equal educational opportunities and enrollment patterns of
TRANSCRIPT

University of Massachusetts AmherstScholarWorks@UMass Amherst
Doctoral Dissertations 1896 - February 2014
1-1-1986
Equal educational opportunities and enrollmentpatterns of minority students in remedial education.Elaine Barako CuphoneUniversity of Massachusetts Amherst
Follow this and additional works at: https://scholarworks.umass.edu/dissertations_1
This Open Access Dissertation is brought to you for free and open access by ScholarWorks@UMass Amherst. It has been accepted for inclusion inDoctoral Dissertations 1896 - February 2014 by an authorized administrator of ScholarWorks@UMass Amherst. For more information, please [email protected].
Recommended CitationCuphone, Elaine Barako, "Equal educational opportunities and enrollment patterns of minority students in remedial education."(1986). Doctoral Dissertations 1896 - February 2014. 4074.https://scholarworks.umass.edu/dissertations_1/4074


EQUAL EDUCATIONAL OPPORTUNITIES AND ENROLLMENT PATTERNS OF
MINORITY STUDENTS IN REMEDIAL EDUCATION
A Dissertation Presented
By
ELAINE BARAKO CUPHONE
Submitted to the Graduate School of the University of Massachusetts in partial fulfillment of the
requirements for the degree of
DOCTOR OF EDUCATION
1986 September

Elaine Barako Cuphone
c
All Rights Reserved
ii

EQUAL EDUCATIONAL OPPORTUNITIES AND ENROLLMENT PATTERNS OF
MINORITY STUDENTS IN REMEDIAL EDUCATION
A Dissertation Presented
By
ELAINE BARAKO CUPHONE
Approved as to style and content by:
Dr. Robert Sinclair, Chairperson of of Committee
i i i

DEDICATION
It is with pleasure, pride, and love that I dedicate thi
tation to my parents, husband, and son. Without all of you,
not be me.
s disser-
I would
TV

ACKNOWLEDGMENTS
Completing a dissertation has been one of the more difficult
challenges I have chosen to undertake. It signifies to me the comple¬
tion of a personal goal; one which demanded sacrifices and persever¬
ance but brought to me knowledge, friendships, and new professional
experiences.
There are many people to whom I owe thanks for enabling me to
reach my goal. Dr. Robert Sinclair, through his advice and guidance,
helped me conceptualize the dissertation from the very roughest of
drafts to the final copy. Drs. Patricia Gillespie-Silver and Clark
Roof provided support and professional help as members of my commit¬
tee. Drs. Linda Nober and Roger Frant, through their friendship and
encouragement, helped me believe in myself and accept the challenges
which a dissertation brings.
To all of you, I express my sincere thanks. If my research
serves its ultimate purpose—one of helping students receive equal
educational opportunities—you will all be partially responsible.
For that you should be proud.
v

ABSTRACT
EQUAL EDUCATIONAL OPPORTUNITIES AND ENROLLMENT PATTERNS OF MINORITY STUDENTS IN REMEDIAL EDUCATION
(September 1986)
Elaine Barako Cuphone, B.S.E., Westfield State College M.Ed., Westfield State College
Ed.D., University of Massachusetts
Directed by: Dr. Robert Sinclair
The purpose of this study was to determine if minority students
were receiving equal educational opportunities in remedial programs
as now guaranteed by law. The study focused on the enrollment pat¬
terns of Black and Hispanic students in special education, transi¬
tional bilingual education, and Chapter I programs at forty-six ele¬
mentary and eighteen secondary schools in three urban Massachusetts
communities which had been cited by the State Department of Education
for prima facie denial of equal educational opportunities to minority
students.
Disproportionate enrollment patterns of Black and Hispanic stu¬
dents suggested discriminatory placement practices were occurring in
these communities. However, after years of state investigations,
discrimination was not uncovered nor could the disproportionate en¬
rollment be explained.
The present study inquired into the possibility that the remedial
education services provided in a school system could result in dispro¬
portionate placement of minority students in some remedial programs
without a practice of unequal opportunity. In other words, dispropor-
vi

tionate placement in one program could not be equated with discrimi¬
nation if similar educational opportunities were provided in another
appropriate program.
Five research objectives guided this study by determining the
relationships among White, Black, and Hispanic student enrollment
patterns in special education, transitional bilingual education, and
Chapter I programs at selected elementary and secondary schools.
Specific findings suggest that:
(1) Speech and language needs of minority youth are not appro¬
priately met in remedial education;
(2) Chapter I programs are primarily utilized by minority stu¬
dents but the language of instruction does not always cor¬
relate with the needs of the population;
(3) Transitional bilingual education and Chapter I programs
appear to substitute for some special education programs;
(4) Enrollment patterns of remedial programs need to be studied
collectively rather than individually to determine if and
how equal educational opportunities are provided to minority
students.
The research culminates in a ten-step model for investigating equal
educational opportunities for minority youth in remedial education.
This model can be used by school districts to analyze and monitor
placement patterns to ensure that equal educational opportunities are
being provided to minority students.
vii

TABLE OF CONTENTS
Dedication . . . .
Acknowledgments
Chapter
i v
v
I. INTRODUCTION . 1
The Purpose.* 4
Definition of Terms..*.*!!!!.* 5
Delimitations of the Study.* 5
Significance of the Study..*!!.*!.*!! 8
II. REVIEW OF THE LITERATURE.12
Historical Review . 13
Remedial Education: Acts, Goals and Placement Options . 31
III. DESIGN OF THE STUDY.42 Selected School Districts, Schools, and Students .... 42 Collection and Analysis of the Data.44
Objective One.44
Formula for analyzing enrollment patterns in remedial education . 45
Objective Two.46 Formula for determining statistically significant
under representation of minority students in special education . 47
Objective Three . 47 Formula for determining if special education
enrollment was affected by minority student participation in Chapter I programs (School Systems B and C).48
Procedure for determining on a systemwide basis if special education enrollment was affected by minority student participation in Chapter I programs.49
Objective Four.51 Formula for determining if special education
enrollment was affected by Hispanic student participation in transitional bilingual education (School Systems B and C) .. • •
Procedure for determining on a systemwide basis if special education was affected by Hispanic student participation in transitional bilingual education
(School System A) . Objective Five .
vi i i

IV. RESULTS OF THE STUDY.. Presentation of the Data.57
Objective One.57
Analysis and discussion . 72 Objective Two.78 Analysis and discussion . 84 Objective Three . 88
Analysis and discussion . 102 Objective Four.108 Analysis and discussion . 118 Objective Five.121 Analysis and discussion . 127
Additional Findings . 133
V. SUMMARY, CONCLUSIONS, AND RECOMMENDATIONS . 140 Summary.140
Objective One.142 Objective Two.142 Objective Three . 142 Objective Four.142 Objective Five.143 Conclusions.146 Recommendations for Further Research . 150 Recommendations for Reform . 154
Approach for investigating equal educational opportunities . 157
FOOTNOTES .
BIBLIOGRAPHY
APPENDICES A. Massachusetts' Special Education Prototypes . B. Action Plan . C. Chi Square Raw Data.
IX

LIST OF TABLES
1. 2. 3.
4. 5. 6. 7. 8. 9.
10. 11. 12. 13.
14.
15.
16.
17.
18.
19.
20. 21. 22.
23.
24.
Educational Goals and Placement Options in Remedial Education .
Special Education Program Enrollment Data—School System A . Transitional Bilingual Education Enrollment Data—School
System A . Chapter I Enrollment Data—School System A. Special Education Program Enrollment Data—School System B . Transitional Bilingual Education Enrollment Data—School
System B . Chapter I Enrollment Data--School System B . Special Education Program Enrollment Data—School System C . Transitional Bilingual Education Enrollment Data—School
System C . Chapter I Enrollment Data—School System C. Chi Square Analysis —Special Education Enrollment Data—
School System A . . . , . Chi Square Analysis—Special Education Enrollment Data—
School System B.• . Chi Square Analysis —Special Education Enrollment Data—
School System C . Individual Elementary School Enrollment Data—School
System A—Chapter I Schools. Individual Elementary School Enrollment Data—School
System A—Non Chapter I Schools. Chapter I and Special Education Program Relationships—
School System A—Elementary Schools. Individual Elementary School Enrollment Data—School
System B—Chapter I Schools. Individual Elementary School Enrollment Data—School
System C—Chapter I Schools. Individual Elementary School Enrollment Data—School
System C—Non Chapter I Schools . Hispanic Elementary School Data—School System A—
Transitional Bilingual Education Schools . Hispanic Elementary School Data—School System A—
Non Transitional Bilingual Education Schools ...... Transitional Bilingual Education and Special Education
Program Relationships —School System A—Elementary Transitional Bilingual Education Data • •••••••••
Individual Elementary School Program Enrollment Data- School System B—Transitional Bilingual Education Schools
Individual Elementary School Program Enrollment Data— School System B—Non Transitional Bilingual Education
Schools.
35 59
61 62 64
66 67 69
70 71
80
82
83
90
. 93
. 96
. 97
. 100
. 101
. 110
. Ill
. 112
. 114
. 115
x

25. Individual Elementary School Program Enrollment Data— School System C--Transitional Bilingual Education Schools . 116
26. Individual Elementary School Program Enrollment Data— School System C—Non Transitional Bilingual Education Schools.117
27. Comparison of Remedial Education Programs--School System A . 124 28. Comparison of Remedial Education Programs—School System B . 125 29. Comparison of Remedial Education Programs —School System C . 126 30. Systemwide Special Education Data—Gender and Age-
School System A.134 31. Systemwide Special Education Data—Gender and Age-
School System B.135 32. Systemwide Special Education Data—Gender and Age-
School System C.136
xi

LIST OF FIGURES
1. Ten Step Model for Investigating Equal Educational Opportunities for Minority Youth . 158

CHAPTER I
INTRODUCTION
Although public education began in the United States during the
1600s, for centuries educational opportunities were denied to certain
student populations.1 Students of some racial, linguistic, or cul¬
tural minority groups and students with physical, emotional, or mental
handicaps were excluded from many of the educational programs which
2 were available to the majority of students. For example. Black
students were often denied educational opportunities because of their
race. Segregated schools with different and often inferior curricula
were responsible for the creation of separate and unequal learning
environments for this minority group--a practice which openly existed
until legal challenges in the 1950s.
During the 1960s and 1970s discriminatory practices which not
only segregated but often excluded students of some cultural and lin¬
guistic minority groups from educational systems were recognized as
3 unfair and changed by legislative mandates. However, various
forms of discrimination continued and as recently as 1974, more than
one million students--those with physical, emotional, or mental
handicaps-continued to be segregated from peer groups or excluded
from both private and public educational opportunities because of
.... 4 their handicapping condition.
Specific pieces of legislation and litigative efforts during
1954-1974 were responsible for a decline in educational inequities
1

2
which occurred because of race, poverty, or a handicapping condition.
Nationwide attempts were made to correct existing educational policies
or procedures which were discriminatory. Federal interventions into
state educational practices initiated compensatory and remedial pro¬
grams which were aimed at equalizing educational opportunities across
the country. Equal educational opportunities became a stated national
5 goal. Summarily, the results of three decades of litigation and
legislation helped ensure that students of racial, cultural, and lin¬
guistic minority groups and those with a handicapping condition have
equal access to educational opportunities which are available to the
major student population.
To equalize educational opportunities, remedial and compensatory
educational programs such as special education, transitional bilingual
education (TBE), and Chapter I were implemented in the 1960s and
1970s. These remedial programs, specifically designed to meet the
educational needs of economically disadvantaged, non-English speaking,
and handicapped students, provide a mechanism for equalizing educa¬
tional opportunities for diverse student groups.
Haring, Blackhurst and Berdine state that educators must recog¬
nize certain students—in particular, racial or linguistic minority
and handicapped—may need to receive remedial services at a greater
proportionate rate than their peers. This disproportionality is
deemed necessary since the effects of poverty, which are strongly
correlated with minority groups, language differences, or of a han¬
dicapping condition often interfere with and negatively affect the

3
ability of students to learn within the regular educational environ¬
ment.6
Therefore, a recent finding by the Mdssachusetts Advocacy Center
(MAC) is disconcerting and a cause of concern. In some Massachusetts
communities. Black and Hispanic students are under enrolled in all
levels of special education—one of the remedial programs specifically
designed to provide equal opportunity for students so they can suc¬
cessfully participate in a school's educational program. This dis¬
covery by the MAC raised a major question: Are minority students
again, as in the past, being denied educational opportunities?
Massachusetts General Law 71B, section 6, states that a dispro¬
portionate enrollment rate of minority students must be investigated
by the Massachusetts Department of Iducation. In 1979, the Depart¬
ment began studies of these disproportionate enrollment rates in
special education, but at this time it has neither conclusive
evidence of discriminatory practices which exclude Black or Hispanic
students from special education programs nor an explanation for such
disproportionality.^
The question, "Are minority students again, as in the past, being
denied educational opportunities?" cannot be answered by looking
solely at special education and its enrollment patterns. Educational
services may be provided to students through other remedial programs,
thereby preventing or decreasing the need for remediation through
special education. This could help explain the under enrollment of
minority students in special education.

4
An investigation which focuses on a denial of equal education
because disproportionate enrollment patterns exist in one program is
an approach which fails to view the total system for remedial educa¬
tion. A more comprehensive approach to an investigation of equal
educational opportunities must be conducted if we are to determine if
minority students are being denied opportunities intended to provide
them with an equal education. Without a more comprehensive approach,
we cannot accurately determine if various equal educational opportun¬
ities are truly available to all student groups.
The Purpose
The purpose of this study was to determine whether Black or
Hispanic students from forty-six elementary and eighteen secondary
schools in three urban school districts were being denied access to
remedial education. More specifically, the researcher analyzed
racial enrollment patterns in three major remedial programs to
determine to what extent minority students were enrolled in special
education, transitional bilingual education, and Chapter I.
When minority students were under enrolled in special education
programs, this discrepancy was identified by race and specific pro¬
gram. Discrepancies were further analyzed to determine if Black or
Hispanic students were receiving similar educational services through
transitional bilingual education or Chapter I programs or if minority
students were indeed being denied equal access to all three remedial

5
education programs.
The following research objectives gave direction to this study.
(1) To determine the enrollment patterns of Black, Hispanic, and
White students in special education, transitional bilingual education,
and Chapter I in selected school systems.
(2) To determine if the enrollment patterns in special education
at selected school systems had a statistically significant under rep¬
resentation of minority students.
(3) To determine if minority enrollment patterns in special
education programs were affected by minority student participation in
Chapter I in elementary schools.
(4) To determine if minority enrollment patterns in special
education programs were affected by minority student participation in
transitional bilingual education in elementary schools.
(5) To determine if differences in enrollment patterns in reme¬
dial programs indicated that minority students were denied participa¬
tion in programs designed to provide educational opportunities.
Definition of Terms
To help insure consistency and clarity in this research, the
following key terms are defined.
(1) Black, Hispanic and White Students--These are students whose
racial identity and language dominance have been identified through a
home/language survey which asked parents to identify their child s

6
race &nd dominant language. This racial and language categorization
was accepted as accurate if validated by the child's current teacher.
(2) Minority Students--These are students who had been identi¬
fied by their parents through a home/language survey and by their
teacher as Black or Hispanic.
(3) Chapter I--This is a federally funded program which provides
remedial and compensatory instruction to students who attend school
in districts which have been designated as economically deprived.
(4) Special Education--This refers to remedial services based
on a student's identified educational need and provided outside of
the regular education curriculum.
(5) Transitional Bilingual Education--This is an educational
program which teaches academic subjects in the student's native
tongue. In this study, the native language is Spanish.
(6) Discrepancies--These are variations in enrollment rates
which show disproportionate numbers of minority students in remedial
programs.
(7) Prototype--This is a numeric labelling system for special
education programs as mandated by Chapter 766 regulations in
Massachusetts. It is based on the length of time a child is out of
his/her classroom and in the special education classroom (Appendix A).
Del imitations of the Study
This study is delimited in five ways. First, the investigation

7
was conducted in school districts which had special education, transi¬
tional bilingual education, and Chapter I services on the elementary
level. Since school systems establish their own criteria for entering
each program, generalizations about the findings are limited to the
systems selected for this study.
Second, since parental permission is necessary before students
can be enrolled in these three programs, schools may have offered an
opportunity for a student to be enrolled in a program but a student
may not have entered the program due to parental choice. Lack of
enrollment in remedial programs because of parental choice was not
considered as a variable in this study.
Third, transitional bilingual educational programs included in
this study were those serving Spanish speaking children. Therefore,
the enrollment analysis applies only to Spanish speaking children and
does not address the enrollment pattern of other linguistic groups.
Fourth, enrollment figures of Black and Hispanic students were
based on home/language survey information and by teacher identifica¬
tion. Due to the confidential nature of racial information and the
subjective tendencies of this counting process, slight errors may
have occurred when determining the Hispanic and Black enrollments.
Fifth, the enrollment data that were collected represented the
total number of Black, White and Hispanic students in special educa¬
tion, transitional bilingual education, and Chapter I programs. Since
it is possible that a small number of students were simultaneously en¬
rolled in two programs, enrollment figures were analyzed and discussed

8
on a percentage basis, i.e., percentage of each racial group in each
remedial program rather than as numbers of individual students.
Significance of the Study
Massachusetts General Law, Chapter 71B, section 6, prohibits
disproportionate enrollment of minority students in special education.
During the last five years, the Massachusetts Department of Education
has studied disproportionate enrollment figures in special education
on a statewide basis to determine how this remedial program is being g
used by minority students. However, it has become apparent to
local school administrators, educators, and state officials themselves
that the current investigative procedures are too narrowly focused and
need revision. After five years, the Department still cannot explain
why disproportionate enrollment rates exist or if an under enrollment
of minority students in special education constitutes a denial of
equal educational opportunities.
Current procedures investigate special education enrollment in
isolation rather than studying enrollment rates more comprehensively
through an analysis of enrollment patterns in other major remedial
programs. Therefore, this study is significant because it provides
an approach which analyzes student enrollment rates by looking at the
interrelationships among special education, transitional bilingual
education, and Chapter I programs. This more comprehensive approach
will help state and local officials determine if there is an under

9
representation of Black or Hispanic students in remedial education.
If such disproportionality exists, the approach will indicate if there
is a lack of equal educational opportunities for minority students,
or if enrollment in one program is the result of participation in
different program options.
Second, this study presents the goals and placement options which
currently exist among various remedial programs and may help or hinder
the provision of equal educational opportunities to minority youth.
These goals and placement options can be used by school systems to
create a continuum of remedial services which is appropriate for the
cultural, linguistic, and educational needs of the district's stu¬
dents. With such an appropriate continuum of services, equal educa¬
tional opportunities are more likely to be provided to and utilized
by minority children.
Third, the study is significant because it presents a model which
enables a local school district to analyze its enrollment patterns and
determine if the remedial services offered link with the needs of mi¬
nority students. The procedure for analysis allows a school district
to take responsibility for monitoring its educational programs rathet
than deferring this crucial function to a state agency a practice
which too often results in the establishment of adversarial roles and
prevents state and local collaboration for instructional improvement.
Fourth, this study is important because it provides a con¬
structive approach to the assurance of equal educational opportuni¬
ties for minority youth by encouraging school districts to iden-

10
tify programmatic strengths and weaknesses and then develop a plan of
action which addresses necessary changes. The approach used in the
present study is in direct contrast to the reactive posture schools
are forced to take when the state Department of Education investigates
prima facie evidence which suggests discrimination against minority
students and implies discriminatory placement procedures. Schools
should take control of their mission in education--fair and equitable
opportunities for all students--rather than look in retrospect at
existing policies and programs, a situation which too often occurs.
In summary, five research objectives have given direction to this
study. The stated delimitations made the researcher and reader sensi¬
tive to the parameters of the investigations while the statements of
significance emphasized the importance of the research and its poten¬
tial impact on school systems and on the delivery of educational ser¬
vices to minority youth.
The remainder of this research has been organized into four
chapters. The introductory comments pertaining to exclusionary prac¬
tices in education and the legislative and litigative efforts which
changed them have been expanded in Chapter II. Here an historical
review provides the reader with a greater understanding of the ardu¬
ous journey toward realizing the stated national goal of equal educa¬
tional opportunities-a goal which this research study hopes to ad¬
vance. Chapter II also states the major goals and placement options
of special education, transitional bilingual education, and Chapter I
programs.

11
Chapter III is divided into two sections and explains how this
study was conducted. The first section describes the school dis¬
tricts, schools, and students included in the study. The second sec¬
tion identifies the data used in the investigation, describes how the
data were collected, and details the procedures used to analyze the
data.
In Chapter IV, the data from each research objective are pre¬
sented, analyzed and discussed for each school district. Chapter V
summarizes this research and makes recommendations for expansion of
this research, future research, and educational reform.
CHAPTER II
REVIEW OF THE LITERATURE
This chapter is divided into two sections. The first section is
an Historical Review that describes key discriminatory and exclusion¬
ary educational practices which occurred in the United States for
hundreds of years, thus prohibiting equal educational opportunities
to school aged children. It also includes a description of the major
litigative decisions and legislative acts of three decades which cul¬
minated in the present national goal of equal educational opportunity.
This section is necessary because it outlines discriminatory practices
which have occurred in educational institutions and the Federal and
state interventions which have addressed these practices so the coun¬
try can meet its goal of equal educational opportunities for all
students.
The second section lists goals of special education, transitional
bilingual education, and Chapter I programs. It focuses on the inter¬
relationships of the Education Consolidation and Improvement Act,
Transitional Bilingual Education Act, and Education for All Handi¬
capped Children Act as they attempt to serve the economically disad¬
vantaged, racial and/or linguistic minority, and handicapped student.
This section highlights the need to study enrollment patterns in a
comprehensive rather than singular approach since the Acts have some
overlapping goals and populations.
12

13
Historical Review
In early colonial America, education was primarily a family con¬
cern and took place at home. The few formal institutions for educa¬
tion were privately controlled and served the wealthier colonists.
These practices began to change as the concept of public education was
pursued. In 1647, Massachusetts developed the first public school
system—a development which was adopted and supported by the colonial
government.
After the colonies united, educational matters were regulated by
individual states. Since the Constitution does not specifically men¬
tion education or schools, it has been implied that the framers viewed
public education as a matter for state control. Although the Four¬
teenth Amendment states "no state shall . . . deny to any person
within its jurisdiction the equal protection of the laws," this was
not interpreted in relationship to education until 1954 in Brown vs.
Board of Education.
From the 17th to the 20th centuries, state statutes arbitrarily
authorized the exclusion of children from schools. If students were
judged to be incapable of profiting from school they were excluded
from school and did not come under the purview of state compulsory
attendance laws.
Examples of exclusionary practices are shown by the Maine and
New York statutes which respectively declared that:

14
The superintending school committee or school directors mav exclude from the public schools any child whose physical or mental condition makes it inexpedient for him to attend.
A person whose mental or physical condition is such that his attendance upon instruction would endanger the health or safety of himself or of others, or who is feebleminded to the extent that he is unable to benefit from instruc¬ tion, shall not be permitted to attend.9
The following poignant quote, taken from Beattie v. Board of
Education of the City of Antigo, 1919, further illuminates state con¬
trol over the exclusion of children from school. Students could be
expelled from school if they had
. . . a depressing and nauseating effect on the teachers and school children. The rights of a child of school age to attend the schools of the state could not be insisted upon, when its presence therein is harmful to the best interest of the school JO
The Beattie case involved a physically handicapped, speech im¬
paired boy who was excluded from education because his presence was
viewed as harmful to the best interests of the school. Although this
exclusion was within the state board's power at that time, it is im¬
portant to review two statements made by Justice Eschweiler as he
stated his dissenting minority opinion.
His dissent focused on two counts—statutory power and procedural
framework. Justice Eschweiler did not agree that a state statute
could be placed above the guaranty of the State Constitution which
provided education for students 4 to 20 years old. Secondly, he did
not feel that the school board showed convincing evidence that the

15
presence of this child would be harmful to the school or children who
attended it. Justice Eschweiler was concerned about the procedural
framework which was followed and believed that the burden of proof
for exclusion should be upon the school board and not the student.
Justice Eschweiler's opinions were forerunners to the judicial atten¬
tion which was given to Constitutional rights and due process proceed¬
ings in the second half of the century.
Federal involvement in the education of handicapped persons in
the 19th century paralleled state movements. As states established
schools for deaf, blind, and retarded students, the federal effort
evolved from granting land for similar schools to one of financing
tuition costs for deaf students. However, after the 1879 Congres¬
sional authorization of funds to aid in the education of blind stu¬
dents, there was a 40-year dearth in federal legislation for handi¬
capped citizens.
In the 1800s, state and limited federal involvement in the educa¬
tion of handicapped citizens focused on specific disabilities (blind¬
ness, retardation, deafness). Programs which were provided were ex¬
clusive and limited. An example of this exclusivity was the first day
school program for mentally retarded students started in Providence,
Rhode Island in 1896. It was developed for children who were excluded
, , 11 from the public school setting.
The first half of the 1900s is characterized by a governmental
posture and legal system which were reactive rather than proactive.
Attention was focused on educational and rehabilitation programs for

16
disabled and blind World War I and World War II veterans. In 1918
the Soldiers Rehabilitation Act was passed by Congress and signed by
President Wilson. It offered vocational rehabilitation services to
disabled World War I veterans but excluded disabled civilians using
the tenet that rehabilitation was not a federal responsibility. In
spite of this tenet, in 1920, the Citizens Vocational Rehabilitation
Act became law. Civilians and veterans were under the aegis of this
Act and received specialized training so they could return to the work
force. In 1943, this Act was expanded to include services for re¬
tarded and mentally ill citizens in addition to those who had physical
handicaps.
During the early 1950s, categorical legislation which was enacted
established institutions for the deaf and dumb; deaf, dumb and blind;
12 insane; and disabled veterans. The needs of specific groups of
handicapped persons, as in the 1800s, were again addressed.
Federal involvement in state educational processes escalated in
the 1950s as a result of the Civil Rights movement. The historical
Supreme Court case. Brown vs. Board of Education of Topeka, began
intense questioning about equal educational opportunities and marked
the advent of judicial decisions which challenged practices throughout
the country. Preceding Brown vs. Board of Education were four separ¬
ate state challenges to racial separation in schools. In Kansas,
cities of more than 15,000 were permitted to maintain separate facil¬
ities for Black and Caucasian students. When this separation was
legally challenged, the Court found that segregation in public educa-

17
tion had a detrimental effect on Black children. However, it denied
relief to this situation on the basis that the schools, curriculum,
and teachers within the segregated school system were equal. In South
Carolina and Virginia, Court cases tried to enjoin statutory codes
which segregated Black students from Caucasian students. Although
these requests were denied, the legal decision stated that schools
must be made equal. However, Black students remained segregated while
the schools were equalized. A similar Court case in Delaware ended
with the decision that separate facilities were not equal. Black
students were allowed to attend schools which were previously closed
to them. All four of these decisions were appealed and culminated in
the class action suit known as Brown vs. Board of Education in Topeka.
The Plaintiffs in these cases sought admission to public schools on a
non-segregated basis.
The Supreme Court decision in Brown vs. Board of Education was
unanimous and significant in two respects. Equal opportunity was
proclaimed a constitutional right. Chief Justice Warren referenced
the Fourteenth Amendment in his statement that:
. . segregation of children in public schools solely on the basis of race, even though the physical facilities and other tangible factors may be equal deprives the children in the minority group of equal educational opportunities, in contravention of the Equal Protection Clause of the 14th Amendment.^
This was the first time the Equal Protection Clause in the Constitu¬
tion was related to educational practices. Second, the state's role

18
in education was defined.
Today education is perhaps the most important function of state and local government ... it is a principal instru¬ ment in awakening the child to cultural values, in prepar¬ ing him for later professional training, and in helping him to adjust professionally to his environment. In these days it is doubtful that any child may reasonably be ex¬ pected to succeed in life if he is denied the opportunity of an education. Such an opportunity, where the state has undertaken to provide it, is a right which must be made available to all childrenJ4
This quote affirms the rights of all children to an education
once the state chose to provide it. Unfortunately, handicapped stu¬
dents did not realize their state right to an education or constitu¬
tional right to equal opportunity for almost twenty-five more years.
The decisions from Brown vs. Board of Education were precedent
setting—especially the reference to the Fourteenth Amendment:
All persons born or naturalized in the United States and subject to the jurisdiction thereof, are citizens of the United States and of the State therein they reside. No state shall make or enforce any law which shall abridge the privileges or immunities of citizens of the United States, nor shall any state deprive any person of life, liberty, or property without due process of law, nor deny any person within the jurisdiction equal protection of the
laws.
As previously stated, education is not specifically mentioned in this
amendment or the Constitution. However, if equal protection is inter¬
preted as a right to access the free, public education which has been
established by the state, then educational opportunities should be
available to all students including those who are handicapped.

19
During the 1950s, the Fourteenth Amendment was used unilaterally
in the pursuit of equal educational opportunities. The focus was on
racial imbalance and resultant inequities. Non-segregated schools
were viewed as fulfilling equal educational mandates, although segre¬
gated settings were allowed if supportive services were necessary and
not available in a non-segregated setting.^
Throughout the 1960s, the conceptualization and pursuit of equal
educational opportunities expanded. Court challenges increased and
new legislation was designed and promulgated. Equal protection was
interpreted as that which is done for one person must be done for all
persons on equal terms. This meant that states could not set up sep¬
arate systems, such as separate schools for different groups of peo¬
ple, unless there was a compelling reason for doing so.17 Since
separation without due cause was prohibited, schools were forced to
question educational and separation practices for various student
groups.
During the 1960s, attention also focused on the need for remedial
or compensatory education. The Elementary and Secondary Education Act
of 1965 was enacted as a vehicle for equalizing educational opportuni¬
ties. It targeted money for poverty programs and provided educational
opportunities for specific student groups. This philosophical
position that differing resources were needed if students were to
achieve similar objectives was strengthened by court decisions.
In 1967, the Court case of Hobson vs. Hansen questioned a track-
lts of group IQ tests to place and ing system which used the resu

20
develop programs for students. This was the first significant legal
challenge to the use of tests which labelled and often segregated or
excluded students from regular education. Since the IQ tests had
been standardized on a White population, but were used to place Black
students, the results judged students in accordance with their racial
or socioeconomic status rather than intelligence or innate ability.
A Supreme Court decision, handed down by Judge Skelly Wright, declared
it unconstitutional to deprive students of an education which was
available to other students because of the results of one test score.
This practice was said to violate the due process clause of the Fifth
Amendment, since students were suspended or excluded from classes on
the basis of test results without recourse to hearings or periodic
19 review.
The Hobson case also identified the multiplier effect as a con¬
comitant problem of tracking. Through tracking, children were not
only segregated from contemporaries, but also denied access to compen¬
satory programs which multiplied the denial of their equal educational
opportunities. Hobson vs. Hansen challenged the use of group intelli¬
gence tests for placement and exclusionary practices; subsequent liti¬
gation challenged the use of individual intelligence tests.
Although discriminatory practices, tracking and questionable
assessment techniques were recognized as obstacles to equal educa¬
tional opportunities, the educational rights of handicapped students
in the 1960s were still lacking in three major respects. First, in
the 1960s the majority of mentally retarded students were receiving

21
instruction in self-contained (separate) classrooms. This can be
viewed as a form of tracking and a way to exclude some students from
the mainstream of education. Second, students were identified and
grouped together under one category such as mental retardation or
physically handicapped. It was often assumed that one mentally re¬
tarded student was just like another mentally retarded student and a
physical disability was synonymous with a need for a different educa¬
tional program. Individual differences were not always considered
and often obscured. Third, there was a lack of federal and state
funds to develop programs specifically for handicapped students. The
Elementary and Secondary Act of 1965 did target some money for handi¬
capped children but the primary focus of these allocations was for
20 disadvantaged children.
In Diana vs. California State Board of Education, 1971, a class
action suit challenged placement and identification procedures used
for Mexican students and became another step in the process of secur¬
ing educational programs for handicapped students. The Plaintiffs
charged that the administration of the WISC-R and Standford-Binet was
prejudicial since the children's dominant language was Spanish and
the test required a facility with English. It was alleged, as in
Hobson vs. Hansen, that children were inappropriately labelled and
then segregated from some educational programs because of an invalid
test. Documentation supported this since about 18.5% of the student
population in Monterey County, California had Spanish surnames, yet
about 33% of the children in classes for the mentally retarded were

22
Spanish surnamed. Similar situations occurred throughout the
21 state/1
As a result of Diana vs. California, some discriminatory place¬
ments which resulted from language barriers were rectified and new
placement procedures were implemented. Specifically, the court
stated:
(1) Children must be tested in their primary language;
(2) Children who were already placed in classes for the mentally retarded must be reevaluated;
(3) New testing protocols were to be developed to reflect different cultural backgrounds;
(4) Disproportionate numbers of minority students in segregated classes must be explained.
Diana vs. California expanded the Hobson decision by ordering a remedy
for linguistically biased tests and testing procedures.
Diana and similar cases, (Arreola vs. Board of Education, 1968;
Covarrubias vs. San Diego, 1971), had an impact at both the state and
federal levels. In 1970, the former Department of Health, Education
and Welfare's (HEW) Office for Civil Rights sent a memo to 1,000
school districts warning them that they would not be in compliance
with Section VI of the Civil Rights Act if students whose primary
language was not English were assigned to classes for the retarded
based on tests which did not take into account their linguistic
proficiency. In part, the memo said:
. each school district has an affirmative duty to take

prompt and effective action to eliminate . . . discrimina¬ tion based upon . . . race or national origin, and to cor¬ rect the effects of past discrimination.22
23
Previously, equal protection and due process clauses of the
Constitution had been referenced when equal educational opportunities
were denied or discriminatory practices existed. This intervention
by HEW signified a legislative rather than litigative role of the
federal government in educational affairs—a trend that continued and
intensified in the 1970s.
Although the federal government intervened in state educational
affairs, the early 1970s were still characterized by numerous legal
disputes. Two landmark cases which dramatically changed educational
practices were Pennsylvania Association for Retarded Children (PARC)
vs. Commonwealth of Pennsylvania and Mills vs. District of Columbia.
PARC was a class action suit which questioned the exclusion,
denial, and lack of due process procedures for mentally retarded
23 children between the ages of 6 and 21. This suit stated that
four Pennsylvania statutes denied educational opportunities. They
were as follows:
(1) The state was relieved of its obligation to educate a child who the school psychologist certified as un- educable or untrainable. The burden of care then shifted to the Department of Public Welfare which was not mandated to provide educational services;
(2) Education could be postponed if a child had not reached the mental age of five (5);
(3) Psychologists could exclude children from school if a child was unable to profit from education; and

24
(4) Compulsory school age was defined as 8 - 17 and could be used to postpone school admissions.
The Plaintiffs, using the testimony of social scientists pre¬
sented evidence which led to the establishment of new educational
and social priorities. Three salient points were made:
(1) Systematic education programs for mentally retarded children can produce learning;
(2) Education must be seen as a continuous process not just the provision of academic experiences;
(3) Early provision of services will increase the amount of learning which can be expected.24
This information and Constitutional safeguards in the Fifth and Four¬
teenth Amendments affected the outcome of this case. The conclusion
of the consent agreement stated
. . . every retarded person between the ages of 6 and 21 shall be provided access to a free public program of education and training appropriate to his capacities as soon as possible but in no event later than September 1, 1972." (emphasis added)25
The definition of equal opportunities had changed. Specifically, the
phrase "appropriate to his capacities" implied that different training
may be necessary to access free public programs of education.
PARC is often referred to as the cradle of the legal rights move¬
ment for handicapped students. It expanded the Brown vs. Board of
Education decision by addressing and rectifying discrimination on the
basis of a handicapping condition. Although categorical in nature,

25
it specifically granted educational opportunities to retarded students
in the Commonwealth. PARC stimulated publicity, questioning, and
social reaction. Many subsequent judicial decisions, including Mills
vs. Board of Education, were influenced by PARC.
The genesis of Mills was the failure of Washington, D.C., schools
to provide education, due process proceedings, and expulsion policies
for students. In 1972, the parents and guardians of seven children
in the District of Columbia, brought a class action suit against the
Board of Education for its failure to provide all children with a pub¬
lic education. The children involved were labelled mentally handi¬
capped, epileptic, brain damaged, orthopedically handicapped and
26 hyperactive students.
In December 1971, the District Court ordered that a publicly
supported education should be provided to the Plaintiffs by January
3, 1972. Judge Joseph Waddy's decision used the Fifth Amendment to
support the Constitutional right of all children to have a public-
supported education. The Mills decision expanded PARC by guaranteeing
educational rights to all students regardless of any handicapping
condition. The Constitutional guarantee referred to in Mills was the
Fifth Amendment, rather than the Fourteenth. This was cited since
Washington, D.C., is not a state but a Federal entity, and the Four-
27 teenth Amendment specifically addressed state issues.
Brown, PARC, and Mills cited the Constitution as granting educa¬
tional rights. They are examples of the definite shift from complete
control of education through statutory provisions to educational

26
guarantees under the Constitution.
In addition to determining educational rights, Mills clarified
the issue of financial responsibility for equal education opportuni¬
ties. Quoting the decision:
The District of Columbia's interest in educating the ex¬ cluded children clearly must outweigh its interest in pre¬ serving its financial resources. If sufficient funds are not available to finance all of the services and programs that are needed and desirable in the system, then the available funds must be expended equitably in such a man¬ ner that no child is entirely excluded from a publicly supported education consistent with his needs and ability to benefit therefrom. The inadequacies of the District of Columbia public school system whether occasioned by insuf¬ ficient funding or administrative inefficiency, certainly cannot be permitted to bear more heavily on the exceptional or handicapped child than on the normal child.^8
Although financial responsibility remains one of the most
controversial issues regarding the education of handicapped students,
it was clearly decided in Mills that a lack of financial resources
was not justification for excluding students from educational
programs.
Racial discrimination, tracking, selective exclusion of handi¬
capped students, and placement via invalid tests were some practices
which had denied students educational opportunities during the 1960s.
Discriminatory practices which were often challenged in the 1970s were
those which affected cultural and linguistic minorities.
In 1972, the Plaintiffs in Larry P. vs. Riles claimed both their
iConstitutional and Civil Rights were violated by a placement process
which identified Black elementary school students as mentally retarded
27
on the basis of one IQ score—a situation similar to Diana vs. Cali¬
fornia. Since the Plaintiff's spoken language and culture was con¬
temporary Black American and the IQ tests were not standardized on
this population, the placement process was determined invalid. This
decision supported the findings in both Diana vs. California and
Hobson vs. Hansen. Additionally, the Court decided that the Civil
Rights Act of 1964 supported the Federal position that equal educa¬
tional opportunities were required for all children under the equal
protection clause of the Fourteenth Amendment.
In 1974, Lau vs. Nichols challenged cultural and linguistic
biases of tests which were used to segregate students from regular
education and also addressed the issues of bilingual education op¬
portunities. The Plaintiffs in Lau vs. Nichols were advocates for
Chinese-American students who were not receiving bilingual education.
Since bilingual education was not available to all students who needed
it, the Plaintiffs charged that they were being denied equal educa¬
tional opportunities. And again, as in Hobson vs. Hansen, Diana vs.
California and Larry P. vs. Riles, Lau challenged the usage of stan¬
dardized tests as sole placement indicators. The Supreme Court's de¬
cision stated, "There is no equality of treatment merely by providing
students with the same facilities, textbooks, teachers, and curricu¬
lum, for students who do not understand English are effectively fore¬
closed from any meaningful education." It also acknowledged the
invalid nature of many tests and the subsequent erroneous labelling
and placement of bilingual students in special education programs.

28
The Court recommended the establishment of a task force to ensure the
proper use of assessment techniques and programs for bilingual stu¬
dents. As a result of Lau vs. Nichols, schools cannot claim to pro¬
vide equal educational opportunities to students by merely providing
them with the same educational services in their native language but
29 must also change testing and assessment procedures.
The Lau Remedies of 1975 and the Office of Civil Rights Memoran¬
dum of May 25, 1975 both advanced the rights of limited English speak¬
ing students by guaranteeing their right to transitional bilingual
education and prohibiting the assignment of students to special edu¬
cation classes based on criteria which measure language skill rather
than academic achievement or ability. Additionally, an Office for
Civil Rights task force set procedures for identifying a child's
dominant language through the use of home and school observations,
developed monitoring strategies, and made recommendations for assess-
J 30 ing and placing minority students in educational programs.
Although all of those judicial decisions helped stop some dis¬
criminatory and exclusionary practices in education, and disavowed
the philosophy of separate being equal, litigation could not be relied
upon to assure equal protection and non-discriminatory practice in
education. This position is supported by reviewing Washington vs.
Davis, 1976 in which the Supreme Court decided that a test of dis¬
criminatory effect was not of Constitutional stature and stated that
unless there is a proven intent to discriminate, constitutional rights
are not violated. Further, it stated that a law is not discriminatory

29
or unconstitutional because its impact has a discriminatory effect.
If this decision was applied to the cases of Hobson vs. Hansen, Diana
vs. California, Larry P. vs. Riles or Lau vs. Nichols, discriminatory
testing procedures might still be preventing some students from equal
educational opportunities.
Since a decision such as this could negatively affect the avail¬
ability of equal educational opportunities by allowing subtle discrim¬
ination (tests, assessments, placement criteria). Federal laws and
their regulations are of paramount importance. Many students need to
depend on Congressional statutes not Constitutional interpretations
31 to protect their educational rights.
Along with the evolving role of the judicial system in determin¬
ing and changing educational practices, the Federal government gradu¬
ally changed its position from giving states carte blanche in educa¬
tional issues to one of increased Federal involvement. The 1961
Presidential Committee on Mental Retardation was an impetus to this
special education movement. Its numerous recommendations which were
reflected in P.L. 88-164 included allocations of federal funds for
32 the training of teachers in the field of special education.
The establishment of the Bureau of Education for the Handicapped,
a legislative entity within the Office of Iducation, was viewed as a
unified and powerful voice within the federal bureaucracy. Special
education funds increased tenfold during the 1966-1976 period and were
an expression of the emerging national conscience about educational
33 opportunities for handicapped students.

30
The Civil Rights Act of 1964 is another example of increased
federal involvement. Although the Civil Rights Act did not specify
education or educational practices in its wording, it was referenced
to prohibit discriminatory education practices. In fact, the Diana
vs. California, Larry P. vs. Riles and Lau vs. Nichols decisions ref¬
erenced the Plaintiffs' rights to non-biased assessments and programs
under this act. Briefly, the Act states
No person in the United States shall on the grounds of race, color, or national origin be excluded from partici¬ pation in, be denied the benefits of, or be subjected to discrimination under any program or activity receiving Federal financial assistance.
Public schools receive federal aid in many different forms. There¬
fore, it was interpreted that all students had a right to attend
school without being subjected to discriminatory practices.
The enactment of additional strands of legislation. Vocational
Education Amendments of 1968, Economic Opportunities Act of 1972
(Headstart) and the Educational Amendments of 1974 (P.L. 93-380),
emphasized an increased Federal interest in the creation of educa-
34 tional opportunities for poor and handicapped students. In
short. Federal legislation was now prescribing educational programs
and services rather than deferring this position to the states.
Title IX of the 1972 Educational Amendments and Section 504 of
the Rehabilitation Act of 1973 also serve as examples of Federal pro¬
tection and intervention in respect to education. Title IX and Sec¬
tion 504 guarantee non-discriminatory educational benefits to students

31
when they attend programs which receive Federal financial assistance.
In brief, they state
Title IX: No person in the United States, shall on the basis of sex, be excluded from participation in, be denied the benefits of, or be subjected to discrimination under any program or activity receiving Federal financial assistance.
Section 504: No otherwise qualified handicapped individual in the United States, shall solely by reason of his handi¬ cap, be excluded from participation in, be denied the bene¬ fits of, or be subjected to discrimination under any pro¬ gram or activity receiving Federal financial assistance.
The Federal government was now seen as a strong and significant force
in educational matters in contrast to its sparse and sporadic involve¬
ment during the 1800s and early 1900s. This increased involvement
took some control away from the states but opened new educational
opportunities by prohibiting discriminatory and exclusionary educa¬
tional practices previously practiced.
Today there are three major Federal Acts which have dramatically
changed educational practices across the nation. These Acts and their
remedial goals will be discussed in the next section of this chapter.
Remedial Education: Acts, Goals and Placement Options
The Education for All Handicapped Children Act of 1978, the Bi¬
lingual Acts of 1968, 1974 and 1979, and the Elementary and Secondary
Education Act of 1965 now superseded by the Education Consolidation
and Improvement Act of 1981 are primarily responsible for the programs

32
available to handicapped, linguistically different, or economically
disadvantaged students. These Acts have dramatically changed educa¬
tional practices by mandating new programs for students who are need¬
ing compensatory, remedial, and/or individualized education. The
Education for All Handicapped Children Act requires special education
programs; the Bilingual Education Act supports transitional bilingual
education (TBE); and the Education Consolidation and Improvement Act
provides Chapter I programs.
Although all of these programs were enacted to help specific
student groups achieve the national goal of equal educational oppor¬
tunities, at times the goals of these programs overlap. This can
cause duplication of services, which leads to confusion about appro¬
priate placement. The following description of each of the three
Acts and Table 1 identify the overlap which exists in programs today,
and help explain why placement decisions in remedial education are
often difficult and inconsistent.
The Education of All Handicapped Children Act (EHA) of 1978 was
enacted to specifically aid handicapped children; some of these chil¬
dren also suffering educationally due to poverty related causes.
EHA has a four pronged focus. It
(1) Insures that all handicapped children have available to them a free appropriate public education which includes special education and related services,
(2) Insures that the rights of handicapped children and their parents are protected;
(3) Assists States and localities to provide for educa-

33
tion for all handicapped children;
(4) Assesses and insures the effectiveness of efforts to educate those children.35
Although the EHA states that a child is not handicapped due
solely to environmental, cultural or economic disadvantage; testing
protocols do not diagnose all etiologies of learning problems. Thus
environmentally, culturally and/or economically disadvantaged children
may be erroneously labelled mentally handicapped and receive educa¬
tional services under EHA rather than another remedial program.
The Bilingual Education Acts of 1968, 1974, and 1979 were enacted
to aid educationally disadvantaged students--students with limited
English ski 1ls--in school. The main emphasis is to provide instruc¬
tion in the child's dominant language while transitioning the student
to English instruction. However, when limited English speaking stu¬
dents are from families of low socioeconomic status, the educational
needs could be addressed in bilingual education or Chapter I programs.
Placement would depend upon the language of instruction in which the
remedial service was taught.
Chapter I of the Education Consolidation and Improvement Act of
1981 supersedes Title I of the Elementary and Secondary Act of 1965;
however, the primary goal remains the same. It is to "provide finan¬
cial assistance to State and local educational agencies to meet the
special educational needs of educationally deprived children on the
36 basis of allocations calculated under Title I . . ."
Authorized programs include projects designed to meet the needs
37
emphasizes the need to review enrollment rates in remedial programs
collectively rather than singularly to determine if equal educational
opportunities are available to minority youth.
As Table 1 shows, low socioeconomic status could result in a
child receiving services under Chapter I programming or special educa¬
tion. Language problems could result in placement in special educa¬
tion, transitional bilingual education, or a Chapter I program.
Depending upon the severity of the handicapping condition, special
education or Chapter I programs could provide remedial help.
A major intention of the present study is to determine if enroll¬
ment patterns of White, Black, and Hispanic students suggest that
similar educational needs of students are being met in different reme¬
dial programs. More specifically, three students may need remedial
reading instruction in small group settings. Their needs might be due
to a language based learning disability, a dominant language other
than English, or an educationally deprived home environment which was
not able to encourage pre-reading skills. Although the educational
need for all three students is similar, different programs may meet
the educational need.
Taking a very simplistic look at these three students, one might
assume that the first student would be placed in special education
since there is a handicapping condition--a learning disability. The
second student might be placed in a transitional bilingual class since
English is not the dominant language. Environmental deprivation can
be a placement indicator for Chapter I, thus the third student might

38
be placed in that program.
However, it must also be suggested that the language learning
disabled student might be taught in a Chapter I class, particularly
if the disability is not severe. If the limited English speaking stu¬
dent was also misbehaving in the classroom, a placement might have
been made in a bilingual special education classroom rather than in
transitional bilingual education to address learning and behavioral
problems. Since Chapter I does not exist in all schools, a child with
a deprived educational background in a non-Chapter I school might re¬
ceive remedial services in the only option available, special educa¬
tion. Since school systems do not have a well defined set of entrance
and exit criteria for each program, nor a well defined set of criteria
for movement from one program to another, placement decisions are not
clear cut. They contain a substantial degree of subjectivity.
This subjectivity can create unequal enrollment patterns in
remedial education due to practices and beliefs relative to race,
culture, language, or a handicapping condition. Since unequal can be
considered either an over utilization of some programs or an under
utilization of other programs, both disproportional occurrences
create what might be an illusion of discrimination.
As previously stated, Massachusetts General Law, Chapter 71B,
Section 6, prohibits disproportionate enrollment of minority students
in special education unless there is a "compelling interest for such
disproportionality."39 When disproportionality in enrollment rates
exists, investigations must be conducted by the Massachusetts Depart-

39
ment of Education to determine if discrimination is occurring.
Investigative procedures by the Department to date have focused
mainly on adherence to regulations and assessment practices. For
years investigations continued; violations were discovered and cited
by the Department. Although violations were corrected by the school
systems, disproportionate numbers of students still appeared when the
enrollment patterns were studied the following year.
In response to these recurring patterns of discrimination and
the mandate to continue investigations, the Department asked each
school system which had disproportionate placement of students in
special education to develop an Action Plan (Appendix B) to help
identify why disproportionality was occurring. However, after four
years of developing and implementing individual Action Plans, some
school districts continue to be cited for prima facie denial of equal
educational opportunities. A clear comprehensive understanding of
why this pattern emerges and if discrimination is really occurring
has not yet evolved. The Action Plan included as one element an
analysis of placement patterns in special education. This, in iso¬
lation, did not explain why minority children were placed in one
special education program more or less frequently than another. This
element, though, touches the periphery of another more important con¬
cern which has been discussed in this chapter. Could the remedial
needs of minority students be met in more than one program?
A major intention of the present study is to determine if the
participation of minority students in one remedial program was affect

40
ing the enrollment pattern in another program. The overlap of program
goals as seen in Table 1 could be partially responsible for dispropor¬
tionate enrollment patterns of minority students in special education.
It has been shown that more than one remedial program can meet the
educational needs of a student and it is being suggested that the
placement of minority students in special education, transitional bi¬
lingual education, or Chapter I programs may be due to factors other
than legal mandate, legislative intent, or educational need. Place¬
ments may be based on philosophy of education, availability of a pro¬
gram, or the language in which a program is offered.
It is not the purpose of this research to debate the advantages
and disadvantages of any one remedial program. Rather, the intention
is to determine if the overlap of educational goals and placement
options in remedial programs creates an illusion of discriminatory
educational practices for minority youth, or if discriminatory condi¬
tions indeed exist and thus prevent Black and Hispanic students from
receiving equal educational opportunities. This will be determined
through a study of enrollment patterns in remedial education.
In summary, this chapter has provided the reader with an over¬
view of some historical practices which were exclusionary in nature
and prevented students from receiving educational opportunities.
Major litigation and legislation which led to the guarantee of equal
educational opportunities for all student groups was highlighted.
Also included was a narrative and graphic description of educational
goals which appear in remedial education programs. These goals pro-

41
vide educational assistance to students in one or more remedial pro¬
grams and overlap at times. The next chapter presents the design of
this study. Data collection and analysis procedures are stated for
each of the five research objectives by individual school districts.

CHAPTER III
DESIGN OF THE STUDY
The major purpose of this chapter is to explain how the study was
conducted. It consists of two sections. The first section describes
the school districts, schools, and students involved in the study.
The second section identifies the various types of data used in the
investigation, describes how the data were collected, and details the
procedures used to analyze the data so each research objective could
be accomplished.
Selected School Districts, Schools, and Students
School Districts
The school districts included in this study were three urban
systems in western Massachusetts. They were selected for three main
reasons. First, each district had been cited by the Massachusetts
Department of Education in 1983 for prima facie denial of equal edu¬
cational opportunities to Black and Hispanic youth. The prima facie
evidence was disproportionate enrollment of minority students in
special education programs as compared with White peers.
Second, although the Department monitored each district for at
least three years, it neither uncovered discriminatory practices nor
could explain the disproportionality. The administrators of these
school districts were disappointed and frustrated by the investiga-
42

43
tions and wanted to better understand the disproportionality which was
occurring. The researcher personally met with each administrator to
explain the purpose of the study and to request their participation.
The three administrators agreed to participate in the study as they
wanted to analyze their systems in a new way; one which would, per¬
haps, explain why disproportionality of minority students in special
education continued to appear each year.
Third, these school districts were selected because they repre¬
sented different types of urban communities. School System A is a
large city with a minority-majority population. It had over 23,000
students, of whom 10,402 were White, 6,629 were Black, and 5,481 were
Hispanic. There were twelve secondary and thirty elementary schools
in this district. School System B is a smaller industrial city where
the majority of the school population was White. Minority students
accounted for about forty percent of the school population. This dis¬
trict had more than 6,800 students, of whom 3,921 were White, 274 were
Black, and 2,484 were Hispanic. There were four secondary and ten el¬
ementary schools within this system. School System C is a small pro¬
fessional city with a small minority population. It had more than
3,600 students, of whom 3,170 were White, 73 were Black, and 136 were
Hispanic. Two secondary and six elementary schools comprised this
district.
Sample Schools and Students
In the present study, all elementary and secondary schools in

44
each of the three districts were included in the systemwide analyses.
There were a total of sixty-four schools—forty-six were elementary,
kindergarten through grade six, while eighteen were secondary schools,
grades seven through twelve. In total, 32,570 students represented
three racial groups. There were 17,493 White, 6,976 Black and 8,101
Hispanic students.
Objectives Three and Four focused on transitional bilingual edu¬
cation and Chapter I programs in elementary schools. All elementary
schools in the three school districts were included in this study.
The total number of students was 16,897, of whom 8,588 were White,
3,433 were Black, and 4,876 were Hispanic.
Collection and Analysis of the Data
Data collected were analyzed in relationship to each of the five
research objectives. Each research objective has been restated in
this section with an explanation of the procedures used to complete
the analysis.
Objective One
To determine the enrollment patterns of Black, Hispanic and White
students in special education, transitional bilingual education, and
Chapter I in selected school systems.
The special education data came from the October 1, 1983 School
System Summary Report, while the transitional bilingual education data
45
and Chapter I data came from reports made by administrative personnel
in the fall of 1983. Since Massachusetts does not require school dis¬
tricts to keep records of the racial identities of students, these
data were extrapolated from local school district records. In Systems
B and C, the Directors of Special Education provided the information,
while in System A the data came from the Director of Research and
Evaluation and the Director of Special Education. School District A
had racial information in its computer; School Districts B and C col¬
lected it from school building reports.
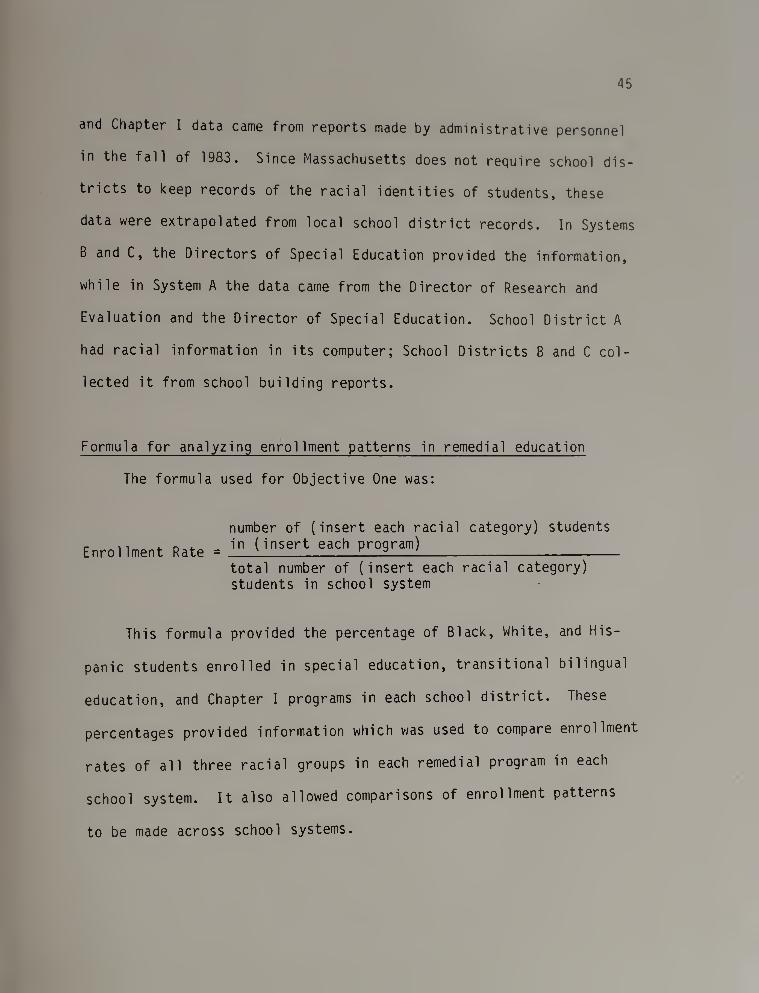
Formula for analyzing enrollment patterns in remedial education
The formula used for Objective One was:
number of (insert each racial category) students r . n . in (insert each program) Enrollment Rate = v___f_:-
total number of (insert each racial category) students in school system
This formula provided the percentage of Black, White, and His¬
panic students enrolled in special education, transitional bilingual
education, and Chapter I programs in each school district. These
percentages provided information which was used to compare enrollment
rates of all three racial groups in each remedial program in each
school system. It also allowed comparisons of enrollment patterns
to be made across school systems.

46
Objective Two
To determine if the enrollment patterns in special education at
selected school systems had a statistically significant under repre¬
sentation of minority students.
In Massachusetts prima facie denial of equal educational oppor¬
tunity is investigated by the following formula:
number of (insert each racial category) students o/o _ in (individual special education program)
number of (insert each racial category) students in special education
If the percentage of Black or Hispanic students differs from
that of White students by more than 20 percent, prima facie denial
of equal educational opportunities is concluded. The twenty percent
figure is arbitrary. Therefore, it was determined that a statistical
method, the chi square test, would be applied to special education
enrollment figures as an alternative approach to the Massachusetts'
formula to determine if under representation, when it occurred, was
statistically significant.
The data which were collected for this objective came from the
October 1, 1983 School Summary Reports and individual school reports.
The data were provided by the Directors of Special Education in the
selected school systems.

47
Formula for determining statistically significant under representa¬
tion of minority students in special education
A chi square test was applied to the special education enroll¬
ment data for each special education program prototype 502.1-502.4
(Appendix A). The formula was:
X2 ■ I
The data from the chi square test were analyzed by individual
school system, racial group, and program. Under representation was
labelled significant at the .05 level and was identified by school
district, racial group, and program.
Objective Three
To determine if minority enrollment patterns in special education
programs were affected by minority student participation in Chapter I
in elementary schools.
In School Districts B and C, the individual school program data,
which were collected for Objective One and also for Objective Two,
were used to address this objective. Both districts had gathered and
kept enrollment data for special education and Chapter I programs by
individual schools, thus facilitating a study of enrollment patterns
at individual elementary schools within a system. Since School Dis¬
trict A had not stored enrollment data by individual elementary
schools, a systemwide analysis of elementary school enrollment pat-

48
terns was completed through an alternative procedure. This alterna¬
tive procedure will be described after the formula used in School
Districts B and C is presented.
Formula for determining if special education enrollment was affected
by minority student participation in Chapter I programs (School Sys¬
tems B and C)
Enrollment Rate =
number of (insert each racial category) students
in (insert each program) at each elementary school
total number of (insert racial category) students in that elementary school
The schools within each district were separated into two cate¬
gories, Chapter I Schools and Non Chapter I Schools. This separation
allowed the special education enrollment data in percentages to be
analyzed in relationship to the availability of another remedial ser¬
vice, Chapter I. In other words, a descriptive analysis of the ra¬
cial enrollment trends in special education at Chapter I Schools and
non Chapter I Schools was completed on an individual school basis.
This analysis determined if the existence of Chapter I in a school
affected the percentage of minority students in special education.
School System A had provided the enrollment data used in Objec¬
tives One and Two from reports they had completed for the state.
The special education data had been totaled in the central office by
individual programs and reported by program and student age. the

49
data had not been reported by individual school. Thus, to collect
the individual school data a procedure for counting all of the stu¬
dents who were in 502.1, 502.2, 502.3, and 502.4 special education
programs would have had to be developed and implemented. The school
system would not do this and confidentiality laws prevented this re¬
searcher from hand counting students in the programs. Therefore, the
Director of Research and Evaluation supplied data extrapolated from
individual school reports which he obtained from building principals.
However, as these did not reflect the same time periods and had miss¬
ing information, they could not be used for the individual school
analysis.
The researcher decided that an alternative analysis should be
completed for Objective Three for School System A. This analysis
differs from that for Districts B and C as it presents a systemwide
view of the impact Chapter I had on special education in elementary
schools rather than an individual school perspective.
Procedure for determining on a systemwide basis if special education
enrollment was affected by minority student participation in Chapter
I programs
First, a calculation was made to determine the percentage of
Black and Hispanic students who attended schools with Chapter I pro¬
grams. The formula used was:

50
number of (insert racial group) students in oo _ elementary schools with Chapter I
number of (insert racial group) students in K-6 grade
Next, a calculation was made to determine the percentage of Black and
Hispanic students who did not attend schools with Chapter I programs.
The formula was:
number of (insert racial group) students in non _ Chapter I elementary schools
number of (insert racial group) students in K-6 grade
The next two calculations focused on enrollment in special
education at Chapter I and non Chapter I schools. One formula was:
number of (insert racial group) students in special education at elementary schools with Chapter I
number of (insert racial group) students inK-6 grade at Chapter I schools
and yielded the percentage of Black and Hispanic students who were
enrolled in special education at Chapter I schools. The following
formula:
number of (insert racial group) students in special education at non Chapter I elementary schools
number of (insert racial group) students in K-6 grade at non Chapter I schools
yielded the percentage of Black and Hispanic students enrolled in
special education at non Chapter I schools. These percentages and

51
enrollment figures were used to analyze the effect minority student
participation in Chapter I appeared to have on special education
enrollment patterns.
The analysis continued by taking the total enrollment of each
minority group at Chapter I schools and multiplying this number by
the percentage of Black and Hispanic students enrolled in special
education at non Chapter I schools.
Total enrollment of (insert racial group) at Chapter I schools x percentage of (insert racial group) enrolled in special education at non Chapter I schools = number of (insert racial group) ex¬ pected to need special education if Chapter I were not available
This resulted in the number of Black or Hispanic students who would
be expected to need special education if Chapter I programs did not
exist. After subtracting the actual number of students in special
education at Chapter I schools from the number expected to need spe¬
cial education, the result was analyzed to determine if the partici¬
pation of minority students in Chapter I programs had an impact on
enrollment in special education.
Objective Four
To determine if minority enrollment patterns in special education
programs were affected by minority student participation in transi¬
tional bilingual education in elementary schools.
As stated in Objective Three, the individual school program data
which were collected by the Directors of Special Education in School
52
Systems B and C were used to address this objective. These data were
translated into percentages using the following formula.
Formula for determining if special education enrollment was affected
by Hispanic student participation in transitional bilingual education
(School Systems B and C)
number of (insert each racial category) students r ,, . n . in (insert each program) at each elementary school
total number of (insert racial category) students in that elementary school
The schools within each district were separated into two cate¬
gories, Transitional Bilingual Education Schools and Non Transitional
Bilingual Education Schools. This separation allowed the special
education enrollment data, translated into racial percentages, to be
analyzed in relationship to the availability of another remedial ser¬
vice, transitional bilingual education. A descriptive analysis of
the racial enrollment trends in special education at Transitional
Bilingual Education Schools and Non Transitional Bilingual Education
Schools was completed on an individual school basis. This analysis
was used to determine if the existence of transitional bilingual
education in a school affected the percentage of minority students
in special education.
As previously stated, the individual school data for District A
could not be validly analyzed by individual schools, so again a

53
systemwide analysis was completed. A procedure analogous to that in
Objective Three was used for this analysis.
Procedure for determining on a systemwide basis if special education
was affected by Hispanic student participation in transitional bi¬
lingual education (School System A)
First a calculation was made to determine the percentage of
Hispanic students who attended schools with transitional bilingual
education. The formula was:
number of Hispanic students in elementary schools 0/ _ with transitional bilingual education ^ = --—--—-—-
number of Hispanic students in K-6 grade
Next, a calculation was made to determine the percentage of Hispanic
students who did not attend schools with transitional bilingual ed¬
ucation. This formula was:
number of Hispanic students in elementary schools _ without transitional bilingual education_
number of Hispanic students in K-6 grade
The next two calculations focused on enrollment in special
education at transitional bilingual education schools and schools
without transitional bilingual education. One formula was.
number of Hispanic students in special education
_ elementary schools with TBE__
number of Hispanic students in K-6 grade at TBE
schools
at

54
and yielded the percentage of Hispanic students who were enrolled in
special education at TBE schools. The following formula:
number of Hispanic students in special education at non TBE schools
number of Hispanic students in K-6 grade at non TBE schools
yielded the percentage of Hispanic students enrolled in special edu¬
cation at non TBE schools. These percentages and enrollment figures
were used to analyze the effect that minority student participation
in transitional bilingual education appeared to have on special edu¬
cation enrollment patterns.
This analysis continued by taking the total number of Hispanic
students at transitional bilingual education schools and multiplying
this number by the percentage of Hispanic students enrolled in spe¬
cial education at non transitional bilingual education schools.
Total Hispanic enrollment at transitional bilingual education schools x percentage of Hispanic students enrolled in special education at non transitional bilingual education schools = number of Hispanic students expected to need special education if transitional bilingual education were not available
This resulted in the number of Hispanic students who would be expected
to need special education if transitional bilingual education did not
exist. After subtracting the actual number of students in special
education at transitional bilingual education schools from the number
expected to need special education, the result was analyzed to deter-

55
mine if the particiption of minority students in transitional bilin¬
gual education programs had an impact on special education.
Objective Five
To determine if enrollment patterns in remedial programs indi¬
cated that minority students were denied participation in programs
designed to provide equal educational opportunities.
Data gathered for and previously used in Objectives One through
Four were used to address this objective for all three school systems.
The data were analyzed collectively by using the results from:
(1) Formula for analyzing enrollment patterns in remedial
education,
(2) Formula for determining statistically significant under
representation of minority students in special education,
(3) Formula for determining if special education enrollment was
affected by minority student participation in Chapter I
programs,
(4) Procedures for determining on a systemwide basis if special
education enrollment was affected by minority students par¬
ticipating in Chapter I programs,
(5) Formula for determining if special education enrollment was
affected by Hispanic student participation in transitional
bilingual education, and
(6) Procedure for determining on a systemwide basis if special
education was affected by Hispanic student participation in

56
transitional bilingual education.
All of the enrollment data which were collected for special education,
transitional bilingual education, and Chapter I programs were
analyzed collectively by school district to determine if the parti¬
cipation of minority students in one remedial program affected parti¬
cipation in another remedial program. This collective analysis was
used to determine if minority students were denied equal educational
opportunities or if the accessibility of one remedial program created
illusions of discrimination in another program, specifically special
education.
In summary, this chapter had two main purposes. First, it ex¬
plained demographic information about the three school districts which
were included in this study and then presented the actual sample used
in this research--the number of elementary and secondary schools and
number of White, Black, and Hispanic students. Reasons for the inclu¬
sion of these districts in the present research were stated. Second,
it restated each research objective which guided this study and after
each objective, gave descriptions of the data collected and statisti¬
cal calculations applied to the data. This was followed by an explan¬
ation of the methods used to analyze the data. Due to confidentiality
laws and a system-wide data collection system, some data from School
System A were analyzed differently for Objectives Three, Four, and
Five. The alternate analysis was explained where necessary. The de¬
sign provided the format for Chapter IV, Results of the Study, where
the collected data are presented, analyzed and discussed.

CHAPTER IV
RESULTS OF THE STUDY
The major purpose of Chapter IV is to present the results of this
study on equal educational opportunities for minority students in re¬
medial education. The data collected for the three school districts
included in this study are presented for each research objective and
followed by an analysis and discussion of the data. Analysis and dis¬
cussion are completed by districts and across districts, when appro¬
priate. However, due to the many variables which exist in a school
district, the results are not intended to be used to compare school
districts with each other, since a more thorough understanding of the
complexities of the individual systems would be needed. Rather, the
results are to be used to determine if the systems which participated
in this study were denying equal educational opportunities to minority
students and if similar patterns of denial existed among the school
districts.
Presentation of the Data
Objective One
To determine the enrollment pattern of Black, Hispanic, and White
students in special education, transitional bilingual education, and
Chapter I in selected school systems.
The data which were collected for this objective included special
57

58
education enrollment figures for five different special education pro¬
gram prototypes. Prototypes, as described in the first chapter and
in Appendix A, are a numerical labelling system which designate how
much time a student spends in special education. The severity of a
child's academic needs can be determined by the prototype; the higher
the prototype the greater the need for special education services.
Within the public schools, 502.4 is the prototype which represents
students with the greatest academic needs. In contrast, students in
502.1 prototypes generally have the least severe academic needs of
all students in special education. Enrollment in each prototype,
502.1, 502.2 academic, 502.2 speech/language, 502.3, and 502.4, was
separated by racial identity--White, Black or Hispanic. The number
of students who entered transitional bilingual education was obtained
from the TBE school reports and reported by racial group. Chapter I
enrollment figures were similarly obtained and reported.
In the public school special education programs provided by
School System A, 11.3 percent of the Black students, 9.2 percent of
the Hispanic students, and 9 percent of the White students were in
special education. A more thorough comparison of these percentages
is provided by breaking down the enrollment of special education into
individual program prototypes and analyzing each component by racial
enrollment. Table 2 presents this special education enrollment data
for School System A. It shows that Hispanic students were under rep¬
resented in 502.1 and both the 502.2 academic and speech/language
program when compared with the enrollment rates of White students

59
<0
Q
O &. C <
e <d ro 4-» U </> CT> >> O <>0 u
Q. *— o
c o o -c
•*- (J -*-> UO CO u 3
“O
U OJ Q. uO
C\J O U“>
CM o un
0) ct> cO 3 ct>
CM C • CO
CM *— o ^ WO .C
U <d CD a. crt
E D
*o cO CJ O
CM O un
CM O m
c CD U '- <D a.
O m 4-»
i- c CD OJ -Q "O E 3 3 4-» Z UO
c CD u L> <D a.
O m
i. c CD <D -Q -O E 3 3 4-» Z ^
(D U u (D
Q-
L. C 01 CD
•i^ 3 4-> Z OO
c CD U
D Q.
O m 4->
l. c CD D -Q TD E 3 3 4-» z oo
c CD u L. CD
Q.
o m w
u c (D CD n -o S 3 3 4-> Z </>
C <D
— E O <— 4-> <- O O - £
<T3 Q. •r- 3
u o «T3 U
<X O
— o rn *t
O so CM VO co CM >—
CM
CM
m co <J\ CM CM
CM CO
CM —
CM CO CM
m ao
o «T
CO CM
CM CX> p—
O CM ao «T ^0
O •>o m
c <D -* ^
•*-» CJ CL p- «0 </> ^ p— • —
3 GO X

60
these programs. Black students were under represented when compared
to White student enrollment rates in the 502.1. The major enrollment
discrepancy occurred in the speech/language special education program.
While White students entered speech/language at a rate of 2.2 percent
of the population, only 1.3 percent of Black students and .9 percent
of Hispanic students received speech/language services in special edu¬
cation. When 502.3 and 502.4 program enrollment rates were studied,
there was an over representation of minority students in both of these
programs. The more noticeable difference occurred in the 502.3 pro¬
gram where the percentage enrollment rate of minority students was
double the percentage enrollment rate of White students (Black, 4.5%;
Hispanic, 4.4%; White, 2.2%).
Transitional bilingual education enrollment data are presented
in Table 3. More than 20 percent of the Hispanic student population,
1135 students, were enrolled in transitional bilingual programs.
These programs only served Hispanic students.
Table 4 is a presentation of relative percentage rates of White,
Black and Hispanic students in Chapter I programs. The enrollment
rate of Hispanic students in Chapter I was 38.8 percent, while Black
students were enrolled at a 21.9 percentage rate. Enrollment rates
of minority student groups were greater than the White student enroll
ment rate of 13.1 percent.
Contrasting enrollment patterns of White and Black students.
Black students were under represented in 502.1 and 502.2 special
education speech/language programs. Black students were enrolled at

61
Table 3
Transitional Bilingual Education Enrollment Data School System A
Tn+.,-i TBE Enrollment Racial Group Flit ---
nro men Number of Students Percent of Students
White 10,402 0 0
Black 6,629 0 0
Hispanic 5,481 1,135 20.7

62
Table 4
Chapter I Enrollment Rate School System A
Racial Group Total
Enrollment
Chapter I Enrollment
Number of Students Percent of Students
White 10,402 1,359 13.1
Black 6,629 1,452 21.9
Hispanic 5,481 2,127 38.8

63
a greater proportionate rate than White peers in 502.2 academic, 502.3
and 502.4 special education programs, and Chapter I. Neither Black
nor White students were enrolled in transitional bilingual education.
Contrasting enrollment patterns of White and Hispanic students,
Hispanic students were under represented in 502.1, 502.2 academic,
and 502.2 speech/language programs. They were over represented in
the 502.3 and 502.4 special education programs, were the only racial
group in TBE, and had the highest proportional representation of all
races in Chapter I.
In the public school special education programs provided by
School System B, 16.8 percent of Black students, 10.4 percent of His¬
panic, and 11.4 percent of White students were enrolled. According
to these percentages. Black students received 5.4 percent more and
Hispanic students received 1.0 percent less remedial help in special
education than their White peers.
Table 5, which presents School System B's special education en¬
rollment data, shows that compared with White student enrollment, His¬
panic students were under represented in 502.1, 502.2 academic and
502.2 speech/language. Black students were only under represented in
502.2 speech/language. However, in the more restrictive programs,
502.3 (White, 1.5%; Black, 2.9%; Hispanic, 2.9%) and 502.4 (White,
1.6%; Black, 2.6%; Hispanic, 2.4%), the enrollment rate of Black and
Hispanic students was greater than that of the White student popula¬
tion.
Transitional bilingual education enrollment data are presented

Sp
ecia
l E
duca
tion
Pro
gram
Enro
llm
ent
Dat
a S
choo
l S
yste
m
B
64
4-» c QJ LO LO to* O 4 • k *— CNJ CM QJ
Q. *T
CM k. O O LO LT> +■*
k C QJ QJ TT r*^ O
il VO LO
3 4-» Z on
4-t c QJ LT> On On U • • k *— CNJ CM QJ
+-> Q_ c cn QJ •
E C\J k- e— O O LO *— LO 4-> o L- C k QJ QJ CO CM c -O 'O LO
LU E 3 3 -M
E z on <v k cr> u o c k QJ QJ CM co
CL on U • (V k CM r—
C 3 QJ o on Q.
•*“ C\J c • TO
<v CM •— k- u o \ O LO 3 LO .C
■D u k c UJ QJ QJ QJ CO cn
QJ -Q -O 00 CM *— Q. E 3 TO v/n 3 4->
z on U 0) Cl •M
on c U QJ to* on ©
U to E k lO On 3 QJ QJ
T3 *o Q. •*— TO > u
•*— TO k- •o O LO c W
C\J k c CNJ VO on • QJ QJ CM On
cm o * ?
CNJ
U“> 3 4-> z on
4-» c QJ U cn k • 4 •
QJ CL
CM <4- o o v/> LO 4->
k c QJ QJ vO CM .a *o E 3 3 4U z on
CNJ
4-» c QJ TO* C
E CNJ CO *v •— on CM
4U ■— * *
o o H- k
m CM
c LU
u «— •r-
TO Q c •— 3 QJ J* fV
U O 4-> U CL
tv k •f- TO i/l
Q£ O -C •r-
CO z
65
in Table 6. Almost 30 percent of the Hispanic population were en¬
rolled in transitional bilingual education. Again, Hispanic students
were the only racial group enrolled in this program.
Table 7 is a presentation of relative percentage rates of White,
Black and Hispanic students in Chapter I programs. The greatest en¬
rollment rate was that of Hispanic students, 37.4 percent, followed
by Black student enrollment at 21.5 percent, and a White enrollment
rate of 12.4 percent. This resulted in a majority of minority stu¬
dents (58.9%) in Chapter I.
Contrasting special education enrollment patterns of White and
Black students in System B, Black students were under represented only
in the 502.2 speech/language program. They were over represented in
the 502.2 academic, 502.3, and 502.4 programs and equally represented
in the 502.1 program. Neither Black nor White students were enrolled
in TBE.
Contrasting special education enrollment patterns of White and
Hispanic students in System B, Hispanic students were under repre¬
sented in 502.1, 502.2 academic, and 502.2 speech and language pro¬
grams. They were over represented in both the 502.3 and 502.4 special
education programs. Hispanic students were the only racial group to
receive TBE services (726 students) and had the highest proportional
representation in Chapter I programs (37.4%).
In the public school special education programs provided by
School System C, 21.9 percent of the students were Black, 23.5 per¬
cent of the students were Hispanic, and 13.2 percent of the students

66
Table 6
Transitional Bilingual Education Enrollment Data School System B
Tr.4.a-. TBE Enrollment Racial Group F ,, . --——-
nro men Number of Students Percent of Students
White 3,921 0 0
Black 274 0 0
Hispanic 2,484 726 29.2

67
Table 7
Chapter I Enrollment Data School System B
Racial Group Total Enrollment
Chapter I Enrollment
Number of Students Percent of Students
White 3,921 488 12.4
Black 274 59 21.5
Hispanic 2,494 929 37.4

68
were White. Minority students participated in special education at
greater percentage rates than White peers.
Table 8 presents special education enrollment data. When com¬
pared with the White enrollment rates, Black and Hispanic students
were under represented in the 502.2 speech/language (White, 1.9%;
Black, 1.4%, Hispanic, 0%) program and Blacks were under represented
in the 502.1 program (White, .9%; Black, 0%).
Minority students were enrolled in the 502.3 and 502.4 special
education programs at more than twice the rate of White students. In
the 502.3 program, 1.8 percent of White students were enrolled, as
contrasted with 4.1 percent of the Black students and 8.8 percent of
the Hispanic students. In the 502.4 program, 2.0 percent of White
students were enrolled, as contrasted with 6.8 percent of the Black
students and 5.9 percent of the Hispanic students.
Transitional bilingual education data are presented in Table 9
for School System C. More than 30 percent of the Hispanic population
of this school system were enrolled in this transitional bilingual
program. Table 10 is a presentation of relative percentage rates of
White, Black and Hispanic students in Chapter I. Black students led
the enrollment pattern with over 30 percent of Black students receiv¬
ing aid from Chapter I. Hispanic students, with an enrollment rate
of 9.6 percent, were similar to the enrollment rate of White students
(8.1%).
Contrasting special education enrollment patterns of White and
Black students in System C, Black students were under represented in

69
CO
Ot
-a
*3 O
C CJ c S e at ^0 4-» i- t/1 cn >» o <y> u
Q- O
c ◦ o .C •— u
•*-» CO <■0 u 3
■O
u ■X) CL </>
c at u
o CO oo
C. at
CM VO cn
a. *r
CM <*- o O cn cn
C- c a a CM cn GO -9 "O CO § 3 3 w z uo
c 0) GO <— ao u • • L. at
•— *T ao a.
c on
e CVJ a- o Q cn cn
o L. C L. at at 00 m CM C
UJ -Q -Q E 3
cn
3 •*_> E Z UO <TJ
a> 4J o c u a> at a> TT
Q. a> u 'O &• #— o C 3 at
O cn Q. •*“ CM c
• <o *T3 CM <— <J o \ O cn 3 cn JO 4-»
T3 <J u c LU 0) at at oo r— o
0) <Q ^ cn r— Q. E 3
<T3 cn 3 <*-> "«-»* z un
U at CL w
UO ——s c U at co CO ^r
u <T3 E L. CO ao Ps* 3 at at
T3 -a Q. ■r— ns > u
•r— <n a- *3 O cn C +->
CM c. c pn. o • at at r—
CM O
CM
cn 3 -*-> Z UO
-4-> c at JO cn u • • V. o <— at a.
CM a- o O co cn w
i- C at at r-* o CM
i? CM
3 W Z ^
•*->
a) O m cO — E i—. m T3 /— *— >— W -— «* o o
t— i- ro
c UJ
u f— •r—
<T3 a c •*- 3 at _* u o +-» u a. -T3 L. 4/1 ca <jd 'r">
3 CO

70
Table 9
Transitional Bilingual Education Enrollment Data School System C
Tnt,i TBE Enrollment Racial Group F °,? . -
nro men Number of Students Percent of Students
White 3,170 0 0
Black 73 0 0
Hispanic 136 43 31.6

71
Table 10
Chapter I Enrollment Rate School System C
acial Group Total EnrolIment
Chapter I EnrolIment
Number of Students Percent of Students
White 3,170 258 8.1
Black 73 23 31.5
Hispanic 136 13 9.6

72
502.1 and 502.2 speech and language programs. They were over repre¬
sented in all others. Black students entered Chapter I programs at
almost four times the rate of White students (White, 8.1%; Black,
31.5%). Neither racial group entered TBE.
Contrasting special education enrollment patterns of White and
Hispanic students in System C, Hispanic students were under repre¬
sented in only one program, 502.2 speech/language. They were over
represented in all other programs in special education. Additionally,
they were the only racial group serviced in TBE (31.6%) and were en¬
rolled at a slightly higher percentage rate (White, 8.1%; Hispanic,
9.6%) than White peers in Chapter I.
Analysis and Discussion
At first, the enrollment patterns of Black (11.3%), White (9.0%),
and Hispanic (9.2%) students in special education at School System A
suggested that more minority students received special education ser¬
vices than White students. However, when individual special education
programs were analyzed, minority students did not receive speech/
language services at a rate proportionate to their White peers and
Hispanic students were under represented in the 502.1 and 502.2 aca¬
demic special education programs. Under representation of minority
students in special education did not appear in the total enrollment
analysis because of the over representation of minority students in
the 502.3 and 502.4 programs.
The 38.8 percent representation of Hispanic students in Chapter

73
I programs and the 20.7 percent representation in TBE appears to be
decreasing the enrollment of Hispanic students in 502.1 or 502.2 aca¬
demic services. Although it would be expected that more Hispanic
students than White students would be enrolled in remedial programs
such as TBE and Chapter I due to socio-economic factors, linguistic
differences, and perhaps a deprived educational background, as dis¬
cussed in Chapter II of this study, a question must be raised about
the appropriateness of the large Hispanic enrollment in Chapter I and
TBE programs. Are some Hispanic students remaining or placed in Chap¬
ter I or TBE rather than in special education 502.1 or 502.2 academic
programs? It appears that this is true and a denial of some special
education services is occurring.
Additionally, this denial of the less comprehensive special edu¬
cation services may result in a greater Hispanic enrollment in 502.3
and 502.4 programs, the more segregated and comprehensive programs
within a public school. If special needs are not diagnosed and reme¬
diated early in a child's school career, the result can be a greater
need for special education such as provided in the 502.3 and 502.4
settings. Therefore, the decreased Hispanic enrollment in 502.1 and
502.2 academic programs may be due, in part, to the availability and
utilization of Chapter I and TBE programs but also appears to indi¬
cate a denial of some special education services resulting in a need
for more comprehensive services at a later date.
Black students were enrolled in Chapter I programs and in the
502.2 academic special education program at a greater proportionate

74
rate than their White peers. However, they were under represented in
the 502.1 special education program. It appears that the utilization
of Chapter I may decrease enrollment in 502.1 programs by providing
one-half to one hour of a remedial service rather than a modification
in regular education as provided by 502.1 programs. When the nature
of the Black population's educational needs are greater than those of
White counterparts, as previously discussed, this enrollment pattern
would appear to be appropriate rather than indicate a denial of equal
educational opportunities. The opportunities may be provided in a
more comprehensive fashion in Chapter I rather than the 502.1 special
education program.
Hispanic and Black students were both under represented in the
speech/language special education programs. This suggests two pos¬
sibilities in School System A. First, another remedial program
addressed some speech/language needs of some minority students.
Second, speech/language needs among the Black and Hispanic populations
were not accurately identified, and therefore, their speech/language
needs were not met.
If another program addressed speech and language needs of minor¬
ity students, the under representation which was found might not indi¬
cate a denial of equal educational opportunities, but rather the par¬
ticipation of minority students in other remedial programs. However,
since Chapter I programs did not provide speech and language remedia¬
tion, they were not a substitute for the speech and language services
of special education. It is possible that TBE addressed some language
75
needs of Hispanic students but could not have addressed speech needs
as the teachers were not qualified to do this. Therefore, the under
enrollment which was found in the 502.2 speech/language special edu¬
cation programs appears to constitute a denial of equal educational
opportunities to Black and Hispanic youth.
In School System B, Black students were enrolled in the 502.2
academic special education program and Chapter I at approximately
twice the rate of White students. Hispanic students participated in
Chapter I at more than three times the rate of White students but
participated in the 502.2 academic program at a 1.4 percent lower
rate than White students.
The 502.2 academic program offered one-half to one and one-half
hours of daily remedial instruction comparable to the length of time
a student might spend in a Chapter I program. It appears that parti¬
cipation of Hispanic students in Chapter I programs may have decreased
their enrollment in special education 502.1 or 502.2 academic pro¬
grams. However, if Hispanic students had actually been denied en¬
trance into these programs, this denial of a less comprehensive spe¬
cial education program might have resulted in a student's educational
needs becoming greater, thus necessitating the more comprehensive
special education program (502.3 or 502.4). If, due to over reliance
on Chapter I, the over representation in the more comprehensive spe¬
cial education programs resulted, then a denial of educational oppor¬
tunities in less comprehensive programs (502.1 and 502.2 academic)
appears to have occurred.

76
As in School System A, speech and language services were not
received by minority students at the same proportionate rate as White
students. For Hispanic students, this may be, among other reasons,
caused by a lack of Spanish speech pathologists who could accurately
identify, diagnose and remediate speech and language problems in
Spanish speaking youth or by participation in another remedial pro¬
gram, TBE. Since TBE was not designed to provide speech services, a
denial of some educational opportunities appears to have occurred.
No other remedial program offered speech and language services to
Black students, therefore, the under representation of Black students
in speech and language may have been caused, in part, by a lack of
personnel; more specifically, a lack of those who understood the dia¬
lect and culture of Black students. As no other programs in System B
provided speech services to minority students, it appears that under
representation of Black and Hispanic students in 502.2 speech/language
is a denial of equal educational opportunities.
Although minority groups represented a small percentage of School
System C's student population, special education, transitional bilin¬
gual education, and Chapter I programs were all offered. Hispanic
students participated in every academic special education program at
a rate higher than White students. It appeared that the academic
needs of the Hispanic students in this professional city were greater
than the White student group and were met through a variety of reme¬
dial programs.
The under representation of Black students in the 502.1 program

77
may have been due to the large enrollment in Chapter I (31.5%) as
contrasted with the other minority groups (White, 8.1%; Hispanic,
9.6%). Chapter I may have provided more comprehensive but necessary
remediation to Black students. This pattern does not in itself sug¬
gest that educational opportunities were denied to Black students.
Speech and language services appear to have been unavailable or
not identified for Hispanic students, since no Hispanic students re¬
ceived speech/language services under special education. Since this
system had one bilingual speech pathologist which should have ade¬
quately met speech/language needs of Hispanic students, services were
available. However, it may be interpreted that either the small sam¬
ple size was not a true representation of the Hispanic population's
speech and language needs or that another program, such as TBE,
offered language services to some minority youth. It appears that
speech services may have been denied to Hispanic youth.
Black students had a higher rate of enrollment in three of the
five special education programs studied and in the Chapter I program.
Black students, though under represented, did receive speech/language
services in special education. Due to the small sample size of Black
students (73), the under representation cannot be assumed to be a
denial of speech services. The sample size may not have reflected a
representative group of Black students.
Objective One determined the racial enrollment patterns in spe-
cial education, transitional bilingual education, and Chapter I pro¬
grams in the three systems selected for this study. Enrollment pat-

78
terns showed the following trends. In special education in all three
systems minority students were consistently under represented in the
502.2 speech programs and often over represented in the more compre¬
hensive, 502.3 and 502.4, programs. All systems used transitional
bilingual education as a program specifically for Hispanic students
and Chapter I programs were most heavily utilized by minority youth.
Minority students utilized Chapter I and TBE remedial programs at a
greater proportionate rate than White peers, used the less comprehen¬
sive special education services at a lower proportionate rate than
White peers, and were enrolled in the more comprehensive special
education services at a greater proportionate rate than White peers.
Objective Two
To determine if enrollment patterns in special education in
selected school systems had a statistically significant under
representation of minority students.
The Massachusetts Department of Education bases its citation of
prima facie denial of equal educational opportunities to minority
youth on a comparison of enrollment figures in special education on
October 1 of each year. If minority students are enrolled in special
education at a rate 20 percent lower than their White peers, under
representation is deemed significant. Since there has been much
criticism about the 20 percent figure as it is an arbitrary one, this
objective was designed to analyze the October 1 special education en¬
rollment by applying a chi square test to determine the statistical

79
significance of under enrollment of minority students in special edu¬
cation. Therefore, data collected for this objective were the same
enrollment figures as the Department of Education collects, the
October 1, 1983 School Summary Report. In addition, enrollment fig¬
ures of the 502.2 speech and language programs were collected to pro¬
vide a more accurate look at the 502.2 prototype programs.
When the total special education enrollment was used as a basis
for determining the proportional percentage of enrollment of Black,
Hispanic, and White students in special education, under representa¬
tion of both minority groups appeared in School System A's 502.1,
502.2 academic, and 502.2 speech and language programs. The largest
discrepancies occurred in the 502.2 programs.
In the 502.1 program, 2.1 percent of the White students enrolled
in special education were in this program, as compared with .8 per¬
cent of the Black students and no Hispanic students. A comparison of
enrollment rates in the 502.2 academic program shows enrollment per¬
centages of 12.9 percent White students, 11.3 percent Black students
and 6.0 percent Hispanic students. The 502.2 speech and language
program accounted for 21.4 percent of the White special education
enrollment, 10.2 percent of the Black student enrollment, and 8.6
percent of the Hispanic student enrollment. The chi square analysis
showed that all three enrollment patterns in these special education
programs were statistically significant at the .05 level (Table 11).
When the special education enrollment of School System B was
analyzed, under representation of both minority groups appeared in

80
Table 11
Chi Square Analysis Special Education Enrollment Data
School System A
Individual Program Special Education Percentages
Chi Square White Black Hispanic
502.1 2.1 .8 0 15.52097*
502.2 academics 12.9 11.3 6.0 19.21237*
502.2 speech/language 21.4 10.2 8.6 69.13180*
*p < .05.

81
the 501.1 and 502.2 speech and language programs. Of all White stu¬
dents in special education, 5.0 percent of them entered the 502.1
program as contrasted with a Black enrollment rate of 3.8 percent and
an Hispanic enrollment rate of 2.4 percent.
In the 502.2 speech and language programs. White students were
enrolled two to three times more than their minority counterparts.
White students had a representation of 16.8 percent as contrasted with
5.7 percent of the Black students and 7.1 percent of the Hispanic
students. The chi square analysis showed that the enrollment pattern
in this 502.2 program was statistically significant at the .05 level
(Table 12).
When special education enrollment was analyzed in School System
C, under representation of both minority groups appeared in the 502.2
programs. Of the total number of Black students in special education,
43.8 percent of them were in the 502.2 academic program as compared
with a percentage enrollment rate of 48.0 percent White students. Of
the total Hispanic special education population, 30.3 percent were
enrolled in this academic program.
Black students entered speech and language 502.2 programs at a
lower proportionate rate than White students. While 13.0 percent of
the White students in special education entered speech and language
programs, only 6.3 percent of the Black students entered this program
prototype in School System C. The under representation in both of
these programs was not significant at the .05 level, as shown in
Table 13.

82
Table 12
Chi Square Analysis Special Education Enrollment Data
School System B
Individual Program Special Education Percentages
Chi Square White Black Hispanic
502.1 5.0 3.8 2.4 3.335261
502.2 speech/language 16.8 5.7 7.1 69.13180*
^Not significant at .05 level.
*p < .05.

83
Table 13
Chi Square Analysis
Special Education Enrollment Data
School System C
Individual Program Special Education Percentages
Chi Square White Black Hispanic
502.2 academics 48.0 43.8 30.3 3.915071
502.2 speech/language 13.0 6.3 0 5.455791
^Not significant at .05 level.

84
Analysis and Discussion
The chi square test, when applied to special education enrollment
patterns, provides an approved and acceptable statistical methodology
for analyzing under representation of minority students in special
education. It serves as a contrast to the arbitrary mathematical
formula (20 percent discrepancy between racial enrollments) currently
used by the Massachusetts Department of Education, while also provid¬
ing another format for analyzing disproportionate enrollment rates.
In System A, the chi square test corroborated the patterns of
under representation which were found in the systemwide enrollment
analysis of Objective One and showed an additional finding of under
representation of Black students in 502.2 academic programs. This
example of under representation, which did not appear when the total
school population was used as the basis for determining dispropor-
tionality, highlights the importance of using more than one measure
to analyze enrollment. Disproportionality may not appear when the
total enrollment of a racial group within the system is used as a
basis for determining enrollment patterns, but may appear when racial
enrollment within a remedial program is used as a basis for determin¬
ing disproportionate placement.
As seen in the data from Objective One, both Black and Hispanic
students had a higher proportionate representation in Chapter I than
their White peers. Hispanic students were also heavily enrolled in
transitional bilingual education. These programs, it can be argued,
may have eliminated the need for some minority students to enter spe-

85
cial education. This may have been true for the 502.1 special educa¬
tion programs where a student's progress is monitored or modifications
are made to the regular education curriculum. But since the curricu¬
lum and remediation in Chapter I, TBE and the 502.2 special education
programs were not similar. Chapter I programs and/or TBE may have sup¬
planted special educational opportunities. It appears that Hispanic
and Black youth, as suggested by the under representation in 502.2
academic programs, were denied equal educational opportunities.
Speech and language services had a statistically significant
under enrollment of both minority groups which corroborates the find¬
ings in Objective One. It is possible that transitional bilingual
education addressed some language needs of Hispanic students, thus
substituting for special education. However, it appears that the
linguistic differences of Hispanic students may have interfered with
the proper diagnosis of their speech needs. The acknowledged short¬
age of bilingual and Black speech and language pathologists may be
responsible for the disparity in enrollment rates in special educa¬
tion speech and language programs and suggests a denial of equal edu¬
cational opportunities to minority youth, most dramatically in the
area of speech.
The chi square analysis of School System B's enrollment rates in
special education showed an area of under representation. Black stu¬
dents in the 502.1 programs, which was not seen in the systemwide
analysis of Objective One's enrollment patterns. The appearance of
under representation of Black students in the 502.1 program again

86
shows how a systemwide analysis does not identify all areas which
need further investigation.
It may again be speculated that the participation rate of minor¬
ity students in Chapter I programs and TBE may have decreased the
enrollment of Black and Hispanic students in special education 502.1
programs. Since the differences in enrollment rates were relatively
small (Blacks were enrolled at a 1.2 percent lower rate than White
students and Hispanics were enrolled at a 2.6 percent lower rate than
White students) and were not found to be statistically significant at
the .05 level, the enrollment pattern will not be interpreted to sug¬
gest equal educational opportunities were denied to the minority stu¬
dents in School System B's 502.1 programs. However, the enrollment
should be monitored to determine if any changes in the enrollment
pattern occur which might suggest a denial of educational options.
The speech enrollment pattern gives strength to the finding in
Objective One that either minority students received speech and lan¬
guage remediation in another program or a denial of equal educational
opportunities was occurring. Since Chapter I did not provide speech
services, it does not appear that Black students had a chance to
receive speech services in another program. Thus, it again appears
that Black students were denied equal educational opportunities in
speech and language programs.
Hispanic students may have received some remedial help in the
speech and language area through transitional bilingual education but
again, as in School System A, since the design of TBE did not include

87
speech remediation, the provision of equal educational opportunities
would appear to have been unavailable to this minority group, at least
in the area of speech.
In School System C, the disproportionate entry of minority stu¬
dents in the 502.2 programs may, as in the other school systems, con¬
stitute a denial of equal educational opportunities or may reflect
participation in TBE and Chapter I programs. Again, since Chapter I
did not provide speech services, it does not appear that Black stu¬
dents received speech in another remedial program; thus, it appears
that they were denied equal educational opportunities in the area of
speech and language.
TBE may have substituted for some of the academic and language
needs of the Hispanic population, thus creating disparity in White
and Hispanic enrollment rates. However, since no Hispanic students
received speech and language services in System C, unless the sample
was not a representative one, it appears that services were not pro¬
vided to Hispanic youth on an equal basis.
The under representation which is shown in the 502.2 academic
programs may result, in part, from the 31.5 percent enrollment rate
of Black students in Chapter I and the 31.6 percent enrollment rate
of Hispanic students in TBE. Since Chapter I and TBE do not offer
the extent of services found in 502.2 academic programs, it appears
that within the enrollment pattern of special education, minority
students do not receive equal educational opportunities. This pat¬
tern needs to be further monitored, as it was not consistent with the

88
systemwide total analysis which showed higher percentage rates of
minority students in 502.2 programs (Table 8).
In conclusion, the chi square analysis brought attention to
findings which strengthen and then go beyond an analysis of a total
school population's participation rate in selected remedial programs
and gave a statistical interpretation to under representation of
minority students in special education. Within the identified special
education population of all three systems, under representation was
seen in the same programs identified by the total population analysis
of Objective One. Additionally, this analysis added three findings.
First, based upon enrollment in special education, Black students were
under represented in the 502.2 academic program in Systems A and C.
Second, based upon enrollment in special education. Black students
were under represented in the 502.1 program in System B. Third,
based upon enrollment in special education, Hispanic students were
under represented in the 502.2 academic program in System C.
The chi square test supported the under representation which was
found in the systemwide analysis of enrollment rates. It also pro¬
vided new comparisons within special education by using an approved
mathematical alternative to the arbitrary mathematical procedure cur¬
rently used by the Massachusetts Department of Education to determine
denial of equal educational opportunities to minority youth.
Objective Three
To determine if minority enrollment patterns in special education

89
proarams were affected by minority student participation in Chapter I
in elementary schools.
The data collected for this objective were enrollment figures of
White, Black, and Hispanic students in Chapter I programs. In School
Systems B and C, the data were collected by individual elementary
school, in System A, the data were collected on a systemwide basis.
These data, in combination with data from Objective One, were used
for Objective Three.
In School System A, special education enrollment data from the
thirty elementary schools were kept by individual program prototype,
age and racial category on a systemwide basis at the central office
of administration. Individual school records were not part of this
central record keeping system.
As stated in the design of this study, the Director of Research
and Evaluation was unable to collect all of the individual school data
which were necessary for this objective. This missing data can be
seen in Tables 14 and 15.
Since special education program enrollment data could not be ob¬
tained according to all of the individual prototypes, the alternative
analysis--procedures for determining if special education was affected
by minority student participation in Chapter I programs—presented in
the design of this study was completed. The intent of Objective Three
was to determine if enrollment in special education programs was af¬
fected by minority student participation in Chapter I programs at ele¬
mentary schools. The available data did not give the complete repre-
Ind
ivid
ual
Ele
men
tary
Sch
ool
Enro
llm
ent
Dat
a S
cho
ol
Sys
tem
A C
hap
ter
I S
chools
90
O C ^ OlN • •••••
O 00 IX) r— 1^0 00 n n n nsf in
oor'*.coir>c\j<3- • •••••
O 1 CO 00 SO 0O cm ^ co in ^ uj
co cn cm o q- rs • •••••
oo cr> o in o oo *3- «a- c\j co m
I I
oo so so >— n ^ in in m
in O m-q-co io ro is <? co m cm (\i o nis co r-
CM
<— co in co
I
<d +-> id Q
•
CM O SO
+
3 QJ
OO
CM o SO
c Ol u s_ at a_
S- aj .a E 3
5.0
.7
CM
CO o • •
LO LO 2.0
7.3
CM SO
in os
so o • • 1
in >— - 1
SO 1— o o lo r^s '— in r>. 00 SO ' CM CM r—
O 3
d S_ cn O 3 a.
,_„ aj cn 4J d c 3 a> cn u 3 3
CM d aj • r— a.
CM \ O .3 in sj 3
a> ai a» jo CL E 00 3
—' ZI
m oo so os o <— . . • . . • • • CM '— in o d- oo O o OO I— o
oo cm r^o <53- m oo in cm O'—
+-> 3
--V at 1/1 sj u 3
CM •<— ai • E
cm aj o o
Cl
in d 3 u CJ d -Q
E 3 2:
co ■53- CO • •
OO
CM
o o
in O oO'— O CM CM CM OO
c a> QJ
<— E SJ d i— d
+-> i— ad o o
h~ i- >i C JO
CM'— OO OCM enN cn '— CMCOCO'g-I^CO'Jin in CMIC1U3CM'— LnCOCM^3-LT)CMC3SCOO^r^'53-^3-
sj SJ «_) SJ U • 1— •1— •1— •r” • 1— ,p“
rO Q. 3 c 3 3 3 c
3 a> iT3 0J -*C fO aj d a) <d aj JaC id aj (T3
u o -M a CL 4-> SJ CL 4-> SJ CL 4-> o Q.-M u cl+j a Q-
rO s_ tc i/l v- rO in ■r- d l/) •<— rO 1/1 •!— id in •<— r0 uo
o .3 ,— •r- SC <— ■r— -3 i— •i- -3 r— •r- _3 •r- ZI r“ •r-
IS CO X3ca ZE 12 co x: 3 CQ I IS CO x 3C CQ n:
o o
u I/O
,— ,— i— cMCMCMoooooo-g-sf'd'inLnuicDcocD lllllllllllllllll'
«£ «£ <C <=C =£ < <<<<<<<<<<el-<

Pro
gra
m E
nro
llm
en
t D
ata
91
c o cj
CD
-Q n3
i- CD
Q.
c OJ CJ s- <D
Q-
S_ CD
-Q
oo
C\J CM N N N O Ol ro O^'^inuinNo^o
C0NC0im0lfl(V)0<g-CDai0ist\unoJ CM 0O r- PO 03 LO U3 lO roScMcnS^S ^OCMCO
C1^ "'•P ^ CD CO ' cn oo i— ^j- ld c\j 1— Ln co —i. /v ,
oou, rou^^co^S^coS^SKbSKKi cn on co
c CD •
00 0 • •
0 LO r— O O r-v 00 00 O O •
CM o
CJ s_ CD
CM CM
CO 00
co 0 >— CM
cn *3- O CM co
21
.
12
. • • CM O
CO LO a.
+ S-
CO CD •
C\J o
-Q e 3
CM CO 1
2
O *3- cn
01
cn 1— CM *3- cn CM CM
CM *3"
on 2
^v
OJ cn 4-> rt3 c Z3 cn
CD CJ
0 co co 0 co CO co co co 0 c
C\J <3 s_ CD
0 <— co cn CM — 0 cn — — CO 0 CM • r— CL.
CM \ O JO ui cj S-
CD CD CD JO CL oo
E 3
1 0 -- -- <3- CO cn <— CM •—
—- 2
+-> sz
^" CD O CM CO CM co co co 0 00 CJ • • • • • • • CD S- 0 cn 0 0 CM <— 0 CM ■— 0 *3- O
C\J -I- CD • tr Q_
CM <D O T3 on fo S-
cj <D ra JO
—' E 23
0 co 0 O 0 CM 1— CM O LO CM
2:
+-> c QJ CD
'— E cj CO ■— *3 MO cn CO 0 0 CM ,_ CO cn ■=3- O cn CM ro ■vT O CO CO CO O
-M r— QC CM CO co CO CM cn CO r— CO <— 1— cn CM CO <— CM <30 in o o
1— s- >, ’ 1 1 CM 1 >— CM CM 1—
C XI UJ
CJ CJ CJ CJ 0 CJ 0 f— •r— •r— •r— • r— •r- • r— ■ C- O CL c c <3 c c c c
•i- 3 CD rO CD n/ rO a> J«C <T3 CD 03 CD H3 QJ <X3 <D J^ ft3 u o 4-> cj a. +-> CJ Cl+J 0 CL +j CJ CL+J cj Q. 4-> U Q. 4-> CJ CL O i_ •r— 0 00 •r— <T3 C/1 •r— fD on •r— (T3 00 •r- fD on •1— ra 00 •r rO on
OC CO r— •r— x: r— *r— JO r— 0= r— *r- XC p— •r— x: '— •<- JZ2 e— *f— 3: CO 3c 3 CO 3= 3 CO 3 CO 3= 3 CO 3 3 CO 31 2 CQ X
ro 00 ro o 0 O O r— r— 1- CM CM CM o r^ CO CO CO CT> cn cn 1— r— 1 1—
-C u
1 <C
1 <
1 1 < <
1 1 <c < A
- A
- A
- A
- A
- A
- A
- A
- A
- A
-
A-
A-
A-
A-
A-

Pro
gra
m E
nro
llm
en
t D
ata
92
c o o
■=3-
cu
jd 03
1. CL)
CL 03
C\J O U")
+
CO •
CM O cn
a> cn 03 13 cn c
CM 03
CM \ O -C LO U
aj aj CL i/i
(/) u
CM •<“ • *—
cm ai o -a LD 03
u 03
c aj aj E a
■— 03 r- CH o S- >3
C -Q
aj u i.
O) Cl
aj -Q
a> u O)
Q.
S- aj jd
ai u i.
ai CL
aj -Q
+-> c: cu u s- ai
CL
O) -O
o o SI u oo
^ 22 ^ ^ ^ '— Ocof,'~*3'«3'OcOLnocnr^r-3L<-'io.i ^>COCMCOCOCMCM-COCna3CO^^ggg^g^^
03
CO
'cr 1—
CM 03 • •
CO O
CD
CM
O CO
CO CO • •
cn 1—
03 *3- cm cn
'cr co • •
>—
cn co
CM 03 • •
*3- CO
cn
co >3- • •
CM r—
o o
^ ^ ^ CO N cn-vj- I— 03 CM'— • • • ••••*«« -,
' ^ 1— o 00 cm <— lo u-> <3- -— 1—
cm co >— o 00 cnco cn'— cocn
co ^tcm CM'— co c^cn cm co • • • ••• •• •• O 'D" CM O CM O'— CM O '— CM
O CO <— CD *3- CO O <3" COO '— CM
03OC0c0C0c003C0OC003r^C0'— 03'— CO CM 00 1— CO CO CO cn (J) CD <Cf '— 03 O CO CM 03 CO CO 1— o 03 CO CO CM'— '— *3" CO '— <3- CM CM CM '— '— '—
a 0 0 u u a u f— • r— • r— •1— •r“ ■ r— •f”
03 Q. c c: C c c C c — O O) J*Z fl (U^ 03 CD 03 cu fO O) D O ^ <D (1) 03
u O +-> u CL +-> U CL +J <_) CL -M O CL4-> O CL+-> O CL +-> <J Cl
03 S_ •f“ CD (/) •!— CD (/) ■r— n3 00 •r— <D CO • r“ <D (/)•!— (T3 LO -i— fD on
Qd O C“ ,— •i- -SC '— •r— LI r— •P“ -C r— •r— sz n— •r- SI '— • 1— _C r— >r“
3 ca O 3 CO =c 3 CO x 3 CO x 3 CO X3CO CC 3 OO x
<J<3-'3-imCUnc0C0CDNMv-C0C0C0O)0303OOO
7 7 7 7 T 7 T i i * ■ > ■ ■ « • • • < » ■ ^ <£ c <X. ^ ^ ^ CX. ^ <C e=X. <£. ^ ^

Indiv
idual
Ele
menta
ry
Sch
ool
Enro
llm
ent
Dat
a S
cho
ol
Syst
em
A N
on
Ch
ap
ter
I S
ch
oo
ls
93
4-> c cu cj
>—i s_ O)
S- Cl O)
+-> CL S_ n3 CU
-C -Q c_> E
o z
-M c
'd- cu • CJ
CM s_ CO O cu
+-> cn Q_ <T3 Q +
s_ +-> CO CU C • -Q Ol CM E e O C3
i— cn r— o S- ^v c <D
LU cn +J <n c
E o cu 03 cn cj S- c s_ cn CM K3 CU O • i— CL s_ CM ^
Q_ O -SC cn cj t-
cu CU QJ -Q CL E l/) o
—'
+-> c
-—- cu CO u u s_
CM •<- cu • E CL
CM CU o -a cn fo s_
cj cu TO -O — E
o 21
+J e cu a)
<— E u fO <— TO
+-> r- QC O O
1— S_ >, C JO
UJ
Racia
Gro
up
_ o o C"
u oo
CO CO O O — CO CO rv. o cn o o oo
cn CO O O co r-v. CO o O LO
cn *— cn cn
CO '—
10
CO oi CM i—
CO cn cn 03
r-^ co • •
r", oo
CO r—
CO
CM O
■— o
CO
on o
Ol o
CO
o
<— o
o
— o
■— o
o
CO o
CO o
^r
o
CM O
CO
cn o
co o
cm o • •
CO o
CO I—
o o
o o
r'*.
CM O
■— o
CO o
CO o
I— CnCMCOCMO'^WCO'— cJoO^-CDOrOrvCM CO r— CM CO i— cn OO CM CO TO" CO Ol !- Ol CO «—
CM ’—
cj CJ CJ CJ u U ■ r~ • i— •r— •r“ • 1— •r—
C C C C c C
cu TO aj j*c to cu TO cu <T3 CU rO CU <T3
+-> CJ SZL-M CJ CL4-> cj CL 4-> u au CJ Cl 4—i cj Q.
fO co •i— co co ■r— 03 C/1 * r“ 03 U0 •r— fT3 00 •r- CO uo
Jc r— *i— -C i- T- -C r— • P“ -C r— • p— r— •f— i- •r—
zs. CQ 31 13 CO 31 12 CO :n 12 CQ 3: 3 CO 3Z ^ CO n=
_ ^_ CM CM CM CO CO CO ’d" ■vl- TO- cn cn cn <xO cO
CM CM CM CM CM CM CM CM CM CM 1
CM CM CM CM CM i
CM CNJ i i
CM i
1 <■ <C =£
1 1 1 < < c
1 1 <. < ■<
1 < ■=£ <
i • < < < < <

Pro
gra
m E
nro
llm
ent
Dat
a
94
LO O co >— 00
CO LO O LO LO CM CM CO CM
r— O cm (XI r— LO 00 CO r— •- CO
o u
lo
<u C71 re =3 CT1
CM fO
CM O lo
x: u qj QJ CL i/I
■M c O) u 4- QJ
Cu
0) JO
CM LO
00 CM LO r—
CT1 I—
CO O • •
n o
re- 1—
LO
C\J O
re- O
O CM • •
*— CO
QJ -M
JO fO 1/1
u CM
CM cD o o LO re
o re
0) u $_ O)
Q_
S- a> JO E 3
o o
o o
LO
<— o
CM O
ai
o
CO O
CM O
CM O
c O) 0J
«— E o re >— re
+-> <— oc o o
i— s_ >i c JO
UJ
LO CM CO f— CO CO <—
LOOOooOLOoocor^i— r^CMc— O LO CM O O'! CO
>— I— CM ■— CO
re a. ■r- 3
o o re s_
OC CD
o o
o CO
a> +->
CM I
<
o u u u •r— •r— •p—
c <c c c re aj CaC re <u re qj LkC rtf
CL +J u CL -*-> o Cl 4-i u CL <T3 </) •<- re 1/1 T- rO c/i •<— re CO
•i- JO n— •r- JO i— •r- X *r”’ CD nr 3 CO 31 3 CD □r 3 CO n:
ivrsoocooaoiai^ooo CM CM CM CM CM CM CM CM CO CO CO I.I'''
<=£eCe£Cea;<d;<CcC':=C‘=C=£
95
sentation of individual elementary school enrollment trends. There¬
fore, the alternative analysis was completed using systemwide data,
which included all racial groups in kindergarten through sixth grade.
Table 16 identifies enrollment patterns of Black and Hispanic
students in special education and Chapter I programs. This analysis
showed 309 Black students enrolled in special education at Chapter I
schools and 229 students enrolled in special education at non Chapter
I schools. However, when compared on a percentage basis of enroll¬
ment, 14.1 percent of Black students entered special education at
Chapter I schools while 21.1 percent of Black students entered special
education at non Chapter I schools.
A similar enrollment pattern emerged when the Hispanic student
enrollment was analyzed at Chapter I and non Chapter I schools. In
this school system, 271 Hispanic students were enrolled in special
education at Chapter I schools (9.0%) and 82 Hispanic students were
enrolled in special education at non Chapter I schools (46.3%).
Of the 10 elementary schools in School System B, nine had Chap¬
ter I services and one did not. The school without Chapter I was a
pre-school and kindergarten combination and had only four White chil¬
dren in special education at the kindergarten level. Due to this
small number, it was not included in the analysis. Table 17 shows
the program enrollment data by race and school for the nine Chapter I
elementary schools.
In School B-l, Hispanic students were consistently under repre¬
sented in the 502.2 programs. Black students had no representation

96
Table 16
Chapter I and Special Education Program Relationships School System A
Elementary Schools
Analysis Data Black Hispanic Students Students
(1) Enrollment in grades K-6 3,269 3,183
(2) Enrollment in Chapter I schools 2,184 3,006
(3) Percentage of Minority Students Enrolled in Schools with Chapter I Programs
(4) Enrollment in Non Chapter I schools
(5) Percentage of Minority Students Enrolled in Schools Without Chapter I Programs
(6) Enrollment in Special Education (502.2- 502.4)
(7) Enrollment in Special Education (502.2- 502.4) at Chapter I schools
(8) Percentage of Minority Students at Chapter I Schools Enrolled in Special Education
(9) Enrollment in Special Education (502.2- 502.4) at Non Chapter I schools
(10) Percentage of Minority Students at Non Chapter I Schools Enrolled in Special Education
66.8
1,085
33.2
538
309
14.1
229
21.1
94.4
177
5.6
353
271
9.0
82
46.3
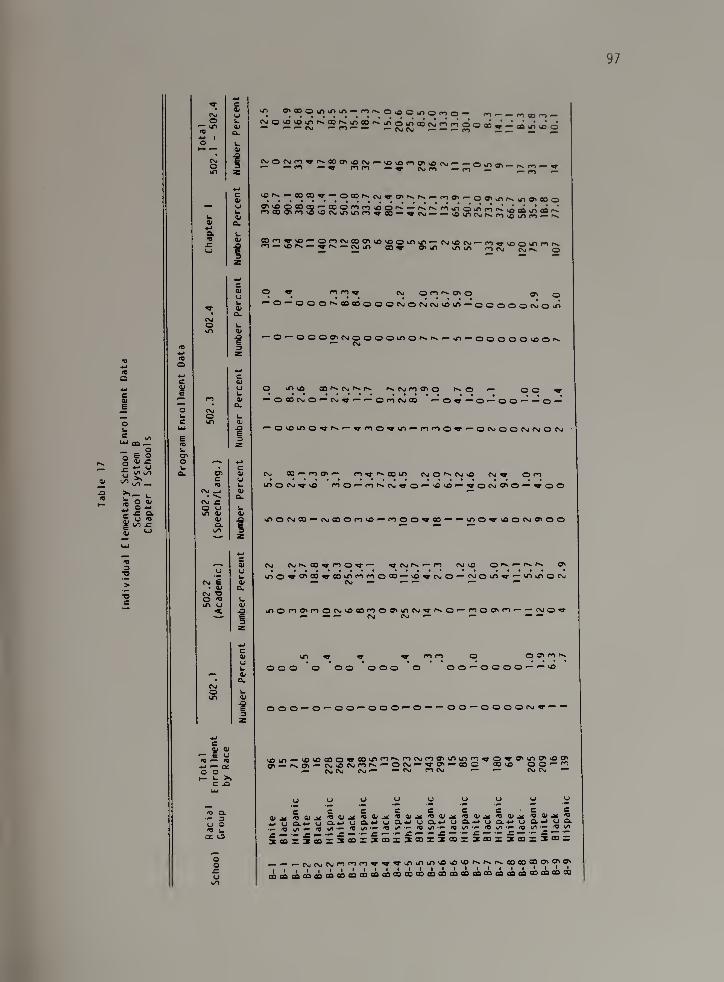
Ind
ivid
ual
Ele
menta
ry
Sch
oo
l E
nro
llm
en
t D
ata
S
cho
ol
Syst
em
B C
hap
ter
1 S
ch
oo
ls
97
4-» c
C\J QJ u (MOo^iT-nrso^O^ono- n--non-
O — u->
k. Qj
Cl •*-* i o k. h- — QJ
CM O tn Z
NO<vmviscoonocgi-\aano,aM-_0l. — — m nn tVin —
4-> c qj
k.
u k. Qj
2)£2£c2'TC0O<,,,)r)'fiOr>‘',“N',^,¥,>'C>o^nrv^m^(nfs! cieo5in3>eftj1n^nwco-vN--icS(\,Nn2Sn2J:
QJ Q- -*-» Ql i-
-C o
Qj
| n-iON -oo oun aim n ° !l. o
5 z
4-> c Qj on- nnw cm onisaio a> o
k. QJ '■‘O-oooNcocoooocMocMcvnoir^oooooc'joj!
a- CM o k. LO ai
' O'— OOO^CMOOOOu">Or^'-*''-“U"> — 00000<s00^ 3 z
'TJ o
c c QJ
u u
O vr>vO CO ^ cvj rs fN n (M n O' O r-v o — OO
m aj '“OCOCVjO'“CMV'“"OWC\jCO '"0v'“0'"00"'“0'“
o CM u o u c lO QJ
LU ■g -Ommo<rr'-»novm-nno»-OMOOcaMOM ■
E 3 Z
k. O' O 4J k. • c
CL CP QJ cm CO ^ n O' <- rn «r rs co cm O ^ cm ^ cm c o c U <T3 k. kDOCM^r-sO n O '— nN^jcO'-^^^^OCMQ'O1— tt O O
CM —I QJ CL
CM jC O U k. lO QJ QJ
QJ f
inocvjcO'-cMCOOniO-noocco'-'-^Ov voocmctnoo CL
LO 3 Z
4-4 c QJ cm CMNCO^nOv" rr cm cn cm O rs^ ^ p^. C'
u U uiovO'«vco^nno®-'flvcMO'-cMO^c^^^OCM k.
CM £ QJ • a; a-
CM ‘O o ^ u LO u QJ
uionoinotM'ficonoa'^CMVNO'-noo'n^-cNjOc < .O
§ Z
4-»
QJ lO *y c v co co O O ^ ^
k. ooo o oo ooo o oo — oooo — — co #— QJ
• a- CM o u U"> QJ
2 ooo — O — OO — OOO — O — — OO — OOOOfaff- 3 Z
4-» c * 1
•— E M ® *“ r>» Ci CM vfl CM (rlfN'”OC\J'“<70''“C0O COO OOr“r^1
o o <— CM CM CM »“ ^-CM CO CM »— CM CM »™
C X UJ
(JUU'J’J'-’UUO
c c c c c c c c _ C fl! w (O (11 V ID Hi w IT3 D ^ 'TS QJ -* D Ji ^ QJ 'TJ 01 JC /D5QJ^^
{ u n ^_» 11 fi . i i j *~j (_j o lj cl o c\ «-j <_j cl w lj *j lj cl i/i •*- rn (✓>•»- 'O i/l i/» ■»■* <TJ v/> •'" 'O </»•'“ ^ </* ’** ro t/^ •*“ ^ ^
f— __ ^ ,_ •*— ^ ^ l; ** ••“ lC t—'
o o ^-(-^PuAafMronncvci/)Ji^'fi'6^^rsr,,*coco®a'0'ff'
JC u
iiiiicicococofflcofflcoaafflflOcocomcoQOflOQOOfflcoa

98
in any special education programs. Chapter I services were used by
minority students at more than twice the rate as the White students.
Hispanic and Black students in School B-2 had an opposite enrollment
pattern in 502.2 when compared to the White rates; Hispanic students
were consistently under represented and Black students were over rep¬
resented. Both minority groups were under represented in 502.3 and
enrolled in Chapter I at almost twice the rate of White students. In
School B-3, the enrollment rates in special education fluctuated and
no racial group showed a consistent pattern of under or over represen¬
tation. Again, Chapter I appeared to be a minority majority program;
Black and Hispanic students were enrolled at almost twice the rate of
White students.
Although the number of Black students in School B-4 (N = 13)
made it hard to identify enrollment trends, the pattern showed simi¬
lar Chapter I enrollment rates between Black and White students and
an under representation of both Black and Hispanic students, when
contrasted with Whites, in total special education. Chapter I was
heavily utilized by Hispanic youngsters (80.4%).
In all special education programs in which Black students were
enrolled in School B-5, they were enrolled at a greater rate than both
other racial groups. Hispanic students were under represented in all
special education programs and were enrolled in Chapter I at about
two-thirds the rate of Black students. In School B-6, the minority
students were, with the exception of Black students in speech/lan¬
guage, under represented in the lower prototypes (502.1 and 502.2) and

99
generally over represented in the more restrictive prototypes (502.3
and 502.4). Hispanic students represented the majority of students
in Chapter I and were enrolled at a rate of 65.9 percent. Since only
one of the four Black students in School B-7 was enrolled in special
education, a trend of enrollment patterns cannot be determined for
Black students. However, there was considerable under representation
of Hispanic students in special education (8.3%) and over representa¬
tion in Chapter I (73.9%).
School B-8 had varying degrees of over and under representation
of minority students in remedial education. Both minority groups were
under represented in special education in 502.2 speech/language pro¬
grams and over represented in Chapter I. The pattern which emerged in
School B-9 was under representation of both minority groups in 502.2
special education programs. Chapter I enrollment rates showed an
under representation of Black students (18.8%) and an over represen¬
tation of Hispanic students (77.0%) as compared to White enrollment
rates (35.9%).
There were six elementary schools in School System C, of which
four had Chapter I programs. Table 18 shows program enrollment data
by race, by school, by program for all Chapter I schools. Table 19
shows the same data for the non Chapter I schools.
In School C-l, minority students were under represented only in
the 502.2 speech/language program. In Chapter I, Hispanic students
were represented at half the rate of the White students. In School
C-2, Hispanic students were under represented in 502.2 academic and

Tab
le
18
100
T3 O
o u. c
UJ
o o
-C u
wO
l/T UJ •—
o e o qj ^
•*-> u U> UO >»
UO ■— »* u 'TJ
4-> c
i
— u. O CL O ■*-* -C Q. u ^
U-) .C uj
•V 2 -o
T3 C
w C
CM <L oOtanosoiN vno U
O U CiOBOOvonifiorC jio *“ wo
<T3 Qj ^■V(\jCM^*CM'"ifi '“CM
a_ o 1 u
H— *— a>
CM 1 U">CMw0OCMCMPr>CMO4T'-“O
O' '—cm m o 5 WO z
c Qj
^oco vofM/>n mo
— u CT>ovvosf>vmo — uio CM “ O CM “ n — CM u
u a> a» a.
CL u OJ n-'-VOCMn-OCM-O
-C UJ
1 Z
CM WO CM CM CM
4-» c CL VJ
*t o> wo
OOOvOOCDOOO OO
Q. CM o k. lO a>
£ OOO^O^OOO'-OO
CM 2 Z
4-> c a> WO o ro WO O TT CM CM
'"O u O u WOO’STCMO^T — OOWOOO
m QJ CM *— •— CL.
CM £ O U e WO CL
— .O cn«— m*— CMCMCMOOCMOO
o 3 u Z c
UJ ._„ 4-» E • c
Or O) wO O' CN COO u B u a> u ^■OOCMOOCM^OCMwOO o CM _J 0/ vO CM u • Q.
Q. CM .C O u k. wO <L OJ
<D -c - O OnOO^CMO^-O CL E
<-o 2 Z
4-» C Qj O' O n - r^. o cm
u U k. aoo vcoo'flo'oo'ooo
CM E CL CM — • a> a.
CM "O o ^ u wO O CL
< — — mwOOcnwOOOCMOO
z
cm rn — —
w c QJ 4T CM — CJ k. © o o <— OO- OOCMOO
r— <L • a.
CM o u wO QJ
OOO^OcocmOO^tOO
Z
4-» C
2 R — £ u fO ^5 psir»“ vn _ — a m CM ^ cm ^ vO O'
o o K- W.
CM ^ *“ *“
c .o UJ
u u u u
^ Q. C C c c nj ro QJ ^ QJ ^ a; ^ <T3
vj O 4-> (J Q. *J WJ Q. 4-> u Q. •*-* WJ Q.
^ V/> ^ l/T «f— fO l/T ^ .c *- — ^ — — £ -- 3CD£3CDZ3COl3(Ol
— O o f-^—CMCMCMCOf^COV^^
.c (J
llllllllllll UUUUUUUUUUUU
lO

101
2 ” •S« § O £ u
o> §2^ ~ u £“ 4! ^ ^ U
!5 o a. J O
c ^ ^ « 5
CM o
— wf>
1
CM _1 • ^
cm .c O u u“> a; a»
Q. UO
CM S
- £ oj
(T3 <— *« •*-» — QC O O H— ^
c -a
•— 3 W O
o o o o o o
o o o o o o
O O O CM VO O
o o o a* ^ o
000—00
0 0 0^000
CO
000^00
O O O k-O o o CM
TT O CO
o o CO o o
vo — o ao o o
«— o o o o
o o ^ o o
^ cm. rn ^ vO —
<l) ^ w a •*- n -C — 3 CD
IQ OJ ^ o. w u a. c* — «/* — x — — X 3 03 X
a-> un u*> ^ vo vo • •••** o O <_J O C-J

102
502.2 speech/language. Black students were only enrolled in the 502.3
program. Chapter I enrollment rates of Black and Hispanic students
exceeded the enrollment rate of White students. All Black students
at C-2 were enrolled in the Chapter I program.
School C-3 had an under representation of Black students in
502.1, 502.2 academic, 502.3, and 502.4. There were no Hispanic stu¬
dents in this school. The Chapter I enrollment rate of Black students
was more than twice the rate of White students enrolled in the pro¬
gram. In School C-4, Black students were under represented in 502.1,
502.2 academic, 502.3, and 502.4, but over represented in Chapter I
programs. No Hispanic students were in special education or in Chap¬
ter I programs.
In Schools C-5 and C-6, without Chapter I services, there was an
under representation of Black students in 502.1, 502.2 speech/language
and 502.3. Hispanic students did not enter any programs in special
education at either school.
Analysis and Discussion
Table 4 showed that 21.9 percent of Black students entered Chap¬
ter I programs in School System A. When this enrollment percentage
of Chapter I participation is viewed in conjunction with the special
education enrollment of Black students in Chapter I schools (14.1%),
total participation of Black students in remedial programs was 36
percent. This can be contrasted with the enrollment rate of Black
students in special education at non Chapter I schools, 21.1 percent.

103
It must be noted that some Chapter I students may also be in special
education; however, this dual enrollment is reported by Chapter I
directors and administrators of special education to be minimal.
The seven percent decrease in special education enrollment of
Black students at Chapter I schools as contrasted with Black students
in special education at non Chapter I schools appears to be connected
to the 21.9 percent enrollment rate of Black students in Chapter I
programs. If the Chapter I programs were addressing their goal of
meeting academic needs of children educationally deprived due to low
socioeconomic status, poor prenatal care, or limited educational ex¬
posure, and schools were designated as Chapter I schools based upon a
greater educational need of their population, then it would be ex¬
pected that more students would receive remedial help at Chapter I
schools than non Chapter I schools. However, when the special educa¬
tion enrollment at non Chapter I schools is greater than that at Chap¬
ter I schools, this remedial program appears to be supplanting special
education. Equal educational opportunities appear to be denied to
Black youth in special education at Chapter I schools.
This systemwide analysis does not allow comparisons to be made
within the special education prototypes at Chapter I schools to cor¬
roborate the suggestion made in the analysis of data in Objective One
that Chapter I programs may substitute for necessary special education
services (502.2 academic) and create an unnecessary dependence on the
more comprehensive prototype placements (502.3 and 502.4). Individual
school data are necessary before this suggestion can be corroborated.

104
The enrollment of Hispanic students in special education at non
Chapter I schools was more than five times the enrollment rate at
Chapter I schools. Enrollment data from Table 4 showed 38.8 percent
of Hispanic students at Chapter I schools entered Chapter I programs.
When this enrollment percentage of Chapter I participation is viewed
in conjunction with the special education enrollment of Hispanic stu¬
dents at Chapter I schools (9.0%), total participation of Hispanic
students in remedial education at Chapter I schools was 47.8 percent.
This can be contrasted with the enrollment rate of Hispanic students
in special education at non Chapter I schools, 46.3 percent. These
similar total enrollment rates in remedial programs suggest that
Chapter I programs are either preventing some student placements in
special education or supplanting special education services.
Again, although there may be students in both remedial programs
included in the combined total, the reported 1.5 percent difference
in remedial program enrollment percentages between Chapter I and non
Chapter I schools could be attributed to a greater educational need
of Hispanic students at Chapter I schools, as previously discussed.
However, the concern that must be stated is. Why are so many Hispanic
students in Chapter I programs rather than special education? Is
Chapter I supplanting special education or preventing a need for it?
The enrollment percentages suggest Chapter I is supplanting some spe¬
cial educational placements. Therefore, it appears that educational
opportunities in special education were denied to some Hispanic
students.

105
Upon further inquiry into the design of Chapter I programs in
System A, a new concern was raised. Chapter I programs provided
instruction only in English, although 43 percent of the children
enrolled in the program were Hispanic. The exclusive use of English
as the language of instruction suggests that access to Chapter I
depended upon fluency in English. Therefore, if an Hispanic student
was not fluent in English, it appears that he/she either could not
enter Chapter I or participated with a disadvantage due to linguistic
differences. Both situations would constitute a denial of equal edu¬
cational opportunities in School System A's Chapter I programs and
raise more concern about the disparate special education enrollment
rates just discussed.
The sample size of Black students for System B was small (124).
In some Chapter I programs. Black students received more services
than White peers and in other programs less. Strong statements about
enrollment trends would be spurious. However, it did not appear that
the participation of Black students in Chapter I programs caused any
particular pattern to emerge in special education placement decisions.
Hispanic students were the majority group in Chapter I and were
enrolled at individual schools at a rate of one and one-half to over
three times the rate of their White counterparts. Chapter I with
some Spanish instruction was the foremost remedial service utilized
by Hispanic students. This utilization of Chapter I appears to be
responsible, in part, for the under enrollment of Hispanic students
in 502.2 (academics), which occurred at all schools excluding B-8.
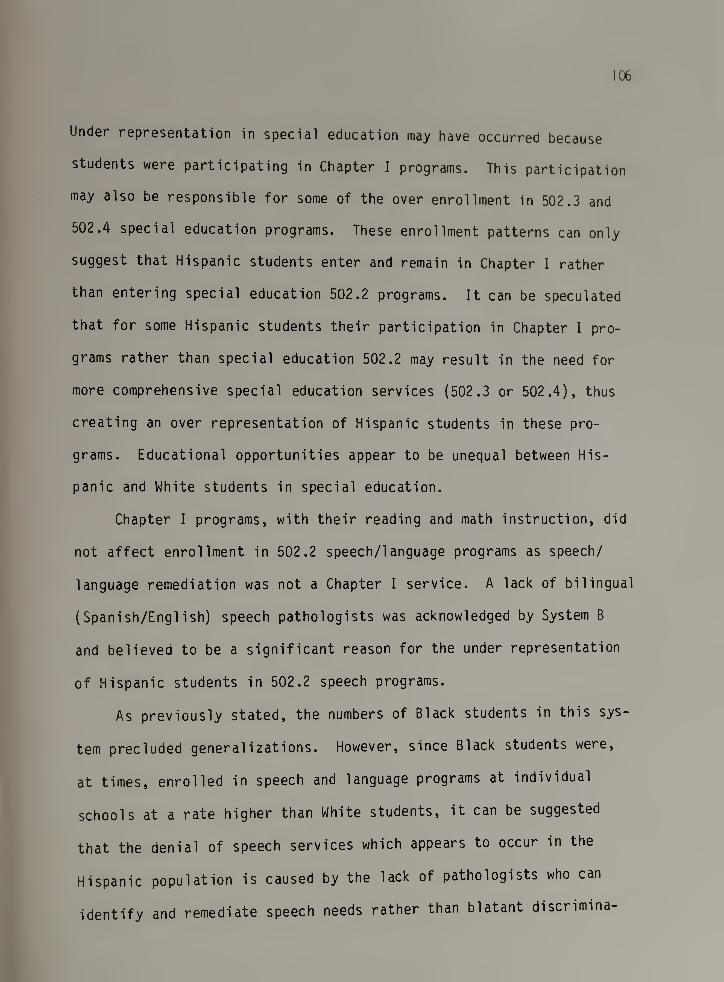
106
Under representation in special education may have occurred because
students were participating in Chapter I programs. This participation
may also be responsible for some of the over enrollment in 502.3 and
502.4 special education programs. These enrollment patterns can only
suggest that Hispanic students enter and remain in Chapter I rather
than entering special education 502.2 programs. It can be speculated
that for some Hispanic students their participation in Chapter I pro¬
grams rather than special education 502.2 may result in the need for
more comprehensive special education services (502.3 or 502.4), thus
creating an over representation of Hispanic students in these pro¬
grams. Educational opportunities appear to be unequal between His¬
panic and White students in special education.
Chapter I programs, with their reading and math instruction, did
not affect enrollment in 502.2 speech/language programs as speech/
language remediation was not a Chapter I service. A lack of bilingual
(Spanish/English) speech pathologists was acknowledged by System B
and believea to be a significant reason for the under representation
of Hispanic students in 502.2 speech programs.
As previously stated, the numbers of Black students in this sys¬
tem precluded generalizations. However, since Black students were,
at times, enrolled in speech and language programs at individual
schools at a rate higher than White students, it can be suggested
that the denial of speech services which appears to occur in the
Hispanic population is caused by the lack of pathologists who can
identify and remediate speech needs rather than blatant discrimina-

107
tion against minority students.
Due to the small sample size of minority children in the elemen¬
tary schools of School System C (Black = 40, Hispanic = 97), this
analysis of Chapter I was made cautiously and tried to locate trends
or patterns which were occurring in the system. Minority students
were, percentage-wise, always the majority of students in Chapter I.
Of the four Chapter I schools, three schools had both Hispanic and
Black students. In the one exception, C-2, all Black students were
enrolled in Chapter I programs. At all Chapter I schools, Hispanic
elementary students were enrolled in Chapter I at a lower rate than
Black students, but the combined enrollment of minority students in
Chapter I was always higher than that of White students. This greater
enrollment rate in Chapter I of minority students may have been re¬
sponsible for the lack of participation of minority students, particu¬
larly Hispanic, in some special education programs. To determine if
this were true. Schools C-l and C-2 with the largest minority enroll¬
ment of all schools, were analyzed further to see if any other enroll¬
ment pattern existed which showed any relationship between Chapter I
and special education enrollments for minority students. However, no
pattern emerged.
As in School System A, the language of instruction may have pre¬
sented a barrier to Hispanic students and prevented them from entering
Chapter I programs. Since the only remedial program which offered
remediation in Spanish was special education 502.4 programs at C-2,
and this program had an over representation of Hispanic students, it

108
appears that equal educational opportunities may have been denied in
Chapter I and provided through special education to some youth who
needed Spanish instruction.
In conclusion. Chapter I programs were not equally available to
Hispanic youth in Systems A and C as services were not provided in
Spanish. Equal educational opportunities were, therefore, not
provided.
It appears that Chapter I may be a substitute for some special
education services as well as supplanting others. Further investiga¬
tions into the services of Chapter I and special education programs
and the placement practices of administrators and teachers especially
in respect to race, may determine if the under representation of mi¬
nority students in some special education programs (502.1 or 502.2
academic) and over representation of minority students in 502.3 or
502.4 programs indicates a denial of equal educational opportunities.
The enrollment patterns suggest this to be true.
Objective Four
To determine if minority enrollment patterns in special education
programs were affected by minority student participation in transi¬
tional bilingual education in elementary schools.
The data which were collected for this objective included the
number of Hispanic surnamed students at each elementary school and
the number of Hispanic surnamed children who were in TBE at these
elementary schools. Enrollment figures were translated into percen-

109
tages to determine the percentage of Hispanic students who were en¬
rolled in TBE at the elementary level.
The enrollment data for transitional bilingual education was
kept by the thirty elementary schools in System A. Table 20 shows
the enrollment number and percentage enrollment rate of Hispanic
students in the fourteen schools with bilingual education programs.
Table 21 shows the number of Hispanic students in the sixteen schools
with no transitional bilingual education programs.
Transitional bilingual education was primarily offered at schools
with over 100 Hispanic students. There were three exceptions. Schools
A-l0, A-17, and A-30, with respective enrollments of 25, 50, and 88
students. The non transitional bilingual schools had Hispanic enroll¬
ments lower than 50, with the exception of A-l8 with 53 students.
As in Objective Three, the intent of this objective was to deter¬
mine if special education enrollment figures were affected by the par¬
ticipation of minority students in another remedial program, in this
case, transitional bilingual education. Since the elementary school
data for special education in this system were not complete, again, a
systemwide analysis was conducted. These data represent grades kin¬
dergarten through six and appear in Table 22.
Of the 3,183 Hispanic students in grades K-6, 2,812 were en¬
rolled at schools with transitional bilingual education and 371 were
at schools where transitional bilingual education was not available.
Hispanic students were enrolled in special education at transitional
bilingual education schools at a rate of 8.6 percent. When transi-

no
Table 20
Hispanic Elementary School Data School System A
Transitional Bilingual Education Schools
School Number of Hispanic Students
Number of Hispanic Students in TBE
Percent of Enrollment
A-l 153 68 44.4 A-4 129 36 27.9 A-5 328 78 23.8 A-6 177 55 31.1 A-8 145 84 57.9 A-10 25 9 36.0 A-l 2 183 80 43.7 A-l 6 226 121 53.5 A-l 7 50 17 34.0 A-20 490 142 29.0 A-23 477 65 13.6 A-24 239 59 24.7
A-26 102 30 29.4
A-30 88 24 27.3

Ill
Table 21
Hispanic Elementary School Data School System A
Non Transitional Bilingual Education Students
School Hispanic Students
A-2 A-3 A-7 A-9 A-ll A-13 A-14 A-15 A-18 A-19 A-21 A-22 A-25 A-27 A-28 A-21
14 12 10 36 28 33 10 35 53 46 10 12
8 10 23 31

112
Table 22
Transitional Bilingual Education and Special Education Program Relationships
School System A Elementary Transitional Bilingual Education Data
Hispanic Students
(1) Enrollment in Grades K-6 3,183
(2) Enrollment in TBE Schools 2,812
(3) Percentage of Hispanic Students in Schools with TBE
Enrolled 88.3
(4) Enrollment in Non TBE Schools 371
(5) Percentage of Hispanic Students in Schools without TBE
Enrolled 11.7
(6) Enrollment in Special Education (502.2-502.4) 353
(7) Enrollment in Special Education in TBE Schools
(502.2-502.4) 243
(8) Percentage of Minority Students Enrolled in Special Education
in TBE Schools 8.6
(9) Enrollment in Special Education Schools
at Non TBE 110
(10) Percentage of Minority Students at Non TBE Schools Enrolled in Special Education 29.6

113
tional bilingual programs were not available, Hispanic students en¬
tered special education programs at a percentage rate of 29.6 percent.
Six of the nine elementary schools in School System B had transi¬
tional bilingual education programs. Enrollment rates of Hispanic
students in these programs ranged from 33.0 to 75.1 percent (Table
23). Enrollment rates in 502.2 academic special education programs
at TBE schools were similar and averaged about four percent, while
the rates at the non TBE schools varied from 1.2 to 8.4 percent
(Table 24). The enrollment patterns in speech/language programs at
non TBE schools varied, but the average (2.2%) was higher than the
average enrollment at TBE schools (1.1%). Enrollment rates in 502.3
special education programs at TBE schools were about one percent.
The three schools without TBE had 502.3 program enrollment rates of
3.7 to 8.5 percent, noticeably higher than those at TBE schools. No
specific trends appeared in 502.4 programs. Enrollment rates varied
at all schools.
The six elementary schools in System C were separated into two
groups—those which had transitional bilingual education and those
which did not. Only one school had a transitional bilingual education
program. The enrollment pattern in special education at the school
with transitional bilingual education is shown in Table 25. Enroll¬
ment patterns at the non transitional bilingual schools are shown in
Table 26.
Three schools, C-l, C-2, and C-6, in this system had 20 or more
lied, yet only C-2 had transitional bilingual Hispanic students enro

Indiv
idual
Ele
men
tary
Sch
ool
Pro
gram
Enro
llm
ent
Dat
a S
choo
l S
yste
m
B T
ransi
tional
Bil
ing
ual
Ed
uca
tio
n
Sch
ools
114
+-> C QJ u
CU C'j O NT — vo
k. 0
0 9 0
0
6
0
0
3
0
0 4 0
0
5,
0
0
7.
&
QJ Q. ** v ^ u->
>— k. QJ
X) O O tO O O O O O co o O ^ O O o o q
s — — O 03 CO
Z
4-* c QJ U
no ro rr Ou O O ON o k. QJ
OOOiNCOCOMOM^ooOOO(\jOm
Q_ C\J o k. to QJ
OOOQifyjQLrQrs^nnnnnipnrv
§ CNJ
z
•u) C QJ U
no corspjrspjno>o '— OO NT
k. C\J O ‘— CNJ NT ■— CNjCO '— o*— 00'~'~0'—
Q.
\ ° CNJ o U to QJ
i c -§ O CHN (-v in •“ ro ■— OC\iOOC\ic\jOc\j
e Z
o k. 4-> c • c ^ O O' — ro to CNJ to CNJ ^ o o
i UJ O* QJ • ••• •• •• •• •• c U NT NO mO’— NTO-—NTOcjONO — NTOO
E T3 k. CNJ _J QJ
U • X Q. cn CNl «C o o u k. k. to QJ QJ
Q_ QJ •Q (D'-i'jcoonoo<ri/iO<f'fl ocnjonoo Q. E to D
' z
4-> c rNffl<rnO<ic\jrv-j) O''" — P^rs. on QJ
u U on co «• co in m '— * c m O in «r — m n o cnj k.
CNJ E QJ • QJ o.
CNJ TD O *3 u tO U QJ
<£ -O ONroOcNjcooOLn)c\jNTnoaNcvN'— — cnjOnt — 5 *— '— '— CNj^-»—
Z
4-J c QJ to ^ c m o o ci n n u k. O OO O <— OOOO — >— NO 4>
• a. CNJ o k.
O •— O O ■— — o — <— OOOOOjNT-
z
4-» C QJ QJ
tQtQCOOCCOOCMfOOCO^^tOO^^ 4-» •— oc on •— c\j o c\j no cnj <— <tO CO VO O O'- (o
o o CNJ CNJ CNlCNl CO '— *“ CNjCNi »—
►-!->> C J2
UJ
o O o u o u
c = = = = = •r- 3 <U QJ ^ ro QJj^ OJ ^ <U OI ^ ^ QJ-* ^
tij ij a. u q.4-1 u kJ ^
rD k. (t) »/)•»■ it! i/I U ^
r - r - r - - £ - ” r 5 ^ r 3cox3cox3cax3coi3CDX^cox
—
8 cMMOjcoeinininin'^rsrNcococoONONON -C u
fflfflauBcocococoaicococococoxcocDoo to

Table
24
115
'TS
Q
<T3 3
*o
T3 C
4-> c o o u ooooooooo ai
UJ a. GQ ►— u
0)
*1 ooooooooo
z
4-1 c a> o O ^ n rs ai u aj 1 O' O O O CM CO u~)
a. CM O L. un QJ
i — o — ooor^ — in 3 Z
U c a> O ir> i-m r-. o pm
•w rn
o u Qj — oca — oro-—o^r
<T3 a. o CM
O u 4-> un o c V ■§ 1— Ocoroo^rmov s 3
Z
o u —<* 4-> c
UJ a> c OJ cm oo <r is co o x cvj
6 c ro
o i^OMMrxivjiCiOf-
CM O o L. • '— a. o> CM .C o o o u U LD 0) QJ a. ai .Q tnocMeO1— m co <——
Q. ^2 </> 3 "— Z
4-» c CM CM •“ «T PO CM o
o o ‘OO'TnOOOMO — u CM 6 a>
• O Q. CM "3 O ^3 U lD O O)
< .Q LOOC’IP'IOO'f^O'- —" § CM
z
4-» c o ro o • u oooooo oo o
• a. CM O u <X> V
-Q 000000—00 S 3 Z
+-» c oj qj
— 60 ^ ^ — tncorsOM/) u“>
— QC O — — O^ — 00 O O — — CM
H- O >> C XI
UJ
o o o •r— •>“
-a a. see •»- 3 aj^'oai^'oai^q O O *•> U Q. *J CJ Q. 4-> O Q. ^ o •>— iO (/>•»“ H> «/>•*” <o 1/1
QC O £ — -C — •— £ — — 20)13101301
— O o r~ >— - V WOOlO
XI o
1 1 1 1 1 1 1 1 1 cacocococoaocacacs
oO

116
ur> cm
<D
v/»
o o -C u
do
4-» c CD
Cv
u O O vO
CD *r
& a_
h- L. <D
o O CM
Z
4-* c <D U
*T co
u CD
VO o 00* • a.
CM o L. vo CD
| TT CM
o 3 Z
<4-» C
I'D +■> <D Q
CO
CM
CD U u <D a.
2.5
o o 4
.4
O u CO CD
C <d CM CM 6 §
z o L. +-> C • c
UJ a> CD c O
E <D
<D CM _J
V. CD
CM o O U • M a. CD CM -C O O U u w CD <D <D a. CD
Q. co o o
DO
' ' Z
-*-> c CD r— Cs*
VJ U • u CO o VO
CM 6 CD • <d a.
CM T3 o u UO u CD
<£ CO o CO
Z
co
4-» c CD *T Ps* U • • u o vO CD
• Q- CM O U vO a;
■g cO o co
3 Z
•M C o uo cd a* CM
— E U T3 -— <T3 t-> *— cz O O - 1- »>
c -a UJ
u
T3 Q. c ■*- 3 <D -* CD
CD O u Q. ^ u •p— <D uo
QC. O -C •r— 2 CO X
_ o o CM CM CM
-C 1 1 1 u LJ C-J O
DO

117
vO C\i
rO
w C O) u L ooooooooooooooo <Xj
& CL
►— L.
*| ooooooooooooooo
z
•*-» c OJ un _ u • L. 0> OOOOOO OOOOO^OO
Q. eg O U u-> <D
*| oooooo — ooooocnoo
Z
•*-» c QJ U
Vf) O PO CM «r <T3
co u QJ vOO^OOOvOOOO©©^— OO
'O • CL Q eg
O L> w U“> QJ C
I §
co co Q O Q eu q q O O Q Q q
Z
o L. 4-» C • c vO iflo CO LU o> QJ * • • • • .
E c U
u ^too*—>ooejunoooou-)oo vo eg
eg ^ 1/ l. • \ a. O' eg ^ o O o L. &- lo <d QJ
Q. <D O 1— OO VC\jO^'— OOOOiOOO CL eg go
Z
+-» c C' o n o eg ^ © co 0)
u u COO^^OOvOOOvOOOQOOO •»■ L. eg <— un eg E QJ
• 0) O. eg "O O ^ u U"> U <1>
< .o — — eOiOOOegOOO'— OCOOO — eg *— »— co
z
4-» c OJ ej — — ^ u • • • • i- O O O *— O O eg o O — O O OO
r~ QJ • a.
eg O w vO QJ
*g OOOegOO^'OO'— OO^TOO
Z
•*-* c v o» E U
rsuip-iomov^e^c^n^r^o- •*-» *— oc co eg vO cr% co eg o o eg ^ h- t- »
c o UJ
u u u u u ^ ■»“ ■»*
<T3 Q. c C c c c •f 3 u o *j u q.*■> u a.-M u a. «-> u Q.-W u a. ^ L.
q£ O .e — •<- .c — .c — — -c — ■- -c — — xaoxacoxaaoxataoxxcox
O o £ u
iiiiiiiiiiiiiii uuuuuuuuuuuuuuu
gO

118
education. Almost half of the Hispanic students in C-2 were enrolled
in TBE. Schools C-3, C-4, C-5 and C-6 had no Hispanic students in
any special education program. School C-l, a non TBE school, had
28.6 percent of its students in special education and C-2, the TBE
school, had 26.6 percent.
Analysis and Discussion
It appeared that when TBE did not exist in System A, many His¬
panic students, perhaps due to a lack of program options, entered
special education. Since the percentage of Hispanic students in
special education at non TBE schools was more than three times that
of Hispanic students at TBE schools, TBE appeared to substitute for
special education. This could be viewed as a viable placement option
for Hispanic students if the services in TBE and special education
were similar. However, although TBE had some remedial and/or compen¬
satory services within its structure, it is unlikely that these com¬
pared with the remedial aid available in special education.
The acknowledged shortage of bilingual special education teachers
and speech pathologists in this city and the lack of Spanish Chapter
I programs may have resulted in students with limited English skills
remaining in TBE rather than moving into special education for reme¬
dial help. This inappropriate reliance on TBE might have lowered the
enrollment rates in special education at TBE schools. Therefore, it
can be suggested that the existence of transitional bilingual educa¬
tion programs decreased the enrollment rate in special education in

119
this system because of staffing rather than educational reasons.
Equal educational opportunities do not appear to have been provided.
In School System B enrollment suggested that TBE decreased the
need at some schools for educational services such as 502.2 academics
or, possibly, 502.2 speech/language programs by providing remedial
help within the TBE structure. If TBE provided this help, it would
then be expected that the enrollment rate of students in 502.2 pro¬
grams at non TBE schools would be greater than the enrollment in
502.2 programs at TBE schools. However, In System B, in only one of
the three non TBE schools (B-4) was the 502.2 academic enrollment
rate significantly higher (8.4%) than that at TBE schools. However,
it must be noted that at these non TBE schools, the enrollment rate
in 502.3 programs ranged from 3.7 to 8.5 percent, while at the TBE
schools these rates were about one percent. These findings suggest
that without transitional bilingual services, Hispanic students may
eventually be placed in a 502.3 program, one of the more comprehensive
special education placements. This may indicate a denial of 502.2
academic special education services or may indicate the result of non
participation in TBE. If TBE was truly unavailable to the students
and they entered special education 502.3 programs due to language bar¬
riers or lack of previous special education interventions, then equal
educational opportunities appear to have been denied in special educa¬
tion and in TBE.
In the 502.2 speech/language program, Hispanic enrollment rates
, at non TBE schools were higher (2.8%, 2.8%, 1.2%), on the average
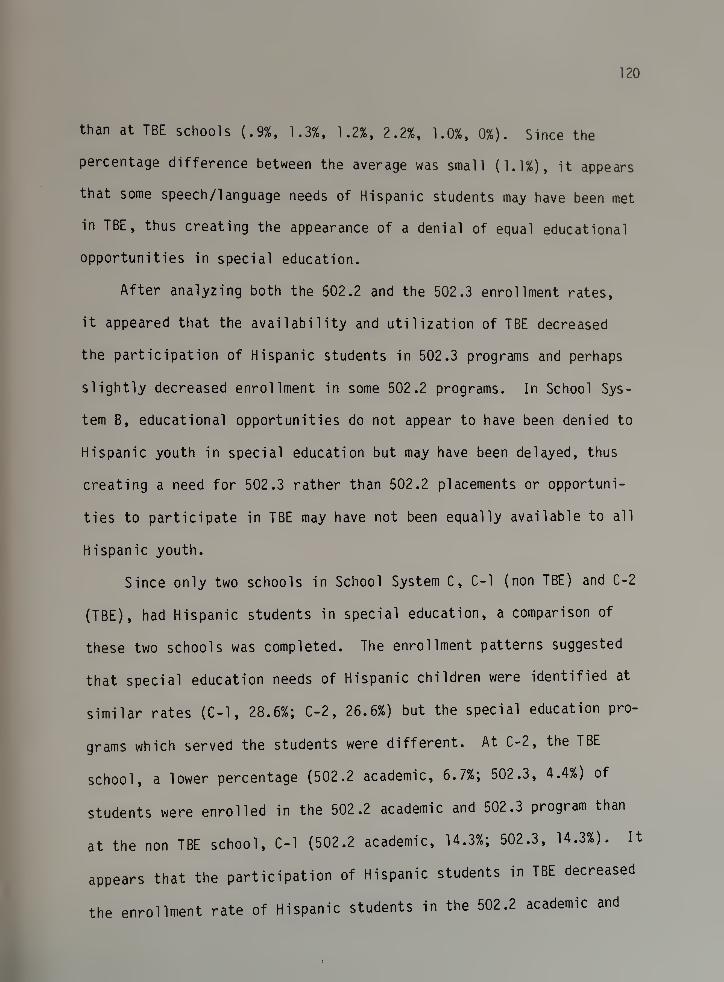
120
than at TBE schools (.9%, 1.3%, 1.2%, 2.2%, 1.0%, 0%). Since the
percentage difference between the average was small (1.1%), it appears
that some speech/language needs of Hispanic students may have been met
in TBE, thus creating the appearance of a denial of equal educational
opportunities in special education.
After analyzing both the 502.2 and the 502.3 enrollment rates,
it appeared that the availability and utilization of TBE decreased
the participation of Hispanic students in 502.3 programs and perhaps
slightly decreased enrollment in some 502.2 programs. In School Sys¬
tem B, educational opportunities do not appear to have been denied to
Hispanic youth in special education but may have been delayed, thus
creating a need for 502.3 rather than 502.2 placements or opportuni¬
ties to participate in TBE may have not been equally available to all
Hispanic youth.
Since only two schools in School System C, C-l (non TBE) and C-2
(TBE), had Hispanic students in special education, a comparison of
these two schools was completed. The enrollment patterns suggested
that special education needs of Hispanic children were identified at
similar rates (C-l, 28.6%; C-2, 26.6%) but the special education pro¬
grams which served the students were different. At C-2, the TBE
school, a lower percentage (502.2 academic, 6.7%; 502.3, 4.4%) of
students were enrolled in the 502.2 academic and 502.3 program than
at the non TBE school, C-l (502.2 academic, 14.3%; 502.3, 14.3%). It
appears that the participation of Hispanic students in TBE decreased
the enrollment rate of Hispanic students in the 502.2 academic and

121
502.3 special education program, thus creating an appearance of a
denial of equal educational opportunities. Again, as in the other
systems, there may be a denial of equal educational opportunities
occurring in TBE and creating disproportionate placement in special
education. Since no Hispanic students entered the special education
speech/language program at any school in System C, it appears that
equal educational opportunities were not available to this population.
In all three school systems, special education enrollment in
some programs decreased by the participation of Hispanic students in
TBE. The 502.2 academic and 502.3 programs both appeared to have
decreased Hispanic enrollment when TBE was available, but this trend
varied among individual schools. Enrollment patterns suggested that
if TBE did not provide educational services, special education en¬
rollment increased. It appears that a lack of TBE services may create
disproportionate placement patterns in special education and be a
denial of equal educational opportunities.
Objective Five
To determine if differences in enrollment patterns in remedial
programs indicated that minority students were denied participation
in programs designed to provide equal educational opportunities.
All of the data which were collected for the previous four objec¬
tives were used in this summative objective. The data are again pre¬
sented to provide a more comprehensive view of enrollment patterns in
remedial education.

122
The major intention of Objective Five was to look at enrollment
rates from special education, transitional bilingual education, and
Chapter I programs as remedial educational opportunities which were
available to all students who needed them. It was considered that
these various remedial programs may have provided educational oppor¬
tunities similar to one another, or that one program may have served
as a substitute for remedial services provided in another program.
The individual analyses which have been conducted in Objectives One,
Two, Three, and Four emphasized the importance of not relying on en¬
rollment numbers in any one program as an indication that equal educa¬
tional opportunities were being provided or denied to any student
group.
These data showed how enrollment patterns when studied in isola¬
tion could be deceptive and cause erroneous decisions to be made about
the provision of equal educational opportunities to minority youth.
Specific examples of this follow.
In School System A, 11.3 percent of Black, 9 percent of Hispanic,
and 9.2 percent of White students entered special education. However,
when compared with White student enrollment percentages in 502.2 pro¬
grams, (speech/language, 2.2%; 502.2, 1.3%), Black students were under
represented in the speech/language program (1.3%) and Hispanic stu¬
dents were under represented in both speech/language (.9%) and aca¬
demics (.6%). Over twenty percent (20.7%) of Hispanic students en¬
tered TBE and minority students entered the Chapter I program (Black
21.9%; Hispanic, 38.8%) at almost two to three times the rate of White

123
students (13.1%). Table 27 shows a comparison of all racial groups
in remedial education.
In School System B, 16.8 percent of Black, 10.4 percent of His¬
panic and 11.4 percent of White students entered special education.
However, when compared with White student enrollment percentages in
502.2 programs (speech/language, 2.2%; academics, 5.4%), Black stu¬
dents were under represented in speech/language (1.1%) and Hispanic
students were under represented in speech/language (.8%) and academics
(4.0%). Over twenty-nine percent (29.2%) of Hispanic students entered
TBE and minority students entered the Chapter I program (Black, 21.5%;
Hispanic, 37.4%) at almost two to three times the rate of White stu¬
dents (12.4%). Table 28 shows a comparison of all racial groups in
remedial education.
In School System C, 21.9 percent of Black students, 23.5 percent
of Hispanic, and 13.2 percent of White students entered special edu¬
cation. However, when compared with the White student enrollment per¬
centage in the 502.2 speech/language special education program (1.9%),
Black students were under represented (1.4%). No Hispanic students
were enrolled in the speech/language program. Over thirty percent
(31.6%) of Hispanic students entered TBE and minority students (Black,
31.5%; Hispanic, 9.6%) entered the Chapter I program at a higher per¬
centage rate than White peers (8.1%). Table 29 shows a comparison of
all racial groups in remedial education.

124
Table 27
Comparison of Remedial Education Programs School System A
Program
Special Education
TBE
Chapter I
502 .2 academic
502.2 speech/language
502.2 academic and Chapter I
502.2 academic. Chapter I and TBE
Enrollment Percentage
White Black Hispanic
9.2 11.3 9.0
0 0 20.7
13.1 21.9 38.8
1.3 1.4 .6
2.2 1.3 .9
14.4 23.3 39.4
14.4 23.3 60.1

125
Table 28
Comparison of Remedial Education Programs School System B
Program Enrollment Percentage
White Black Hispanic
Special Education 11.4 16.8 10.4
TBE 0 0 29.2
Chapter I 12.4 21.5 37.4
502.2 academic 5.4 9.5 4.0
502.2 speech/language 2.2 1.1 .8
502.2 academic and Chapter I 17.8 31.0 41.4
502.2 academic. Chapter I and TBE 17.8 31.0 70.6

126
Table 29
Comparison of Remedial Education Programs School System C
Program Enrollment Percentage
White Black Hispanic
Special Education 13.2 21.9 23.5
TBE 0 0 31.6
Chapter I 8.1 31.5 9.6
502 .2 academic 6.8 9.6 7.4
502.2 speech/language 1.9 1.4 0
502.2 academic and Chapter I 14.9 41.1 17.0
502.2 academic. Chapter I and TBE 14.9 41.1 48.6

127
Analysis and Discussion
In School System A, the enrollment rate of minority students in
remedial education was similar to or greater than that of White stu¬
dents when all enrollment was examined. However, when programs within
a remedial program were analyzed, specifically the 502.2 special edu¬
cation programs, different enrollment patterns emerged. The under
representation of Black students in speech/language and Hispanic stu¬
dents in 502.2 speech/language and academic programs appeared to be a
denial of equal educational opportunities to some minority youth. It
can be suggested that the participation of Black students in Chapter
I programs and Hispanic students in transitional bilingual education
and Chapter I programs, contributed to this under representation of
minority students in special education. Chapter I and TBE may have
substituted for or prevented the remedial services of special educa¬
tion 502.2 programs; if this were true, equal educational opportuni¬
ties were not denied.
However, since Chapter I programs were taught only in English,
equal educational opportunities were provided only to those Hispanic
students who were proficient in English. Hispanic students with
limited English proficiency, it appears, were either excluded from
Chapter I programs or entered inappropriately. Therefore, the lack
of Spanish instruction in Chapter I programs appears to be a denial
of equal educational opportunities to some Hispanic youth and may
result in questionable placements in special education.
Participation of Hispanic students in transitional bilingual

128
education may explain, in part, the under representation of Hispanic
students in 502.2 academic special education programs. It has also
been suggested that when TBE is unavailable, special education enroll¬
ment is increased. Therefore, a denial of equal educational opportun¬
ities may occur when TBE is not available, thus creating an over reli¬
ance and representation of students in special education 502.3 and
502.4 programs. The combination of Chapter I instruction solely in
English, a shortage of bilingual teachers and speech pathologists in
special education as stated in Objective Four, and an over represen¬
tation of Hispanic students in special education when TBE does not
exist, suggests that although Hispanic students receive a high per¬
centage of remedial services, these services may not be meeting the
real needs of the students. Equal educational opportunities do not
appear to be provided.
Both minority groups were under represented in the speech/
language programs in special education. As previously stated, TBE
may have provided some speech/language remediation to Hispanic stu¬
dents, thus slightly decreasing their enrollment in 502.2 speech/
language programs. Since Chapter I programs neither provided speech/
language services nor were offered in Spanish, the participation of
Black and Hispanic youth in Chapter I would not legitimately decrease
enrollment in speech/language special education programs. It appears
that equal educational opportunities in the area of speech/language
remediation were not available to minority students.
The enrollment rate of minority students in remedial education

129
in School System B was similar to or greater than that of White stu¬
dents when the total percentage of enrollment was examined. However,
when programs within a remedial program were analyzed, specifically
502.2 special education programs, different enrollment patterns
emerged. The systemwide under representation of Black and Hispanic
students in speech/language, Hispanic students in 502.2 academic pro¬
grams and Black students in 502.2 academic programs at some schools,
at first, appeared to be a denial of equal educational opportunities
to minority youth.
Upon further investigation at individual schools, it can be sug¬
gested that Black and Hispanic student participation in Chapter I
programs contributed to the under representation of minority students
in some special education programs. Chapter I, with its Spanish and
English instruction, may have been a substitute, at times, for special
education. In this situation, it appears that equal educational op¬
portunities in special education may not have been denied to minority
students but provided in another remedial program. Chapter I.
However, if Chapter I programs delayed appropriate services pro¬
vided in special education, educational opportunities may have been
denied and resulted in a greater need for minority placement in 502.3
and 502.4 programs. As discussed in the analysis of Objective Four,
enrollment of Hispanic students in 502.2 academic programs did not
appear to be decreased by TBE. However, although the systemwide
analysis (Objective One) showed an over representation of Hispanic
students in 502.3 programs, the individual school analysis (Objective

130
Four) of TBE and its relationship to special education suggested that
TBE may have decreased Hispanic student participation in 502.3 special
education programs. The combined participation of Hispanic students
in 502.2 academic and 502.3 special education, in TBE, and in Spanish
instructed Chapter I programs appeared to provide them with equal
educational opportunities in academic areas. However, when TBE was
not available, special education enrollment appeared to increase in
some areas. This situation suggests that a denial of equal educa¬
tional opportunities may occur in TBE rather than special education.
Both minority groups were under represented in the 502.2 speech/
language program. Chapter I programs were not designed to provide
speech/language remediation, therefore the participation of minority
students in Chapter I programs did not appear responsible for under
representation of minority students in 502.2 speech/language.. There
is a possibility that some Hispanic students received speech/language
aid in transitional bilingual education, thus contributing to the dis¬
criminatory appearance of their under representation in speech. How¬
ever, it is also possible, due to a lack of bilingual speech patholo¬
gists, that if TBE was used for speech/language remediation it was so
used due to a lack of other remedial options. Therefore, it appears
that equal educational opportunities in the area of speech/language
remediation were not provided to Black or Hispanic students in System
B and it is inconclusive as to whether Hispanic students received
equal educational opportunities in the language area.
In School System C, the enrollment rate of minority students in

131
special education was similar to or greater than that of White stu¬
dents when the total percentage of enrollment was examined. However,
when individual programs within special education were analyzed,
specifically 502.2 special education programs, different enrollment
patterns emerged.
The examination of actual enrollment rates in special education
and enrollment percentages of each racial group within each program
(Table 13) showed an under representation of Black and Hispanic stu¬
dents in 502.2 academic programs in addition to the under representa¬
tion which had been seen in 502.2 speech/language programs (Table 2).
These patterns gave the appearance that equal educational opportuni¬
ties were denied to some minority youth.
Upon further investigation, it was suggested that Black student
participation in Chapter I, as seen in the individual school analysis
(Objective Three) did not appear to affect enrollment in special edu¬
cation 502.2 academic programs in any consistent way. Equal educa¬
tional opportunities in academic areas do not appear to have been
denied.
The participation of Hispanic students in Chapter I programs and
TBE at individual schools did not explain the under representation
which was found in the 502.2 academic program analysis in Objective
Two and suggests a denial of equal educational opportunities.
Furthermore, since Chapter I programs were provided only with English
instruction, students whose dominant language was Spanish were denied
educational opportunities provided by Chapter I.

132
Black students were under represented and Hispanic students had
no representation in the 502.2 speech/language program (Table 8).
Since Chapter I did not provide speech instruction, the participation
of minority students in this program would not be expected to decrease
enrollment in the 502.2 speech/language program. Therefore, it ap¬
pears that Black and Hispanic students in System C were denied equal
educational opportunities in the area of speech/language. This state¬
ment is made cautiously since the small number of Black students may
provide misleading information. The needs of this particular sample
may not be representative of the Black population.
It appeared that Black students in this community received a
relatively high percentage of remedial services. However, the small
sample size of Black students makes it difficult to state that equal
educational opportunities were available to Black students or that
discrimination, as suggested in some enrollment patterns, existed.
Hispanic students accessed TBE, Chapter I programs, and special edu¬
cation, but not always at the rate which would have been expected
when compared to other racial groups.
In all three systems, minority students received more remedial
services than their White counterparts. However, the language in
which programs were offered appeared to have a significant effect on
the placement decisions which were made and may have contributed to a
denial of equal educational opportunities, not only in special educa¬
tion but in the remedial programs of Chapter I and TBE.

133
Additional Findings
While collecting the information that was needed to answer the
research objectives, the following additional data were gathered.
Although they did not directly address any of the research objectives
which were posed, they had a correlation with the main concern of
this dissertation.
The present study was concerned with the access of racial minor¬
ity students, specifically Black and Hispanic students, to remedial
education. Another student group that is often treated as a minority
and discriminated against is females. Therefore, data about access
for females in remedial programs were analyzed to see if there were
any trends which suggested unequal educational opportunities for
females in special education.
Tables 30, 31, and 32 show the pattern of male and female enroll¬
ments in four special education programs: the 502.1, 502.2 total,
502.3 and 502.4 programs. Gender information had been collected by
age for the elementary school population in School System A, and by
the elementary and secondary school populations in School Systems B
and C. The results are very similar in all three systems. Although
there are a few exceptions, females were outnumbered in the individual
programs by their male counterparts. When the total number of girls
and boys in each prototype was analyzed, there was a consistent boy:
girl ratio of 2:1 and at times 3:1. With the exception of the 502.1
program in School System B, the 3:1 ratios were found in the more

134
Table 30
Systemwide Special Education Data Gender and Age School System A
Age
Program Enrollment Data
502 .1 502 .2 502.3 502.4
Male Female Male Female Male Female Male Female
5 1 0 26 9 1 0 30 9 6 2 0 50 18 2 4 33 15 7 1 0 48 18 26 9 42 18 8 1 0 64 38 41 15 53 14 9 0 3 45 39 54 28 53 21
10 0 1 50 22 57 36 54 15 11 3 2 27 15 51 38 61 21 12 1 0 28 16 77 37 61 16 13 5 1 25 4 58 33 24 19 14 3 1 10 8 61 37 25 7
Subtotal 17 8 373 187 428 239 436 155
Total 25 560 665 591
Percentage 68.0 32.0 66.7 33.3 64.4 35.6 73.8 26.2

135
Table 31
Systemwide Special Education Data Gender and Age School System B
Age
Program Enrollment Data
502 .1 502 .2 502 .3 502.4
Male Female Male Female Male F ema1e Male Female
5 0 0 16 6 0 0 6 3 6 0 1 25 20 0 3 15 1 7 7 1 41 14 11 4 4 4 8 0 1 31 29 14 4 6 1 9 2 3 31 26 18 4 3 1
10 1 0 32 14 6 2 7 3 11 3 0 23 8 6 5 4 1 12 3 1 24 6 6 2 5 3 13 2 0 6 4 6 3 8 1 14 2 0 12 5 2 1 4 4 15 2 0 20 10 10 6 7 3 16 3 1 16 3 9 4 10 7 17 1 0 10 5 5 2 5 1 18 1 0 3 1 1 1 2' 0 19 0 0 1 0 0 0 1 2 20 0 0 1 0 0 0 1 0 21 0 0 1 0 0 0 2 2
Subtotal 27 8 294 151 94 41 90 37
Total 35 445 . 135 127
Percentage 77.1 22.9 66.1 34.0 70.0 30.0 70.1 29.1

136
Table 32
Systemwide Special Education Data Gender and Age School System C
Age
Program Enrollment Data
502. ,1 502.2 502. 3 502.4
Male Female Male Female Male Female Male Female
5 0 1 2 2 3 0 3 2 6 1 0 11 11 2 0 2 2 7 3 1 26 23 4 1 6 4
8 1 2 20 6 6 0 5 1
9 2 0 22 9 6 4 5 0
10 1 0 25 10 8 2 2 0
11 3 1 22 11 10 6 3 3
12 4 4 21 10 5 1 4 1
13 2 0 14 9 2 3 3 2
14 1 0 14 6 2 1 2 5
15 1 1 8 1 3 0 2 1
16 0 0 4 2 2 0 4 0
17 1 0 1 4 3 2 1 1
18 0 0 2 1 0 0 1 1
19 0 0 1 2 0 0 2 2
20 0 0 0 0 0 0 3 0
21 0 0 0 0 0 0 1 1
Subtotal 20 10 193 96 56 20 49 26
Total 30 289 76 75
Percentage 66.7 33.3 66.7 33.2 73.7 26.3 65.3 34.7

137
restrictive, 502.3 and 502.4 programs.
Educational research is replete with statistics on the prevalence
of handicapping conditions among school aged children. According to
Federal statistics, about 12 percent of the school-aged population is
handicapped. However, these prevalence rates are most often reported
in a categorical format according to handicapping condition.^
Prevalence rates stated in respect to gender differences are now being
reported more often and need to be further researched. Lerner, for
example, believes that boys are four to six times more likely to be
42 diagnosed as learning disabled than girls and the National Infor¬
mation Center for Handicapped Children and Youth reports that males
43 are four times more likely to have autism than females. Higher
ratios of boys to girls in special education, then, appear likely and
appropriate.
Consistently, throughout the three school systems which were in¬
cluded in this study, males outnumbered females in special education.
The smallest percentage difference was in School System C, program
502.4, where boys exceeded girls by almost a 2:1 ratio. All other
percentage ratios exceeded this finding. The highest ratio difference
occurred in School System B, prototype 502.1, where males exceeded
females by a ratio of 3.4:1.
It is not clear if the higher ratio of males to females was due
to a higher prevalence rate of handicapping conditions which necessi¬
tated remedial education or if placement decisions were gender re¬
lated. Further research needs to be conducted about the relation-

138
ships between gender and placement to determine if remedial programs
are equally available to female and male students. This will be
further discussed in the following chapter.
In summary, this chapter discussed each school system individu¬
ally for each of the five research objectives. The three urban school
districts which were included in this study were of three different
sizes and had different proportionate enrollment rates of Black, His¬
panic and White students. School System A, which was the largest
district, was a minority-majority system with over 52 percent of the
students being of racial minority status.
School System B was the second largest district and had a major¬
ity of White students--56 percent. The second largest group was His¬
panic students with 36 percent. School System C was the smallest
community included in this study and had a very small percentage of
Black and Hispanic students. This small percentage has been thought
to be one of the reasons this district continues to be cited for prima
facie denial of equal educational opportunities. The population may
be a non representative sample of minority students.
There were three recurrent themes which were discovered through¬
out this study of equal educational opportunities for minority youth.
First, the participation of minority students in transitional bilin¬
gual education or Chapter I programs appeared to decrease their en¬
rollment in some special education programs. Second, if the language
of instruction in which a remedial program was offered was not the
student's dominant language, equal educational opportunities were not

139
available. Third, it appeared that both Black and Hispanic students
were denied equal educational opportunities in the area of speech/
language remediation. Chapter V, the concluding chapter, will sum¬
marize the findings of the study, state conclusions, and make recom¬
mendations for further research and educational reform.

CHAPTER V
SUMMARY, CONCLUSIONS AND RECOMMENDATIONS
This chapter summarizes the findings of the present study, draws
conclusions related to these findings, and suggests recommendations
for further research and educational reform.
Summary
The central purpose of this study was to determine if minority
students were again, as in the past, being denied access to educa¬
tional opportunities. More specifically, this study focused on the
enrollment patterns of White, Black and Hispanic youth in remedial
education programs to determine if under enrollment of minority stu¬
dents in special education was indicative of a denial of equal educa¬
tional opportunities or if their participation in other remedial pro¬
grams such as transitional bilingual education or Chapter I createa
the appearance of a denial of educational options. In essence, did
the participation of minority students in one remedial program affect
their participation in another remedial program?
In Massachusetts, the finding of under representation of minority
youth in special education programs has been a statewide concern since
1978. As under representation appears most frequently in urban school
districts, three varied systems in western Massachusetts were selected
for this study. There were forty-six elementary schools and eighteen
140

141
secondary schools included in these systems representing over 32,000
students.
These districts were selected for their similarities as well as
their differences. Each system included students who represented the
racial categories included in this study--Black, White, and Hispanic.
Also, each system offered special education, transitional bilingual
education, and Chapter I programs to its youth. Perhaps most impor¬
tant, each district had been cited for three consecutive years by the
Massachusetts Department of Education for prima facie denial of equal
educational opportunities to minority youth.
The systems differed in respect to size, racial balance, and
socioeconomic status. School System A, with over 23,000 students,
was the largest system and had a minority population of 53 percent.
It is both a working class and professional city. School System B,
with over 6,800 students, was primarily comprised of White students
but about 40 percent of the population was Hispanic. It is a working
class community. School System C was the smallest community, with
approximately 3,600 students, of whom less than 6 percent were minor¬
ity students. It is a small professional city.
Although the Massachusetts Department of Education had monitored
the prima facie denial of equal educational opportunity to minority
youth in special education in each of these systems for three years
and had each system develop a plan of corrective action to eliminate
its discrepancies in special education enrollment, discrepancies con¬
sistently appeared in all three systems during 1980-1983. Therefore,

142
the following five research objectives were developed to broaden the
base of inquiry into under enrollment of minority youth in renedial
education. These objectives analyzed the enrollment patterns of
minority youth in three separate areas of remedial education rather
than studying special education in isolation to determine if under
representation, when it occurred, constituted a denial of equal
educational opportunities to Black or Hispanic students.
Objective One
To determine the enrollment pattern of Black, Hispanic, and White
students in special education, transitional bilingual education, and
Chapter I programs in selected school systems.
Objective Two
To determine if enrollment patterns in special education in
selected school systems had a statistically significant under repre¬
sentation of minority students.
Objective Three
To determine if minority enrollment patterns in special education
were affected by minority student participation in Chapter I programs
in elementary schools.
Objective Four
To determine if minority enrollment patterns in special education

143
were affected by minority student participation in transitional bi¬
lingual education in elementary schools.
Objective Five
To determine if differences in enrollment patterns in remedial
education indicated that minority students were denied participation
in programs designed to provide equal educational opportunities.
The first research objective determined the patterns of enroll¬
ment of minority students in special education, transitional bilingual
education, and Chapter I programs. Three patterns consistently emerged
in all three school districts. First, speech and language services in
special education were not equally provided to minority students but
rather were provided in a descending order to White, Black, and then
Hispanic youth. Second, Chapter I programs were primarily utilized
by minority students whether the language of instruction was English
or Spanish. Third, the special education enrollment in the 502.2
academic programs was predominantly composed of White students, while
the more comprehensive special education programs, 502.3 and 502.4,
were predominantly composed of Black and Hispanic students.
Objective Two centered on special education enrollment rates in
isolation from other remedial programs, as currently analyzed by the
Massachusetts Department of Education, to determine if current racial
enrollment within special education showed a pattern of under repre¬
sentation; thus providing prima facie evidence that a denial of equal

144
educational opportunities was occurring. Based upon actual enrollment
in special education, under representation of minority students in
speech and language programs and 502.2 academic programs was found to
be significant in School Systems A and B (p < .05). Under repre¬
sentation was also found in these programs in School System C, but
was not significant (p > .05).
This analysis supported the findings of the systemwide anaysis
by again showing the under representation of minority students in
specific special education programs. It also added 502.2 academics
for Black students at School System A, 502.1 programs for Black stu¬
dents at School System B, and 502.2 academics for Black and Hispanic
students at School System C as new areas for the investigation of
under representation.
Objective Three, which analyzed minority student participation
in Chapter I programs to determine if there was a relationship between
participation in Chapter I programs and enrollment in special educa¬
tion, determined that Chapter I programs appeared to have a direct
impact upon enrollment rates of Black and Hispanic students in some
special education programs. More specifically. Chapter I programs
when offered in a student's dominant language appeared to substitute
for or prevent some 502.1 and 502.2 special education placements and
served as an appropriate remedial option. Chapter I programs when
not provided in the student's dominant language appeared to be an
inappropriate placement for some Hispanic students and seemed to be
responsible for the over enrollment of Hispanic students in the more

145
comprehensive special education programs (502.3 and 502.4).
Chapter I programs did not offer speech/language remediation as
part of their curriculum. Therefore, the under enrollment of mi¬
nority students in speech/language special education programs was
not due to participation in Chapter I programs. Speech and language
opportunities appeared to have been denied to many minority youths.
Objective Four determined if minority enrollment patterns in
special education programs were affected by minority student par¬
ticipation in transitional bilingual education in elementary
schools. It was determined that transitional bilingual education
appeared to decrease the enrollment rate of Hispanic students in
special education 502.2 academic or 502.3 programs. It appeared that
when TBl was available, students remained in TB l rather than entering
special education but when TB £ was unavailable special education
enrollment rates were inflated. These situations appeared to be due
to staffing reasons rather than educational concerns.
When Hispanic students had the option of TB l or Chapter I
services prior to entering special education, the under repre¬
sentation of Hispanic students in 502.2 special education pro¬
grams appeared to be caused, in part, by their participation in
other appropriate remedial programs. However, when Chapter I
remediation was not available in Spanish as in School Systems
A and C, Hispanic students had only two choices for remedial
help outside of the regular curriculum--TB£ and special educa¬
tion. This lack of remedial Spanish instruction in Chapter I

146
programs appeared to have encouraged the utilization of TBE and may
have delayed students from entering special education 502.2 programs.
Equal educational opportunities were not truly available to Hispanic
students due to a lack of program alternatives for students whose
dominant language was not English.
Objective Five determined if differences in enrollment patterns
in remedial programs suggested that equal educational opportunities
were not being provided to minority students. This summative objec¬
tive draws on data from the previous objectives and provides the
conclusions for this study.
Conclusions
The most consistent determination was that speech and language
remediation through special education was not available to minority
students on an equal basis. In all three school districts included
in this study, Black and Hispanic students received less service in
these programs than their White counterparts. No other remedial pro¬
grams provided speech remediation; alternative options were not util¬
ized as they were unavailable.
It was suggested that some language remediation for Hispanic
students may have taken place in the transitional bilingual education
programs, thus substituting for a need for language remediation in
special education. However, based upon the design of TBE and the
knowledge that there were not enough bilingual educators to meet the

147
needs of Hispanic youth in other remedial programs, TBE appears to
have been a substitute for the language remediation of special educa¬
tion and used by necessity rather than by choice or design. Minority
students appear to have been denied equal educational opportunities
in all systems included in this study.
Participation of minority students in Chapter I programs appeared
to decrease the enrollment of minority students in the 502.1 and 502.2
academic special education programs. This occurred more often with
the Hispanic population. When Chapter I programs were available in
English and Spanish, this correlation might be appropriate and not
suggest a denial of equal educational opportunities in special educa¬
tion. However, when, as in all three systems, a pattern appears which
shows over representation in Chapter I and the comprehensive (502.3
and 502.4) programs and under representation in the 502.1 and 502.2
academic programs, it can be concluded that an over reliance on Chap¬
ter I may prevent enrollment in 502.1 or 502.2 programs and eventually
create a need for more comprehensive placements in special education.
If this placement pattern is occurring, as suggested by enrollment
patterns, equal educational opportunities are being denied to some
minority youth as seen particularly in the under representation in
502.2 academic programs.
The utilization of transitional bilingual education programs by
Hispanic youth appeared to decrease the numbers of Spanish speaking
students who entered some programs in special education or the lack
of TBE may have created an over reliance on special education in

148
selected schools. Because the special education enrollment was not
reported by language of instruction, the number of students receiving
special education instruction in Spanish could not be determined,
making it difficult to absolutely state the correlation between TBE
and special education.
However, both School System A and C reported that they were
unable to staff the number of bilingual special education programs
which would best meet the needs of their student population. There¬
fore, the enrollment patterns suggest that the placement of Hispanic
students in TBE may have been due to staffing patterns rather than
educational concerns and equal educational opportunities in special
education, especially the 502.2 programs, were not available to His¬
panic youth.
Although this study concentrated on equal educational opportuni¬
ties in remedial education for minority students, a pattern of enroll¬
ment was uncovered between male and female students which suggests
additional discriminatory placement practices. In all special educa¬
tion placements, boys outnumbered girls. More specifically, boys out¬
numbered girls 2:1 and 3:1 in individual programs. The more compre¬
hensive the program, the fewer girls were enrolled. This suggests
that equal educational opportunities may not be available to girls
through special education or equal educational opportunities may not
be available to boys in other remedial programs or in the regular
education curriculum. Further research needs to be conducted in this
area and will be recommended later in this chapter.

149
Educational opportunities, then, did not appear to have been
provided on an equal basis to Black and Hispanic students in remedial
education. Most noticeable were the lack of speech and language
services available to minority youth and then the lack of remedial
services available to students with a dominant language other than
English. The participation of minority students in Chapter I programs
and TBE did appear to decrease the enrollment rate of minority stu¬
dents in special education, particularly the 502.2 academic program;
however, this decreased enrollment appeared to be caused by the lack
of other remedial options in the student's dominant language rather
than the lack of need for a special education program.
The enrollment patterns have suggested that discrimination has
occurred against minority students in their educational options.
Speech and language programs were not available to them and others,
such as Chapter I and special education, though available, were not
always in the appropriate language of instruction. These patterns
should not be interpreted to suggest covert discriminatory practices
but rather show the result of a shortage of appropriate staff and a
lack of attention to the language of instruction in which remedial
services should be offered.
This section presented the findings of the five research objec¬
tives which were summarized by individual school systems and collec¬
tively for all three systems. Enrollment patterns of special educa¬
tion, transitional bilingual education, and Chapter I programs were
shown, in some cases, to suggest a denial of equal educational oppor-

150
tunities to some minority youth, while other enrollment patterns sug¬
gested that remedial opportunities were not denied to minority stu¬
dents but, in part, provided through another remedial program.
Recommendations for Further Research
It is suggested that the present study could be extended in two
ways. First, enrollment patterns in remedial education at individual
schools within each school system should be analyzed after categor¬
izing schools according to the programs available, the language in
which services are offered, and the type of service provided. Cate¬
gories would include groups of schools which offered the following
programs:
Group A Special education, bilingual special education, transi¬
tional bilingual education, and Chapter I programs;
Group B Special education, transitional bilingual education,
and Chapter I programs;
Group C Special education, bilingual special education and
transitional bilingual education;
Group D Special education and bilingual special education;
Group E Special education and Chapter I programs;
Group F Transitional bilingual education and special education
and
Group G Special education.
Within each group of schools, the remedial programs need to be

151
further identified to allow for more in-depth analyses. The main
language of instruction should be listed. When the language of in¬
struction is other than English, the position of the instructor should
be identified, i.e., aide, teacher, pathologist. Each remedial pro¬
gram needs to be identified by services provided. Chapter I programs
need to specify if reading and/or language instruction is provided;
special education programs need to specify if academic instruction is
offered as compared to academic and behavioral programs.
These distinctions will enable a more comprehensive analysis of
remedial programs to be conducted. Such a detailed analysis could
help answer the questions continually raised in the present study:
Are equal educational opportunities being denied due to the language
in which instruction is offered? Is participation in one remedial
program occurring because no appropriate alternatives are available?
Does a reliance on one remedial program eventually result in a place¬
ment in a more comprehensive but segregated remedial program?
If the research is expanded in this way, administrators of spe¬
cial education, transitional bilingual education, and Chapter I pro¬
grams would have a better understanding of their programs and perhaps
would now see how the program offerings within each remedial area can
affect the educational opportunities in other areas of remediation.
Second, an analysis of the student profiles of students in the
502.3 and 502.4 special education programs should be made to compare
the educational needs of minority students to those of White students
Certain components, such as intelligence quo¬ in these programs.

152
tients, educational history, and dominant language need to be analyzed
to determine if there is a need for the over representation of minor¬
ity students in these programs or if discriminatory practices existed,
thus resulting in inappropriate placements in special education.
If IQ scores were used to determine placement in 502.3 and 502.4
programs, it must be determined if the tests given to minority youth
were culturally fair and linguistically non-biased. As discussed in
Chapter II of this study, in the past minority students often were
placed in special education due to prejudicial testing protocols.
The educational history of minority students should be analyzed
in respect to that of White peers in the program. Did minority stu¬
dents follow a similar remedial program to that of White students?
If not, what was different and why was it different? This information
could provide more details about the relationships among Chapter I
programs, TBE and special education. Of further interest would be
the dominant language of each student and the language in which the
502.3 and 502.4 programs are taught. This should be analyzed to
determine the extent to which language affects placement of minority
students in some special education programs.
Three recommendations for related but additional research about
the provision of equal educational opportunities to minority students
follow. First, enrollment patterns in all remedial programs should
be analyzed in respect to gender and race to determine if gender is
responsible for placement decisions in remedial education. Statis¬
tically, as stated by Lerner43, nationally, more boys than girls

153
enter special education programs. However, the proposed research
study could determine if boys of different racial groups enter reme¬
dial education at a rate consistently above that of their female
counterparts. If so, in what programs are boys entering at a greater
rate and is gender, race, or educational need the cause for remedial
placements? Presently, data are not routinely gathered by gender for
each remedial program. New data collection procedures must be imple¬
mented if such a study is to occur.
Second, the goals and objectives of all remedial programs should
be studied in relation to each other to determine how their design
fits within the school's structure of remedial education. If remedial
services are to meet the needs of all students, they must be available
in the student's dominant language, must work in conjunction with one
another not in competition for students, and must have clearly defined
entrance and exit criteria. As discussed in Chapter II of this study,
the goals of remedial programs often overlap and cause confusion about
placement. Further research into programmatic relationships among
remedial programs needs to be conducted to determine a process and
design in which remedial programs can work together to advance the
provision of equal educational opportunities to minority youth.
Third, the enrollment patterns of remedial reading should be
analyzed to determine how remedial reading services and Chapter I
programs interface with each other. As more remedial reading pro¬
grams are being reinstated in school districts and Chapter I programs
are declining due to cuts in federal funds, this interface between

154
the two programs needs to be carefully designed and implemented so
educational opportunities are available in the schools where they are
most needed.
Recommendations for Reform
Recommendations to reform the conditions which prevented minority
students from participating in remedial education at a rate propor¬
tionate with their peers should be addressed not only by the school
districts involved in this study, but also by state agencies and
institutes of higher education. Since it is beyond a school's locus
of control to correct all of the conditions internally, collaborative
efforts must be encouraged. Examples of such collaboration follow.
Speech and language instruction was not available to minority
youth in the same proportionate way as it was to White students;
therefore, the following recommendations are being made. First,
schools need to continue to actively recruit bilingual speech and
language therapists to meet the needs of Hispanic students. In con¬
junction with this, they should work with the State Department Bureau
of Certification and institutes of higher education to develop train¬
ing programs which result in a new cadre of trained bilingual speech
and language therapists who can serve minority youth.
Second, inservice training in culture and language differences
of minority youth needs to be provided to veteran speech and language
therapists on a yearly basis to update their skills in identification

155
and diagnosis of speech and language problems among minority students.
Professional incentives, such as release time or pay scale increments,
should be awarded for attending these sessions. Collaboration in
inservice training should be with other school districts for the pool¬
ing of physical and financial resources, institutions of higher educa¬
tion for trainers, and the State Department of Education for funding
sources and technical assistance.
To correct the placement practices which appeared to result from
the language of instruction rather than the actual remedial needs of
the student, the following recommendations are made. Chapter I pro¬
grams must be reviewed to determine if the language of instruction is
appropriate to the needs of the students within the school district.
This review can be either internal or external, but a combination of
the two is recommended. Reviews should be part of the three year
evaluation which is conducted every three years in Chapter I projects.
Additionally, questions about language of instruction in Chapter I
programs should be a more comprehensive component in the prima facie
monitoring by the State Department of Education.
Also, parents of minority children must be recruited to serve on
the Advisory Councils of Chapter I. Recognizing the attempts that
have been made to accomplish this and the limited success that has
occurred, it is recommended that parents are paid a stipend to serve
on such advisory councils. This stipend should be part of the Chap¬
ter I project.
In addition, administrators need to develop a conceptual model

156
for the delivery of remedial services to minority youth within their
school districts. This model should include recommendations from ad¬
ministrators, teachers, and students. If parental input is viable,
they are recommended to form the fourth constituency group. This
model should be a continuum of services which addresses the language
and academic needs of all students who need remedial education.
Curriculum design must be addressed in each remedial program.
It is recommended that a curriculum coordinator or outside curriculum
specialist be hired to help ensure that the curricula of all remedial
programs are developed to meet the needs of minority students. Tech¬
nical assistance grants from the State Department of Education should
be earmarked for curriculum coordination among remedial programs.
As stated in Chapters III and IV, all school districts did not
routinely maintain statistics which were vital to understanding and
analyzing enrollment patterns in remedial education. Therefore, it
is recommended that the State Department of Education require school
systems to collect and maintain:
(1) System enrollment data by gender and race for all remedial
programs.
(2) Individual school enrollment data by gender, race, and
remedial program.
(3) Data which show enrollment rates in remedial programs
labelled by the language of instruction.
(4) Enrollment data which show primary, secondary, and tertiary
remedial services provided to individual students.
157
(5) Racial data which can be used to determine non participation
in a remedial program due to parental choice.
To collect data which have been suggested, school systems should
have a computerized format. Although many school districts maintain
data on computers, the state has yet to develop a statewide data col¬
lection format. This should be done immediately. Institutes of
higher learning can provide the State Department of Education with
technical assistance in the establishment of data bases which would
enable the data collection which has been recommended.
Finally, it is recommended that the Massachusetts Department of
Education analyze statewide remedial enrollment rates by program and
race. It should assign Department staff to assist the school dis¬
tricts which have been cited for prima facie denial of equal educa¬
tional opportunities in analyzing their enrollment rates in a more
comprehensive manner. The following model for administrators, state
officials, and advocates for children is offered as a comprehensive
approach for investigating the availability of equal educational
opportunities to minority youth (Figure 1). It is based on the
findings of the research objectives which guided this study and the
factors which are likely to affect placement in remedial education.
This simple but sequential ten step approach should enable admin¬
istrators, state officials, and advocates for children to investigate
the educational opportunities which are available to minority students
through a variety of means; one of which is an investigation of en¬
rollment patterns. The beginning steps require paperwork reviews

158
Figure 1
Ten Step Model for Investigating Equal Educational Opportunities for Minority Youth
STEP I
STEP II
STEP III
STEP IV

Figure 1, continued
STEP V
STEP VI
STEP VII
STEP VIII
STEP IX
STEP X
List Remedial Services Presently Available to Minority Youth
Determine Strengths and weaknesses of Remedial
Services, Raise Questions about Over and under Representation

160
while the final steps will require sensitive, professional probing.
Together the data collection and analysis in Steps I through VI begin
to identify patterns of enrollment. These can then be investigated
during steps VII through X to determine if equal educational oppor¬
tunities are available, and if not, to identify reasons for dispro¬
portionate placement.
This country has advocated strongly for public education to meet
the needs of bilingual, bicultural, disadvantaged, and handicapped
youth. It is with a spirit of pride and accomplishment that we can
reflect upon the educational programs which are now available to
minority and educationally disadvantaged youth. The above recommen¬
dations do not reflect a failure of national advocacy or remedial pro¬
grams. Rather, they represent procedures which can help to improve
the delivery of remedial education to minority youth. The enactment
of these recommendations will prove a commitment by professionals to
help ensure that al 1 students have an equal opportunity to receive the
benefits of remedial programs which are available. This sincere com¬
mitment of dedicated professionals is what is needed if the national
goal of equal educational opportunities for all students is to be
fully realized.

FOOTNOTES
■•Robert L. Burgdorf, ed., The Leqal Riqhts of HandicaDDed
T~~S:?nS* Cases’ Mater1a1s and Text (Baltimore: Brooks Publishers, 1980j, p. 60. *
2Norris G. Haring, ed.. Behavior of Exceptional Children (Columbus, Ohio: Charles E. Merrill Publishing Company, 1974), p. 10.
3James E. Ysseldyke and Bob Algozzine, Introduction to Special Education (Boston: Houghton Mifflin Company, 19/9), pp. 372-376.
4S. Rep. No. 168, 94th Congress, 1st Session. 8 (1975).
5Ysseldyke and Algozzine, Introduction to Special Education, pp. 372-384. “
6Haring, Behavior of Exceptional Children, pp. 10-17; A. Edward Blackhurst and William H. Berdine, An Introduction to Special Education (Boston: Little, Brown and Company, 1981), pp. 42-43.
^Interviews with James Fenlason, Springfield Public School System, Springfield, Massachusetts, 9 September 1983, and Nancy A. Curtis, Massachusetts Department of Education, West Springfield, Massachusetts, 10 November 1983.
^Statement by Roger W. Brown, Ea.D., Massachusetts Department of Education, Quincy, Massachusetts, 27 October 1983.
^Burgdorf, The Legal Rights of Handicapped Persons, p. 63.
^Burgdorf, The Legal Rights of Handicapped Persons, p. 60.
^Martin L. LaVor, "Federal Legislation for Exceptional Per¬ sons: A History," in Education of Exceptional Children, edited by Frederick J. Weintraub (Reston, Virginia: Council for Exceptional Children, 1976), pp. 96-97.
126. Dybwad, "A Look at History and Present Trends in the Pro¬ tection of Children's Right to Education," in Leadership Series in Special Education, edited by R. Johnson, J. Gross and R. Weatherman, University of Minnesota, pp. 152-163.
l^Brown v. Board of Education, Topeka, Kansas, 347 U.S. 483,
74 S.Ct., 686, Ed. 873 ( 1954).
14Burgdorf, The Leqal Riqhts of Handicapped Persons, p. 153.
161

162
IpAnne Langstaff Pasanella and Cara B. Volkmer, Coming Back or ^ver Leaving (Columbus, Ohio: Charles E. Merrill Publishing Company, iy//j, pp. 14-19.
16Education for the Handicapped Law Report (Washington, D.C.: CPR Publishing Company, October 2, 1982), p. 1.
^Thomas K. Gilhool, "Education: An Inalienable Right," in Frederick J. Weintraub, Education for Exceptional Children, p. 17.
l^Joel s. Berke and Mary T. Moore, "A Developmental View of the Current Federal Government Role in Elementary and Secondary Edu¬ cation," Phi Delta Kappan, January 1982.
19Haring, Behavior of Exceptional Children, pp. 16-18.
20u.S. Federal Register, Department of Health, Education and Welfare, Office of Elementary and Secondary Education, April 11, 1965
^Frederick J. Weintraub and Alan Abeson, "New Policies for the Handicapped: The Quiet Revolution," in Weintraub, Public Policy and the Education of Exceptional Children, pp. 11-12.
22David P. Riley, Herbert D. Nash and J.T. Hunt, "National In¬ centives in Special Education" (Washington, D.C.: NASDE, 1978), p. 2
^Pennsylvania Association for Retarded Children v. Common¬ wealth of Pennsylvania, 343, F. Supp. 279. 1972.
^Frederick J. Weintraub, "New Educational Policies," p.
25joseph J. Marinelli, "Financing the Education of Exceptional Children," in Weintraub, Public Policy and the Education of Excep¬ tional Children, pp. 151-154.
^Pennsylvania Association for Retarded Children ( 1972).
27Burgdorf, The Legal Rights of Handicapped Persons, pp. 94-96.
^Frederick Weintraub et al.. Public Policy and the Education of Exceptional Children (Reston, Virginia: Council for Exceptional
Children, 1976), pp. 9-10.
29Lau v. Nichols, 414 U.S. 565, 95 S.Ct. 786, 39 L.Ed. 2d 1
(1973).
30Iris Rotberg, "Federal Policy in Bilingual Education," American Education, vol. 18, October, 1982.
163
31Burgdorf, The Leqal Rights of Handicapped Persons, do. 309. -- -
154,
32Haring, Behavior of Exceptional Children, pp. 12, 568.
33Haring, Behavior of Exceptional Children, pp. 10-12; Samuel Kirk and James Gallagher, Educating Exceptional Children (Boston: Houghton Mifflin, 1983), pp. 14-17.
34H. Rutherford Turnbull and Ann Turnbull, Free Appropriate Public Education--Law and Implementation (Colorado: Love Publishing Company, 1978), p.
33U.S. Federal Register, Department of Health, Education and Welfare, Department of Education. Education of All Handicapped Chil¬ dren Act. Vol. 42, No. 163, August 23, 1977, pp. 42477-8.
36u.S. Federal Register, Department of Education, Office of Elementary and Secondary Education. Chapter I of the Education Con¬ solidation and Improvement Act of 1981, Vol. 47, No. 224, November 19, 1982, p. 52340.
37 ibid.
38Ena Vasquez Nuttall, Patricia Medeiros Landurand, and Patricia G. Goldman, "A Critical Look at Testing and Evaluation from a Cross Cultural Perspective," unpublished Comprehensive Examination, University of Massachusetts, October 1, 1984, pp. 31-32; Interviews with Dr. Mary Claffey, Massachusetts Department of Education, West Springfield, Massachusetts, October 1984.
^Massachusetts General Law, 71B, section 6. 40 U.S. Office of Education. Progress Toward a free Appropriate Education: A Report to Congress on the Implementation of 94-124, The Education for All Handicapped Children Act, Washington, D.C.: U.S. Department of Health, Education snd Welfare, January, 1979, p. 162.
^Interviews with Mary Claffey, Ed.D., Massachusetts Department of Education, West Springfield, Massachusetts, 10 November 1983; John Howell, Ph.D., Springfield Public Schools, Springfield, 9 September, 1983.
Massachusetts,
41janet Lerner, Learning Disabilities, Third Edition (Boston: Houghton Mifflin Publishing Company, 198U, p. 17.
^National Information Center for Handicapped Children and Youth Handout. Washington, D.C.
43Lerner, Learning Disabilities, p. 17.

BIBLIOGRAPHY
Alford, Albert L. "What to Anticipate: Advice for Administrators from the Chief Architect of Title I, Education Act of 1965." Phi Delta Kappan 46, 1 June 1965: 483-487.
Ballard, Joseph. "Public Law 94-142 and Section 504--Understanding What They Are and Are Not." Reston, Virginia: Council for Exceptional Children, 1977.
Becker, Ralph J., and Halpein, Samuel. "Title I: Improvement of Education of Children of Low Income Families." American School Board Journal 15 (July 1965): 5-13. -
Bergin, Victoria. Special Education Needs in Bilingual Programs. Inter America Research Associates, Inc., National Clearinghouse for Bilingual Education, 1980.
Berke, Joel L., and Moore, Mary. "A Developmental View of the Current Federal Government Role in Elementary and Secondary Education," Phi Delta Kappan, January 1982.
Blackhurst, Edward, and Berdine, William H. An Introduction to Special Education. Boston: Little, Brown and Company, 1981.
Bogatz, B.E. With Bias Toward None. Coordinating Office of Regional Resource Centers, University of Kentucky, 1978.
Brown Roger, W. Personal statement, 1983.
Brown v. Board of Education, Topeka, Kansas, 347 U.S. 483, 74 S.Ct., 686, Ed. 873, 1974.
Burgdorf, Robert L., ed. The Legal Rights of Handicapped Persons: Cases, Materials, and Text. Baltimore: Brooks Publishers, 1982.
Claffey, Mary A. "Working with Bilingual Children." West Springfield, Massachusetts: Massachusetts Department of Education, undated.
Claffey, Mary A. Personal Interview. 1983.
Coleman, J. "The Concept of Equality of Educational Opportunity," Harvard Educational Review, 1968 in "New Educational Policies for the Handicapped: The Quiet Revolution," in Weintraub, Frederick J. and Abeson, Alan, Education of Exceptional Children, 1976.
164

165
Dabney, Margaret G. "Curriculum Building and Implementation in Main¬ stream Settings: Some Concepts and Propositions," in Jones, Reginald L., Mainstreaming and the Minority Child.
Dybwad, G. "A Look at History and Present Trends in the Protection of Children's Right to Education," in Second Leadership Series in Special Education, Johnson R., Gross, J., and Weatherman, R., eds. Minnesota: University of Minnesota, undated.
Education for the Handicapped Law Report. Washington, D.C.: CPR Publishing Company, 1982.
Farnum, H. Arthur. Memorandum About the Proposed P.L. 94-142 Regula¬ tion Changes. American Speech, Language and Hearing Association (August 24, 1982).
Fenlason, James E. Personal Interview, 1983.
Foster, Charles R. "Defining the Issues in Bilingualism and Bilingual Education." Phi Delta Kappan 63 (January 1982).
Gilhool, Thomas K. "Education: An Inalienable Right," in Weintraub, Frederick, Education for Exceptional Children, 1976.
Haring, Norris G., ed. Behavior of Exceptional Children. Columbus, Ohio: Charles E. Merrill Publishing Company, 1974.
Henderson, Ronald W. "Social and Emotional Needs of Culturally Diverse Children." Exceptional Children, 46(8), May 1980.
Hewitt, Frank M., and Forness, Steven R. Education of Exceptional Learners.
Howell, John. Personal Interview. 1983.
"Implementing Massachusetts' Special Education Law: A Statewide Assessment." Massachusetts: Department of Education, 1982.
Jones, Reginald, ed. Mainstreaming and the Minority Child. Reston, Virginia: Council for Exceptional Children, 19/b.
Kirk, Samuel A., and Gallagher, James J. Educating Exceptional Children. Boston: Houghton Mifflin Company, 1983.
Lau v. Nichols, 414 U.S. 565, 95 S.Ct. 786, 39 L.Ed. 2d, 1973.
LaVor, Martin History," Children.
L "Federal Legislation for Exceptional Persons: A in Weintraub, Frederick J., Education of Exceptional Virginia: Council for Exceptional Chi Idren, 19/b.

166
Lerner, Janet. Learning Disabilities, Third Edition. Boston: Houghton Mifflin Publishing Company, 1981.
Marinel 1 i, Joseph J. "Financing the Education of Exceptional Chil¬ dren, in Weintraub, Public Policy and the Education of Excpd- tional Children. 1976“ -
Massachusetts General Law, 71B. Section 6.
McKay, Robert E. "The President's Program: A New Commitment to Quality and Equality in Education." Phi Delta Kappan 46 (May 1965): 427-429. -J
National Information Center for Children and Youth Handout, Washing¬ ton, D.C.
Nuttall, Ena Vasquez, Landurand, Patricia Madeiros and Goldman, Patricia G. "Critical Look at Testing and Evaluation from a Cross Cultural Perspective," unpublished Comprehensive Examina¬ tion, University of Massachusetts, 1984.
Passanella, Anne Langstroff and Volkmor, Cara. Coming Back or Never Leaving. Columbus, Ohio: Charles E. Merrill Publishing Comoanv. 1977.
Pennsylvania Association for Retarded Children v. Commonwealth of Pennsylvania, 343, F.Supp. 279, 1972.
Riley, David P., Nash, Herbert D., and Hunt, J.T. "National Incen¬ tives in Special Education." Washington, D.C.: National Asso¬ ciation of State Directors of Special Education, 1978.
Rotberg, Iris. "Federal Policy in Bilingual Education," American Education, vol. 18, 1982.
Shannon, Thomas A. "The Emerging Role of the Federal Government in Public Education," Phi Delta Kappan 63 (May 1982).
S. Rep. No. 168, 94th Congress, 1st Session, 8, 1975.
Turnbull, H. Rutherford and Turnbull, Ann. Free Appropriate Public Education--Law and Implementation. Colorado: Love Publishing Company, 1978.
U.S. Federal Register, Department of Health, Education and Welfare, Office of Elementary and Secondary Education, 1965.

167
Weintraub, Frederick J. and Abeson, Alan. "New Educational Policies for the Handicapped: The Quiet Revolution," in Weintraub, Edu¬ cation of Exceptional Children. Reston, Virginia: Council-for Exceptional Children, 1976.
Weintraub, Frederick J., et al. Public Policy and the Education of Exceptional Children. Reston, Virginia: Council for Exceptional Children, 1976.
Yaffe, Elaine. "Ambiguous Laws Fuel Debate on Bilingual Education." Phi Delta Kappan 62 (June 1981): 10.
Ysseldyke, James E. and Algozzine, Bob. Introduction to Special Edu¬ cation. Boston: Houghton Mifflin Company, 1984.

APPENDIX A
Massachusetts' Special Education Prototypes
168

169
Massachusetts1 Special Education Prototypes
Prototype 502.1 A regular classroom program which has been slightly modified. For example, classroom furni¬ ture is rearranged so that it is easier for a child with a hearing loss to lipread, or a spe¬ cialist provides support and training to the child's classroom teacher.
Prototype 502.2 A regular classroom program in which up to 25% of a child's time is spent in specialized services. For example, a child spends 1 hour per week with a speech therapist.
Prototype 502.3 A regular classroom program in which up to 60% of a child's time is spent in specialized services. For example, a child who needs small group in¬ struction receives it in a special education classroom.
Prototype 502.4 A special class which is in a regular public school and is entirely composed of other young people with special needs.
Prototype 502 .4( i) A classroom of all special education students which is located in a building other than a public school.
Prototype 502.5 A private day school program for children with special needs. For example, a school which specializes in programs for children with severe emotional needs and is privately operated.
Prototype 502.6 A residential educational program which enables a child to live at the school.
Prototype 502.7 A home or hospital program which is implemented if a child is at home or in the hospital for 14 days or more.
Prototype 502.8 A preschool program for 3- and 4-year-olds which may be
(a) a Home Program where school personnel make home visits and provide instruction, mate¬ rials for the child and group sessions for the parents;

170
(b) an integrated program where up to 50% of the children may have special needs; or
(c) a separate program where up to 50% of the children have special needs.
Prototype 502.9 An eight week diagnostic program designed so a TEAM can learn more about a student's special educational needs.
Prototype 502.11 A special educational program designed for stu¬ dents 16-22 who cannot function within the regular school setting.

APPENDIX B
Action Plan
171

172
Action Plan, Elements 1-9
An Action Plan is a concise written statement of the steps a school district will undertake to correct the disproportionate place¬ ment of minority children in special education. The development of an Action Plan can be done voluntarily after notification of prima facie denial or it can be ordered by a hearing officer after a finding that a school district has denied minority students equal opportuni¬ ties concerning their participation in special education programs.
At minimum, an acceptable Action Plan is composed of the follow¬ ing nine elements and covers the activities of the school district over a three year period with modifications made yearly as necessary. Each of the nine elements will assist in securing the rights of minor¬ ity children to equal opportunity in special education.
The Action Plan must be submitted on the form provided by the Department. It must also contain all the information and documenta¬ tion requested. Staff from the Regional Center are available to pro¬ vide technical assistance in preparing the Plan. Modifications of approved sections of an Action Plan can be made with the approval of the Regional Center and may be required after on site monitoring visits by the Regional Center.
Element #1. Minority Student Placement Review
The district shall conduct during the first year of their Action Plan, a placement review of each minority student in special education prototypes in which over-representation was found. This placement re¬ view will consist of an in-depth record review which will be the basis for determining which students, if any, should have a full review or re-evaluation under 333.0 and 334.0 of the regulations to further de¬ termine appropriate placement. Prior to the start of this process, the district shall notify parents of the reason for this placenent review and their right to particpate if it is determined that a review or re-evaluation should be done.
1.1 The district must submit a copy of the letter to be sent to parents.
1.2 The district must include a description of the composition of the placement review team, identifying those members with the training and experience in non-biased assessment who will determine whether each student's evaluation was as free as possible from cultural and linguistic bias and the person responsible for coordination of this effort.

173
1.3 The district must include a description of the placement review process and must address the following minimum re- quirements when reviewing each student's record:
a. Language dominance and proficiency testing completed prior to other testing for limited English proficient children.
b. Pre-referral modifications attempted and documented with results of each modification.
c. Appropriate assessments conducted which were as free as possible from cultural and linguistic bias.
d. Composition of the evaluation TEAM met requirements of sections 311.0, 312.0, and 313.0.
e. Interpreter was present when primary language of parent or student was other than English.
f. Forms and notices to parent were in primary lanquaqe of parent.
g. IEP included specific criteria for movement to less restrictive program.
h. IEP and placement were based on the results of the assessments.
i. Progress reports are prepared as required and show that child has made progress in achieving goals in IEP.
1.4 The district must include a statement of the criteria to be used to determine whether a student should have a complete review or re-evaluation under 333.0 or 334.0.
1.5 The record review and any subsequent reviews or re-evalua¬ tions must be completed within the timelines specified by the Regional Center.
Element #2. Identification of Primary Language and Non-Biased Assessment
The district shall describe the procedures used, or to be used, to identify the primary languages of all students, including an assessment of language dominance and proficiency as well as achieve¬ ment levels and for insuring non-biased assessment of minority chil¬ dren referred for evaluation.
2.1 Identification of primary languages may be accomplished by either an approved Lau Plan or a description of the process by which all students are tested for language dominance and proficiency as detailed below.
2.2 The process by which all students are tested for language dominance including how the home and school surveys which

174
answer the following "Lau Questions" are completed:
Home What language do you speak to your child? Home What language does your child speak to you? Home What language does the child speak to brothers,
sisters and friends? School Which children are not functioning on grade level
in English?
2.3 The process for testing all students' language proficiency and achievement level, including copies of tests employed.
2.4 The process for identification of primary home language of all students.
2.5 The procedures used to insure non-biased assessment of minority children referred for evaluation, including a list of assessors with their specialized training and/or appro¬ vals and copies of certifications.
Element #3. Community Group Involvement
A statement of the manner in which interested community groups will be involved both in the development of the Action Plan and on an ongoing basis.
Include in this statement:
3.1 Identification of groups and name of contact person for each group.
3.2 A description of the role these groups will play both in the development of the Action Plan and on an ongoing basis.
Element #4. In-Service Plan
A plan to provide training to appropriate staff which includes the required areas and processes.
4.1 An acceptable in-service training plan includes the follow¬ ing process components:
a. A needs assessment to identify target populations and critical issues.
b. Evidence of participatory planning. c. Evaluation plan with criteria for success.

175
4.2 An acceptable in-service training plan includes at minimum the following content areas:
a. Cultural awareness (all staff): the impact of cultural and linguistic diversity on the individual learner and the learning environment.
b. Non-discriminatory assessment (all staff involved in assessments): issues, techniques, and procedures to assure non-discriminatory assessment in the evaluation of minority students.
c. Pre-referral modification procedures: resources avail¬ able and staff responsibilities.
Element #5. Collaboration Between Bilingual and Special Education
A description of the procedures through which bilingual education and special education staff collaborate in the referral, evaluation, and placement of limited English proficiency students.
This description should include the following:
5.1 The manner in which bilingual staff will be involved in the pre-referral and referral process (314.0).
5.2 The manner and frequency with which bilingual and special education staff will communicate and collaborate.
5.3 Explanation of how student records from various programs are to be maintained and shared.
5.4 The availability of placements for students who require both bililngual and special education.
5.5 The persons/position responsible for the above effort.
Element #6. Public Outreach Plan
A plan for increased efforts at public outreach to ensure that minority parents are aware of their rights under Chapter 766 and understand the procedures for referral, evaluation, placement, and
appeal.
The plan should describe the following:
6.1 How continuous and systematic efforts to identify minority children out of school (3-21 years) who are in need of spe
cial education are maintained.

176
6.2 The annual communication with parents and students describ¬ ing available special education programs and options.
6.3 The special outreach efforts made to encourage minority parents of children ages 3 and 4 to attend annual orienta¬ tion workshops, and orientation workshops to be conducted in the native language(s) of the parents when applicable.
6.4 Staff development activities that have taken place and those planned for the coming year to assist staff in reaching par¬ ents and involving the parents in their child's education.
6.5 Its support for the existing advisory council or other appropriate group(s) which include minority members or its intention to organize such a group.
Element #7. School Placement Pattern Review
A plan to review the referral and placement patterns of special needs students by race, language category, prototype, school building and systemwide.
The plan should include:
7.1 Identification of personnel responsible for collecting and analyzing by school building the referral and placement figures.
7.2 The procedure for generating such figures at least twice a year and prior to any monitoring visits by the Department.
7.3 Intervention strategies that will follow when particular schools are identified with disproportionate enrollments.
Element #8. Staffing
A statement of procedures currently used, or to be undertaken, to provide appropriate staffing for serving the needs of minority children in special education.
The statement should include the following:
8.1 A list of staff providing special education and related services indicating certification status, language certifi¬
cations, and race of each.
8.2 Where additional staff are needed in order to secure appro-

177
priate staff for serving the needs of minority children, especially in accordance with Regulation 213.0 and 314.0.
8.3 The plan to fill staffing needs.
Element #9. District Monitor
The identification of an individual to monitor the implementation of the proposed plan.
9.1 Assurances must be given that the individual identified:
a. Does not have a direct line relationship with those persons responsible for implementation;
b. Has time to carry out the responsibilities of the Plan; and
c. Is clear as to the function s/he will play in monitoring the implementation of the Plan.

APPENDIX C
Raw Chi Square Data
178

179
School System A
502.1
Chi Square Analysis
White Black Hispanic
Count 23 7 0
Row Percent 76.7 23.3 0
Column Percent 2.1 .8 0
Total Percent .9 .3 0
Raw chi square = 15.52097 with 2 degrees of freedom.
Significance = .0004.

School System B
502.1
180
Chi Square Analysis
White Black Hispanic
Count 26 2 7
Row Percent 74.3 5.7 20.0
Column Percent 5.0 3.8 2.4
Total Percent 3.0 .2 .8
Raw chi square = 3.33526 with 2 degrees of freedom.
Significance = .1887.
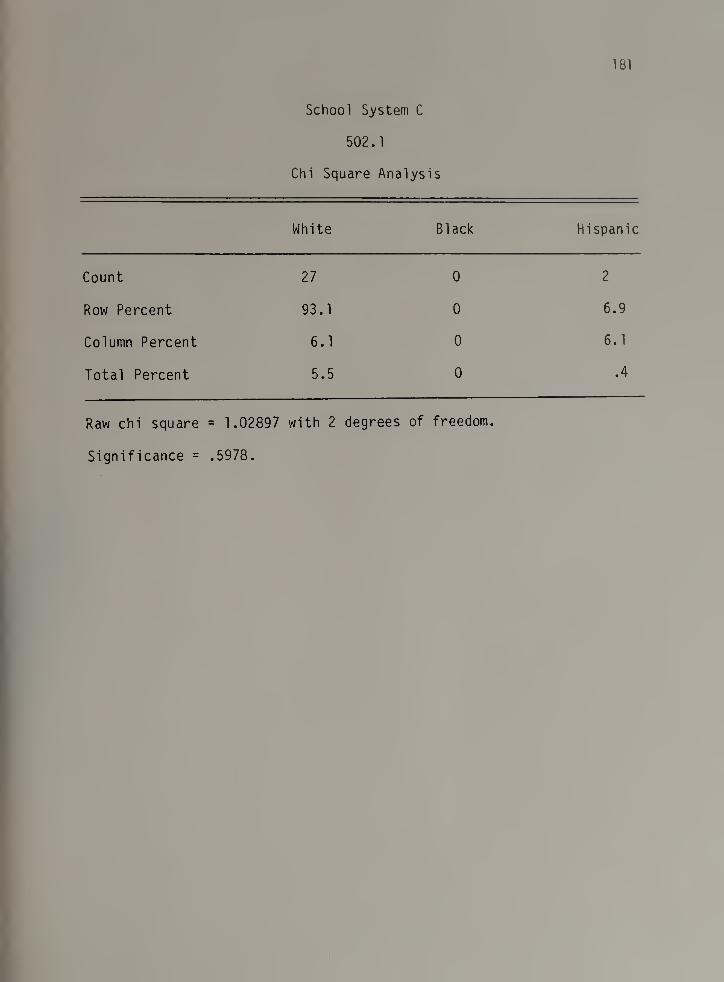
School System C
502.1
181
Chi Square Analysis
White Black Hispanic
Count 27 0 2
Row Percent 93.1 0 6.9
Column Percent 6.1 0 6.1
Total Percent 5.5 0 .4
Raw chi square = 1.02897 with 2 degrees of freedom.
Significance = .5978.

182
School System A
502.2 Academic
Chi Square Analysis
White Black Hispanic
Count 140 94 34
Row Percent 52.2 35.1 12.7
Column Percent 12.9 11.3 6.0
Total Percent 5.6 3.8 1.4
Raw chi square = 19.21237 with 2 degrees of freedom.
Significance = .0001.

School System B
502.2 Academic
Chi Square Analysis
183
White Black Hispanic
Count 212 26 99
Row Percent 62.9 7.7 29.4
Column Percent 40.4 49.1 33.3
Total Percent 24.2 3.0 11.3
Raw chi square = 6.62644 with 2 degrees of freedom.
Significance = .0364.
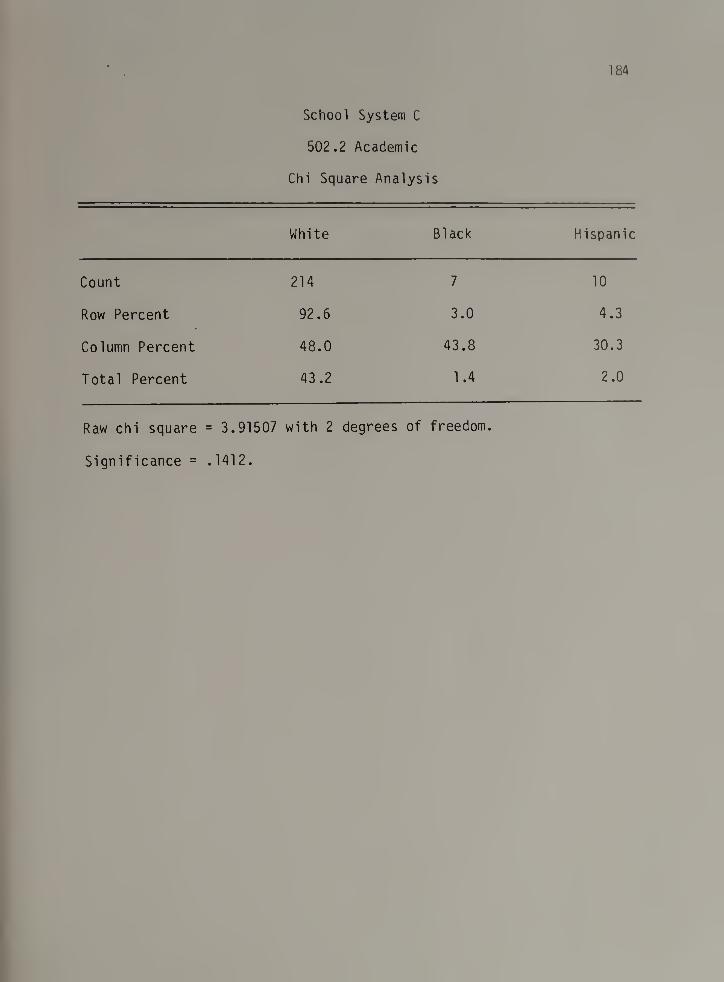
184
School System C
502.2 Academic
Chi Square Analysis
White Black Hispanic
Count 214 7 10
Row Percent 92.6 3.0 4.3
Column Percent 48.0 43.8 30.3
Total Percent 43.2 1.4 2.0
Raw chi square = 3.91507 with 2 degrees of freedom.
Significance = .1412.
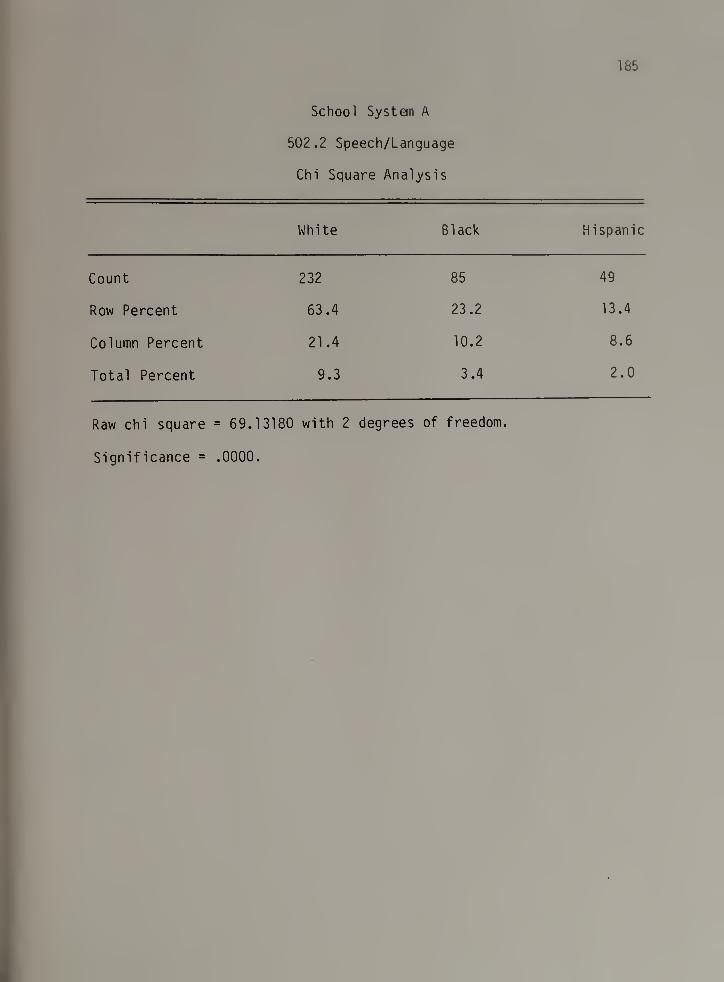
185
School System A
502.2 Speech/Language
Chi Square Analysis
White Black Hispanic
Count 232 85 49
Row Percent 63.4 23.2 13.4
Column Percent 21.4 10.2 8.6
Total Percent 9.3 3.4 2.0
Raw chi square = 69.13180 with 2 degrees of freedom.
Significance = .0000.

186
School System B
502.2 Speech/Language
Chi Square Analysis
White Black Hispanic
Count 88 3 21
Row Percent 78.6 2.7 18.8
Column Percent 16.8 5.7 7.1
Total Percent 10.1 .3 2.4
Raw chi square = 18.53799 with 2 degrees of freedom.
Significance = .0001.

187
School System C
502.2 Speech/Language
Chi Square Analysis
White Black Hispanic
Count 58 1 0
Row Percent 98.3 1.7 0
Column Percent 13.0 6.3 0
Total Percent 11.7 .2 0
Raw chi square = 5.45579 with 2 degrees of freedom.
Significance = .0654.

School System A
502.3
188
Chi Square Analysis
White Black Hispanic
Count 231 295 242
Row Percent 30.1 38.4 31.5
Column Percent 21.3 35.5 42.5
Total Percent 9.3 11.9 9.8
Raw chi square = 90.17899 with 2 degrees of freedom.
Significance = .0000.

189
School System B
502 .3
Chi Square Analysis
White Black Hispanic
Count 57 8 72
Row Percent 41.6 5.8 52.6
Column Percent 10.9 15.1 24.2
Total Percent 6.5 .9 8.2
Raw chi square = 25.74936 with 2 degrees of freedom.
Significance = .0000.

School System A
502 .4
190
Chi Square Analysis
White Black Hispanic
Count 320 266 179
Row Percent 41.8 34.8 23.4
Column Percent 29.6 32.0 31.4
Total Percent 12.9 10.7 7.2
Raw chi square = 1.46496 with 2 degrees of freedom.
Significance = .4807.

191
School System B
502.4
Chi Square Analysis
White Black Hispanic
Count 64 7 60
Row Percent 48.9 5.3 45.8
Column Percent 12.2 13.2 20.2
Total Percent 7.3 .8 6.9
Raw chi square = 9.70208 with 2 degrees of freedom.
Significance = .0078.

School System C
502 .4
Chi Square Analysis
White Black Hispanic
Count 62 5 8
Row Percent 82.7 6.7 10.7
Column Percent 13.9 31.3 24.2
Total Percent 12.5 1.0 1.6
Raw chi square = 5.88909 with 2 degrees of freedom.
Significance = .0526.

