eq draft with tables 2-27-2012 sr - harvard … (ii) about 50% of earnings quality is driven by...
TRANSCRIPT

Earnings Quality
Ilia Dichev Goizueta Business School, Emory University
John Graham
Campbell R. Harvey Fuqua School of Business, Duke University
National Bureau of Economic Research
Shiva Rajgopal Goizueta Business School, Emory University
Preliminary and incomplete
Please do not quote or distribute without permission Comments welcome
February 27, 2012
Abstract: We provide new insights into earnings quality via a survey 169 CFOs of public companies and 12 in-depth interviews of Chief Financial Officers (CFOs) and two standard setters. Our key findings are: (i) high quality earnings reflect consistent reporting choices over time, avoid long term estimates, and are sustainable; (ii) about 50% of earnings quality is driven by innate factors; (iii) about 20% of firms manage earnings to misrepresent economic performance and for such firms, 10% of EPS is typically thus managed; (iv) CFOs believe that earnings management is hard to unravel from the outside but suggest numerous red flags that academics can use to identify managed earnings; and (v) CFOs disagree with the direction the FASB is headed on a number of issues including the sheer number of rules promulgated, the top-down as opposed to the bottom-up approach to rule making, curtailed reporting discretion, de-emphasis of the matching principle, and the over-emphasis on fair value accounting. We acknowledge excellent research assistance by Mengyao Cheng, Jivas Chakravarthy and Stephen Deason. We appreciate comments on an earlier version of the paper from workshop participants at Texas A&M University and on a preliminary version of the survey instrument from workshop participants at Emory University and from Bob Bowen, Dave Burgstahler, Brian Bushee, Dan Collins, John Core, Patty Dechow, Mark DeFond, Jennifer Francis, Weile Ge, Jeff Hales, Michelle Hanlon, Gary Hecht, Kathryn Kadous, Mark Lang, Russ Lundholm, Mark Nelson, Stephen Penman, Kathy Petroni, Grace Pownall, Catherine Schrand, Terry Shevlin, Shyam Sunder, Terry Warfield, Ross Watts, Greg Waymire, Joe Weber and Jerry Zimmerman, and two anonymous standard-setters. We would like to thank Dean Benveniste and Trevor Harris for arranging interviews. We are grateful for CFO magazine’s help in this project, though the views expressed here do not necessarily reflect those of CFO. Finally, we thank David Walonick and STATPAC for their dedicated work in coding and delivering the survey.

1
Earnings Quality 1. Introduction
Earnings quality is a fundamental concept. Yet, ironically, there are deep disagreements about to
define earnings quality or to measure it. The list of candidate measures is long: earnings persistence,
predictability, asymmetric loss recognition, various forms of benchmark beating, smooth earnings,
magnitude of accruals, income-decreasing accruals, absolute value of discretionary or abnormal accruals
and the extent to which accruals map into past and future cash flows. In addition to the proliferation of
measures, there are a number of vexing questions that have been difficult to address with archival work
because answers often rely on managerial intent, which is not observable and is difficult to infer. A
related problem is that archival work cannot satisfactorily decompose the portion of earnings that is
manipulated by management from the portion attributable to the unobservable fundamental earnings
process (Dechow, Ge and Schrand, 2009). Examples of such questions include: What opportunities and
constraints do managers trade off to choose one set of earnings attributes over the other? How prevalent
is earnings management? What are the typical magnitudes of earnings management? Would certain
types of accounting policies promote higher quality earnings? How can an outside investigator tell
whether ex-ante earnings quality is poor before observing ex-post outcomes such as restatements and SEC
enforcement actions?
In this paper, we provide new insights about earnings quality from a new data source: a large
survey and a dozen interviews with top financial executives, primarily Chief Financial Officers (CFOs).
Why CFOs? While it is clear that there are important consumers of earnings quality, such as investment
managers and analysts, we focus on the direct producers of earnings quality, who also likely intimately
know and cater to such consumers. In addition, CFOs commonly have a formal background in
accounting – about half of our survey respondents - which provides them with keen insight into the
various aspects of earnings quality, including the advantages and limitations of GAAP accounting. CFOs

2
are also key decision-makers in company acquisitions (see Graham, Harvey and Puri 2010), which
implies that they know how to evaluate earnings quality from an outsider perspective.
Although field studies suffer from their own problems (potential response bias, limited data
points, whether questions on a survey instrument are misinterpreted, do respondents do what they say, do
they tell the truth, do they recall the most vivid or their most representative experience), they potentially
offer a way to address often intractable issues related to omitted variables and the inability to draw causal
links between variables that are endemic to large sample archival work. Surveys and interviews allow
researchers to ask key decision makers directed questions about their behavior as opposed to inferring
intent from statistical associations between proxy variables surrogating for such intent. In particular, we
ask senior financial executives to identify the key choices, incentives and constraints behind their decision
to produce a high quality earnings number. Critically, we also try to provide some idea of “how it all fits
together,” i.e., the relative importance of individual factors and how they come together to shape reported
earnings.
Our analysis offers the following insights: (i) earnings is as useful for valuation as for contracting
purposes, contrary to the position taken in the conceptual framework project of the FASB and the IASB
(2006); (ii) high quality earnings are those that avoid long term estimates as much as possible, reflect
consistent reporting choices over time, and/or are sustainable; (iii) the most important determinants of
earnings quality are the firm’s business model, accounting standards, the company’s industry, macro-
economic conditions and the firm’s internal controls; (iv) innate factors (beyond immediate managerial
control) account for roughly 50% of earnings quality; (v) CFOs feel that reporting discretion has declined
over time and that GAAP is somewhat of constraint in reporting high quality earnings; (vi) a large
majority of CFOs believe that FASB’s de-recognition of matching, under-emphasis of conservative
accounting and over-emphasis on the fair value approach is misguided; (vii) CFOs would like standard
setters to issue fewer new rules, and to converge U.S. GAAP with IFRS. They would also prefer
reporting choices to evolve from practice rather than from a top-down body such as the FASB. They
3
view financial reporting largely as a compliance activity rather than as a process where they can innovate
and compete in communicating operating results; (viii) CFOs estimate that roughly 20% of firms
misrepresent their firm’s economic performance by managing earnings; (ix) the typical misrepresentation
is 10% of the EPS number; (x) 60% of earnings management is income-increasing while 40% is income-
decreasing; (xi) A large majority of CFOs feel that earnings misrepresentation occurs because of outside
and inside pressure to hit earnings benchmarks, in an attempt to influence stock price, and to avoid
adverse compensation and career consequences for senior executives; and (xii) CFOs suggest numerous
red flags that point to potential earnings management. The three most important flags are persistent
deviations between earnings and the underlying cash flows, deviations from industry and other peer
experience, large and unexplained accruals and changes in accruals.
Relative to the extant literature, our work provides the following three key contributions. First, in
an area crowded with competing earnings quality measures, we provide a rank ordering of what CFOs
believe are good candidate measures for earnings quality (consistent reporting choices, avoiding long-
term estimates and sustainable earnings). Empirical measures of these concepts are under-developed and
hence represent opportunities for future research. Second, we provide, for the first time, a numerical
estimate of the proportion of earnings quality that is innate and the prevalence and magnitude of earnings
management. Third, we identify several areas of regulatory focus that are unpopular among CFOs such
as the top-down approach to rule-making, curtailed reporting discretion, abandonment of the matching
principle and conservative accounting, and the over-emphasis on fair value accounting for entities other
than financial institutions. We hope that rule making bodies such as the FASB and IASB find such
feedback useful during the course of their future deliberations. We also hope to spur academic research
into how corporate behavior changes in response to regulatory priorities that seem inconsistent with
CFOs’ preferences.
The remainder of the paper is organized as follows. Section 2 describes the process of designing
and conducting the survey and the interviews. Section 3 presents results on how earnings are used and on

4
CFOs’ views of defining and measuring “earnings quality.” Section 4 reports results on the determinants
of earnings quality. Section 5 details CFOs views on the standard setting process and its impact on
earnings quality. Section 6 presents CFOs’ views on how and why other CFOs reduce earnings quality
via earnings management and section 7 concludes.
2.0 Survey logistics and descriptive data
2.1 Survey design and delivery
We developed the initial survey instrument based on our review of the literature on earnings
quality and standard setting, including recent published reviews in Dechow, Ge, and Schrand (2010),
Melumad and Nissim (2008), and Dechow and Schrand (2004). We supplemented this review with 12
one-on-one interviews with Chief Financial Officers (CFOs), and two with standard setters to capture
issues related to standard setting and earnings quality that are potentially missed by the academic
literature. The draft survey contained 10 questions, of which two had subsections, and most of which had
multiple response choices. We solicited and received feedback from 18 academic researchers, one
standard setter and a few CFOs on survey content and design. We also distributed a draft of the survey to
an expert who specializes in survey design and execution. Our goal was to minimize biases induced by
the questionnaire, strike a neutral tone, and to maximize response rate. We used the penultimate version
of the survey to conduct beta tests to seek feedback and to make sure that the time required to complete
the survey was reasonable. Our beta testers took 15-20 minutes to complete the survey. Based on this
and other feedback, we made changes to the wording of several questions, deleted a couple of questions
and added four new (sub) questions. The final survey contains 10 questions, and was administered over
the Internet and is available on request.
One advantage of online administration was the ability to randomly scramble the order of
possible answers within a question, to mitigate order-of-presentation effects. Specifically, the survey
scrambles the order of answers in questions 1, 4, 5, and 9. For the remaining questions order is either not

5
an issue (demographic questions, qualitative questions), there is a natural order of alternatives (e.g., 6,
8b), and in two cases we decided against scrambling because the listed alternatives are organized in
meaningful clusters, and it is unadvisable to break them (3a, 7). Participants were allowed to skip
questions to ensure that we did not lose them if they were to encounter a question that they did not want
to answer. Every multiple-choice question was followed by a free text version of the question so that
survey takers could enter alternatives or choices that were not explicitly specified in the question. We
comment on these qualitative textual responses at appropriate places in the paper.
Invitations to take the survey were sent via email. We used two databases of email addresses of
CFOs supplied by (i) CFO magazine; and (ii) a list of CFO email addresses maintained by the Fuqua
School at Duke University. The majority of executives have the job title of CFO, though the database
also includes the titles Chief Accounting Officer, Treasurer, Assistant Treasurer, Controller, Assistant
Controller, or Vice President (VP), Senior VP or Executive VP of Finance (collectively referred to as
CFOs for simplicity). In total, approximately 10,300 email addresses from these two sources were
surveyed. We received 558 responses, for a response rate of approximately 5.4%.1 We emailed an
invitation to take the survey on October 25, 2011.2 A reminder was sent a week later, and finally the
survey closed on December 9, 2011.
Of the 558 total responses, only 402 participants indicated whether they belong to a public
company, a private firm or to the government non-profit sector. We are left with 169 responses from
public firms and 206 from private firms. Other than when we directly compare public firms to the private
firms, the analysis below is based on the 169 responses that we can confidently identify as public firms.
1 As a reference point, Trahan and Gitman (1995) report a response rate of 12% in a survey physically mailed to 700 CFOs, while Graham and Harvey (2001) obtain a 9% response rate for 4,400 faxed surveys. Brav et al. (2005) have a 16% response rate whereas Graham, Harvey and Rajgopal (2005) report a response rate of 10.4% averaged over two modes of delivery (Internet and physically at a conference). 2 We worked with a software expert for about two weeks to ensure that the email invitation message did not get quarantined by the standard email spam filters, where Gmail’s Postini proved the hardest hurdle.

6
2.2 Summary statistics and data issues
While the survey is anonymous, the instrument gathered much demographic information to allow
us to explore conditional effects of earnings quality practices, e.g., whether CFOs of companies with high
leverage rate conservatism higher as earnings quality feature. In particular, the survey instrument asks for
firm characteristics often used to proxy for credit worthiness (credit rating, total debt to assets ratio),
profitability (report a profit or a loss), growth opportunities (growth rate in sales, price to earnings ratio),
potential agency problems (did the firm pay a dividend, proportion of CEO and CFO pay that is incentive
based, managerial ownership, institutional ownership), the firm’s operating environment (firm age,
foreign sales, number of business segments, the physical location of company headquarters, earnings
volatility and exposure to class action litigation), size effects (sales revenue, number of employees),
informational effects (public versus private, which stock exchange for public firms), industry
membership, and several variables specific to the CFO taking the survey (age, his/her risk aversion, job
title, person he/she reports to, where is his/her job physically located, time on the job and the professional
background such as public accounting, investment banking etc.). The survey question assessing risk
aversion is inspired by Barsky et al. (1997) and has been used before in Graham, Harvey and Puri (2010).
To conserve space, we do not tabulate, but only discuss, conditional analyses of the survey responses.
Table 1, panel A reports select descriptive data on the surveyed firms. All firms that indicated
their public/private/non-profit status are included in this table. As reported, only 42% of the total 402
observations are public and hence broadly usable for most of our analysis. The statistics are based on the
non-missing values for each particular variable. The executives are mostly between 50-59 years of age.
Their experience is fairly evenly distributed across the four intervals indicated in the survey, with 26% of
respondents having less than four years of experience as a CFO, and 17.7% having been on the job for 20-
plus years. The majority (52.4%) have an MBA. Roughly half have an accounting background,
consistent with our priors that top finance executives are likely to have a sophisticated understanding of
the accounting determination of earnings. Approximately 33.2% of the firms have no foreign sales and

7
are hence not multinationals. Interestingly, only 10.2% of the executives were risk averse. The
responding firms are widely distributed across firm size categories, where 9.18% of the sample have
revenues of less than $25 million, while 11.99% have revenues of more than $10 billion. Most firms are
from the manufacturing sector (30.49%) followed by banking/finance and insurance (12.92%) and
retail/wholesale (12.66%) sectors. Reflecting the pooled public and private profiles of the surveyed firms,
insider ownership is bi-modal in that 35.08% of the firms have less than 5% of the firm owned by insiders
versus 35.91% with insiders owning more than 20% of the equity. Similar patterns are observed for
institutional ownership wherein 45.56% (45.85%) of the sample consists of firms where institutions own
less than 5% (more than 20%) of the equity.
Table 1, panel B reports the pair-wise correlations of select variables reported in the survey.
None of the pair-wise correlations are particularly noteworthy. Table 1, panel C benchmarks the
interviewed firms to the distribution of firms in Compustat. The interviewed firms are larger than the
typical Compustat firm with average (median) sales of $24 billion ($10.4 billion). They are more levered,
report lower sales growth, yield less in terms of dividend but have a higher credit rating and a larger
price-earnings ratio relative to a typical Compustat firm. Table 1, panel D benchmarks the surveyed firms
to Compustat. However, an important feature of Table 1, panel D is that it is restricted to public surveyed
firms. As can be seen, the average (median) sample firm reports revenues of $4.8 billion ($2.95 billion).
Our sample firms are slightly smaller than the typical Compustat firm, as indicated by the observation that
36.36% (16.97%) of the sample falls in Compustat-determined quintile 2 (3) of revenues, relative to an
equally distributed benchmark proportion of 20%. Sample firms are roughly similar to Compustat in
terms of sales growth and leverage (debt/assets) and credit ratings.
2.3 Conducting interviews
To identify interview subjects, we chose firms in different industries and with different analyst
coverage and market capitalization, purposefully seeking cross-sectional variation in financial reporting
policies. We conducted 12 one-on-one interviews with senior executives (typically the CFO) and two

8
with standard-setters, where all invited agreed to be interviewed. Table 1, Panel C reports data on the
representativeness of these interviewed firms relative to the population of U.S. public firms.3
All the interviews except one were conducted via telephone. The interviews were arranged with
the understanding that the identity of the firms and executives will remain anonymous. We conduct
interviews according to the scientific practices described in Sudman and Bradburn (1983). At the
beginning of each interview, we ask the executive an open ended question allowing them to describe their
understanding of “earnings quality” and the ways in which an outside investigator would discern high
quality earnings from the firm’s financial statements. We next clarify that, consistent with Dechow and
Skinner (2000), whenever we use the words “earnings management” we mean aggressive reporting
choices within GAAP, i.e., we explicitly rule out fraudulent transactions in both our survey instrument
and interviews. Also consistent with Sudman and Bradburn (1983), “riskier” questions are asked later in
the interview. We attempt to conduct the interview so as not to ask leading questions, influence the
answers or make the interviewee feel “cornered.” We also try to avoid affecting the initial direction of
the interviews with a pre-set agenda. Rather, we let the executive tell us what is important at his or her
firm about earnings quality and follow up with clarifying questions. Many of the clarifying questions are
similar to those that appear on the survey instrument. The interviews varied in length, lasting from 40 to
90 minutes. The executives were remarkably forthcoming in their responses. Each interview was
recorded and transcribed. In what follows, we present interview comments in quotation marks or in
identifiable sub-sections of the paper.
3.0 Earnings quality
3.1 How are earnings used?
To aid interpretation of later survey questions about earnings quality, it is important that we first
understand CFO beliefs about how earnings are used. In addition to clarifying the decision context, this
3 Table 1 lists data for 11 publicly traded firms since one executive worked for a private firm (and another for a subsidiary of a public firm).

9
question can shed some light on the theoretical debate related to whether reported earnings are more
useful for valuation or for contracting. Several authors (e.g., Schipper 2005 and others) have interpreted
GAAP as providing direct valuations of firms whereas other authors (e.g., Holthausen and Watts 2001
and others) contend that GAAP provides information useful for performance evaluation and stewardship.
While these two objectives often agree in their implications for what is meant by “high quality earnings,”
they also contradict on some key issues. As Christensen, Feltham and Sabac (2005) point out “increasing
the persistent components (of earnings) and reducing the reversible components are generally desirable
for valuation, but not for contracting. Eliminating transitory components of earnings is generally
desirable for valuation, but not necessarily for contracting.”
This discussion is also important in light of the decision by standard setters to de-emphasize the
stewardship objective in favor of the valuation objective of financial reports. In particular, the joint
IASB/FASB project on the conceptual framework (2006) states that the objective of financial reporting is
to provide information to users in making resource allocation decisions. Thus, stewardship, which is
accounting for the resources entrusted to management, is no longer considered by the boards to be a
separate objective of financial accounting. Given this controversy, we start by asking CFOs of public
firms to rate the importance of earnings for various uses such as valuation, use by managers inside the
firm and for other uses posited in the literature such as in debt contracts, executive compensation
contracts, for negotiations with labor and by other current and prospective stakeholders such as
customers, suppliers, employees and for evaluating managers. Establishing these opinions early also
helps us to identify later whether subsequent answers in the survey meaningfully depend on how
executives view the role and function of earnings.
Results reported in Table 2 reveal a clear favorite: 94.7% of CFOs think that earnings are either
very important or somewhat important for investors in valuing the company (where very important is
ranked at 5 and somewhat important is ranked 4, on a scale of 1 to 5). This emphasis on the valuation
role of earnings is consistent with extant impressions from surveys of investors, analysts, and financial

10
executives, with a long line of research in capital markets (Kothari 2001), and the professed goals of
standard setters. But following closely behind is a distinct cluster of four other uses, which can be
broadly placed in the contracting/stewardship/control role of accounting; specifically we find much
support for the importance of earnings (i) for use in debt contracts (82.1%); (ii) for use by the firm’s own
managers (80%); (iii) for use in executive compensation contracts (78.7%); and (iv) for use by outsiders
in evaluating the company’s managers (62.7%).
The results also indicate that earnings are much less important for other stakeholders such as
employees (45.2%), suppliers (41.4%), customers (40.2%) and negotiating with labor (32.7%). Focusing
on qualitative answers that appeared at least thrice or more in the data, the CFOs identified the following
four other uses of earnings: (i) by government/tax authorities/regulators; (ii) for identifying M&A
opportunities; (iii) for incentive compensation; and (iv) for use by competitors. In sum, while the
valuation use of earnings dominates, there is solid support for the importance of contracting and
stewardship uses, consistent with the position adopted by several researchers (e.g., Christensen and
Demski 2003; Kothari, Ramanna and Skinner 2010) but somewhat at odds with IASB/FASB’s position.
To shed some light on these results, we asked a standard setter whether IASB/FASB’s rule-
making under-emphasizes the stewardship objective. The standard setter disagreed with this claim and
stated “what is expressed in that document is that the objective is to essentially portray or provide
information that’s useful to the providers of capital. The document notes that part of that role is buy,
hold, and sell decisions but part of it also depends on corporate governance arrangements and various
functions such as being on a board of directors and electing directors and overseeing management.”
Comments from interviewed CFOs also help in clarifying the related but distinct roles of valuation and
stewardship. One CFO mentioned in an interview: “most people who are looking at our public reports or
listening to our calls have a model that they’re trying to update, or they have a model about how they
want to value the company. So from that perspective, most of our energy related to earnings reports is
targeted at investors.” Another interviewed CFO suggested that “both the valuation and stewardship

11
motives are important. People are very aware of our financials and how it affects share price and
stockholders. So we are very aware of the fact that how and what we communicate has to be absolutely
clear and a fair view of our business so that stakeholders interpret it the right way. And then secondarily,
and equally important, is accountability. The divisions are broken up based off of the presidents who are
then held accountable for their revenue numbers as well, so that financial reporting is absolutely key in
order to make sure that compensation is aligned with those numbers. And there is a lot that goes in to
making sure that the numbers that we report are aligned with how we compensate.”
One surprise in the answers to this question is the high ranking of using published earnings by the
firm’s own management, which we initially thought would not be the case given existing arguments that
managers have access to more fine-grained information beyond earnings. One interviewed CFO
suggested a tight link between internal and external reporting: “because we are always very cognizant of
what was told to the Street, and we know that the Street is constantly watching our earnings, so the best
thing to do is to have the exact same numbers that were received in the Street as we have internally, at
least the top and bottom line numbers. We make sure that everything that we have underneath –
underneath in terms of the detailed reporting – also rolls up basically to the same story that we’ve told
externally. All of our reporting hangs together, so it’s not disconnected.” Others suggest that
performance inside the firm is tracked via reported earnings and compensation decisions also depend on
earnings: “earnings is certainly the basis of our assessing our own performance, and our board, we had a
little grid to determine what is our return on equity and that was driven by the earnings figure as per
GAAP.”
We do not tabulate, but merely discuss, conditional averages of the answers reported in Table 2
(and to the other survey questions) to conserve space. When we add private firms to the sample, CFOs of
public firms rate several uses of earnings to be uniformly higher than CFOs of private firms. However,
the usage of reported earnings is very high among private firms. Internal use of earnings, debt contracts,
valuation and executive compensation are the more important ways in which earnings is used by private

12
firms. Executives, whose pay depends more on incentives, are less like to use earnings for internal
purposes. The other demographic variables do not seem to be all that important in discriminating the
usage of reported earnings.
3.2 Earnings quality
3.2.1 Qualitative evidence
Despite widespread use of the term “earnings quality” in both the academic and practitioner
literature, there is no consensus on its definition and meaning. Most of the extant literature agrees that the
notion of earnings quality is context-specific and hence offering a general definition of earnings quality is
difficult (e.g., Dechow et al. (2009), Melumad and Nissim (2009)). High-quality earnings have been
defined/measured in the literature as those that:
(i) are persistent and hence the best predictor of future long-run sustainable earnings, e.g., Penman and Zhang (2002), Dechow and Schrand (2004) and Melumad and Nissim (2009).
(ii) are smooth and hence not variable over time, e.g., Francis et al. (2004) and Dechow and Schrand (2004);
(iii) predict future earnings better, e.g., Schipper and Vincent (2003); (iv) do not have special or non-recurring items, e.g., Dechow and Schrand (2004), McVay (2006); (v) are derived under conservative accounting rules or the conservative application of relevant rules
(Watts 2003a, 2003b); (vi) are backed by past, present, or future cash flows, e.g., Sloan (1996), Dechow and Dichev (2002); (vii) have smaller changes in total accruals that are not linked to fundamentals, e.g., DeAngelo (1996),
Jones (1991), Dechow et al. (1995), Kothari et al. (2005).
Note that the above definitions overlap somewhat. For instance, because special items have
lower persistence, absence of special items implies higher persistence. Another issue that often comes up
in the literature is the low empirical correlations among these several measures of earnings quality
(Bowen et al. 2002, Dechow et al. 2009). It is also unclear whether these low correlations indicate noise
in the measures of earnings quality or more fundamental differences in the underlying notions of earnings
quality. In particular, there is little guidance in the literature on (1) the relative importance of earnings
quality attributes; and (2) whether there are specific contexts in which one attribute is more important
than the other; and (3) what trade-offs CFOs weigh while deciding to choose one attribute over the other.

13
We ask CFOs to provide answers to these questions, starting with an open-ended qualitative question
what the term “high quality earnings” means to them.
We collected about 320 responses to this qualitative question (from public and private firms),
which are organized and ranked on their relative frequency in Panel A of Table 3; Panel B includes direct
quotes from participants which illustrate the findings. The most dominant and common idea of earnings
quality relates to earnings that are sustainable, repeatable, recurring, consistent, reflecting long-term
trends, and/or have the highest chance of being repeated in future periods. The second most common
theme relates to earnings that are free from special or one-time items, earnings that are not drawn from
reserves, fair value adjustments, accounting gimmicks, market fluctuations, gains/losses, fluctuations in
effective tax rates, and/or foreign-currency adjustments; this is essentially the converse of “sustainable”
above. The third most common theme relates to earnings that are backed by cash flows. We also see
many combinations and permutations of these three themes. Two other ideas are moderately common,
the first that earnings quality results from consistent and accurate application of GAAP; the other one is
that quality earnings come from core operations or from normal margin on regular expenses and revenues
(which is essentially a variation on the sustainable idea above). Summing up, the qualitative answers
suggest that high quality earnings are sustainable and repeatable, free of one-time items, and backed by
actual cash flows.
3.3 Rank ordering empirical proxies of earnings quality
To get a sense for how preparers view the academic operationalization of earnings quality, we
asked public firms’ CFOs to rank the importance of commonly-used proxies. The most popular choice,
as reported in Table 4, is that high quality earnings reflect consistent reporting choices over time (94%
strongly or weakly agree) followed by avoid long-term estimates as much as possible (86.4%). The
choices that were the next most popular are (i) earnings that are sustainable (80.5%); (ii) earnings that
predict future earnings (78.6%) or future cash flows (75.7%); (iii) accruals that are eventually realized as
cash flows (75.7%); (iv) earnings that do not include one-time items (71.4%) and require fewer

14
explanations in company communications (69.2%). Interestingly, several of these dominant answers
(consistent reporting choices, earnings without long-term estimates, sustainable earnings and earnings that
require fewer explanations) are relatively under-researched and perhaps deserve more academic attention.
Characteristics that are somewhat less popular but still pass the majority opinion test include
unconditional conservatism and conditional conservatism (59.3% and 49.7% respectively).
Characteristics not viewed as important include earnings with fewer accruals (20.8%) and earnings that
are smoother than cash flows (40.2%). We turn next to a discussion of untabulated conditional averages.
All unconditional averages reported in the paper are based on CFOs of public firms, except when
comparing the responses of public firms to private firms. The data reveal that CFOs of larger firms
(higher sales) rank consistent reporting choices, sustainability and accruals realized as cash flows as more
important than CFOs of smaller firms. CFOs of older firms and those with an MBA rank prediction of
future earnings as more important attribute than CFOs of younger firms and those without an MBA.
Older executives are more in favor of unconditional conservatism but less in favor of accruals realized as
cash and consistent reporting choices. CFOs of firms with greater exposure to a lawsuit rank earnings
with fewer long term estimates and with fewer accruals as more important than CFOs of firms that are
less likely to be sued. CFOs of firms with many business segments rank predictability of future earnings
and less volatile earnings as more important. An interesting non-result is the absence of differences in the
responses of the CFOs of public and private companies.4
4 Dechow, Schrand and Ge (2010) suggest that there is no one uniformly accepted proxy for earnings quality for all decision contexts. To address this issue, we considered the answers of 138 participants of public firms that ranked the use of earnings in debt contracts as a “4” or a “5.” We found that these participants ranked the same three ideas (consistent reporting choices, long term estimates and sustainable earnings) as important relative to the average participant.

15
3.4 Interview evidence
3.4.1 Consistent reporting choices
A CFO suggested that high quality earnings involve consistency in many of the detailed reporting
choices that firms make on a regular basis: “every quarter you're making many of these choices but they
were not observable ones like a switch from LIFO to FIFO. For instance, in deciding whether to
designate earnings abroad as “re-investable” or not, I could assume that my Philippines earnings are
invested one way in one quarter and they're not in the next quarter because it suits my purposes. And
another one is whether an asset is available-for-sale. It could be something that's pretty subtle. If a guy
walked in and offered me the right price, of course, I would sell it. Am I marketing it? No. Do I hope that
somebody offers me a good price for it? Yes.”
3.4.2 Long term estimates
An interviewed CFO in the oil and gas business cites an example of how long term estimates can
lead to low earnings quality. In particular, he cites the case of long-term energy contracts for they “are
required to do mark-to-market accounting. There is a constant concern about using forward curves to
value the contracts, especially given the diminishing liquidity in that forward market. We used model
curves a lot 20-30 years out although the market for electricity is not very liquid for durations beyond
three or four years.” Moreover, the mark-to-market estimates come from the traders and “you're one step
removed from being able to second-guess and dig down because your traders come back and say well this
is how it should be marked and it's very hard to argue with them about that.”
We asked a CFO to comment on the conflict posed by the idea that accounting is full of estimates
and some estimates are unavoidably unreliable. The CFO mentioned: “in dealing with long-term
estimates it is important to make sure that people have clarity on the underlying assumptions of how the
estimate was derived. For instance, we really try to provide people with the basis on which you made our
assumptions underlying pension calculations. So if they want to disagree, say if they don't think it’s an

16
8% growth rate and if they think it's a 5%, then they can recalculate it themselves and adjust their model
accordingly.”
3.4.3 Sustainable earnings
Several interviewed CFOs stressed the importance of sustainable earnings. To quote one
example: “I would've said you are reporting earnings in a way that is consistent with the long-run view of
the profitability of the company. That you're not trying to essentially grab earnings from the future and
drag them in to make it look better, nor are you trying to push earnings out into the future but you
somehow reflect the underlying economics of the long-run value of this bundle of net assets that is the
firm.” Another CFO opined: “my view in terms of high-quality earnings, are earnings where you see
sustainable revenue growth and you can see a bottom-line that is well-managed. So well-managed
operating expenses, given where the company is in its life cycle. You have some sustainable companies
that are one shot wonders that could end up having an issue over time e.g., Facebook. I don’t actually
think that their revenues are sustainable personally when I look at their industry. So I don’t think they
have quality earnings.” Another CFO distinguished sustainable earnings from persistent earnings by
pointing out that “persistence is more backward-looking, and sustainability is more forward-looking.”
3.4.4 Predictability
To CFOs, the notions of transparency and predictability seem intertwined. One CFO opined:
“one of the real big elements in this is transparency and predictability. Can investors anticipate what’s
going to happen? And not that they have to have a perfect forecast because there are the moving parts of
the business but are the value drivers of the business understandable? ” Another CFO suggests that one
can “almost hit all the previous items, but if investors don’t have a comfortable idea about how those
profits are being made, then it does put the stock price at a big risk. It is hard to really be considered a
quality earnings company if investors don’t really have the ability to explain the company to others. If
you can’t make your business model more transparent, then there is always going to be that suspicion or
that fear that the company may be the next Enron or that things may blow up.”

17
3.4.5 Accruals reflected as cash flows
One CFO pointed out that that over the long term, if earnings and cash flows are not highly linked
and if he were to consistently report a big gap between these two measures, then the market would start to
wonder what is going on, unless the firm is in a huge growth phase. If the gap between earnings and cash
flows is persistently high, then this CFO expects a significant discount in the firm’s stock price because
ultimately if the cash is not being generated, then the earnings are artificial or are not a good indicator of
value creation. Another CEO echoed the same sentiment saying “I think if earnings are not backed by
actual cash flows, except for the very short term, then they are not good earnings.”
3.4.6 One-time items
A CFO comments that as long as the item is only a one-time event, it may not catch up with the
company. “Now when you do one-time items, I will admit that at least in the short-term, the analysts
look past them. But it is sometimes almost too easy to do one-time write-downs. It can become a habit
and that’s when they impact the company’s reputation for quality earnings. If for every acquisition you
do, you’re going to come back two years later with a write-down of 10% then I’m going to start factoring
that in when I hear you do another acquisition. It is the persistent abusers, where things that are stretched
too often that get questioned and lose credibility…so you’re spending your bank account of credibility
when you do one-time items. You’ve got to make sure that those truly are one time and that they’re
material enough that it makes sense to try to exclude them.” Several CFOs underscored the importance of
disclosure to clarify the nature of these one time or non-recurring items. One CFO cited the example of a
FIN 48 reversal which he said he would disclose, talk about and work through the item transparently so
that the investor can then attempt to go back and determine a consistent earnings stream.
3.4.7 Fewer explanations
A CFO opined that “high-quality earnings are earnings that you don’t have to go back in and do a
lot of adjustments and clarify what those adjustments mean. Quality earnings are earnings (i) where you
have had no restatements; and (ii) that people are not surprised with.” Several CFOs complained that

18
over time GAAP has progressed and transitioned in so many ways that it creates earnings volatility that
now requires him to spend a lot more time with investors trying to explain what causes an infrequent gain
or an infrequent loss. He is concerned that he has to spend a considerable amount of time explaining to
investors about undoing these FASB imposed one-time items so that they can better appreciate the core
earnings number for the firm; or alternatively, providing the investor with realistic earnings in terms of
what they can expect on a normalized go-forward basis. Although the FASB might think that these new
rules result in high quality GAAP, in reality, the CFO focuses more on high quality earnings going
forward that should help the Street understand what the company is achieving and where it might be
going.
3.4.8 Conservative accounting
The two interviewed CFOs who had picked conservative accounting as their top choice shared
certain unique characteristics, relative to the other interviewees. One of the CFOs worked for a major
bank and he explained his choice as a natural response to the impending regulation of the financial
industry after the credit crisis of 2008. The other CFO had been appointed recently after the company had
to report an earnings restatement. This CFO reported that they had gone from being aggressive before the
earnings restatement to being ultra-conservative five years after the restatement. He expressed frustration
that his audit committee preferred to err on the side of conservatism because they never wanted to be hit
by the auditors and the SEC again. This CFO frets that although they will not have a restatement in the
near future, they instead have understatements of earnings and assets, although the exact amount of the
understatement is a matter of judgment that is difficult to objectively verify. Another CFO pointed out
that conservative accounting can be abused by setting up cookie jar reserves especially because auditors
do not look as closely at under-statement of earnings and assets relative to over-statements. He narrated
an incident at a major money center bank, “ who had taken down their loan loss expense 70% year-over-
year in their second quarter of 2010, even though their loan loss experience had actually only improved
marginally. During the downturn this bank had taken the opportunity to set up a substantial amount of

19
reserves, and now that they feel the credit quality issue is behind them, they’re going to try to reap the
benefits of it.”
A CFO, whose second pick was conservative accounting, had been a credit officer at a major
bank before becoming the CFO had an interesting take on conservative accounting. He mentioned that he
was a “you cannot know the future” kind of guy.5 Because of his background as a former credit officer,
he maintains that “you can do the analysis of historical cash flows you want but you get paid on
tomorrow’s cash flow. At the end of the day, it is a leap of faith. Conservative accounting is the way to
go because you have less of a worry when the market turns against you. You are better insulated against
the unknown.”
Several CFOs mentioned that the expected effect of conservative accounting on their stock price
is subtle. On the one hand, investors that probe the kind of assumptions that the firm uses with respect to
liabilities, pension obligations, or other such estimates are likely to feel reassured by the choice of
conservative accounting, because this strategy would increase credibility as results would not be stretched
to the limit from an accounting perspective. However, the difficulty lies in credibly communicating the
exact extent to which the firm is conservative in its accounting. The fear is that if most other firms are not
being conservative, then following a conservative accounting policy would result in a discount on their
stock price. On a related point, another CFO highlighted the complementary role of voluntary disclosure
if the firm follows conservative accounting policies. In his words, “for investors to understand really how
conservative you are, they need enough disclosure. Otherwise, they would undervalue our company as if
they cannot distinguish poor earnings from conservative earnings.” This hesitation might explain the
modest popularity of conditional and unconditionally conservative accounting policies in the survey data.
One CFO lamented that the move to a fair value regime by the FASB made the application of
conservative accounting difficult. Another CFO challenged the notion that the FASB’s accounting rules 5 As an aside, this finding highlights the need in the literature to understand the influence of the background and managerial style of senior managers, usually CFOs or CEOs, on reporting policies. Of course, it is important to disentangle whether CEOs influence firms’ policies or whether a firm’s policy influences the choice of who to hire as a CEO.

20
are mostly always conservative. He was thinking of the FASB’s interpretation of FAS 5 as applied to the
banking industry. Up until 1996, banks as an industry would reserve for the inherent losses that were
built into their loan portfolios. In 1996, FASB took a very strong stand against bank regulators and
against banks by ruling that banks can only reserve when losses have actually occurred, not when they are
embedded in the loan portfolio. A bank’s portfolio of assets and liabilities is essentially made up of
financial instruments, and some of those financial instruments have inherent losses built into them.
Hence, failing to recognize these losses in a timely manner, in this executive’s opinion, was partly
responsible for lax lending practices during the mortgage boom. If not for FASB’s position, banks would
have been forced to start reserving for bad loans once they started putting them on their books.
3.4.9 Smooth earnings
A CFO remarked that smooth earnings start to raise the specter of General Electric, which he
thought was the ultimate case study for managing earnings via artificial smoothing. One CFO mentioned
that when they discuss the quality of earnings with their audit committee, they do not worry as much
about “smooth or predictable earnings, because that’s not the real world.” Along similar lines, another
CFO remarks: “If you go to smoothing earnings, I always compare that to getting to be on cocaine – once
you do it you’re hooked, and how do you get off of it? You know, you get off that treadmill, because one
quarter something doesn’t work the way you thought it was going to work, and you’ve suddenly got to
smooth it out, have to make some really big but acceptable adjustments. Now you’re on a track where
you’ve got some really big problems on what you do next to get out of that situation, going forward.”
One of the CFOs mentioned that he had been a CFO for a long time and although historically,
consistent and smooth would have been indications of a very well-run company, with the new accounting
rules, especially with fair value accounting, these ideas are no longer relevant. In many cases “one can
follow the accounting rules to a T and in doing so the volatility blows up.” Another CFO argues that
smoothed earnings cannot be high quality earnings because one may be in an industry that is truly cyclical
where earnings do go up and down. A different CFO had an interesting take on smooth as opposed to

21
predictable earnings, which he prefers. He clarifies “to use statistical terms, you can have two companies
that both have strong correlation say to the economy, but they could have different coefficients, which
relates to how sensitive the company is to economy wide volatility. And so I think it’s important for
companies to be able to communicate the difference between those two. Our company, for example, is
very sensitive to the economy, but the volatility of earnings around that sensitivity is perhaps less than
other companies in the industry. So there is a differentiation between the regression goodness of fit and
the coefficient that shows how extreme the ranges are.”
3.4.10 Other comments: investor confidence
We asked a CFO what needs to happen for the investors to believe that he/she is reporting high
quality earnings? The CFO stated: “you actually have to “componentize” all of the pieces of your
earnings and your cash flow, and identify markers that people can measure you against and look at and
say "they're on track, they're doing better than what they thought, or they're doing worse than what they
thought." So, the year-end results we'll issue in February will break down earnings into four component
buckets, three of which are nonrecurring. We are going to try to give them some milestones. They can
make their own determination as to whether we are on or not on track, and then try to show them that the
core business is still going strong, irrespective of all of the noise elsewhere. It is also really important to
ensure that if we do label something as transitory, then it actually turns out to be a transitory item. If a
transitory item all of a sudden becomes recurring then we are going to take an earnings hit unless we have
got some great explanations as to why, because investors will feel like they've been duped and that’s not a
good thing.”
3.4.11 Other comments: the importance of balance sheet quality and leverage
One CFO emphasizes the related importance of balance sheet quality. He looks for what he calls
“a fortress balance sheet.” He goes on “to me, the quality of your earnings is directly related to the
quality of your balance sheet. That is, we need to assess the quality of assumptions underlying the
estimates on the balance sheet. Even cash can be a problem if not properly audited, as found in the Italian

22
company, Parmalat.”6 Illustrating his point in the context of a financial institution, he points out “for
instance, in securitization, we know that several of these claims are not traded and banks use their own
models to value the residual interest retained by the bank. One can look at what percentage of the balance
sheet is made up of high risk residuals. The FDIC thinks that if more than 25% of equity is composed of
high risk residuals, then that bank is risky. An analyst can use a similar ratio to assess the quality of the
bank’s balance sheet. That would reduce the quality of earnings because they are taking too much risk
and that will come back to haunt them later.”
Another CFO cautions that “even if you have all the things we mentioned, if the entity is over-
leveraged, it affects earnings quality. Even if earnings are reported under conservative assumptions, if the
balance sheet is over-leveraged, we do have event risk in the future. You woke up one Monday morning,
you work at Union Carbide and the Bhopal plant exploded. You have an event that deteriorates asset
quality but the debt never goes away. Leverage is wonderful on the way up and it is painful on the way
down. That goes for individuals and for companies and countries.”
4.0 Determinants of earnings quality
4.1 Is managerial discretion in reported earnings used to convey private information or to bias financial
reporting?
A long standing debate is whether managerial discretion over reporting improves capital
allocation because managers use discretion to convey private information to investors (e.g., Healy and
Palepu 1993, Christie and Zimmerman 1994, Bowen et al., 2009) or whether discretion decreases
efficiency because managers bias financial reports for private gains. Theory (Dye and Verrecchia 1995,
Fischer and Verrecchia 2000 and Stocken and Verrecchia 2004) predicts that managers use discretion
sometimes to convey information and sometimes they choose methods that intentionally increase the
6 The Parmalat scandal, unearthed in 2004, refers to a fake letter purportedly from Bank of America, in which the bank confirmed that Bonlat, a Parmalat subsidiary based in the Cayman Islands, had deposits of close to €4 billion ($5.5 billion) with the bank.

23
noise in financial reports. On the empirical side, there are examples in the literature showing earnings
management around a specific event can benefit the firm or the manager in the short run (Teoh et al.
1998). A common objection to opportunism, though, is that it can hurt a firm’s reputation and cost of
capital in the long run, as predicted by adverse selection models. Is this objection valid? Then, why do
certain CFOs attempt opportunistic earnings management? In sum, there is conflicting theory and
evidence about the circumstances in which managers use or abuse accounting discretion, and therefore we
ask CFOs to shed some light on these topics.
Evidence about this point also informs another long-standing debate related to whether
accounting standard-setters should incorporate more or less discretion in financial reporting rules. One
school of thought advocates allowing managers discretion to appropriately fit the accounting to their
disparate firm and business models, where the result is better quality accounting and earnings. A
dissenting view favors narrower and more prescriptive accounting rules to eliminate managerial
distortions, which can grow to outright manipulation. An often cited example here is Enron’s use of
mark-to-market accounting for long-term energy contracts to front-load revenue and earnings (Benston
and Hartgraves 2002). We ask a series of survey questions and provide interview evidence to address
these open issues.
4.2 Determinants of earnings quality
A consistent theme in research is that earnings quality is affected by two types of factors. One is
related to innate and exogenous factors like industry membership and economy-wide forces, and there is
little that business and society can do except understand and acknowledge them. For example, the rise in
R&D-type activities suggests volatile earnings because the outcomes of such activities are inherently
more volatile and less predictable (Kothari, Laguerre, and Leone 2002). There are, however, a whole host
of controllable factors that can influence the quality of earnings, starting with the internal workings of the
firm and extending to various voluntary and imposed mechanisms at the industry, profession, and societal
level.

24
We begin by providing evidence on the relative importance of a number of factors that have been
hypothesized to drive earnings quality. The survey evidence, reported in Table 5, indicates that by far the
most popular choice among CFOs was the firm’s business model (74% thought that its influence was high
or slightly less than high) followed by accounting standards (60.4%). The other three determinants that
pass the threshold of majority opinion were the company’s industry (56.8%), macro-economic conditions
(55%) and the firm’s internal controls (50%). In the middle of the pack were the board of directors (48%),
reporting choices (43.2%) and the operating cycle (40.2%). The contributions of the following variables
is a statistical tie: audit committee (40.2% say highly influenced v/s 33.1% say not influenced), disclosure
policy (39.1% v/s 32%), the analysts following the firm (38.7% v/s 35.7%), and the external auditor (37.9%
v/s 29.6%). The least popular choices were the SEC’s enforcement process (29.8%), and the prospect of
litigation (22.6%).
The key results appear to be the following. A substantial portion of earnings equality is beyond
the immediate control of the CFO in that it is driven by the industry the firm operates in, accounting
standards set by the FASB, the firm’s chosen business model and the operating cycle. Among the more
discretionary choices that the manager can influence include the set of internal controls, the board, the
nature of reporting and disclosure choices. The impact of the audit committee on earnings quality appears
to be smaller than that of the board. The SEC’s enforcement process also does not appear to affect
earnings quality much. Interestingly, although a lot of effort is expended by researchers on trying on
model innate earnings quality that is beyond the control of the manager (e.g., Francis et al. 2005), we
have seldom observed explicit controls in those regressions for several factors identified here such as
macro-economic conditions, variations in the firm’s business model relative to other firms in the industry
and the accounting standards affecting the company relative to other companies.
Turning to untabulated conditional averages, the CFOs of public firms rank most drivers of
earnings quality to be more important than CFOs of private firms. Similarly, CFOs of larger firms rank
most drivers as more important than those of smaller firms. CFOs, with a public accounting background,

25
rank the contribution of the audit committee to earnings quality to be more important relative to other
CFOs. Risk-averse CFOs rank the contribution of the board and audit committee to be more important
relative to risk-tolerant CFOs.
4.3 How much of earnings quality is innate?
Another important question, that is perhaps unanswerable via archival research, is the extent of
the earnings quality that is innate versus the portion that is discretionary or controllable by the manager.
To get a sense for this proportion, we asked CFOs on a scale of 0 (“no influence of innate factors”) to 100
(“earnings completely determined by innate factors”), “to what extent do innate factors influence earnings
quality at your company? (where innate factors refer to factors beyond managerial control such as your
industry or macro-economic conditions).” The mean and median answer to this question was about 50%
in Table 6. Thus, it appears that half the earnings quality of the average firm is beyond the immediate
control of the manager. Untabulated results indicate that CFOs of low P/E firms believe that a higher
portion of their earnings quality is innate relative to CFOs of high P/E firms (51.7% v/s 36.1%). CFOs,
with an investment banking background, believe a substantial portion of earnings quality is innate relative
to other CFOs (75% vs. 44.7%).
4.4 Interview evidence on determinants of earnings quality
Most interviewed CFOs thought that it was their job to produce high quality earnings. One CFO
elaborated “the majority of the responsibility, or at least the communication, the presentation, of high
quality earnings is the CFO’s. And then ultimately, behind that, is the operational generation of those
earnings, which is the business model, which would be more the CEO and COO. It’s hard to have one
without the other, but I think they are two distinct issues. One: is the business inherently high quality, in
the way the business model converts revenue to cash and earnings? And the other: is the accounting
doing the best job it can around clarity, communication, and predictability and visibility?”
Another CFO thought that the way the accounting standards are implemented, more than the
standards themselves are important: “it’s really what you make of those standards more than the standards

26
themselves keeping you from having high quality earnings.” A CFO thought that the key determinants of
earnings quality are “good management culture, well-staffed internal accounting function, an audit group
that knows what it is doing.” Referring to auditors and audit committees, one CFO remarked “there are
some differences across audit firms, and certainly partners assigned to accounts, so that relationship of a
company to its audit firm is an important one, and the audit firm has to strike the right balance between
trying to be 100% strict and also making sure it is not in bed with management.”
Another CFO emphasized the importance of the internal accounting group: “the quality and
experience of people in the internal accounting department is very important to me. You need people
who have been through a few recessions so that they know that bad things do happen to good people.
And, then you don’t want inexperienced people there. You want solid technicians so that you have
control but then you also want people who have a good worldview on what can happen so that when they
are asked a question about the accounting treatment, they take into account the fact that the future is
uncertain. All these little individual decisions add up and go up to determine the quality of earnings and
the balance sheet.”
When asked about the relatively lower rank that audit committees receive in our survey results, a
CFO suggested that “I know our controller was more aggressive than I would have liked him to be. The
audit committee isn't going to catch that. What they're going to do is basically set the general tone. I
think you can fool them, but what the audit committee is essentially going to ask whether the CEO and
controller are basically honest people who are going to report faithfully. That's about all they can do at
the end of the day. They can ask some intelligent questions and my guess is that a well-functioning audit
committee is going to keep the big collapse from happening. But I don't think they can do much about the
small variations in earnings quality.”
Turning to the role of the external auditor, a CFO suggested that a good external auditor and a
well-functioning audit committee were complements not substitutes: “let's suppose I'm Enron and my aim
is to basically to corrupt the whole process from the start. Well, I guess it's evident that they could move

27
Anderson around and sort of make them do whatever they wanted them to do. But I guess for us in the
context of a very well-run board and organization, Anderson was a pretty useful tool in explaining what
our choices were. For instance we did some leasing transactions and I would routinely ask the question,
you know this is both an IRS and GAAP issue, and I'm willing to take on some risk, but I'm not willing to
be near the edge of the envelope. So when you look at this, can you tell me how near the edge of the
envelope I am? And then I can have an intelligent conversation with them and they would say well, I
have seven clients who are also doing this same thing, and I think you're fine, or they could say no,
nobody's doing this and I think you'd be the only one.” This passage also suggests that reporting
practices, both desirable and otherwise, perhaps diffuse across firms via external auditors.
When asked about the relatively high importance of boards in affecting earnings quality, one
CFO says: “Boards are becoming very influential in the last five years, and they are constantly
scrutinizing the earnings on a regular basis, and they truly do try to measure how our management team is
doing.” We discuss the issue of misrepresenting earnings in section 6. Next, we turn to the role of
standard setters in affecting earnings quality.
5.0 The impact of standard setters on earnings quality
As indicated in Table 5, standard setters have a first-order impact on the earnings quality reported
by individual firms. Hence, it is important to understand the role played by such rule-making bodies,
especially in specifying the extent of reporting discretion delegated to CFOs relative to the prescriptive
directives mandated by the standard setters. To begin to do so, we ask a series of survey questions on this
topic and supplement it with interview evidence.
5.1 The extent of reporting discretion
We begin with the following survey question: “How much discretion in financial reporting does
the current accounting standard-setting regime in the United States allow?” We ask CFOs to pick a point
along the continuum anchored by the following points: -10 for “too little discretion,” 0 for “about right”

28
and 10 for “too much discretion.” The mean and median answer are close to -1 in Table 7a, suggesting
that most CFOs think that the extent of reporting discretion is slightly below that they consider “right.”
As might be expected, public firms feel there is less discretion relative to private firms. CFOs of firms
with greater sales growth, executives with greater incentive based pay, firms with low foreign sales feel
they have less discretion relative to their counterparts.
To provide an inter-temporal perspective on the extent of reporting discretion, we ask “Relative
to 20 years ago, indicate the extent to which you believe companies have more or less discretion in
financial reporting.” Survey evidence likely has distinct advantages here as questions related to the
curtailment of reporting discretion are hard to get at with archival data because of the pervasive
entanglement of economic and accounting changes through time. Similar to the previous question,
answers are reported on a scale of -10 for “too little discretion” to +10 for “too much discretion.” The
mean (median) answer to this question is -4.22 (-5) in Table 7b clearly suggesting that CFOs think that
reporting discretion has been substantially curtailed over time. Note, however, that the combination of
the last two answers indicates that much of this curtailment has had a positive role as the current reporting
discretion is not far from optimal. The following (untabulated) categories of CFOs feel that discretion has
been curtailed over time relative to their counterparts: (i) public firms; (ii) high P/E firms; (iii) executives
with greater incentive based pay; and (iv) low foreign sales.
All the interviewed CFOs thought that they had far less discretion in financial reporting relative
to when they started their careers. One CFO set up the discussion nicely saying “I think you can either
have absolutely strict accounting that is 100% consistent but 80% useless, or you can have more flexible
accounting that has more risk of misinterpretation or distortion, but hopefully gives a better idea of the
vitality of the different business types. I think that’s a little bit of the balance in all of this, that the
regulators I think even struggle with and frankly, CFOs wrestle with also.” A similar ambivalence was
echoed by one CFO who thought that FASB regulation “in some cases it’s tightened up a few slack areas.

29
However, there are many other cases where there are pronouncements that just don’t match the business
aspects of whatever it is that’s being done and that becomes a real problem.”
As a final question with respect to discretion and the possible limitations of mandated standards,
we ask “to what extent have you found that written accounting standards limit you in your ability to report
high quality earnings?” Answers are recorded on a scale of 0 for “not at all limited” to 100 for “very
limited.” The mean (median) answer to question is 35.57 (31) in Table 7c, suggesting that most CFOs
feel moderately constrained by codified GAAP in their ability to report better quality earnings. There is
not much cross-sectional variation in this response. Summing up, CFOs feel that today they have
considerably less reporting discretion as compared to a generation ago. Some of this curtailment has
served a positive role but on balance executives feel that present standards somewhat constrain their
ability to report high quality earnings.
5.2 What kind of accounting produces quality earnings?
As mentioned above, we view the quality of earnings as arising from two types of factors, one
largely non-controllable and one controllable. In addition, some of the controllable factors fall beyond
the scope of accounting per se. There is little doubt that corporate governance affects managerial
incentives and thus the quality of earnings. However, corporate governance is shaped by forces that go
way beyond accounting. We are especially interested in the factors that fit more narrowly within the
established accounting function and are largely left within the range of competency and discretion of the
accounting profession. Specifically, we are interested in what kind of accounting practices produces
higher quality earnings.
A long-standing controversy is whether accounting should follow an “income-statement” or a
“balance-sheet” orientation. The income statement orientation views the firm as an ongoing stream of
operating bets designed to bring in revenues and, ultimately, earnings, and equity value is derived from
this ongoing stream of earnings. Since the slicing of company life into reporting periods often artificially
separates the business connection between operating receipts and expenditures, an important function of

30
accounting is to properly emulate this business connection by “matching” them, i.e., using accruals to
adjust the recognition of the logically connected operating receipts and expenditures in the same time
period. For example, actual cash outlays for auto workers’ pensions occur years after their productive
input; however, accounting recognizes that these future cash outlays are logically a cost of cars produced
today, and therefore estimates and accrues a pension cost component of the cost of cars sold today. Thus,
the income statement perspective views earnings as mostly the result of revenues minus properly matched
expenses, and the quality of earnings depends on the quality of this matching. The income statement
perspective was historically prominent until the early 1980s (Paton and Littleton 1940), and still has
strong support, especially in the investment community.
In contrast, the balance sheet perspective views the firm as a collection of assets and liabilities,
and the operations of the company as a continuous and dynamic creation and destruction of new assets
and liabilities. Equity value, as per the balance sheet view, is simply the difference between properly
determined assets and liabilities and earnings for a given period is the change in equity, which is equal to
the change in net assets over time. Thus, the balance sheet perspective is primarily interested in the
valuation of assets and liabilities, and quality earnings can be thought of as the result of the quality
valuation of net assets. The logic of the balance sheet perspective is especially clear for financial assets,
and since market-based prices often provide a clear benchmark for value for such assets, there has been an
increasing push for “fair value” accounting. Driven by conceptual considerations, accounting standard
setters have been the biggest proponents of the balance sheet model and fair value accounting, and
through their influence, these features dominate recent accounting rules (Storey and Storey 1998).
The history and substance of these two perspectives, though, is too long and arcane to address in
questions to financial executives and analysts, so we take a two-pronged approach. First, we directly and
indirectly ask what can be done to improve accounting. Second, we ask respondents about a list of
features, attributes and comparisons that are valuable in their own right but can be also used to infer
underlying opinions about the more theoretical constructs discussed above.
5.3 Specific policies that affect earnings quality

31
We asked two questions to get a more granular sense for which specific policies practiced by the
FASB affect earnings quality. In the first of these two questions, we ask CFOs to rate the extent to which
they agree with the statements listed in Table 8 about GAAP policies that are likely to produce “high
quality earnings.” The most popular answer by far was the reliance on matching (92.2% of respondents
strongly or weakly agree) followed by conservative accounting principles (75.4%). Respondents also
emphasize the need to reduce long term projections and revaluations (65.3%).7 The unpopularity of
revaluations and long term projections is consistent with the lack of enthusiasm for fair value accounting
principles. There was a statistical tie between those who agreed and disagreed on policies that rely on fair
value accounting as much as possible (38.1% v/s 39.9%) or for policies that reduce earnings volatility
(41.3% v/s 35.3%). However, CFOs were not in favor of historical cost based policies (40.7%) either,
perhaps pointing to support for the currently used hybrid model of accounting. There is relatively more
support for using fair value only for financial assets and liabilities, as opposed to operating assets and
liabilities (53.6%). The key message here is the overwhelming popularity of the matching principle and
conservative accounting and the tepid support for fair value accounting.8 These views run counter to the
FASB’s official position against matching and conservative accounting, and in favor of fair value
accounting. This is perhaps our clearest and strongest finding of sharp dissonance between the views of
standard setters and the most important producers of financial reports.
Turning to untabulated conditional averages, firms whose earnings volatility is greater than those
of their peers prefer policies that minimize reliance on long term projections and revaluations, which are
inherently more volatile in nature. The more experienced CFOs dislike policies that rely on fair value
accounting for financial claims alone but prefer policies that (i) minimize the use of long term projections;
7 82.03% of respondents who rated “conservative accounting” (both unconditional and conditional) highly in Table 4 as an attribute of high quality earnings also support the idea that the FASB should promulgate conservative accounting policies. 8To verify whether CFOs from financial industries prefer fair value accounting relative to those from other industries, we compared the percentage of CFOs from finance who ranked fair value accounting as a “4” or a “5” relative to those from other industries. However, we could not detect statistically significant differences in these responses.

32
(ii) minimize earnings volatility; and (iii) policies that rely on historical cost accounting as much as
possible. Executives, whose pay is more incentive based, are averse to fair value accounting. CFOs
without a public accounting background prefer policies that minimize long term projections and
revaluations.
5.4 Interview evidence
We begin with CFO views on matching and next summarize their views on the balance sheet
perspective and fair value accounting below.
5.4.1 Matching principle
Several interviewed CFOs point out the importance of the matching principle, its role in making
earnings more useful than cash flows, and question FASB’s divergence from the matching principle. In
the words of one CFO “I’m a huge proponent of matching. Because I believe the highest quality of
earnings occur when we match costs to generate that revenue.” A similar sentiment is expressed by
another CFO: “I think the matching of the revenue and the earnings streams is probably the most
important thing on the income statement. If you have balance sheet adjustments that you need to make,
they should be called out separately, below operating earnings.” Several CFOs were in favor of the
matching principle as it obviously applies to earnings but not cash flows: “I grew up with and still believe
in the matching principle, and so in my view the P&L is a proxy for the sustainability of your cash flow.”
One CFO thought that the FASB’s de-emphasis of matching has increased earnings volatility: “so from
my standpoint, the FASB has lost the concept of matching and driven a substantial amount of volatility
within earnings, and in many cases unnecessarily.” 9
9 To ensure that these answers are not overly influenced by firms in industries where matching is potentially important, we examined the proportion of respondents from industries where matching is less likely to work well. In particular, we focused on the proportion of executives in the high tech industries (software/bio technology) and the service and consulting industries who ranked matching as “4” or “5.” We find that 78% of the executives from high tech industries and 100% of those from service and consulting ranked matching as highly important.

33
5.4.2 Fair value accounting
Every CFO we spoke to laments the FASB’s de-emphasis of the income-statement perspective in
favor of the balance-sheet perspective. The following comment is quite typical: “the balance sheet has
become the big obsession, and a lot of that is because of the financial industries. I think fair value
accounting is a great snapshot if there were doubts about the going concern assumption of a business. But
in a continuing, stable environment, traditional accounting based on historical cost accounting for the
assets and balance sheet works pretty well. I do worry that we’re starting to create much more volatility
on balance sheets, as various assets get valued, whether that’s pension liabilities or financial assets. My
concern is that so much energy directed at the balance sheet is going to be hard for markets to digest. It
may be that the FASB is overreaching a bit trying to solve problems in all industries with something
that’s most important for financial companies.” Referring to the assumption that the market price is
assumed to be the correct measure of value in fair value accounting, one CFO observed “ultimately that’s
as good a measure of current value as any, but the issue of whether the assets of a company need to be
revalued almost in real-time based on market trends is another question, and I think there may be a need
for some revision in the future on how to offset that against the more stable view of a company.”
Another CFO observes that the over-emphasis on the balance sheet approach is also inconsistent
with the way the market looks at financial statements. He says “I think the market tends to focus too
much on just the income statement. The vast majority of investors I’ve dealt with are 90% plus effective
on income statement analysis, and 20-30% effective on balance sheet analysis. So it’s actually going to
be a bit of a challenge if the balance sheet begins to be the tail that’s wagging the dog, then there is
actually a pretty big learning curve I think that the market’s going to have to go through, since the
majority of investors are much more income statement oriented.”
Most CFOs were unhappy with the FASB’s unrelenting push towards more fair vale accounting.
Some of the comments include: (i) “It creates a level of volatility and change, even though nothing in the
business seems to have changed. That may be the new frontier of confusion;” (ii) “in my opinion fair
value accounting should be limited to banks and companies that have a lot of financial assets.” Another

34
CFO complained about the extensive reliance on fair values in accounting for acquisitions: “If you do an
acquisition, you need to identify all the theoretical intangible assets and assign a value to them, and then
what’s leftover goes to goodwill. This process gives leeway on what those fair values on those intangible
assets are. I guess there is huge subjectivity there.” On a similar theme related to the requirement under
FAS 141R to value segments, one CFO observed: “Well in many cases they (valuation consultants) go
out and they’ll consider 141R and they’ll break up the pieces of the business and try to do cash flow
metrics that have a number of assumptions such that even small modifications to the assumptions can
entail major changes in the overall valuation of the business.”
Citing an example of how fair value accounting contributes to unnecessary volatility in earnings,
one CFO explains, “I agree with the concept of making sure your balance sheet is fair valued almost like a
liquidation approach, not quite that far, and then everything else shakes up through the P&L. But I can
tell you from an investor standpoint, that’s just confusing. A swap marked to market that’s $10 million in
one quarter and is $500 million negative the next quarter because of a shift in the yield curve, but our
company has no intent to settle the swap till maturity. Then, is it really appropriate to blast it through
your P&L? I can tell you from my standpoint as CFO I had to spend time educating my investors,
walking through this item that I won’t call non-recurring because it’s going to continue to happen, but
what I consider more infrequent or non-core items flushing through the P&L.”
Commenting on the emphasis of fair value accounting on exit value as opposed to value-in-use in
the context of accounting for acquisitions, one CFO described the following example “We acquired a
distressed building materials company, and the company that was selling it just wanted to get out of that
asset because of the losses that the asset was generating. The way the accounting rule made me book that,
I recorded a gain at the acquisition date, and then I recorded eight consecutive quarters of massive losses
because they sold it to us cheap and because they knew it was going to lose money. The accounting rule
did not allow me to record the assets at day 1 at what we considered the true fair value.”

35
Some CFOs were unhappy with hybrid accounting that comingles historical costs and fair value:
“What I think is not good is to do it piecemeal. Banks’ assets and liabilities are essentially all financial
instruments of some sort. So I would have no problem in valuing the balance sheet in its entirety on some
regular basis. Now there is a problem of how much discretion is left in how you do that. So there are
some real tough challenges to do it but conceptually I can see if you valued the whole balance sheet on a
market basis that that might actually give you a pretty good measure of what the company is really
worth.” One CFO was more charitable towards fair value accounting: “It’s very difficult. But if you
could get past the mechanics of how to do it, conceptually fair value accounting is not a bad idea.” On
balance, several CFOs felt that fair value accounting has its place and value but it should be mostly for
financial instruments, and mostly for disclosure rather than “running fair-value changes through
earnings.”
5.5 Changes needed in policy making
Continuing on the theme of improving earnings quality, we ask CFOs the following question:
“would the following changes in standard-setting produce higher quality earnings?” The alternatives are
listed in Table 9. The most popular policy change that CFOs would like is for the standard setters to issue
fewer new rules (65.7% strongly or weakly agree) followed by a desire to see convergence of U.S. GAAP
and IFRS (59.9%). Interestingly, there is not much appetite for either an outright promulgation in favor
of IFRS (25.4%) or for allowing a choice between IFRS and GAAP (29.8%). The third popular response
is the desire to allow reporting choices to evolve from practice (53.6%), as opposed to the FASB’s top-
down approach to rule making. Somewhat contradictorily, they would like more detailed implemented
guidance (47.9%) but would also like rule makers to allow more judgment in reporting (44.4%). As
explained in the interview evidence to follow, a resolution to this apparent inconsistency is that many
CFOs view reporting as a compliance activity and they would rather get implementation guidance from
the FASB than get into debates with their auditors. There is no appetite for more emphasis on rules rather
than principles (30.7%) or for expansion of fair value accounting (23.7%). In fact, 39.6% of CFOs would

36
rather have a reduction in the extent of fair value accounting. There is a statistical tie among CFOs who
prefer rules that require more conservative reporting relative to those who do not (28.7% vs. 27.6).10 The
qualitative comments at the end of this question contained a couple of interesting recommendations for
improvement: (i) “policies that enable the ease of disclosure of cash and non-cash components of
earnings, and disclosure of recurring and non-recurring components of earnings;” and (ii) disclosures
related to the “velocity of cash moving through the cycle.”
Untabulated conditional averages that are interesting include (i) CFOs of large firms would like
fewer rules; (ii) the more senior executives are less inclined to support mandatory IFRS; (iii) younger
CFOs prefer more implementation guidance and reduction in fair value accounting whereas older
executives would prefer conservative rules; (iv) CFOs, whose pay is more incentive based, prefer a
reduction in the use of fair value accounting; (v) CFOs of firms with greater exposure to lawsuits prefer
convergence between IFRS and GAAP and more reporting rules; (vi) CFOs with an I-banking
background do not mind an expansion of fair value accounting or the issuance of new rules; (vii) CFOs
with a public accounting background are averse to convergence between GAAP and IFRS and would
prefer more detailed rules than concepts; and (viii) risk-averse CFOs would prefer more detailed
implementation guidance.
5.6 Interview evidence
5.6.1 Issue fewer rules
Several CFOs complained about (i) “rules fatigue” or the sheer number of standards issued by the
FASB every year; (ii) the difficulty they experience in keeping up with the standards; and (iii) explaining
the changes in reported earnings created by these ever-changing standards to investors. One CFO
commented that he spends a considerable time every year undoing the effect of the new standards so that
they communicate core earnings to his investors on a comparable basis relative to last year. In the
10 This tepid popularity for conservative accounting policies is not entirely inconsistent with the moderate support for conservative accounting (both unconditional and conditional) as an attribute of high quality earnings in Table 4.

37
academic literature, Benston (2003) observes that too many rules set by the FASB lead to information
overload, which inevitably results in noncompliance.
Several CFOs complained that the FASB-imposed rules have become so complex that instead of
helping the user better understand the business, they end up confusing the user even more. The following
comment is typical: “As a person that produces financial statements, what we would like is just a
consistent set of rules year after year that doesn’t change a lot, and it is up to the statement user to
understand the accounting rules. We have gotten to a point now where the rules are so complex because
we are trying to create a number that’s so accurate that the user doesn’t have to understand the accounting
rule that produced it when really the opposite is what’s occurring. The user actually has to become even
more of an expert in the accounting rules.” Another CFO complains along similar lines: “there is an
effort on the part of the FASB to try to figure out how to make the financial statements absolutely
economically precise that (FASB has) lost sight of the real purpose. They worked fine previously, where
is the need for this rule?” Another CFO laments: “investors cannot understand the complexity of the new
accounting rules, so in many cases they look for the companies to educate them so they can better
understand it and better explain it. Routinely, we’ll have one of our Wall Street analysts who cover us
send me an email request from an investor who doesn’t understand something from an accounting
perspective. The analyst doesn’t understand it himself, so he sends it to me, and we have to walk them
through how it works.” Summing up, both survey and interview evidence shows strong signs of rules
fatigue, where the introduction of new rules is mostly seen as costly and confusing. Note that this
evidence is related to the results that CFOs view consistent reporting choices as the top characteristic of
quality earnings. Thus, the need for consistency and continuity in financial reporting – both on the level
of standards and in reporting choices - and is one of the emphatic messages of our study.
5.6.2 Too prescriptive
One CFO mentioned “in most cases, the rules are so prescriptive that they override and supersede
your judgment, and you end up with things that don’t really reflect the economic substance of the

38
transaction, but you have to account for it in the way that’s described by the rules.” He goes on to argue
that allowing firms discretion in reporting actually places a higher burden of proof on the CFO.
Discussing this concept in the area of allowance for doubtful debts, the CFO remarks “if you say I want
your best judgment about what is going to be collected, and I don’t care about anything else, that’s a
much higher standard than if you tell me reserve anything that’s 30 days past due at 15%, and whatever is
60 days past due you reserve 80%.”
One CFO goes to the extent of suggesting that he takes GAAP as given and changes contracts to
ensure that the operations and the accounting are synchronized. We typically assume that the operations
are a given and accounting or reporting systems attempt to describe the business: “I actually am kicking
off an exercise after the first of the year with our outside auditors to see what do we need to do
operationally to get our accounting, which is a given, to match what's really going on in our business?
Because GAAP prevents me from giving investors information they need to actually understand what's
going on. For instance, investors look for what is the cost to acquiring a customer or the payback of a
customer. If they can’t get this off the face of our financials then we create guesses, and then guesses
create questions, and then questions become convoluted because you're dealing with accounting versus
what's actually going on in the business.” These comments are supportive of Sunder’s (2005) question
asking “how and why did financial reporting get caught in the standardization project, replacing norms
and professional behavior by written rules and standards? . . . I argue that heavy reliance on standards-
based financial reporting . . .has led accounting on a wild goose chase of objectivity without personal
responsibility.”
5.6.3 Convergence between IFRS and GAAP
One CFO thought that competition between two sets of standards would merely create confusion
in implementation. Another suggested that with well-informed shareholders, two sets of standards should
not make much of a difference. An interviewed CFO views the potential move to IFRS as a costly
process without much payoff: “Part of the problem is simply going through the amount of work that’s

39
involved. So under IFRS, you can have one form of inventory valuation. We have multiple forms of
inventory valuation in our company, we use the retail method and the cost method depending on where
the inventory is located and the amount of work it would take to get it all onto one method is crazy and
expensive and doesn’t provide any value to anybody. And it’ll be confusing to investors. So I see it just
as another requirement that will perhaps drive up consulting fees. You know, every time there is a
potential change, everyone’s knocking on the door, wanting to get hired to help us manage through it.”
5.6.4 Top-down FASB rule making
Almost every CFO we spoke to lamented the decline of the bottom-up system relied upon earlier
to develop GAAP. The perception among CFOs is that the top-down approach has resulted in highly
prescriptive rules. For instance, one CFO complains “the rules are so prescriptive that they override and
supersede your judgment, and you end up with things that don’t really reflect the economic substance of
the transaction, but you have to account for it in the way that’s described by the rules.” Another CFO
complained that the FASB had become too bureaucratic to be effective: “they have attempted to be so
definitive that by and large most investors cannot judge what is truly happening within a company.” A
third CFO states “the best quality of earnings is when you can get the accounting matched to what is
actually going on in the business.”
One CFO laments “I think the FASB has lost their way, and have become much too theoretical in
what they’re trying to do. The best of all worlds would be the FASB would actually quit issuing opinions
for a while and let everybody try to implement where we are and then get on with IFRS and then go ahead
and converge it all. I think a lot of it should evolve from practice. Actually setting principles from the
top and then evolving practices from the bottom would make a lot more sense.”
However, one CFO had an interesting take on why a top-down system is not all bad: “I think that
it may make the investing world feel better, that it’s being governed and regulated. You know, stricter
and more uniform across the board, objectively maybe too. I’m assuming that that’s what the market

40
would consider as credible, you see all kinds of meltdowns and things happening over the last few years, I
think that the more they say they’re regulating, the more the market may feel better.”
5.6.5 Reporting is a compliance activity with deadweight costs
Several CFOs say that they are resigned to view financial reporting as a compliance activity that
imposes a deadweight cost such that they just do what the regulators tell them to do rather than compete
and innovate for better access to capital. This feeling of resignation might explain the popularity of more
detailed implementation guidance (47.9%). Typical of this perspective is the following CFO: “There are
so many things that are ridiculous, but rather than saying oh this is ridiculous, we say ok. We just want to
get it right.” Another CFO’s perspective: “Because at the end of the day, how should I spend my time?
Do I want to spend my time working on this? Or do I want to spend my time working on strategy and
driving the business? We’re not going to let the accounting wag the business here, so we’re just going to
comply.”
5.6.6 Rule makers should allow more judgment
One CFO suggested that the FASB just go back to FAS 1-5 which lays out financial accounting
concepts and cut back on detailed rule-making: “I think within the US, we have gone too far in trying to
promulgate exact measurement, down to the minutia. We’d be better off having an accounting
framework. I like the old initial Financial Accounting Concepts 1 through 5 which I learned in
undergraduate school. I felt FAS 1-5 provided a framework that helps drive your accounting decisions
versus trying to dictate down to the minutia the official promulgations now want you to record. And I
think from an investor standpoint that would be far more meaningful. The FASB and the SEC come up
with these very complex accounting rules that many investors, even accredited ones – Fidelity,
Wellington, Putnam-- do not quite get.” However, several CFOs agree that the litigious environment in
the U.S. and regulatory fear of delegating too much discretion to business hamper any progress towards
true principles-based system, e.g.: “We live in a litigious society so people would prefer to have
prescriptive guidance, so they can say they followed the rules.”

41
Another CFO gave us historical perspective on why companies seek guidance from the SEC and
the FASB on rules: “If you go back in history a little bit, back when the Accounting Principles Board
(APB) was in existence and even the FASB in the early years, most of their opinions I would say were
really much more principles-based and in fact, many times, back in my prior career in public accounting,
we would go to an APB Opinion and read the basis for conclusions to understand in what context were
they talking about a principle and how to apply it. There weren’t many rules back then. Rules were kind
of established in practice, but they were established off of those principles.”
5.6.7 Disenchantment with fair value and consultants
Apart from the comments against fair value summarized in section 5.4.2 above, one CFO
complained that the FASB’s focus on fair value accounting has created a cottage industry of valuation
experts: “I think there is too much movement towards trying to figure out how to make the financial
statements exactly right. On our balance sheet, we’ve got an intangible asset for a non-compete covenant,
customer lists, and trademarks. To value these assets, we end up using assumptions that are recycled
from one valuation to another by valuation experts.” He goes to complain that assigning purchase
considerations in an acquisition is adhoc and due to the complexity and sheer volume of adjustments,
companies and auditors end up taking the values assigned by experts at face value, although they realize
that many of these values are unreliable. “It’s completely subjective, (but it’s defended by) valuation
experts who say ‘this is what we use with all companies.’” Another CFO says, “There is just too much
time spent trying to break out values business-by-business…if you bought net tangible assets up to $30
million and you spend $60 million, just put the other $30 million to goodwill and intangible asset, and
make everybody amortize them, or make everybody not amortize it. Don’t spend weeks with valuation
experts trying to figure out how to assign the purchase consideration to a non-compete, or work force in
place…I think it’s silly.” In the academic literature, Ramanna and Watts (2007) argue that the
unverifiable nature of fair-value estimates required by SFAS 142 for the valuation of goodwill in
acquisitions gives firms discretion to manage impairments.

42
5.6.8 Audit firm behavior
Several CFOs mentioned that the FASB’s over-emphasis on rules has affected the quality of
audits. In particular, “the big firms are not passing authority downstream to the regional headquarters or
into the actual auditors like they used to. And so what you lose is an aspect of training that’s very
significant in terms of bright new young accountants coming up through the accounting firms.
Interpretation of these rules in the accounting firms comes from high above now rather than from the
field.” Another CFO lamented that “the junior audit staff, after a short period of time gets tired of
traveling, because their discretion is being more and more limited, therefore there is a continuing outflow
into the corporate world. And, they’re not as well-trained as they used to be.” One CFO observed that
audit firms used to participate more in shaping standard setting by writing position papers but now all
they do is lobby to advance their clients’ positions.
An interviewed CFO complains about how the audit profession has changed due to the rules
orientation of the FASB: “They now are much more into the exact wording of something and the
interpretation of it versus what’s logical. Earlier we could work with your local accounting firm, your
local partner and accomplish things. Now, pretty much everything goes up to their think tank at national.
So it’s now a much more academic level versus what is the practical, what is a legitimate industry
approach.” One CFO observed that auditors have stopped exercising professional judgment relative to
the earlier days. He says “ with the prescriptive accounting rules, the accounting firms feel that they’re
pretty much in a corner – they have to follow a strict interpretation of it, versus what is more relevant for
the business at hand. I had a secondary offering I was doing in my last company. I could not get consent
from the accounting firm until I resolved the one issue with the SEC. So it’s a little bit of a catch-22
where the accounting firm wants to see what the SEC’s interpretation is before they’ll opine on it.” He
goes on to explain that the motivation is litigation and fear: “major accounting firms take away partner
shares if their client has to restate their books.” This echoes Sunder’s (2010) position that uniform

43
standards induce a follow-the-rule-book attitude among accountants at the expense of developing their
professional judgment.
5.7 Standard setters’ perspective
We interviewed two standard setters (both currently or formerly with the FASB) to get a counter-
perspective on these issues raised by CFOs. Their comments are summarized below under appropriate
captions:
5.7.1 Earnings quality
Here is standard setter #1’s take on earnings quality: “earnings quality is a difficult concept
because investors ideally want to identify a firm with quality economics that are repeatable. Firms that
have those characteristics are good investments. Hence, sustainable and persistent earnings are likely to
be popular choices among CFOs for high quality earnings. However, that does not mean that earnings
that are not persistent are low quality because investors will want to know when the economics of the
business dictate that earnings are not repeatable due to changes in the business model or due to the nature
of the business. For earnings to be high quality, it must capture both (i) when earnings components
reflect the outcome of business activities that will persist; and (ii) when those outcomes are associated
with business activities that represent one time changes in wealth that will not persist.” In other words,
both persistent and non-persistent components of earnings can be viewed as good reflections of what is
happening in the business, although they have different meanings, and perhaps the problem lies in
aggregating such distinctly different items into a single earnings number.
The same standard setter extends this line of thought to “another frustrating issue with earnings is
the desire among constituents to condense the economics of the firm into one number. I think
disaggregating activities into operating, investing and financing is important. The EPS number, by itself,
cannot capture everything especially when change is constant and businesses are complex. One way to
do this better is to separate one time components from persistent earnings. These subtotals may also
better measure the effects of persistent and one time outcomes if they are each separately measured using

44
a single measurement attribute. Said differently, these subtotals lose meaning if the subtotal is comprised
of earning components that are measured differently (adding fair value and allocated historical cost
measures and including them in one subtotal creates challenges for what the subtotal means). ”
5.7.2 Matching abandonment
Standard setter # 1 rebuts: “the idea that matching is important is somewhat misleading.
Historical cost accounting necessarily involves allocating costs or benefits over some accounting period.
However, we never do matching right. Most firms use straight line depreciation. How can that reflect
good matching?” Standard setter # 2 believes that there need be a conflict between the income statement
approach (central to matching) and the balance sheet view of standard setting: “the conceptual framework
talks about comprehensive income and earnings as a component of such comprehensive income. But that
doesn’t mean you can’t have earnings that includes ideas that make sense in matching. In other words,
outputs versus inputs. And the bulk of that for most companies is revenue versus cost of sales. But that
doesn’t mean there still isn’t a distinction between earnings and other elements of comprehensive income.
One set of people argues that the balance sheet ought to be the result of the matching process. Others say
no, no, the balance sheet needs to be closer to a genuine statement of financial position, then they say well
if you do that, earnings gets all mucked up with all these transitory, volatile, fair-value, and other types of
adjustments like that, and it doesn’t have to be one or the other.”
Standard setter # 2 goes on to say that “the original concept statement contains the concept of
comprehensive income. It had kind of a Hicksian notion of income, but then it went on to say that a very
important component of income is earnings. It didn’t really define earnings, but it describes earnings as
the results of core activities. I will admit that the dichotomy between earnings and other elements of
comprehensive income has not been well-defined, has been subject to compromises over the years and the
like, but certainly the notion that balance sheets could portray things based on valuations of assets and
liabilities whereas in the income statement, the earnings or income, included a greater number of items
that related to just that period, has been around for a long time.”

45
5.7.3 Fair value pushback
Standard setter # 1 responds to the disenchantment among CFOs about fair value reporting: “this
dichotomy between fair value accounting and historical accounting is a simplistic perspective in that it
often is based on the notion that the changes in balance sheet account are reflected in one earnings line
item only. Discriminating flows from changes in the stock of net assets is important. For instance, the
change in fair value of a debt asset instrument is comprised of three earnings components, two of which
are realized (interest and impaired losses) and one of which is unrealized (the incremental change in fair
value beyond that represented in the realized amounts). Separating the flow (interest) from the changes in
stock (impairments and incremental fair value changes) has meaning and can help investors better
understand the multiples that should be placed on the different components. Changes in stock
(impairment) represent one-time wealth effects within a historical cost model and likely should have a
similar multiple to the change in stock associated with the incremental fair value change. The issue is
separating earnings components that persist (interest) from ones that do not (impairment and unrealized
fair value changes), not fair value vs. historical cost.” We thought that the debt example was indeed
instructive; it is reasonable to say, though, there is little evidence that the distinction between persistent
and non-persistent components is indeed so important to standard setters judging from the near-absence of
such considerations in the proposed new conceptual framework and recent standards.
A related argument was along the lines of “the distinction between income statement and balance
sheet perspective is also misleading because we do double entry book-keeping. Entries that affect the
income statement have to affect the balance sheet by definition in the double entry system. Hence, the
distinction between the two ideas is artificial. The key accounting issues are determining the timing of
the entry and the amount to debit and credit. If those are the key issues we should focus on them
(recognition and measurement) and not on a view that accounting is determined based on single entry
model defined based on a primary financial statement.”

46
When we asked about CFOs’ preference for fair value accounting for financial, as opposed to
operational claims, standard setter # 2 commented that “I might have operating assets in cash-generating
units which I would reflect at their discounted cash flows on the balance sheet. Conglomeration of
individual amortized historic costs is not appealing. But that doesn’t mean that in earnings, I wouldn’t
probably show something that’s closer to the flows of the period.” Related to fair value, we asked
standard setter # 2 about the usual concern often expressed in conversations among academics that
accountants should stay away from valuation. The standard setter retorts “who said that? Did you read
the CFA Comprehensive Business Reporting paper a few years ago from the CFA Institute which is the
biggest organization that represents investors?”
5.7.4 Principles versus rules based standards
Standard setters largely agreed with earlier comments about constituents’ ambivalence between
rules and principles, and the role of the litigious environment. Standard setter # 2 states: “I often hear:
“give me principles but tell me exactly what to do.” It is due to the fear of second guessing, whether it be
the auditor or now the Public Company Accounting Oversight Board (PCAOB) judging the auditor, and
the SEC judging the company and then there’s a problem of the trial lawyers right behind them.”
5.7.5 Top down versus bottom up standards
Standard setter # 1 contends “you would get a contrasting perspective from controllers or other
people in the trenches (such as auditors) who demand specific guidance from the FASB on accounting
issues. CFOs are likely to be removed from the nitty-gritty accounting matters as they are more likely to
be involved in strategic goal setting. Typically, application issues that come before me refer to cases
where there are disagreements between the SEC and the firm/auditor and they are looking for a "get out
of jail" card from the FASB so they don't get sued or get into trouble later. They are the ones demanding
specificity, it not in the DNA of the FASB to drive this. The CFO therefore may have desires that conflict
with those of his controller and auditor rather than conflicting primarily with the FASB.” When we asked
about this conflict, a controller mentioned “in our case, our CFO and our controllers are very tightly-

47
aligned.” Moreover, we investigated whether the answers to any question in the survey were statistically
different for participants who had identified themselves as “controllers” relative to other designations.
We could not find meaningful differences in controllers’ responses relative to executives with other
functional titles.
Standard setter # 2 reacts that the criticism that the FASB is a top-down agency is “nonsense”
“because the amount of outreach that the FASB does with all constituents and stakeholders is enormous,
and that includes lots and lots of investors as well as the companies who are in the face of the FASB all
day long, and the auditors and the SEC, and lots of academic research is looked at. It’s usually human to
suggest that if I don’t agree with your answers then I claim that you didn’t listen to me. Let’s consider
one of the major projects that have been going on with the IASB – revenue recognition. We put out a
discussion paper, got lots of comments and held public round tables, met with people. Then we put out
an exposure draft two years later, after all that. We got lots of comment letters, met with all sorts of
people and now there’s a new proposal out. So all that interaction does affect rule making.”
5.7.6 Curtailed reporting discretion
Reacting to the CFO comment about rules fatigue, standard setter # 2 counters “there are a lot of
people that believe on the policy side that the pace of change in financial reporting has actually been
glacial. You won’t find those people, on average, in the current financial executive positions.”
We asked standard setter # 2 to speculate about what value the FASB adds given that we had
financial reporting and accounting conventions before the advent of the FASB. The standard setter
responded: “I think the big cost over time would be the loss of confidence in financial reporting. Rightly
or wrongly, we seem to have enough instances similar to the stock market crash of 1929, which brought
on the SEC. Remember, companies at that point were first mandated to actually show their sales and
costs of sales, which they weren’t doing. The SEC at that point decided that maybe we needed a FASB.
Recall the SEC started saying to companies that they need to break out data on segments if you have
multiple segments in your business. That was fought for 10 years. The car companies and steel

48
companies fought pension accounting because they said they weren’t real liabilities. So, we probably
wouldn’t have credible reporting without the FASB. I think my own point of view is that there would
probably be a race to the bottom. Not a race to the top. Unfortunately, and part of that is because in the
end, companies have much more say on standard setting than standard setters or politicians.”
We asked standard setter # 2 that when one sets up a rule-making body and if the mandate to
make new rules, the concern is that rule making becomes a self-perpetuating exercise. So what are the
checks and balances in place to make sure that doesn’t happen? To this, the standard setter responded
“first of all, the FASB has a group of trustees, a lot of whom come from the corporate community. Then
there is the SEC and then there’s Congress. All of those people could stop things. It’s all subject to
immense due process. If you talk to a lot of investors, they would say that we have a reporting system
that’s tilted towards companies not towards investors. Whether that’s right or not, I don’t know, but I’m
just telling you what I have experienced and heard over many years.”
5.7.7 Reporting has become a mere compliance activity
Standard setter # 2 admits that “change requires a lot of investment from the company – change
systems, and training, and then explaining the effects of the change. But I also find that over the grand
sweep of history, changes made 30 years ago were fought tooth and nail by industry at that time.
However, if you then propose changing that now 30 years later, they’ll fight tooth and nail to keep the
thing that it was changed to.”
5.7.8 Ideal reporting model
When we asked standard setter # 2 about the ideal set of accounting standards he/she would like
to set without the usual political constraints, s/he responded: “I want a balance sheet perspective. To me
the balance sheet should be something closer to a statement of financial condition. I don’t think that
having long, outdated historical costs for things is particularly informative.”
“The basic model is to try to get the balance sheet closer to current values not fair value. For
operating items, let’s say you have a business that combines fixed assets, intangibles, people, customers,

49
and it generates cash flows. The value of that business is the future discounted cash flows. So, if you had
my ideal model, I would try to get the balance sheet closer to something that captures expected future
cash flows. But the cash flows for the current period run through the cash flow statement, and then
they’re adjusted by the accrual part of the adjustments. The difference we can kind of call “other
comprehensive income,” but, as an economist, if you start with wealth, you will have the change in
wealth being income. An economist meticulously distinguishes between the two components of income,
one being the flows of the period, and the other changes in stocks. And you don’t mix the two because
they have very different properties. Moreover, you have to be much more disciplined in splitting and
reporting these two notions. The real debate to me would be how do we separate the flows from the
change in stocks? We know current cash flows and everybody would agree that adjusting cash by
contractual accruals is probably a useful thing to do. What people don’t agree are things like depreciation
of a building that’s not actually depreciating. How do you want us to deal with inventory valuation?
Those might be very useful discussions to have in order to really improve the overall model of reporting
and the presentation. But unfortunately, most of the debate gets into, I want to just have matching – any
dollar that I spend now I want to be able to capitalize it because there must be a future benefit or I
wouldn’t capitalize it. Then I want to amortize it. And then when the balance sheet doesn’t change very
much despite changing economics and technology, most people would complain and say no, you have to
start with the balance sheet, and the changes in the balance sheet ought to go through earnings.”
Summing up, standard setters often disagreed with the CFOs but also thought that the conflict
often is based on a misunderstanding or mischaracterization of the issues, where the two sides are closer
than they outwardly appear. They staunchly defend the balance sheet model and the existing model of
standard setting, and think that, on balance, they do a good job given the constraints within which they
operate. A recurrent theme in their comments is the need to distinguish between persistent and non-
persistent components of income, which is related to the need to distinguish between normal and ongoing
cash flows and accruals, and revision in stocks. Based on our impressions from the literature and the

50
survey and interviews in this study, we believe that the theme about parsing line items by persistence is
likely to have considerable appeal to key constituencies like executives, analysts, and investors. So far,
however, there is little evidence that classifying line items by persistence has become a dominant driving
force in official standard setting theory or practice.
6.0 Misrepresenting Earnings
Finally, we turn to the abuse of reporting discretion that results in poor earnings quality.
Dechow, Schrand and Ge (2010) note that “while it has long been recognized that accounting choices can
be motivated by opportunism or efficient contracting, we still do not have sufficient evidence on this
issue.” Here, we ask three questions: (i) how common is earnings management to misrepresent economic
performance; (ii) why do CFOs manage earnings; and (iii) how can academics and other outsiders detect
earnings management from public data.
6.1 How common is earnings management?
Healy and Wahlen (1999) lament the absence of evidence on the magnitude and frequency of
earnings management. We asked questions to cover three aspects of this issue: (i) the proportion of firms
in the economy that manage earnings; (ii) the magnitude of the typical EPS number that is managed; and
(iii) the extent to which such earnings management represents income-increasing as opposed to income-
decreasing earnings management. Note that in phrasing these questions, we opted for a narrower but also
clearer definition of earnings management. Specifically, this is reflected in the questions in two ways.
First, we emphasize that this is earnings management that misrepresents economic performance. As
discussed in much extant literature, there are also broader notions of earnings management that include
financial reporting discretion that communicates private information. Second, we clarify that our notion
of earnings management is strictly within the realm of GAAP and does not involve fraud. Thus, the
answers to these questions can be thought of as providing a lower bound on the prevalence and magnitude
of earnings management in practice.

51
As a further precaution, we also avoid asking CFOs about earnings management at their own
firm. In particular, the first survey question reads: “From your impressions of companies in general, in
any given year, what percentage of companies use discretion within GAAP to report earnings which
misrepresent the economic performance of the business?__%.” The mean answer to this question is
18.43%, in Table 10. Thus, it appears that roughly 20% of the firms in the economy manage earnings.
Looking further into the results, 99.4% of CFOs feel that at least some earnings management of the
opportunistic kind happens whereas the standard deviation is about 17%. Thus, there is near-unanimity
that at least some earnings management occurs but there is considerable dispersion in beliefs about the
magnitude of this phenomenon. There is modest cross-sectional variation in this response (untabulated).
To get a sense for the extent to which EPS is managed, we ask “for this question, consider only
companies that use discretion within GAAP to misrepresent economic performance. Among these firms,
assume that earnings per share is $1 per share. Of this, how many cents per share is typically
misrepresented?” The mean answer to this question, reported in Table 11, is 9.85 cents, with standard
deviation 0f 8.81. Thus, for firms that do it, approximately 10% of the earnings number is managed.
Consistent with this assessment, one interviewed CFO thought that “I would say on average 10-15% of
earnings are managed through various accruals, reserves, fair value assumptions. That would be what I
would expect – somewhere in the 10-15% range. Companies can make small adjustments to fair value
assumptions, loan loss reserves to try to help achieve such earnings management.” Turning to the
(untabulated) cross-sectional variation, the following categories of CFOs believe that the dollar
magnitude of earnings management is higher relative to their counterparts: (i) fast growing firms; (ii)
firms whose earnings are more volatile than those of their peers; and (iii) firms with a higher exposure to
lawsuits.
Finally, we asked about the extent to which such earnings management represents income-
increasing earnings, as opposed to income-decreasing earnings via cookie-jar reserves, for instance. In
particular, the survey question read “within a given year and among the companies that misrepresent

52
performance, indicate the percentage of firms that misrepresent by increasing earnings (vs. those that
misrepresent by reducing earnings). The mean (median) answer to this question, as reported in Table 12,
is 58.8% (67%). Thus, it appears that the majority of firms misrepresent by increasing income but a
significant portion manages earnings down. This is interesting because the extant literature tends to
emphasize income-increasing earnings management – but on some level it is not too surprising given that
the inter-temporal settling up of accruals implies that managing up and managing down can be two sides
of the same coin.
There is not much cross-sectional variation in this response (untabulated). CFOs of fast growing
firms and those with fewer business segments believe that upward earnings management is more
prevalent relative to CFOs of slower growing firms and many business segments. When asked about the
relative importance of income-decreasing earnings management, a CFO commented “I think managing up
on earnings becomes less of a necessity than it’s ever been in the past. The larger companies have gotten
far more sophisticated in understanding where their operating results are at any point in time. And
therefore you're running closer to what your estimates are than you ever have before, especially
companies that have moved to three day closes. So I think you find a lot less of that ‘hey I'm trying to
take an accrual to get to an earnings number because you missed something.’ I think the sophistication of
processes ensures that we can predict outcomes a lot better. Even to the extent of controlling your legal
team in regards to timing of their settlements, and sensitizing the organization about our ability to deliver
operating results, and our ability to provide people clarity and/or insights into what our operating results
are going to be.”
One CFO shared the following comment about the process of earnings management: “we were
going to get a $1.50 EPS number and you could report anywhere from a $1.45 to a $1.55, and so you sit
around and have the discussion saying well, what do we want the number to be within that range? We
talk about estimates: do we recognize this in this quarter? Is there some liability that can be triggered that
hasn't been triggered yet or has it really been triggered yet? Do we really have enough information to

53
write this down? All of those kind of things but mainly involving some sort of estimate and also a
question of something where we had discretion of the time period in which we recognized the gain or the
loss.”
6.2 Why manage earnings?
To get a better sense of why CFOs misuse their reporting discretion we asked the following
survey question: “From your observations of companies in general, please rate the extent to which
companies use reporting discretion within GAAP to report earnings which misrepresent their economic
performance to achieve the following goals.” The goals are listed in Table 13. The most popular answers
are the desire to influence stock price (93.5% strongly or weakly agreed), outside pressure to hit earnings
benchmarks (92.9%) and inside pressure to do the same (91%) These pressures are similar to the ones
reported as significant in earlier survey evidence of Graham, Harvey and Rajgopal (2005). These were
followed by answers related to executives’ career concerns: 88.6% felt that executive compensation was
responsible whereas 80.36% thought that senior managers fear adverse career consequences and hence
misrepresent earnings. Interestingly, the motivation to avoid debt covenant violations is important
(72.5%), perhaps consistent with the prominence attached to this hypothesis in the positive theory
literature beginning with Watts and Zimmerman (1985). The pressure to report smooth earnings comes
out as important (69.1%), consistent with the survey evidence reported in Graham et al. 2005). It is also
interesting to note that 60.1% of executives feel that managers manage earnings because they believe such
misrepresentation will go undetected. Among the less popular motivations are (i) managerial
overconfidence (49.4%); (ii) desire to reduce expectations of future earnings (41.7%); (iii) desire to
influence non-investor stakeholders (37.3%); and (iv) because others misrepresent earnings (26.2%).
Some of the more noteworthy qualitative reasons given at the end of the question include “lack of
fiduciary responsibility” or “lack of ethics.”
Turning to the more interesting untabulated conditional averages, we find that profitable firms
rank the pressure to smooth earnings more. Firms with greater P/Es rank inside pressure to hit

54
benchmarks and executive compensation as more important drivers of earnings management perhaps
because missing benchmarks can severely affect their stock price (Skinner and Sloan 2002). Firms with
greater sales growth rank the desire to keep the stock price high as important whereas those with lower
sales growth feel that the pressure to smooth earnings matters more. CFOs of firms with greater earnings
volatility believe that senior managers’ career concerns matter more perhaps because earnings volatility
can encourage forced manager turnover. Less experienced executives rank inside and outside pressure to
beat benchmarks highly. Risk-averse CFOs pick executive compensation and the desire to reduce
expectations of future earnings as important factors.
6.3 Interview evidence
6.3.1 Stock price and pressure to meet benchmarks
Most CFOs thought there is unrelenting pressure from Wall Street to avoid surprises. As one
CFO put it, “you will always be penalized if there is any kind of surprise.” As a result “there is always a
tradeoff. Even though accounting tries to be a science, there are a hundred small decisions that can have
some minor impact at least on short-term results. So that is a natural tension, and one that, depending on
the company, the culture, and the volatility of the company, can be either a source of extreme pressure or
a minor issue.”
A CFO of a large company brought up the issue of materiality as it related to Wall Street pressure
to meet or beat earnings benchmarks. That is, a penny a share for his company can be a lot of money and
can make the difference between meeting or missing the analyst consensus forecast but that amount
would usually be buried in a generic line item on the income statement. One CFO likened the process of
hitting the precise earnings benchmark to “trying to land an aircraft on a pin head.” In his own words “let
me give you a couple of examples, and these would be real-life examples from last year. We have some
three-year compensation plans involving restricted stock, and they’re paid when managers achieve certain
targets based on accounting numbers, and each quarter you have to make an estimate as to do you believe
the company is going to actually hit these targets one, two, and three years out. And depending on a

55
judgment call, based on where you think you are, you will start adjusting that accrual either up or down.
And so last year, we had some wild swings at our company, and in the 3rd quarter of last year it looked
like we were not going to make the targets, and we reversed the accrual. The reversal was a penny a
share and increased income. Now let’s stop for a minute and say, I did that appropriately – but how
would you know? You probably wouldn’t because it’s buried in general and administrative expense but
it’s not big enough on our income statement in one quarter to stick out. But it’s enough to change the
EPS number that Wall Street analysts are looking at.”
6.3.2 Executives’ career concerns
One CFO suggested that earnings-based compensation is a potential explanation for why CFOs
manage earnings. This CFO suggested that “over the last five years, compensation consultants have
shifted many companies toward using a GAAP-based earnings hurdle for their stock compensation. So
there is usually some sort of earnings threshold to achieve either for their stock option vesting or for their
restricted share vesting. Due to Section 162m considerations, they tie such stock compensation to a
performance metric. I think earnings management is still done, in many cases it is for executive
compensation. If you’re going through a bad year, you’re not going to achieve bonuses or vesting of your
stock. There’s still this inherent desire for management to set aside reserves so they can protect future
years to make sure that from a compensation standpoint they’re rewarded in the future.” Note that this
explanation has elements that are different from the dominant story in the existing literature, where it is
assumed that bonus, not stock compensation, is directly tied to earnings and earnings targets (Healy
1983).
6.3.3 Getting away with it
An interviewed CFO started off by saying “if you talk to any CFO who’s compiling the numbers,
they know things are happening like that, they just aren’t forced to disclose them. They only talk about
what they need to talk about.” One CFO thought that the chances that an analyst would spot an
occasional instance of earnings management are low, and only persistent abusers have a high chance of

56
being detected. He states: “I think when people are dishonest it is very hard for an analyst with just
public information, to tell, at least in the short-term. Eventually absence of cash flows always catches up
with you. That’s kind of the first flag that something may not be right with the earnings, but you could be
totally transparent and conservative but the accounting model, for a while, might show earnings that are
not supported by actual cash flows. So by doing comparisons and some detective work, an analyst can
start to smell that something is not right, but unless it’s very egregious behavior, it usually takes a long
time before they can have a conclusive argument that earnings are managed.” When pressed further to
speculate how long such earnings management could carry on, he responded: “It would depend a lot on
the industry. I think it would be very difficult for anyone to do this for any longer than five years,
anywhere between two and three years should be possible, depending on the industry.”
Moreover, several CFOs felt that sell-side analysts are not particularly good at detecting earnings
management. One CFO goes so far as to say “analysts usually don’t actively detect poor earnings quality.
The good ones do but the sell side has no incentive to detect earnings quality.” Another financial
executive thought that buy side analysts are better because they “tend to go deeper into the nuts-and-bolts
of the valuation and the value creation, cash flow, earnings quality” relative to the sell side analysts.
We probed deeper to understand whether other financial intermediaries are better at detecting
earnings management and/or fraud. One CFO thought “the shorts and the bond and debt industry do a
better job of it.” Referring to the role of shorts in the recent credit crisis, one CFO mentioned “the whole
idea that no one saw it coming is spurious because these shorts had seen the credit crisis coming. It was
not anything magical. They did the hard work. They drove through empty neighborhoods, looked at
houses and thought “Oh my god, they are trading these as AAA securities? Short this thing.” People got
away from the discipline of doing the hard work and doing the credit analysis. Anytime you slack off on
issues like this, you end up with a quality of earnings issue down the line.” He also thought that credit
default swaps served as an early indicator: “we watch for daily trends in CDS prices. We look at the
ratings that rating agencies give us but we also look at the trends in the CDS for companies whose
57
securities we hold. These CDS data are telling you something before the rating agencies. Ratings tend to
be sticky and late.”
6.3.4 Consequences of poor earnings quality
The importance of earnings quality increases to the extent that there are consequences to the firm
or to the manager of reporting poor earnings quality, assuming that outsiders can recognize good quality
earnings. The literature has explored several consequences of poor earnings quality (see Dechow et al.
2010) including (i) higher cost of capital; (ii) lower stock price; (iii) investor confusion, high bid-ask
spread; (iv) low analyst following; (v) trouble communicating how well the business is doing; (vi) drain
on managerial time and attention; (vii) distrust between firm and stakeholders; (viii) trouble accessing
debt and equity markets; or (ix) adverse career consequences to the senior management team. We asked
interviewed CFOs about these concerns.
Most of the interviewed CFOs believe that the consequences of poor quality, once discovered by
the market place, is either an increase in the cost of capital and/or a decrease in stock price. The
following comments were typical: (i) “The company will not be fairly valued, because analysts will
discount their earnings and cash flow so the company will trade at lower multiples than their peers” or (ii)
“From management’s standpoint, much lower valuation. In the short term, there is an adjustment to your
multiple. But this can take years.”
Another CFO attributed the consequences to investor confusion: “If it’s hard for investors to
understand earnings going forward, that will result in lower stock price and higher cost of capital.” An
interviewed CFO pointed out consequences that are not that important: “depending on how big the
company is, the number of analysts that follow you may or may not be an issue, but I suppose I wouldn’t
rank less analyst following very high. I think you would have to get down into the smaller cap companies
for that to be a big issue. High bid-ask spread seems like an arcane issue to me, I don’t know how that
manifests itself in the market these days, with such low increments of trading. Well, poor earnings
quality certainly creates confusion, a lack of trust, to a large extent, companies, when you’re out there

58
meeting with buy-side especially, you’re selling the management is in effect the product that the company
is buying. So if they don’t trust you, then that ripples through the whole company results. So, if there is a
lack of trust, then that makes decisions riskier, and therefore there’s an implicit higher return that’s
required, which ripples into cost of capital.”
Another CFO thought low earnings quality leads to high betas and short interest. He said “when I
joined this company nine months ago, quite a few people were questioning the quality of the earnings.
And it wasn’t a case where the company was manipulating GAAP or doing anything unusual, but it was a
case where things were coming through earnings that had not been discussed. There was no clarity or no
transparency of disclosure that created that uncertainty and led to a very large short interest ratio and we
had a very, very high beta. When I joined, the company used four non-GAAP measures as its primary
earnings measures and that’s all you’d see in the press releases, and of course our key investors didn’t like
that. They thought that approach was in many ways hiding the true performance of the company. The
old CFO was not a CPA, was not overly versed in the GAAP or SEC rules, and so he would avoid
answering questions. He would do a black box. Hence, we were punished and we had over a 30% short
interest ratio.”
One CFO mentioned that the market is more likely to ask questions about earnings quality when
the firm is not doing well: “whereas if you look at our company, what happened is we had the downturn
in 2008, and at the same time people question the transparency and quality of the earnings, and that leads
to a very bad situation. That’s ultimately why the board forced the previous CFO to move and brought
me in nine months ago.”
6.4 Detecting earnings management
There is a considerable academic and practical demand for identifying managed earnings from
public data. A related, pervasive difficulty is splitting earnings or earnings components into an innate
portion that is beyond the control of the management versus a discretionary portion that can be influenced
by the CFO’s decisions. As an illustration of the depth of this problem, Guay, Kothari and Watts (1996)

59
find that a random decomposition of accruals into discretionary and nondiscretionary components is no
worse than discretionary accruals obtained from several well-known models. Moreover, the ability of
even well accepted models such as the Jones model and the modified Jones model to outperform the
random decomposition model is modest. Thirty years of research has still left us with more questions
than answers about how an external observer can detect footprints of managed earnings. Virtually every
proposed method of identifying managed earnings (e.g., discretionary accruals and benchmark beating) is
followed by papers that argue that such managed earnings represent (i) either an econometric artifact
(Easton and Durtschi 2005, Guay, Kothari and Watts 1996); or (ii) some unobservable dimension of
earnings quality related to the unobservable fundamental earnings process (Dechow et al. 2010, Beaver,
McNichols and Nelson 2007).
Hence, we ask CFOs the following question: “academic researchers have struggled for years
trying to use publicly available data to identify companies that misrepresent reported performance. In
your view, what are three “red flags” that would help academics detect such misrepresentation?” We
expect the answers to serve three purposes. First, these answers can help us validate some of the more
popular approaches already used by academic researchers. Second, they may open up new areas of
inquiry. Third, there is demand for the creation of “red flag” profiles to aid SEC investigations (Pincus,
Holder and Mock 1998).
6.5 Red flag evidence
Table 14 organizes and summarizes CFO input on red flags, where individual responses are first
organized into related categories, and only categories with more than 10 responses are included. The
table is sorted in descending order of popularity, where for each category we include possible
permutations of the main idea, and the frequency with which it is mentioned. We discuss in turn the
most frequently offered red flags followed by a summary section on the remaining ones.
(i) Earnings inconsistent with cash flows: The most popular red flag is observing trends in earnings
that diverge from trends in cash flows, garnering 101 responses. Permutations on this idea

60
include “weak cash flows,” earnings strength with deteriorating cash flows”, and “earnings and
cash flows from operations (CFO) move in different directions for 6-8 quarters.” Note that the
importance of the link between earnings and underlying cash flows is registered pretty much
throughout the whole study, getting high rankings in the open-ended responses to what is
earnings quality in Table 3, in the survey question about characteristics of earnings quality in
Table 4, and in the CFO interviews. This link has certainly been recognized in practitioner circles
(e.g., O’Glove 1998) and on the academic side as well (e.g., Dechow and Dichev 2002). Based
on our combined impressions, however, we believe that there is still much work that can be done
here, especially in the direction of explicitly modeling and exploring the multi-period and inter-
temporal nature of this relation.
(ii) The second most frequent red flag is deviations from industry norms or experience, registering 88
responses. Variations on this idea include deviations from the economy or peer experience, and
including specific examples of such disparity, for example in cash cycle, average profitability,
revenue and investment growth, asset impairments. This idea is also recognized in the academic
literature, where the typical treatment is to use industry and peer benchmarks as control variables.
Given the high prominence of this signal in CFO responses, though, and its presence in some of
the most celebrated cases of earnings manipulation (Enron, WorldCom), one is inclined to think
that perhaps a more direct and forceful investigation of this red flag is in order.
(iii) The third most prominent red flag, with 71 responses, is a firm that reports lots of accruals or
exhibits unusual behavior in accruals, including large jumps in accruals. This signal has been
well-researched in accounting, perhaps most prominently in the “accrual anomaly” literature
starting with Sloan (1996). There are perhaps some research opportunities here given that CFO
responses seem to emphasize changes in accruals as compared to the accrual anomaly literature
that traditionally relies on level-of-accrual specifications. Since extreme levels of accruals,

61
however, are strongly associated with accrual reversals (Dechow and Sloan 2012), it is not clear
that there is a reliable empirical distinction between these two specifications.
(iv) The more unusual red flags on the list include looking at comments in social media, strong sales
growth without an increase in marketing expenditure, a mismatch in the performance of the
fourth quarter relative to the first quarter, large frequent one-time items for the same company,
large volatility in earnings without a major change in the business model, frequent “puff-piece”
type press releases, absence of negative news from the company, political contributions, strong
revenue spikes in the third month of the year, relation between backlogs, work-off backlogs and
future performance.
6.6 Interview evidence
Several CFOs gave detailed responses, summarized below.
6.6.1 Corporate culture
The tone is set at the top. One CFO suggested that academics need to assess the credibility of
management. He goes on “I would start with say the top management or senior executives. That sets the
tone or culture which your internal accounting function will operate under. These people have lives or
families and they will feel the pressure that top managers (CEO, CFO) will exert.” When pressed further
about how exactly academics should try to detect management, this executive suggested that similar to a
deep fundamental analysis of financial statements, we should conduct an “intensive fundamental analysis
of the backgrounds of the top people running the company.” Another suggested: “well there’s certainly
industry gossip for sure and talking to the people in the company and in others to see how well-regarded
they are. Look through the resumes of the individuals and check their background and whether they have
a known history of success.”
Another CFO opined: “I would like to look at the experience of the people behind a lot of the
numbers. It’s certainly very telling, so I try to look at as much as I can at the people who are running the
company and the CFO and the CEO.” Some of the emerging work on the management styles of

62
executives and CFO fixed effects on financial reporting can thought of as implementing this advice (e.g.,
Bertrand and Schoar 2003, Bamber et al. 2010, Ge et al. 2010 and Dyreng et al. 2010).
6.6.2 Do the CEO’s actions gel with his words?
One CFO pointed out that “companies are required to disclose their strategy in the CEO’s letter.
We used to try and assess whether their actions are in alignment with the stated strategy. When we
looked at Enron, we saw that their strategy and actions did not gel. Their actions showed up on the
statement of cash flows. Where is the cash? I think one of the problems is that the statement of cash flows
tends to get overlooked by the analysts. They tend to look at income statement, the balance sheet and
they do not tend to use the statement of cash flows as the roadmap of the business that it really is. Where
is the cash going? Are they making tangible investments with the cash? This gives the analyst a chance to
question management about the sources and uses of cash. Then, we look at what the answers
management gives.”
Another CFO looks for consistency between the financial statements and the MD&A: “When I
look at other companies, I think they reflect low quality earnings is when I read the MD&A and there’s
not a lot of information outside of the financials, it doesn’t give enough color, and then that makes me
feel like they’re not using metrics to run their business. In terms of other red flags, when I look at their
earnings versus other companies, other benchmark companies, I ask if there are any anomalies. If there
are inconsistencies in terms of how they’re spending their dollars, then I would say that’s more fiscal
mismanagement. If there are too many one-off explanations too many times in too many consecutive
quarters, like if there’s always an excuse for why their earnings are good or for why their earnings are
bad, that is something I certainly look for.”
6.6.3 Governance structure
One CFO stated “you get what you inspect not what you expect.” Hence, the quality of the
internal audit team is important. He goes on “you need an independent internal auditor that reports up to
the audit committee. The audit committee should be chaired by an experienced auditor that has a strong

63
accounting and finance background, especially perspective on accounting policy treatment of
transactions, as this kind of experience is more valuable than ever now. They should also use outsourced
expertise in technical subjects such as valuing assets such as mortgage-backed securities, residual assets
or compliance with loan loss reserves. You need the kind of talent in the audit function that can go up
against the department heads of divisions. Good management culture, well staffed internal accounting
function, an audit group that knows what it is doing is crucial. The next group is the board. Note that I
don’t put them up ahead because they are not close enough to the transactions. They have to assume that
the management that they delegated to is performing and they are getting the proper reports coming up to
the board. All the reports coming up to the board are only as good as the first three things I mentioned.
Otherwise, it is the old garbage in, garbage out. The board would then be looking at fictitious reports
which are useless.”
Another CFO elaborates “You can get behind the proxy disclosures and take a hard look at who is
on their audit committees or who is on the risk management committees. Do they have players in that
specialty or industry such that they can give management honest advice? Again, it comes back to the
category of ‘are their actions consistent with their stated strategy.’ Does management pay lip service or
are they serious about corporate governance?”
Summing up, more so than in the red flags survey responses, interviewed CFOs emphasized the
importance of the human factor, including management, the quality of internal audit, and the board of
directors. Although there is some existing research along these lines, this seems to be major line for
future inquiry. Of course, data availability is a problem here but creative approaches can perhaps
circumvent these obstacles.
6.6.4 Quality of the estimates in the financial statements
One interviewed CFO stated “another way to evaluate earnings quality is to look at the footnotes
and assess the quality of the estimates and assumptions underlying the present value calculations of assets
when these assets are being reported at the present value of future cash flows. We would look at several

64
years of footnotes and see whether the target banks changed the assumptions underlying the valuations. It
is easy to spot changes in the assumptions but the accounting profession does not ask firms to disclose
what I call the “next sentence” stating that the effect of the change is to increase earnings in the current
period and increase risk on the balance sheet. They are not required to say that. What you can assume is
that the accounting firm that audited their books thought that the change was reasonable but it does not
mean they have not added risk. Remember auditors look at GAAP compliance only. They are not going
to invest their money in your stocks or bonds.”
This CFO went on to give specific examples of the kind of estimates to consider in the context of
a bank’s financial statements: “Look at asset valuation models, residual valuations, what proportion of
their book are these dodgy assets? Look at allowance for loan losses, allowances and estimates on the
balance sheet and their methodology for valuing receivables. There is a lot of room in these estimates and
the company can either be aggressive or less aggressive. Do the prepayment rates underlying the
valuation of mortgage back securities or securitized assets make sense to me? Do the discount rates make
sense? An analyst should be able to get that from industry standards. The next level is to check if these
estimates change. You have to ask why? Their earnings must be under some stress.”
6.6.5 Beware of black boxes
Several CFOs suggested that “if something is a black box or too good to be true, it probably is.”
He was referring to firms with opaque disclosure policies. One CFO commented that “I would look for
an open discussion with management and I’m looking for clarity on the business model. I’ve found that if
it’s a black box generally they are usually hiding something.”
6.6.6 Acquisition accounting
Several CFOs mentioned that accounting for acquisitions was a common setting for earnings
management: “acquisition accounting would be the biggest area where I’ve seen some CFOs taking
advantage. I have seen acquisitions used to establish numerous balance sheet items and those provide
huge opportunities in the future to manage the P&L. They would set up provisions that are always worth
65
more than they were set up for. I’ve watched numerous managements earn big incentives by being able
to manage a balance sheet accrual. They set up big accruals and (then do) not meet them. They are set up
at the time of the acquisition, they include everything from integration to many different things that you
assume, but they’re an estimate at that point in time. When the future happens then you take charges
against that and in reality it was an estimate so it’s going to be (imprecise) but whenever I have seen this
it was always less than what got set up, so it got released into favorable earnings. These accrual reversals
did impact the earnings and sometimes for a period of time, two-three years because they were big
acquisitions.”
6.6.7 Understand how accruals are put together and whether they tie back to cash
Many of the interviewed CFOs suggested that analysts should try to understand how accruals are
put together and whether the analyst can tie the accruals back to cash over several years, although the
CFOs readily acknowledge that growth “muddies the picture.” In particular, when we asked CFOs how
they would go about evaluating the quality of earnings of a target company they were considering
acquiring using just public financial statements, one CFO advised “We go through and prove out the
revenue ties back to cash. You just go through all the accruals to make sure that they’re right, or how are
they done really. So in essence it’s saying ‘if we put these financial statements together, would we have
done the same thing?’ And if it’s different, why is it different?” Another CFO echoes a similar point:
“one of the first things we do is just go to the balance sheet. See what’s on the balance sheet, and then
compare that with the actual experience in terms of payment. Look at their history.”
6.6.8 Consistency
One CFO stressed the importance of applying the policies and principles consistently over time:
“Well, if the accounting policies and principles are not being consistently applied, that’s a huge red flag,
and there better be a doggone good reason that something changed. If I started changing how we were
reserving the board’s compensation and general liability expense, you should ask why. Because that is
not managing the business, that’s making a change. You’d want to look at the discount rate being used

66
for pension liabilities – is there a change? Why? You’d want to look at the discount rates in all the
behind the scenes math that supports stock option expense and stock compensation expense and say why
– why has it changed. If there’s a good reason for it, great. But if there’s not a very good reason, you
have to say hmm, what’s up with that?” Another CFO opined “If revenues are jumping all over the place
as opposed to showing a pattern of growth over time, it’s usually an indicator that the underlying drivers
may not be stable. If things run up too fast, too soon, then I say “ok, what’s caused that run-up?” and I
look at the underlying drivers.”
6.6.9 Short sellers
Standard setter # 2 suggests talking to short sellers to unearth red flags. He remarks “they are the
most motivated people to try to understand the truth. I find that personally, some of the people in the
long-only funds don’t want to know the truth.”
6.6.10 Specific red flags
(i) Pension accounting: One CFO suggested “to the extent that management is changing assumptions in a
way that could materially affect the reporting is an issue. Now, one is supposed to every year true the
pension accounting up and use new long-term assumptions, and that’s fine. But when they make changes
that lead to them being different than everybody else, it’s kind of a red flag.”
(ii) Use of subsidiaries and off-balance entities: An interviewed CFO points out “when you see a
company that has subsidiaries that for whatever reason you learn about and are not reported as part of the
entire company, that’s questionable and is a red flag.”
(iii) Basis for recognition of income: “Another has to do with the recognition of income, and on what
basis is revenue being recognized, or expenses. For instance, if you have a contractor who is capitalizing
interest on all developments, one might start asking some questions in that case.” Along similar lines, a
CFO commented about due-diligence practices they follow about ensuring quality earnings at the
company they are trying to acquire: “We look at revenue recognition first and foremost. Then, we look at
reconciliations. Then, we look at reserving practices, and spend a ton of time on tax accounts.”

67
(iv) Non-financial metrics: One CFO remarked that disclosure of non-financial metrics is becoming
increasingly important but some companies manipulate those metrics: “I've come out of a world of
subscribers, and trust me people can tout subscribers that, in other peoples’ minds, shouldn't be
considered a subscriber at all. So make sure you understand the underlying metrics of the business, and
the basis of how they're calculating those metrics.”
6.6.11 Real earnings management is harder to detect but often more damaging
Several CFOs thought that earnings are often managed using real actions such as cutting R&D,
maintenance expenses and marketing expenditures and these cuts are value decreasing but distinguishing
between business-driven economic reasons to cut spending versus opportunistic cuts aimed at hitting
earnings targets is difficult for an outside analyst. One of the CFOs commented “I think you can look at
which is driving which? Is it the accounting trying to drive the business or the business driving the
accounting? Yes, you can cut marketing, yes you can cut R&D, yes you can structure transactions, if you
think about those though, you’re going to need to ask the questions, if it’s not disclosed: well, tell me
about your marketing spends, tell me about your R&D spends, and because many times it may not be
evident, because it’s going to be buried, and a company may or may not disclose it. So that’s one of those
things I would say that should be asked when investors are talking with management and on public
conference calls. How are you doing spending on your brands this quarter? How’s your R&D pipeline
going, are you still investing? So I think there are some ways to determine real earnings management, but
it’s going to require more rigorous analysis and questioning of management than is available in the
financial statements.” He goes on to clarify “and by the way, cutting marketing may be the right decision,
if you’re let’s say in a country where your volumes are down, revenues are not increasing perhaps
because of a recession. So that is an appropriate business decision (and does not imply that you are)
cutting marketing because you just have to hit an earnings target for the quarter.”

68
7.0 Conclusions
We analyze 169 survey responses from public firms and 12 interviews with CFOs and two with
standard setters about earnings quality. Most respondents believe that high quality earnings are
sustainable, free of one-time items, and are backed by actual cash flows. Turning to more specific and
observable characteristics of earnings, they add that high quality earnings results from consistent
reporting choices over time, and avoiding long-term estimates. They believe that about half of earnings
quality is determined by innate factors, i.e., by forces outside manager’s immediate control. In terms of
economic prevalence and importance, they estimate that in any given period about 20% of firms manage
earnings to misrepresent their economic performance, and for such firms 10% of the typical EPS number
is managed (in interpreting these point estimates, it is useful to keep in mind that the questions are
phrased narrowly, so these numbers are best understood as lower bounds). Their answers indicate that
only about 60% of earnings management is from income-increasing as compared to income-decreasing
activities, which may seem somewhat surprising given that the extant earnings management literature
emphasizes income-increasing motivations but is understandable given that in the inter-temporal shifting
of earnings income-increasing and income-decreasing are two sides of the same phenomenon.
CFOs believe that outside observers find it hard to unravel earnings management, especially
when such earnings are managed using real actions. However, they do suggest several new avenues for
inquiry into how to detect earnings management from public data. Many believe that better earnings
quality lowers investor confusion and the cost of capital and increases company valuations. Most believe
strongly in the matching principle and in the primacy of the income statement over the balance sheet.
Most CFOs are not fans of fair value accounting, although they think it does have a place in the reporting
for financial firms, and for financial assets and liabilities for regular firms.
There is a strong feeling that executives take financial reporting rules as exogenous and given, i.e.,
they view reporting as a compliance issue rather than as an area where they can compete and innovate for
better access to capital. CFOs have a strong aversion to changes and FASB’s frequent alteration of the
rules, citing high cost of adoption and compliance, and investor confusion and the corresponding

69
continued need for guidance and explanation. Several CFOs lament that the absence of reporting
discretion and the consequent slavish compliance with rules affects the training process of younger
auditors and the quality of the profession.

70
References: Ball, R., and L. Shivakumar. 2008. How Much New Information Is There in Earnings? Journal of
Accounting Research 46: 975-1016. Barth, Mary and Wayne Landsman, 1995, Fundamental issues related to using fair value accounting for
financial reporting. Accounting Horizons 9, 97-107. Barsky, R. B., M. S. Kimball, F. T. Juster, and M. D. Shapiro, 1997, Preference parameters and
behavioral heterogeneity: An experimental approach in the health and retirement survey, Quarterly Journal of Economics, 112 (2), 537-579.
Bamber, Linda, J. Jiang, and I. Wang. 2010. What’s my style? The influence of top managers on voluntary corporate financial disclosure. The Accounting Review 85: 1131–1162.
Beaver, William H., Maureen F. McNichols, Karen K. Nelson, 2007, An alternative interpretation of the discontinuity in earnings distribution, Review of Accounting Studies 12, 525-556.
Bertrand, Marianne and Antoinette Schoar, 200, Managing with Style: The Effect of Managers on Firm Policies. Quarterly Journal of Economics, 2003, 118(4), pp. 1169-208.
Benston, George, 2003, The Regulation Of Accountants And Public Accounting Before And After Enron. Emory Law Journal 52(3): 1325-1351.
Benston, George, and Al L. Hartgraves, 2002, Enron: what happened and what we can learn from it, Journal of Accounting and Public Policy 23 (3), 105-127.
Benston, George, Michael Bromwich, Robert E. Litan, and Alfred Wagenhofer, 2006, Worldwide Financial Reporting: The Development and Future of Accounting Standards (New York: Oxford University Press.
Christensen, J., and J. Demski. 2003. Accounting Theory: An Information Content Perspective. Columbus, OH: McGraw-Hill/ Irwin.
Dechow, Patricia, 1994, Accounting earnings and cash flows as measures of firm performance: The role of accounting accruals, Journal of Accounting and Economics 18, 3-42.
Dechow, Patricia, and Ilia Dichev, 2002, The quality of accruals and earnings: The role of accrual estimation errors, The Accounting Review 77 (Supplement), 35-59.
Dechow, Patricia, S.P. Kothari, and Ross Watts, 1998. The relation between earnings and cash flows," Journal of Accounting and Economics 25(2), 133-168.
Dechow, Patricia, Weili Ge, and Catherine Schrand, 2010, Understanding earnings quality: A review of the proxies, their determinants and their consequences, Journal of Accounting and Economics 50, 344-401.
Dechow, Patricia, and Catherine Schrand, 2004, Earnings quality, The Research Foundation of CFA Institute.
Durtschi, C., Easton, P., 2005. Earnings management? The shapes of the frequency distributions of earnings metrics are not evidence ipso facto. Journal of Accounting Research 43 4: 557-592.
Dyreng, Scott., Michele Hanlon, and Ed Maydew. 2010. The effects of executives on corporate tax avoidance. The Accounting Review 85: 1163–1189.
FASB/IASB. 2006. Conceptual Framework for Financial Reporting: Objective of Financial Reporting and Qualitative Characteristics of Decision-Useful Financial Reporting Information.
Francis, Jennifer, Ryan LaFond, Per M. Olsson and Katherine Schipper, 2004, Costs of equity and earnings attributes, The Accounting Review 79, 967-1010.

71
Ge, Weili., Dawn Matsumoto, and J. Zhang 2010. Do CFOs have styles of their own? An empirical investigation of the effect of individual CFOs on financial reporting practices. Working paper, University of Washington.
Graham, John R., Harvey, Campbell R. and Puri, Manju, Capital Allocation and Delegation of Decision-Making Authority Within Firms (August 27, 2010). Available at SSRN: http://ssrn.com/abstract=1527098
Graham, John, Campbell Harvey, and Shivaram Rajgopal, 2005, The economic implications of corporate financial reporting, Journal of Accounting and Economics 40, 3-73.
Guay, Wayne, S.P. Kothari, and Ross L. Watts, 1996, A market-based evaluation of discretionary accrual models, Journal of Accounting Research.
Healy, Paul M., and James M. Wahlen, 1999, A review of the earnings management literature and its implications for standard setting, Accounting Horizons, 365-383.
Holthausen, R., Watts, R., 2001. The relevance of the value-relevance literature for financial accounting standard setting. Journal of Accounting & Economics 31, 3–75.
Institute of Chartered Accountants of England and Wales (ICAEW). Measurement in Financial Reporting. Kothari, S.P., Ted E. Laguerre, and Andrew J. Leone, 2002, Capitalization versus expensing: evidence on
the uncertainty of future earnings from capital expenditures versus R&D outlays, Review of Accounting Studies 7, 355-382.
Kothari, S., Ramanna, K., Skinner, D., 2010. Implications for GAAP from an analysis of positive research in accounting. Journal of Accounting and Economics 50: 246–286.
McVay, Sarah, 2006, Earnings management using classification shifting: An examination of core earnings and special items, The Accounting Review 81 (3), 501–531.
Melumad, Nahum D., and Doron Nissim, 2008, Line-item analysis of earnings quality, Foundations and Trends in Accounting, Vol. 3, Nos. 2-3, 87-221.
O’Glove, Thornton L., 1998, Quality of earnings, Free Press. Paton, William A. and A. C. Littleton, 1940, An introduction to corporate accounting standards,
American Accounting Association, Sarasota, Florida. Pincus, Karen, William Holder, and Theodore J. Mock. 1998. Reducing the incidence of fraudulent
financial reporting: The role of the Securities and Exchange Commission. Los Angeles, CA: SEC Financial Reporting Institute of the University of California.
Ramanna, Karthik and Ross. L. Watts, 2007, Evidence on the effects of unverifiable fair-value accounting Harvard Business School Working Paper No. 08-014. Available at SSRN: http://ssrn.com/abstract=1012139
Richardson, Scott A., Richard G. Sloan, Mark T. Soliman and Irem Tuna, 2005, Accrual Reliability, Earnings Persistence and Stock Prices. Journal of Accounting and Economics, Vol. 39, No. 3, 437-485.
Schipper, K., 2005. Fair values in financial reporting. Presentation at American Accounting Association Annual Meetings, August 2005. Available at:/http://fars.org/2005AAAFairValueKSchipper.pdf.
Schipper, Katherine and Linda Vincent. 2003. Earnings Quality. Accounting Horizons 17: 97-110. Skinner, Douglas and Richard, Sloan. 2002. Earnings surprises, growth expectations, and stock returns, or,
don’t let an earnings torpedo sink your portfolio. Review of Accounting Studies 7, 289–312. Sivakumar, Kumar, and Gregory Waymire, 2003, Enforceable accounting rules and income measurement
by early 20th century railroads, Journal of Accounting Research 41 (2), 397-432. Sloan, Richard, 1996, Do stock prices fully reflect information in accruals and cash flows about future
earnings?, The Accounting Review 71, 289-316.

72
Storey, Reed K. and Sylvia Storey, 1998, The framework of financial accounting concepts and standards (Special report), Financial Accounting Standards Board, Norwalk, CO.
Sunder, Shyam. 2002. Regulatory competition for low cost-of-capital accounting rules, Journal of Accounting and Public Policy 21: 147
Sunder, Shyam. 2005. Minding our manners: Accounting as social norms (plenary address, British Accounting Association, Edinburgh, Scotland, March, 2005): 1–2.
Sunder, Shyam. 2010. Adverse effects of accounting uniformity on practice, education, and research. Journal of Accounting and Public Policy 29(2): 99-114.
Sudman, Seymour and Norman Bradburn, 1983, Asking Questions: A Practical Guide to Questionnaire Design, San Francisco: Jossey Bass.
Teoh, Siew Hong, Ivo Welch, and T.J. Wong, 1998, Earnings management and the long-run market performance of initial public offerings, The Journal of Finance 53, 1935-1974.
Watts, Ross L., 2003a, Conservatism in accounting Part II: Explanations and implications, Accounting Horizons 17.
Watts, Ross L., 2003b, Conservatism in accounting Part II: Evidence and research opportunities, Accounting Horizons 17.
Watts, R.L. and J.L. Zimmerman, 1986. Positive Accounting Theory. Englewood Cliffs, N.J.: Prentice-Hall.

73
Table 1 Panel A: Demographic characteristics of the survey participants (N = 402)
Ownership Percent Risk Averse Percent Public 42.04 Yes 10.22 Private 51.24 No 89.78 Government or Non-Profit
6.72
Revenues Executive Age < $25 million 9.18 <40 4.81 $25 - $99 million 21.17 40-49 28.61 $100 - $499 million 24.49 50-59 47.09 $500 - $999 million 9.18 ≥60 19.49 $1 - $4.9 billion 15.56
$5 - $9.9 billion 8.42 Executive Tenure >$10 billion 11.99 <4 years 26.08 4-9 years 32.41 Industry 10-19 years 23.80 Retail/Wholesale 12.66 ≥20 years 17.72 Mining/Construction 4.65 Manufacturing 30.49 Executive Education Transportation/Energy 5.68 Some College 0.50 Communications/Media 3.36 BA or BS 39.80 Tech [Software/Biotech] 5.17 MBA 52.39 Banking/Finance/Insurance 12.92 Non-MBA Masters 7.30 Service/Consulting 6.46 Healthcare/Pharmaceutical 8.27 Executive Background*
Other 10.34
Corporate Finance 36.92 Public Accounting 31.00 Insider Ownership Other Accounting 17.92 <5% 35.08 Investment Banking 2.15 5-10% 21.00 Credit Officer 1.79 11-20% 8.01 Other 5.56 >20% 35.91 Proportion of Foreign Sales
Institutional Ownership
0% 33.16 <5% 45.56 1-24% 37.28 5-10% 3.72 25-50% 18.77 11-20% 4.87 >50% 10.80 >20% 45.85 *Total percentages add up to more than 100% because respondents could choose more than 1 option. Note: Frequencies are based on non-missing observations.

74
Table 1 Panel B: Pearson correlation coefficients of the demographic variables (N = 402)
Profitable P/E Ratio Sales Growth Firm Age
Insider Ownership
Institutional Ownership
Executive Age
Executive Tenure
Executive Education
Risk Averse Revenue
P/E Ratio -0.183** Sales Growth 0.013 -0.003 Firm Age -0.121** -0.006 -0.156*** Insider Ownership -0.051 -0.023 -0.057 -0.188*** Institutional Ownership 0.067 0.072 0.088 0.041 -0.486*** Executive Age 0.010 0.128 -0.026 0.032 0.152*** -0.198*** Executive Tenure -0.099** -0.010 -0.058 0.151*** 0.093* -0.078 0.232*** Executive Education -0.059 -0.047 0.123** 0.079 -0.063 -0.004 -0.073 -0.109** Risk Averse 0.089* 0.030 0.000 0.025 0.038 -0.059 0.069 0.090* -0.046 Revenue -0.170*** 0.041 0.025 0.417*** -0.481*** 0.447*** -0.141*** 0.063 0.056 -0.009 Debt/Assets 0.083 -0.172** -0.070 -0.081 -0.035 0.108** -0.038 0.006 -0.021 -0.001 -0.100* Note: Demographic correlations for executive age, executive tenure, executive education, risk aversion, revenues, insider ownership, and institutional ownership are based on the categories defined in Table 1, Panel A. Profitability, P/E ratio, sales growth, firm age, and debt/assets are directly drawn from the survey responses. *, **, *** correspond to p-values = <0.1, 0.05, 0.01, respectively.

75
Table 1 Panel C: Representativeness of interviewed firms
Variable Sample
average Sample median
Compustat breakpoint quintiles 1 2 3 4 5
Universe avg. 1008.23 1885.04 2221.54 4667.33 31257.16 Sales Sample avg. 24076.81 10420.03 274.34 1964.34 2309.00 5802.60 41448.67
Sample size 1 1 1 2 6 Sample % 9.09% 9.09% 9.09% 18.18% 54.55% Universe avg. -0.19 -0.04 0.10 0.30 1.46
Sales growth Sample avg. -0.01 -0.05 -0.20 -0.05 0.29 Sample size 4 4 3 Sample % 36.36% 36.36% 27.27% Universe avg. 0.00 0.09 0.19 0.28 0.45
Debt/Assets Sample avg. 0.23 0.25 0.08 0.18 0.28 0.41 Sample size 3 2 4 2 Sample % 0.00% 27.27% 18.18% 36.36% 18.18% Universe avg. 0.00 0.00 0.01 0.02 0.04
Dividend yield Sample avg. 0.01 0.01 0.00 0.01 0.02 0.04 Sample size 5 1 4 1 Sample % 45.45% 0.00% 9.09% 36.36% 9.09% Universe avg. -8.90 0.72 1.31 1.97 4.12
Earnings per Sample avg. 1.06 1.37 -2.41 0.59 1.37 1.90 3.18 share Sample size 2 3 1 2 3
Sample % 18.18% 27.27% 9.09% 18.18% 27.27% Universe avg. B+ BB+ BBB BBB+ A+
Credit rating Sample avg. BBB+ BBB+ B+ BB BBB+ AA- Sample size 2 1 2 4 Sample % 18.18% 9.09% 0.00% 18.18% 36.36% Universe avg. -77.92 11.94 15.64 19.33 41.91
Price to earnings Sample avg. 15.62 18.70 -4.73 4.48 14.72 18.80 28.97 ratio Sample size 2 1 1 4 3
Sample % 18.18% 9.09% 9.09% 36.36% 27.27% Universe avg. 11.56 14.88 17.10 22.01 47.05
Price to earnings Sample avg. 20.14 19.32 4.48 14.72 17.75 22.42 36.90 ratio (>0) Sample size 1 1 2 4 1
Sample % 11.11% 11.11% 22.22% 44.44% 11.11% The table reports summary statistics on the representativeness of the interviewed (panel C) firms relative to the universe of firms listed on the NYSE, AMEX, and NASDAQ and with CRSP share codes of 10 or 11. Comparison is based on the following variables: Sales, Sales growth, Debt-to-assets, Dividend yield, Earnings per share, Credit rating, and Book-to-market value. Since companies report their own debt-to-asset ratio, dividend yield, credit rating and earnings per share on the survey, we employ these in the analysis below. We match all the Compustat firms listed on the NYSE, AMEX, and NASDAQ and with CRSP share codes of 10 or 11 with our interviewed /or surveyed firms based on +/- 20% sales and two digit SIC. The matched firms represent the universe of this table. The information for the universe of firms is obtained from Compustat: 1) Sales, is based on Data12-Sales(net); 2) Sales growth, is calculated as the percentage of sales over 3 years; 3) Debt-to-asset, is based on Data9-long term debt divided by Data6-total assets; 4) Dividend yield, is the ratio of

76
Data26 divided by the firm’s stock price, Data24; 5) Earnings per share is Data58-EPS (basic) excluding extraordinary items; 6) Credit rating, is Compustat variable SPDRC: S&P long term domestic issuer credit rating; 7) Book to market is total stockholders’ equity, Data216, divided by size, where size is computed as the product of price, Data24, and common shares outstanding, Data25. For each variable we identify all candidate firms listed on the three major exchanges with valid data on Compustat and share codes 10 and 11 on CRSP as of December 2011. We then sort all firms with valid data into quintiles and record the corresponding breakpoints. For each quintile we report in panel C the percentage of the interviewed firms that are in these five sorts. The reported percentages can then be compared to the benchmark 20%.

77
Table 1 Panel D: Representativeness of surveyed public firms (total possible N= 169)
Variable Sample
average Sample median
Compustat breakpoint quintiles 1 2 3 4 5
Universe avg. 18.06 82.08 271.01 936.52 12070.49 Sales Sample avg. 4807.20 2950.00 218.09 2289.85 7450.00 10000.00
Sample size 33 60 28 44 Sample % 20.00% 36.36% 16.97% 26.67% 0.00% Universe avg. 0.00 0.01 0.08 0.21 0.57
Debt/Assets Sample avg. 0.28 0.25 0.05 0.19 0.27 0.37 0.61 Sample size 33 37 34 29 28 Sample % 20.50% 22.98% 21.12% 18.01% 17.39% Universe avg. B- B+ BB BBB A
Credit rating Sample avg. A A- BB BBB A- AA- AA+ Sample size 29 22 36 31 32 Sample % 19.33% 14.67% 24.00% 20.67% 21.33% Universe avg. --55.16 -2.84 7.37 17.04 79.01
Price to earnings Sample avg. 13.82 13.40 7.65 11.83 14.19 16.00 22.34 ratio Sample size 34 20 36 11 25
Sample % 26.98% 15.87% 28.57% 8.73% 19.84% Universe avg. 7.40 13.20 17.55 25.48 119.03
Price to earnings Sample avg. 13.93 13.80 7.88 11.83 14.19 16.00 22.34 ratio (>0) Sample size 33 20 36 11 25
Sample % 26.40% 16.00% 28.80% 8.80% 20.00% The table reports summary statistics on the representativeness of the surveyed firms (Panel D) relative to the universe of firms listed on the NYSE, AMEX, and NASDAQ and with CRSP share codes of 10 or 11. Comparison is based on the following variables: Sales, Debt-to-assets, Credit rating, and Price to earnings ratio. Since companies report their own sales, debt-to-asset ratio, credit rating and price to earnings ratios on the survey, we employ these in the analysis below. The universe of firms in this table is all firms in Compustat that are listed on the NYSE, AMEX, and NASDAQ and with CRSP share codes of 10 or 11.The information for the universe of firms is obtained from Compustat: 1) Sales, is based on Data12-Sales(net); 2) Debt-to-asset, is based on Data9-long term debt divided by Data6-total assets; 3) Credit rating, is Compustat variable SPDRC: S&P long term domestic issuer credit rating; 4). Price to earnings ratio, is calculated as Data 24- price divided by Data 58-EPS (basic) excluding extraordinary items. For each variable we identify all candidate firms listed on the three major exchanges with valid data on Compustat and share codes 10 and 11 on CRSP as of December 2011. We then sort all firms with valid data into quintiles and record the corresponding breakpoints. For each quintile we report in panel C the percentage of the surveyed firms that are in these five sorts. The reported percentages can then be compared to the benchmark 20%. All firms contained in sample calculations are public.

78
Table 2 Survey responses to the question: Rate the importance of earnings: Unconditional Averages Question % of respondents who answered Very Important
(5 or 4) Important (3)
Not Important (2 or 1)
Average Rating
H0: Average Rating =1
H0: Average Rating =3
(1) For use by investors in valuing the company
94.67 2.96 2.37 4.72 *** ***
(2) For use in debt contracts 82.15 11.31 6.55 4.14 *** *** (3) For use by the company's own
managers 80.48 12.43 7.10 4.15 *** ***
(4) For use in executive compensation contracts
78.70 13.61 7.70 4.11 *** ***
(5) For use by outsiders in evaluating the company's managers
62.72 23.67 13.61 3.67 *** ***
(6) For use by current and prospective employees
45.24 36.90 17.86 3.33 *** ***
(7) For use by current and prospective suppliers
41.42 36.69 21.89 3.25 *** ***
(8) For use by current and prospective customers
40.24 37.28 22.49 3.22 *** ***
(9) For use in negotiations with labor
32.74 30.36 36.91 2.89 ***
Respondents were asked to indicate the level of importance of statements on a scale of 1(not important) to 5(very important). The table reports summary statistics for the responses from all public firms surveyed. Columns 1- 5 present the percent of respondents indicating importance levels of 5 (very important) through 1 (not important) for each statement. Column 6 reports the average rating, where higher values correspond to higher importance. Column 7 reports the results of a t-test of the null hypothesis that each average response is equal to 1 (not important), and column 8 reports the results of a t-test of the null hypothesis that each average response is equal to 3 (important). ***, **, and * denote rejection at the 1%, 5%, and 10% levels, respectively.

79
Table 3 Summary of the responses to the open-ended question “What does the concept of earnings
quality mean?”
Panel A: Ranked summary of CFO responses CFO’s concept of earnings quality Comment Sustainable, Repeatable, Recurring, Consistent, Reflects long-term trend, has the highest chance of being repeated in future periods
This is the dominant and most common idea of earnings quality
Free from special or one-time items, not from reserves, fair value adjustments, accounting gimmicks, market fluctuations, gains/losses, fluctuations in effective tax rates, F/X adjustments
Very common, essentially the converse of “sustainable,” typically the two are expressed together
Earnings that are backed by cash flows Third most common, often combined with the first two
Accurately reflects economic reality, accurately reflects the results of operations
Common – but not helpful operationally
Consistently reported, consistently applied GAAP Moderately common Accurate application of GAAP rules Moderately common Quality earnings come from normal (core) operations Moderately common, essentially a
variation on “sustainable” above Regular revenues minus regular expenses, normal margin on revenues
Moderately common, essentially a variation on “sustainable” above
Sustainable in the face of adversity (macro, operations) Occasional, variation on “sustainable” above
Growing Occasional Conservative Occasional EBITDA Rare Panel B: Selected direct quotes from CFOs illustrating the summary concepts in Panel A above “Repeatable earnings based on the core operations of the company” “Earnings quality relates to sustainability and cash flow-driven earnings” “Consistent, repeatable income” “Consistent profitability from core business segments that tracks with sales growth” “How closely the current reported earnings relates to the true long-term earnings of the company” “Earnings generated by core business operations that are considered sustainable and exclude the impact of any material non-recurring items” “Earnings based fundamentally on sales realized in cash from continuing customers that are likely to repeat”

80
Table 4 Survey responses to the question: To what extent do you agree that this statement captures important features of "high quality earnings" Unconditional Averages
Question %Strongly agree or weakly agree (5 or 4)
%Weakly disagree or strongly disagree (2 or 1)
Average Rating
H0: Average Rating =3
(1) Reflect consistent reporting choices over time 94.05 2.98 4.49 *** (2) Avoid long term estimates as much as possible 86.39 3.55 4.28 *** (3) Are sustainable 80.47 7.10 4.25 *** (4) Are useful predictors of future earnings 78.57 8.33 4.07 *** (5) Are useful predictors of future cash flows 75.74 7.10 4.07 ***
(6) Have accruals that are eventually realized as cash flows 75.74 9.46 4.04 ***
(7) Do not include one-time or special items 71.43 16.07 3.92 ***
(8) Require fewer explanations in company communications 69.23 14.80 3.80 ***
(9) Result from conservative recognition of assets and liabilities 59.28 13.77 3.64 ***
(10) Recognize losses in a more timely manner than gains 49.71 22.48 3.40 *** (11) Are less volatile than cash flows 40.24 28.41 3.15 * (12) Have fewer accruals 20.84 49.40 2.60 *** Respondents were asked to indicate the level of agreement with statements on a scale of 1(strongly disagree) to 5(strongly agree). The table reports summary statistics for the responses from all public firms surveyed. Column 1 presents the percent of respondents indicating agreement levels of 5 or 4 (strongly agree with or weakly agree with). Column 2 presents the percent of respondents indicating agreement levels of 2 or 1 (weakly disagree with or strongly disagree with). Column 3 reports the average rating, where higher values correspond to higher agreement. Column 4 reports the results of a t-test of the null hypothesis that each average response is equal to 3 (neutral). ***, **, and * denote rejection at the 1%, 5%, and 10% levels, respectively.

81
Table 5 Survey responses to the question: Rate the influence of the following on earnings quality
Unconditional Averages Question % of respondents who answered Highly influenced
by (5 or 4)
Somewhat influenced by (3)
Not at all influenced by (2 or 1)
Average Rating
H0: Average Rating =1
H0: Average Rating =3
(1) The business model of your company 73.96
16.57 9.47
3.91
***
***
(2) Accounting standards 60.36 24.26 15.38 3.72 *** *** (3) Your company's industry 56.81 30.18 13.01 3.62 *** *** (4) Macro-economic conditions 55.03 26.63 18.34 3.57 *** *** (5) Your company's internal controls 50.00 26.79 23.21 3.39 *** *** (6) Your company's board of directors
47.93
24.26 27.81
3.28
***
*** (7) Your company's reporting choices 43.19 24.85 31.95 3.17 *** * (8) How fast the operating cycle
converts accruals to cash flows at your company 40.24
34.32 25.44
3.24
***
** (9)
Your company's audit committee 40.23
26.63 33.13
3.07
***
(10) Your company's disclosure policy 39.05 28.99 31.95 3.1 *** (11) Analysts that follow your company 38.69 25.6 35.72 2.98 *** (12) Your company's external auditor
37.87
32.54 29.58
3.08
***
(13) The SEC's enforcement process 29.76 28.57 41.67 2.76 *** ** (14) Prospect of litigation
22.62
29.17 48.21
2.63
***
*** Respondents were asked to indicate the level of influence of statements on a scale of 1(not at all influenced by) to 5(highly influenced by). The table reports summary statistics for the responses from all public firms surveyed. Columns 1- 5 present the percent of respondents indicating influence levels of 5 (highly influenced by) through 1 (not at all influenced by) for each statement. Column 6 reports the average rating, where higher values correspond to higher influence. Column 7 reports the results of a t-test of the null hypothesis that each average response is equal to 1 (not at all influenced by), and column 8 reports the results of a t-test of the null hypothesis that each average response is equal to 3 (somewhat influenced by). ***, **, and * denote rejection at the 1%, 5%, and 10% levels, respectively.

82
Table 6 Survey responses to the question: To what extent do innate factors influence earnings quality at your company (from 0-100) with 0 is no innate
and 100 is all innate? Unconditional Averages
Obs. Mean
Median Std. Dev. Min Max
% greater than 75
% greater than 50
% less than 50
% less than 25
160 49.98 50.00 22.19 5.00 100.00 15.04 46.36 20.00 17.50 Respondents were asked to indicate the extent that innate factors influence earnings quality on a scale of 0 (not influential) to 100(very influential). Panel A reports summary statistics for the responses from all public firms surveyed. Columns 1-6 present the number of respondents, mean, median, standard deviation, minimum, and maximum of the answers, respectively. Columns 7-10 present the percent of respondents who answered greater than 75, greater than 50, less than 50, and less than 25, respectively.

83
Table 7 Panel A Survey responses to the question: How much discretion in financial reporting does the current accounting standard-setting regime in the United States allow (-10 - +10) with -10 being too little discretion and +1) being too much discretion. Unconditional Averages
Obs. Mean
Median Std. Dev. Min Max
% greater than 0 % less than 0 H0: Mean=0
147 -0.78 -1.00 3.74 -10 8 29.24 50.33 ** Respondents were asked to indicate the level of discretion given by the current accounting standard-setting regime on a scale of -10 (too little discretion) to 10 (too much discretion). Panel B reports summary statistics for the responses from all public firms surveyed. Columns 1-6 present the number of respondents, mean, median, standard deviation, minimum, and maximum of the answers, respectively. Columns 7 and 8 present the percent of respondents who answered greater than 0 (neutral) and less than 0, respectively. Column 9 reports the results of a t-test of the null hypothesis that the mean response is equal to 0 (neutral). ***, **, and * denote rejection at the 1%, 5%, and 10% levels, respectively. Panel B: Survey responses to the question: Relative to 20 years ago, or to when you first became familiar with financial reporting practices, indicate the extent to which you believe companies today have more or less discretion in financial reporting (-10 - +10) with -10 being too little and +10 being too much discretion: Unconditional Averages
Obs. Mean
Median Std. Dev. Min Max
% greater than 0 % less than 0 H0: Mean=0
164 -4.22 -5.00 5.00 -10 10 17.08 81.11 *** Respondents were asked to indicate the current level of discretion compared to 20 years ago on a scale of -10 (less discretion today) to 10 (more discretion today). Panel C reports summary statistics for the responses from all public firms surveyed. Columns 1-6 present the number of respondents, mean, median, standard deviation, minimum, and maximum of the answers, respectively. Columns 7 and 8 present the percent of respondents who answered greater than 0 (neutral) and less than 0, respectively. Column 9 reports the results of a t-test of the null hypothesis that the mean response is equal to 0 (neutral). ***, **, and * denote rejection at the 1%, 5%, and 10% levels, respectively.

84
Table 7 (continued)
Panel C: Survey responses to the question: To what extent have you found that written accounting standards limit your ability to report high quality earnings (from 0-100 where 0 stands for not all limiting and 100 for very limiting)? Unconditional Averages
Obs. Mean
Median Std. Dev. Min Max
% greater than 75
% greater than 50
% less than 50
% less than 25
152 35.57 31.00 22.13 0 90 5.26 22.39 71.76 36.21 Respondents were asked to indicate the extent that written accounting standards limit the ability to report high-quality earnings on a scale of 0 (not at all limiting) to 100(very limiting). The table reports summary statistics for the responses from all public firms surveyed. Columns 1-6 present the number of respondents, mean, median, standard deviation, minimum, and maximum of the answers, respectively. Columns 7-10 present the percent of respondents who answered greater than 75, greater than 50, less than 50, and less than 25, respectively.

85
Table 8 Survey responses to the question: Rate the extent to which you agree with this statement about GAAP policies that are likely to produce
"high quality earnings" Unconditional Averages
Question %Strongly agree or weakly agree (5 or 4)
%Weakly disagree or strongly disagree (2 or 1)
Average Rating
H0: Average Rating =3
(1) Policies that match expenses with revenues 92.22 2.40 4.59 ***
(2) Policies that use conservative accounting principles 75.44 7.79 4.04 ***
(3)
Policies that minimize long-term projections and revaluations as much as possible
65.27 19.76 3.68 ***
(4)
Policies that use fair value accounting only for financial assets/liabilities but not for operating assets/liabilities
53.57 25.00 3.37 ***
(5) Policies that minimize the volatility of reported earnings 41.32 35.33 3.07
(6) Policies that rely on historical costs as much as possible 40.72 25.15 3.21 **
(7) Policies that rely on fair value accounting as much as possible 38.09 39.88 2.91
Respondents were asked to indicate the level of agreement with statements on a scale of 1(strongly disagree) to 5(strongly agree). The table reports summary statistics for the responses from all public firms surveyed. Column 1 presents the percent of respondents indicating agreement levels of 5 or 4 (strongly agree with or weakly agree with). Column 2 presents the percent of respondents indicating agreement levels of 2 or 1 (weakly disagree with or strongly disagree with). Column 3 reports the average rating, where higher values correspond to higher agreement. Column 4 reports the results of a t-test of the null hypothesis that each average response is equal to 3 (neutral). ***, **, and * denote rejection at the 1%, 5%, and 10% levels, respectively.
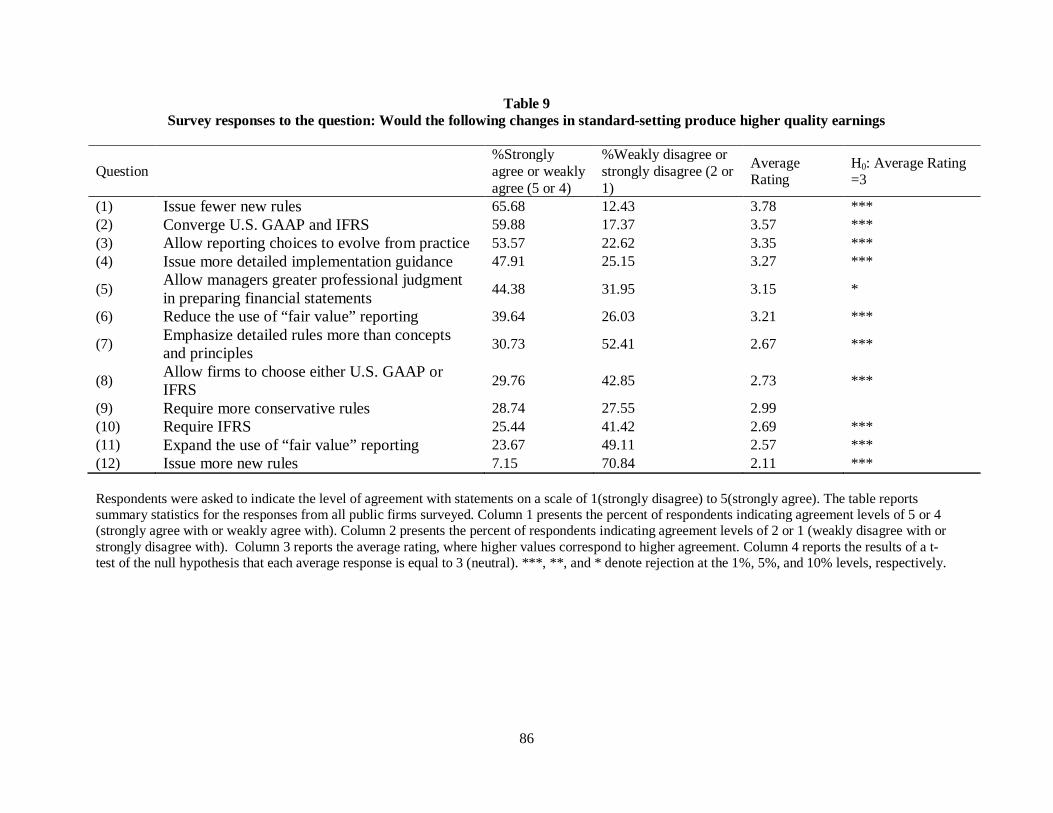
86
Table 9 Survey responses to the question: Would the following changes in standard-setting produce higher quality earnings
Question %Strongly agree or weakly agree (5 or 4)
%Weakly disagree or strongly disagree (2 or 1)
Average Rating
H0: Average Rating =3
(1) Issue fewer new rules 65.68 12.43 3.78 *** (2) Converge U.S. GAAP and IFRS 59.88 17.37 3.57 *** (3) Allow reporting choices to evolve from practice 53.57 22.62 3.35 *** (4) Issue more detailed implementation guidance 47.91 25.15 3.27 ***
(5) Allow managers greater professional judgment in preparing financial statements 44.38 31.95 3.15 *
(6) Reduce the use of “fair value” reporting 39.64 26.03 3.21 ***
(7) Emphasize detailed rules more than concepts and principles 30.73 52.41 2.67 ***
(8) Allow firms to choose either U.S. GAAP or IFRS 29.76 42.85 2.73 ***
(9) Require more conservative rules 28.74 27.55 2.99 (10) Require IFRS 25.44 41.42 2.69 *** (11) Expand the use of “fair value” reporting 23.67 49.11 2.57 *** (12) Issue more new rules 7.15 70.84 2.11 *** Respondents were asked to indicate the level of agreement with statements on a scale of 1(strongly disagree) to 5(strongly agree). The table reports summary statistics for the responses from all public firms surveyed. Column 1 presents the percent of respondents indicating agreement levels of 5 or 4 (strongly agree with or weakly agree with). Column 2 presents the percent of respondents indicating agreement levels of 2 or 1 (weakly disagree with or strongly disagree with). Column 3 reports the average rating, where higher values correspond to higher agreement. Column 4 reports the results of a t-test of the null hypothesis that each average response is equal to 3 (neutral). ***, **, and * denote rejection at the 1%, 5%, and 10% levels, respectively.

87
Table 10 Survey responses to the question: From your impressions of companies in general, in any given year, what percentage of companies use
discretion within GAAP to report earnings which misrepresent the economic performance of the business? Unconditional Averages
Obs. Mean
Median Std. Dev. Min Max
% greater than 0
% greater than 15 H0: Mean=0
163 18.43 15.00 17.24 0 100 99.37 40.47 *** Respondents were asked to indicate the percentage of companies that use discretion within GAAP to report earnings which misrepresent the economic performance of the business on a scale of 0 to 100. The table reports summary statistics for the responses from all public firms surveyed. Columns 1-6 present the number of respondents, mean, median, standard deviation, minimum, and maximum of the answers, respectively. Columns 7 and 8 present the percent of respondents who answered greater than 0 and greater than 15 (the median), respectively. Column 9 reports the results of a t-test of the null hypothesis that the mean response is equal to 0. ***, **, and * denote rejection at the 1%, 5%, and 10% levels, respectively.

88
Table 11 Survey responses to the question: For this question, consider only companies that use discretion within GAAP to misrepresent economic
performance. Among these firms, assume that earnings per share is $1 per share. Of this, how many cents per share is typically misrepresented? Panel A: Unconditional Averages
Obs. Mean
Median Std. Dev. Min Max
% less than 10
% greater than 10
163 9.85 10.00 8.81 1 65.50 45.39 22.70 Respondents were asked to indicate the number of cents per share (out of $1) that is typically misrepresented on a scale from 1 to 95.5. The table reports summary statistics for the responses from all public firms surveyed. Columns 1-6 present the number of respondents, mean, median, standard deviation, minimum, and maximum of the answers, respectively. Columns 7 and 8 present the percent of respondents who answered less than 10 (the median) and greater than 10, respectively.

89
Table 12: Survey responses to the question: Within a given year and among the companies that misrepresent performance, indicate the percentage of
firms that misrepresent by increasing earnings (vs. those that misrepresent by reducing earnings) Unconditional Averages
Obs. Mean
Median Std. Dev. Min Max
% greater than 50
H0: Mean=50
163 58.78 67.00 27.18 2 100 66.19 *** Respondents were asked to indicate the percentage of firms that misrepresent performance by increasing earnings on a scale of 0 to 100. The table reports summary statistics for the responses from all public firms surveyed. Columns 1-6 present the number of respondents, mean, median, standard deviation, minimum, and maximum of the answers, respectively. Column 7 presents the percent of respondents who answered greater than 50. Column 9 reports the results of a t-test of the null hypothesis that the mean response is equal to 50. ***, **, and * denote rejection at the 1%, 5%, and 10% levels, respectively.

90
Table 13 Survey responses to the question: Please rate the importance of the following motivation for companies that use earnings to misrepresent
economic performance
Question %Strongly agree or weakly agree (5 or 4)
%Weakly disagree or strongly disagree (2 or 1)
Average Rating
H0: Average Rating =3
(1) To influence stock price 93.45 6.55 4.55 ***
(2) Because there is outside pressure to hit earnings benchmarks 92.86 2.38 4.41 ***
(3) Because there is inside pressure to hit earnings benchmarks 91.02 4.19 4.28 ***
(4) To influence executive compensation 88.62 11.38 4.46 ***
(5) Because senior managers fear adverse career consequences if they report poor performance 80.36 8.33 4.02 ***
(6) To avoid violation of debt covenants 72.46 27.54 3.88 *** (7) Because there is pressure to smooth earnings 69.05 11.90 3.74 ***
(8) Because they believe such misrepresentation will likely go undetected
60.12 17.27 3.55 ***
(9) Because senior managers are overconfident or overoptimistic
49.41 23.81 3.40 ***
(10) To reduce expectations of future earnings 41.67 32.15 3.13
(11) To influence other stakeholders such as customers, suppliers and employees 37.73 25.15 3.16 **
(12) Because they feel other companies misrepresent performance 26.19 42.86 2.73 ***
Respondents were asked to indicate the level of agreement with statements on a scale of 1(strongly disagree) to 5(strongly agree). The table reports summary statistics for the responses from all public firms surveyed. Column 1 presents the percent of respondents indicating agreement levels of 5 or 4 (strongly agree with or weakly agree with). Column 2 presents the percent of respondents indicating agreement levels of 2 or 1 (weakly disagree with or strongly disagree with). Column 3 reports the average rating, where higher values correspond to higher agreement. Column 4 reports the results of a t-test of the null hypothesis that each average response is equal to 3 (neutral). ***, **, and * denote rejection at the 1%, 5%, and 10% levels, respectively.

91
Table 14: Red Flags: CFOs responses for signals that can be used to detect earnings that misrepresent
economic performance:
Rank Red Flag Count
1 GAAP earnings do not correlate with CFO; Weak cash flows; Earnings and CFO move in different direction for 6-8 quarters; Earnings strength with deteriorating cash flow.
101
2 Deviations from industry (or economy, peers’) norms/experience (cash cycle, volatility, average profitability, revenue growth, audit fees, growth of investments, asset impairment, A/P, level of disclosure)
88
3 Lots of accruals; Large changes in accruals; Jump in accruals/Sudden changes in reserves; Insufficient explanation of such changes ; Significant increase in capitalized expenditures; Changes in asset accruals, High accrued liabilities
71
4 Too smooth/too consistent of an earnings progression (relative to economy, market); Earnings and earnings growth are too consistent (irrespective of economic cycle and industry experience); Smooth earnings in a volatile industry
60
5 Large/frequent one-time or special items (restructuring charges, write-downs, unusual or complex transactions, Gains/Losses on asset sales)
57
6 Consistently meet or beat earnings targets (guidance, analyst forecasts) 46 7 (Frequent) Changes in (significant) accounting policies 28 8 Inventory build-up / age of raw materials; Build-up in work-in-progress; Mismatch
between inventory/COGS/reserves 26
9 High executive turnover; Sudden change in top management; Change in financial management; Sudden director turnover; Employee (non-management) turnover
26
10 Using non-GAAP (and/or changing) metrics 25 11 Build-ups of receivables; Deterioration of receivables days outstanding; A/R
balance inconsistent with cash cycle projections/Allowance for doubtful accounts 25
12 Large volatility (Wide swings) in earnings, especially without real change in business
25
13 SEC filings becoming less transparent; Uninformative MD&A; Complex footnotes; Complexity of financials; Lack of understanding how cash is generated; Poor communication to outsiders
20
14 Major jumps or turnarounds; Break with historical performance; Unexplained volatility in margins
17
15 (Repeated) Restatement of earnings/prior period adjustments 16 16 Large incentive compensation payment; Misalignment of management
compensation incentives; Management turnover after bonus payments 16
17 Sudden change in auditors; Auditors’ report; Exceptions in audit report 12 18 “Tone from the top”; Internal controls; Reporting of internal control weakness 11 19 Significant use of (aggressive) long-term estimates (including resulting volatility in
balances); Unusual reliance on accounts requiring management judgment/estimates; Changes in estimates, Lack of explanatory detail on estimates
11