epubs.surrey.ac.ukepubs.surrey.ac.uk/813820/13/cumulative welfare paper final submit… · web...
TRANSCRIPT

Refinement through development of a quantitative system for retrospective assessment of life
time experience and cumulative severity of procedures
Sarah Wolfensohn1*, Sally Sharpe2, Ian Hall2, Steve Lawrence2, Samantha Kitchen2 & Mike Dennis2
Running Title: Assessment of cumulative severity
1* Corresponding author: University of Surrey, Faculty of Health and Medical Sciences, School of
Veterinary Medicine, Duke of Kent Building, Guildford, Surrey GU2 7XH, UK.
2Public Health England, Porton Down, Salisbury, SP4 0JG
Abstract:
This paper proposes a system that uses intrinsic study data to provide an easily understandable
visualisation of the stresses involved during the animal’s life history that can be applied to all
types of studies, even those not requiring invasive techniques. Thus it provides an opportunity for
researchers to identify and refine key events which impact on the welfare of an animal, and to
explain clearly to a lay audience the totality of any necessary harms when justifying the research.
Assessment of animal welfare depends on measurement of a number of parameters which will
vary according to species, the animal's environment and the scientific procedure, all of which are
inter-related. Currently there are few tools to assess cumulative suffering or even, in some cases,
to recognise that it exists. A matrix to assess cumulative severity has been applied retrospectively
1
1
2
3
4
5
6
7
8
9
10
11
12
13
14
15
16
17
18
19

to programmes of work involving macaques. Lifetime records, available for animals from their
birth in the breeding colony through to experimental use in vaccine efficacy evaluation studies,
were analysed as a robust validation test for the assessment matrix and refinement of the way in
which information on these events is captured. A meaningful assessment method is required
prospectively for project licence applications and retrospectively for licence review or decisions
on re-use. The analysis will provide information on how refinements can be made that will
optimally enhance the lives of experimental animals.
Keywords: Animal welfare, life time experience, cumulative severity, retrospective assessment,
refinement of procedures, macaque models of infectious disease
Introduction
The EU Directive 2010/63 on the protection of animals used for scientific procedures encompasses the
concept of cumulative severity, in which the whole experience of each animal is taken into account
when assessing the severity classification of a programme of work. This is a variation from previous
classification systems where there was a requirement only to consider the direct suffering caused by a
particular technique rather than taking into account any contingent events.
Specifically, the Directive requires “...taking into account the lifetime experience of individual
animals...” (paragraph 25), “... to enhance the lifetime experience of the animals..” (paragraph 31), “...to
reduce the duration and intensity of suffering to the minimum possible..” (Article 13.3b). It requires
that the severity category shall take into account the nature of pain, suffering, distress and lasting harm,
and its intensity, the duration, frequency and multiplicity of techniques, and the cumulative suffering
within a procedure (Annex VIII). Annex VIII contains guidance on assignment criteria when
considering cumulative suffering within a procedure but the examples are a mix of "techniques" and
"protocols". They are not based on the use of specific refinement measures which can have a
significant impact on the actual severity experienced by the animal.
2
20
21
22
23
24
25
26
27
28
29
30
31
32
33
34
35
36
37
38
39
40
41
42
43

Cumulative suffering is the combination of direct effects on welfare (the procedural protocol on a
licence in terms of the actual procedure and its subsequent outcomes) and any clinical condition from
which the animal suffers which may not be due to the procedure (a bite wound or bullying by
conspecifics, for example), plus any contingent effects related to housing, husbandry or transportation.
The duration of each of these and the intervals between events must also be taken into account.
There is an increasing interest in developing methods of assessing the lifetime experience of
experimental animals by addressing issues such as the cumulative effect of a series of procedures and
the retrospective assessment, on completion of a study, of actual severity experienced by individual
animals. The EU Directive 2010/63 requires that retrospective assessment shall be carried out “to
evaluate whether the objectives of the project were achieved, the harm inflicted on animals, including
the numbers and species used and the severity of the procedures used and any elements that may
contribute to the further implementation of the requirement of replacement, reduction and refinement”
(article 39). The Working Document on a Severity Assessment Framework under the EU Directive
(2012) requires recording of the effects of procedural events for retrospective reporting of actual
severity at the end of procedures, but it has been recommended that retrospective assessment should be
based on the continuous collection of data as experiments progress. The UK Home Office now requires
that data are collected on all animals involved in regulated procedures completed, including actual
severity, and these data will be required to be submitted on an annual basis from January 2015. The
Animal Procedures Committee (2013) recommended collecting data to assess an overview of the
animal’s lifetime experience with key events and quality of the environment, including benefits of any
refinements that have been developed and a log of adverse events (non-procedural, generic and
intended effects of the procedure and complications) including their impact on welfare.
With this in mind the system detailed here has been developed to allow recording and assessment of
lifetime events for individual animals (Honess & Wolfensohn 2010). In order to test the suitability of
this system in terms of ease of use and discrimination of differences in lifetime experience it has been
tested using data from a series of experiments involving a macaque model of tuberculosis.
3
44
45
46
47
48
49
50
51
52
53
54
55
56
57
58
59
60
61
62
63
64
65
66
67
68
69
70

The macaque model of tuberculosis
Tuberculosis (TB) is a major health problem, especially in low income countries. There are 1.4 million
deaths per year from TB (WHO 2014) and it is estimated that a third of the world’s population is
latently infected. The devastating effects of TB infection have been exacerbated by the emergence of
multi-drug resistant strains and HIV co-infection. There is an urgent need for improved interventions,
including a new vaccine. The only currently available vaccine is BCG which protects children from
developing severe TB disease but it is not suitable for use in people whose immune system is
compromised (e.g. those with AIDS) and has mostly failed to protect against pulmonary TB in adults.
The lack of a defined immunological correlate of protection for TB means that, in order to assess
efficacy, candidate TB vaccines must enter large clinical trials involving thousands of at-risk
individuals in endemic countries. Therefore, validated preclinical animal models that can identify
correlates of protection and accurately predict the effectiveness of vaccines in humans through
challenge studies are critical to achieving the goal of an improved TB vaccine. Because of their close
similarity to humans, non-human primates (NHP) provide the most relevant models of human disease
and advanced models for assessment of new interventions. The current NHP models of TB that are
used to evaluate the efficacy of new TB vaccine candidates rely on readouts of disease burden such as
changes in clinical parameters (e.g. weight) or pulmonary disease burden (e.g. measured by bacterial
load, or TB-induced pathology), or survival time after challenge (Sharpe et. al., 2010), to distinguish
between test groups. The duration of studies following challenge are dependent on the primary efficacy
readout, where studies using survival time post challenge as the main readout tend to require long-term
follow up and control groups to develop end stage TB-induced disease, while studies using defined
endpoints (Anacker et al 1972, Barclay et al; 1970, Barclay et al 1973, Janicki et al 1973, Ribi et al
1971) tend to be shorter and do not require animals to progress to end stage disease.
A challenge model that could be applied in human clinical trials would accelerate the development of
new TB vaccines and, whilst the use of Mycobacterium tuberculosis (M.tb) would not be appropriate,
BCG could be used. The hypothesis is that replication of BCG administered intradermally as a
4
71
72
73
74
75
76
77
78
79
80
81
82
83
84
85
86
87
88
89
90
91
92
93
94
95
96
97

challenge agent will be diminished in individuals with pre-existing immunity to TB induced by prior
vaccination. The quantity of BCG remaining at the site of challenge can be quantified in the tissue
obtained in a punch biopsy of skin over the site of BCG ‘challenge’ vaccination. Macaque studies are
being performed in parallel with human clinical trials to assess the utility of the model as macaques
offer the opportunity to compare the BCG and M.tb challenge models and validate the BCG challenge
model. A challenge system that removes the requirement for animals to be challenged with a disease-
inducing organism would provide a significant refinement and welfare improvement. This project has
accessed data from completed studies using macaque models of human TB to refine and demonstrate
utility of an existing lifetime assessment system as described by Honess & Wolfensohn (2010).
Since the establishment of the macaque aerosol challenge model of TB, the facility at PHE has worked
to introduce new practices to improve the welfare of animals under study that have included changes in
housing. The refined assessment system was used to evaluate the life time experience of animals in
studies to evaluate new TB vaccines, and the life time experience of animals in studies benefiting from
these new approaches were compared to determine the ability of the system to provide a measure
capable of quantifying the impact of key changes in housing or experimental practices. The acquisition
of two adjacent macaque breeding colonies during the lifetime of the project has provided a unique
opportunity to test potential refinement strategies afforded by having both breeding and experimental
facilities on the same site.
Material and Methods:
All data used in this report were obtained retrospectively from completed studies where the findings
have been previously reported (Sharpe et al. 2009, Sharpe et al. 2010).
Experimental animals
With the exception of one study (study 2), all animals described in this paper were rhesus macaques
(M. mulatta) obtained from a long established UK breeding colony. For comparative purposes,
historical data from study 2 involving cynomolgus macaques (M. fascicularis) imported from a Home
Office approved non-UK source (the Guangxi Grand Forest Scientific Primate Company) are also
5
98
99
100
101
102
103
104
105
106
107
108
109
110
111
112
113
114
115
116
117
118
119
120
121
122
123
124

reported. All studies were conducted under project licences approved by the Ethical Review Process of
Public Health England (PHE), Porton, Salisbury, UK and the Home Office, UK. Animals were housed
according to the Home Office (UK) Code of Practice for the Housing and Care of Animals Used in
Scientific Procedures (1995) and following the National Committee for Refinement, Reduction and
Replacement (NC3Rs) Guidelines on Primate Accommodation, Care and Use (NC3Rs, 2007).
Throughout the course of these studies two types of caging systems were used at CL2 and two versions
at CL3. These cages differed in the amount of height, balcony access and opportunity for enrichment
that was provided. In the case of CL2 caging the newer style provided balcony access, more provision
for 3D enrichment and the ability to forage in deep litter (manipulable enrichment). Similarly the later
version of CL3 accommodation provided greater height and better opportunities for 3D and
manipulable enrichment. These differences are summarised in the table in section C (Environmental
factors) and in Table 1. The programmes of work evaluated were all designed to examine the efficacy
of vaccine regimes against TB, where the efficacy of new vaccine candidates is compared to the
efficacy of BCG. These involved a period of vaccination followed by either a challenge with M.tb or
with BCG as a surrogate challenge. For M.tb challenge studies, a defined clinical scoring system
allowed the identification of clear humane end points before progression to severe disease.
Vaccination
Animals were immunised intradermally in the upper left arm with 100 μl BCG, Danish strain 1331
(SSI, Copenhagen, Denmark). The BCG vaccine was prepared and administered according to
manufacturer’s instructions for preparation of vaccine for administration to human adults, by addition
of 1 ml Sauntons diluent to a vial of vaccine, to give a suspension of BCG at an estimated concentration
of 2 x 10⁶ to 8 x 10⁶ CFU/ml.
M. tuberculosis challenge procedures
Each animal was challenged by aerosol inhalation of M.tb (Erdman strain) and the presented dose
described as in Sharpe et al., 2009. Animals received doses ranging between 800 – 1200 CFU (study
1), 500 - 1000 CFU (study 3) and 7000 – 10,000 CFU (study 2). The M.tb Erdman strain K 01
6
125
126
127
128
129
130
131
132
133
134
135
136
137
138
139
140
141
142
143
144
145
146
147
148
149
150

challenge stock was kindly provided by Dr Amy Yang (CBER/FDA) generated as described previously
(Sharpe et al, 2009, 2010).
M. tuberculosis challenge study design
Six macaques in each study received an intradermal vaccination with BCG. Prior to challenge, animals
in studies 1 and 2 were housed in the experimental facility under CL2 conditions, animals in study 3
were housed within the breeding facility in which they were born. Twenty-one weeks after
immunisation with BCG, the BCG vaccinated group, together with four (study 1) or six (studies 2 and
3) naïve controls received an aerosol challenge with M.tb. Following challenge, animals were housed
for a maximum of 52 weeks (study 1, Sharpe et al 2010), 26 weeks (study 2) or 16 weeks (study 3) in
the biocontainment facility under CL3 conditions (Dennis 2010) and monitored daily for behavioural
changes and clinical signs of disease. Clinical parameters such as weight and body temperature were
measured and blood samples collected for evaluation of immune responses, red blood cell haemoglobin
levels and erythrocyte sedimentation rate, at 2-4 weekly intervals throughout the study.
BCG ‘challenge’ study design (Study 4)
Six rhesus macaques were vaccinated intradermally with BCG and blood samples collected two, seven
and 14 days after BCG vaccination. Clinical parameters were measured and blood samples collected for
evaluation of immune responses from these vaccinated animals in and from six unvaccinated animals at
2 weekly intervals between week 4 and 12 after BCG vaccination, then every 4 weeks until week 20.
Twenty-one weeks after BCG immunisation, the six BCG-vaccinated animals together with six non-
vaccinated animals were challenged (C) with BCG via the intradermal route. Following challenge,
blood samples were collected on days C+2, C+7, and C+14 for immunological studies and
measurement of BCG burden. A skin biopsy was collected from the BCG challenge site 14 days after
challenge for estimation of BCG burden. Clinical parameters were measured in all animals each time
animals were sedated during the study period. All animals were male rhesus macaques of Indian origin
bred in the UK PHE colony on the dstl site Porton Down born in 2007. All animals were housed
throughout the study in the experimental facility under CL2 conditions. Figure 1 and table 1 show the
timelines of studies 1-4.
7
151
152
153
154
155
156
157
158
159
160
161
162
163
164
165
166
167
168
169
170
171
172
173
174
175
176
177
Description of the Extended Welfare Assessment Grid (EWAG) system.
From the individual records maintained at the time for each animal, a welfare assessment score was
applied at each moment in the animal’s life when there was a record of some intervention having taken
place. This system scores four parameters (Physical, Psychological, Environmental, Procedural
(experimental and/or clinical). These four parameters together contribute to the level of cumulative
severity and are scored to obtain a quantitative measure. Within each parameter various factors are
scored between 1 and 10 where a score of 1 indicates the best possible state (lowest possible impact on
welfare) for the respective factor, whilst a score of 10 would be the worst possible state (highest
possible impact on welfare). For each parameter the average of the factors scored is used to assess the
level contributing to cumulative severity.
Notice that the four parameters are not independent of each other. For example, an animal that
undergoes a procedure may well have a change in routine that affects its use of enrichment, and its
activity level may be affected by being put into restricted housing. This would be reflected in the
scores for all four parameters. It should be noted that in the examples given one of the listed factors
(alopecia) had not been consistently recorded in a form that would allow allocation of a numerical score
and was therefore not included in the calculation. In all ongoing and future studies this important
parameter will be scored consistently. The lack of independence between the factors and their
consequences is reviewed by Collins (2012) who concludes that this does not affect the scoring of
individual-focused factors of intensity or duration of adverse experience. Indeed it may be argued that
if the actions of a hazard lead to multiple types of consequences, then standardising will mean that the
risk outcomes for this hazard could be underestimated (Collins 2012). Intensity and duration of
consequences are not independent since an individual’s level of adverse experience will be a function
not only of current intensity, but also how long it has been attempting to cope with the insult, and
whether and to what extent this has impacted on immune, endocrine and nervous-sensory systems
(Broom & Johnson 1993). When evaluating an animal’s welfare it is necessary to consider the timing,
8
178
179
180
181
182
183
184
185
186
187
188
189
190
191
192
193
194
195
196
197
198
199
200
201
202
203
204

duration and frequency of welfare assessment measures which will take into account the species/ strain
of animal, the experimental design, the housing environment, husbandry practices and the animals’
normal circadian rhythm. Care must be taken when interpreting numerical scores of welfare assessment
since, for example, a score of three for staring coat and three for isolation from conspecifics does not
equate to a score of six for a distended bowel. A score of six is not suffering twice as much a score of
three (Hawkins et al 2011).
Whilst there are certain fundamental factors that are relevant to all animals undergoing experimental
use, there are obviously decisions to be made on which factors are to be scored and the relative weight
that is given to them. The system described is highly flexible in this respect and should be tailored to
each individual type of experiment. Thus experiments on a pulmonary infectious disease model such as
tuberculosis, will assess relevant factors that reflect the animals’ condition (such as respiration rate,
level of dyspnoea). When used to assess other types of experiments, for example in neuroscience, the
factors should reflect conditions that may occur in such procedures (such as withholding access to
fluids, surgical intervention, incidence of seizures etc). Thus careful consideration must be made on
which criteria are to be scored.
For this report the parameters were scored as follows:
A. Physical
Factors:
1. General condition. (weight-loss, condition score etc (see Wolfensohn & Honess 2005 chapter
5)) Weight loss of zero up to 1.9% score 2, from 2-3.9% score 3, from 4-5.9 % score 4, from 6-
9.9% score 5,from 10-14.9% score 6, from 15-19.9% score 7, from 20-24.9% score 8, over 25%
score 10. In growing animals it is important to score against expected weight gain according to
the normal growth curve.
2. Clinical assessment. (eg cough, diarrhoea, ascites, tachypnoea (rapid breathing), dyspnoea
(struggling or irregular breathing), vomiting, temperature changes). It is necessary to consider
9
205
206
207
208
209
210
211
212
213
214
215
216
217
218
219
220
221
222
223
224
225
226
227
228
229
230
231

how much the clinical condition is affecting the animal (i.e.: how ill is it) not just the extent of
the clinical sign. For example, the animal may have an increased respiration rate after exercise
but not be stressed by it or it may have an increased respiration rate due to infection which is
causing it distress. These would be scored at different levels. Also it is possible to give the
same score for different clinical conditions (eg: diarrhoea and dyspnoea) if they are affecting the
animal’s welfare to the same extent. If there are a combination of conditions that are occurring
at the same time it is the net effect on the animals that needs to be reflected in the score.
3. Activity level, mobility. In addition to reduced activity note that hyperactivity may be abnormal
and result in poor welfare, incurring a score.
4. Presence of injury. If there is an injury then a score will depend on the level to which it affects
the animal’s welfare. Absence of any injury scores 1.
5. Not eating/drinking. Normal intake score 1, food/water intake less than 40% for 3 days score
6, food/water intake below 40% for 7 days or anorexic for 3 days score 9. This should also
include withholding of food/water so that intake is below normal levels.
B. Psychological/Behavioural
Factors:
1. Stereotypy, self-harming, unusual grooming. The frequency and time spent in the abnormal
behaviour, not just the extent of physical damage to the animal should be taken into account in
the scoring.
2. Response to catching event. Recognise if the animal is well trained and habituated, or stressed
and frightened, or aggressive. The method used, for example catching net, pole and collar, crush
back cage or use of positive reinforcement training and how long it takes to catch the animal
should be reflected in the score.
3. Hierarchy upset/dispute, aggression/bullying. Take into account the extent, duration and
outcome.
4. Alopecia score. (Honess et al 2005) If not recorded, do not score but mark as not applicable.
10
232
233
234
235
236
237
238
239
240
241
242
243
244
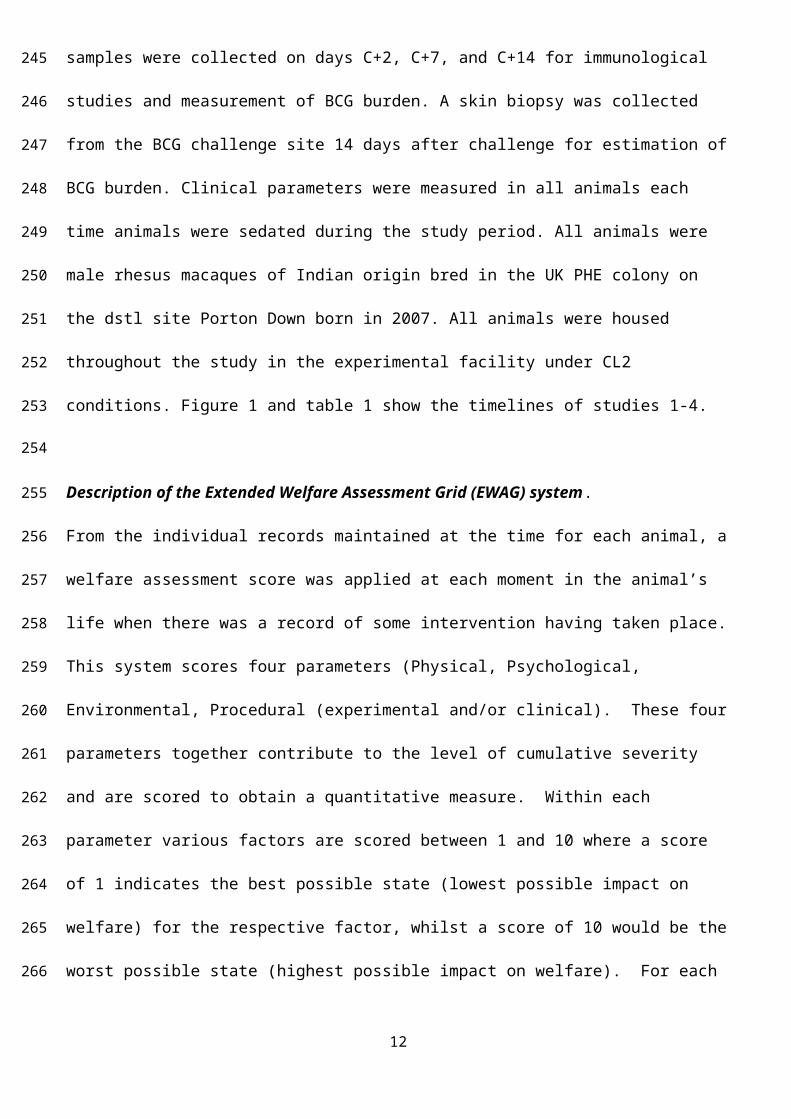
245
246
247
248
249
250
251
252
253
254
255
256
257
258

5. Use of enrichment. There may be lots of enrichment provided, but the score should reflect if
the animal is using it.
6. Aversion to ‘normal’ events such as staff interaction, cage cleaning etc. The score should
reflect if the animal is well trained and habituated, or stressed and frightened, or aggressive.
C. Environmental
Factors:
1. Housing. Free range zoo type environment score 1. Consider the space provision, lighting,
ventilation, weather exposure, animal-friendly materials, noise. Adjustment may be needed to
take account of the species and size of the animals.
2. Group size. Singles score 10, pairs score 6, small groups (3 to 5) score 4, medium size groups
(6 to 8) score 3, breeding groups score 1.
3. Provision of 3D enrichment. Consider the ability to climb, jump, hide, establish and maintain
social hierarchy without aggression and fighting.
4. Provision of manipulable enrichment. Consider forage material, food provision and the
variety of what is offered.
5. Contingent events. Consider if the animal has been moved, on-going building works etc.
Scores for the different environments at PHE:
Containment level 2 Containment level 3
Breeding Colony
CL2v1: Older style with upper extensions
CL2v2: New style with balcony
CL3v1: High containment
CL3v2: High containment
Housing 2 5 3 6/7/8* 4
Group size 1 3 3/4 3/4/6 3
11
259
260
261
262
263
264
265
266
267
268
269
270
271
272
273
274
275
276
3D enrichment
1 4 3 6/7/8* 5
Manipulable enrichment
1 6 2 7 6
Average Score
1.25 4.50 2.75/3.0
0
5.50 /6.25/ 7.25
4.50
*Scores depend on the weight of the animal: Lowest score <4kg, intermediate score 4-6 kg, highest
score >6kg.
D. Procedural (experimental and/or clinical)
Factors:
1. Restraint. The score should reflect the method used and the effect on the animal, such as use of
positive reinforcement training, or if the animal is aggressive and frightened.
2. Sedation. Consider duration, quality of induction and recovery, effect on food intake and
behaviour.
3. Effect of intervention: Whether the intervention is a planned licensed procedure or a veterinary
or husbandry procedure, assess to what extent this has impacted on the animal’s welfare. What
has been the overall effect on the animal’s welfare of the intervention/procedure carried out,
even if done for the animal’s benefit in the longer term.
4. Change in daily routine. Consider such things as withholding enrichment or food, restricting
access to the usual living area.
Worked examples for routine licensed procedures on this study:
Computed Tomography
(CT) scan
Broncheo-alveolar Lavage
Blood sampleWith
sedation
Blood sampleWithout sedation
12
277
278
279
280
281
282
283
284
285
286
287
288
289
290
291
292

(BAL)
Restraint 4 4 4 6
Sedation 4 4 4 1
Procedural/intervention effect
3 4 3 2
Daily routine changes 5 5 5 3
Average Score 4.00 4.25 4.00 3.00
See Figure 2 for a scoring sheet as used in the facility.
Results
Calculation of cumulative effects on welfare
The scores for each factor were entered into an excel spread sheet that automatically calculated the
average score for the four parameters and quantified the level of cumulative effect on welfare by
calculating the area of the welfare assessment grid (WAG). A graph was then plotted to show the total
cumulative welfare assessment score (CWAS) throughout the life time of each animal – see figure 3 for
an example for animal S36 from study 3 unvaccinated group. At any time point on this graph a welfare
assessment grid can be plotted to show the effects of each of the four parameters at that moment in
time, the WAGs at the time points day 801 (pre-challenge) and day 1084 (7 weeks post-challenge). For
animal S36 it can be seen that the effect of the environment was significant in terms of its negative
welfare state, in addition to the expected physical effects of the procedure of infectious challenge, and 13
293
294
295
296
297
298
299
300
301
302
303
304
305
306
307

this allows for refinement to be tailored in order to have a maximal effect on improving the animals’
welfare.
Use of the WAG to compare studies and demonstrate the effect of refinement of study design,
environment and use of end points
The WAG can be utilised to examine and quantify the effect on welfare following any changes in
experimental design and environments, demonstrating the overall improvement these make to total
lifetime experience. This will assist with the quantification of the ‘harms’ to the animals of studies to
evaluate the vaccine efficacy. The WAG was applied retrospectively to quantify the lifetime experience
of animals in four studies designed to evaluate the efficacy of new TB vaccines performed over a 10
year period at PHE (Table 1).
Table 1
Study no
Species and origin
Vaccinationphase:
Containment level and Housing
Challenge phase:
organism and dose
range
Group Challenge phase:
Containment level and
Housing
Mean cumulative score for post
challenge phase
Time period of post
challenge phase
to efficacy
1 Rhesus UK Experimental facility: CL2v1, linked cages
Mycobacterium tuberculosis, 800-1,200 CFU
BCG vaccinated
CL3v2, until week 28 post challenge, then 13 weeks in CL3v1, then back to CL3v2
22.9 52 weeks
unvaccinated CL3v1, final 5 weeks one animal in CL3v2
24.3 52 weeks
2 Cynomolgus China
Experimental facility: CL2v2,
Mycobacterium
BCG vaccinated
CL3v2 18.5 26 weeks
14
308
309
310
311
312
313
314
315
316
317
318
319
320
321

balcony cages tuberculosis 7,000-10,000 CFU
Unvaccinated CL3v1 19.2 26 weeks
3 Rhesus UK Breeding facility Mycobacterium tuberculosis, 500-1000 CFU
BCG vaccinated
CL3v1 24.4 16 weeks
Unvaccinated CL3v1 27.0 16 weeks
4 Rhesus UK Experimental facility: CL2v2, balcony cages
BCG BCG vaccinated
CL2v2 10.3 2 weeks
Unvaccinated CL2v2 10.5 2 weeks
When comparing groups of animals from these studies the cumulative welfare assessment score
(CWAS) was averaged over a week’s activity as well as across the group. Rather than use date of birth
as a common reference point for each animal in a group, the week of common procedure (say, aerosol
challenge or vaccination) was used as an anchor point to enable simple visual comparison. Figure 4
shows the cumulative welfare assessment plots indicating the lifetime experience for all four studies for
the vaccinated groups and the unvaccinated groups.
These results were used to determine the impact of study design. Specifically:
15
322
323
324
325
326
327
328
329

1. Design of the housing environment: By comparing the CWAS for the period from study
enrolment before BCG vaccination through to challenge for all studies, the welfare effect of the
different housing environments was demonstrated. In study 1 animals in the pre-challenge phase
were housed in the first the version of group CL2 housing in the experimental facility, in studies
2 and 4 the animals were housed in refined CL2 housing in the experimental facility, and in
study 3 the pre-challenge phase was conducted within the home breeding facility implementing
a significant refinement. The analysis of the CWAS allows the quantification of the impact of
housing facility on life experience. It can be seen that the CWAS for vaccinated animals on
study 1 shows a marked increase between weeks 48 and 61. Examination of the individual
WAGs for this period (see figure 5) shows that the increase is due to a change in the
environmental score. This was due to the animals having to be moved from more refined CL3
housing to less refined CL3 housing for 13 weeks while maintenance work was carried out.
2. The efficacy measure employed necessitating the use of either the survival or a fixed end point,
and the effect of duration of fixed end point by comparing studies 1, 2 and 3: Comparison of the
scores attributed to the animals following challenge with M.tb provided the opportunity to
quantify differences in the lifetime experience when a survival endpoint (study 1) was used, as
opposed to a fixed end point (studies 2 and 3) for the evaluation of vaccine efficacy. Study 1
had a 52 week post challenge follow up period which was the amount of time required to obtain
sufficient data to evaluate vaccine efficacy in this study design, whereas study 2 had a fixed end
point design of 26 weeks and study 3 had a fixed end point design of 16 weeks as the post
challenge period. The cumulative cost of evaluation of vaccine efficacy can be calculated
looking at the period after challenge to study end point (52, 26, or 16 weeks) in all studies as
shown in table 1 and in figure 4 and demonstrates the reduction ‘cost’ with time post challenge .
3. The effect of challenge dose of M.tb used: Rhesus macaques on study 1 received a higher
aerosol dose of M.tb than those on study 3. Comparison of the CWAS for the unvaccinated
groups during the first 16 weeks after challenge in these studies when both were housed in the
same environment shows the adverse effect of the increased dose on the animals in study 1.
16
330
331
332
333
334
335
336
337
338
339
340
341
342
343
344
345
346
347
348
349
350
351
352
353
354
355
356

4. The effect of vaccination to quantify the additional ‘cost’ of being in an unvaccinated control
group animal in studies requiring aerosol challenge with M.tb: This can be seen by comparing
the CWAS for BCG vaccinated groups of animals against the unvaccinated control groups
within studies 1, 2 and 3 (Figure 4) where there is a trend for the scores to be higher in the
unvaccinated groups. The difference between vaccinated and unvaccinated groups in study 1,
between weeks 21 and 48 after challenge, was particularly striking, however further
interrogation of the individual WAGs for this period revealed that a portion of the reduction in
score of the vaccinated group was due to the environment and the benefits afforded by the more
refined CL3 housing in which they were maintained.
5. The effect of importation and use of species with different susceptibility and ability to control
TB disease progression: By comparing the CWAS of animals on study 2 (cynomolgus
macaques imported from China) with those on studies 1, 3 and 4 (home bred rhesus macaques),
the adverse effect of importation on the pre-challenge period can be seen. However there is also
a species difference in the susceptibility to M.tb which can be seen by comparing study 2 with
studies 1 and 3 in the first 16 weeks post challenge phase. Although the rhesus macaques were
exposed to lower doses of M.tb than the cynomolgus macaques, they were more susceptible to
the adverse effects associated with onset of disease.
6. The effect of changing from use of a pathogenic challenge organism to a non-pathogenic
methodology and the duration of follow up: The impact on life time experience that could be
achieved through development of a challenge system that did not require infection with M.tb
and the consequent development of TB-induced disease, was evaluated through comparison of
the CWAS during the post challenge phase needed to evaluate vaccine efficacy. In study 1 (52
weeks after M.tb challenge) and study 2 (26 weeks after M.tb challenge fixed endpoint) and
study 3 (16 weeks after M.tb challenge fixed endpoint) the CWAS was much greater compared
to study 4 (2 weeks after BCG challenge).
Animal welfare implications
17
357
358
359
360
361
362
363
364
365
366
367
368
369
370
371
372
373
374
375
376
377
378
379
380
381
382
383

This work has provided a unique opportunity to refine and test the Extended Welfare Assessment Grid
(Honess & Wolfensohn 2010) for its ability to assess the life time experience of non-human primates
used in infectious disease research projects. Numerous methods of assessment of animal welfare have
been reported but the majority only look at the animal at one moment in time. The Extended Welfare
Assessment Grid represents a valuable tool to reflect the temporal component of suffering that is often
overlooked and allows assessment of cumulative suffering imposed by the events that occur. The Grid
examines the welfare of the animal at key points throughout its life taking into account the duration as
well as the intensity of suffering producing numeric, as well as visual, representation of the animal’s
overall quality of life. It has been developed to monitor the lifetime experience and evaluates the
physical condition, the psychological condition, the quality of the environment and the impact of
procedural intervention and clinical conditions on the animal. The Extended Welfare Assessment Grid
has particular value in producing a simple, objective, visual illustration of cumulative suffering and is
used in this paper to retrospectively review refinements in husbandry and study design to demonstrate
objectively the effect on animal welfare. We have developed a simple assessment form (see Figure 2)
that can be easily completed by animal carers or licence holders and will allow simple data entry to the
cumulative score system. The factors for each parameter can be modified to suit different types of
experiments other than infectious studies. This can be done such that when data are entered in real time
as an experiment progresses, its use enables those involved in the conduct of animal studies to plan and
intervene with additional environmental enrichment, alterations to housing and husbandry practices,
giving suitable treatments or carrying out euthanasia at an appropriate time, such as to limit the
negative effect of interventions. Whilst this system may be seen to have particular value for long-term
experiments, we have also demonstrated its utility for application to short and mid-term programmes of
work.
This has also been an opportunity to quantify the improvements that have been made to the life time
experiences of animals in studies to evaluate new interventions against human diseases, through
changes in study procedures and housing arrangements. Such a system will be invaluable in helping to
make decisions at the AWERB discussion on harm:benefit balance and in considering the justification
18
384
385
386
387
388
389
390
391
392
393
394
395
396
397
398
399
400
401
402
403
404
405
406
407
408
409
410

for carrying out the work. Furthermore, the system allowed areas of environment, practices, contingent
events and experimental design to be identified as the particular cause of any change in welfare,
enabling refinements to be focussed appropriately to maximise improvements in welfare wherever
possible and this will assist study design in the future.
Conclusion
Ethical justification for carrying out a scientific procedure will be a balance between the harm to the
animals and the benefit to society from the knowledge gained. The level of harm will be affected by
the degree of implementation of the 3Rs (replacement, reduction and refinement). Thus the level of
cumulative severity will be directly affected by how the work is conducted and this will include
elements of contingent suffering and direct suffering caused by procedures such as sampling,
administration of substances, surgery and the induction of disease. Implementation of the refinement
loop (Lloyd et al, 2008) will assist in reducing the level of cumulative severity.
The general requirements for effective welfare assessment have been agreed as (Hawkins et al 2011):
A team approach
Appropriate welfare indicators
A sound understanding of good welfare and the normal animal
Full recognition of all potential adverse effects
Consistency for all species
Consistency between observers
Appropriate recording systems
While all of these requirements can be met for a particular moment in time, there is the need to
assess the animal’s whole quality of life over the duration of the study in order to truly reflect its
welfare. This project reviewed the welfare records to see how well the adverse effects had been
predicted, recognised and alleviated; and to study the effect of refinements of housing and study
19
411
412
413
414
415
416
417
418
419
420
421
422
423
424
425
426
427
428
429
430
431
432
433
434
435

design. The information gained was useful in liaising with the institutional animal welfare and
ethical review body to seek guidance on the continued acceptability with respect to the local culture
of care at the establishment. The Concordat on Openness on Animal Research (2012) highlights the
importance of transparency about the actual level of suffering experienced by animals undergoing
procedures. Thorough retrospective review such as that undertaken here enables continual
assessment of the harm:benefit balance at ethical review, and for this study the benefit of improved
treatments and prevention of human morbidity and mortality from tuberculosis was considered
acceptable. However for future studies on-going refinements can now be targeted at the specific
elements that will improve the animals’ welfare and quality of life.
References:
Animal Procedures Committee 2013. Review of the assessment of cumulative severity and lifetime
experience in non-human primates used in neuroscience research. Report of the Primate Subcommittee
of the Animal Procedures Committee (https://www.gov.uk/government/publications/animal-
procedures-committee-cumulative-severity-review).
Anacker RL, Brehmer W, Barclay WR, Leif W, Ribi E, Simmons JH and Smith AW 1972 Superiority
of intravenously administered BCG and BCG cell walls in protecting rhesus monkeys (Macaca
mulatta) against airborne tuberculosis. Z Immunitatsforsch Exp Klin Immunol. 143:363-76
Barclay WR, Anacker RL, Brehmer W, Leif W and Ribi E 1970 Aerosol-induced tuberculosis in sub-
human primates and the course of the disease after intravenous BCG vaccination. Infect Immun. 2 574-
582
20
436
437
438
439
440
441
442
443
444
445
446
447
448
449
450
451
452
453
454
455

Barclay WR, Busey WM, Dalgard DW, Good RC, Janicki BW, Kasik JE, Ribi E, Ulrich CE and
Wolinsky E 1973 Protection of monkeys against airborne tuberculosis by aerosol vaccination with
bacillus Calmette-Guerin. Am Rev Respir Dis. 107:351-8
Broom DM and Johnson KG 1993 Stress and Animal Welfare, Kluwer Academic Publishers:
Dordrecht, The Netherlands
Collins LM 2012 Animal Welfare 21(S1) 73-79 Benefits and pitfalls of welfare risk assessment
Concordat on Openness on Animal Research 2012. www.understandinganimalresearch.org.uk
Dennis M 2010 Special Housing Arrangements Chapter 11 in UFAW Handbook on the Care and
Management of Laboratory and Other Research Animals, 8th Edition. Edited by Robert Hubrecht and
James Kirkwood published by Wiley Blackwell
European Directive 2010/63/EU. Available at
http://ec.europa.eu/environment/chemicals/lab_animals/legislation_en.htm or
http://eur-lex.europa.eu/LexUriServ/LexUriServ.do?uri=OJ:L:2010:276:0033:0079:en:PDF
EU Directive 2012: Working document on a severity assessment framework (2012).
ec.europa.eu/environment/chemicals/lab_animals/pdf/Consensus%20doc%20on%20severity
%20assessment.pdf.
Hawkins P, Morton DB, Burman O, Dennison N, Honess P, Jennings M, Lane S, Middleton V,
Roughan JV, Wells S and Westwood K 2011. A guide to defining and implementing protocols for the
welfare assessment of laboratory animals: eleventh report of the BVAAWF/FRAME/RSPCA/UFAW
Joint Working group on Refinement. Laboratory Animals 45 1-13
21
456
457
458
459
460
461
462
463
464
465
466
467
468
469
470
471
472
473
474
475

Home Office 1995. Code of practice for the housing and care of animals in designated breeding and
supplying establishments. London: The Stationery Office
Honess P and Wolfensohn S 2010 A matrix for the assessment of welfare and cumulative suffering in
experimental animals. Alternatives to Laboratory Animals 38 205–212
Honess PE, Gimpel JL, Wolfensohn SE and Mason GJ 2005 Alopecia scoring: The Quantitative
Assessment of Hair Loss in Captive Macaques. Alternatives to Laboratory Animals 33 193-206
Janicki BW, Good RC, Minden P, Affronti LF and Hymes WF 1973. Immune responses in rhesus
monkeys after bacille Calmette-Guerin vaccination and aerosol challenge with Mycobacterium
tuberculosis. Am. Rev. Respir Dis. 107:359-66
Lloyd MH, Foden BW, Wolfensohn SE 2008 Refinement: promoting the 3Rs in practice Laboratory
Animals 42, 284-293
NC3Rs 2007 National Centre for the 3Rs. Guidelines on primate accommodation, care and use.
Available from www.nc3rs.org.uk/page.asp?id=277
Ribi E, Anacker RL, Barclay WR, Brehmer W, Harris SC, Leif WR and Simmons J 1971. Efficacy of
mycobacterial cell walls as a vaccine against airborne tuberculosis in the rhesus monkey. J infect Dis.
123: 527-538.
Sharpe SA, Eschelbach E, Basaraba RJ, Gleeson F, Hall GA et al. 2009. Determination of lesion
volume by MRI and stereology in a macaque model of tuberculosis Tuberculosis, 89, 405-416.
22
476
477
478
479
480
481
482
483
484
485
486
487
488
489
490
491
492
493

Sharpe SA, McShane H, Dennis M J, Basaraba R, Gleeson J F, Hall GA, McIntyre A, Clark S, Gooch
K, Beveridge NER, Nuth E, White A, Marriott A, Dowall S, Hill AVS, Williams A, and Marsh PD
2010 Establishment of an Aerosol Challenge Model of Tuberculosis in Rhesus Macaques and an
Evaluation of Endpoints for Vaccine Testing. Clinical and Vaccine Immunology 17, 1170–1182
Wolfensohn S and Honess P 2005. Handbook of Primate Husbandry and Welfare. Blackwell
Publishing
WHO 2014 World Health Organization Tuberculosis Fact sheet N°104 March 2014.
http://www.who.int/mediacentre/factsheets/fs104/en/
23
494
495
496
497
498
499
500
501
502
503
504
505

Figure 1 Diagram to show the timelines of studies 1-4
Week 0 21 23 37 47 73
BCG Mtb End: Necropsy
1: rhesus2: cynomolgus3: rhesus
4: rhesus
End: skin biopsyBCG
Study
24
506
507
508
509
510
511
512
513

Figure 2 Scoring sheet
PHYSICAL Scoring Factor Score 1 2 3 4 5 6 7 8 9 10
1 General condition (weight loss, condition score)
2 Clinical assessment (eg cough, diarrhoea, ascites)
3 Activity level, mobility
4 Presence of injury
5 Not eating/drinking
Average score (average of scoring factors)
Comments:
PSYCHOLOGICAL/BEHAVIOURAL
Scoring factor Score 1 2 3 4 5 6 7 8 9 10
1 Stereotypy, self harming, unusual self-grooming
2 Response to catching event
3 Hierarchy upset/dispute, aggression/bullying
4 Alopecia score
5 Use of enrichment
6 Aversion to normal events eg staff interaction, cage
cleaning etc
Average score (average of scoring factors)
Comments:
ENVIRONMENTAL
Scoring Factor Score 1 2 3 4 5 6 7 8 9 10
1 Housing
2 Group size
3 Provision of 3D enrichment
25
514
515
516
517

4 Provision of manipulable enrichment
5 Contingent event (Room move, building works etc)
Average score (average of scoring factors)
Comments:
PROCEDURAL (Experimental and/or clinical)
Scoring Factor Score 1 2 3 4 5 6 7 8 9 10
1 Restraint
2 Sedation
3 Effect of intervention
4 Change in daily routine, withholding enrichment, food,
restricted access to usual living area
Average score (average of scoring factors)
Comments:
26
518
519
520

Figure 3: Cumulative welfare assessment score throughout animal S36’s life (Study 3 unvaccinated)
0 200 400 600 800 1000 12000.0
10.0
20.0
30.0
40.0
50.0
60.0
27
Time (days)
Cumulative welfare assessment score
Procedural Psychological
Environmental ural
Environmental ural
Physical Physical
Pre-challenge 7 weeks post-challenge
521522
523
524
525
526
527

Figure 4: Comparison of the life time experiences (CWAS) of BCG vaccinated and unvaccinated animals in studies 1 to 4
28
528529
530
531

Figure 5: Animal K80 WAGs at weeks 48 and 61 to show effect of environment when transferred
for 13 weeks to different type of BSL3 cage with poorer environment due to maintenance
requirements.
29
0.0
5.0
10.0
animal K80 week 48
0.0
5.0
10.0Animal K80 week 61
532
533
534
535
536