epro: a view from statistical programmercarry important variables such as disease progression date...
TRANSCRIPT

1
SESUG Paper 174-2019
ePRO: A View from Statistical Programmer Vijetha Kode, Merck & Co., Inc., North Wales, PA, USA
Saigovind Chenna, Merck & Co., Inc., North Wales, PA, USA
ABSTRACT Assessing patients experiences and perspectives into their clinical care is an important mechanism for evaluating the Quality of Life (QoL) of patients participating in cancer clinical trials. Patient-Reported Outcomes (PROs) commonly would capture patient perspective systematically and could assist in the development of new cancer therapies. European Organization for Research and Treatment of Cancer (EORTC) created and developed an integrated, modular approach for evaluating the QoL of patients participating in cancer clinical trials. This led to the development of the EORTC Quality of Life Questionnaire (QLQ) QLQ-C30, a quality of life instrument for cancer patients. Furthermore, EORTC developed various types of Questionnaires within various types of cancers. This paper primarily focuses on statistical programming aspects of PRO analysis for questionnaires (QLQ-C30, QLQ-LC13 and EQ-5D-5L) collected in Lung Cancer Indication trials. Details on the mapping process from collected data to Study Data Tabulation Model (SDTM), creation of Analysis Data Model (ADaM) datasets and various types of analysis reports typically included in a Clinical Study Report (CSR) will be discussed in this paper.
BACKGROUND Patient-reported outcomes (PRO) measures are commonly assessed in cancer trials and they represent important mechanism of incorporating patients’ experience and their perspectives in their care so overall participation in delivering cancer care is greatly enhanced. ‘Patient’ can be considered as the center for any healthcare system. As per US-FDA, a PRO is any report of the status of a patient's health condition that comes directly from the patient, without interpretation of the patient's response by a clinician or anyone else [11]. Though medical technology allows to measure physical, physiological or biochemical data of the patient; it is not able to give all the data about the treatment or the disease. Some data can be obtained only from the patient. Further to add, in some cases, disease survival is not the goal of the treatment, but quality of life also plays an essential role in the treatment. There are various types of PRO measures assessing quality of life of the patients. The EORTC quality of life questionnaire (QLQ) is an integrated system for assessing the health-related quality of life (QoL) of cancer patients participating in international clinical trials. An essential component of the EORTC QLQ development strategy involves the use of supplementary questionnaire modules which, when employed in conjunction with the QLQ-C30, can provide more detailed information relevant to evaluating the QoL in specific patient populations. Some of the following modules are currently available for general use, to supplement the core EORTC QLQ-C30. • Breast cancer module: QLQ-BR23 • Head & neck cancer module: QLQ-H&N35

2
• Lung cancer module: QLQ-LC13 • Oesophageal cancer module: QLQ-OES24 • Ovarian cancer module: QLQ-OV28 Similarly, EuroQol Group developed EQ-5D, a standardized measure of health status to provide a simple, generic measure of health for clinical and economic appraisal. Below are the versions available in EQ-5D. • The 3-level EQ-5D version (EQ-5D-3L). • The 5-level EQ-5D version (EQ-5D-5L). This paper primarily focuses on statistical programming aspects of ePRO analysis of questionnaires (QLQ-C30, QLQ-LC13 and EQ-5D-5L) and especially with respect to Lung cancer trials. SDTM MAPPING Typically, above mentioned questionnaires are mapped to QS (Questionnaire) domain regardless of SDTM IG version (3.1.1, 3.1.3 or 3.2). This paper mainly discusses with respect to SDTM IG 3.1.3. Questions from each of the questionnaire is generally mapped to QSTEST/QSTESTCD and the results associated with the questions are mapped to QSORRES/QSSTRESC/QSSTRESN variables. QSORRES (Original result) would capture the original result as it was collected and QSSTRESC/QSSTRESN captures the numeric part of the original result in character and numeric formats respectively. The information related to administration method, completion status and version is also captured and mapped in SDTM. If there are multiple questionnaires being mapped to QS domain, QSCAT is used to differentiate it.
ADAM All the TLFs generated to support ePRO analysis will make use of ADaM datasets. To support this analysis, three individual ADaM datasets (ADPRO (Analysis Dataset for PRO), ADTTD (PRO Time-to-True-Deterioration) and ADPLDA (Analysis Dataset for PRO Longitudinal Data Analysis) are developed and conformed to ADAM IG 1.1 and belong to the class of BDS (Basic Data Structure). Implementing ADaM compliant (in this case BDS) is essential to the Clinical Data Interchange Standards Consortium (CDISC) compliance of total submission package. However, implementing BDS datasets especially the Questionnaire data is quite challenging. To guide and create mentioned datasets, programmers typically follow company specific dataset specifications which is usually in excel format.
Common subject level variables (Core variables) are carried from Subject Level Analysis Dataset (ADSL) to all the datasets, similarly core variables are also carried to ePRO related datasets, besides we also carry important variables such as disease progression date etc from other efficacy datasets to support further analysis. Since this is QS data, all the questions that are mapped to QSTESTCD/QSTEST variables in SDTM/QS domain are directly mapped to paramcd/param of ADPRO. Along with directly mapped parameters, additional parameters are derived to support intended analysis. Following paragraphs describes each of the analysis datasets (ADPRO, ADTTD and ADPLDA) in detail.
ADPRO Table 1, Table 2 and Table 3 provides parameters related to Questionnaire QLQ-C30, QLQ-LC13 and EQ-5D-5L respectively. In table 1, Functional scales (paramcd Q1-Q7, Q20-Q27), Symptom scales/items (paramcd Q8-Q19, Q28), Global health status/QoL (paramcd Q29-Q30), are directly mapped from QSTEST/QSTESTCD of SDTM/QS domain and rest of the parameters are derived in analysis dataset.

3
Similarly, in table 2 and table 3, Symptom scales/items (paramcd LC1-LC12) and paramcd (Mobility to EQ VAS) are directly mapped from QSTEST/QSTESTCD of SDTM/QS domain and rest of the parameters are derived in analysis dataset. In questionnaire QLQ-C30 and QLQ-LC13, parameters that are directly mapped from SDTM/QS domain has AVAL mapped directly from QSSTRESN variable. Whereas, in questionnaire EQ-5D-5L AVAL is decoded from character response (QSSTRESC) to numeric value. Typically assigned values range from 1 to 5 i.e., no problem to extreme problem. Procedure of calculating analysis value, AVAL (in this case score) in questionnaire QLQ-C30 and QLQ-LC13 for derived param is explained in detail in subsequent paragraphs. Score is calculated for each subject and at each time point (analysis visit (AVISIT), analysis date (ADT) etc). Parameter category 1(PARCAT1) is used to identify different Questionnaire forms. The QLQ-C30 is composed of both multi-item scales and single-item measures. These include five functional scales, three symptom scales, a global health status / QoL scale, and six single items. Parcat2 captures types of scales.
PARAM PARAMCD PARCAT2
Trouble with Strenuous Activities Q1 Functional scales
Trouble Taking Long Walk Q2 Functional scales
Trouble Taking Short Walk Q3 Functional scales
Bed or Chair During Day Q4 Functional scales
Need Help Caring For self Q5 Functional scales
Limited Daily Activities Q6 Functional scales
Limited Hobbies or Leisure Q7 Functional scales
Short of Breath Q8 Symptom scales/items
Had Pain Q9 Symptom scales/items
Need Rest Q10 Symptom scales/items
Trouble Sleeping Q11 Symptom scales/items
Felt Weak Q12 Symptom scales/items
Lacked Appetite Q13 Symptom scales/items
Felt Nauseated Q14 Symptom scales/items
Vomited Q15 Symptom scales/items
Constipated Q16 Symptom scales/items
Diarrhea Scale Q17 Symptom scales/items
Tired Q18 Symptom scales/items
Pain Interfere with Daily Activities Q19 Symptom scales/items
Difficulty Concentrating Q20 Functional scales
Feel Tense Q21 Functional scales
Worry Q22 Functional scales
Feel Irritable Q23 Functional scales

4
PARAM PARAMCD PARCAT2
Feel Depressed Q24 Functional scales
Difficulty Remembering Q25 Functional scales
Condition Interfered with Family Life Q26 Functional scales
Condition Interfered with Social Life Q27 Functional scales
Condition Caused Financial Difficulty
Q28 Symptom scales/items
Overall Health Q29 Global health status/QoL
Overall Quality of Life Q30 Global health status/QoL
Global health status/QoL QL2 Global health status/QoL
Physical functioning PF2 Functional scales
Role functioning RF2 Functional scales
Emotional functioning EF Functional scales
Cognitive functioning CF Functional scales
Social functioning SF Functional scales
Fatigue FA Symptom scales/items
Nausea and vomiting NV Symptom scales/items
Pain PA Symptom scales/items
Dyspnoea DY Symptom scales/items
Insomnia SL Symptom scales/items
Appetite loss AP Symptom scales/items
Constipation CO Symptom scales/items
Diarrhea DI Symptom scales/items
Financial difficulties FI Symptom scales/items
Questionnaire Completion Status (C30)
CSTAT1
TABLE 1. Parameters related to Questionnaire QLQ-C30
PARAM PARAMCD PARCAT2 Amount of Cough LC1 Symptom scales/items Cough Up Blood LC2 Symptom scales/items Short of Breath Rested LC3 Symptom scales/items Short of Breath Walked LC4 Symptom scales/items Short of Breath Stairs LC5 Symptom scales/items Sore Mouth or Tongue LC6 Symptom scales/items Trouble Swallowing LC7 Symptom scales/items Tingling Hands or Feet LC8 Symptom scales/items Hair Loss LC9 Symptom scales/items Chest Pain LC10 Symptom scales/items

5
Arm or Shoulder Pain LC11 Symptom scales/items Pain in Other Body Parts LC12 Symptom scales/items Dyspnoea LCDY Symptom scales/items Coughing LCCO Symptom scales/items Haemoptysis LCHA Symptom scales/items Sore mouth LCSM Symptom scales/items Dysphagia LCDS Symptom scales/items Peripheral neuropathy LCPN Symptom scales/items Alopecia LCHR Symptom scales/items Pain in chest LCPC Symptom scales/items Pain in arm or shoulder LCPA Symptom scales/items Pain in other parts LCPO Symptom scales/items Questionnaire Completion Status (LC13) CSTAT2
TABLE 2. Parameters related to Questionnaire QLQ-LC13
PARAM PARAMCD Mobility MOBILITY Self-Care SELFCARE Usual Activities ACTIVITY Pain or Discomfort PAIN Anxiety or Depression ANXIETY EQ VAS Score EQVAS Questionnaire Completion Status (EQ-5D) CSTAT3
TABLE 3. Parameters related to Questionnaire EQ-5D-5L
Additional parameters from above table QL2-FI are derived in the analysis dataset. Figure 2 provides details regarding number of items, item range and item number to calculate the score for each of the parameter. For example, Global health status/QoL (QL2) consider item numbers Q29, Q30 (number of items as 2) which has minimum response as 1 and maximum response as 7 which gives item range of 6. Please refer to EORTC QLQ-C30 sample specimen provided at end of this paper.
Scale Number
of items Item
range* Version 3.0
Item numbers Function
scales
Global health status / QoL Global health status/QoL (revised)†
QL2
2
6
29, 30
Functional scales Physical functioning (revised)†
PF2
5
3
1 to 5
F
Role functioning (revised)† RF2 2 3 6, 7 F Emotional functioning EF 4 3 21 to 24 F Cognitive functioning CF 2 3 20, 25 F Social functioning SF 2 3 26, 27 F
Symptom scales / items

6
Fatigue FA 3 3 10, 12, 18 Nausea and vomiting NV 2 3 14, 15 Pain PA 2 3 9, 19 Dyspnoea DY 1 3 8 Insomnia SL 1 3 11 Appetite loss AP 1 3 13 Constipation CO 1 3 16 Diarrhoea DI 1 3 17 Financial difficulties FI 1 3 28
FIGURE 2. Scoring of the QLQ-C30
* Item range is the difference between the possible maximum and the minimum response to individual items.
Scoring of the lung cancer module The questionnaire QLQ-LC13 includes dyspnoea scale assessment which includes multi-item, and all other scales such as assessing pain (pain in chest, pain in arm or shoulder, pain in other parts), coughing, sore mouth, dysphagia, peripheral neuropathy, alopecia, and haemoptysis. The scoring approach for the QLQ-LC13 is identical in principle to that for the symptom scales /
single items of the QLQ-C30.
Scale name Scale Number of items
Item range
QLQ-LC13 Item numbers
†
Symptom scales / items
Dyspnoea† LCDY 3† 3 3,4,5 X
Coughing LCCO 1 3 1 Haemoptysis LCHA 1 3 2 Sore mouth LCSM 1 3 6 Dysphagia LCDS 1 3 7 Peripheral neuropathy LCPN 1 3 8 Alopecia LCHR 1 3 9 Pain in chest LCPC 1 3 10 Pain in arm or shoulder LCPA 1 3 11 Pain in other parts LCPO 1 3 12
† The dyspnoea scale should only be used if all three items have been answered.

7
For all scales, the Raw Score, RS, is the mean of the component items:
Raw Score=RS= (I1 +I2+…..+ Inn, Where I is individual item(question) in the Questionnaire form
XNUM = N (OF I1 I2…..In); XMEAN = MEAN (OF I1 I2…..In); XNUM is used to count the number of non-missing items, which should be at least half the total NITEMS items in the scale to derive a score i.e. xnum >= nitems / 2
To calculate the Functional scale score:
𝑆𝑆𝑆𝑆𝑆𝑆𝑆𝑆𝑆𝑆 = �1 −(𝑅𝑅𝑆𝑆 − 1)𝑅𝑅𝑅𝑅𝑅𝑅𝑅𝑅𝑅𝑅
� ∗ 100
To calculate Symptom scales / items and Global health status / QoL:
𝑆𝑆𝑆𝑆𝑆𝑆𝑆𝑆𝑆𝑆 = �(𝑅𝑅𝑆𝑆 − 1)𝑅𝑅𝑅𝑅𝑅𝑅𝑅𝑅𝑅𝑅
� ∗ 100
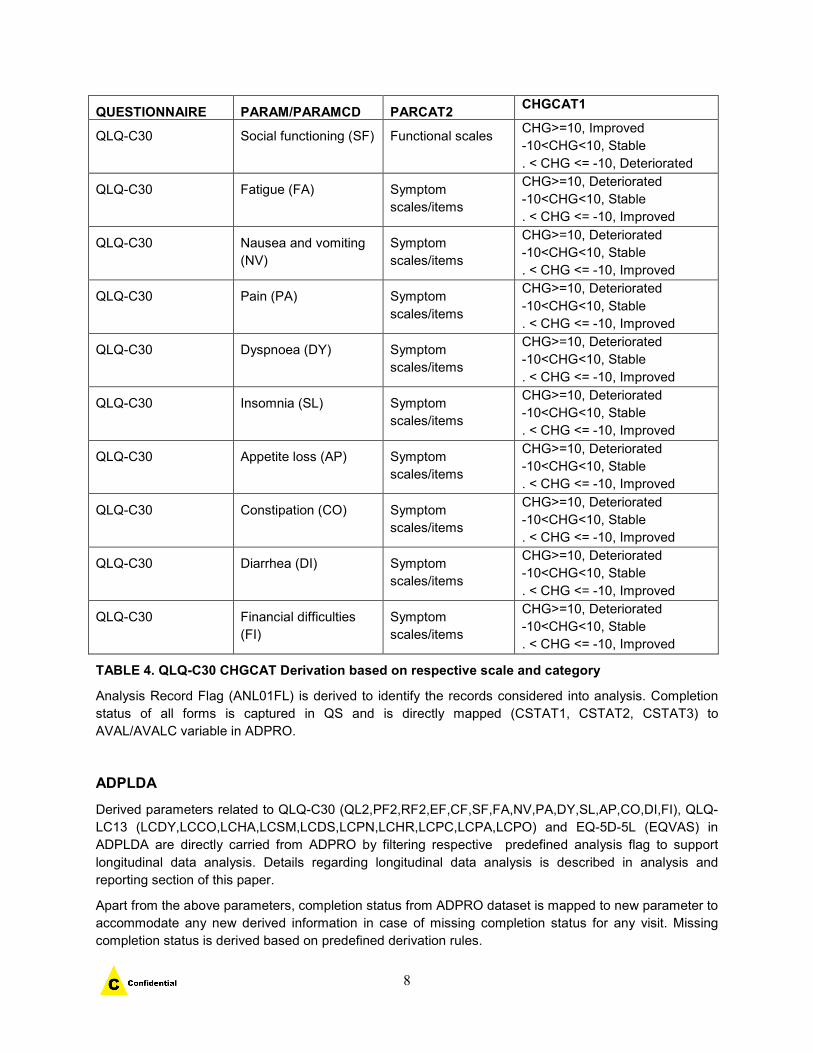
As mentioned earlier, since analysis datasets conform to ADaM class of BDS structure, Baseline flag (ABLFL), Baseline value (BASE), Change from Baseline (CHG), analysis visit (AVISIT) are derived to support analysis. Baseline column, BASE is identified for each subjid and parameter and then ABLFL is set to Y on the record whose analysis value is mapped to variable BASE. Change from baseline at each time point is calculated by difference of AVAL and BASE. AVISIT is used to describe analysis visit or analysis time point. Based on the value of change from baseline, different categories (stable, improved and deteriorated) are derived in Change from Baseline Category 1(CHGCAT1). Please refer to following Table 4 for complete derivation.
QUESTIONNAIRE PARAM/PARAMCD PARCAT2 CHGCAT1
QLQ-C30 Global health status/QoL (QL2)
Global health status/QoL
CHG>=10, Improved -10<CHG<10, Stable . < CHG <= -10, Deteriorated
QLQ-C30 Physical functioning (PF2)
Functional scales CHG>=10, Improved -10<CHG<10, Stable . < CHG <= -10, Deteriorated
QLQ-C30 Role functioning (RF2) Functional scales CHG>=10, Improved -10<CHG<10, Stable . < CHG <= -10, Deteriorated
QLQ-C30 Emotional functioning (EF)
Functional scales CHG>=10, Improved -10<CHG<10, Stable . < CHG <= -10, Deteriorated
QLQ-C30 Cognitive functioning (CF)
Functional scales CHG>=10, Improved -10<CHG<10, Stable . < CHG <= -10, Deteriorated
8
QUESTIONNAIRE PARAM/PARAMCD PARCAT2 CHGCAT1
QLQ-C30 Social functioning (SF) Functional scales CHG>=10, Improved -10<CHG<10, Stable . < CHG <= -10, Deteriorated
QLQ-C30 Fatigue (FA) Symptom scales/items
CHG>=10, Deteriorated -10<CHG<10, Stable . < CHG <= -10, Improved
QLQ-C30 Nausea and vomiting (NV)
Symptom scales/items
CHG>=10, Deteriorated -10<CHG<10, Stable . < CHG <= -10, Improved
QLQ-C30 Pain (PA) Symptom scales/items
CHG>=10, Deteriorated -10<CHG<10, Stable . < CHG <= -10, Improved
QLQ-C30 Dyspnoea (DY) Symptom scales/items
CHG>=10, Deteriorated -10<CHG<10, Stable . < CHG <= -10, Improved
QLQ-C30 Insomnia (SL) Symptom scales/items
CHG>=10, Deteriorated -10<CHG<10, Stable . < CHG <= -10, Improved
QLQ-C30 Appetite loss (AP) Symptom scales/items
CHG>=10, Deteriorated -10<CHG<10, Stable . < CHG <= -10, Improved
QLQ-C30 Constipation (CO) Symptom scales/items
CHG>=10, Deteriorated -10<CHG<10, Stable . < CHG <= -10, Improved
QLQ-C30 Diarrhea (DI) Symptom scales/items
CHG>=10, Deteriorated -10<CHG<10, Stable . < CHG <= -10, Improved
QLQ-C30 Financial difficulties (FI)
Symptom scales/items
CHG>=10, Deteriorated -10<CHG<10, Stable . < CHG <= -10, Improved
TABLE 4. QLQ-C30 CHGCAT Derivation based on respective scale and category
Analysis Record Flag (ANL01FL) is derived to identify the records considered into analysis. Completion status of all forms is captured in QS and is directly mapped (CSTAT1, CSTAT2, CSTAT3) to AVAL/AVALC variable in ADPRO.
ADPLDA Derived parameters related to QLQ-C30 (QL2,PF2,RF2,EF,CF,SF,FA,NV,PA,DY,SL,AP,CO,DI,FI), QLQ-LC13 (LCDY,LCCO,LCHA,LCSM,LCDS,LCPN,LCHR,LCPC,LCPA,LCPO) and EQ-5D-5L (EQVAS) in ADPLDA are directly carried from ADPRO by filtering respective predefined analysis flag to support longitudinal data analysis. Details regarding longitudinal data analysis is described in analysis and reporting section of this paper.
Apart from the above parameters, completion status from ADPRO dataset is mapped to new parameter to accommodate any new derived information in case of missing completion status for any visit. Missing completion status is derived based on predefined derivation rules.

9
ADTTD Time-to-deterioration (TTD)
For the EORTC QLQ-C30 and QLQ-LC13, a 10 points or greater worsening from baseline for each scale represents a clinically relevant deterioration based on prior literature. Time-to deterioration is defined as the time to first onset of 10 or more (out of 100) deterioration from baseline in a given scale/sub-scale/item and confirmed by a second adjacent 10 or more deterioration from baseline under a right-censoring rule. Typically, endpoint of interest for lung cancer trial is the composite endpoint of cough (QLQ-LC-13 Item 1), chest pain (QLQ-LC-13 Item 10), or dyspnoea (QLQ-C30 Item 8).
Various endpoints for TTD defined in protocol or SAP are derived in ADTTD dataset. ADTTD follows time to event analysis dataset structure per ADAM IG.
PARAMCD ADT CENSOR EVENT DESCRIPTION
TTDXX Select ADPRO records with parameter “XXX” (for example Pain in Chest, LCPC) and in conjunction with predefined analysis flags, select the earliest record with Change category (CHGCAT1) as “Deteriorated” confirmed by the following assessment {Event}
If there is no event, then select most recent date of post baseline records, if at least one post-baseline record exists with non-missing Change from Baseline {Censor}
Else ADT = TRTSDT
0 if event, 1 if censor
If there is an event,
then "Deteriorated from Chest Pain"
If there is no event and there is at least one valid post-baseline record, then "Censored at last assessment";
If there is no event and there is no valid post-baseline, then "Censored at first dose date";
TTDCOMP In case of composite endpoint, select required parameters based on above logic, combine all of them and select earliest record.
0 if event, 1 if censor
Event description would be based on analysis date from which parameter it was derived from. In case of ties, then we need to go with alphabetic order. In case of no event, use same logic as described above.
Time-to-Event Origin Date (STARTDT) is typically randomization date or treatment start date. Analysis value is calculated based on difference of analysis date (ADT) and STARTDT +1.
ANALYSIS AND REPORTING The above described analysis datasets (ADaM) are created to support PRO related endpoints defined in protocol such as mean change in scores and time to deterioration. Along with these endpoints, there are exploratory endpoints such as analysis of overall improvement and stability, for example Proportion

10
improved/stable in Global Health Status/QoL scale are also supported. Apart from the endpoints, Completion and compliance of Questionnaires by visit and by treatment will also be analyzed. The details regarding all these Analysis and Reporting formats are explained in subsequent paragraphs.
Mean Change in Score To calculate mean change from baseline at intended timepoint (visit) in the derived QLQ-C30 global health status/quality of life score (i.e., QL2 parameter from ADPRO), cLDA model will be used for analysis.
To assess the treatment effects on the PRO, for each continuous endpoint defined, a constrained longitudinal data analysis (cLDA) method proposed by Liang and Zeger [1] will be used. This model assumes a common mean across treatment groups at baseline and a different mean for each treatment at each of the post-baseline time points. In this model, the response vector consists of baseline and the values observed at each post-baseline time point. Time is treated as a categorical variable so that no restriction is imposed on the trajectory of the means over time. The analysis model will include the PRO score as the response variable, with covariates including treatment by study visit interaction, and the same stratification factors as used in the stratified analyses of efficacy endpoints. The treatment difference in terms of mean PRO score change from baseline at prespecified timepoint (time defined by time windows instead of study visit) will be estimated and tested from this model.
Above model is described as below in SAS code and sample display of report is also mentioned below.
Proc mixed data=dataset;
Class avisitn usubjid stratum;
Model y = avisitn stratum Trt*Time/ DDFM=KR;
Repeated Time / Subject=usubjid Type = un R;
Lsmeans Trt*Time / CL Pdiff e;
Run;
Baseline Week X Change from Baseline at Week X
Pairwise Comparison Inv. Drug vs. Control
Treatment N Mean (SD)
N Mean (SD)
N LS Mean (95% CI) Difference in LS Means
(95% CI)
p-value
Inv.Drg X xx.x (xx.xxx)
X xx.xx (xx.xxx)
X xx.xx (xx.xx) xx.xx (xx.xx) x.xx
Control X xx.xx (xx.xxx)
X xx.xx (xx.xxx)
X
xx.xx (xx.xx)

11
Time-to-deterioration (TTD) The TTD is defined as the time to first onset of 10 or more points deterioration from baseline with confirmation under right-censoring rule. The non-parametric Kaplan-Meier method will be used to estimate the deterioration curve in each treatment group. The estimate of median time to deterioration and its 95% confidence interval will be obtained from the Kaplan-Meier survival estimates. The treatment difference in TTD will be assessed by the stratified log-rank test. A stratified Cox proportional hazard model with Efron's method of tie handling and with a single treatment covariate will be used to assess the magnitude of the treatment difference (hazard ratio). SAS code to achieve above analysis is explained below and display of table is also mentioned below. TTD is also represented in Kaplan Meier plots representing time in X axis and no deterioration rate in Y axis.
proc lifetest data= dataset method=LT intervals=t1 t2 alpha=0.05; time aval* censor (0); strata treatment; survival out= xx conftype=LOGLOG; run;
Analysis of Overall Improvement/Stability Overall Improved/Stable rate will be calculated as the percentage of subjects who have 10 point
or more improvement or less than 10 points worsening in score from baseline at any time during
the trial and confirmed by a 10 point or more improvement or a less than 10 points worsening at
the next consecutive visit. The stratified Miettinen and Nurminen method will be used for
comparison of the overall improvement/stability rate between the treatment groups. The
difference in overall improvement/stability rate and its 95% CI from the stratified Miettinen and
Nurminen method with strata weighting by sample size will be provided.
Treatment N Number of
patients with Improvement/Stability
Proportion with Improvement/Stability % (95% CI)
Inv drug vs Control Difference of Improvement/Stability % (95% CI)
p-Value
Inv drug xxx xx xx.x (xx.x, xx.x)
Control xxx xx xx.x (xx.x, xx.x) xx.x (xx.x, xx.x) x.xx
Median TTD vs. Control Deterioration (Months) Treatment N (Events) % (95% CI) Hazard Ratio (95% CI) p-Value Inv drug X X (X.XX) X (X.XX) xx.xx (x.xx, x.xx) x.xx Control X X (X.XX) X (X.XX) --- ---

12
Compliance reports Completion and compliance of QLQ-C30, LC13 and EQ-5D-5L by visit and by treatment will be described within the specified population. Numbers and percentages of complete and missing data at each visit will be summarized for each of the treatment groups.
Completion Rate is defined as the percentage of observed visit over number of randomized subjects at each time points.
Completion Rate =Number of Subjects who Complete at least one Item
Number of Randomized Subjects
The completion rate is expected to shrink in the later visit during study period due to the
subjects who discontinued early. Therefore, another measurement, Compliance Rate, defined
as the percentage of observed visit over number of eligible subjects who are expected to complete
the PRO assessment (not including the subjects missing by design (such as death, discontinuation,
translation not available) will be employed as the support for completion rate).
Compliance Rate =Number of Subjects who Complete at least one Item
who are Expected to Complete
For example, Compliance of EORTC QLQ C30 by Visit and by Treatment is shown below
Inv Drug Control Treatment N = XX N = XX Visit Category n (%) n (%) T1 Missing by Design x (x.x) x (x.x) Discontinued due to adverse event Discontinued due to death Discontinued due to physician decision Discontinued due to progressive disease Discontinued due to clinical progression Discontinued due to withdrawal by subject Discontinued due to other Translation not available in subject’s language Subject died No visit scheduled Expected to Complete Questionnaires Not Complete Subject did not complete due to disease under
study
Not completed due to site staff error Subject in hospital or hospice Subject was physically unable to complete Subject lost to follow-up/unable to contact Subject did not complete due to side effect of
treatment

13
Graphs
Empirical mean change Graph
The empirical mean change (with 95% CIs) from baseline across time will be displayed
graphically for the following scale as an example: EORTC QLQ-C30 GHS/QoL (QL2 from ADPRO).
Note: Above data has been constructed for example purpose.

14
LS mean change Graph
Analysis of LS mean change (95% CI) from baseline to time point of interest will be displayed in bar plot
format for different questionnaires as mentioned in protocol. For example, see below bar plot displayed
for questionnaire EORTC QLQ-C30 global health status and functional scales. LS mean change from
baseline is plotted against different scales such as Global health status, Physical Functioning and others
as shown below.
Note: Above data has been constructed for example purpose.

15
APPENDIX

16
FIGURE 1. EORTC QLQ-C30 Specimen sheet

17
FIGURE 3. EORTC QLQ-LC13 Specimen sheet
CONCLUSION In recent years, regulatory agencies such as the FDA and EMA have increasingly promoted the use of PRO data in the development and approval of cancer products. Like regular clinical trial data, ePRO data can be analyzed and reported in tables and figures following CDISC guidelines, SDTM and ADaM models.
REFERENCES 1. Longitudinal Data Analysis Using Generalized Linear Models; Kung-Yee Liang; Scott L. Zeger
Biometrika, Vol. 73, No. 1. (Apr 1986), pp. 13-22. 2. The EORTC QLQ-C30 (in all versions), QL Coordinator, Quality of Life Unit, EORTC Data Center,
Avenue E Mounier 83 - B11, 1200 Brussels, BELGIUM. 3. EQ-5D-5L User Guide, Version 2.1, Apr 2015, Prepared by Mandy Van Raneen/Bas Janssen. 4. © Copyright 1995 EORTC Quality of Life Group. All rights reserved. Version 3.0. 5. QLQ-C30-LC13 Copyright 1994 EORTC Quality of life Group. All rights reserved. 6. CDISC, ADaM Implementation Guide, Version V 1.1. 7. CDISC, Analysis Data Model, Version 2.1 (ADaM 2.1).

18
8. CDISC, ADaM Basic Data Structure for Time-to-Event Analyses. 9. CDISC, SDTM Version 1.3. 10. CDISC, SDTM Implementation Guide Version 3.1.3. 11. U.S Department of Health and Human Services Food and Drug Administration Guidance for
Industry: Patient-Reported Outcome Measures: Use in Medical Product Development to Support Labeling Claims. [Last Accessed on2011 Apr 20];U.S. FDA, Clinical/Medical. 2009 available from: [http://www.fda.gov/downloads/Drugs/GuidanceComplianceRegulatoryInformation/Guidances/UCM193282.pdf. ] [PMC free article] [PubMed] [Google Scholar]
ACKNOWLEDGEMENTS I would like to thank my Management team for their feedback, inputs and review. CONTACT INFORMATION Your comments and questions are valued and encouraged. Contact the author at: Vijetha Kode([email protected]) Saigovind Chenna([email protected])