epr in the us what’s working and why - nerc 2017 conference/epr in... · epr in the us what’s...
TRANSCRIPT
EPR IN THE US WHAT’S WORKING AND WHY
Northeast Recycling Council Fall Conference
November 13, 2017
1

Are you ready to
effect change?
ORGANICS MANAGEMENT
WASTE RECOVERY
GLOBAL CORPORATE SUSTAINABILITY
© RRS 2017 2

© RRS 2017
WHAT WE DO SINCE 1986, RRS has expanded its services throughout the value chain:
• Planning/Implementing recycling and composting programs.
• Planning/Implementing materials management and zero waste solutions.
• Waste and compliance training.
• Developing/Facilitating collaborations to increase commodity recovery.
• Analyzing the recyclability and compostability of packaging.
• Evaluating anaerobic digestion and biomass facilities.
• Food waste prevention and organics recovery planning.
• Reviewing/Negotiating hauler and MRF contracts.
• Designing/Permitting MRF and composting sites.
• Developing/Implementing multi-stakeholder communications and outreach.
Much of our work is customized to the client’s situation. Talk to us to see if we are the right fit to help you effect change.

© RRS 2017
WHO WE ARE
30 40
660 1,000
OUR SKILLS years in recycling and managing resources
employees in 3 countries
years combined field experience
projects across 9 markets
4
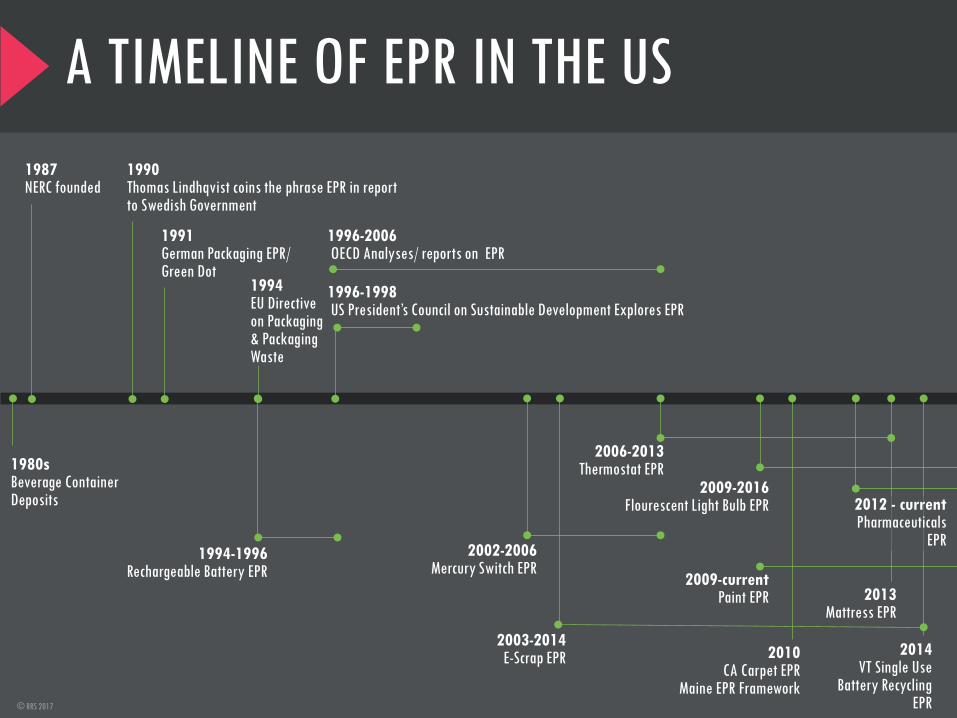
A TIMELINE OF EPR IN THE US
© RRS 2017
1987 NERC founded
1990 Thomas Lindhqvist coins the phrase EPR in report to Swedish Government
1991 German Packaging EPR/ Green Dot
1996-2006 OECD Analyses/ reports on EPR
1996-1998 US President’s Council on Sustainable Development Explores EPR
2014 VT Single Use
Battery Recycling EPR
2013 Mattress EPR
2010
CA Carpet EPR Maine EPR Framework
2012 - current Pharmaceuticals
EPR
2009-2016 Flourescent Light Bulb EPR
2009-current
Paint EPR
2006-2013 Thermostat EPR
1994 EU Directive on Packaging & Packaging Waste
2003-2014 E-Scrap EPR
2002-2006 Mercury Switch EPR
1994-1996 Rechargeable Battery EPR
1980s Beverage Container Deposits

6 © RRS 2017
WHY CHOOSE EPR?
Increase diversion
and recovery
Reduce cost to
government
Incorporate the cost of recycling / end-of-life
management in the cost of the product
Improve the design of
products to reduce
environmental impact

CHALLENGES IN EVALUATING EPR PROGRAM PERFORMANCE
7
• Pre-program data not available in most states, so before and after comparisons are difficult
• Little data available on recovery of most EPR target products in non-EPR states
• Limited visibility into local government budgets, pre- and post- EPR implementation to evaluate cost savings
© RRS 2017

8 © RRS 2017
DOES EPR ACHIEVE ITS OBJECTIVES?
Increase diversion
and recovery
Reduce cost to
government
Incorporate the cost of recycling / end-of-life
management in the cost of the product
Improve the design of
products to reduce
environmental impact

9
DOES EPR INCREASE RECOVERY? CT EXAMPLE
0%10%20%30%40%50%60%70%80%
- 20,000 40,000 60,000 80,000
100,000 120,000 140,000 160,000
2012 2013 2014 2015
Perc
ent o
f ge
nera
ted
mat
eria
l rec
ycle
d
Mat
tres
ses a
nd B
ox
Sprin
gs (u
nits
)
MATTRESSES RECYCLED & DISPOSED: 2010-2015
Mattresses recycled(units)
Mattresses disposed(units)
Percent of generatedmattresses recycled
-
1.00
2.00
3.00
4.00
5.00
6.00
-
5,000
10,000
15,000
20,000
2009 2010 2011 2012 2013 2014 2015
Poun
ds p
er C
apita
Poun
ds (t
hous
ands
)
CHANGE IN E-WASTE COLLECTED
Total e-waste collected(lbs)
CEDs collected (lbs)
E-waste collected percapita (lbs)
Source: Product Stewardship Institute for CT Department of Energy and Environmental Protection

10
DOES EPR INCREASE RECOVERY? CT EXAMPLE
0.0%1.0%2.0%3.0%4.0%5.0%6.0%7.0%8.0%9.0%10.0%
-
1,000
2,000
3,000
4,000
5,000
2008 2009 2010 2011 2012 2013 2014 2015
Perc
ent o
f G
ener
ated
Th
erm
osta
ts C
olle
cted
Ther
mos
tat E
quiv
alen
ts
TRC CT THERMOSTAT COLLECTIONS, 2008-2015
Thermostatequivalentscollected1
Percent ofgeneratedthermostatscollected3
0%
10%
20%
30%
40%
50%
60%
-
50,000
100,000
150,000
200,000
250,000
300,000
350,000
2008 2009 2010 2011 2012 FY 2014 FY 2015 FY 2016Pe
rcen
t of
Gen
erat
ed P
aint
Pain
t (ga
llons
)
LATEX AND OIL-BASED PAINT COLLECTED: 2008-2016 Oil-based paintcollected (gallons)
Latex paint collected(gallons)
Percent of generatedleftover paintcollected
Source: Product Stewardship Institute for CT Department of Energy and Environmental Protection

11 Source: PaintCare Annual Reports
DOES EPR INCREASE RECOVERY? PAINT EXAMPLE
0
500,000
1,000,000
1,500,000
2,000,000
2,500,000
3,000,000
3,500,000
California Connecticut Minnesota Oregon Vermont
GA
LLO
NS
PAINT COLLECTED PRE- AND POST-EPR
Pre-EPR (gallons)
Post-EPR (gallons)
2016 (gallons)
Post-EPR = first full year of data after EPR implementation Note that in 2016 some total collections decreased slightly, but sales were also lower and so the recovery rate may have increased.

12 © RRS 2017
DOES EPR SAVE GOVERNMENT MONEY? CT EXAMPLE
$0
$100,000
$200,000
$300,000
$400,000
$500,000
$600,000
$700,000
$800,000
$900,000
$1,000,000
2008 2009 2010 2011 2012 FY 2014 FY 2015
TOTAL STATE & LOCAL GOV’T PAINT MANAGEMENT COSTS DEEPadministrativecosts
Cost to MunicipalTransfer Stations(latex+oil)
Cost to PermanentHHW Sites (oilonly)
Cost of Events (oilonly)
Disposal Cost forNon-Accounted forLatex
Source: Product Stewardship Institute for CT Department of Energy and Environmental Protection
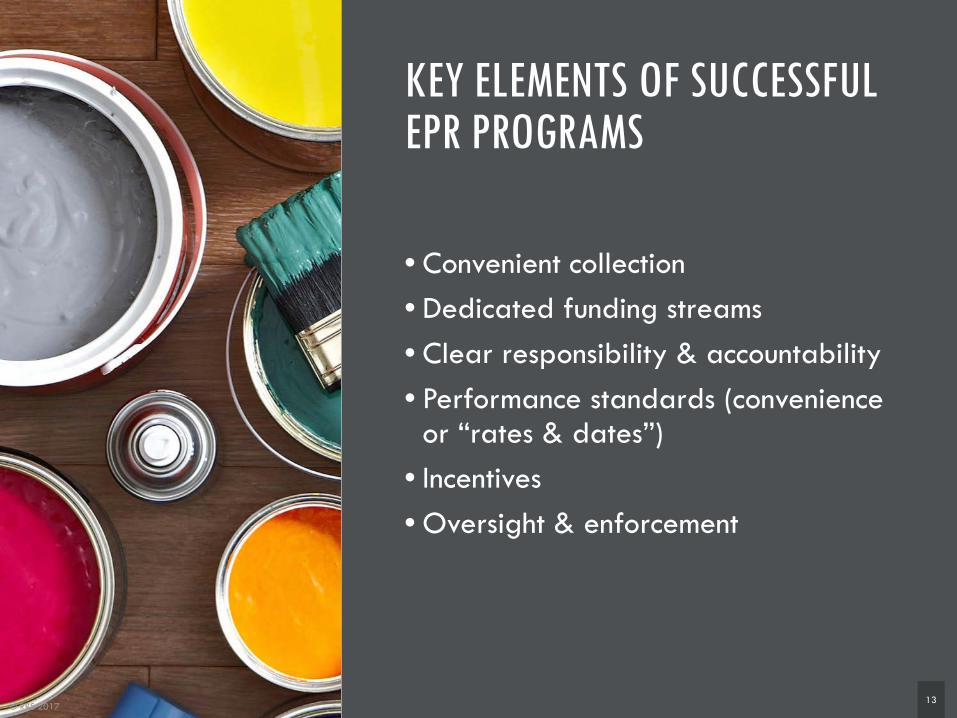
KEY ELEMENTS OF SUCCESSFUL EPR PROGRAMS
13
• Convenient collection • Dedicated funding streams • Clear responsibility & accountability • Performance standards (convenience
or “rates & dates”) • Incentives • Oversight & enforcement
© RRS 2017

OTHER CONTRIBUTORS TO SUCCESSFUL PROGRAMS
14
• Transparency / reporting requirements
• Environmental management standards
• Disposal bans • Education & outreach
© RRS 2017

15 © RRS 2017
DOES EPR INCREASE RECOVERY? E-SCRAP EXAMPLE
0
1
2
3
4
5
6
7
8
9
10
LBS/
CA
PITA
PER CAPITA E-WASTE COLLECTION, 2015
*State has an e-waste landfill ban **Data is for a different year (Delaware 2016, Kansas 2013, South Dakota 2011)
Source: ERCC (EPR States); State websites (non EPR states)
Note: This chart presents available data on program performance, but does not provide an “apples to apples” comparison as the covered products and entities (e.g., residents, businesses, schools, etc.) vary from state to state.
Structured EPR Less structured EPR Non-EPR

EPR CHALLENGES: CHANGING ROLES
16
• Appropriate roles for state and local governments
• Proper balance of responsibility & authority
© RRS 2017

DRIVERS FOR EPR MOVING FORWARD
17
• Government budget challenges continue
• Market challenges / export restrictions hamper growth in recovery
• Circular economy capturing attention of business leaders
© RRS 2017
