epr and optical absorption studies of cu2+ doped lithium maleate dihydrate single crystal
TRANSCRIPT
EPR and optical absorption studies of Cu2þ doped lithium maleatedihydrate single crystal
Ram Kripal n, Shri Devi PandeyEPR Laboratory, Department of Physics, University of Allahabad, Allahabad 211002, India
a r t i c l e i n f o
Article history:Received 2 February 2014Received in revised form9 March 2014Accepted 10 March 2014Available online 21 March 2014
Keywords:Organic compoundsCrystal growthCrystal fieldsOptical propertiesElectron paramagnetic resonance
a b s t r a c t
Electron paramagnetic resonance (EPR) study of Cu2þ doped lithium maleate dihydrate single crystal isdone at liquid nitrogen temperature (LNT). Four hyperfine lines are observed in all directions, i.e. only asingle site is observed. The spin Hamiltonian parameters are determined from EPR spectra:gx¼2.10070.002, gy¼2.16270.002, gz¼2.21570.002, Ax¼(5575)�10�4 cm�1, Ay¼(5275)�10�4 cm�1, Az¼(5075)�10�4 cm�1. The results indicate that the copper ion enters the latticeinterstitially. Using the spin Hamiltonian parameters obtained from EPR study the ground state wavefunction of Cu2þ ion in the lattice is determined. The optical absorption study of Cu2þ doped lithiummaleate dihydrate at room temperature is also performed. With the help of optical and EPR data, thenature of bonding in the complex is discussed.
& 2014 Elsevier B.V. All rights reserved.
1. Introduction
Electron paramagnetic resonance (EPR) studies of Cu2þ impu-rities have been widely carried out in a variety of single crystals[1–8]. The hyperfine structure of copper ion was first investigatedin solid state by the method of EPR. In Cu2þ complexes the metalions have either four or six co-ordination geometry and there areonly few exceptions to this. The 3d9 configuration of Cu2þ is ofparticular interest because it represents a simple one magnetichole system. EPR and optical absorption are two supplementarytools to investigate the site symmetry of the impurity, the dynamicbehavior of the dopant and its nature of bonding in crystals. Theobjectives of EPR studies of transition metal ions doped in crystalsare to find the sites available for the impurity ion and theirorientations, the study of phase transition and magnetic propertiesof unpaired electrons of transition metal ions.
Lithium compounds are used as the standard in the treatmentof bipolar disorder. Lithium salts may be helpful in diagnoses ofschizoaffective disorder and cyclic major depression [9]. Organo-lithium compounds are used as strong bases, as reagents for theformation of carbon–carbon bonds, as catalysts in polymer synth-esis or initiators in anionic polymerization of unfunctionalizedolefins [10–12]. Such compounds are in turn very reactive and arethe basis of many synthetic applications [13]. Lithium compoundsare also used as pyrotechnic colorants and oxidizers in redfireworks and flares [14]. Some of these compounds (e.g. lithium
niobate) are used as non-linear optical materials. Due to reasonsmentioned above, our interest developed in lithium maleatedihydrate.
In the present study, EPR at liquid nitrogen temperature (LNT)and optical absorption at room temperature (RT) of Cu2þ dopedlithium maleate dehydrate (LMD) are carried out to find thelocation of impurity ion in the lattice. The study is also used toobtain the site symmetry, the energy level structure and the natureof bonding of Cu2þ ion with its various ligands in the crystal.
2. Crystal structure
LMD, Li2C4H2O4 �2H2O single crystal is monoclinic, belongs tothe space group Cc or C2/c and Z¼8 [15]. The unit cell dimensionsare a¼9.6306, b¼12.1307, c¼12.7051 Å and β¼107.961. Theprojection of the structure along the b-axis is shown in Fig. 1(a).The main plane of each maleate ion is approximately parallel to(001). The water molecules are sandwiched between layers ofmaleate ions and lithium ions. The structure is continuouslybonded in three dimensions by either ionic or hydrogen bonds.Each lithium ion forms bonds with four oxygen atoms and eachmaleate ion is bonded by four oxygen atoms to lithium ions andwater molecules.
3. Experimental details
Single crystals of LMD were prepared by slow evaporation of anaqueous solution of maleic acid with stoichiometric ratio of
Contents lists available at ScienceDirect
journal homepage: www.elsevier.com/locate/physb
Physica B
http://dx.doi.org/10.1016/j.physb.2014.03.0210921-4526/& 2014 Elsevier B.V. All rights reserved.
n Corresponding author. Tel.: þ91 532 2470532; fax: þ91 532 2460993.E-mail addresses: [email protected] (R. Kripal),
[email protected] (S.D. Pandey).
Physica B 444 (2014) 14–20

lithium hydroxide. For Cu2þ doped crystals, an aqueous solution of0.05 wt% of copper sulfate was added as dopant. Good, transparentand monoclinic prism shaped crystals were grew in about twoweeks. The crystals are elongated parallel to a axis and show forms(010), (110) and (001). The maximum size of the grown crystals is12 mm�1.5 mm�0.7 mm. The morphology of the crystal wasfound to be as shown in Fig. 1(b) together with the orientation ofthe crystal axes. The coordination of Cu2þ in LMD is shown inFig. 1(c).The coordinates of Cu2þ ion are (0.2100, 0.2862, and0.1001) and site symmetry is C2v.
EPR spectra of single crystals were recorded at LNT using a X-bandVarian E-112 EPR spectrometer with 100 kHz field modulation. Thesingle crystals were mounted at the end of a quartz rod using quick-fixand crystal rotations were performed along the three mutuallyorthogonal axes a, b, cn at an interval of 101 using a goniometer. Inthe monoclinic system two of the crystal axes are perpendicular toeach other, but the third is obliquely inclined. The LMD crystal ismonoclinic so we choose a, b, and cn experimental axis system forsingle crystal studies. In this system a and b are orthogonal crystal-lographic axes and cn is orthogonal to both a and b. The optical spectrawere recorded on a Unicam-5625 spectrophotometer in the wave-length range 195–1100 nm at room temperature.
4. Results and discussion
The 3d9 system with S¼1/2 and I¼3/2 exhibits four hyperfinelines from a single complex for two stable isotopes of copper: 63Cu(69.05% abundant) and 65Cu (30.95% abundant). The lines corre-sponding to the less abundant isotope of Cu2þ (65Cu) could not beresolved perhaps due to the broadness of lines. EPR spectrum ofCu2þ doped LMD single crystal taken at LNT in ab plane for themagnetic field at 01 from a axis (frequency 9.1 GHz) is shown inFig. 2(a). The unit cell of host crystal contains eight molecules perunit cell but only one set of four hyperfine lines is observed. This isexplained on the basis of interstitial doping. For a substitutionalsite of Cu2þ in monoclinic crystal with two molecules per unit cell,two sets of four lines should be observed in two planes and onlyone set of four lines in one plane of rotation [16]. In the present
study, the number of atoms per unit cell is eight in the monocliniccrystal. Therefore, we should get eight sets of four hyperfine linesin two planes and four sets of four hyperfine lines in third planefor substitutional site of Cu2þ in place of Liþ . But we haveobserved only one set of four hyperfine lines in all three ab, bcn
and cna planes. This indicates that the Cu2þ ion enters the hostlattice interstitially. Further, the ionic radius of Liþ ion (68 pm) issmaller than that of Cu2þ ion (72 pm), which also suggests lesspossibility of substitution of Cu2þ in place of Liþ . The simulationof EPR spectrum using EasySpin [17–20] and spin Hamiltonianparameters (obtained from the EPR spectra using Schonlandprocedure) gx¼2.10070.002, gy¼2.16270.002, gz¼2.21570.002, Ax¼(5575)�10�4 cm�1, Ay¼(5275)�10�4 cm�1, Az¼(5075)�10�4 cm�1 was performed. The simulation was basedupon diagonalization of the entire S¼1/2, I¼3/2 energy matrix.
Cu2+
O(3)
O(1)
O(5)
O(2)
gy
gxgz
Fig. 1. (a) Projection of crystal structure along b-axis. (b) Morphology and orientation of axes of the LMD crystal. (c) Coordination of Cu2þ in LMD (coordinates of Cu2þ ion:(0.2100, 0.2862, and 0.1001)).
Fig. 2. (a) EPR spectrum of Cu2þ doped LMD crystal in ab plane for the magneticfield at 01 from the a-axis (frequency 9.1 GHz). (b) Simulated EPR spectrum of Cu2þ
doped LMD crystal in ab plane for the magnetic field at 01 from the a axis(frequency 9.1 GHz).
R. Kripal, S.D. Pandey / Physica B 444 (2014) 14–20 15
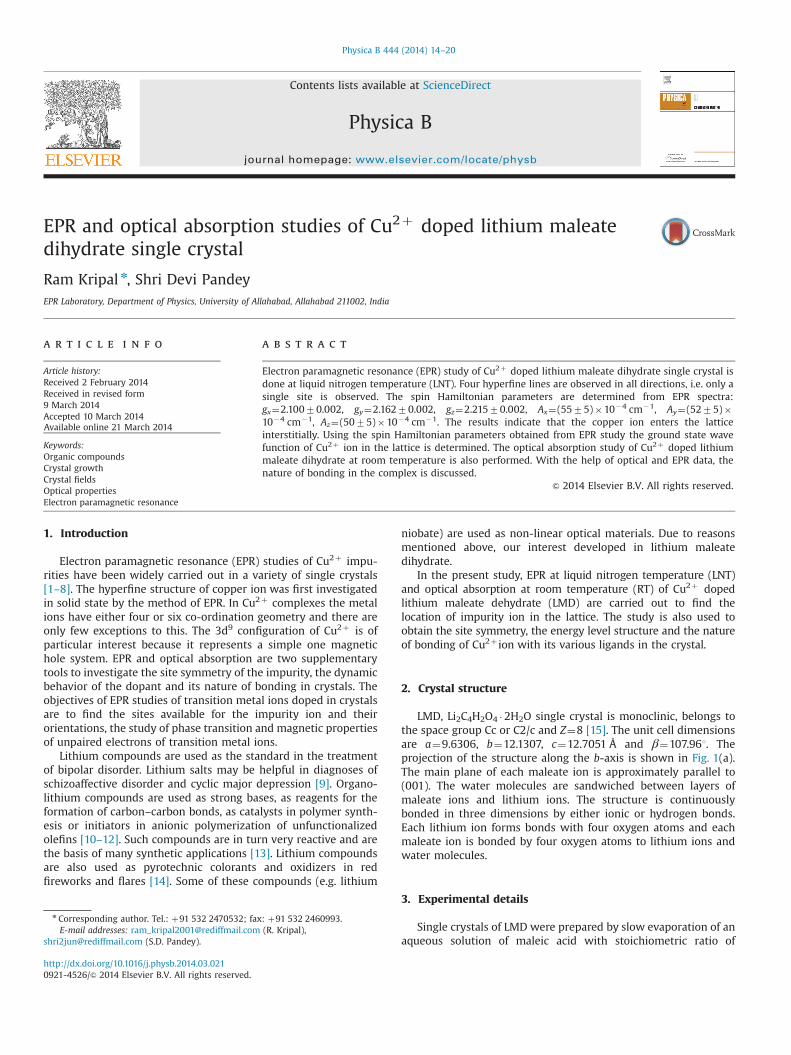
Lorentzian first derivative lineshapes were used. The simulatedspectrum is in reasonable agreement with the experimental one.The simulated EPR spectrum of Cu2þ doped LMD crystal in abplane for the magnetic field at 01 from a axis (frequency 9.1 GHz) isshown in Fig. 2(b).The angular variation of hyperfine lines in allthree ab, bcn and cna planes is shown in Fig. 3(a), (b) and (c),respectively. The direction of the maximum overall splitting of EPRspectrum is taken as the z-axis and that of the minimum as thex-axis [21]. The EPR spectra recorded in ab and cna planes showeda large anisotropy in g and A values; however the correspondingvariation in bcn plane is small. The principal values of g and Atensors for Cu2þ doped LMD single crystals were evaluated usingthe Schonland procedure [22], in which all the EPR line positionsrecorded for the magnetic field in the three planes were fitted tothe spin Hamiltonian 1 [23] shown as follows:
ℋ¼ μBSgBþSAI ð1Þ
where S¼1/2 and I¼3/2 are the electronic and nuclear spins ofCu2þ , μB is Bohr magneton, g is spectroscopic splitting factor and Ais hyperfine structure constant. The spin Hamiltonian parameters gand A together with their direction cosines evaluated using theSchonland procedure [18] and self-developed computer programare given in Table 1. The procedure of obtaining principal values ofthe g-tensor is to rotate the magnetic field about three mutuallyperpendicular axes fixed in the crystal and to measure the g valuevariation in the plane perpendicular to each axis, respectively.If l1, l2 and l3 are the direction cosines of the magnetic fieldwith respect to above axes, the square of corresponding g-value isgiven by
g2 ¼ ∑3
i;j ¼ 1Gijlilj ð2Þ
When the coefficients Gij are known for a particular set of axes,the principal g values and principal axes are found by diagonaliz-ing the matrix G. If θ is an angle specifying the direction of themagnetic field in the plane of measurement, the g2 variation in theplane must fit to the expression [22]
g2 ¼ αþβcos2θþγsin2θ ð3Þwhere α, β and γ are functions of Gij. Fig. 4 shows the angularvariation of g2 and g2A2 in ab, bcn and cna planes and indicates anapproximate rhombic symmetry for copper ion in the LMD lattice.The quantities α, β and γ are determined by obtaining the best fitof Eq. (3) to a large number of g-value measurements at differentangles. The quantities α, β and γ can also be expressed in terms ofmaximum (gþ ) and minimum (g� ) g-values in the plane and theangle θþ at which the maximum g-value appears as
2α¼ g2þ þg2�2β¼ ðg2þ �g2� Þcos2θþ
2γ ¼ ðg2þ �g2� Þsin2θþ ð4Þ
To find all Gij, it is essential to measure the g-value variation inall three ab, bcn and cna planes. This gives nine equations to findthe six independent Gij. The G matrix is then diagonalized and theprincipal values of g are obtained as the square roots of thediagonalized G tensor eigenvalues
Gdiag ¼ R�1GR
gx ¼ffiffiffiffiffiffiffiffiG11
p; gy ¼
ffiffiffiffiffiffiffiffiG22
pand gz ¼
ffiffiffiffiffiffiffiffiG33
pð5Þ
where x, y and z are the principal axes of the g-tensor and R is theeigenvector matrix giving the direction cosines of gx, gy and gz withrespect to the rotation axes in the laboratory axis system. Thevalues are then transformed into the crystal and hence the
Fig. 3. (a) Angular variation of EPR line positions of Cu2þ doped LMD in ab plane. (b) Angular variation of EPR line positions of Cu2þ doped LMD in bcn plane. (c) Angularvariation of EPR line positions of Cu2þ doped LMD in cna plane.
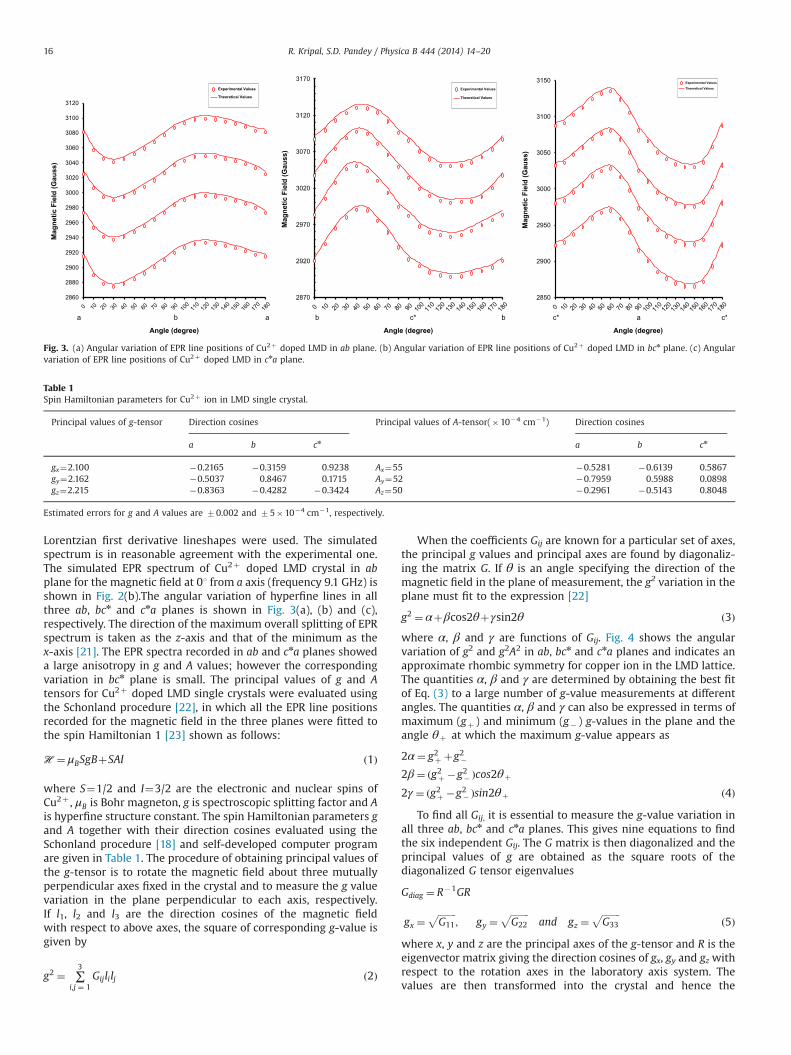
Table 1Spin Hamiltonian parameters for Cu2þ ion in LMD single crystal.
Principal values of g-tensor Direction cosines Principal values of A-tensor(�10�4 cm�1) Direction cosines
a b cn a b cn
gx¼2.100 �0.2165 �0.3159 0.9238 Ax¼55 �0.5281 �0.6139 0.5867gy¼2.162 �0.5037 0.8467 0.1715 Ay¼52 �0.7959 0.5988 0.0898gz¼2.215 �0.8363 �0.4282 �0.3424 Az¼50 �0.2961 �0.5143 0.8048
Estimated errors for g and A values are 70.002 and 75�10�4 cm�1, respectively.
R. Kripal, S.D. Pandey / Physica B 444 (2014) 14–2016

molecular framework using the direction cosines of the rotationaxes. The principal values of the A tensor and their directioncosines can also be obtained by a similar procedure as for theg-tensor taking the angular variation of g2A2 in three perpendi-cular planes. The parameter errors are determined using a statis-tical method [24].
The values of spin Hamiltonian parameters of Cu2þ doped LMDobtained here are similar to the results of earlier works [5,25,26]shown in Table 2. The direction cosines of different bonds inlithium maleate dihydrate crystal are calculated from X-ray dataand compared with those obtained by an EPR method. The ionicdistances and direction cosines of various bonds are given inTable 3. The direction cosines of O(1)–O(3) bond agree withinexperimental errors with those obtained for the principal axis ofg-tensor of Cu2þ ion. The observed EPR spectra are assigned toCu2þ ions on interstitial sites. An ion in an interstitial site has fournearest neighbor lithium ions at the corners of a cube; the ligandsconsist of a tetrahedron of oxygen ions and a tetrahedron oflithium ions (Fig. 1(c)). Cu2þ ion has a small radius (72 pm) and fitsreadily into an interstitial site. The spectrum of Cu2þ in LMD canbe explained by assuming that Cu2þ ions are associated with fourneighboring lithium vacancies. This gives rise to the creation of anentity Cu (OH)42� in the crystal. The capture of the necessarylithium vacancies takes place either by migration to the Cu2þ siteof those already present in the lattice or by the removal of lithiumions migrating away as interstitials. The product of the concentra-tions of free lithium vacancies and interstitial lithium ions remainsconstant throughout the process. A similar effect has been found
for Fe3þ ions incorporated in AgCl [27]. This indicates that Cu2þ
ion takes up interstitial position [27] (coordinates of Cu2þ ion:(0.2100, 0.2862, 0.1001)) in the crystal showing tetrahedral struc-ture (Fig. 1(c)) with O(1), O(2), O(3) and O(5) as the surroundingoxygen atoms.
4.1. Optical spectrum
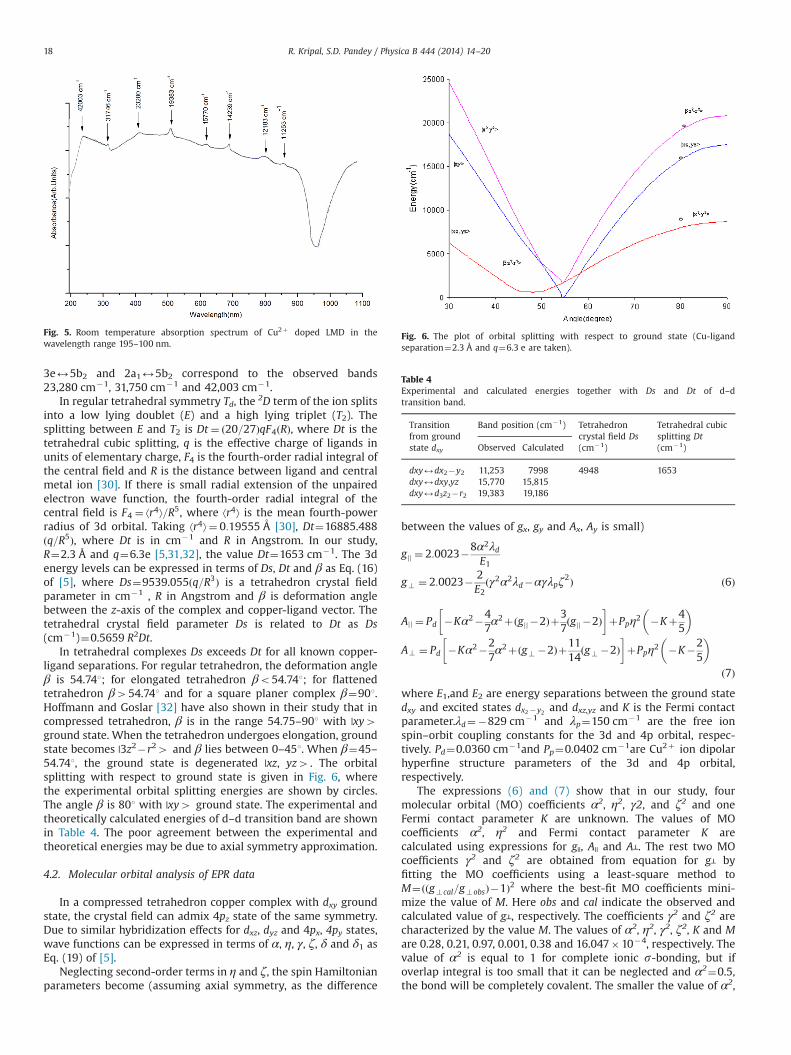
The optical absorption spectrum of Cu2þ doped LMD singlecrystal at room temperature in the wavelength range 195–1100 nm is shown in Fig. 5. There are five bands appearing atν1¼11,253 cm�1, ν2¼12,183 cm�1, ν3¼14,239 cm�1, ν4¼15,770cm�1, and ν5¼19,383 cm�1 in visible region and three bands inultraviolet region at ν6¼23,280 cm�1, ν7¼31,746 cm�1 andν8¼42,003 cm�1.
From the nature of absorption spectrum in visible region, theband observed at ν1¼11,253 cm�1 is called as the d–d transitionband between ground state dxy and the excited state dx2 �y2 . Theabsorption band at ν4¼15,770 cm�1 may be called as d–d transi-tion band between dxy and dxz,yz. The third absorption bandobserved at ν5¼19,383 cm�1 can be called as the d–d transitionband between ground state dxy and the excited state d3z2 � r2 . Thebands at 12,183 cm�1 and at 14,188 cm�1 may be infrared spectralovertone and/or combination bands [28]. There are three bandsobserved in UV region. These bands are probably charge transferbands, as they arise from the higher lying energy levels. Theobserved bands in UV region at 23,280 cm�1, 31,750 cm�1 and42,003 cm�1 can be compared with the bands for CuCl2�4 complex[29]. From the results of CuCl2�4 complex, the transitions 4e25b2,
Fig. 4. Angular variation of g2 and g2A2 for B in ab, bcn and cna planes for Cu2þ
doped LMD.
Table 2Spin Hamiltonian parameters for Cu2þ ion in different lattices performed in earlier works.
Lattices gx gy gz Ax Ay Az
(�10�4 cm�1)
Cs2ZnCl4: Cu2þ 2.08370.004 2.10170.003 2.44670.002 5175 4675 2574C2H8N2ZnCl2: Cu2þ 2.05870.002 2.06270.002 2.29770.00 974 974 12374ZnC28H36N6O6: Cu2þ 2.0270.002 2.0970.002 2.16370.002 3072 4072 15472
Table 3Distances and direction cosines of various Li–O and O–O vectors in LMD singlecrystal.
Bond Distance (Å) Direction cosines
a b cn
Li(1)–O(1) 1.9107 70.9827 70.3016 70.4904Li(1)–O(2) 6.0703 70.95681 70.179 70.0782Li(1)–O(3) 2.0151 70.1115 70.9813 70.1946Li(1)–O(4) 11.0920 70.1509 70.2193 70.9184Li(1)–O(5) 5.5747 70.1691 70.9631 70.1635Li(1)–O(6) 8.9286 70.1619 70.9843 70.0357Li(2)–O(1) 4.7869 70.6814 70.7412 70.0359Li(2)–O(2) 5.9449 70.7441 70.6828 70.0487Li(2)–O(3) 2.0217 70.7960 70.4917 70.1843Li(2)–O(4) 12.2586 70.2494 70.0439 70.893Li(2)–O(5) 4.0475 70.5749 70.5923 70.4142Li(2)–O(6) 6.7020 70.4223 70.8679 70.1617O(1)–O(2) 7.5737 70.9960 70.0662 70.0598O(1)–O(3) 2.9993 70.5510 70.8515 70.1816O(1)–O(4) 11.4658 70.0177 70.2624 70.9702O(1)–O(5) 6.2109 70.1505 70.9572 70.2976O(1)–O(6) 9.4413 70.0457 70.9919 70.1331O(2)–O(3) 10.1415 70.5949 70.3022 70.0081O(2)–O(4) 16.3904 70.4565 70.2147 70.6505O(2)–O(5) 11.942 70.5653 70.5406 70.1161
R. Kripal, S.D. Pandey / Physica B 444 (2014) 14–20 17
3e25b2 and 2a125b2 correspond to the observed bands23,280 cm�1, 31,750 cm�1 and 42,003 cm�1.
In regular tetrahedral symmetry Td, the 2D term of the ion splitsinto a low lying doublet (E) and a high lying triplet (T2). Thesplitting between E and T2 is Dt ¼ ð20=27ÞqF4ðRÞ, where Dt is thetetrahedral cubic splitting, q is the effective charge of ligands inunits of elementary charge, F4 is the fourth-order radial integral ofthe central field and R is the distance between ligand and centralmetal ion [30]. If there is small radial extension of the unpairedelectron wave function, the fourth-order radial integral of thecentral field is F4 ¼ ⟨r4⟩=R5, where ⟨r4⟩ is the mean fourth-powerradius of 3d orbital. Taking ⟨r4⟩¼ 0:19555 A [30], Dt¼16885.488ðq=R5Þ, where Dt is in cm�1 and R in Angstrom. In our study,R¼2.3 Å and q¼6.3e [5,31,32], the value Dt¼1653 cm�1. The 3denergy levels can be expressed in terms of Ds, Dt and β as Eq. (16)of [5], where Ds¼9539.055ðq=R3Þ is a tetrahedron crystal fieldparameter in cm�1 , R in Angstrom and β is deformation anglebetween the z-axis of the complex and copper-ligand vector. Thetetrahedral crystal field parameter Ds is related to Dt as Ds(cm�1)¼0.5659 R2Dt.
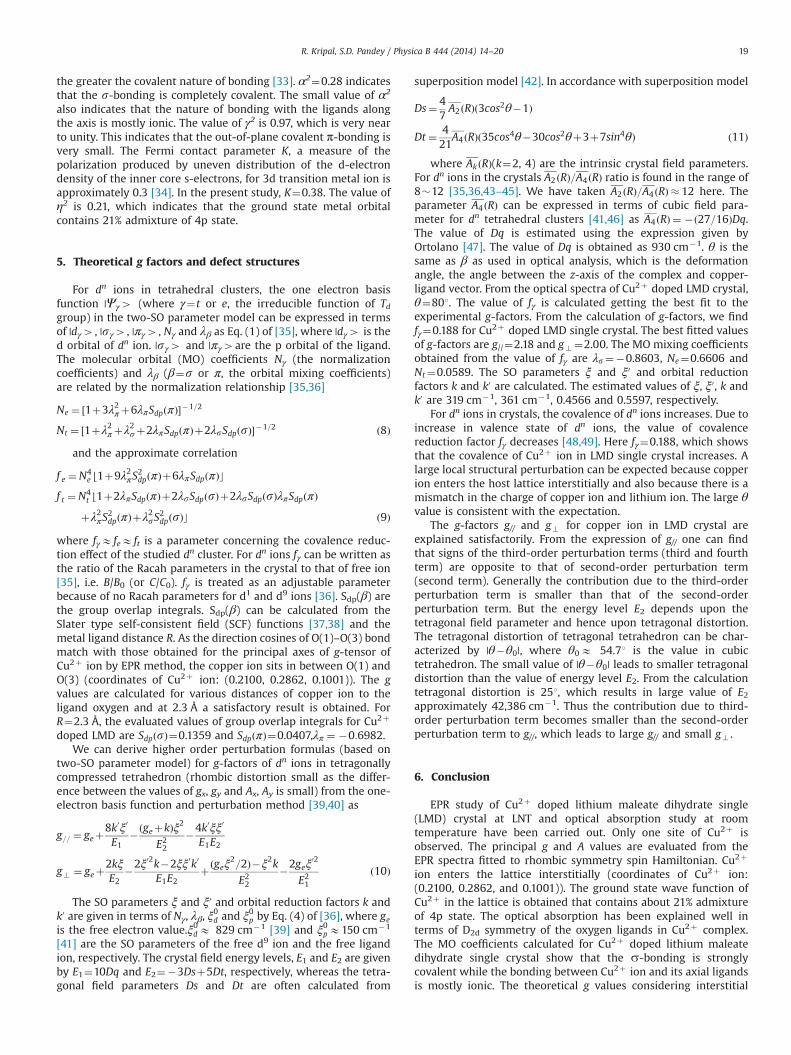
In tetrahedral complexes Ds exceeds Dt for all known copper-ligand separations. For regular tetrahedron, the deformation angleβ is 54.741; for elongated tetrahedron βo54.741; for flattenedtetrahedron β454.741 and for a square planer complex β¼901.Hoffmann and Goslar [32] have also shown in their study that incompressed tetrahedron, β is in the range 54.75–901 with |xy4ground state. When the tetrahedron undergoes elongation, groundstate becomes |3z2�r24 and β lies between 0–451. When β¼45–54.741, the ground state is degenerated |xz, yz4 . The orbitalsplitting with respect to ground state is given in Fig. 6, wherethe experimental orbital splitting energies are shown by circles.The angle β is 801 with |xy4 ground state. The experimental andtheoretically calculated energies of d–d transition band are shownin Table 4. The poor agreement between the experimental andtheoretical energies may be due to axial symmetry approximation.
4.2. Molecular orbital analysis of EPR data
In a compressed tetrahedron copper complex with dxy groundstate, the crystal field can admix 4pz state of the same symmetry.Due to similar hybridization effects for dxz, dyz and 4px, 4py states,wave functions can be expressed in terms of α, η, γ, ζ, δ and δ1 asEq. (19) of [5].
Neglecting second-order terms in η and ζ, the spin Hamiltonianparameters become (assuming axial symmetry, as the difference
between the values of gx, gy and Ax, Ay is small)
gjj ¼ 2:0023�8α2λdE1
g? ¼ 2:0023� 2E2
ðγ2α2λd�αγλpζ2Þ ð6Þ
Ajj ¼ Pd �Kα2�47α2þðgjj �2Þþ3
7ðgjj �2Þ
� �þPpη2 �Kþ4
5
� �
A? ¼ Pd �Kα2�27α2þðg? �2Þþ11
14ðg? �2Þ
� �þPpη2 �K�2
5
� �
ð7Þwhere E1,and E2 are energy separations between the ground statedxy and excited states dx2 �y2 and dxz,yz and K is the Fermi contactparameter.λd¼�829 cm�1 and λp¼150 cm�1 are the free ionspin–orbit coupling constants for the 3d and 4p orbital, respec-tively. Pd¼0.0360 cm�1and Pp¼0.0402 cm�1are Cu2þ ion dipolarhyperfine structure parameters of the 3d and 4p orbital,respectively.
The expressions (6) and (7) show that in our study, fourmolecular orbital (MO) coefficients α2, η2, γ2, and ζ2 and oneFermi contact parameter K are unknown. The values of MOcoefficients α2, η2 and Fermi contact parameter K arecalculated using expressions for g||, A|| and A┴. The rest two MOcoefficients γ2 and ζ2 are obtained from equation for g┴ byfitting the MO coefficients using a least-square method toM¼ððg? cal=g?obsÞ�1Þ2 where the best-fit MO coefficients mini-mize the value of M. Here obs and cal indicate the observed andcalculated value of g┴, respectively. The coefficients γ2 and ζ2 arecharacterized by the value M. The values of α2, η2, γ2, ζ2, K and Mare 0.28, 0.21, 0.97, 0.001, 0.38 and 16.047�10�4, respectively. Thevalue of α2 is equal to 1 for complete ionic s-bonding, but ifoverlap integral is too small that it can be neglected and α2¼0.5,the bond will be completely covalent. The smaller the value of α2,
Fig. 5. Room temperature absorption spectrum of Cu2þ doped LMD in thewavelength range 195–100 nm.
Fig. 6. The plot of orbital splitting with respect to ground state (Cu-ligandseparation¼2.3 Å and q¼6.3 e are taken).
Table 4Experimental and calculated energies together with Ds and Dt of d–dtransition band.
Transitionfrom groundstate dxy
Band position (cm�1) Tetrahedroncrystal field Ds(cm�1)
Tetrahedral cubicsplitting Dt(cm�1)Observed Calculated
dxy2dx2�y2 11,253 7998 4948 1653dxy2dxy,yz 15,770 15,815dxy2d3z2�r2 19,383 19,186
R. Kripal, S.D. Pandey / Physica B 444 (2014) 14–2018
the greater the covalent nature of bonding [33]. α2¼0.28 indicatesthat the s-bonding is completely covalent. The small value of α2
also indicates that the nature of bonding with the ligands alongthe axis is mostly ionic. The value of γ2 is 0.97, which is very nearto unity. This indicates that the out-of-plane covalent π-bonding isvery small. The Fermi contact parameter K, a measure of thepolarization produced by uneven distribution of the d-electrondensity of the inner core s-electrons, for 3d transition metal ion isapproximately 0.3 [34]. In the present study, K¼0.38. The value ofη2 is 0.21, which indicates that the ground state metal orbitalcontains 21% admixture of 4p state.
5. Theoretical g factors and defect structures
For dn ions in tetrahedral clusters, the one electron basisfunction |Ψγ4 (where γ¼t or e, the irreducible function of Tdgroup) in the two-SO parameter model can be expressed in termsof |dγ4 , |sγ4 , |πγ4 , Nγ and λβ as Eq. (1) of [35], where |dγ4 is thed orbital of dn ion. |sγ4 and |πγ4are the p orbital of the ligand.The molecular orbital (MO) coefficients Nγ (the normalizationcoefficients) and λβ (β¼s or π, the orbital mixing coefficients)are related by the normalization relationship [35,36]
Ne ¼ ½1þ3λ2πþ6λπSdpðπÞ��1=2
Nt ¼ ½1þλ2πþλ2sþ2λπSdpðπÞþ2λsSdpðsÞ��1=2 ð8Þ
and the approximate correlation
f e ¼N4e⌊1þ9λ2πS
2dpðπÞþ6λπSdpðπÞc
f t ¼N4t ⌊1þ2λπSdpðπÞþ2λsSdpðsÞþ2λsSdpðsÞλπSdpðπÞþλ2πS
2dpðπÞþλ2sS
2dpðsÞc ð9Þ
where fγE feE ft is a parameter concerning the covalence reduc-tion effect of the studied dn cluster. For dn ions fγ can be written asthe ratio of the Racah parameters in the crystal to that of free ion[35], i.e. B/B0 (or C/C0). fγ is treated as an adjustable parameterbecause of no Racah parameters for d1 and d9 ions [36]. Sdp(β) arethe group overlap integrals. Sdp(β) can be calculated from theSlater type self-consistent field (SCF) functions [37,38] and themetal ligand distance R. As the direction cosines of O(1)–O(3) bondmatch with those obtained for the principal axes of g-tensor ofCu2þ ion by EPR method, the copper ion sits in between O(1) andO(3) (coordinates of Cu2þ ion: (0.2100, 0.2862, 0.1001)). The gvalues are calculated for various distances of copper ion to theligand oxygen and at 2.3 Å a satisfactory result is obtained. ForR¼2.3 Å, the evaluated values of group overlap integrals for Cu2þ
doped LMD are SdpðsÞ¼0.1359 and SdpðπÞ¼0.0407,λπ ¼ �0:6982.We can derive higher order perturbation formulas (based on
two-SO parameter model) for g-factors of dn ions in tetragonallycompressed tetrahedron (rhombic distortion small as the differ-ence between the values of gx, gy and Ax, Ay is small) from the one-electron basis function and perturbation method [39,40] as
g== ¼ geþ8k0ξ0
E1�ðgeþkÞξ2
E22�4k0ξξ0
E1E2
g? ¼ geþ2kξE2
�2ξ02k�2ξξ0k0
E1E2þðgeξ2=2Þ�ξ2k
E22�2geξ
02
E21ð10Þ
The SO parameters ξ and ξ0 and orbital reduction factors k andk0 are given in terms of Nγ, λβ, ξ
0d and ξ0p by Eq. (4) of [36], where ge
is the free electron value.ξ0dE 829 cm�1 [39] and ξ0pE150 cm�1
[41] are the SO parameters of the free d9 ion and the free ligandion, respectively. The crystal field energy levels, E1 and E2 are givenby E1¼10Dq and E2¼�3Dsþ5Dt, respectively, whereas the tetra-gonal field parameters Ds and Dt are often calculated from
superposition model [42]. In accordance with superposition model
Ds¼ 47A2 ðRÞð3cos2θ�1Þ
Dt ¼ 421
A4 ðRÞð35cos4θ�30cos2θþ3þ7sin4θÞ ð11Þ
where Ak ðRÞ(k¼2, 4) are the intrinsic crystal field parameters.For dn ions in the crystals A2 ðRÞ=A4 ðRÞ ratio is found in the range of8�12 [35,36,43–45]. We have taken A2 ðRÞ=A4 ðRÞ � 12 here. Theparameter A4 ðRÞ can be expressed in terms of cubic field para-meter for dn tetrahedral clusters [41,46] as A4 ðRÞ ¼ �ð27=16ÞDq.The value of Dq is estimated using the expression given byOrtolano [47]. The value of Dq is obtained as 930 cm�1. θ is thesame as β as used in optical analysis, which is the deformationangle, the angle between the z-axis of the complex and copper-ligand vector. From the optical spectra of Cu2þ doped LMD crystal,θ¼801. The value of fγ is calculated getting the best fit to theexperimental g-factors. From the calculation of g-factors, we findfγ¼0.188 for Cu2þ doped LMD single crystal. The best fitted valuesof g-factors are g//¼2.18 and g? ¼2.00. The MO mixing coefficientsobtained from the value of fγ are λs¼�0.8603, Ne¼0.6606 andNt¼0.0589. The SO parameters ξ and ξ0 and orbital reductionfactors k and k0 are calculated. The estimated values of ξ, ξ0, k andk0 are 319 cm�1, 361 cm�1, 0.4566 and 0.5597, respectively.
For dn ions in crystals, the covalence of dn ions increases. Due toincrease in valence state of dn ions, the value of covalencereduction factor fγ decreases [48,49]. Here fγ¼0.188, which showsthat the covalence of Cu2þ ion in LMD single crystal increases. Alarge local structural perturbation can be expected because copperion enters the host lattice interstitially and also because there is amismatch in the charge of copper ion and lithium ion. The large θvalue is consistent with the expectation.
The g-factors g// and g? for copper ion in LMD crystal areexplained satisfactorily. From the expression of g// one can findthat signs of the third-order perturbation terms (third and fourthterm) are opposite to that of second-order perturbation term(second term). Generally the contribution due to the third-orderperturbation term is smaller than that of the second-orderperturbation term. But the energy level E2 depends upon thetetragonal field parameter and hence upon tetragonal distortion.The tetragonal distortion of tetragonal tetrahedron can be char-acterized by |θ�θ0|, where θ0E 54.71 is the value in cubictetrahedron. The small value of |θ�θ0| leads to smaller tetragonaldistortion than the value of energy level E2. From the calculationtetragonal distortion is 251, which results in large value of E2approximately 42,386 cm�1. Thus the contribution due to third-order perturbation term becomes smaller than the second-orderperturbation term to g//, which leads to large g// and small g? .
6. Conclusion
EPR study of Cu2þ doped lithium maleate dihydrate single(LMD) crystal at LNT and optical absorption study at roomtemperature have been carried out. Only one site of Cu2þ isobserved. The principal g and A values are evaluated from theEPR spectra fitted to rhombic symmetry spin Hamiltonian. Cu2þ
ion enters the lattice interstitially (coordinates of Cu2þ ion:(0.2100, 0.2862, and 0.1001)). The ground state wave function ofCu2þ in the lattice is obtained that contains about 21% admixtureof 4p state. The optical absorption has been explained well interms of D2d symmetry of the oxygen ligands in Cu2þ complex.The MO coefficients calculated for Cu2þ doped lithium maleatedihydrate single crystal show that the s-bonding is stronglycovalent while the bonding between Cu2þ ion and its axial ligandsis mostly ionic. The theoretical g values considering interstitial
R. Kripal, S.D. Pandey / Physica B 444 (2014) 14–20 19
doping of Cu2þ ion are in reasonable agreement with theexperimental ones.
Acknowledgment
The authors are thankful to the Head, Department of Physics,University of Allahabad for providing departmental facilities. Wealso thank the Sophisticated Analytical Instruments Facility (SAIF),IIT Mumbai, Powai, Mumbai, India for providing EPR spectrometerfacilities.
References
[1] E. Bozkurt, B. Karabulut, Spectrochim. Acta Part A 73 (2009) 871.[2] B. Karabulut, F. Duzgun, C. Keser, Z. Heren, Physica B 396 (2007) 8.[3] R. Bijik, R Tapramaz, B. Karabulut, Z. Naturforsch 58a (2003) 499.[4] R. Kripal, S. Misra, J. Phys. Chem. Solids 65 (2004) 939.[5] R. Kripal, S. Misra, I. Misra, Mol. Phys. 109 (2011) 239.[6] R. Kripal, M. Bajpai, Spectrochim. Acta Part A 72 (2009) 528.[7] W. Sano, E.D. Mauro, J. Phys. Chem. Solids 58 (1997) 391.[8] R. Tapramaz, B. Karabulut, F. Koksal, J. Phys. Chem. Solids 61 (2000) 1367.[9] R.J. Baldessarini, L. Tondo, P. Davis, M. Pompili, F.K. Goodwin, J. Hennen,
Bipolar Disord. 8 (2006) 625.[10] A.V. Yurkovetskii, V.L. Kofman, K.L. Makovetskii, Russ. Chem. Bull. 37 (2005)
1782.[11] R.P. Quirk, P.L. Cheng, Macromolecules 19 (1986) 1291.[12] F.G.A. Stone, R. West, Advances in Organometallic Chemistry, Academic Press,
London (1980) 55.[13] R.K. Bansal, Synthetic Approaches in Organic Chemistry, Jones and Bartlett
Publishers, London (1996) 192.[14] E. Wiberg, N. Wiberg, A. Frederick, Inorganic Chemistry, Academic Press,
London (2001) 1089.[15] W.G. Town, R.W.H. Small, Acta Cryst. B29 (1973) 1950.[16] C. Shiyamala, R. Venkatesan, P.S. Rao, Solid State Commun. 128 (2003) 137.[17] J.R. Pilbrow, Mol. Phys. 16 (1969) 307.
[18] S. Stoll, Spectral simulations in solid-state electron paramagnetic resonance(Ph. D. thesis), ETH, Zurich, 2003.
[19] S. Stoll, A. Schweiger, Chem. Phys. Lett. 380 (2003) 464.[20] S. Stoll, A. Schweiger, J. Magn. Reson. 178 (2006) 42.[21] C. Rudowicz, R. Bramley, J. Chem. Phys. 83 (1985) 5192.[22] D.S. Schonland, Proc. Phys. Soc. 73 (1958) 788.[23] S.K. Misra, M. Kahrizi, S.Z. Korczak, Physica B 182 (1992) 186.[24] S.K Misra, S. Subhramanian, J. Phys. C 15 (1982) 7199.[25] M. Sharnoff, J. Chem. Phys. 42 (1965) 3383.[26] G.F. Kokoszaka, C.W. Reimann, H.C. Allen, J. Phys. Chem. 71 (1967) 121.[27] R. Kripal, D.K. Singh, J. Phys. Chem. Solids 67 (2006) 2559;
W. Hayes, J.R. Pilbrow, L.M. Slifkin, J. Phys. Chem. Solids 25 (1964) 1417.[28] D.E. Billing, B.J. Hathaway, P. Nicholls, J. Chem. Soc. A (1970) 1877–1881;
B.J. Hathaway, D.E. Billing, Coord. Chem. Rev. 5 (1970) 143.[29] S.R. Desjardins, K.W. Penfield, S.L. Cohen, R.L. Musselman, E.I. Solomon, J. Am.
Chem. Soc. 105 (1983) 4590.[30] H.L. Schlafer, G. Gliemann, Basic Principles of Ligand Field Theory, Wiley,
London, 1969.[31] A. Abragam, B. Bleaney, Electron Paramagnetic Resonance of Transition Ions,
Clarendon Press, Oxford, 1970.[32] S.K Hoffmann, J Goslar, J. Solid State Chem. 44 (1982) 343.[33] B.R. McGarvey, in: R.L. Carlin (Ed.), Transition Metal Chemistry, Vol. 3, Marcel
Dekker, New York, 1966.[34] J.H. Van Vleck, Phys. Rev. 41 (1932) 208.[35] W.C. Zheng, L. He, Y. Mei, Philos. Mag. 89 (2009) 789.[36] W.L. Feng, W.C. Zheng, Int. J. Mod. Phys. B 23 (2009) 5325.[37] E. Clementi, D.L. Raimondi, J. Chem. Phys. 38 (1963) 2686.[38] E. Clementi, D.L. Raimondi, W.P. Reinhardt, J. Chem. Phys. 47 (1967) 1300.[39] J.S. Griffith, The Theory of Transition Metal Ions, Cambridge University Press,
London, 1964 (Appendix 6).[40] J.R. Pilbrow, Transition Ion Electron Paramagnetic Resonance, Clarendon Press,
Oxford, 1990.[41] M.L. Du, C. Rudowicz, Phys. Rev. B 46 (1992) 8974.[42] J. Newman, B. Ng, Rep. Prog. Phys. 52 (1989) 699.[43] C. Rudowicz, Y.Y. Zhou, J. Magn. Magn. Mater. 111 (1992) 153.[44] W. Fang, X.X. Wu, W.C. Zheng, J. Magn. Magn. Mater. 320 (2008) 2784.[45] C. Rudowicz, Z.Y. Yang, Y.Y. Yeung, J. Phys. Chem. Solids 64 (2003) 1419.[46] X.X. Wu, W.L. Feng, Q Zhou, W.C. Zheng, Z. Naturforsch. A 61 (2006) 505.[47] T.R. Ortolano, J. Selbin, S.P. Mcglynn, J. Chem. Phys. 41 (1964) 262.[48] A.B.P. Lever, Inorganic Electronic Spectroscopy, Elsevier, Amsterdam, 1984.[49] K.H. Karlsson, T. Perander, Chem. Scr. 3 (1973) 201.
R. Kripal, S.D. Pandey / Physica B 444 (2014) 14–2020