epoxidation of propene in a confined taylor flow (ctf
TRANSCRIPT

- 1 -
Manuscript for Chemical Engineering Research and Design
Epoxidation of Propene in a Confined Taylor Flow (CTF) Reactor
at Atmospheric Pressure
Sang Baek Shina,†,*
, Dae-Won Lee b, David Chadwick
a,*
a Department of Chemical Engineering, Imperial College London, London SW7 2AZ, United Kingdom
b Department of Chemical Engineering, Kangwon National University, 1 Kangwondaehak-gil,
Chuncheon-si, Gangwon-do 200-701, Republic of Korea
† Current Affiliation: Environmental Technologies Department, Technology Centre, Yara
International ASA, 3936 Porsgrunn, Norway
* Corresponding author 1 (Sang Baek Shin): Tel.: +47 4061 8565 ; Fax: +47 2415 8213 ; E-mail:
* Corresponding author 2 (David Chadwick): Tel.: +44 (0)20 7594 5579 ; Fax: +44 (0)20 7594
5637 ; E-mail: [email protected].

- 2 -
Abstract
Heterogeneous catalytic epoxidation of propene to propene oxide with hydrogen peroxide as oxidant was
investigated in a confined Taylor flow (CTF) reactor, a continuous monolith reactor, containing a long
alumina rod coated with titanium silicalite (TS-1) catalyst in the centre of the reactor column. The effect
of gas and liquid superficial velocity on the hydrodynamics of CTF reactor was also investigated under
Taylor flow regime at atmospheric pressure. The variation of hydrodynamics had a profound impact on
the production of propene oxide. When liquid superficial velocity was constant, the concentration of
propene oxide produced decreased with increasing gas superficial velocity as Taylor bubble length and
bubble rise velocity increase. However, when gas superficial velocity was constant, the concentration of
propene oxide produced had no linear dependency on liquid superficial velocity as Taylor bubble length
decreases but bubble rise velocity increases.
Keywords: propene oxide; hydrogen peroxide; titanium silicalite; epoxidation; confined Taylor flow
(CTF) reactor
- 3 -
Nomenclature
aC , 1C = constants [-]
aC = Capillary number ( )/ LTBL σUμ [-]
tD = tube diameter [m]
g = gravitational acceleration [m/s2]
dl = distance between infra-red detectors [m]
LSL = liquid slug length [m]
TBL = Taylor bubble length [m]
it = time for detector i [s]
LSU = liquid slug rise velocity [m/s]
mU = mean flow velocity ( GV + LV ) [m/s]
TBU = Taylor bubble rise velocity [m/s]
GV = gas superficial velocity [m/s]
LV = liquid superficial velocity [m/s]
Greek letters
= gas injection ratio ( GV /( GV + LV )) [-]
L = liquid viscosity [Pa s]
L = liquid surface tension [N/m]
- 4 -
1. Introduction
Propene oxide is one of the most important raw materials in the chemical industry. It is widely used
for manufacturing a variety of commercials and industrial products [1, 2]. Until recently, two different
types of commercial process were dominating for the production of propene oxide from propene: the
chlorohydrin process and the hydroperoxidation process. However, both of these processes employ
multiple reaction steps and have several essential disadvantages: a toxic oxidant and waste in the
chlorohydrin process and a large amount of co-products in the hydroperoxidation process. Therefore,
heterogeneously catalyzed oxidation of propene with ex situ and in situ produced hydrogen peroxide has
attracted much attention as a more environmentally benign and profitable chemical process [1-9].
Titanium silicalite (TS-1) catalyst has been extensively investigated for this route because it can promote
the formation of propene oxide with a high selectivity of greater than 95% and a high hydrogen peroxide
conversion since Clerici and co-workers first demonstrated that TS-1 can be used efficiently as a catalyst
for the epoxidation of various olefins using hydrogen peroxide in methanol under mild conditions [5-13].
The first commercial-scale propene oxide plant based on ex situ produced hydrogen peroxide recently
has started its operation [6]. However, there is still a need to develop a more efficient reactor concept
employing catalyst immobilization in order to remove the necessity for the separation of nano-scaled TS-
1 particles from its reaction liquid.
Catalytic gas-liquid-solid reactions are used extensively in the processes of chemical and
petrochemical industry. Several conventional types of reactor such as stirred tank slurry, slurry bubble
column and trickle-bed reactor have been employed for the catalytic multiphase reactions. Recently,
monolith reactors have attracted increasing interest as a promising alternative since the use of structured
packing, called “monolith”, is expected to overcome the disadvantages of conventional reactors [14-22].
A monolith consists of a bundle of narrow parallel channels in which catalyst materials are dispersed on
the inside walls. Due to the structure of monolith, low pressure drop and enhanced mass and heat transfer
efficiency can be achieved. Separation of catalyst from product chemicals is not needed and ease of scale-
up is also an advantage of monolith reactors.
Various flow patterns can be formed according to gas and liquid flow rates in a monolith channel [23,
24] and the performance of multiphase monolith reactors is greatly affected by these flow patterns. Due to
a high mass transfer rate between phases [19], special attention has been recently paid to slug flow or
Taylor flow regime, in which gas bubbles and liquid slugs move consecutively through the monolith
- 5 -
channel [25, 26]. Vaitsis et al. [27] suggested a novel design of a monolith reactor, the confined slug flow
(CSF) reactor, in which a rod was attached to the inside wall of the capillary (monolith channel). They
proved that it is possible to attain the slug flow regime with the reactor, claiming that it opens the
possibility of applying catalyst functions to the flow channels of monolith reactors.
In this study, a confined Taylor flow (CTF) reactor was evaluated for the catalytic epoxidation of
propene with hydrogen peroxide and TS-1 using methanol/water mixture as the solvent. Although the
structure of CTF reactor is fundamentally similar to that of CSF reactor, a rod coated with catalyst
materials is positioned in the centre of vertical reactor column. Therefore, when compared with the CSF
reactor, the contact area between the catalyst rod and the reactants in the liquid and gas phase is extended.
In addition to the advantages of conventional monolith reactor, the separated rod in CTF (and CSF)
reactor allows easier control of catalyst coating and profiling and endows the possibility of temperature
control. In particular, the feasibility of simple catalyst coating is a main advantage of CTF (and CSF)
reactor as finding an efficient and easy method to support catalyst materials on the monolith reactor wall
has been a challenge.
Most of the previous experiments of propene epoxidation have been conducted in autoclave reactors.
Some researchers evaluated the performance of propene epoxidation in gas-lift loop reactors, or
continuous flow fixed-bed reactors [3, 28-32]. The aim of this work is to apply a unique reactor concept,
CTF reactor, to the propene epoxidation. The hydrodynamics such as Taylor bubble length, bubble rise
velocity, liquid slug length and slug rise velocity with respect to gas and liquid flow rate was also
investigated under Taylor flow regime at atmospheric pressure. The CTF reactor basically showed stable,
high productivity and selectivity to propene oxide under mild conditions, although the variation of
hydrodynamics had a significant impact on the production of propene oxide. At the same liquid
superficial velocity, the production of propene oxide decreased with an increase of gas superficial
velocity as Taylor bubble length and bubble rise velocity increase. However, at the same gas superficial
velocity, the production of propene oxide had no linear dependency on liquid superficial velocity as
Taylor bubble length decreases but bubble rise velocity increases.
2. Material and Methods
2.1 Catalyst rod preparation

- 6 -
TS-1 catalyst was synthesized according to the method descried in the literature [10, 33, 34]. A
solution of 1.5 g of tetraethyl orthotitanate (Aldrich) was gradually added to 45 g of tetraethyl
orthosilicate (Merck) with magnetic stirring for 30 min. An aliquot of 100 g of 20 wt%
tetrapropylammonium hydroxide solution (Merck) was then gradually added to the mixed solution under
stirring for an additional 30 min. After keeping the mixture at 60 °C for 3 h, 56 g of deionized water was
added to the solution. The resulting solution was transferred to an autoclave in an oven and crystallized at
175 °C for 48 h without stirring. After cooling the solution to room temperature, the crystalline product
was separated by centrifugation, washed with deionized water, dried at 100 °C for 2 h and then finally
calcined at 550 °C for 5 h in an air-atmosphere furnace.
For the immobilization of TS-1 in the CTF reactor, catalyst materials had to be coated on the surface
of a 500 mm long extruded alumina rod (Multi-lab). However, it was impossible to properly coat the rod
using TS-1 particles only. Therefore, silica nanoparticles in the range of 10 – 50 nm were used to make a
stable coating of catalyst. The silica nanoparticles with smaller size help TS-1 particles with larger size
get stuck not only on the surface of rod but also on other TS-1 particles. The rod was dipped in a slurry of
20 wt% TS-1 and 15 wt% silica in deionized water. When the weight percent of silica in the slurry was
less than 15 wt%, the mechanical strength of coating decreased, on the other hand, when the weight
percent of silica was greater than 15 wt%, the chemical activity of coating was likely to decrease because
the active surface of TS-1 is covered by inert silica nanoparticles. To get a predetermined weight of
coating, drying and dipping were repeated.
2.2. Characterization
SEM images were taken on a Leo Gemini 1525 to inspect the morphology of TS-1 coating on the
surface of rod. Photographs of Taylor gas bubbles and liquid slugs formed in the CTF reactor were taken
using an Olympus high speed camera (i-SPEED 3).
2.3. Epoxidation of propene
The CTF reactor consisted of a 500 mm vertical transparent polycarbonate tubing with temperature
control (Fig. 1). The inner diameter of the circular column was 8 mm and the outer diameter of the rod
was 4 mm, which can be represented by a hydraulic diameter of 4 mm or an equivalent diameter of 6.93

- 7 -
mm. The rod coated with TS-1 catalyst was positioned axis-symmetrically in a narrow channel of the
reactor.
Fig. 1
In the CTF reactor where gas and liquid flow simultaneously, it is important to adopt an appropriate
flow configuration and a hydrodynamic flow regime because these significantly affect the reactor
performance. There are four different flow configurations possible: co-current downward gas and liquid
flow, co-current upward gas and liquid flow, counter-current upward gas flow and downward liquid flow,
and counter-current downward gas flow and upward liquid flow. Besides, for co-current upward gas and
liquid flow in vertical tubes, various flow patterns can be formed according to relative flow rates of gas
and liquid phase: bubble flow, Taylor (slug) flow, churn flow and annular flow, which will be discussed
later in detail. However, the hydrodynamics experiments conducted in the CTF reactor used in this study
showed that the co-current upward gas and liquid flow was the only flow configuration giving stable
Taylor flow over a wide range of gas and liquid flow rates [35]. In other flow configurations, it was found
to be difficult to obtain proper sustained flow directions of each gas and liquid and to achieve accurate
flow control to make stable Taylor flow for sufficient period of time, due to the nature of the experimental
setup, buoyancy of the gas, surface tension and density of the liquid, and so on. Hence, the reactor was
operated under Taylor flow regime at atmospheric pressure with co-current upward flow of gas (10%
C3H6 in N2) and liquid (H2O2 0.35 wt%, CH3OH 50 wt%, H2O 49.65 wt%), giving a hydrogen peroxide
concentration of 0.1 mol/kg and a methanol content of 50 wt%. Both gas and liquid flow enter via bottom
of the column and their gas and liquid superficial velocity conditions are listed in Table 1.

- 8 -
Table 1.
Case VG [m/s] VL [m/s] ε
1 0.036 0.022 0.62
2 0.071 0.022 0.76
3 0.142 0.022 0.87
4 0.036 0.044 0.45
5 0.071 0.044 0.62
6 0.142 0.044 0.76
7 0.036 0.088 0.29
8 0.071 0.088 0.45
9 0.142 0.088 0.62
The CTF reactor was operated in a semi-batch mode where the gas flow passed once through the
reactor column and was discharged from the system, but the liquid flow was repeatedly recycled
throughout experiment. An in-house infra-red detection unit connected with a data logger (TracerDaq)
and computer system, built by Electronics Workshop of Chemical Engineering Department at Imperial
College London, was attached on the top part of reactor column to collect the data for hydrodynamic
characterization. The detectors are usually 2 cm apart. Therefore, a time delay is made between the
signals from the first and second detectors and it was utilized for the analysis of hydrodynamic properties
of Taylor bubbles and liquid slugs. The reaction products were sampled at regular time intervals via a
liquid sample point located at the outlet of the reactor column.
At atmospheric pressure, the gas and liquid flow rates were controlled by mass flow controllers
(Brooks) and a double-headed peristaltic pump (Masterflex), respectively. The peristaltic pump gave a
stable liquid flow over a wide range of flow rates.
The concentrations of hydrogen peroxide were determined by iodometric titration. Liquid samples
were analyzed on a gas chromatograph (Shimadzu GC-2014) equipped with a flame ionization detector
and a capillary column (30 m × 0.32 mm) with nitroterephthalic acid-modified polyethylene glycol (0.25
μm) as the stationary phase. Propene oxide was the main product; propene glycol and propene glycol
monomethyl ether were the byproducts. The selectivity of all byproducts always remained lower than 5%.
3. Results and discussion
3.1. Catalyst characterization

- 9 -
The results of various analyses of TS-1 catalyst showed good agreement with the data indicated in the
original patent [34] and were presented in our previous papers [33, 36]. The BET analysis gave a specific
surface area of 421 m2/g and a pore volume of 0.255 cm
3/g, which are comparable to the values reported
in the literature [4, 12, 33]. Fig. 2 demonstrates that an even distribution of TS-1 particles on the surface
of rod was achieved through the dip-coating method. The size of TS-1 is in the range of 200 – 300 nm.
The coating layer was found to be sufficiently stable to endure the operating conditions of CTF reactor
under Taylor flow regime. Less than 1 wt% of original weight of TS-1 catalyst coating was lost at normal
operating conditions that are indicated as case 5 in Table 1, for 5 h.
Fig. 2
3.2. Hydrodynamics of CTF reactor at atmospheric pressure
For operating conditions for the test of CTF reactor performance for the propene epoxidation at
atmospheric pressure, nine cases were selected with a variation in gas and liquid superficial velocity as
shown in Table 1. To achieve Taylor flow regime in capillary tubes, the gas injection ratio (ε), linked with
the transition of flow patterns, should be in the range of 0.2 – 0.9 [37]. Similarly, in this study, a stable
Taylor flow was obtained over a gas injection ratio range of 0.29 – 0.87 in the capillary annulus. The
capillary number (Ca) for the system used in this study ranges from 2.2 × 10⁻³
to 5.4 × 10⁻³
. All
hydrodynamic data was collected and analyzed at these conditions.
For two-phase co-current upward flow in vertical tubes (d > 1 cm), four types of flow regime are
formed as the gas flow rate in the tube increases: bubble flow, slug flow, churn flow and annular flow
[38]. In slug flow, dispersed gas bubbles coalesce to form large bubbles with diameters approaching that
- 10 -
of the tube. The phases separate into bullet shaped gas bubbles and liquid slugs containing entrained gas
bubbles. In capillaries (d < 4 mm), the two-phase flow follows a similar flow pattern but there are no
smaller bubbles dispersed in the liquid slugs. This is designated as Taylor flow.
The cross-section and the schematic representation of a Taylor gas bubble rising through the
concentric annulus of CTF reactor are shown in Fig. 1. The elliptic gas bubbles are radially asymmetric
and hence never occupy the whole cross-sectional area and rise faster than in the corresponding circular
tube [39]. As the gas bubbles rise through the vertical annulus, liquid moves downward in thin films
between the bubble and the tube wall or the rod surface, which increase the efficiency of mass transfer
between the phases.
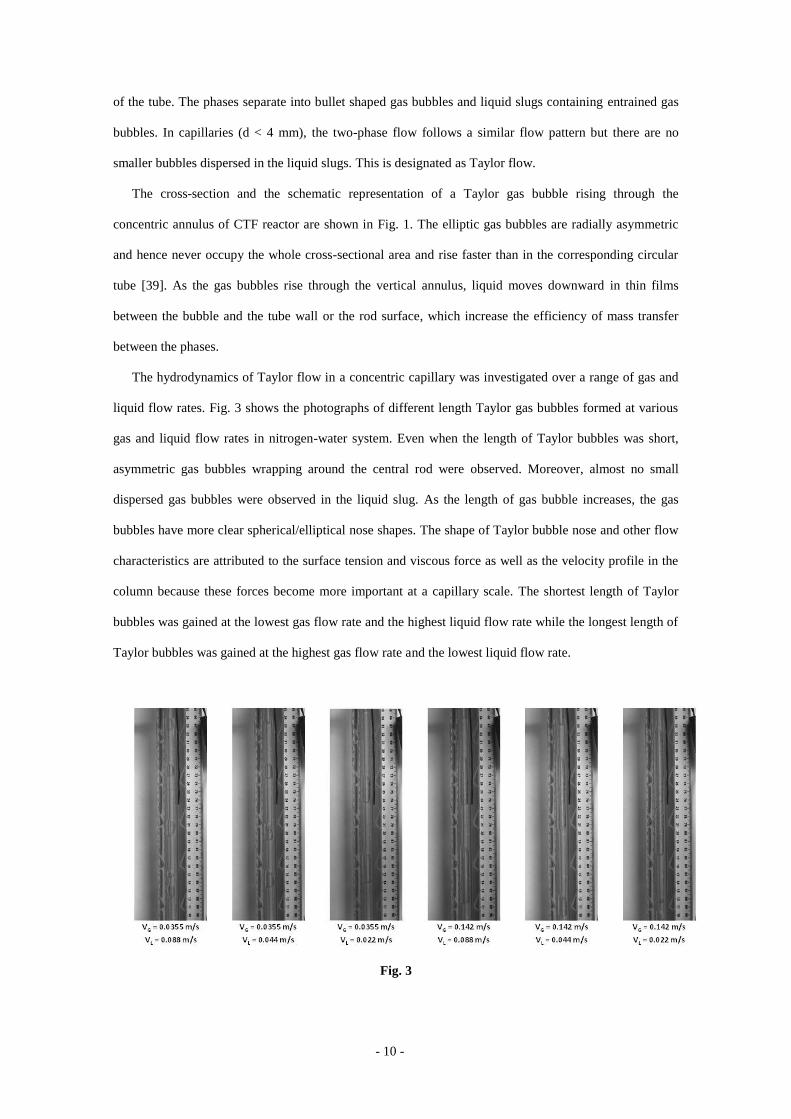
The hydrodynamics of Taylor flow in a concentric capillary was investigated over a range of gas and
liquid flow rates. Fig. 3 shows the photographs of different length Taylor gas bubbles formed at various
gas and liquid flow rates in nitrogen-water system. Even when the length of Taylor bubbles was short,
asymmetric gas bubbles wrapping around the central rod were observed. Moreover, almost no small
dispersed gas bubbles were observed in the liquid slug. As the length of gas bubble increases, the gas
bubbles have more clear spherical/elliptical nose shapes. The shape of Taylor bubble nose and other flow
characteristics are attributed to the surface tension and viscous force as well as the velocity profile in the
column because these forces become more important at a capillary scale. The shortest length of Taylor
bubbles was gained at the lowest gas flow rate and the highest liquid flow rate while the longest length of
Taylor bubbles was gained at the highest gas flow rate and the lowest liquid flow rate.
Fig. 3

- 11 -
The data from the two infra-red detectors mounted on the upper part of the CTF reactor column is
shown in Fig. 4.
Fig. 4
The plot shows the sudden changes in signal level when the Taylor bubbles pass consecutively two
detectors. The time delay between the signals from detector 1 and detector 2 is because of the relative
position along the column. Hydrodynamic parameters such as Taylor bubble length (LTB), bubble rise
velocity (UTB), liquid slug length (LLS) and slug rise velocity (ULS) can be calculated using the distance
between detectors and the time difference between the detection of gas-liquid interface by each detector.
For example, the bubble rise velocity and the Taylor bubble length can be expressed by the following
equations, respectively.
2det,11det,2
=tt
lU
d
TB - (Eq. 1)
)(= 1det,21det,3 ttUL TBTB - (Eq. 2)
where 1det,2t and
2det,1t are times of the moment when a liquid slug is replaced by a Taylor bubble at
each detector and 1det,3t is a time of the moment when a Taylor bubble is replaced by a liquid slug at
detector 1. A similar process can be carried out to calculate the liquid slug length and the liquid slug rise
velocity.
In upward slug flow, there is a widely used relationship between mean flow velocity (Um) and Taylor
bubble rise velocity through a flowing liquid in a large diameter tube [27].

- 12 -
tmoTB gDCUCU 1+= (Eq. 3)
where Co and C1 are constants. Co is known as a function of Eötvös number containing fluid density,
surface tension and tube diameter. This relationship can be seen in Fig. 5 and given by equation (4).
Indeed, Taylor bubbles rise with a higher velocity than the mean flow velocity.
083.0+29.1= mTB UU (Eq. 4)
This equation gives Co = 1.29 and C1 = 0.42 when the hydraulic diameter of annulus (the difference
between outer and inner tube diameters of an annulus) is used instead of tube diameter (Dt) in equation
(3). A positive value was obtained for C1 due to buoyancy forces acting on the Taylor bubbles in the same
direction of flow. These values gained at a capillary annulus are very similar to Co = 1.29 and C1 = 0.35
for a 5.1 cm diameter tube proposed by Fernandes et al. [40]. An implication of this is the possibility that
the relationship is applicable to the small diameter annulus (Dt = 8 mm) under Taylor flow regime,
regardless of existence of rod.
Similarly, in Fig. 5, a linear relationship between a mean flow velocity and liquid slug rise velocity
can be suggested by the following equation.
077.0+79.1= mLS UU (Eq. 5)
Fig. 5
Generally, therefore, it can be said that both the bubble rise velocity and the liquid slug rise velocity
increase when one of gas or liquid superficial velocity increases.
0.00 0.05 0.10 0.15 0.20 0.25
0.0
0.1
0.2
0.3
0.4
0.5
y = 1.79x + 0.077
R2 = 0.85
Taylor bubble rise velocity (UTB
)
Liquid slug rise velocity (ULS
)
UT
B o
r U
TS [
m/s
]
Um [m/s]
y = 1.29x + 0.083
R2 = 0.98
- 13 -
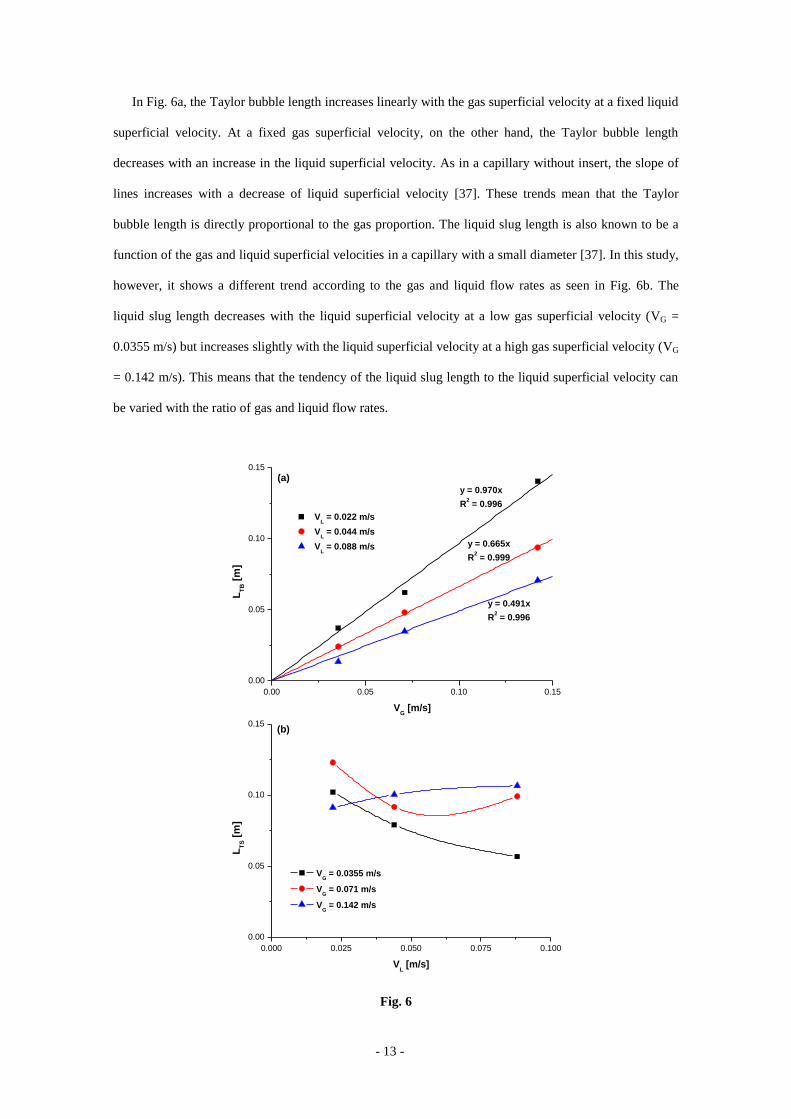
In Fig. 6a, the Taylor bubble length increases linearly with the gas superficial velocity at a fixed liquid
superficial velocity. At a fixed gas superficial velocity, on the other hand, the Taylor bubble length
decreases with an increase in the liquid superficial velocity. As in a capillary without insert, the slope of
lines increases with a decrease of liquid superficial velocity [37]. These trends mean that the Taylor
bubble length is directly proportional to the gas proportion. The liquid slug length is also known to be a
function of the gas and liquid superficial velocities in a capillary with a small diameter [37]. In this study,
however, it shows a different trend according to the gas and liquid flow rates as seen in Fig. 6b. The
liquid slug length decreases with the liquid superficial velocity at a low gas superficial velocity (VG =
0.0355 m/s) but increases slightly with the liquid superficial velocity at a high gas superficial velocity (VG
= 0.142 m/s). This means that the tendency of the liquid slug length to the liquid superficial velocity can
be varied with the ratio of gas and liquid flow rates.
Fig. 6
0.00 0.05 0.10 0.15
0.00
0.05
0.10
0.15
(a)
y = 0.491x
R2 = 0.996
y = 0.665x
R2 = 0.999
y = 0.970x
R2 = 0.996
VL = 0.022 m/s
VL = 0.044 m/s
VL = 0.088 m/s
LT
B [
m]
VG [m/s]
0.000 0.025 0.050 0.075 0.100
0.00
0.05
0.10
0.15
VG = 0.0355 m/s
VG = 0.071 m/s
VG = 0.142 m/s
LT
S [
m]
VL [m/s]
(b)

- 14 -
Fig. 7 shows the histograms of the Taylor bubble length and the bubble rise velocity at the lowest and
highest gas superficial velocities at VL = 0.044 m/s. The histograms show a relatively higher spread of
data from the mean Taylor bubble length or the bubble rise velocity as the gas superficial velocity
increases. This result is most likely due to the increase in turbulence of flow at a higher gas superficial
velocity.
Fig. 7
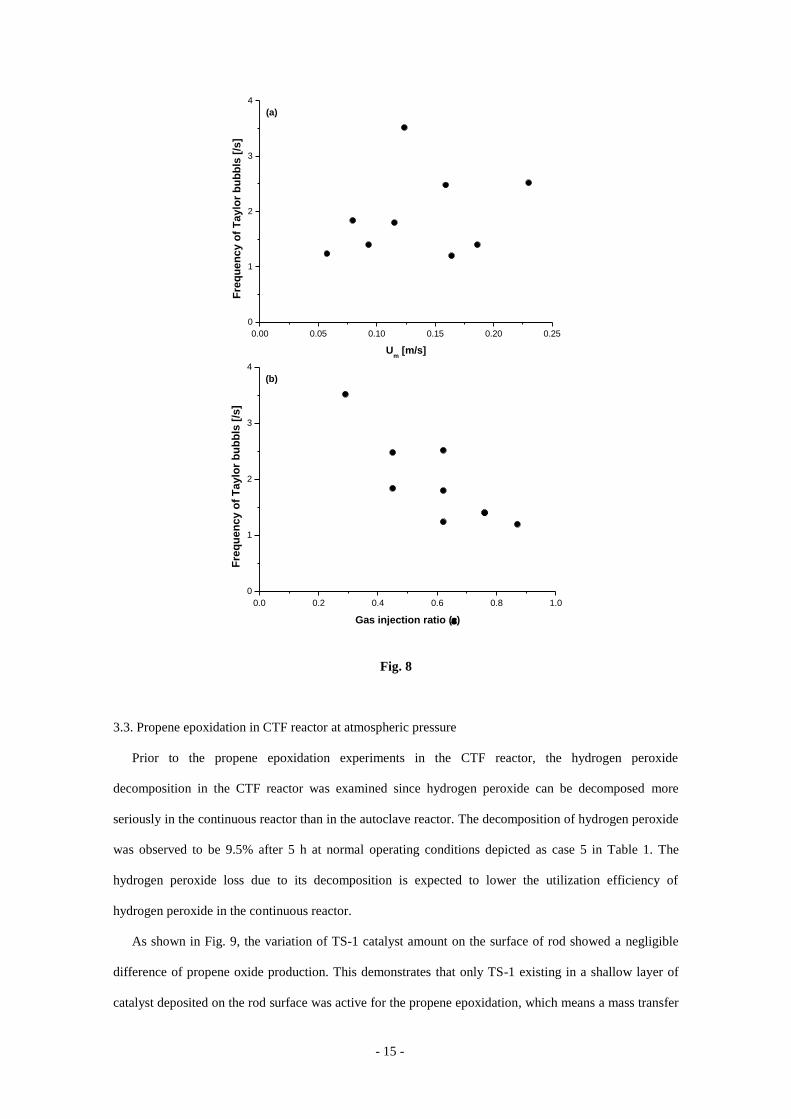
The number of Taylor bubbles was counted over a time period of 25 seconds in the infra-red detector
output and plotted against mean flow velocity and gas injection ratio in Fig. 8. The Taylor bubble
frequency shows a weak increasing trend with respect to mean flow velocity while it is a clear decreasing
function of gas injection ratio. Similarly, Laborie et al. [37] reported that Taylor bubble frequency is a
linear function of Reynolds number based on mean flow velocity.
0.005 0.010 0.015 0.020 0.025 0.030 0.035 0.040
0
2
4
6
8
10
12
14
16
(a)
Mean = 0.0241
Std. Dev. = 0.0062
Co
un
t
LTB
[m]
0.14 0.16 0.18 0.20 0.22 0.24 0.26 0.28
0
5
10
15
20
25
30
35
Co
un
t
UTB
[m/s]
(b)
Mean = 0.183
Std. Dev. = 0.023
0.02 0.04 0.06 0.08 0.10 0.12 0.14 0.16
0
2
4
6
8
10
12
14 (c)
Mean = 0.0938
Std. Dev. = 0.0298
Co
un
t
LTB
[m]
0.0 0.1 0.2 0.3 0.4
0
2
4
6
8
10
12
14
Co
un
t
UTB
[m/s]
(d)
Mean = 0.323
Std. Dev. = 0.067
- 15 -
Fig. 8
3.3. Propene epoxidation in CTF reactor at atmospheric pressure
Prior to the propene epoxidation experiments in the CTF reactor, the hydrogen peroxide
decomposition in the CTF reactor was examined since hydrogen peroxide can be decomposed more
seriously in the continuous reactor than in the autoclave reactor. The decomposition of hydrogen peroxide
was observed to be 9.5% after 5 h at normal operating conditions depicted as case 5 in Table 1. The
hydrogen peroxide loss due to its decomposition is expected to lower the utilization efficiency of
hydrogen peroxide in the continuous reactor.
As shown in Fig. 9, the variation of TS-1 catalyst amount on the surface of rod showed a negligible
difference of propene oxide production. This demonstrates that only TS-1 existing in a shallow layer of
catalyst deposited on the rod surface was active for the propene epoxidation, which means a mass transfer
0.00 0.05 0.10 0.15 0.20 0.25
0
1
2
3
4
Fre
qu
en
cy
of
Ta
ylo
r b
ub
bls
[/s
]
Um [m/s]
(a)
0.0 0.2 0.4 0.6 0.8 1.0
0
1
2
3
4
(b)
Fre
qu
en
cy
of
Ta
ylo
r b
ub
bls
[/s
]
Gas injection ratio ()

- 16 -
limitation through the catalyst coating layer. 2.0 g/m of TS-1 coating was selected for further experiments
to provide a proper thickness and an even distribution of catalyst materials on the whole surface of
alumina rod.
Fig. 9
Fig. 10 shows the effect of propene concentration change in the feed on the propene production. As
expected, the production rate of propene oxide was directly proportional to the feed concentration of
propene. 10% propene was determined as a feed concentration for further experiments.
Fig. 10
0 1 2 3 4 5
0.0000
0.0004
0.0008
0.0012
0.0016
0.0020
PO
co
nc
en
tra
tio
n [
mo
l/k
g]
Time [h]
1.0 g/m
2.0 g/m
3.0 g/m
0 1 2 3 4 5
0.000
0.002
0.004
0.006
PO
co
nc
en
tra
tio
n [
mo
l/k
g]
Time [h]
10%
20%
30%

- 17 -
The influence of gas and liquid superficial velocity on the propene production rate is shown in Fig.
11a. Basically, the production rate of propene oxide was found to decrease with mean flow velocity in Fig.
11b. The selectivity to propene oxide was maintained over 95% for 5 h in all cases.
Fig. 11
The productivity of propene oxide was found to be in the range of 0.005 – 0.012 gPO/(gcat∙h) that is
much lower than 1 gPO/(gcat∙h) mentioned as an industrially relevant target [41, 42]. The low productivity
per amount of catalyst is mainly due to the rather thick catalyst layer coated by 1g of TS-1 on 50 cm long
(short) and 4 mm diameter (thin) rod and the very mild conditions employed in the present study such as
low reactant concentrations, short residence time of gas and liquid flow and atmospheric operating
0.00 0.05 0.10 0.15 0.20 0.25
0.000
0.001
0.002
0.003
(b)
PO
co
nc
en
tra
tio
n a
fte
r 5
h [
mo
l/k
g]
Um [m/s]

- 18 -
pressure Therefore, the catalyst rod preparation and operating conditions can be adjusted to achieve the
industrial target in future studies.
In Fig. 11a, the concentration of propene oxide after 5 h was the lowest under the operating conditions
of case 3 and the highest under the operating conditions of case 7. The utilization efficiency of hydrogen
peroxide after 5 h was found in the range of 6.3% (case 3) – 13.3% (case 7) and there was a strong
positive linear dependency between the utilization efficiency of hydrogen peroxide and the production
rate of propene oxide. The utilization efficiency of hydrogen peroxide is thought to be largely damaged
by the decomposition of hydrogen peroxide. Due to the fact that hydrogen peroxide is one of the powerful
oxidizing agents but still relatively expensive, and therefore the applicability of hydrogen peroxide to
propene epoxidation highly depends on the utilization efficiency of hydrogen peroxide, minimizing the
decomposition of hydrogen peroxide is thought of as one of key factors in optimizing the reactor
operating conditions.
The Taylor bubble length and the bubble rise velocity are linked with active surface area and
residence time for the multiphase reactions, respectively. Therefore, the reaction rate is expected to be
higher when Taylor bubble length is shorter and bubble rise velocity is lower, resulting in higher surface
area and longer residence time. When the liquid superficial velocity was constant, the propene oxide
concentration produced decreased with an increase in the gas superficial velocity as the Taylor bubble
length and bubble rise velocity simultaneously increased (Fig. 12a). However, when the gas superficial
velocity was constant, the propene oxide concentration produced had no linear dependency on the liquid
superficial velocity as the Taylor bubble length decreased but the bubble rise velocity increased (Fig. 12b).
0.00 0.02 0.04 0.06 0.08 0.10 0.12 0.14
0.000
0.001
0.002
0.003
PO
co
nc
en
tra
tio
n a
fte
r 5
h [
mo
l/k
g]
LTB
[m]
VL = 0.022 m/s
VL = 0.044 m/s
VL = 0.088 m/s
(a)

- 19 -
Fig. 12
4. Conclusions
The hydrodynamic parameters such as Taylor bubble length, bubble rise velocity, liquid slug length
and slug rise velocity according to the variation of gas and liquid superficial velocity were investigated in
a confined Taylor flow reactor. The Taylor bubble length increased with the gas superficial velocity at a
fixed liquid superficial velocity, whereas it decreased with the liquid superficial velocity at a fixed gas
superficial velocity. The high spread of hydrodynamic data was attributed to the increase of flow
turbulence level determined by operating conditions.
Overall, the CTF reactor showed stable performances with high productivity and selectivity to
generate propene oxide under mild conditions (40 °C, 1 atm). However, the variation of hydrodynamics
had a significant impact on the production of propene oxide. At the same liquid superficial velocity, the
production of propene oxide decreased with an increase of gas superficial velocity as Taylor bubble
length and bubble rise velocity increased, though there was no linear dependency between the production
rate of propene oxide and liquid superficial velocity at the same gas superficial velocity as Taylor bubble
length decreased but bubble rise velocity increased.
Acknowledgement
Financial support by EPSRC (UK) is gratefully acknowledged. The authors would like to thank Dr
Colin Hale at Imperial College London for the help with high speed photography and Dr A. J. Fergusson-
0.00 0.02 0.04 0.06 0.08 0.10 0.12 0.14
0.000
0.001
0.002
0.003
(b)
PO
co
nc
en
tra
tio
n a
fte
r 5
h [
mo
l/k
g]
LTB
[m]
VG = 0.0355 m/s
VG = 0.071 m/s
VG = 0.142 m/s
- 20 -
Reeves for the preceding research at Imperial College London related to the Confined Taylor Flow
reactor.
References
[1] Nijhuis T.A., Makkee M., Moulijn J.A., Weckhuysen B.M., 2006. The Production of Propene
Oxide: Catalytic Processes and Recent Developments, Ind. Eng. Chem. Res. 45, 3447-3459.
[2] Cheng W.G., Wang X.S., Li G., Guo X.W., Zhang S.J., 2008. Highly efficient epoxidation of
propylene to propylene oxide over TS-1 using urea plus hydrogen peroxide as oxidizing agent, J.
Catal. 255, 343-346.
[3] Liu X.W., Wang X.S., Guo X.W., Li G., Yan H.S., 2004. Regeneration of Lamina TS-1 catalyst in
the epoxidation of propylene with hydrogen peroxide, Catal. Lett. 97, 223-229.
[4] Wang Q.F., Wang L., Chen J.X., Wu W., Mi Z.T., 2007. Deactivation and regeneration of titanium
silicalite catalyst for epoxidation of propylene, J. Mol. Catal. A: Chem. 273, 73-80.
[5] Cavani F., Catalytic selective oxidation: The forefront in the challenge for a more sustainable
chemical industry, 2010. Catal. Today 157, 8-15
[6] Russo V., Tesser R., Santacesaria E., Di Serio M., Chemical and Technical Aspects of Propene
Oxide Production via Hydrogen Peroxide (HPPO Process), 2013. Ind. Eng. Chem. Res. 52, 1168-
1178.
[7] Russo V., Tesser R., Santacesaria E., Di Serio M., Kinetics of propene oxide production via
hydrogen peroxide with TS-1, 2014. Ind. Eng. Chem. Res. 53, 6274-6287.
[8] Puértolas B., Hill A.K., García T., Solsona B., Torrente-Murciano L., 2015. In-situ synthesis of
hydrogen peroxide in tandem with selective oxidation reactions: A mini-review, Catal. Today 248,
115-217.
[9] Lin M.,. Xia C, Zhu B., Li H., Shu X., 2016. Green and efficient epoxidation of propylene with
hydrogen peroxide (HPPO process) catalyzed by hollow TS-1 zeolite: A 1.0 kt/a pilot-scale study,
Chem. Eng. J. 295, 370-375
[10] Clerici M.G., Bellussi G., Romano U., Synthesis of propylene oxide from propylene and hydrogen
peroxide catalyzed by titanium silicalite, 1991. J. Catal. 129, 159-167.
[11] Thiele G.F., Roland E., 1997. Propylene epoxidation with hydrogen peroxide and titanium
silicalite catalyst: Activity, deactivation and regeneration of the catalyst, J. Mol. Catal. A: Chem.
117, 351-356.

- 21 -
[12] Chen L.Y., Chuah G.K., Jaenicke S., 1998. Propylene epoxidation with hydrogen peroxide
catalyzed by molecular sieves containing framework titanium, J. Mol. Catal. A: Chem. 132, 281-
292.
[13] Laufer W., Meiers R., Holderich W., 1999. Propylene epoxidation with hydrogen peroxide over
palladium containing titanium silicalite, J. Mol. Catal. A: Chem. 141, 215-221.
[14] Guo X.W., Wang X.S., Liu M., Li G., Chen Y.Y., Xiu J.H., Zhuang J.Q., Zhang W.P., Bao X.H.,
2002. Epoxidation of propylene with dilute H2O2 over Titanium Silicalite containing trace
aluminum, Catal. Lett. 81, 125-130.
[15] Li G., Meng J.W., Wang X.S., Guo X.W., 2004. Effect of solvents on propene epoxidation
catalyzed by titanium silicalite, React. Kinet. Catal. Lett. 82, 73-80.
[16] Clerici M.G., 2006. TS-1 and Propylene oxide, 20 years later, Oil Gas Euro. Mag. 32, 77-82.
[17] Nijhuis T.A., Kreutzer M.T., Romijn A.C.J., Kapteijn F., Moulijn J.A., 2001. Monolithic catalysts
as efficient three-phase reactors, Chem. Eng. Sci. 56, 823-829.
[18] Williams J.L., Monolith structures, materials, properties and uses, 2001. Catal. Today 69, 3-9.
[19] Pangarkar K., Schildhauer T.J., van Ommen J.R., Nijenhuis J., Kapteijn F., Moulijn J.A., 2008.
Structured packings for multiphase catalytic reactors, Ind. Eng. Chem. Res. 47, 3720-3751.
[20] Kashid M.N., Kiwi-Minsker L., 2009. Microstructured Reactors for Multiphase Reactions: State of
the Art, Ind. Eng. Chem. Res.48, 6464-6485.
[21] Yue H., Zhao Y., Zhao L., Lv J., Wang S., Gong J., Ma X., 2012. Hydrogenation of dimethyl
oxalate to ethylene glycol on a Cu/SiO2/cordierite monolithic catalyst: Enhanced internal mass
transfer and stability, AIChE J. 58, 2798-2809.
[22] Gascon J., van Ommen J.R., Moulijn J.A., Kapteijn F., Structuring catalyst and reactor – an
inviting avenue to process intensification, 2015. Catal. Sci. Technol. 5, 807-817.
[23] Kelessidis V.C., Dukler A.E., 1989. Modeling flow pattern transitions for upward gas-liquid flow
in vertical concentric and eccentric annuli, Int. J. Multiphase Flow 15, 173-191.
[24] Heiszwolf J.J., Kreutzer M.T., van den Eijnden M.G., Kapteijn F., Moulijn J.A., 2001. Gas–liquid
mass transfer of aqueous Taylor flow in monoliths, Catal. Today 69, 51-55.
[25] Morgado A.O., Miranda J.M., Araújo J.D.P., Campos J.B.L.M., 2016. Review on vertical gas–
liquid slug flow, Int. J. Multiphase Flow 85, 348-368.
[26] Haase S., Murzin D.Y., Salmi T., 2016. Review on hydrodynamics and mass transfer in
minichannel wall reactors with gas–liquid Taylor flow, Chem. Eng. Res. Des. 113, 304.
[27] E. Vaitsis, D. Chadwick, E. Alpay, Slug Flow Hydrodynamics in the Presence of Catalyst Rods,
Chem. Eng. Res. Des. 82 (2004) 653-658.
- 22 -
[28] Li G., Wang X.S., Yan H.S., Liu Y.H., Liu X.W., 2002. Epoxidation of propylene using
supported titanium silicalite catalysts, Appl. Catal. A: Gen. 236, 1-7.
[29] Serrano D.P., Sanz R., Pizarro P., Moreno I., de Frutos P., Blazquez S., 2009. Preparation of
extruded catalysts based on TS-1 zeolite for their application in propylene epoxidation, Catal.
Today 143, 151-157.
[30] Huang J., Takeia T., Akita T., Ohashi H., Haruta M., 2010. Gold clusters supported on alkaline
treated TS-1 for highly efficient propene epoxidation with O2 and H2, Appl. Catal. B: Env. 95,
430-438.
[31] Zuo Y., Wang M., Song W., Wang X., Guo X., 2012. Characterization and catalytic performance
of deactivated and regenerated TS-1 extrudates in a pilot plant of propene epoxidation, Ind. Eng.
Chem. Res. 51, 10586-10594.
[32] Wu G., Wang Y., Wang L., Feng W., Shi H., Lin Y., Zhang T., Jin X., Wang S., Wu X., Yao P.,
2013. Epoxidation of propylene with H2O2 catalyzed by supported TS-1 catalyst in a fixed-bed
reactor: Experiments and kinetics, Chem. Eng. J. 215-216, 306-314
[33] Shin S.B., Chadwick D., 2010. Kinetics of Heterogeneous catalytic epoxidation of propene with
hydrogen peroxide over titanium silicalite (TS-1), Ind. Eng. Chem. Res. 49, 8125-8134.
[34] Taramasso M., Perego G., Notari B., 1983. Preparation of porous crystalline synthetic material
comprised of silicon and titanium oxides, U.S. 4,410,501.
[35] Fergusson-Rees A. J.. 2008. Generation of hydrogen peroxide directly and in situ for green
selective oxidation, PhD thesis, Imperial College London, London.
[36] Shin S.B., Lee D.-W., Chadwick D., 2016. The effects of impregnation of precious metals on the
catalytic activity of titanium silicate (TS-1) in epoxidation of propene using hydrogen peroxide, J.
Mol. Catal. A: Chem. 423, 478-488.
[37] Laborie S., Cabassud C., Durand-Bourlier L., Laine J.M., 1999. Characterisation of gas–liquid
two-phase flow inside capillaries, Chem. Eng. Sci. 54, 5723-5735.
[38] Hewitt G.F., Hall-Taylor N.S., 1970. Annular Two-phase Flow, Pergamon, Oxford.
[39] Kelessidis V.C., Dukler A.E., 1990. Motion of large gas bubbles through liquids in vertical
concentric and eccentric annuli, Int. J. Multiphase Flow 16, 375-390.
[40] Fernandes R.C., Semiat R., Dukler A.E., 1983. Hydrodynamic model for gas-liquid slug flow in
vertical tubes, AlChE J. 29, 981-989.
[41] Klemm E., Dietzsch E., Schwarz T., Kruppa T., De Oliveira A.L., Becker F., Markowz G.,
Schirrmeister S., Schütte R., Caspary K.J., Schüth F., Hönicke D., 2008. Direct gas-phase
epoxidation of propene with hydrogen peroxide on TS-1 zeolite in a microstructured reactor,
Ind.Eng. Chem. Res. 47, 2086–2090.

- 23 -
[42] Truter L.A., Perez Ferrandez D.M., Schouten J.C., Nijhuis T.A., 2015. TS-1 coated microreactor
for selective oxidations, Appl. Catal. A: Gen. 490, 139–145.
Table Caption
Table 1. Gas superficial velocities (VG) and liquid superficial velocities (VL) for operating conditions of
CTF reactor.
Figure Caption
Fig. 1. Schematic representation of confined Taylor flow (CTF) reactor.
Fig. 2. SEM micrograph of TS-1 coated on the surface of alumina rod.
Fig. 3. Photographs of Taylor gas bubbles at various gas superficial velocities (VG) and liquid superficial
velocities (VL) in nitrogen-water system in CTF reactor.
Fig. 4. Infra-red detector output with time
Fig. 5. Taylor bubble rise velocity (UTB) and liquid slug rise velocity (ULS) vs. mean flow velocity (Um).
Fig. 6. (a) Taylor bubble length (LTB) vs. gas superficial velocity (VG) at liquid superficial velocities (VL)
and (b) Liquid slug length (LLS) vs. liquid superficial velocity (VL) at gas superficial velocities (VG).
Fig. 7. Histogram for Taylor bubble length (LTB) and bubble rise velocity (UTB) in nitrogen-water system:
(a) and (b) VG = 0.0355 m/s, VL = 0.044 m/s, (c) and (d) VG = 0.142 m/s, VL = 0.044 m/s.
Fig. 8. Influence of (a) mean flow velocity (Um) and (b) gas injection ratio (ε) on the frequency of Taylor
bubbles.
Fig. 9. Effect of catalyst loading on propene oxide production. Reaction conditions: 40 °C, atmospheric
pressure, 0.5 – 1.5 g (1.0 – 3.0 g/m) TS-1 coating, co-current upward & semi-batch operation, VG 0.071
m/s (10% C3H6), VL 0.044 m/s (H2O2 0.35 wt%, CH3OH 50 wt%, H2O 49.65 wt%).
Fig. 10. Effect of propene feed concentration on propene oxide production. Reaction conditions: 40 °C,
atmospheric pressure, 1.0 g (2.0 g/m) TS-1 coating, co-current upward & semi-batch operation, VG 0.071
m/s (10 – 30% C3H6), VL 0.044 m/s (H2O2 0.35 wt%, CH3OH 50 wt%, H2O 49.65 wt%).
Fig. 11. Influence of (a) gas superficial velocity (VG), liquid superficial velocity (VL) and (b) mean flow
velocity (Um) on propene oxide production.
Fig. 12. Influence of Taylor bubble length (LTB) on propene oxide production.