epoc 2013 european powers of construction - deloitte · 43 bellway plc united kingdom jul 13 1,337...
TRANSCRIPT

EPoC 2013European Powers of Construction
June 2014

EPoC is an annual publication produced by Deloitte and distributed free of charge
DirectorJavier Parada, partner in charge of the Infrastructure Industry, Spain
Coordinated byMargarita VelascoAlberto Benito BenitoMartín Alurralde Serra
Published byCIBS
ContactInfrastructure Department, Deloitte MadridPlaza Pablo Ruiz Picasso, S/NTorre Picasso 28020 Madrid, Spain
Phone + 34 91 514 50 00Fax + 34 91 514 51 80
June 2014

Contents4 Introduction
5 Ranking of listed European construction companies
6 Top 50 EPoC – ranking by sales
7 Top 20 EPoC – ranking by market capitalisation
8 Outlook for the construction industry in the EU
12 Top 20 EPoC strategies: internationalisation and diversification
16 EPoC 2013 financial performance
26 Internationalisation: Business opportunities
32 Diversification of the EPoC 2013
35 Financing of EPoC 2013
37 Internationalisation: Profitability & Cash Flows
39 Performance of non-European construction companies
43 Top 20 EPoC – Company profiles

4
Introduction
Welcome to the eleventh edition of European Powers of Construction, our annual publication in which we identify the major listed European construction groups. This publication examines the market position and performance of the main players of the industry in terms of revenue, market capitalisation, internationalisation, diversification, indebtedness and other financial ratios.
The European construction industry has been significantly affected by the recession. However, after five years of continuous contraction, the European Commission predicts the sector will see a return to moderate growth in 2014, and a full recovery may not be far off. Meanwhile, a number of developed economies continue to invest heavily in renewing and adapting their aging infrastructure to the latest quality, efficiency and sustainability standards. As a result, European construction groups are expanding their businesses both in terms of geographical locations and also their scope of capabilities.
In this year’s EPoC, the main new developments have to do with the aforementioned internationalisation process with a new section covering a financial analysis. In addition, we have provided a brief description of the main non-European competitors that our EPoC could meet in the international market place.
As in previous years, we have included a section analysing EPoC financial performance. Despite a 2.1% decrease in aggregate sales, major companies’ market capitalisation grew by 29.7% in 2013.
We have retained the section on company profiles, which focuses on the top 20 listed European construction companies. For these selected companies, we present key data regarding ownership structure, main activities and divisions, international presence, goals and strategic objectives, as well as selected financial data from the groups’ 2013 financial statements, compared to 2012 and 2011. Please note that prior years' data corresponds in all cases to the audited financial statements of the relevant year, since we are not taking into account subsequent restatements. In addition, we have converted financial data of companies with functional currency other than the Euro into Euros, using the exchange rate prevailing at year end for balance sheet data, and the average exchange rate for the year for income statement data.
We hope that you find our EPoC 2013 analysis of the construction sector of interest, and that the information presented here helps you to understand and assess the challenges and opportunities of this sector. As usual, we welcome your ideas and suggestions about any of the topics covered.
European Powers of Construction 2013 examines the status of the major listed European construction groups and their position in terms of revenue, market capitalisation, internationalisation, diversification, indebtedness and other financial ratios.

EPoC 2013 European powers of construction 5
Ranking of listed European construction companies
Country Number of companies
Total sales 2013 (€m)
Variation 2013 Vs 2012
Total market capitalisation
2013 (€m)
Variation 2013 vs 2012
France 4 100,996 1.8% 45,190 30.9% Spain 6 66,621 (7.3%) 27,332 26.9% United Kingdom 13 40,444 (3.0%) 24,392 46.4% Germany 3 35,512 0.4% 8,853 25.2% Sweden 4 28,898 2.3% 11,746 28.4% Austria 2 15,170 (0.8%) 2,730 9.0% Netherlands 3 10,364 (5.9%) 1,376 31.5% Finland 2 3,961 (43.2%) 1,603 (25.8%) Italy 3 6,119 4.5% 3,182 43.0% Turkey 1 4,930 10.2% 6,464 2.6% Portugal 2 3,944 7.1% 1,254 175.6% Norway 1 2,790 5.1% 780 (2.5%) Poland 2 1,695 (30.4%) 857 43.7% Switzerland 1 2,483 11.0% 979 60.3% Belgium 1 2,267 19.4% 848 47.7% Denmark 1 987 (24.6%) 102 134.4% Greece 1 1,242 0.7% 563 65.6%Total 50 328,423 (2.1%) 138,251 29.7%
The ranking of the Top 50 EPoC 2013 by sales volume is once again led by Vinci. ACS and Bouygues maintain their second and third places and there were no changes in the top six positions in 2013. Among the Top 10, Balfour Beatty Plc lost two positions while Colas and Strabag gained one position each.
France dominates the ranking in terms of total sales, with four companies listed within the Top 10. These French construction groups increased their total sales by 2% thanks to the growth achieved by Vinci and Eiffage.
Spain has the largest presence in the Top 20 with five companies. Total sales of Spanish EPoC decreased by 7% to €66,621 million.
The United Kingdom has the largest number of companies in the Top 50 with 13 medium-sized groups, including a number of dedicated house builders.
Total sales of EPoC 2013 decreased by 2.1% to €328,423 million compared to 2012. Among the Top 20, Vinci
increased its revenues by €1,704 million while FCC saw its sales fall by 40% mainly due to the deconsolidation of its Austrian subsidiary Alpine.
EPoC’s total market capitalisation grew by around 30% in 2013. French, UK and Spanish groups increased their total market value by 31%, 46% and 27%, respectively. As a percentage, the highest growth in market capitalisation of the European groups corresponds to UK groups (46%) continuing the trend initiated in 2012 when market value of these groups increased by 48%. Overall, the better outlook of the European economy contributed to the good performance of our EPoC in the stock markets.
In line with the approach adopted in the prior year, our 2013 ranking includes all the main listed companies, regardless of whether any of them are in turn controlled by another company included in our ranking. Therefore, HOCHTIEF (controlled by ACS), Colas (controlled by Bouygues), CFE (controlled by Vinci) and Budimex (controlled by Ferrovial) are included in the 2013 ranking.
Source: Bloomberg. Deloitte analysis

6
FY 2013
Rank, Company CountryFY END
Sales 2013 (€ m)
% Variation 2013 vs
2012
EBIT 2013 (€ m)
Market Capitalisation
2013 (€ m)
Ranking 2013 vs
2012
1 VINCI SA France Dec 13 40,338 4% 3,767 28,704 =
3 ACTIV. DE CONSTR. Y SERV. SA (ACS) Spain Dec 13 38,373 (0%) 1,644 7,873 =
3 BOUYGUES SA France Dec 13 33,345 (1%) 1,344 8,727 =
4 HOCHTIEF AG Germany Dec 13 25,693 1% 859 4,779 =
5 SKANSKA AB Sweden Dec 13 15,776 6% 642 6,228 =
6 EIFFAGE SA France Dec 13 14,264 2% 1,318 3,743 =
7 COLAS SA France Dec 13 13,049 0% 406 4,017 � 1
8 STRABAG SE Austria Dec 13 12,476 (4%) 262 2,430 � 1
9 BALFOUR BEATTY PLC United Kingdom Dec 13 11,914 (11%) 57 2,371 � 2
10 BILFINGER SE Germany Dec 13 8,415 (1%) 287 3,752 � 1
11 FERROVIAL SA Spain Dec 13 8,166 6% 827 10,317 � 1
12 KONINKLIJKE BAM GROEP NV Netherlands Dec 13 7,042 (5%) 16 1,019 � 1
13 FOMENTO DE CONSTR. Y CONTRATAS SA (FCC) Spain Dec 13 6,727 (40%) (303) 2,059 � 3
14 NCC AB Sweden Dec 13 6,684 2% 310 2,568 � 1
15 ACCIONA SA Spain Dec 13 6,607 (6%) (1,771) 2,391 � 1
16 PEAB AB Sweden Dec 13 4,981 (7%) 71 1,315 � 1
17 ENKA INSAAT VE SANAYI AS Turkey Dec 13 4,930 10% 703 6,464 � 2
18 CARILLION PLC United Kingdom Dec 13 4,804 (12%) 252 1,706 � 2
19 OBRASCON HUARTE LAIN SA (OHL) Spain Dec 13 3,684 (9%) 1,031 2,937 � 1
20 BARRATT DEVELOPMENTS PLC United Kingdom Jun 13 3,159 15% 306 4,119 � 4
21 SACYR VALLEHERMOSO SA Spain Dec 13 3,065 (15%) 90 1,755 =
22 INTERSERVE PLC United Kingdom Dec 13 3,040 4% 102 964 =
23 VEIDEKKE ASA Norway Dec 13 2,790 5% 89 780 � 2
24 TAYLOR WIMPEY PLC United Kingdom Dec 13 2,703 9% 418 4,328 � 3
25 PORR GROUP Austria Dec 13 2,694 16% 88 300 � 5
26 ASTALDI SPA Italy Dec 13 2,520 3% 236 753 � 2
27 IMPLENIA AG Switzerland Dec 13 2,483 11% 93 979 � 7
28 MORGAN SINDALL PLC United Kingdom Dec 13 2,467 (2%) 40 400 � 2
29 PERSIMMON PLC United Kingdom Dec 13 2,456 16% 401 4.524 � 6
30 KIER GROUP PLC United Kingdom Jun 13 2,404 (13%) 60 1,215 � 7
31 IMPREGILO SPA Italy Dec 13 2,323 2% 158 1,987 =
32 MOTA ENGIL SGPS SA Portugal Dec 13 2,314 3% 243 885 � 1
33 CFE SA Belgium Dec 13 2,267 19% 67 848 � 3
34 LEMMINKAINEN OYJ Finland Dec 13 2,218 (2%) (91) 299 � 2
35 HEIJMANS NV Netherlands Dec 13 2,054 (11%) 13 252 � 6
36 GALLIFORD TRY PLC United Kingdom Jun 13 1,779 (0%) 97 1,148 � 1
37 YIT OYJ Finland Dec 13 1,743 (63%) 104 1,304 � 19
38 KELLER GROUP PLC United Kingdom Dec 13 1,693 4% 66 978 =
39 TEIXEIRA DUARTE ENGENHARIA E CONSTRUÇOES SA Portugal Dec 13 1,630 13% 143 369 � 2
40 INTERIOR SERVICES GROUP PLC United Kingdom Jun 13 1,557 3% 4 124 � 1
41 JM AB Sweden Dec 13 1,457 2% 176 1,635 � 1
42 BAUER AKTIENGESELLSCHAFT Germany Dec 13 1,404 4% 32 322 � 1
43 BELLWAY PLC United Kingdom Jul 13 1,337 11% 182 2,293 � 4
44 TREVI GROUP Italy Dec 13 1,276 14% 80 442 � 5
45 BALLAST NEDAM NV Netherlands Dec 13 1,268 (2%) (30) 105 =
46 ELLAKTOR SA Greece Dec 13 1,242 1% 76 563 =
47 BUDIMEX SA Poland Dec 13 1,132 (22%) 79 811 � 7
48 COSTAIN GROUP PLC United Kingdom Dec 13 1,130 (2%) 22 222 =
49 MT HOJGAARD Denmark Dec 13 987 (25%) 22 102 � 5
50 POLIMEX MOSTOSTAL SA Poland Dec 13 563 (43%) (41) 46 =
Top 50 EPoC – ranking by sales

EPoC 2013 European powers of construction 7
Rank. Company CountryMarket
Capitalisation (€ m) 2013
Variation 2013 vs 2012
Ranking change on
2012
1 VINCI SA FRANCE 28,704 38% =
2 FERROVIAL SA SPAIN 10,317 25% =
3 BOUYGUES SA FRANCE 8,727 24% =
4 ACTIV. DE CONSTR. Y SERV. SA (ACS) SPAIN 7,873 31% � 1
5 ENKA INSAAT VE SANAYI AS TURKEY 6,464 3% � 1
6 SKANSKA AB SWEDEN 6,228 19% =
7 HOCHTIEF AG GERMANY 4,779 41% � 1
8 PERSIMMON PLC UNITED KINGDOM 4,524 52% � 3
9 TAYLOR WIMPEY PLC UNITED KINGDOM 4,328 66% � 4
10 BARRATT DEVELOPMENTS PLC UNITED KINGDOM 4,119 66% � 4
11 COLAS SA FRANCE 4,017 5% � 4
12 BILFINGER SE GERMANY 3,752 12% � 3
13 EIFFAGE SA FRANCE 3,743 28% � 1
14 OBRASCON HUARTE LAIN SA (OHL) SPAIN 2,937 34% � 3
15 NCC AB SWEDEN 2,568 49% � 4
16 STRABAG SE AUSTRIA 2,430 4% � 1
17 ACCIONA SA SPAIN 2,391 -26% � 7
18 BALFOUR BEATTY PLC UNITED KINGDOM 2,371 3% � 2
19 BELLWAY PLC UNITED KINGDOM 2,293 49% � 2
20 FOMENTO DE CONSTR. Y CONTRATAS SA (FCC) SPAIN 2,059 73% � 3
Top 20 EPoC – ranking by market capitalisation
In 2013 the market capitalisation of most of our EPoC grew significantly. Total aggregate market capitalisation of the EPoC increased by 30%, compared to Euro Stoxx 50 Index growth of 18% in 2013. Vinci, Ferrovial and ACS achieved the highest increases in absolute terms, while FCC, Barratt and Taylor Wimpey attained the most significant growth in percentage terms. Nevertheless among our Top 20 EPoC, just eight groups recorded higher market values than those reached during pre-crisis periods. As of December 2013, total market capitalisation for the Top 20 EPoC is 26% lower than in 2007.
At 31 December 2013, Vinci had strengthened its position as the European construction leader in terms of market value, increasing the gap with its closest rival, Ferrovial. Total market capitalisation for French EPoC increased by 31%, compared to 18% growth in the CAC 40 Index.
Among the Spanish construction groups, noteworthy is the consolidation of Ferrovial in the second position of our ranking. ACS and OHL jumped one and three positions, respectively, while FCC increased its market value by 73% compared to 2012. Acciona is the only Top 20 EPoC
that saw its market capitalisation decrease in 2013 due mainly to its exposure to the Spanish energy sector and the uncertainties surrounding it in 2013. Total aggregate market value for the Spanish EPoC increased by 27% in 2013, similar to the 21% growth of the IBEX 35 index.
The UK groups maintained high growth rates in terms of market capitalisation. Excluding Balfour Beatty, these groups climbed two or even more positions in our ranking. Persimmon Plc, Taylor Wimpey Plc and Barratt Development Plc increased their market value by more than 50%, compared to 14% growth in the FTSE 100 index.
Among other countries, it should be noted that HOCHTIEF increased its market value by 41% to €4,779 million while NCC jumped four positions due to a 49% increase in its market capitalisation.
Compared to the previous edition of EPoC, Yit and Carillion dropped out of our Top 20 ranking by market capitalisation, replaced by Bellway Plc and FCC.
Source: Bloomberg

8
Outlook for the construction industry in the EU
A characteristic of construction activity is that it is particularly cyclical, as it is influenced by business and consumer confidence, interest rates and government programmes.
Business and consumer confidence started to decline in 2008 and now, after falling for a few years, construction investment is projected to return to growth in 2014 and to accelerate further in 2015. However, the main impediments to growth stemming from the crisis (high debt, financial fragmentation, uncertainty and difficult adjustment) are only slowly receding and the European economy is projected to grow at just a moderate pace.
Source: Eurostat
Production index in the construction sector
2010 = 100
Euro area, seasonally adjusted series EU28, seasonally adjusted series
130
125
120
115
110
105
100
95
90
85
01-2
005
04-2
005
07-2
005
10-2
005
01-2
006
04-2
006
07-2
006
10-2
006
01-2
007
04-2
007
07-2
007
10-2
007
01-2
008
04-2
008
07-2
008
10-2
008
01-2
009
04-2
009
07-2
009
10-2
009
01-2
010
04-2
010
07-2
010
10-2
010
01-2
011
04-2
011
07-2
011
10-2
011
01-2
012
04-2
012
07-2
012
10-2
012
01-2
013
04-2
013
07-2
013
10-2
013
01-2
014
Construction investment is projected to return to growth in 2014 and to accelerate further in 2015
From 2010 to 2013, when the deficit-cutting policies implemented by the governments were especially severe, construction investment in the European Union decreased by 3.1% in 2010, grew by 0.4% in 2011, and decreased by 4.0% and 3.5% in 2012 and 2013. For the coming years, according to the European Commission, it is forecast to expand by 1.7% and 2.8% in 2014 and 2015, respectively.
In 2013, the construction sector in peripheral countries such as Greece, Spain, Cyprus and Portugal continued to be particularly affected by the economic recession. Construction investment fell in these countries by more than 10% in the year. Conversely, Lithuania and Hungary achieved the highest growth rates among the EU-27, driven in part by significant local public investment. Finally, economic giants such as Germany, France and the United Kingdom did not see an increase in construction investment in 2013.

EPoC 2013 European powers of construction 9
5-year averages Winter 2014 forecast
1995-99 2000-04 2005-09 2010 2011 2012 2013 2014 2015
Belgium 1.1 0.5 1.4 6.0 3.9 (2.4) (2.9) 0.7 1.8
Germany (1.1) (3.9) (0.5) 3.2 7.8 (1.4) (0.3) 3.6 2.8
Estonia - 14.2 (2.1) (3.0) 3.8 10.5 (2.9) (2.9) 2.9
Ireland 14.1 6.6 (5.7) (29.6) (15.6) (4.1) (1.4) 8.9 2.5
Greece 5.0 4.1 (3.0) (19.2) (21.0) (22.7) (13.5) 2.4 9.9
Spain 4.7 6.2 (1.7) (9.9) (10.8) (9.7) (10.0) (4.1) (1.9)
France 0.9 2.7 0.9 (3.2) 1.4 (0.8) (2.5) (0.8) 1.5
Italy 1.1 4.0 (1.9) (4.5) (3.7) (6.4) (6.8) (1.4) 1.8
Cyprus - 5.5 3.4 (4.8) (7.9) (20.3) (24.9) (13.8) 1.4
Latvia - 0 0 0 0 0 0 0 0
Luxembourg 5.6 5.8 1.9 (10.0) 4.0 (6.1) 0.6 2.3 2.4
Malta - - (2.9) 0.6 (8.7) (4.7) - - -
Netherlands 3.1 (0.9) 1.2 (11.9) 4.9 (7.6) (4.7) 5.5 2.5
Austria 0.1 0.2 (1.3) (3.9) 2.5 2.5 0.2 1.9 2.2
Portugal 7.3 (1.5) (3.6) (4.2) (11.5) (18.1) (13.6) (2.2) 0.9
Slovenia 9.3 1.6 1.6 (20.5) (18.5) (6.5) (3.7) (3.4) 0.2
Slovakia - (1.7) 5.3 (7.7) 7.4 (8.5) (6.9) 2.0 3.4
Finland 8.3 2.9 (0.4) 7.2 4.9 (5.2) (3.6) (1.2) 1.6
Euro area 1.2 1.2 (0.7) (4.1) (0.3) (4.2) (3.9) 0.6 1.8
Bulgaria - 12.2 17.8 (21.6) (22.2) (6.2) (1.0) 2.4 3.4
Czech Republic 1.9 1.3 1.8 (0.1) (5.0) (5.3) (7.5) 0.3 1.7
Denmark 5.6 1.5 (2.7) (7.1) 9.6 (5.4) (1.6) 4.5 1.1
Croatia - 0 0 - 0 0 0 0 0
Lithuania - 5.0 0.8 (7.4) 14.3 (4.0) 4.1 5.0 5.0
Hungary - 6.0 (1.7) (13.7) (13.3) (9.1) 4.3 5.6 4.2
Poland - (1.6) 8.8 2.2 7.8 (1.0) (2.7) 3.9 5.4
Romania 0.8 8.1 9.7 11.3 (4.3) 3.5 (3.4) 3.6 4.6
Sweden (0.1) 4.0 1.1 4.5 3.5 0.7 0.7 4.0 5.5
United Kingdom 4.7 1.4 (1.4) 2.2 3.6 (4.0) (2.8) 6.5 7.1
EU 1.7 1.3 (0.4) (3.1) 0.4 (4.0) (3.5) 1.7 2.8
USA 4.4 2.2 (6.6) (7.4) (1.6) 7.7 3.8 4.6 7.7
Japan (3.4) (3.5) (4.5) (3.1) (0.1) - - - -
• In the European Union, only the United Kingdom is expected to achieve higher growth rates than the United States. Construction investment in the United Kingdom will grow by 6.5% in 2014 and 7.1% in 2015 according to the European Commission while in the United States it is forecast to expand by 4.6 % and 7.7%, respectively.
Source: European Commission.
An analysis of forecast EU construction investment for 2014 - 2015 highlights the following:
• Despite the negative growth rates noted in previous years, recovery is expected to start in 2014 and continue in 2015. Forecast growth rates are higher among the EU-27 than in the Euro area mainly due to the good outlook in countries such as the United Kingdom and Sweden where some of our EPoC are well established.
Investment in construction, volume (percentage change on preceding year, 1995-2015)

10
Construction Investment/GDP 2013
Ireland
Greece
Portugal
Denmark
Sweden
United Kingdom
Netherlands
Slovakia
Hungary
Italy
Luxembourg
Germany
Spain
Czech Republic
Belgium
Austria
Poland
France
Finland
Romania 13.3%
12.6%
12.0%
11.4%
11.3%
10.8%
10.5%
10.0%
9.9%
9.6%
9.1%
8.8%
8.6%
8.6%
8.4%
8.2%
8.1%
8.1%
6.0%
5.4%
Source: Ameco
Source: Ameco, February 2014
Source: Ameco
Construction Investment (€bn)
0
50
100
150
200
250
300 M
alta
Cyp
rus
Est
onia
Lat
via
Slo
veni
a
Lith
uani
a
Bul
garia
Lux
embo
urg
Slo
vaki
a
Irel
and
Hun
gary
Gre
ece
Por
tuga
l
Cze
ch R
epub
lic
Rom
ania
Den
mar
k
Fin
land
Sw
eden
Aus
tria
Bel
gium
Pol
and
Net
herla
nds
Spa
in
Ital
y
Uni
ted
King
dom
Fra
nce
Ger
man
y
270
2013
247
160141
102
5244 41 35 34 25 20 19 16 13 11 9 9 6 4 4 3 3 2 2 1 1
2012 2011
• In the EU-27, eight countries are expected to see negative growth rates in 2014. However, the outlook for 2015 is quite different as only Spain is expecting a reduction in investment in construction.
Total construction investment in the European Union in 2013, 2012 and 2011 amounted to €1.27 trillion, €1.33 trillion and € 1.34 trillion, respectively, indicating that European construction has fallen below levels last seen in the mid-1990s.
As in 2012, the three largest construction markets in Europe are Germany, France and the United Kingdom. Additionally, the Top 5, which also includes Italy and Spain, represented 72% of total construction investment in the European Union in 2013. In the aforementioned markets, construction investment represents between 8% and 12% of total GDP. Construction investment in smaller countries such as Finland or Romania is significantly lower but in relative terms it represents more than 12.5% of total GDP. Through the analysis of

EPoC 2013 European powers of construction 11
Source: * International Monetary Fund ** Ameco
the construction investment / GDP ratios and GDP per capita, there seems to be a direct correlation between both figures. Those countries that recorded construction investment / GDP ratios above 9% obtained an average GDP per capita of €30,455, 12% higher than the GDP per capita recorded by countries with lower construction investment ratios.
ROM
GRE
FRA
FIN
HUN
AUS
NL
POL
ITA
LUX
IRL
GER
CZ POR
SWE
UK
DEN
SPA
SVK
BLG
0
10,000
20,000
30,000
40,000
50,000
60,000
70,000
80,000
0% 2% 4% 6% 8% 10% 12% 14%
GD
P PE
R C
API
TA (€
)*
Construction Investment/ GDP %**

12
Top 20 EPoC strategies: internationalisation and diversification
As in previous editions of this report, we have identified four main categories within the Top 20 EPoC, based on the varying levels of internationalisation and diversification across the group. Here we examine the performance in 2013 across each of these four categories:
Domestic construction groupsThe four companies in this category are focused on construction projects in their domestic markets.
In line with previous years, Vinci and Bouygues achieved more than 60% of total sales in France and around 80% of total revenue from construction activities. These French groups are included in our Top 3 on the basis of both sales volume and market value, demonstrating that it is possible to achieve and consolidate a strong position mainly by doing business locally.
Peab, which is considered in our ranking to be the third largest Swedish listed construction group in terms of total sales, has not significantly modified its diversification strategy or its international presence since 2010. Peab has moved out of an expansion phase that was coupled with acquisitions and investments in recent years. In 2013, over 80% of its total revenue was generated from local construction projects.
The UK group Barratt Developments Plc, which jumped into the Top 20 listed European construction companies in 2013, is well-known as one of the largest housebuilders in the United Kingdom. Almost 100% of its total revenue is generated through construction activities in the UK.
International construction groupsThis category is made up of construction groups that generate more than 40% of their total revenue outside of their domestic markets.
ACS has been considered an “international construction group” since the acquisition of HOCHTIEF in June 2011, and is one of the most widely diversified groups in this category. In 2013, non-construction activities represented almost 25% of its total revenue. Cross-border activities are mainly carried out in Europe,
America and the Asia-Pacific region and represent 86% of its total sales
HOCHTIEF, which is part of the ACS Group, as mentioned above, is once again the company with the largest international presence among the Top 20 listed European construction groups. The German group obtained more than 90% of its total sales abroad thanks to the strong position of its Australian subsidiary, Leighton Group, as well as the good performance of its American subsidiaries Turner, Flatiron, E.E. Cruz and Clark Builders.
Skanska has reduced its international presence in relative terms as a consequence of the strong performance in its local market. Nevertheless, international sales represented 75% of its total income obtained in 2013. Its non-construction activities such as real estate or industrial and services activities are not representative enough for Skanska to fall within the “international conglomerate” category.
Colas, which is also part of the Bouygues Group, obtains 43% of its total sales abroad. Construction activities represent more than 80% of total income and it is the only French group included in the Top 20 that has not increased the importance of its construction activities in relative terms comparing 2013 and 2012 figures.
The relatively small size of the local markets and fierce competition has in previous years boosted the internationalisation strategies adopted by certain companies such as the Austrian Strabag, the Swedish NCC and the Dutch BAM Groep. In 2013, all of these companies obtained almost 40% of their total income abroad while non-construction activities represented less than 10% of total revenue.
Lastly, OHL, which was classified in 2012 as an “international conglomerate”, has been reclassified into the “international construction groups” category in 2013. Among other factors, the divestment in 2012 of part of OHL’s concession division has negatively impacted on the company’s level of diversification. OHL continues to obtain almost 75% of its total sales abroad, with a strong presence in markets such as the US and Mexico.

EPoC 2013 European powers of construction 13
Domestic conglomerates“Domestic conglomerates” are formed by groups with different divisions focused on local markets.
In 2013, Carillion increased both its internationalisation and diversification. The contraction of business in the local market has increased the importance of its international activities in relative terms. In addition, Carillion has strengthened its diversification strategy in 2013 through the acquisition of John Laing Integrated Services.
Despite the decrease noted in the revenue obtained by its energy division plus the growth achieved through construction activities, the Turkish Enka continues to be the most diversified group among the Top 20 listed European construction companies in 2013. In comparison to 2012, Enka has increased its level of internationalisation by 9% due to strong performance in markets such as Russia, Kazakhstan, Iraq and Gabon.
In line with other French groups such as Bouygues and Vinci, Eiffage is focused on the domestic market and in 2013 the company obtained almost 85% of its total revenue in France. Since 2010, the Group's diversification and internationalisation have remained unchanged. Eiffage is considered to be a “domestic conglomerate” due to the strong position of its concessions and energy divisions.
International conglomeratesThe “International conglomerates” category encompasses groups with highly diversified portfolios and a strong international presence.
Among other factors, Acciona is considered to be an “international conglomerate” as a result of the international presence of its energy division. Revenue from cross-border activities has increased significantly since 2010. In 2013, the decrease in construction activities in the local market has increased the importance of its non-construction business. In 2013 and
VINCI
OHL
ACS
BAM SKANSKA
NCC HOCHTIEF
FERROVIAL
BILFINGER
BARRATT
BALFOUR BEATTY
COLAS
CARILLION
PEAB
ACCIONA
ENKA
STRABAG
FCC
EIFFAGE
0%
10%
20%
30%
40%
50%
60%
70%
80%
90%
100%
0% 10% 20% 30% 40% 50% 60% 70% 80% 90% 100%
Non
-con
stru
ctio
n re
venu
es /
tot
al r
even
ues
International revenues / Total revenues %
"Domestic"Conglomerates
InternationalConglomerates
"Domestic"Construction Groups
InternationalConstruction Groups
BOUYGUES
Source: Deloitte analysis

14
2012, revenue from construction projects represented 41% and 48% of total income.
In 2013, the Spanish group Ferrovial has strengthened its position as an “international conglomerate” through the acquisition of the UK company Enterprise and the Chilean Steel Ingeniería. Compared to 2012, both internationalisation and diversification levels increased by 6 percentage points in 2013.
Bilfinger, which is ranked in the Top 10 listed European construction companies, obtains around 62% of total revenue from non-construction activities, especially from the industrial and power services divisions. In 2013, the acquisitions of Johnson Screens and Europa Services expanded the Group's portfolio, enabling access to new markets and customers. Foreign markets such as the United States or Europe represented 61% of its total sales in 2013.
Balfour Beatty, which has a significant presence in the United States, generated 54% of total sales abroad in 2013. The contraction of construction activities in the UK was offset by a reduction in the revenue generated by other divisions such as professional and support services. As a result, the importance of non-construction activities remained unchanged and has represented around 35% of total income in the last few years.
Finally, FCC’s subsidiary Alpine, with a strong presence in construction activities in Austria and the rest of Europe, initiated a liquidation process in 2013. At December 2013, FCC had not consolidated this subsidiary, thus reducing the international presence of the Spanish group but increasing its level of diversification in relative terms.
Trends in internationalisation and diversification 2010-2013In 2013, international sales of our EPoC represented 56% of total revenue with an aggregate diversification level of 23%. In comparison to 2010, the level of internationalisation has increased by 7 percentage points while the level of diversification has decreased by 6 percentage points.
This reflects increasing internationalisation across our EPoC as well as the impact of the divestments made by some groups in recent years to reduce debt levels.
An analysis of the differences in the degree of internationalisation and diversification over the last four years shows that most of our Top 20 EPoC have remained in the same category throughout this period and have seen changes in their internationalisation and diversification levels of around +/- 6 percentage points. Significant changes have only been noted in the following groups:
• In 2011, ACS was transformed from a domestic conglomerate to an international construction group as a result of the acquisition of HOCHTIEF. Additionally, this transformation was supported by the divestment process embarked upon by the group.
• French companies within our Top 20 have not experienced significant changes in their internationalisation and diversification levels.
• The Spanish company FCC has significantly reduced its international presence and increased its diversification level due to the deconsolidation of its Austrian construction subsidiary Alpine.
• Carillion has increased its internationalisation as well as its diversification in relative terms. Certain acquisitions performed in recent years such as the Boucher Group in 2012 and John Laing Integrated Services in 2013 have supported the growth of 15 percentage points in its internationalisation level.
• In recent years, Acciona’s diversification and internationalisation levels have increased, partly explained by the severe reduction of activities in the local construction market.
• In recent years, OHL has reduced its diversification by 10 percentage points, mainly as a result of the divestment of its Brazilian and Chilean concessions.

EPoC 2013 European powers of construction 15
Company 2013-2010
Internationalisation % variation
Diversification % variation
VINCI 0% (2%)
ACS 55% (41%)
BOUYGUES 3% (5%)
HOCHTIEF 0% (4%)
SKANSKA (6%) (1%)
EIFFAGE 1% (0%)
COLAS (3%) 0%
STRABAG (2%) 0%
BALFOUR BEATTY 2% (1%)
BILFINGER 1% 6%
FERROVIAL (1%) (13%)
BAM 6% (2%)
FCC (4%) 17%
NCC 1% 0%
ACCIONA 10% 12%
PEAB 4% 1%
ENKA 4% (12%)
CARILLION 5% 15%
OHL 5% (10%)
BARRATT 0% (1%)
Average Top 20 EPoC 7% (6%)
VINCI
OHL
BOUYGUES
BAM
SKANSKA NCC
HOCHTIEF
FERROVIAL
BILFINGER
BARRATT BALFOUR BEATTY
COLAS
CARILLION
PEAB
ACCIONA
ENKA
STRABAG
FCC
EIFFAGE
(15%)
(10%)
(5%)
0%
5%
10%
15%
20%
(7%) (5%) (3%) (1%) 1% 3% 5% 7% 9% 11%
Diversification level variation 2013 vs 2010
Internationalisation level variation 2013 vs 2010
60%
(40%)ACS
Source: Deloitte analysis
The contraction of its local construction market and the strong performance achieved in different international projects resulted in an increase of 5 percentage points in its level of internationalisation.
• Due to construction projects developed in countries such as Ukraine, Iraq, Afghanistan or Albania, Enka has increased its internationalisation by 4 percentage points while reducing its diversification by 12 percentage points since 2010.
• In previous years, Ferrovial saw its percentage of international sales fall and became less diversified, mainly as a result of its divestment policy and the deconsolidation of HAH (formerly BAA) and 407 ETR. Nevertheless, certain recent acquisitions such as the UK services subsidiary Enterprise have resulted in growth in its levels of internationalisation and diversification.
• Lastly, Skanska remained faithful to its construction roots but increased its share of domestic market.

16
EPoC 2013 financial performance
The most noteworthy aspects of the financial performance of our Top 20 EPoC are as follows:
EBIT marginThe analysis of EPoC 2013 profitability levels must be carried out drawing a distinction between the construction business and other activities. Based on the figures obtained in the last three years, the following conclusions can be drawn:
• In 2013, total average EBIT margins fell by 20 basis points to 4.4% as a result of a decrease in non-construction margins, which was not offset by growth recorded in construction margins.
• While in 2012 the Top 20 EPoC reported lower construction margins than in 2011, in 2013 construction EBIT margins grew. Construction activity EBIT increased slightly to 3.1% in 2013.
• With regards to construction activities, it is worthy of note that four of the Top 20 EPoC recorded negative margins in 2013. The Swedish company Peab and the Spanish company FCC reported negative margins due in part to the effect of certain one-off costs such as valuation adjustments or project write-downs. Balfour Beatty, Bam and FCC recorded negative margins in both 2013 and 2012.
• In 2013, four groups were able to achieve construction margins above 5%: Enka, Barratt Developments, OHL and Ferrovial. In addition, OHL recorded the highest total margins among the Top 20 EPoC due to the relative weight of its concession business.
Net income attributable to the GroupThe analysis of the net income obtained by the Top 20 EPoC in 2013 discloses the following conclusions:
EBIT / Sales
Construction activities Other activities Total
Company 2013 2012 2011 2013 2012 2011 2013 2012 2011
ENKA INSAAT VE SANAYI AS 13.5% 6.6% 22.7% 14.7% 12.1% 13.0% 14.3% 10.8% 14.8%
BARRATT DEVELOPMENTS PLC 9.7% 8.3% 6.8% 0.0% 4.1% 1.6% 9.7% 8.2% 6.6%
FERROVIAL SA 7.7% 6.9% 5.1% 9.4% 12.2% 12.9% 8.6% 9.2% 8.4%
OBRASCON HUARTE LAIN SA (OHL) 5.8% 1.1% 6.9% 86.3% 48.8% 38.6% 28.0% 16.4% 20.0%
NCC AB 4.7% 4.7% 3.8% N/A N/A N/A 4.6% 4.4% 3.8%
VINCI SA 4.2% 4.2% 4.5% 40.5% 40.7% 40.1% 9.3% 9.5% 9.7%
CARILLION PLC 4.1% 5.8% 4.5% 5.9% 5.0% 4.1% 5.3% 5.3% 4.3%
BOUYGUES SA 3.9% 3.7% 3.7% 4.4% 4.3% 9.5% 4.0% 3.8% 5.6%
COLAS SA 3.5% 3.1% 3.8% 1.5% 3.1% 3.8% 3.1% 3.1% 3.8%
EIFFAGE SA 3.1% 2.7% 2.2% 16.9% 15.7% 15.4% 9.2% 8.5% 8.0%
BILFINGER SE 3.1% 3.6% 3.3% 3.6% 5.7% 5.3% 3.4% 4.9% 4.4%
AVERAGE EPOC 3.1% 2.6% 3.4% 8.8% 11.2% 13.4% 4.4% 4.6% 5.9%
HOCHTIEF AG 3.1% 2.7% 2.5% N/A N/A N/A 3.3% 2.3% 2.7%
SKANSKA AB 3.0% 2.8% 3.2% 19.2% 11.2% 46.4% 4.1% 3.1% 7.1%
ACTIV. DE CONSTR. Y SERV. SA (ACS) 2.4% 2.3% 2.3% 10.7% 10.4% 10.7% 4.3% 4.1% 4.8%
STRABAG SE 2.1% 1.6% 2.6% N/A N/A (2.2%) 2.1% 1.6% 2.3%
ACCIONA SA 0.2% 2.8% 4.1% (45.8%) 15.2% 15.4% (26.8%) 9.2% 9.5%
KONINKLIJKE BAM GROEP NV (0.1%) (2.2%) 2.0% 12.8% (32.2%) 1.0% 0.2% (4.0%) 1.9%
PEAB AB (0.5%) 1.1% 2.7% 12.1% 10.1% 8.4% 1.4% 2.3% 3.5%
BALFOUR BEATTY PLC (0.5%) (0.5%) 2.0% 2.3% 2.8% 2.6% 0.5% 0.7% 2.2%
FOMENTO DE CONSTR. Y CONTRATAS SA (FCC) (9.6%) (6.7%) 3.2% (1.3%) 0.1% 3.7% (4.5%) (3.6%) 3.4%

EPoC 2013 European powers of construction 17
• Total net income obtained by the Top 20 EPoC decreased by 51% to €1,859 million in 2013 while average net income amounted to €93 million. As indicated below the reduction in net income is basically due to the impairment losses recognised by some of our EPoC.
• Vinci continued to be the group with the highest net income among the Top 20 EPoC. Since 2011, net income obtained by the French giant has remained stable at around €1,900 million.
• Two Spanish groups are positioned below Vinci in the profit ranking. In line with 2012, net income recorded by Ferrovial amounted to €727 million. The construction and airports divisions of the group represented 79% of total net income obtained in 2013. After the non-recurring losses obtained by ACS during 2012 (mainly as a result of its investment in Iberdrola), in 2013 the Spanish group’s net attributable income amounted to €702 million.
• Four groups among the Top 20 EPoC recorded losses in 2013. Acciona’s net losses amounted to €1,972 million due to the write-offs recorded in connection with the company’s renewable assets arising from the amendments to Spanish energy sector legislation. Similarly, the write-offs recognised by FCC and Bouygues in connection with its subsidiaries Alpine and Alstom partially explain the losses obtained by those groups. Balfour Beatty almost broke even in 2012 and 2013.
• Twelve EPoC increased their net income in 2013. The most significant growth was achieved by ACS. On a smaller scale, and after the significant losses obtained in 2012, the Dutch group BAM increased its net income by €233 million to €46 million in 2013. In contrast, OHL’s net income was down 73% to €270 million, mainly as a consequence of the impact on 2012 results of the profit on the sale of its Brazilian and Chilean concessions.
Net Income attributable to the Group (€m)
-2000 -1500 -1000 -500 0 500 1000 1500 2000
ACCIONA
FCC
BOUYGUES
BALFOUR BEATTY
PEAB
BAM
BARRATT
STRABAG
CARILLION
HOCHTIEF
BILFINGER
NCC
EIFFAGE
OHL
COLAS
SKANSKA
ENKA
ACS
FERROVIAL
VINCI
2013 2012

18
Average debt to equity ratios have remained unchanged for the last three years
Net debt / net debt + equityThe analysis of the net debt / (net debt + equity) ratio gave rise to the following highlights:
• Over the last three years, average debt levels have remained relatively stable between 45% and 46%.
• Eiffage and the Spanish groups FCC, Acciona and OHL continue to be the groups with the highest ratio while Enka, Bilfinger, Strabag and Colas reported the lowest ratio in 2013.
• Vinci, ACS and Bouygues, which are ranked in the first three positions of our Top 20, recorded net debt / (net debt + equity) ratios of 50%, 44% and 34%, respectively.
Total net debt / (Total net debt + Equity)
-20%
0%
20%
40%
60%
80%
100%
ENKA
BILF
ING
ER
STRA
BAG
CO
LAS
BARR
ATT
HO
CH
TIEF
SKA
NSK
A
CA
RILL
ION
BALF
OU
R BE
ATT
Y
BAM
BOU
YGU
ES
NC
C
AC
S
PEA
B
FERR
OV
IAL
VIN
CI
OH
L
AC
CIO
NA
EIFF
AG
E
FCC
2013 2012
Average 2013 and 2011 = 46%
Average 2012 = 45%
Source: Deloitte analysis

EPoC 2013 European powers of construction 19
Net Debt / Market Capitalisation
-1.0
0.0
1.0
2.0
3.0
4.0
5.0
6.0
7.0
8.0
ENKA
STRA
BAG
BILF
ING
ER
CO
LAS
BARR
ATT
HO
CH
TIEF
SKA
NSK
A
CA
RILL
ION
BALF
OU
R BE
ATTY
NC
C
BAM
VIN
CI
BOU
YGU
ES
PEA
B
FERR
OV
IAL
AC
S
OH
L
AC
CIO
NA
FCC
EIFF
AG
E
2013 2012
Average 2012 = 0.7 Average 2013 = 0.6
Average 2011 = 0.8
Source: Bloomberg, Deloitte analysis
The average net debt/market capitalisation ratio of EPoC 2013 was reduced by 0.1, following a 25% increase in EPoC Top 20 market capitalisation
Net debt / market capitalisationThrough the analysis of these ratios the following conclusions can be drawn:
• The average net debt / market capitalisation ratio fell from 0.7 to 0.6 as a result of the combination of a 3% decrease in net debt and a 25% increase in EPoC Top 20 market capitalisation.
• In 2013, Eiffage reduced the ratio by 0.9 to 3.4. Nevertheless, it is placed as the group with the highest net debt / market capitalisation ratio.
• FCC and BAM recorded the highest reductions in the net debt / market capitalisation ratio. The Spanish group has reduced its ratio to 2.9 as a result of the decrease recorded in the net debt figure as well as the growth of its market capitalisation. In the same way, BAM significantly reduced its net debt due to the change in the consolidation method of certain subsidiaries as a result of the implementation of IFRS 11 “Joint Arrangements”.

20
Market capitalisation / book value• The average market capitalisation / book value ratio
grew by 0.4 during 2013 to 1.7 mainly due to the higher market capitalisation achieved by most of our Top 20 EPoC.
• FCC’s market capitalisation / book value ratio is significantly higher than those achieved by the remaining nineteen groups in our ranking. The losses obtained in 2013 have impacted the book value recorded and market capitalisation has grown by almost 73%.
• Excluding FCC, in 2013 five groups of the Top 20 EPoC recorded market capitalisation / book value ratios above 2. Among this group, NCC, Skanska and ACS achieved the highest figures. On the other hand, the book value of Acciona and Strabag is higher than their market value.
Intangibles and market value vs book valueBefore the current financial crisis, EPoC were involved in significant M&A activities as part of their growth strategies. New opportunities were identified in the international marketplace, but also in different sectors, reflecting the trends outlined above: internationalisation and diversification.
In many instances, the purchase prices paid exceeded the value of the assets acquired since the investors expected to recover their investments through higher cash flows in subsequent years. Not all those cash flows have materialised as a consequence of the economic and financial crisis which broke out in the summer of 2008 and some of our EPoC have recorded significant impairment losses over the last years. This means that analysts are focusing on the value of the residual intangible assets and goodwill that arose as a result of the aforementioned M&A transactions. Against this backdrop, the relationship between market capitalisation, book value and the intangible assets of our EPoC 2013 is further discussed.
Market capitalisation / Book value
2013 2012
0.0
0.5
1.0
1.5
2.0
2.5
3.0
3.5
650.0
AC
CIO
NA
STRA
BAG
BAM
BARR
ATT
BOU
YGU
ES
OH
L
EIFF
AG
E
CA
RILL
ION
PEA
B
ENKA
CO
LAS
BILF
ING
ER
FERR
OV
IAL
BALF
OU
R BE
ATT
Y
VIN
CI
HO
CH
TIEF
AC
S
SKA
NSK
A
NC
C
FCC
Average 2013 = 1.7
Average 2012 and 2011 = 1.3
Source: Bloomberg, Deloitte analysis

EPoC 2013 European powers of construction 21
VINCI
ENKA
BOUYGUES
ACS
FERROVIAL
SKANSKA
ACCIONA
HOCHTIEF BILFINGER
OHL
COLAS
EIFFAGE
BARRATT
CARILLION
NCC
PEAB
BALFOUR BEATTY
BAM
STRABAG
0.0
0.5
1.0
1.5
2.0
2.5
3.0
0.0 0.2 0.4 0.6 0.8 1.0 1.2 1.4
Mar
ket
capi
taliz
atio
n /
Boo
k va
lue
Intangibles excluding concessions / Market capitalization
Average 2013: 1.7
650.0FCC
Average 2013: 0.3
Source: Bloomberg, Deloitte analysis
The Top 20 EPoC have an average market capitalisation / book value ratio of 1.7 (1.3 in 2012) and an average intangible asset / market capitalisation ratio of 0.3 (0.4 in 2012).
This evolution reflects a reduction in balance sheet risks as well as significant impairment charges recorded in the last years and a better market sentiment (external view) on those risks.
In an analysis of the relationship between intangible assets (excluding concessions), book value and market capitalisation of the major listed European construction groups, four categories can be identified as follows:
• The first category is made up of groups where market value levels are higher than both intangible asset value and book value. In 2012 this category comprised thirteen of our Top 20 EPoC. In 2013, four additional groups joined this category: BAM, Eiffage, Bouygues and FCC. The most significant variation among them is represented by FCC. The Spanish group has increased
its market capitalisation by 73% while the book value was severely impacted by the net losses obtained. In addition, Vinci, HOCHTIEF, Ferrovial, Skanska and NCC obtained in 2013 a market capitalisation / book value ratio above average and an intangible assets / market capitalisation ratio below average.
• Strabag and Acciona represent the segment in which market capitalisation is lower than book value and at the same time the amount of intangible assets is below market value. These companies trade at a discount to book value. In 2013, Acciona reduced its intangible assets and market capitalisation by 91% and 26% partially as a consequence of the new policies adopted by the Spanish government in connection with the renewable energies sector.
• A third segment is made up solely of Carillion, which has significant intangible assets on its balance sheet, although the market is not currently discounting this possible risk. Carillion’s figures have remained unchanged for the last three years.

22
Enterprise value / EBITDA
-15 -10 -5 0 5 10 15 20 25 30 35
HOCHTIEF
STRABAG
ACS
COLAS
BOUYGUES
BILFINGER
OHL
ACCIONA
ENKA
VINCI
SKANSKA
EIFFAGE
CARILLION
NCC
FCC
PEAB
BARRATT
BAM
FERROVIAL
BALFOUR BEATTY 31.3
16.8
13.5
13.3
11.5
11.2
10.4
9.8
7.7
7.7
7.6
7.5
7.4
7.0
6.6
4.6
4.2
4.0
3.7
2.6
Average 2011 = 6.7Average 2012 = 6.3Average 2013 = 6.9
2013
2012
• Finally, there used to be a fourth category made up of groups with both book and intangible asset values above their market capitalisation. In 2012, this category was represented by Bouygues and FCC. As mentioned above, in 2013 these groups achieved higher market values than both intangible asset and book values and have recorded significant impairment losses being the groups with the highest net losses in 2013, together with Acciona.
Enterprise value / EBITDA• The average enterprise value / EBITDA multiple
amounted to 6.9 compared to 6.3 in 2012 and 6.7 in 2011.
• As in 2012, Balfour Beatty and Ferrovial recorded the highest enterprise value / EBITDA multiples in December 2013. Balfour Beatty has increased its ratio by 12.6 to 31.3 mainly due to a 37% reduction in the EBITDA obtained.
• On the other hand, the enterprise values of groups such as Bouygues, Strabag, Colas, ACS and HOCHTIEF are less than five times their EBITDA figures.
Capital expenditure / salesConstruction activity generally does not require significant levels of capital expenditure. However, the capital expenditure requirements are traditionally higher in highly diversified groups.
The Top 20 EPoC average capital expenditure / sales ratio reached 5.6% in 2013, compared to 6.0% in 2012 and 2011. However, for the companies falling in the “International construction groups” category this ratio stood at 4.9%.
In line with 2012, Spanish groups such as OHL and Ferrovial have significant investment levels due to the importance of their concession businesses.
The main reductions in the capital expenditure / sales ratio are observed in Acciona and Bouygues, two of the EPoC with higher net losses in 2013.
Dividend yieldThe average dividend yield decreased to 4.3% in 2013, compared to 5.9% and 5.5% in 2012 and 2011.
In 2013, only HOCHTIEF, Acciona and Bouygues reached dividend yield ratios above 6%. On the other hand, the dividend yield of Enka, Strabag, Bam and Barratt is below 2%. Finally, the Spanish FCC, which reached a dividend yield of 12.8% in 2012, cancelled its dividend in 2013.
Net debt / EBITDAThe average net debt / EBITDA ratio dropped to 2.5 in 2013 from 2.7 and 3.1 in 2012 and 2011.
As in 2012, this ratio is highest at FCC, Eiffage and Ferrovial, which are considered to be highly diversified groups, whereas companies such as Enka, Bilfinger, Strabag, Barratt and Colas are among the lowest.
Cash to EBITDAThe average cash to EBITDA ratio reached 0.9 in 2013. While BAM and FCC lead this ranking, Bilfinger and Balfour Beatty reported cash to EBITDA ratios below zero in 2013.

EPoC 2013 European powers of construction 23
Net Debt/EBITDA
-8 -6 -4 -2 0 2 4 6 8 10
ENKA
BILFINGER
STRABAG
BARRATT
COLAS
HOCHTIEF
SKANSKA
CARILLION
ACS
BOUYGUES
NCC
VINCI
BAM
PEAB
OHL
ACCIONA
BALFOUR BEATTY
FERROVIAL
EIFFAGE
FCC8.3
6.0
5.7
5.5
5.5
4.6
3.9
3.7
2.5
2.1
1.6
1.4
1.3
0.4
0.1
0.0
-0.1
-0.1-0.1
-0.8
Average 2012 = 2.7
Average 2013 = 2.5
Average 2011 = 3.1
2013
2012
Capital expenditure / Sales *
0% 5% 10% 15% 20% 25% 30% 35% 40%
BARRATT
CARILLION
BALFOUR BEATTY
SKANSKA
NCC
BAM
COLAS
PEAB
STRABAG
BOUYGUES
BILFINGER
ACS
HOCHTIEF
ACCIONA
EIFFAGE
ENKA
FCC
VINCI
** FERROVIAL
** OHL 35%16%
8%
8%
7%
7%
7%
6%
5%
5%
4%
3%
3%
2%
2%
2%
1%
1%
1%
1%Average 2012 and 2011 = 6.0%Average 2013 = 5.6%
2013
2012
* The ratios of these groups may be affected by the investments made in subsidiaries andassociates.** Excluding the impact of the investments made in subsidiaries and associates, the ratios of OHLand Ferrovial would have been 9% and 10%, respectively.
Cash to EBITDA (*)
-3 -2 -1 0 1 2 3 4
BALFOUR BEATTY
BILFINGER
CARILLION
ACS
HOCHTIEF
OH
BOUYGUES
EIFFAGE
VINCI
FERROVIAL
SKANSKA
STRABAG
COLAS
ACCIONA
PEAB
NCC
ENKA
BARRATT
FCC
BAM 3.5
2.4
2.0
1.7
1.5
1.4
1.4
1.2
1.2
1.2
1.0
1.0
0.9
0.9
0.6
0.8
0.7
0.0
-1.5
-2.0
Average 2013 = 0.9
2013
Dividend Yield
9.0%
6.9%6.8%
6.0%
5.4%
5.2%
5.1%
5.1%
4.9%
4.6%
4.1%
3.7%
3.7%
3.0%
2.2%
1.7%
1.6%
1.0%
0.7%0.2%
0% 2% 4% 6% 8% 10% 12% 14%
FCC
BARRATT
BAM
STRABAG
ENKA
OHL
EIFFAGE
BILFINGER
VINCI
PEAB
SKANSKA
NCC
ACS
FERROVIAL
CARILLION
BALFOUR BEATTY
COLAS
BOUYGUES
ACCIONA
HOCHTIEF
Average 2011 = 5.5%Average 2012 = 5.9%Average 2013 = 4.3%
2013
2012
Source: Bloomberg, Deloitte analysis * This ratio is calculated by dividing EBITDA plus working capital variation between EBITDA

24
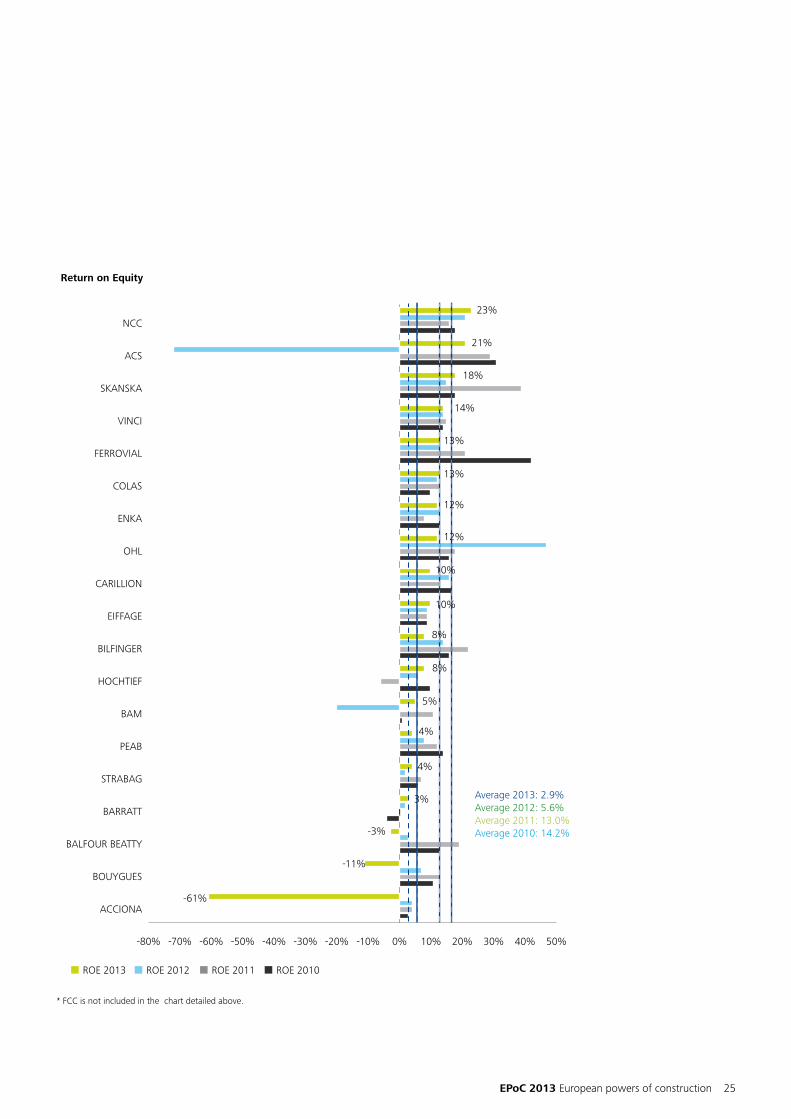
Return on Equity (ROE)Through the analysis of these ratios the following conclusions can be drawn:
• Average ROE for the Top 20 EPoC reached 2.9% in 2013 compared to 5.6% in 2012, 13.0% in 2011 and 14.2% in 2010.
• Average ROE reached in 2013 and 2012 are significantly affected by the impairments recorded by certain of our EPoC during those years. Among
companies, NCC and ACS recorded ROE ratios above 20% and are positioned in the first two positions of the ranking in 2013.
• Additionally, there seems to be a direct correlation between the ROE and the market capitalisation recorded by our EPoC. Groups such as Vinci, ACS, HOCHTIEF, Skanska, Bilfinger, Ferrovial and NCC recorded during 2013 above average ROE and market capitalisation / book value multiples.
VINCI
ENKA
BOUYGUES
ACS
FERROVIAL
SKANSKA
HOCHTIEF
BILFINGER
OHL
COLAS
EIFFAGE BARRATT
CARILLION
NCC
PEAB
BALFOUR BEATTY
BAM
STRABAG
0.0
0.5
1.0
1.5
2.0
2.5
3.0
-20% -15% -10% -5% 0% 5% 10% 15% 20% 25% 30%
Mar
ket
capi
taliz
atio
n /
Boo
k va
lue
Return on Equity
-60%
ACCIONA
AVERAGE 2013: 2.9
AVERAGE 2013: 1.7
* FCC is not included in the chart detailed above.
EPoC 2013 European powers of construction 25
Return on Equity
ROE 2013 ROE 2012 ROE 2011 ROE 2010
Average 2013: 2.9%Average 2012: 5.6%Average 2011: 13.0%Average 2010: 14.2%
-80% -70% -60% -50% -40% -30% -20% -10% 0% 10% 20% 30% 40% 50%
ACCIONA
BOUYGUES
BALFOUR BEATTY
BARRATT
STRABAG
PEAB
BAM
HOCHTIEF
BILFINGER
EIFFAGE
CARILLION
OHL
ENKA
COLAS
FERROVIAL
VINCI
SKANSKA
ACS
NCC23%
21%
18%
14%
13%
13%
12%
12%
10%
10%
8%
8%
5%
4%
4%
3%
-3%
-11%
-61%
* FCC is not included in the chart detailed above.

26
Internationalisation: Business opportunities
The limited size of the Western European market and its negative performance in recent years have forced major European construction groups to look abroad for growth opportunities. As indicated in the chapter on the "Outlook for the construction industry in the EU", investment in construction activity in the European Union is forecast to increase during 2014 and 2015. Nevertheless, since the expected local growth rates are not high enough, our EPoC still need to look abroad for growth opportunities.
In this context, companies must know that being awarded with a foreign contract is usually not as difficult as making it profitable and being able to bring the money back to the domestic markets.
When going abroad, certain issues must be considered in order to avoid the inherent risks of the internationalisation process. The prior selection of target countries and projects, understanding the customers and subcontractors and assessing the convenience of working with local partners and/or acquiring local operators, etc., are key factors that might impact on the traditional narrow margins of construction activities.
Less than 0Between 0 and 1Between 1 and 2Between 2 and 4Between 4 and 6Greater than or equal to 6Insufficient data
0
3,000
6,000
9,000
12,000
15,000
FCC
FERR
OVI
AL
OH
L
VIN
CI
COLA
S
BOU
YGU
ES
BALF
OU
R BE
ATTY
SKA
NSK
A
HO
CHTI
EF
ACS
2013 2012 2011
The Americas EPoC- sales (€ million)
0
5,000
10,000
15,000
20,000
VIN
CI
BOU
YGU
ES
HO
CHTI
EF
ACS
2013 2012 2011
Asia / Oceania EPoC- sales (€ million)
0
500
1,000
1,500
2,000
BILF
ING
ER
ACS
CARI
LLIO
N
BOU
YGU
ES
VIN
CI
2013 2012 2011
Africa
Source: International Monetary Found & Deloitte Analysis

EPoC 2013 European powers of construction 27
In this context, it is important to note that the majority of the most internationalised EPoC reported lower average construction EBIT margins in 2013 than the less internationalised EPoC. The total average construction EBIT margin was 3.1% in 2013 while the average construction margin for internationalised groups such as Acciona, Balfour Beatty, Bam, Bilfinger, Skanska, Strabag, ACS and HOCHTIEF was 2.2%. On the other hand, Colas, NCC, Vinci, Bouygues, Carillion and Eiffage recorded an average construction EBIT margin of 4.0% in 2013. Generally, EPoC that report construction margins geographically have significantly higher margins in their domestic market than in foreign markets. Most EPoC do not disclose this information but, as shown in the chart below, there seems to be an inverse correlation between the EBIT margins on construction activities and the level of internationalisation of the Top 20 EPoC.
VINCI
ENKA BOUYGUES
ACS
FERROVIAL SKANSKA
ACCIONA
HOCHTIEF
BILFINGER
FCC
OHL
COLAS
EIFFAGE
BARRATT
CARILLION
NCC
PEAB
BALFOUR BEATTY
BAM
STRABAG
0%
10%
20%
30%
40%
50%
60%
70%
80%
90%
100%
-10% -5% 0% 5% 10%
Inte
rnat
iona
l sal
es /
Tot
al s
ales
%
Construction EBIT / Construction sales %
There seems to be an inverse correlation between the EBIT margins on construction activities and the level of internationalisation
Source: Deloitte analysis

28
Additionally, through the analysis of the level of internationalisation and the EBITDA multiple reached by our Top 20 EPoC, there seems to be an inverse correlation between both figures. The internationalisation process does not necessarily leads to higher market value.
The most internationalized EPoC generally recorded lower EBITDA multiple than groups with the strongest focus on the domestic market
ACS
HOCHTIEF
EIFFAGE
BALFOUR BEATTY
FCC
BAM
FERROVIAL
ACCIONA
CARILLION
NCC
OHL
PEAB
BARRATT
COLAS
SKANSKA
BILFINGER
ENKA
STRABAG
0%
10%
20%
30%
40%
50%
60%
70%
80%
90%
100%
- 5 10 15 20 25 30
Inte
rnat
iona
l rev
enue
/ T
otal
rev
enue
s %
EBITDA Multiples
VINCI BOUYGUES
Source: Deloitte analysis
Our 2013 EPoC are currently present in all five continents and obtain about 56% of their revenues outside of their national borders. A summary of the international markets and the presence of our EPoC by region is as follows:
The AmericasWhen analysing the economic growth of the continent and forecasts for 2014, we must distinguish between North America and Latin America due to the particular characteristics of each area.
North AmericaThe US economy grew faster than expected in the second half of 2013, explained in part by buoyant domestic demand and strong export growth. GDP grew

EPoC 2013 European powers of construction 29
at an average annualised rate of 3.3% in the second half of the year compared to 1.2% in the first half. The unemployment rate continued to fall in 2013 and reached 6.7% in February 2014. In the first quarter of 2014 the underlying fundamentals of private demand remained strong and growth is expected to advance at an above-potential rate for the rest of this year. In 2014 GDP is expected to increase by approximately 2%-4%. With regards to construction activities, the industry experienced a mild recovery in 2013. Total employment increased by 122,000 while investments in construction rose by nearly 6% between November 2012 and November 2013. Nevertheless, the industry still employs 1.9 million fewer people than it did in 2006 and annual construction spending levels remain $200 billion below peak levels.
Most of the US infrastructure, including the majority of the interstate highway system was built in the 1950s and 1960s and therefore is now reaching the end of its useful life. In order for the US to continue on the path to economic recovery and remain competitive in a global world, it is time for some major renovations to its infrastructure. Approximately $2.3 trillion is needed over the next decade for transportation, energy, and water infrastructure. Despite these pressing infrastructure investment needs, a comprehensive federal infrastructure policy is paralysed by political issues. In this context, there is a request for Congress to allow states more flexibility to pursue alternative financing sources such as public-private partnerships (PPPs), tolling and user fees, and low-cost borrowing through innovative credit and bond programmes. More and more states are now relying on PPPs in order to finance new infrastructure projects, although federal regulations and tax laws often prevent states from fully profiting from these schemes.
Canada’s economy rebounded in 2013 and the annual GDP growth rate is expected to accelerate in 2014 to 2.3% due to the stronger external demand and rising business investment. In addition, the projected up-tick in the US economy will boost Canada’s export and business investment growth. Construction has become a cornerstone of the Canadian economy. The sector employs approximately 7% of Canada’s total workforce.
In the decade ahead, the Canadian construction market is expected to become the 5th largest in the world, driven primarily by global demand for natural resources and the urgent need to modernise Canada’s ageing national infrastructure.
Latin AmericaEconomic activity across Latin America stayed in relatively low gear last year. Full-year growth for 2013 is estimated to be around 2.5% or 3%, significantly less than the growth rates observed during previous years.
Looking ahead, regional growth is projected to remain subdued in 2014, at 2.5%. However, there is considerable variation in the outlook for different parts of the region. Mexico is expected to rebound to 3% this year, after an unexpectedly weak growth rate of 1.1% in 2013. Brazil’s economy is expected to stay in low gear, with growth slowing to 1.8% in 2014. Colombia and Peru are forecast to continue expanding while activity in Chile is projected to slow down somewhat because private investment growth is decelerating significantly. Activity in Argentina and Venezuela is expected to slow markedly during 2014, although the outlook is subject to high uncertainty.
Significant investments are still needed to resolve the current infrastructure shortage in Latin America. To close this gap, the investments in infrastructure need to increase by at least 2% of its gross domestic product over an extended period. This is equivalent to go from $150 billion to $250 billion per year. According to the Interamerican Development Bank, annual investments in infrastructures in the region would be $250 billion in the coming years. In Mexico, the National Infrastructure Programme for the period 2013-2018 forecast both public and private investments on transport infrastructures and telecommunications of $1.3 billion of Mexican pesos. Brazil currently presents an enormous opportunity for investment in infrastructure. The Brazilian Government launched the Energy and Logistics Investment Program, consisting of concessions for highways, railways, airports and ports.
The presence of the EPoC 2013 in the Americas is led mainly by the companies detailed below:

30
• ACS and HOCHTIEF have revenues of approximately €13,100 million aggregate in the Americas, mainly in the US and Canada but also in Latin America. The activity in the US and Canada, which are considered to be the largest construction markets in the world, is performed through four subsidiaries: Turner, Flatiron, E.E. Cruz, and Clark Builders. With their respective focal areas, these four companies together cover the building construction, civil engineering, and infrastructure construction segments. ACS’s backlog in the Americas amounted to €16,255 million and represented 26% of total order book at December 2013.
• Skanska increased its sales in the area by 15% to €5,210 million in 2013. Skanska is one of the leading construction companies in the US for building and civil construction. The construction activities in the US showed strong earnings growth and good profitability during the year. The Latin American operations, which are currently being restructured, are dominated by assignments in the energy sector. As for other business lines, Skanska initiates and develops office properties in the U.S.
Asia/OceaniaEconomic activity in Asia picked up speed in the second half of 2013, as exports to advanced economies accelerated. For Asia as a whole, growth is expected to accelerate modestly, from 5.2% in 2013 to about 5.5% in both 2014 and 2015. However, there are significant differences across the region in the outlook for the coming years: In Japan, GDP growth is expected to slow down to 1.4% in 2014, while in Korea the economy should continue its recovery, with growth accelerating to 3.7%. India is expected to record growth rates above 5% in 2014. China has now entered a new lower-growth trajectory, although with growth forecast at 7%-8% for the coming years, it will continue to be an important driver of global growth. Growth was tepid across the Middle East during 2013. On average, GDP of oil exporters such as Iran, United Arab Emirates or Kuwait grew by 2% during 2013 while in 2014 GDP is expected to increase by 3.4%.
In Australia, growth is expected to remain largely stable at 2.6% in 2014 as the slowdown in mining-related investment continues.
Despite recent rapid growth and poverty reduction, Asia continues to suffer from a combination of slow urbanisation and huge infrastructure gaps that together could jeopardise future progress. Nevertheless, it is important to distinguish between the different areas of the continent. The South Asian region needs to invest between $1.7 and $2.5 trillion in infrastructure until 2020 in order to bridge the existing gap. Departing from similar points, South Asian countries are remarkably “under-urbanised” when compared to East Asian countries. The 2014-2020 urbanisation plan released by the Chinese Government aims to boost domestic consumption by increasing the proportion of urban residents among China's population of almost 1.4 billion. As it seeks to increase migration from rural to urban areas, China is planning a major expansion of its transport networks and urban infrastructure. In India, total infrastructure expenditure during the Twelfth Five Year Plan (2012 - 2017) grew to $1,025 billion from $514 billion in the Eleventh Five Year Plan (2007 - 2012).
In the Middle East, unprecedented levels of construction are expected to be recorded over the next 20 years, especially in the period 2014 to 2019. Currently, the value of projects planned or underway in the Gulf Cooperation Council (Saudi Arabia, Kuwait, the United Arab Emirates, Qatar, Bahrain and Oman) are up over 13% compared to a year ago. The GCC saw US$ 70 billion worth of construction projects completed in 2013.Across the region, it is possible to identify 117 major programmes that are planned for completion by 2030, costing around $1 trillion. They involve a combination of retail, real estate, leisure, health and education asset developments as well as transport, communication and supporting social infrastructures systems. Additionally, Public Private Partnerships will continue to be used extensively in the power, water and wastewater sectors. The increase in annual construction spend due to major programmes could be $50 billion per year.

EPoC 2013 European powers of construction 31
The Australian Infrastructure Investment Programme estimates that $35 billion is needed in order to provide the country with the infrastructure required. The Australia´s national infrastructure plan outlines the major infrastructure reforms that are needed to lay the foundations for a more productive country over the next 50 years. Currently, public sector construction activity represents around 1% of Australia´s GDP.
ACS and HOCHTIEF are the leading EPoC in Asia/Oceania, with aggregate sales of approximately €15,000 million. Their subsidiary Leighton holds a leading position in the Australian, Asian and Middle East construction markets and has operations in more than 20 countries. HOCHTIEF further increased its stake in Leighton over the course of the year. This reflects confidence in the further improvements of Leighton’s business due to its market position and the existing growth perspectives in the Asia/Oceania market. Additionally, the presence in HOCHTIEF’s ownership structure of Qatar Holding could strengthen its position in the Middle East.
A long way behind ACS and HOCHTIEF, but with significant sales in the Asia-Pacific area, Bouygues increased its revenues in the region by 8% to €2,133 million in 2013. One of the priorities for the company’s construction businesses is to expand on international markets, especially in Asia, so the revenue obtained in 2013 is expected to continue growing in the coming years.
Vinci had revenue of €1,706 million in this area in 2013 compared to €1,435 million in 2012. The presence in its shareholder structure of Qatari Diar, which controls 5.2% of the group, is also a presentation card for the company with a view to continuing its operations in the Middle East and the rest of Asia.
AfricaGrowth in Sub-Saharan Africa remained strong in 2013 at 4.8% and it is expected to be 5.4% in 2014. While countries such as Nigeria, the Republic of Congo and Ivory Coast will record above-average growth rates in 2014, other nations like South Africa, Botswana or
Senegal are expected to be positioned below average in terms of GDP growth rates. North African countries such as Algeria, Egypt or Morocco are forecast to achieve growth rates of 4.3%, 2.3% and 3.9% in 2014, respectively.
It is estimated that 40% of Africa’s productivity is lost through the existing lack of infrastructure. Nowadays over $222 billion is being invested in around 322 African infrastructure projects that are underway. Top sectors in African infrastructure development are energy & power, transport, mining, real estate, water and oil & gas. Of the total number of large projects under construction, 36% fall into energy and power while 25% in transport. In terms of the number of projects underway, Southern Africa leads with 38% of projects, followed relatively closely by East Africa with 29%. West Africa has 21% of the total number of projects while North Africa and Central Africa lag behind at 7% and 5%, respectively. Looking at project ownership, 56% are owned by governments, 39% by private investors and 5% are jointly owned between governments and public-private partnerships (PPPs).
The presence of EPoC 2013 in Africa is once again led by Vinci. Sogea-Satom is Vinci’s main brand in Africa, where the Group obtained revenues of €1,816 million in 2013. This subsidiary is focused on roads construction, civil engineering, hydraulic engineering and building.
Bouygues achieved sales of €1,510 million in Africa in 2013. The presence of the French group in the continent is mainly focused on North and Southern African countries such as Algeria, Morocco, Egypt, South Africa and Botswana. The workforce located in the area comprises 17,565 employees.
Carillion completes the top three EPoC with significant sales in Africa but also in the Middle East area (total sales reported for Africa and Middle East amounted to over €600 million in 2013). The UK company has been operating in the region for more than 40 years and it is focused on activities such as construction, support services and public-private partnership projects.

32
Diversification of the EPoC 2013
The cyclical nature of construction activity causes many companies significant financial difficulties in times of recession. In order to offset the negative effects of the economic and financial situation, most of the EPoC pursued diversification strategies aimed at both achieving sustainable growth and increasing the low margins typical of construction activities. These activities share common customers with the construction sector and cover a full range of services throughout the entire infrastructure cycle.
A review of the margins obtained by our EPoC confirms this:
• The Top three most diversified groups, Enka, Carillion and Bilfinger, obtained an average EBIT margin of 6.8% while pure construction groups such as Hochtief, NCC and Strabag recorded an average margin of 3.2% in 2013.
VINCI
BOUYGUES
ACS
HOCHTIEF
EIFFAGE
SKANSKA
BALFOUR BEATTY
FCC
BILFINGER
BAM
FERROVIAL
CARILLION
NCC
OHL
PEAB
COLAS
ENKA
STRABAG
0%
10%
20%
30%
40%
50%
60%
70%
80%
90%
100%
-5% 0% 5% 10% 15% 20% 25% 30%
Non
- C
onst
ruct
ion
reve
nues
/ T
otal
rev
enue
s %
EBIT / Total revenues %
ACCIONA
'-30%
Source: Deloitte analysis

EPoC 2013 European powers of construction 33
• Ferrovial has strengthened its position as an “international conglomerate” through the acquisition of the UK company Enterprise and the Chilean Steel Ingeniería. On the other hand, Enka increased the weight of its construction business by 14 percentage points in 2013. However, the most significant increase in diversification was achieved by FCC (from 45% to 62%), due to the deconsolidation of its Austrian construction subsidiary Alpine.
• OHL, which obtains almost 28% of total revenue from non-construction activities, reached the highest EBIT margin among our EPoC. OHL’s EBIT represented 28% of total sales mainly due to the good performance of its concession business, which represents around 85% of total operating results. Similarly, the Dutch group BAM increased its profitability by 4.2 percentage points as a result of the reduction in the losses recorded by its property business. Conversely, Acciona’s EBIT margin was severely impacted by the write-off recognised in connection with the company’s renewable assets.
• By country, non-construction activities of the UK and Spanish groups represented around 35% of total revenue obtained in 2013. French groups recorded diversification levels of approximately 21%. In terms of profitability, the Spanish, French and UK groups
recorded EBIT margins of 2.1%, 3.1% and 6.8%, respectively. Excluding Acciona, Spanish groups would have recorded an average EBIT margin of 5.4%.
In the last three years, non-construction sales remained stable and represented around 23% of total revenue, showing a deceleration of the diversification process. Even though the level of diversification in the EPoC 2013 remains in line with prior years, average EBIT margins have fallen by 0.2 percentage points.
The analysis of the diversification strategies adopted by our EPoC shows that while Industrial & Services is the segment into which the largest number of our EPoC have diversified, only two companies obtained sales of over €1,000 million in the Environment & Water segment and just one company, the French Bouygues, has a significant presence in the telecommunications market. The concession business, which in many cases is accounted for using the equity method, is led by French groups Vinci and Eiffage, with sales exceeding €1,000 million, but Spanish groups ACS, Ferrovial and OHL also have a significant presence. Lastly, groups such as Vinci, Skanska, Acciona, ENKA, Bilfinger and Eiffage have diversified into Energy activities.

34
Company ConstructionReal Estate
DevelopmentConcessions
Industrial & Services
Environment & Water
Energy TelecomOther
activities
VINCI SA l l l l l l l l
ACTIV. DE CONSTR. Y SERV. SA (ACS) l l l l l l l l
BOUYGUES SA l l l l l l l l
HOCHTIEF AG l l l l l l l l
SKANSKA AB l l l l l l l l
EIFFAGE SA l l l l l l l l
COLAS SA l l l l l l l l
STRABAG SE l l l l l l l l
BALFOUR BEATTY PLC l l l l l l l l
BILFINGER SE l l l l l l l l
FERROVIAL SA l l l l l l l l
KONINKLIJKE BAM GROEP NV l l l l l l l l
FOMENTO DE CONSTR. Y CONTRATAS SA (FCC) l l l l l l l l
NCC AB l l l l l l l l
ACCIONA SA l l l l l l l l
PEAB AB l l l l l l l l
ENKA INSAAT VE SANAYI AS l l l l l l l l
CARILLION PLC l l l l l l l l
OBRASCON HUARTE LAIN SA (OHL) l l l l l l l l
BARRATT DEVELOPMENTS l l l l l l l l
l Sales over € 1,000 million l Sales below € 1,000 million l Relevant presence through equity investments l No presence or residual presence
Source: Deloitte analysis

EPoC 2013 European powers of construction 35
Financing of EPoC 2013
Groups engaging solely in construction activities have not historically required significant financing to perform their core activities. The construction business is generally characterised by low investment, tight margins and low working capital needs.
However, the trends towards higher participation in Public-Private Partnerships (PPPs) and Project Finance Initiatives (PFIs) in the financing of civil engineering works and the diversification processes carried out by some of the major listed European construction companies in recent years have required them to obtain financing. This debt is still reflected in the consolidated balance sheets of the EPoC 2013.
It is clear that further diversification normally goes hand-in-hand with higher net debt. Based on the figures obtained for recent years, the following conclusions can be drawn:
• Vinci continued to be the group with the highest net debt figure among EPoC 2013. However, the net debt to EBITDA ratio is in line with the average achieved by
the Top 20 EPoC and amounted to 2.5 in 2013. The net debt of Eiffage, the French group that reached diversification levels above 40%, has remained stable over the last three years at around €12,500 million.
• The Spanish groups Acciona, FCC, Ferrovial, OHL and ACS and the French company Bouygues have diversification levels above 20% and net debt exceeding €4,000 million. Net overall debt of the Spanish groups has been reduced by 3% during 2013. It is noteworthy that the net indebtedness of the six Spanish companies included in our 2013 EPoC ranking has been reduced from €97 billion in 2007 to €34 billion in 2013, mainly as a result of the divestment process following the 2008 financial crisis.
• Balfour Beatty, Carillion, Bilfinger and ENKA have managed to diversify their traditional construction businesses without creating significant leverage. Net overall debt of these groups was reduced by €175 million to €34 million mainly due to the decrease of €177 million achieved by Bilfinger.
VINCI BOUYGUES
ACS
HOCHTIEF
EIFFAGE
BALFOUR BEATTY
FCC
BAM
FERROVIAL
ACCIONA CARILLION
NCC
OHL
PEAB
BARRATT
COLAS
SKANSKA
BILFINGER ENKA
STRABAG 0%
10%
20%
30%
40%
50%
60%
70%
80%
90%
100%
-2.000 - 2.000 4.000 6.000 8.000 10.000 12.000 14.000 16.000
Non
- C
onst
ruct
ion
reve
nues
/ T
otal
rev
enue
s %
Net debt
Source: Deloitte analysis

36
• Construction companies with low levels of diversification, such as HOCHTIEF, Strabag, BAM, Peab, NCC, Barratt, Skanska and Colas, are among the least indebted of the Top 20 EPoC. As mentioned above, pure construction activities do not require significant levels of financing.
In recent years, our EPoC have shown a certain degree of concern about their debt levels. Since 2011, total net debt of our Top 20 EPoC has been reduced by 5% to €61,075 million. Similarly, the average net debt to EBITDA ratio has been reduced to 2.5.
Our analysis is based on the debt as recorded in the 2013 financial statements of the respective EPoC. Consequently, the debt figures analysed do not include the debt of non-controlling interests that are accounted for using the equity method, joint ventures that are not fully consolidated and PFIs over which the respective company does not have control (which in some cases may be significant).
20122013 2011
-1,000 3,000 7,000 11,000 15,000
ENKA
BILFINGER
STRABAG
COLAS
BARRATT
HOCHTIEF
CARILLION
SKANSKA
BAM
BALFOUR BEATTY
NCC
PEAB
ACS
BOUYGUES
FERROVIAL
OHL
FCC
ACCIONA
EIFFAGE
VINCI
Net Debt
Source: Deloitte analysis

EPoC 2013 European powers of construction 37
Internationalisation: Profitability & Cash Flows
As discussed in the chapter “Internationalisation: Business Opportunities”, when companies plan to do business abroad there are various factors that should be taken into account in order to avoid risks that could impact the traditionally narrow margins of the construction activity. It is sometimes said that “the construction business is not a good traveller”.
Most of our EPoC do not provide detailed margin information on a geographical basis, so it is difficult to assess the profitability and cash flows obtained from the internationalisation process. We have split the Top 20 EPoC data into two categories: The first group includes the Top 10 companies in terms of level of internationalisation. The second category includes the Top 10 groups with the strongest focus on domestic markets. After considering several variables, the following conclusions can be drawn:
• The average profitability of those EPoC with lower internationalisation levels is 11.3%. That is 4.6 percentage points higher than the average profitability achieved by the most internationalised groups.
• The cash to EBITDA ratio is traditionally higher when delivering construction projects in local markets. The cash to EBITDA ratio is higher for the less internationalized EPoC in 2011 (1.0 vs 0.6), 2012 (0.9 vs 0.8) and 2013 (1.1 vs 0.7).
• Regarding the impact of internationalisation on the working capital of our EPoC, the most internationalised groups had negative working capital variation in the last three years, reducing on average €2,750 million per year. On the other hand, the working capital variation of the less internationalised EPoC amounted on average to €594 million per year.
Although it is not possible to draw a definite conclusion from this analysis, it seems that our EPoC obtain higher margins and cash flows from the activities performed in their respective local markets than from their international activities. Factors such as an in-depth knowledge of the domestic markets, customers and subcontractors as well as a good understanding of how to negotiate potential claims could go some way to explaining these results.

38
Working capital variation Cash to EBITDA
0.6
0.8
0.7
-
0.2
0.4
0.6
0.8
1.0
(4,000)
(3,000)
(2,000)
(1,000)
- 2011 2012 2013
Working capital variation Cash to EBITDA ratio
1.0
0.9
1.1
-
0.2
0.4
0.6
0.8
1.0
1.2
1.4
(2,000)
(1,500)
(1,000)
(500)
-
500
1,000
1,500
2,000
2011 2012 2013
EBITDA EBITDA margin
6.7% 6.4%
7.0%
0.0%
1.0%
2.0%
3.0%
4.0%
5.0%
6.0%
7.0%
8.0%
0
2,000
4,000
6,000
8,000
10,000
2011 2012 2013
EBITDA EBITDA margin
11.9%
10.9%
11.3%
0% 1% 2% 3% 4% 5% 6% 7% 8% 9% 10% 11% 12% 13%
0
2,000
4,000
6,000
8,000
10,000
12,000
14,000
16,000
2011 2012 2013
Most Internationalized EPoC
Less Internationalized EPoC
* This chart is based on the information of those EPoC with higher internationalisation levels: ACS, HOCHTIEF, Skanska, Strabag, Balfour Beatty, Bilfinger, Ferrovial, BAM, NCC and OHL.
Source: Deloitte Analysis
* This chart is based on the information of those EPoC with lower internationalisation levels: Vinci, Bouygues, Eiffage, Colas, FCC, Acciona, Peab, Enka, Carillion and Barratt.
Source: Deloitte Analysis

EPoC 2013 European powers of construction 39
Performance of non-European construction companies
The eleventh edition of European Powers of Construction includes a review of some of the most significant non-European construction groups. Our analysis is based on the “Top Global Contractors” ranking published annually by ENR, which analyses the position of both major construction and engineering contractors. Based on their available financial information and excluding our EPoC and other European engineering groups, we have examined their market position and performance in terms of revenue, profitability, debt and other key financial figures.
Noteworthy among the companies selected for our analysis is the presence of seven Chinese and four Japanese construction groups. The remaining groups come from the United States, Australia, South Korea and Brazil:
• China Railway Construction Corporation (CRCC) is one of the world's largest and most powerful integrated construction groups. CRCC has established its leadership position in project design and the construction of railways, high-speed railways, highways, bridges and tunnels. While total sales are significantly higher than those achieved by our average EPoC, the EBITDA margin obtained during 2013 is below the average profitability reached by the most important listed European construction groups. In addition, its net debt/EBITDA ratio is also higher than the average obtained by the European groups.
• China Railway Group Limited is an integrated construction group that encompasses infrastructure construction, survey, design and consulting services, engineering equipment and component manufacturing, property development and other businesses. In 2013, total sales amounted to €66,187 million, a higher figure than that achieved by any of the European construction groups. The net debt/EBITDA ratio is 4.4, higher than the average obtained by the European groups but still lower than CRCC’s ratio.
• China State Construction Engineering Corporation’s activities include, among others, housing construction, real estate development and infrastructure construction. The Group is one of China’s largest construction and real estate conglomerates and its biggest building work contractor. Established in both domestic and international markets, China State Construction Engineering Corporation operates in more than 20 countries and regions around the world.
• Incorporated in 2006, China Communications Construction Company Limited is a leading group in road, railways, ports and bridge construction in China. Total sales amounted to €40,638 million, just 1% higher than our EPoC leader Vinci. In line with the average profitability of EPoC, the total EBITDA margin reached 8.8% in 2013.
• Metallurgical Corporation of China Limited is a key player in the domestic construction business and a reputable EPC contractor in overseas markets, and it also engages in real estate development activities. In addition, it is one of the world’s largest metallurgical engineering contractors and service providers for metallurgical enterprises. In 2013, total sales amounted to €24,770 million, a level comparable to our Top 5 EPoC. The EBIT margin reached 4.6%, also similar to our EPoC 2013 margin of 4.4%.
• Bechtel Corporation is one of the oldest and largest family-led corporations in the United States. Since its foundation in 1898, four generations of the Bechtel family have steered the company through 23,000 projects in 140 nations and seven continents. The company is well-known for engineering, construction and project management services. Additionally, the diverse portfolio encompasses energy, transportation, communications, mining, oil and gas, and government services. In fiscal year 2012, total revenues reached approximately €30 billion.

40
• Leighton Holdings, which is part of the ACS Group, was founded in 1949, listed on the Australian Securities Exchange in 1962 and is based in Sydney, Australia. With a workforce of approximately 56,000 people, it operates in 22 countries mainly in Asia, Middle East and Africa. Leighton carries out activities in segments including infrastructure construction, mining, facility management services and concessions. Total sales grew by 8% in 2013 to reach €16,379 million.The Net debt / EBITDA ratio was below the average of our EPoC 2013 at 0.2, mainly due to the low indebtedness of the Group.
• Fluor Corporation is one of the world's largest publicly traded engineering, procurement, construction, maintenance and project management companies. In 2013, total sales remained in line with 2012, amounting to €20,595 million. While recording lower profitability levels than our average EPoC, its net cash position amounted to €883 million.
• With a history of over 50 years, Shanghai Construction Group has developed some of the most important construction projects carried out in China, such as the Lu Pu Bridge or the East China Sea Bridge. Its business activities include, among others, construction contracting, real estate development and investment & management of public utilities and infrastructures. In 2013, total sales and EBITDA amounted to €12,494 million and €341 million, respectively. Net debt remained low, reaching approximately €147 million.
• In 2013, SINOHYDRO, as an industry leader in engineering and construction, successfully delivered a number of major projects across the world in all business sectors. In 2012, total sales reached approximately €14,000 million, with international sales representing around 25% of total revenue.
• Established around 120 years ago, Obayashi Corporation is one of the world's leading construction contractors and Japan's leading listed companies. In 2013, total sales grew by 11.4% to €12,008 million mainly due to the good performance of its construction business in both domestic and overseas markets. While the average EPoC net debt amounted to €3,054 million, total indebtedness of Obayashi reached €2,003 million in 2013.
• Odebrecht is a Brazilian conglomerate consisting of diversified businesses in the fields of engineering, construction, chemicals and petrochemicals. In 2012, around 84% of total revenue was obtained in Latin America and the Caribbean. Even though the EBIT and EBITDA margins are significantly high, the net debt / EBITDA ratio amounted to 4.9 while the average for our EPoC was 2.5.
• Kajima is one of the five leading general contractors in Japan with a workforce that exceeds 7,500 employees. In 2013, total sales amounted to €11,325 million and operating profit grew by 28% to €171 million. Nevertheless, profitability figures remained below those achieved by most of our EPoC.
• Shimizu Corporation is a leading architectural, civil engineering and general contracting firm, offering integrated, comprehensive planning, design and building solutions for a broad range of construction and engineering projects worldwide. In 2013, total sales increased by 6% to €11,150 million, while the backlog amounted to €9,397 million and represents around 10 months of activity. Total indebtedness is in line with the average recorded by our Top 20 EPoC.
• Since its inception in 1873, Taisei Corporation has undertaken many remarkable projects in Japan and overseas. The Group is focused on different

EPoC 2013 European powers of construction 41
Top 25 companies in the ENR ranking
Company Country
CHINA RAILWAY CONSTRUCTION CORPORATION LIMITED CHINA
CHINA RAILWAY GROUP LIMITED CHINA
CHINA STATE CONSTRUCTION ENGINEERING CORPORATION (*) CHINA
ACTIV. DE CONSTR. Y SERV. SA (ACS) (**) SPAIN
VINCI SA (**) FRANCE
CHINA COMMUNICATIONS CONSTRUCTION COMPANY LIMITED CHINA
HOCHTIEF AG (**) GERMANY
BOUYGUES SA (**) FRANCE
METALLURGICAL CORPORATION OF CHINA LIMITED. CHINA
BECHTEL CORPORATION (*) USA
LEIGHTON HOLDINGS LIMITED AUSTRALIA
FLUOR CORPORATION USA
SHANGHAI CONSTRUCTION GROUP CHINA
SINOHYDRO GROUP LIMITED (*) CHINA
STRABAG SE (**) AUSTRIA
SKANSKA AB (**) SWEDEN
OBAYASHI CORPORATION JAPAN
CONSTRUTORA NORBERTO ODEBRECHT BRAZIL
FOMENTO DE CONSTR. Y CONTRATAS SA (FCC) (**) SPAIN
KAJIMA CORPORATION JAPAN
SAIPEM ITALY
SHIMIZU CORPORATION JAPAN
TAISEI CORPORATION JAPAN
BALFOUR BEATTY PLC (**) UNITED KINGDOM
HYUNDAI ENGINEERING & CONSTRUCTION CORPORATION S. KOREA
(*) The financial information of these groups is not available.(**) Included in our Top 50 EPoC ranking.
Source: ENR
business segments such as Building Construction, Civil Engineering or Real Estate Development. In 2013, total income grew by 7% to €13,259 million mainly due to the good performance recorded in all business areas. In terms of profitability, the EBITDA margin is lower than those achieved by most of our EPoC mainly due to the importance of the construction business, which traditionally records low margins.
• Hyundai Engineering & Construction is recognised as one of the leaders of the Korean construction industry. Established in 1947, in April 2011 the Group started a new chapter in its history by becoming a member of the Hyundai Motor Group. Its activities are mainly focused on building, civil works and power plant construction. In 2012 total sales and EBITDA amounted to €9,683 million and €676 million, respectively. Its net cash position reached €8 million, while among our Top 20 EPoC only five Groups recorded a higher net cash position.

42
Com
pany
Cou
ntry
Sale
s(€
m)
EBIT
(€m
)EB
IT/S
ales
(€ m
)EB
ITD
A(€
m)
EBIT
DA
/Sal
es(€
m)
Net
Deb
t(€
m)
Equi
ty(€
m)
Net
deb
t/ (n
et
debt
+equ
ity)
Net
deb
t /
EBIT
DA
Chi
na R
ailw
ay C
onst
ruct
ion
Cor
pora
tion
Lim
ited
Chi
na 7
1,87
0 1
,504
2.
1% 1
,680
2.
3% 3
5,61
3 1
0,04
0 78
.0%
12.6
Chi
na R
ailw
ay G
roup
Lim
ited
Chi
na 6
6,18
7 2
,263
3.
4% 3
,086
4.
7% 1
3,43
4 1
1,57
4 53
.7%
4.4
Chi
na C
omm
unic
atio
ns C
onst
ruct
ion
Com
pany
Lim
ited
Chi
na 4
0,63
8 2
,398
5.
9% 3
,593
8.
8% 1
2,66
4 1
2,55
7 50
.2%
3.5
Met
allu
rgic
al C
orpo
ratio
n of
Chi
na L
imite
d.C
hina
24,
770
1,1
38
4.6%
1,8
03
7.3%
10,
220
6,5
95
60.8
%5.
7
Leig
hton
Hol
ding
s Li
mite
dA
ustr
alia
16,
379
719
4.
4% 1
,397
8.
5% 2
62
2,1
05
11.1
%0.
2
Fluo
r C
orpo
ratio
nU
nite
d St
ates
20,
595
897
4.
4% 1
,053
5.
1% -
883
2,8
14
(45.
7%)
-0.8
Shan
ghai
Con
stru
ctio
n G
roup
C
hina
12,
494
201
1.
6% 3
41
2.7%
147
1
,549
8.
7%0.
4
Oba
yash
i Cor
pora
tion
Japa
n 1
2,00
8 2
38
2.0%
368
3.
1% 2
,003
1
,942
50
.8%
5.4
Con
stru
tora
Nor
bert
o O
debr
echt
(*)
Braz
il 3
2,15
9 4
,881
15
.2%
3,1
56
9.8%
15,
387
2,9
08
84.1
%4.
9
Kajim
a C
orpo
ratio
nJa
pan
11,
325
171
1.
5% N
/A
N/A
3
,118
2
,556
55
.0%
N/A
Shim
izu
Cor
pora
tion
Japa
n 1
1,15
0 1
94
1.7%
N/A
N
/A
3,1
28
1,7
92
63.6
% N
/A
Tais
ei C
orpo
ratio
nJa
pan
13,
259
333
2.
5% 4
11
3.1%
1,3
80
2,4
77
35.8
%3.
4
Hyu
ndai
Eng
inee
ring
& C
onst
ruct
ion
Cor
pora
tion
(*)
S. K
orea
9,68
3 55
3 5.
7%67
6 7.
0%(8
)3,
365
(0.2
%)
0.0
* Si
nce
finan
cial
info
rmat
ion
for
the
year
201
3 is
not
ava
ilabl
e, t
he fi
gure
s de
taile
d ab
ove
refe
r to
yea
r 20
12.
Sour
ce: D
eloi
tte
Ana
lysi
s

EPoC 2013 European powers of construction 43
Top 20 EPoC – Company profiles

44
Vinci S.A. is a global player in concessions and construction, employing close to 190,000 people in some 100 countries. Incorporated in 1899 by French engineers Alexandre Giros and Louis Loucheur, it remains the largest listed European construction group by sales and market capitalisation.
Its main shareholders are institutional investors, both in France (17%) and outside France (51.7%). The remaining shares are controlled by individual shareholders (9.2%), employees (9.5%) and Qatari Diar Real Estate Investment Company (5.2%). Treasury shares represent 7.4% of the total shares.
Vinci S.A. divides its business portfolio into two main segments: Concessions and Contracting.
ConcessionsThe Group’s concessions business increased total sales by 5% to €5,616 million and represented 14% of total revenue recorded in 2013.
Vinci Concessions develops and operates a strong portfolio of transport infrastructure and public facility concessions in some 20 countries. It is primarily active in airports, motorways and road infrastructure, rail infrastructure, stadiums and parking. Vinci Concessions continues to broaden its scope, both in terms of activities and international reach. Two important developments in 2013 were the acquisition of ANA, the concession company for Portugal’s airports, and the increase in Vinci’s stake in the share capital of Aéroports de Paris. In 2013 revenue grew by 11.5% to €1,020 million.
With a 4,386 km network, Vinci Autoroutes operates half of France’s motorways under concession. Every day it carries over two million customers on the networks of its four concession operating companies: ASF, Cofiroute, Escota and Arcour. Vinci Autoroutes has invested €8.1 billion in its infrastructure since 2006. In 2013 its EBITDA reached €3,231 million and represented 70.3% of total revenue.
ContractingVinci Energies, Eurovia and Vinci Construction represent a strong network of companies and expertise globally. In 2013, their 171,700 employees worked on 266,000 projects in some 100 countries.
Vinci Energies serves public authorities and business customers, helping them to deploy, equip, operate and optimise their energy, transport and communication infrastructure, industrial facilities and buildings. In 2013, total sales of this division, which were obtained mainly in Europe, increased by 3%. The EBITDA margin reached almost 6% in recent years.
Eurovia is a world leader in transport and urban development infrastructure. While continuing to nurture its strong roots in France, it now generates 39% of its revenue through international operations, primarily in Europe, North America and Chile. Business activity held steady in France and grew in the United Kingdom, offsetting a reduction in Germany and Central Europe. Outside Europe, overall business volume remained in line with prior year. In 2013, sales of the division remained stable compared to 2012 and represented 21% of total Group revenue. Similar to the profitability obtained by our EPoC regarding construction activities, the EBITDA margin reached 5% in 2013.
Vinci Construction, France’s leading construction company and a major global player, brings together 830 consolidated companies with 69,000 employees in some 100 countries and delivers a comprehensive array of capabilities in building, civil engineering, hydraulic engineering and contracting-related specialties. Vinci Construction’s business comprises three complementary components:
• A network of French subsidiaries, through Vinci Construction France, and internationally through Vinci Construction UK, Warbud, Prumstay, SMP, SMS in Central Europe and Sogea-Satom in Africa;
• Specialist activities serving global markets: Soletanche Freyssinet (foundation and ground technologies, structures, nuclear) and Entrepose Contracting (infrastructure for the oil and gas sector); and
• A division engaging in the execution and management of complex projects, with Vinci Construction Grands Projects, Vinci Construction Terrassement and Dodin Campenon Bernard, which work on major civil engineering and building projects around the world.
Vinci SA

EPoC 2013 European powers of construction 45
Vinci Construction once again improved its revenue, which rose 9.4% to €16.6 billion. Growth in France and resilience in other European markets were combined with a solid performance in Africa. This is a sign of Vinci Construction’s increasing international reach and its development beyond the confines of the European Union.
Vinci had a robust year in 2013, with further growth in revenues and net income despite a difficult economic climate. Additionally, the total order book amounted to €29.4 billion and represents over 11 months of average business activity. Around two-thirds of the orders are to be executed in 2014. Vinci Energies’ and Eurovia’s order book amounted to €6.4 billion and €5.8 billion while Vinci Construction’s order book totalled €17.3 billion and represents 59% of total Group’s backlog.
Key Data 2013 2012 2011Variation
2013-2012%
Assets
Non-current assets 40,385 38,032 37,202 6.2%
Current assets 22,691 23,559 23,373 (3.7%)
Total Assets 63,076 61,591 60,575 2.4%
Liabilities and shareholders' equity
Shareholders' equity 14,260 14,070 13,615 1.4%
Non-current liabilities 21,618 20,562 21,223 5.1%
Current liabilities 27,198 26,959 25,737 0.9%
Total liabilities and shareholders' equity
63,076 61,591 60,575 2.4%
Income statement
Sales 40,338 38,634 36,956 4.4%
National Sales 25,111 24,324 23,562 3.2%
International Sales 15,227 14,310 13,394 6.4%
Construction Sales 34,636 33,090 31,495 4.7%
Non construction Sales 5,702 5,544 5,461 2.8%
EBITDA 5,596 5,418 5,366 3.3%
EBIT 3,767 3,651 3,601 3.2%
Net income 2,046 2,025 1,996 1.0%
Net income attributable to the Group
1,962 1,917 1,904 2.3%
Other Key Data
Net Debt 14,104 12,527 12,590 12.6%
Order Book 29,400 31,300 30,562 (6.1%)
Market Capitalisation 28,704 20,735 19,077 38.4%
Sales by geographical area
France
Central and Eastern Europe
United Kingdom
Germany
Rest of Europe
America
Africa
Asia, Middle East, rest of the worldBenelux
0
10,000
20,000
30,000
40,000
50,000
2010201120122013
Sales by segment
Contracting Holding companies and misc.Concessions
0
10,000
20,000
30,000
40,000
50,000
2010201120122013

46
Since starting its business activities in 1983, the ACS Group has become a worldwide reference in the construction and services market with a workforce of more than 160,000 employees that includes around 13,000 engineers.
The Group’s main shareholders are Spanish investors (Corporación Financiera Alba has 16.3% and Inversiones Vesan 12.5%).
The Group’s portfolio is divided into the following segments:
ConstructionThe ACS Group’s Construction activity focuses mainly on the development of all types of civil works and building infrastructures, carried out through an extensive group of companies. This business was traditionally headed by Dragados until 2011, when the Group made new acquisitions. The integration of HOCHTIEF in 2011 matched the strategic objectives for the area based on maintaining a leadership position in Spain through Dragados and Iridium, while consolidating and expanding the Group internationally through the German listed Group. The construction business segment comprises mainly civil engineering projects, building projects, concession projects, mining and property.
Total divisions sales remained stable compared to 2012 and amounted to €29,559 million. The construction subsidiaries Dragados and HOCHTIEF represent 12.7% and 86.9%, respectively, of total revenue. On a smaller scale, the Group’s concession business is managed by Iridium and achieved sales of €106 million in 2013.
Industrial servicesThe ACS Group’s Industrial Services area focuses on the development, construction, maintenance and operation of energy and industrial infrastructures in various strategic sectors of the economy. The Industrial Services area is going through an accelerated process of evolution, as a result of which it is becoming a world
leader in applied industrial engineering, with a presence on the five continents, especially in the Americas where the division obtained 46% of total revenue in 2013.
In 2013, total divisions sales remained in line with 2012 at €7,067 million. However, both the EBITDA and EBIT margins grew by 0.5 percentage points to 13.3% and 12.5%, respectively. The total order book, which represents approximately 13 months of activity, amounted to €7,413 million.
EnvironmentThe environment area is specialised in waste and water management and treatment, as well as other related services. The logistics business, refers mainly to port logistics, intermodal transport and car logistics activities.
Urbaser is the leading company in the division. It is considered as a leader in the management of urban solid waste treatment plants in the Spanish market and is consolidating its position in the European market. In 2013 international sales represented 35.5% of total revenue while in 2012 they represented 25.8%.
Total divisions sales increased by 5% to €1,781 while the EBITDA margin grew by 1.1 percentage points to 15.4%. The total backlog of the division reached €8,443 million, of which almost 50% corresponded to international business.
Other investmentsThe ACS Group is involved in the energy sector through its investment in Iberdrola, Spain’s leading energy company and one of the world’s largest electricity companies. ACS Group is a shareholder with a 3.0% ownership interest at 31 December 2013.
ACS Group holds a 17% ownership interest in Xfera Móviles, a telecommunications service provision company in which the majority stakeholder is the TeliaSonera telecommunications group and which operates in Spain under the Yoigo brand name.
ACS Group

EPoC 2013 European powers of construction 47
Sales by geographical area
Spain
Rest of Europe
AmericaAsia - Pacific
Africa
Other OECD countries
Other countries
0
5,000
10,000
15,000
20,000
25,000
30,000
35,000
40,000
2010201120122013
Sales by segment
Construction & concessions
Environment
Industrial Services
Eliminations (other activities)
0
5,000
10,000
15,000
20,000
25,000
30,000
35,000
40,000
2010201120122013
The Group’s order book totalled €63,419 million, which is slightly lower than in 2012 and represents 18 months of activity. The construction, environment and industrial services divisions accounted for 75%, 12% and 13% of the total backlog at December 2013.
Net income attributable to the Group amounted to €702 million in 2013, a significant development after the high losses in 2012, mainly derived from the divestments made in connection to its previous 20% stake in Iberdrola.
Key Data 2013 2012 2011Variation
2013-2012%
Assets
Non-current assets 14,390 15,173 20,040 (5.2%)
Current assets 25,381 26,390 27,948 (3.8%)
Total Assets 39,771 41,563 47,988 (4.3%)
Liabilities and shareholders' equity
Shareholders' equity 5,489 5,711 6,191 (3.9%)
Non-current liabilities 11,323 10,917 13,477 3.7%
Current liabilities 22,959 24,935 28,320 (7.9%)
Total liabilities and shareholders' equity
39,771 41,563 47,988 (4.3%)
Income statement
Sales 38,373 38,396 28,472 (0.1%)
National Sales 5,245 5,975 7,823 (12.2%)
International Sales 33,128 32,421 20,649 2.2%
Construction Sales 29,558 29,683 19,801 (0.4%)
Non construction Sales 8,815 8,713 8,671 1.2%
EBITDA 3,002 3,088 2,318 (2.8%)
EBIT 1,645 1,591 1,374 3.4%
Net income 1,247 (1,405) 1,108 (188.8%)
Net income attributable to the Group
702 (1,926) 962 (136.4%)
Other Key Data
Net Debt 4,235 4,952 9,334 (14.5%)
Order Book 63,419 65,626 66,151 (3.4%)
Market Capitalisation 7,873 5,991 7,206 31.4%

48
Founded by Francis Bouygues in 1952, the Group now has operations in over 80 countries. With a workforce exceeding 128,000 employees, Bouygues’ corporate culture, shared by all of its subsidiaries, is distinguished by project management expertise and human resources management. In 2013, total EBIT grew by 5% and revenues remained stable at €33,345 million.
Its main shareholders are foreign (36.6%). French shareholders control 17.8% of the Group, employees 24.8% and SCDM (a company controlled by Martin and Oliver Bouygues) represents 20.8% of total shares.
Bouygues is structured as follows:
ConstructionBouygues Construction, Bouygues Immobilier and Colas are the Bouygues Group’s construction businesses, making it one of the leaders in the sector.
Bouygues Construction designs, builds and operates structures including public and private buildings, transport infrastructure and energy and communication networks. Total sales grew by almost 5% to €11,111 million and the EBIT margin jumped from 3.4% in 2012 to 3.9% in 2013.
As France's leading property developer, Bouygues Immobilier develops residential, commercial and retail park projects from 35 branches in France and 4 subsidiaries elsewhere in Europe. In 2013, it increased total revenues by 5% to €2,510 million. Residential developments represent 85% of total sales reported by the division.
Colas is a listed transport infrastructure company in which Bouygues holds an ownership interest of 96.6%. It operates in all areas of transport infrastructure construction and maintenance through two main operating divisions: roads, its core business, and specialised business activities. In 2013, total revenue remained in line with 2012 and amounted to €13,049 million, representing 39% of total Group sales. The
order book at December 2013 stood at €7,106 million, up 6% year-on-year. This reflects a strong momentum in international markets and the signing of several large contracts in the railways and roads activities.
Telecoms / MediaThis line of business includes TF1 and Bouygues Telecom, with total sales of €7,134 million.
TF1 is a media group whose mission is to inform and entertain via four free view channels, several pay-TV special-interest channels and a number of digital offshoots. In a fiercely competitive environment, TF1 increased its audience share in 2013. The TF1 Group’s businesses today cover the entire audiovisual chain. Sales in 2013 amounted to €2,470 million, €151 million lower than in 2012 due to a contracting television advertising market and heightened competition.
A major player in the French market for over 17 years, Bouygues Telecom constantly innovates in order to make digital life easier for its 13.1 million customers. In 2013 it launched the largest nationwide 4G network covering 63% of the population in more than 2,100 towns and cities. On 31 January 2014, Bouygues Telecom signed an agreement with SFR to share part of their mobile networks outside high population density areas in order to improve coverage and the mobile customer experience as well as generate significant savings. Despite an 11% reduction in total revenue, the EBIT margin grew to 2.7% in 2013.
OtherAlstom is a global leader in power generation, power transmission and rail transport infrastructure. Consolidated as an equity investment in the Group’s financial statements, it contributed €153 million to Bouygues' net profit in 2013, compared with €240 million in 2012. As a consequence of Alstom’s announcement of a downgrade to its free cash flow and operating margin objectives for the 2014/2015 financial year, Bouygues recognised an impairment loss of €1,404 million in the 2013 financial statements.
Bouygues SA

EPoC 2013 European powers of construction 49
Sales by geographical area
France
Rest of Europe
North America
Central/South America
Asia-Pacific
Africa and Middle East
0
5,000
10,000
15,000
20,000
25,000
30,000
35,000
2010201120122013
Sales by segment
Construction Telecoms/Media and eliminations
0
5,000
10,000
15,000
20,000
25,000
30,000
35,000
2010201120122013
In 2013, revenue and EBITDA remained stable at €33,345 million and €2,835 million, respectively. Total net loss attributable to the Group reached €757 million. However, excluding the effect of the aforementioned write-off recognised on the investment in Alstom, net income attributable to the Group would have been €647 million, 2% higher than in 2012.
The Group’s total order book grew by 2.4% to approximately €27,530 million. Bouygues Construction represents 63.8% of the total backlog, while Bouygues Immobilier and Colas represent 11.2% and 25%, respectively.
Key Data 2013 2012 2011Variation
2013-2012%
Assets
Non-current assets 17,684 20,170 19,442 (12.3%)
Current assets 16,620 16,584 15,480 0.2%
Total Assets 34,304 36,754 34,922 (6.7%)
Liabilities and shareholders' equity
Shareholders' equity 8,684 10,078 9,678 (13.8%)
Non-current liabilities 8,959 9,845 8,875 (9.0%)
Current liabilities 16,661 16,831 16,369 (1.0%)
Total liabilities and shareholders' equity
34,304 36,754 34,922 (6.7%)
Income statement
Sales 33,345 33,547 32,706 (0.6%)
National Sales 22,118 22,308 22,601 (0.9%)
International Sales 11,227 11,239 10,105 (0.1%)
Construction Sales 26,275 25,753 24,679 2.0%
Non construction Sales 7,070 7,794 8,027 (9.3%)
EBITDA 2,835 2,822 3,242 0.5%
EBIT 1,344 1,286 1,819 4.5%
Net income (648) 728 1,237 (189.0%)
Net income attributable to the Group
(757) 633 1,070 (219.6%)
Other Key Data
Net Debt 4,427 4,172 3,862 6.1%
Order Book 27,530 26,874 24,883 2.4%
Market Capitalisation 8,727 7,053 7,665 23.7%

50
Incorporated 140 years ago, HOCHTIEF is one of the leading global construction groups in the world and the main German construction company in terms of revenue. With more than 80,000 employees and a sales volume of €25,693 million in 2013, the company is represented in all the world's major markets, obtaining 92% of total revenue out of Germany.
At December 2013, ACS is the main shareholder of the Group and controls 50.35% of the share capital. 10% of the Group is controlled by Qatar Holding and 9.99% by HOCHTIEF as treasury shares . Free-floating HOCHTIEF shares accounted for 29.66% of the total at 31 December 2013.
HOCHTIEF segments its business into four divisions on a geographical basis:
HOCHTIEF AmericasThe HOCHTIEF Americas division coordinates the activities of the HOCHTIEF companies in the North American market in the building construction, civil engineering and infrastructure segments. Via its subsidiary Turner, HOCHTIEF is a leading player in general building in the USA. Since 2007 the civil engineering company Flatiron has been rounding out HOCHTIEF's presence in North America. Flatiron, with a regional presence in the United States and Canada, is among the top 10 suppliers in the US transportation infrastructure construction sector. With the acquisition of E. E. Cruz in previous years, HOCHTIEF expanded its position in the growing market for US infrastructure projects. The New York state -based company specialises in civil construction.
In 2013, total sales rose by 8% to €7,944 million representing the highest level of revenue recorded by the division for any fiscal year to date. Both building construction and civil engineering contributed to the increase. The order backlog amounted to €9,279 million and represents approximately 13 months of activity.
HOCHTIEF Asia PacificHOCHTIEF is the majority owner of the Australian Leighton Group, which together with its subsidiaries holds a leading position in the Australian, Asian, and Middle East construction markets and has operations in more than 20 countries.
The Leighton Group boasts a broad portfolio of capabilities for the infrastructure, resources and real estate market, and is also the world’s largest contract miner. Nevertheless, in prior years the Group adopted a strategic reorientation based on the disposal of non-core activities. As a result, in 2013 Leighton sold approximately 70% of its telecommunications assets, including the subsidiaries Nextgen Networks, Metronode and Infoplex.
HOCHTIEF increased its stake in Leighton Holdings Limited in 2013. The equity interest rose to 57.94% at 31 December 2013 reflecting the Group’s confidence in the further improvements of Leighton’s businesses.
With a total workforce of almost 59,000 employees, total sales went down by 3% to €14,767 million. The decrease is mainly due to exchange rate effects. Nevertheless, the division remained the most significant division in terms of revenue, representing 57% of total sales recorded by the Group. The division’s backlog fell by 18.4% primarily due to a weaker Australian dollar and the aforementioned sale of Leighton’s communication business.
HOCHTIEF EuropeThe HOCHTIEF Europe division combines the core business in Europe and selected high-growth regions around the world. The division’s main company is HOCHTIEF Solutions AG, which offers customers a full range of construction and construction-related services for infrastructure projects, real estate and facilities.
In 2013, a reorganisation of HOCHTIEF Solutions AG was initiated with the aim of steering the unit to sustained profitability. In this context, the Group sold HOCHTIEF Solutions’ Services business, which was no longer considered as part of the core business. In the same line, on 31 January 2014, HOCHTIEF announced an agreement on the sale of its stake in aurelis Real Estate.
In 2013, total division sales remained stable compared to 2012 at €2,865 million. Excluding the effect of the divestment of the HOCHTIEF Solutions’ Services business, revenue would have grown by almost 13% in the year. The order backlog fell to €4,138 million as a consequence of the aforementioned divestment and represents approximately 18 months of activity.
HOCHTIEF AG

EPoC 2013 European powers of construction 51
Sales by geographical area
Germany
Rest of Europe
Australia
America
Asia
Africa
0
5,000
10,000
15,000
20,000
25,000
30,000
2010201120122013
Sales by segment
HOCHTIEF Americas
HOCHTIEF Asia Pacific
HOCHTIEF Europe
Other
0
5,000
10,000
15,000
20,000
25,000
30,000
2010201120122013
OtherThe Group’s other businesses include Services and Concessions. Its portfolio comprises roads, schools, police facilities, community centres, barracks and geothermal projects.
The order book at December 2013 had decreased by 19.8% to €39,940 million partially due to the divestments accomplished and the strong prior-year figure, which was bolstered by large order volumes in building construction and the roads segment.
2013 net attributable profit amounted to €171 million, which is 8.4% higher than in 2012. Adjusted for one-off items such as the impacts of the divestments made, restructuring expenses, impairment losses on investments, and other items, consolidated net operating profit would have been €207 million.
Key Data 2013 2012 2011Variation
2013-2012%
Assets
Non-current assets 3,780 4,838 5,214 (21.9%)
Current assets 10,977 12,124 10,582 (9.5%)
Total Assets 14,757 16,962 15,796 (13.0%)
Liabilities and shareholders' equity
Shareholders' equity 3,294 4,244 4,110 (22.4%)
Non-current liabilities 3,617 3,738 3,199 (3.2%)
Current liabilities 7,846 8,980 8,487 (12.6%)
Total liabilities and shareholders' equity
14,757 16,962 15,796 (13.0%)
Income statement
Sales 25,693 25,528 23,282 0.6%
National Sales 2,011 1,857 2,055 8.3%
International Sales 23,682 23,671 21,227 0.0%
Construction Sales 25,575 25,400 23,131 0.7%
Non construction Sales 118 128 151 (7.8%)
EBITDA 1,909 1,722 845 10.9%
EBIT 859 595 626 44.4%
Net income 545 385 (168) 41.6%
Net income attributable to the Group
171 158 (160) 8.2%
Other Key Data
Net Debt 194 1,164 990 (83.3%)
Order Book 39,940 49,790 48,670 (19.8%)
Market Capitalisation 4,779 3,383 3,442 41.3%

52
The origin of the Company dates back to 1887 when Aktiebolaget Skånska Cementgjuteriet was established and started manufacturing concrete products. More than 125 years later, Skanska is one of the world’s leading project development and construction groups, with experience in construction, development of commercial properties and residential projects as well as public-private partnerships. The company operates in selected markets in the Nordic region, other European countries and in the Americas. With a workforce of 57,000 employees, Skanska is the largest Swedish construction group based on revenue.
Skanska’s main shareholders are Swedish financial and institutional companies as well as private Swedish individuals that together own 65% of the Group.
In 2013, total sales grew by 6.2% to €15,776 million mainly due to the good performance recorded by the construction and residential development divisions. 25% of total revenues were obtained in Sweden while the United States represents 33% of total sales.
The Group’s structure separates construction, which represented 93% of the Group’s total sales in 2013, from its other businesses, which can be subdivided into residential development, commercial property development and infrastructure development.
ConstructionSkanska's construction business executes building, civil and residential construction work. It also performs commissions of a service-related nature, such as construction management services and facility operation and maintenance.
In 2013, total division sales rose by 3% to €14,737 million, mainly due to the good performance recorded in the Americas, where the segment obtained more than 40% of total income. Among regions, despite the reduction in sales recorded in the Nordic area, the operating margin rose from 2.9% to 3.5% in 2013. Skanska has strong roots in the Czech Republic, Poland and the UK. Total sales in Europe fell by 6% mainly as a result of the continued decline in the Czech market. Regarding the Americas, Skanska is one of the leading construction companies in the US for building and civil
construction. Total sales in the region grew by 10% to €6,040 million while the operating margin rose to 3.1%.
In 2013, the company has completed various acquisitions. In September 2013, Skanska acquired 100% of the shares of the Swedish company Birka Markbyggnad AB, a leading groundwork company. In October 2013, the Group completed the acquisition of Atkins’ Highway Services Division.
Residential developmentSkanska develops modern homes in attractive and sustainable areas. The Group has performed residential development work in the Nordic countries, the Czech Republic and Slovakia for many years. In recent years the Company has expanded its residential development operations to Poland and the United Kingdom. In 2013, 3,400 Skanska homes were sold.
Revenue in this business stream increased by 6% in comparison with 2012 and amounted to €1,065 million in 2013. The Nordic region represented 92% of total division sales.
Commercial property developmentThe commercial property development division reached record levels in 2013 with 30 ongoing projects in markets such as the Nordic countries, Central Europe and the United States. This project development work focuses on three types of products: office properties, shopping malls and logistics properties or distribution centres.
Total segment sales fell by 8% to €717 million, mainly due to the divestments performed in 2013, such as the Gröna Skrapan office property in Gothenburg and the office property Post Oak Boulevard in Houston.
Infrastructure developmentSkanska Infrastructure Development focuses on three segments: roads, including bridges and tunnels; social infrastructure, such as hospitals and schools; and industrial facilities, such as power stations. Currently, its portfolio comprises projects in the Nordic countries, the UK, the US, Poland and Chile.
Revenue in the Skanska Infrastructure Development division comes mainly from Skanska’s share of income
Skanska
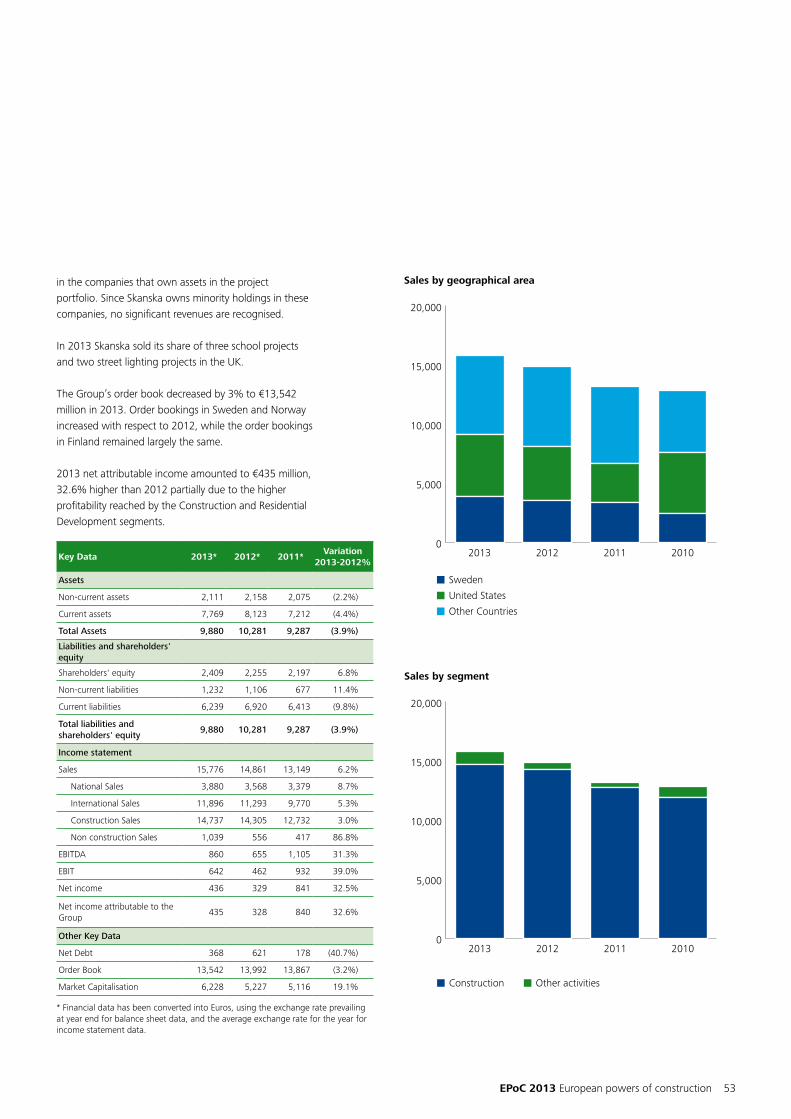
EPoC 2013 European powers of construction 53
Sales by geographical area
Sweden
United States
Other Countries
0
5,000
10,000
15,000
20,000
2010201120122013
Sales by segment
Construction Other activities
0
5,000
10,000
15,000
20,000
2010201120122013
in the companies that own assets in the project portfolio. Since Skanska owns minority holdings in these companies, no significant revenues are recognised.
In 2013 Skanska sold its share of three school projects and two street lighting projects in the UK.
The Group’s order book decreased by 3% to €13,542 million in 2013. Order bookings in Sweden and Norway increased with respect to 2012, while the order bookings in Finland remained largely the same.
2013 net attributable income amounted to €435 million, 32.6% higher than 2012 partially due to the higher profitability reached by the Construction and Residential Development segments.
Key Data 2013* 2012* 2011*Variation
2013-2012%
Assets
Non-current assets 2,111 2,158 2,075 (2.2%)
Current assets 7,769 8,123 7,212 (4.4%)
Total Assets 9,880 10,281 9,287 (3.9%)
Liabilities and shareholders' equity
Shareholders' equity 2,409 2,255 2,197 6.8%
Non-current liabilities 1,232 1,106 677 11.4%
Current liabilities 6,239 6,920 6,413 (9.8%)
Total liabilities and shareholders' equity
9,880 10,281 9,287 (3.9%)
Income statement
Sales 15,776 14,861 13,149 6.2%
National Sales 3,880 3,568 3,379 8.7%
International Sales 11,896 11,293 9,770 5.3%
Construction Sales 14,737 14,305 12,732 3.0%
Non construction Sales 1,039 556 417 86.8%
EBITDA 860 655 1,105 31.3%
EBIT 642 462 932 39.0%
Net income 436 329 841 32.5%
Net income attributable to the Group
435 328 840 32.6%
Other Key Data
Net Debt 368 621 178 (40.7%)
Order Book 13,542 13,992 13,867 (3.2%)
Market Capitalisation 6,228 5,227 5,116 19.1%
* Financial data has been converted into Euros, using the exchange rate prevailing at year end for balance sheet data, and the average exchange rate for the year for income statement data.

54
Since its foundation in 1844, Eiffage has become a leading figure in the European concessions and public works sector. The combined experience of more than 70,000 employees helped Eiffage to generate revenues of €14,264 million, of which 16% related to international projects in around fifteen countries mainly in Europe.
Some 85% of Eiffage employees in France are also shareholders of the Group. The remaining shareholders are mainly institutional investors, with 31.3%, and a free float of 38.2%.
Eiffage operates through five business lines:
Concessions and public-private partnerships (PPPs)Eiffage Concessions continues to affirm its status as a major player in the area of public-private partnerships (PPP). Through such partnerships, the Eiffage Group is able to finance, design, build and maintain complex facilities. The subsidiaries APRR and AREA operate toll and toll-free motorways under concession from the State.
The division’s total sales grew by 4% to €2,261 million, representing 15.9% of total Group revenues. The EBIT margin grew by 3 percentage points to 58%.
ConstructionEiffage Construction is a major player in its sector, with a comprehensive range of businesses relating to construction, urban and property development, as well as works & services and facility management. Eiffage Construction provides a comprehensive, multi-product range of services to support customers at each stage of their projects. Eiffage’s construction division operates through 11 regional divisions as well as locations in the Benelux countries, Portugal, Poland and Slovakia.
The Construction division recorded a 2.2% decrease in sales to €3,715 million, mainly due to a temporary dip in activity in France. The Gabonese Parliament and the Michelin research centre are some of the new orders recorded in 2013.
Public worksEiffage Travaux Publics, the Group's road construction and civil engineering division, has expertise across the full spectrum of businesses relating to road and rail construction, civil engineering, earthworks, drainage and environmental works.
In France, the division is organised into three business lines: Regional Roads, Regional Civil Engineering and Major Projects. The company also carries on activities on the Iberian peninsula and in Germany and Senegal.
The Public Works division recorded a 7% increase in sales to €4,215 million, due notably to the ramping up of work on the Bretagne – Pays de la Loire high-speed rail line project, which is now underway.
EnergyThrough its subsidiaries Clemessy and Eiffage Energie, the division provides comprehensive turnkey solutions including the design, construction, operation and maintenance of special purpose and multi-technical facilities for all sectors of activity.
The Energy division recorded a 2.2% decrease in sales to €3,159 million, due chiefly to France, which recorded a 3.9% decrease, whereas sales contributed by the rest of Europe were stable and sales contributed by the rest of the world increased sharply, up 81%.
MetalEiffage Construction Métallique and Eiffel Industrie specialise in different business lines: civil engineering structures, façades, construction, mechanical engineering, offshore, sheet metal work, industrial maintenance, valves and pipework.
The Metal division recorded a 2.5% increase in revenues to €914 million thanks to the good progress of the work on the Ofon offshore platform for Total in Nigeria and to the acquisition in September 2013 of the main companies of the Smulders Group, which recorded sales of €72 million in 2013.
Eiffage

EPoC 2013 European powers of construction 55
Sales by geographical area
France
Rest of Europe
Other Countries
0
3,000
6,000
9,000
12,000
15,000
2010201120122013
Sales by segment
Construction
Concessions
Public works
Energy
Metal
0
3,000
6,000
9,000
12,000
15,000
2010201120122013
The Group’s order book reached €11,740 million in 2013. While the order book declined slightly compared with 2012, it is equivalent to nearly 12 months of activity.
In 2013, net attributable income grew by almost 17% to €257 million and it is mainly generated by its concession and construction divisions.
Key Data 2013 2012 2011Variation
2013-2012%
Assets
Non-current assets 18,715 18,940 18,950 (1.2%)
Current assets 7,485 8,045 8,220 (7.0%)
Total Assets 26,200 26,985 27,170 (2.9%)
Liabilities and shareholders' equity
Shareholders' equity 2,704 2,318 2,347 16.7%
Non-current liabilities 14,508 15,708 16,182 (7.6%)
Current liabilities 8,988 8,959 8,641 0.3%
Total liabilities and shareholders' equity
26,200 26,985 27,170 (2.9%)
Income statement
Sales 14,264 14,035 13,732 1.6%
National Sales 12,034 11,889 11,579 1.2%
International Sales 2,230 2,146 2,153 3.9%
Construction Sales 7,930 7,739 7,670 2.5%
Non construction Sales 6,334 6,296 6,062 0.6%
EBITDA 2,107 1,972 1,980 6.8%
EBIT 1,318 1,199 1,104 9.9%
Net income 322 257 263 25.3%
Net income attributable to the Group
257 220 205 16.8%
Other Key Data
Net Debt 12,579 12,469 12,645 0.9%
Order Book 11,740 12,170 13,470 (3.5%)
Market Capitalisation 3,743 2,926 1,630 27.9%

56
Founded in 1929, the Colas Group operates in every aspect of construction and maintenance of roads and other types of transport infrastructure (air, rail and marine transport), as well as on projects involving urban development and recreational facilities. With a workforce of approximately 61,000 employees, the Group operates in 50 countries across five continents.
Colas' main shareholder is Bouygues, which controls 96.6% of the Group.
In 2013, the Group’s sales remained stable compared to 2012 and amounted to €13,049 million. Almost 45% of total revenue is obtained abroad, mainly in Europe as well as the United States.
The Group boasts two operational segments: Roads, its core business; and Specialised activities, which are complementary to its Roads business.
RoadsIt includes the construction and maintenance of roads, highways, runways, ports, logistics hubs, urban development, reserved lane public transport networks for buses and tramways, recreational facilities, environmental projects and civil engineering and building operations in certain regions. It also carries out upstream activities that involve the production and recycling of construction materials through its tight-knit network of production sites.
In 2013, total division sales fell by 2% to €10,567 million mainly due to the reduction of activity in North America. Cuts in infrastructure investments in some regions as well as particularly harsh weather during the first half of the year impacted the Group’s North American activities. Almost 50% of revenues are obtained in France while North America represents approximately 23% of total division revenue.
Colas
Specialized business activitiesThis division includes various lines of business:
The Group's Waterproofing business is performed via Smac and its subsidiaries. Waterproofing consists of the production of impervious membranes, and work involving roofing, siding, cladding, waterproofing of buildings, sidewalks and roadways with mastic asphalt. In 2013 it generated revenue of €672 million, 4% higher than in 2012. This business is the most significant in the division, and it represents 27% of total segment sales.
The Group's Railways activities are performed by Colas Rail. The Railways division is dedicated to the construction, renewal and maintenance of railway networks. During 2013, sales increased by 19% to €767 million mainly due to the growth reached in both domestic and international markets.
Sales of refined products are mainly carried out by the subsidiary Société de la Raffinerie de Dunkerque. During 2013, total sales rose by 13% to €487 million. All income in the division is generated in Europe.
The Road Safety and Signalling business is operated through Aximum and its subsidiaries. It specialises in the manufacture, installation and maintenance of road equipment. Total revenue fell by 3% to €337 million due to the reduction of activity in France.
The Pipelines sector is responsible for the installation and maintenance of pipelines for fluids. This business is carried out by the subsidiary Spac. In 2013 revenue was down slightly to €203 million.
The Group’s total order book grew by 6% and amounted to €7,106 million at December 2013. Net attributable income remained in line with 2012 at €312 million. Since 2011, net attributable income obtained by the Group has remained relatively stable.

EPoC 2013 European powers of construction 57
Sales by geographical area
France
Rest of Europe
North America
Other Countries
0
3,000
6,000
9,000
12,000
15,000
2010201120122013
Sales by segment
Road works
HoldingSpecial Division
0
3,000
6,000
9,000
12,000
15,000
2010201120122013
Key Data 2013 2012 2011Variation
2013-2012%
Assets
Non-current assets 3,465 3,860 3,881 (10.2%)
Current assets 4,867 4,465 4,374 9.0%
Total Assets 8,332 8,325 8,255 0.1%
Liabilities and shareholders' equity
Shareholders' equity 2,534 2,544 2,528 (0.4%)
Non-current liabilities 1,119 1,174 1,102 (4.7%)
Current liabilities 4,679 4,607 4,625 1.6%
Total liabilities and shareholders' equity
8,332 8,325 8,255 0.1%
Income statement
Sales 13,049 13,036 12,412 0.1%
National Sales 7,432 7,300 7,250 1.8%
International Sales 5,617 5,736 5,162 (2.1%)
Construction Sales 10,567 10,690 9,681 (1.1%)
Non construction Sales 2,482 2,346 2,731 5.8%
EBITDA 948 972 1,041 (2.5%)
EBIT 406 406 466 0.0%
Net income 315 310 341 1.6%
Net income attributable to the Group
312 302 336 3.3%
Other Key Data
Net Debt (39) 170 (28) (122.9%)
Order Book 7,106 6,704 6,472 6.0%
Market Capitalisation 4,017 3,820 3,360 5.1%

58
Strabag SE, incorporated in 1835, has become one of the Top 10 listed European construction groups, with more than 73,000 employees worldwide. Its services span all areas of the construction industry and cover the entire construction value chain. Austria and Germany are its core markets, although the Group is present via numerous subsidiaries throughout Europe and in individual cases in other continents.
Total revenue fell by 3.9% to €12,476 million in 2013 mainly due to weather-related factors. Declines in Canada, Benelux and Romania were nearly offset by increases in Hungary, Austria and Africa.
Strabag SE’s main shareholders are the Haselsteiner family (28.6%), Rasperia Trading (18.8%), Raiffeisen (14.9%) and Uniqa (14.7%).
Its portfolio is divided into North + West, South + East and International + Special Divisions operating segments.
North + WestThe North + West segment executes construction services of varying types and sizes with a focus on Germany – Strabag’s largest market – and including Poland, the Benelux countries and Scandinavia. Ground and hydraulic engineering as well as offshore wind operations also belong to this segment.
Total division sales remained in line with 2012 and amounted to €5,524 million while the operating margin grew to 1.3%. An especially positive contribution came from the business in German building construction. Improved year-on-year results were also registered in Poland.
The segment’s total backlog grew by 13% to €5,451 million representing 40% of the total order book recorded by the Group. Among new contracts, noteworthy is Thuringia’s new university clinic as well as the office building at Stuttgart airport.
South + EastThe geographic focus of the segment is Austria, Switzerland, Hungary, the Czech Republic, Slovakia, Russia and neighbouring countries and Southeast Europe. Railway construction, environmental technology and selected real estate development activities are also handled within this segment.
Total division sales decreased by 7% and amounted to €4,466 million in 2013. This reduction is partially explained by the internal shifting of the building construction activities in Poland into the North + West segment. The operating margin remained in line with 2012 at 3.1%.
International + Special divisionsThe International + Special Divisions segment includes international construction activities, tunnelling, services, real estate development, infrastructure development and the construction materials business. Concessions represent an important area of the business, with global project development activities in transportation infrastructures in particular.
Total sales amounted to €2,459 million, a decrease of 8% compared to 2012. The EBIT margin was reduced by 2 percentage points to 2.8%. The order backlog rose by 4% to €4,202 million partly due to new contracts in Germany, Chile and Canada.
The Group’s order book remained stable compared to 2012, at €13,470 million. The German market represents 38% of the total figure while Austria and Italy represent 11% and 9%, respectively.
After certain non-recurring items recorded in 2012, 2013 net attributable income amounted to €114 million, an 86% increase on 2012.
Strabag SE

EPoC 2013 European powers of construction 59
Sales by geographical area
Germany
Austria
Rest of Europe
Rest of World
0
3,000
6,000
9,000
12,000
15,000
2010201120122013
Sales by segment
North + West
South + East
International + Special Divisions
Other activities
0
3,000
6,000
9,000
12,000
15,000
2010201120122013
Key Data 2013 2012 2011Variation
2013-2012%
Assets
Non-current assets 4,416 4,547 4,534 (2.9%)
Current assets 6,145 5,591 5,852 9.9%
Total Assets 10,561 10,138 10,386 4.2%
Liabilities and shareholders' equity
Shareholders' equity 3,239 3,163 3,150 2.4%
Non-current liabilities 2,466 2,432 2,359 1.4%
Current liabilities 4,856 4,543 4,877 6.9%
Total liabilities and shareholders' equity
10,561 10,138 10,386 4.2%
Income statement
Sales 12,476 12,983 14,326 (3.9%)
National Sales 2,151 2,278 1,985 (5.6%)
International Sales 10,325 10,705 12,341 (3.5%)
Construction Sales 12,476 12,983 14,158 (3.9%)
Non construction Sales - - 168 -
EBITDA 695 608 746 14.3%
EBIT 262 207 335 26.5%
Net income 156 110 239 41.8%
Net income attributable to the Group
114 61 195 86.2%
Other Key Data
Net Debt (74) 155 (268) (147.6%)
Order Book 13,470 13,203 13,354 2.0%
Market Capitalisation 2,430 2,328 2,515 4.4%

60
Balfour Beatty is a global infrastructure group that delivers world class services essential to the development, creation and care of infrastructure assets from finance and development, through design and project management to construction and maintenance. Operating in over 80 countries, in diverse markets and economies, the Group obtains more than 50% of total revenue outside of the UK.
Balfour Beatty’s main shareholders are UK institutional investors each holding more than 3% of the Company’s shares: Prudential Plc. (5.10%), Causeway Capital Management LLC. (5.12%) and Standard Life Investments Limited (3.65%).
In 2013, total Group sales amounted to €11,914 million, a decrease of 11.3% compared to 2012 mainly due to the disposals of the UK facilities management business and European rail operations in Spain and Scandinavia.
Balfour Beatty’s activity is divided into four business lines: Construction Services, Professional Services, Support Services and Infrastructure Investments.
Construction servicesThe Group manages market leading construction businesses in the UK, the US, Hong Kong and the Middle East. Construction services include civil and ground engineering, rail engineering, building, refurbishment and fit-out and mechanical and electrical services.
In 2013, total division sales decreased by 10% to €7,740 million partly due to the divestments. The Group has decided to divest all of its European rail business. In March 2013 the Group sold the Spanish rail business while the sale of the Scandinavian rail business was announced at the end of 2013. On a like-for-like basis, total revenue would have grown by 1% in 2013. The Construction business backlog amounted to €9,260 million, representing more than 12 months of activity. At December 2013, the US market backlog was over 20% larger than the UK order book.
Professional servicesThe wide range of services provided by this segment includes project and construction management, project design and technical services. With a presence in 70 countries worldwide, Professional Services is an important foothold in the Group’s emerging markets.
In 2013, total division sales remained in line with 2012 at €1,956 million. The lower volumes in Australia were offset by the growth reached in the Americas and the Middle East, where activities are focused in the transportation sector. The total divisional order book amounted to €1,835 million, representing 11% of the total Group’s figure. The decline in the orders received from the UK market was balanced by new contracts in the Americas and the Middle East.
Support servicesThe Group’s support services include facilities management and business services outsourcing, upgrade and maintenance of water, gas and electricity networks, highway network management, operation and maintenance and rail renewals.
Total segment revenues decreased by 26% to €1,490 million, mainly as a result of the sale of the UK facilities management business to GDF Suez Energy Services. The total order book was reduced to €4,918 million. The total backlog has declined in the power and water sectors as significant contracts have been completed or are near to completion.
Infrastructure investmentsThis segment operates a portfolio of long-term PPP concessions, primarily in the education, military, health and roads/street lighting activities. This division invests in infrastructure and in geographical areas where the Group has a presence through the activities of other segments.
Despite a 9% decrease in revenues, the investments business delivered another successful year of growth in terms of profit, establishing a strong presence in new
Balfour Beatty

EPoC 2013 European powers of construction 61
Sales by geographical area
United Kingdom
America
Other Countries
0
3,000
6,000
9,000
12,000
15,000
2010201120122013
Sales by segment
Construction services
Support servicesProfessional services
Infrastructure Investments
Other
0
3,000
6,000
9,000
12,000
15,000
2010201120122013
markets. The disposals programme delivered an increase in profits from €64 million in 2012 to €97 million in 2013. The disposals include, amongst others, the sale of the 50% interests held in four schools projects in Birmingham, Bassetlaw, Stoke and Rotterdam. In spite of these disposals, the Group’s PPP investments portfolio remains substantial and diverse.
The Group’s order book was €16,019 million in 2013, of which Construction Services represented 57.8%, Support Services 30.7% and Professional Services 11.5%.
2013 net attributable losses amounted to €41 million mainly due to non-recurring items such as reorganisational costs as well as certain impairments recorded in the year.
Key Data 2013* 2012* 2011*Variation
2013-2012%
Assets
Non-current assets 3,491 3,919 3,612 (10.9%)
Current assets 3,360 3,178 3,298 5.7%
Total Assets 6,851 7,097 6,910 (3.5%)
Liabilities and shareholders' equity
Shareholders' equity 1,241 1,604 1,512 (22.6%)
Non-current liabilities 2,064 1,495 1,326 38.1%
Current liabilities 3,546 3,998 4,072 (11.3%)
Total liabilities and shareholders' equity
6,851 7,097 6,910 (3.5%)
Income statement
Sales 11,914 13,439 12,715 (11.3%)
National Sales 5,425 6,560 6,566 (17.3%)
International Sales 6,489 6,878 6,149 (5.7%)
Construction Sales 7,740 8,583 8,123 (9.8%)
Non construction Sales 4,174 4,856 4,592 (14.0%)
EBITDA 92 146 432 (37.0%)
EBIT 57 91 280 (37.4%)
Net income (41) 54 214 (175.9%)
Net income attributable to the Group
(41) 54 280 (175.9%)
Other Key Data
Net Debt 504 408 (10) 23.5%
Order Book 16,019 18,379 18,197 (12.8%)
Market Capitalisation 2,371 2,309 2,179 2.7%
* Financial data has been converted into Euros, using the exchange rate prevailing at year end for balance sheet data, and the average exchange rate for the year for income statement data.
62
Incorporated in 1880, three traditional construction companies form the historical roots of Bilfinger SE: Grün & Bilfinger AG, Julius Berger Tiefbau AG and Berlinische Boden-Gesellschaft. With a workforce of approximately 75,000 employees, Bilfinger has become an international engineering and services company with a leading position in its markets. In 2013, total group sales remained stable compared to 2012 and amounted to €8,415 million.
The main shareholders are European institutional investors, most notably several Swiss investors with a 24% interest, German investors with a 21% interest and British investors with a 13% interest.
The Bilfinger SE Group's portfolio comprises the following divisions:
Industrial servicesBilfinger is one of the world’s leading providers of integrated technical services for the process industry and the energy sector. This division offers a range of services that cover the entire lifecycle of industrial plants, from engineering to maintenance. The division expanded its portfolio in 2013 through the acquisition of GreyLogix, an automation specialist. Operations are carried out in regions such as Europe, Asia and the US.
In 2013, total division sales increased by 7% to €3,924 million while the EBITDA margin jumped to 5.9%. Germany and other European countries represent almost 80% of total sales recorded in 2013.
Power servicesBilfinger Power Services is focused on the maintenance, repair, efficiency enhancements and lifetime extensions of existing plants as well as the manufacture and assembly of components for power plant construction. In 2013, the division expanded its portfolio with the addition of turbine services by acquiring the assets of the Swiss company ESG Energy Service Group.
In 2013, total sales decreased by 4% to €1,259 million mainly attributable to the reluctance of energy suppliers to make new investments. In contrast, the EBITDA margin grew from 9.3% in 2012 to 9.8% in 2013. The European market represents around 66% of total activity while Africa represents 18% of total sales in 2013.
Building and facility servicesThis division provides technical, commercial and infrastructural real estate services in Europe, the US and MENA countries as well as worldwide services in water and wastewater technology.
Building design, construction, maintenance and management are carried out in accordance with the lifecycle approach.
During 2013, total revenue rose by 7% to €2,301 million. The total backlog grew by 7% to €2,304 million and the EBITDA margin jumped to 4.9%. With more than 22,000 employees, 87% of total revenue recorded in 2013 was generated in Europe.
ConstructionKey areas include road construction (including bridge construction), hydraulic engineering, pre-stressing technology, steel construction and foundation engineering. Civil engineering activities are centred on Germany (52%) and other European countries (41%).
In 2013, total sales were reduced by 23% to €903 million and the EBITDA margin decreased to 0.1%. Europe represents 93% of total revenue recorded by the division.
It should be noted that Bilfinger intends to part with significant portions of its civil engineering business which generated a volume of approximately €800 million in 2013. These activities are put up for sale.
The Group’s total order book remained stable compared to 2012 and amounted to €7,411 million (Industrial Services 40%, Power Services 16%, Building and Facility Services 31% and Construction 13%).
In 2013, net attributable profit fell to €173 million, partially due to the performance of the construction division that was not completely offset by the positive results recorded by other divisions.
Bilfinger SE

EPoC 2013 European powers of construction 63
Sales by geographical area
Germany
Rest of Europe
America
Africa
Asia-Pacific
0
2,000
4,000
6,000
8,000
10,000
2010201120122013
Sales by segment
Industrial Services
Power Services
Building and Facility Services
Construction
Other activities
0
2,000
4,000
6,000
8,000
10,000
2010201120122013
Key Data 2013 2012 2011Variation
2013-2012%
Assets
Non-current assets 3,134 3,519 3,091 (10.9%)
Current assets 3,398 3,331 4,629 2.0%
Total Assets 6,532 6,850 7,720 (4.6%)
Liabilities and shareholders' equity
Shareholders' equity 2,165 2,037 1,793 6.3%
Non-current liabilities 1,213 1,748 1,159 (30.6%)
Current liabilities 3,154 3,065 4,768 2.9%
Total liabilities and shareholders' equity
6,532 6,850 7,720 (4.6%)
Income statement
Sales 8,415 8,509 8,209 (1.1%)
National Sales 3,262 3,199 3,265 2.0%
International Sales 5,153 5,310 4,944 (3.0%)
Construction Sales 3,205 3,322 3,613 (3.5%)
Non construction Sales 5,210 5,187 4,596 0.4%
EBITDA 556 603 521 (7.8%)
EBIT 287 415 361 (30.8%)
Net income 176 277 396 (36.4%)
Net income attributable to the Group
173 275 394 (37.1%)
Other Key Data
Net Debt (83) 94 (313) (188.3%)
Order Book 7,411 7,422 7,833 (0.1%)
Market Capitalisation 3,752 3,360 3,032 11.7%

64
Ferrovial is the world’s leading private investor in transportation infrastructures, with a workforce of approximately 57,000 employees and operations in more than 25 countries. In 2013, Ferrovial celebrated its 60th anniversary. It is included in the prestigious Dow Jones Sustainability, FTSE4Good and Ethibel indices.
The only shareholder who controls more than 10% of the Group is Portman Baela, S.L. (controlled by the Del Pino family) which held 41.053% of the Group’s shares at the end of 2013.
The Company manages key assets such as Canada's 407 ETR highway and London's Heathrow Airport (both of which are accounted for using the equity method). Other significant transportation infrastructures managed by the Group are the Chicago Skyway and other motorways in the United States and in Europe. Ferrovial also provides municipal services to more than 800 cities and towns in Spain and to the millions who use the Madrid metro system, and the hundreds of kilometres of streets and highways where Amey performs maintenance services as well as utilities services in the United Kingdom.
Total Group sales rose by 6.2% to €8,166 million in 2013, thanks to acquisitions performed by its services divisions, particularly in the United Kingdom.
Ferrovial's activities are divided into four business lines:
ServicesFerrovial Services is an international leader in providing solutions in a range of services that include utilities, highways, waste management, rail, mining, justice solutions, social housing, facilities management and infrastructure maintenance.
Since 2013, the division is structured in three geographical areas: UK (represented by Amey and Enterprise), Spain (headed by Ferrovial Services) and international activities.
Total division revenue grew by 24% to €3,656 million mainly due to the acquisition of Enterprise in the United Kingdom and, to a lesser extent, the Chilean company Steel Ingeniería. Fully integrated since April 2013, Enterprise’s total sales and EBIT amounted to €762 million and €42 million, respectively, in the period.
ConstructionFerrovial Agroman is the flagship company heading up the construction division and is involved in all areas of construction from civil works to building and industrial works.
Construction continues to be a core activity for the Group, not only due to its solid historical trend of growth and profitability, but also because it is an excellent source of cash flow required in the diversification and international expansion process. Ferrovial has been a pioneer in the expansion of Spanish construction companies into stable international markets such as Poland or the United States where it has established a solid presence through its subsidiaries Budimex, Ferrovial Agroman US and Webber.
Total construction sales decreased by 6% to €4,064 million in 2013, mainly due to a significant fall in activity in the local market partially offset by the strong growth reached in international markets such as the United States.
AirportsThe Group activity in this segment corresponds to its stake in HAH (formerly BAA and consolidated as an equity subsidiary since 2011). Ferrovial is one of the leading private infrastructure operators in the world, with four airports in the United Kingdom: Heathrow, Glasgow, Aberdeen and Southampton.
The sale of Stansted Airport initiated in 2012 was officially concluded in February 2013. Additionally, in 2013, Ferrovial reached an agreement with the Universities Superannuation Scheme for the sale of an 8.65% ownership interest of HAH. The contribution to the Group’s net income of both divestments amounted to €137 million and €82 million, respectively.
Passenger traffic in the Group’s airports grew by 3.3% to 84.9 million passengers. This division represents 49% of total net attributable income obtained by the Group in 2013.
HighwaysFerrovial, through its subsidiary Cintra, is one of the leading private developers of transport infrastructure in the world in terms of the number of projects and
Ferrovial

EPoC 2013 European powers of construction 65
Sales by geographical area
Spain
United Kingdom
The United States
Poland
Other countries
0
3,000
6,000
9,000
12,000
15,000
2010201120122013
Sales by segment
Services Airports
OthersConstruction
Highways
0
3,000
6,000
9,000
12,000
15,000
2010201120122013
investment volume. The Group operates infrastructure in countries such as Spain, Canada and the United States.
In 2013, total revenue grew by 13% to €429 million partially due to the start of operations of SH-130 as well as the increase of toll tariffs in Chicago Skyway.
The Group’s order book rose by 19% to €25,616 million. The contraction of the construction division’s order book was offset by the growth achieved by the services division in both domestic and international markets.
2013 net attributable income remained in line with 2012 and amounted to €727 million. The Construction and Airport divisions represented almost 80% of total income recorded in 2013.
Key Data 2013 2012 2011Variation
2013-2012%
Assets
Non-current assets 17,142 16,637 17,517 3.0%
Current assets 5,678 5,580 5,455 1.8%
Total Assets 22,820 22,217 22,972 2.7%
Liabilities and shareholders' equity
Shareholders' equity 6,577 6,118 6,288 7.5%
Non-current liabilities 11,230 11,117 11,107 1.0%
Current liabilities 5,013 4,982 5,577 0.6%
Total liabilities and shareholders' equity
22,820 22,217 22,972 2.7%
Income statement
Sales 8,166 7,686 7,446 6.2%
National Sales 2,590 2,903 3,369 (10.8%)
International Sales 5,576 4,783 4,077 16.6%
Construction Sales 4,064 4,326 4,244 (6.1%)
Non construction Sales 4,102 3,360 3,202 22.1%
EBITDA 934 927 819 0.8%
EBIT 701 708 627 (1.0%)
Net income 701 646 1,268 8.5%
Net income attributable to the Group
727 710 1,269 2.4%
Other Key Data
Net Debt 5,352 5,106 5,171 4.8%
Order Book 25,616 21,483 22,422 19.2%
Market Capitalisation 10,317 8,215 6,840 25.5%

66
Incorporated in 1869, the Royal BAM Group is a successful European construction group listed on the NYSE Euronext Amsterdam. With around 25,000 employees, BAM is responsible for the implementation of thousands of projects every year, with overall sales of €7,042 million in 2013.
Four investors hold ownership interests of 5% or more in the Group: A. Van Herk controls 10%, while the institutional investors ING Groep NV, Delta Lloyd N.V. and Delta Lloyd Deelnemingen Fonds N.V. control 9.8%, 5.6% and 5.2%, respectively.
The BAM Group's portfolio comprises the following divisions:
ConstructionThe Royal BAM Group is active in the construction, mechanical and electrical services sector in the Dutch, Belgian, UK, Irish, Swiss and German markets. In addition to carrying out non-residential construction work in all the home markets, BAM operating companies also carry out residential construction contracts (mainly in the Netherlands, Belgium and Germany). BAM International also carries out non-residential construction projects in the Middle East and Indonesia in particular.
Bam Utiliteitsbouw and BAM Woningbouw are the flagship companies of the Group in the construction segment. BAM Utiliteitsbouw focuses on the commercial and technical development, preparation and construction of non-residential projects in the Netherlands, as well as on the maintenance and management of those projects. It operates from ten regional offices and has around 1,650 employees. BAM Woningbouw employs a workforce of 1,450 to carry out consultancy, development, construction, service, maintenance and renovation work.
Total division revenue was down by €269 million (9.2%) to €2,767 million partially due to the further deterioration in Dutch market conditions in both residential and non-residential segments. The lower volume of activity and some major losses on large projects have reduced the division's result to €7 million.
Property investmentsBAM owns property companies in the Netherlands (AM), the United Kingdom (BAM Properties), Ireland (BAM Property) and Belgium (Kaïros).
In Property, total revenue fell by 54% to €236 million. As expected, there was a further decline of the number of homes sold in 2013 in the Netherlands to 1,365 compared to 1,906 in 2012 and 2,230 in 2011.
Civil engineeringRoyal BAM Group operates in the civil engineering sector in the Dutch, Belgian, UK, Irish and German markets and is also active in Luxembourg. BAM International carries out specialised construction and civil engineering works worldwide.
BAM Civil Engineering’s total revenue went up by 10% to €3,748 million in 2013. Revenue in the Netherlands fell by 5% which was offset by the growth achieved worldwide. The EBIT margin remained stable at approximately 1.3%.
Rest of businessBAM PPP is responsible for the Royal BAM Group’s involvement in the European Public-Private Partnerships (PPP) market and it is active in the roads, rail, education, healthcare, judicial and general accommodation sectors. At the end of 2013 there were 38 PPP projects in the portfolio. BAM PPP retains interest in 31 projects while the remaining 7 contracts involve a very limited amount of shareholders’ equity.
BAM’s order book fell by 9.1% to €10,000 million. Of the total order book, €5,700 million are expected to be carried out in 2014. Construction and Civil Engineering represent approximately 38% and 48% of the total backlog at the end of 2013.
After the losses recorded in 2012, total net attributable income amounted to €46 million in 2013. The improvement relates specifically to the Property segment, which recorded significant impairment losses in 2012.
BAM Group

EPoC 2013 European powers of construction 67
Sales by segment
Construction Civil Engineering
Property Investments Other activities
0
1,000
2,000
3,000
4,000
5,000
6,000
7,000
8,000
2010201120122013
Sales by geographical area
Netherlands
United Kingdom
Belgium
Germany
Ireland
Other countries
0
1,000
2,000
3,000
4,000
5,000
6,000
7,000
8,000
2010201120122013
Key Data 2013 2012 2011Variation
2013-2012%
Assets
Non-current assets 1,632 2,334 2,229 (30.1%)
Current assets 3,685 4,330 4,989 (14.9%)
Total Assets 5,317 6,664 7,218 (20.2%)
Liabilities and shareholders' equity
Shareholders' equity 933 924 1,163 1.0%
Non-current liabilities 1,024 1,800 2,460 (43.1%)
Current liabilities 3,360 3,940 3,595 (14.7%)
Total liabilities and shareholders' equity
5,317 6,664 7,218 (20.2%)
Income statement
Sales 7,042 7,404 7,920 (4.9%)
National Sales 2,722 3,199 3,654 (14.9%)
International Sales 4,320 4,205 4,266 2.7%
Construction Sales 6,857 6,960 7,643 (1.5%)
Non construction Sales 185 444 277 (58.4%)
EBITDA 104 (204) 257 151.0%
EBIT 16 (293) 151 105.5%
Net income 47 (187) 128 125.1%
Net income attributable to the Group
46 (187) 126 124.6%
Other Key Data
Net Debt 383 1,138 1,178 (66.3%)
Order Book 10,000 11,000 10,400 (9.1%)
Market Capitalisation 1,019 779 759 30.8%

68
FCC was founded in 1992 following the merger of two companies: Construcciones y Contratas (1944) and Fomento de Obras y Construcciones (1900). With a workforce of approximately 80,000 employees, the Group obtains 42% of total sales outside Spain.
At the end of 2013, FCC’s most significant shareholder was Esther Koplowitz, through the Company B-1998, S.L., which controls 50.03% of the Group. Bill Gates owns 6% of the Group through different companies controlled by him.
With revenues of €6,727 million, the Group’s activities include environmental services and water management, construction of large infrastructure, cement production and renewable energy production. In addition, the FCC Group operates in the real estate sector through its 37.03% interest in Realia Business, S.A., whose main activity is the development of housing and the office rental market. The Group operates in the concession sector through its 50% stake in Globalvia Infraestructuras, S.A.
Environmental servicesServices provided by this division include, among others, urban sanitation, industrial waste treatment and energy recovery from waste. It represents 41% of total sales representing the Group’s main line of business in terms of revenue.
In 2013, total sales decreased by 6% to €2,770 million as a result of divestments under way (FCC Environmental USA) as well as the contraction of the industrial waste business.
Integrated water managementThis division, through its subsidiary Aqualia, provides services related to the integral water cycle: collection, treatment and distribution of water for human consumption; wastewater collection, filtering and treatment; design, construction, operation and maintenance of water infrastructure for municipal, industrial, agricultural and other services.
The water division accounts for 26.6% of FCC’s EBITDA. Public concessions for end-to-end water management (capture, distribution and treatment) account for 92% of total revenues while water infrastructure design and construction represent the remaining 8%. Total revenues grew slightly to €930 million in 2013. Among the new contracts obtained, noteworthy is a 25-year concession in Jerez that is worth approximately €900 million.
ConstructionThe Construction sector specialises in infrastructure works, construction and related sectors such as highways, roads and airports.
In 2013, total division sales fell by 58%. The sharp adjustment in public spending on infrastructure reduced revenues in Spain by approximately 26%. International sales decreased by 73% due to the deconsolidation of Alpine, which was partially offset by the good performance in some Latin American countries such as Panama, Peru, Chile and Colombia. It should be noted that the Arriyadh Development Authority awarded the FCC-led consortium one of three contracts to build the Riyadh metro, the longest subway system under development in the world.
CementThis area engages in the operation of quarries and mineral deposits and the manufacture of cement, lime, plaster and precast products. In the last two years various products have been rolled out.
Total revenues fell by 17% to €541 million. Revenues in Spain decreased by 32.8% partly explained by the deconsolidation of Cementos Lemona and the closure of less profitable concrete, mortar and aggregate plants. Revenues in the US increased by 9.1% and the US now accounts for one third of the revenue recorded by the division.
The Group’s total order book remained in line with 2012 amounting to €32,865 million. The Water division represents 44% of the total backlog while construction and environmental services account for 20% and 36%, respectively.
FCC

EPoC 2013 European powers of construction 69
Sales by geographical area
Spain
Europe
America and other countries
0
3,000
6,000
9,000
12,000
15,000
2010201120122013
Sales by segment
Environmental Services
Versia
Construction
Cement
Eliminations
Sales by segment
0
3,000
6,000
9,000
12,000
15,000
2010201120122013*
* Since 2013, Versia does not constitute a segment and Integral Water Management is reported as a business unit.
Total net losses attributable to the Group increased by 46.5% to €1,506 million mainly due to the write-offs recognised in connection with its subsidiary Alpine and other subsidiaries in the services and energy divisions.
Key Data 2013 2012 2011Variation
2013-2012%
Assets
Non-current assets 8,442 10,578 11,074 (20.2%)
Current assets 7,160 9,129 11,373 (21.6%)
Total Assets 15,602 19,707 22,447 (20.8%)
Liabilities and shareholders' equity
Shareholders' equity 243 1,721 2,915 (85.9%)
Non-current liabilities 3,472 7,547 7,535 (54.0%)
Current liabilities 11,887 10,439 11,997 13.9%
Total liabilities and shareholders' equity
15,602 19,707 22,447 (20.8%)
Income statement
Sales 6,727 11,152 11,755 (39.7%)
National Sales 3,910 4,886 5,591 (20.0%)
International Sales 2,817 6,266 6,164 (55.0%)
Construction Sales 2,589 6,148 6,686 (57.9%)
Non construction Sales 4,138 5,004 5,069 (17.3%)
EBITDA 720 753 1,252 (4.4%)
EBIT (303) (403) 401 (24.8%)
Net income (1,530) (1,092) 3 40.1%
Net income attributable to the Group
(1,506) (1,028) 108 46.5%
Other Key Data
Net Debt 5,976 7,088 6,277 (15.7%)
Order Book 32,865 33,576 35,238 (2.1%)
Market Capitalisation 2,059 1,193 2,551 72.6%

70
Although the NCC Group was legally formed in 1989, JCC and ABV have been assembled under a single roof and a shared logo since 1988. NCC has become one of the leading construction and property development companies in the Nordic region with a workforce of approximately 7,000 employees and overall sales of €6,684 million. Approximately 53% of the year's sales came from operations carried out in Sweden.
Two investors hold ownership interests of 5% or more in the Group. Nordstjernan AB is the largest individual shareholder, with 21.6% of the share capital and 65% of the voting rights, while SEB Funds controls 6.2% of the share capital and 1.9% of the voting rights.
The Group is structured as follows:
Construction and civil engineeringConstruction and civil engineering operations are divided into four business areas: NCC Construction Sweden, NCC Construction Denmark, NCC Construction Finland and NCC Construction Norway. The segment specialises in the building of residential and office properties, industrial facilities, roads and civil engineering structures.
In 2013, total sales declined by 4% to €3,800 million mainly due to the contraction in the Swedish market that was not completely offset by the growth achieved in other regions such as Norway. The EBIT margin remained stable at approximately 2.5%.
Road business / IndustrialThe division’s operations are based on the production of stone materials and asphalt, as well as asphalt paving and road services. NCC delivers aggregates and asphalts for numerous applications, ranging from major infrastructure projects to small roads.
Total sales remained in line with 2012 at €1,292 million. Asphalt and paving represent 63% of total division activity in 2013 while stone materials and road services represent 17% and 20%, respectively. Geographically, Sweden is the largest single market, representing 50% of total revenue recorded.
HousingNCC’s housing development business is conducted in eight geographical markets in the Nordic region as well as in Germany, St. Petersburg and the Baltic countries.
In 2013, total division sales increased by 5% to €1,043 million due to higher revenues from both housing sales to investors as well as land sales. During the period, 2,951 housing units for private customers (2,845 in 2012) and 903 housing units for the investor market (998 in 2012) were sold.
Property developmentNCC Property Development develops and sells commercial properties in defined growth markets in the Nordic region, Estonia and Latvia. Operations are focused on sustainable office, retail and logistics properties in attractive locations.
Total division sales grew by 68% to €537 million. While in 2012 nine projects were completed by the division, a total of eleven projects were recognised in profit or loss in 2013: five in Sweden, three in Denmark, two in Finland and one in Norway.
The Group’s order book remained in line with 2012 and totalled €5,377 million representing approximately 10 months of activity. The Construction division accounted for 69% of the total order book.
NCC’s 2013 net attributable income amounted to €230 million, a 5.5% increase on 2012, mainly due to the positive performance of NCC’s Property Development division.
NCC

EPoC 2013 European powers of construction 71
Sales by geographical area
Sweden
Denmark
Finland
Norway
Other Countries
0
1,000
2,000
3,000
4,000
5,000
6,000
7,000
8,000
2010201120122013
Sales by segment
Construction and Civil Engineering
Industrial Operations
Housing
Property Development
Other activities
0
1,000
2,000
3,000
4,000
5,000
6,000
7,000
8,000
2010201120122013
Key Data 2013* 2012* 2011*Variation
2013-2012%
Assets
Non-current assets 667 829 730 (19.5%)
Current assets 3,712 3,711 2,964 0.0%
Total Assets 4,379 4,540 3,694 (3.5%)
Liabilities and shareholders' equity
Shareholders' equity 979 1,047 931 (6.5%)
Non-current liabilities 1,122 1,296 874 (13.5%)
Current liabilities 2,278 2,197 1,889 3.7%
Total liabilities and shareholders' equity
4,379 4,540 3,694 (3.6%)
Income statement
Sales 6,684 6,575 5,818 1.7%
National Sales 3,520 3,600 3,207 (2.2%)
International Sales 3,164 2,975 2,611 6.3%
Construction Sales 6,672 6,569 5,813 1.6%
Non construction Sales 12 5 4 140.0%
EBITDA 309 292 227 5.9%
EBIT 310 291 223 6.2%
Net income 230 218 145 5.4%
Net income attributable to the Group
230 218 145 5.5%
Other Key Data
Net Debt 638 706 444 (9.6%)
Order Book 5,377 5,341 5,197 0.7%
Market Capitalisation 2,568 1,720 1,474 49.3%
* Financial data has been converted into Euros, using the exchange rate prevailing at year end for balance sheet data, and the average exchange rate for the year for income statement data.

72
Acciona is one of Spain's leading corporations. The Company was set up over a century ago and is made up of more than 30,000 employees and has a presence in more than 30 countries on five continents.
In 2013, total sales fell by 5.8% to €6,607 million as the growth achieved by the Group’s water division failed to completely offset the decline of the construction business in both Spanish and international markets.
In 2013, two shareholders held a significant ownership interest in the company: Tussen de Grachten, BV (27.8%) and Entreazca, BV (27.4%). Both shareholders belong to the Entrecanales family (founders of the Group).
In 2013, the Group altered its internal organisational structure, mainly through the grouping of several activities under the Services division, and incorporating Water as a separate division. In addition, the Property (Real Estate) and Transmediterranea activities have been classified under the Other Activities division. As a result Acciona is currently structured as follows:
InfrastructureAcciona Infrastructure is capable of taking on all kinds of construction projects from engineering to works execution and maintenance, as well as public works, concessions management and building.
Construction and engineering revenues fell by 19.1% year-on-year to €2,598 million in 2013, mainly due to a decrease in the construction activity in Spain and internationally.
Concessions revenues grew by 16.9% to €135 million while the EBITDA margin was reduced by 8 percentage points to 43.7% as a result of the sale of the concession of the University of San Luis de Potosí in Mexico as well as the sale of the Royal Jubilee Hospital in Canada.
This segment represents 41% of the Group’s total sales.
EnergyAcciona Energy is an energy operator on a global scale. It focuses exclusively on renewables and is a major player in five types of clean energy: wind, solar thermal (CSP), PV solar, hydraulic and biomass.
In 2013, while total revenues remained constant with respect to 2012 at €2,120 million, the operating margin was severely impacted due to the write-off recorded in connection with the company's renewable assets arising from the changes in the Spanish regulation of the energy sector.
WaterAcciona Agua is involved in the water treatment industry offering the design, construction and operation of drinking water treatment plants, desalination facilities, wastewater treatment plants and tertiary treatment plants for water reuse. Acciona Agua also offers end-to-end service management covering each step of the water treatment process.
The Water division delivered a good performance in 2013 achieving an increase in sales of 15.6%. Its EBITDA reached €54 million helped by the design & construction and operation & maintenance activities.
ServiceAcciona Service encompasses under a new division a range of services that the Group was already providing: airport handling services, facility services, logistic services, waste management and others.
The division reported an increase in revenues of 8.3% in 2013, reaching €641 million boosted by the higher volumes of facility services. Total EBITDA amounted to €20 million, 13.5% above 2012, thanks to a margin improvement in 2013 within the handling activity.
Other activitiesThis division includes activities such as real estate, wineries, Bestinver, Transmediterránea and others. Total revenues and the operating margin grew in 2013 to €641 million and 3.2%, respectively.
Transmediterránea, focused on the sea transportation of passengers and goods, saw its revenues fall by 4.2% to €419 million in 2013.
Through its subsidiary Hijos de Antonio Barceló, Acciona produces top quality wines. Total sales amounted to €38 million, down 4.9% on 2012.
Acciona

EPoC 2013 European powers of construction 73
Real estate business remained in line with 2012. Total sales amounted to €66 million while the EBITDA margin reached 4.5%. The housing stock was reduced by 84 units, from 912 in December 2012 to 828 in December 2013.
Bestinver is a financial services company dedicated to asset management services. Total sales grew by 39.4% to €113 million in 2013.
The Group’s order book decreased by 9% to €16,453 million in 2013. By segment, the construction order book amounted to €5,723 million (35%) while the water division’s order book amounted to €10,730 million (65%).
2013 net attributable loss amounted to €-1,972 million as a consequence of the write-off recorded in connection with the company’s renewable assets.
Sales by geographical area
Spain Rest of OECD countries
Rest of European Union Other countries
0
1,000
2,000
3,000
4,000
5,000
6,000
7,000
8,000
2010201120122013
Sales by segment
Infrastructure
Energy
Water, Service and Other Activities
0
1,000
2,000
3,000
4,000
5,000
6,000
7,000
8,000
2010201120122013
Key Data 2013 2012 2011Variation
2013-2012%
Assets
Non-current assets 11,526 13,971 14,020 (17.5%)
Current assets 5,258 5,848 6,307 (10.1%)
Total Assets 16,784 19,819 20,327 (15.3%)
Liabilities and shareholders' equity
Shareholders' equity 3,399 5,508 5,645 (38.3%)
Non-current liabilities 8,123 8,871 8,785 (8.4%)
Current liabilities 5,262 5,440 5,897 (3.3%)
Total liabilities and shareholders' equity
16,784 19,819 20,327 (15.3%)
Income statement
Sales 6,607 7,016 6,646 (5.8%)
National Sales 3,894 4,051 4,308 (3.9%)
International Sales 2,713 2,965 2,338 (8.5%)
Construction Sales 2,733 3,394 3,626 (19.5%)
Non construction Sales 3,874 3,622 3,020 7.0%
EBITDA 1,228 1,431 1,312 (14.2%)
EBIT (1,771) 646 632 (374.1%)
Net income (2,028) 184 170 (1202.4%)
Net income attributable to the Group
(1,972) 189 202 (1143.6%)
Other Key Data
Net Debt 6,715 7,482 6,991 (10.3%)
Order Book 16,453 18,092 11,280 (9.1%)
Market Capitalisation 2,391 3,219 4,241 (25.7%)

74
Peab is one of the Nordic region’s leading construction and civil engineering companies. It was founded more than fifty years ago by two brothers and now has more than 13,000 employees. The Group primarily conducts business in Sweden, where Peab operates nationwide, but it also operates in Norway and Finland, where it focuses on the capital cities.
Total Group sales amounted to €4,981 million in 2013, which represents a decrease of 7.4% in comparison to 2012 due to slightly weaker market conditions at the beginning of the year. Fewer houses were completed and handed over to customers compared to 2012.
At the end of 2013, the main shareholders of the Group were the Paulsson family, which controls 25.9% of the share capital and 51.6% of the voting rights of the company.
The Group is structured around the following business activities:
ConstructionThe Construction division of the Group performs contract work for both external and internal customers in the Nordic region (Sweden, Norway and Finland). Projects include everything from new construction to renovation as well as construction maintenance.
In 2013, total sales decreased by 26% to €2,352 million while the EBIT margin of the division reached -2.3%. One-off costs including valuation adjustments of €106 million were charged to operating profit for the year. Excluding one-off costs, the operating margin was 1.6%, which was the same underlying margin as in 2012.
Civil engineeringThe Civil Engineering business area is a leading player in Sweden with operations also in Norway and Finland. The division builds and maintains roads, railroads and other infrastructure. Peab’s civil engineering is primarily directed towards the local market obtaining
around 90% of total revenue in Sweden. The division performs operations and maintenance projects in many municipalities in Sweden and is responsible for road maintenance in many areas for the Swedish Transport Administration.
In 2013, total sales fell by 14% to €1,129 million. The division’s operating margin reached 3.3% while total average profitability of the Group was 1.4% in 2013. In comparison with 2012, the local market contracted in terms of both net sales and profit.
Other activitiesThe Industry division delivers materials, equipment and services to external customers and internally to Peab’s construction and civil engineering projects. Industry is divided into seven product segments: asphalt, concrete, gravel and rock, transportation and machines, foundations, rentals and industrial construction. In 2013, total division sales represented 15% of total Group revenue and amounted to €755 million.
Project Development is responsible for the Group’s acquisitions and the development and sales of housing and commercial property. This business area is divided into two parts: Housing development and Property development. In 2013, total sales grew to €634 million while the division’s total order book amounted to €449 million.
The Group’s total order book decreased by 2.8% to €3,179 million. Orders received during the year consist of several medium-sized and smaller projects and fewer large projects compared to previous years. Of the total order backlog, 30% is expected to be produced after 2014. Swedish operations accounted for 85% of the total figure.
Net attributable income went down by 54.5% to €34 million in 2013. This reduction in profit was concentrated in the construction segment as a result of certain project write-downs.
Peab

EPoC 2013 European powers of construction 75
Sales by geographical area
Sweden Finland
Norway Other countries
0
1,000
2,000
3,000
4,000
5,000
6,000
2010201120122013
Sales by segment
Construction
Civil Engineering
Other activities
0
1,000
2,000
3,000
4,000
5,000
6,000
2010201120122013
Key Data 2013* 2012* 2011*Variation
2013-2012%
Assets
Non-current assets 1,114 1,140 1,217 (2.3%)
Current assets 2,481 2,597 2,301 (4.5%)
Total Assets 3,595 3,737 3,518 (3.8%)
Liabilities and shareholders' equity
Shareholders' equity 866 930 892 (7.0%)
Non-current liabilities 686 904 921 (24.0%)
Current liabilities 2,043 1,903 1,705 7.4%
Total liabilities and shareholders' equity
3,595 3,737 3,518 (3.8%)
Income statement
Sales 4,981 5,381 4,822 (7.4%)
National Sales 4,053 4,284 3,978 (5.4%)
International Sales 928 1,097 844 (15.4%)
Construction Sales 4,236 4,668 4,377 (9.3%)
Non construction Sales 745 713 445 4.5%
EBITDA 173 265 256 (34.8%)
EBIT 71 121 167 (41.4%)
Net income 34 83 104 (59.0%)
Net income attributable to the Group
34 76 104 (55.3%)
Other Key Data
Net Debt 671 754 743 (11.0%)
Order Book 3,179 3,269 3,114 (2.8%)
Market Capitalisation 1,315 1,071 1,007 22.8%
* Financial data has been converted into Euros, using the exchange rate prevailing at year end for balance sheet data, and the average exchange rate for the year for income statement data.
76
ENKA’s history, characterised by an uninterrupted and accelerated development, began in 1957 with the partnership between Şarık Tara and Sadi Gülçelik. Originally located in Istanbul, the company has expanded internationally achieving more than 30% of total revenue from international activities. In 2013, total sales grew by 10% to €4,930 million while market capitalisation increased by 2.6% to €6,464 million.
The Group’s main shareholders are Tara Holding, A.S., with 49.27% of the share capital, and the Tara and Gülcelik families, who control 28.07% of the company.
ENKA divides its operations into four different kinds of business: Engineering & Construction, Energy, Real Estate and Trade & Manufacturing.
Engineering & ConstructionThe fields of Engineering & Construction activities include the design and construction of motorways, bridges, power plants, oil & gas facilities, airports and harbours. In construction, ENKA’s engineering expertise is currently being employed over an ever-expanding geographical area. Some of the major projects that are currently under development are the construction of US Embassy buildings in various countries and the Morine-Merdare motorway project in Kosovo.
In 2013, total sales rose by 79% to €1,783 million while the EBITDA margin grew from 9% in 2012 to 15% in 2013. The division’s total backlog amounted to €2,297 million. Projects in Iraq represent 37% of the total order book recorded.
EnergyENKA's participation in energy projects dates back to the seventies, when Turkey decided to exploit the lignite coal reserves in the southwest of the country. The experience and skills acquired through these projects enabled ENKA to extend the scope of its responsibility in subsequent turnkey power projects, either as a consortium member or a joint venture partner.
While total sales amounted to €2,457 million representing 50% of total Group´s revenues, EBITDA recorded represents 27% of the total figure. EBITDA margin grew by 1 percentage point to 8.3% in 2013.
Real estateENKA’s interests in real estate development started with the establishment of OAO Mosenka in 1991 to meet the increasing demand for office space in Moscow, and have been expanding ever since, through further investment. At present, OAO Mosenka’s investments consist of six buildings in Moscow.
The other real estate company, OAO Moskva Krasnye Holmy, was established in 1995 for the realisation of the Riverside Towers Business and Cultural Centre, located in Moscow.
Following the establishment of OAO Mosenka and OAO Moskva Krasnye Holmy, ENKA accelerated its development of real estate investments in Moscow. All buildings are equipped with intelligent building technologies, complete safety and engineering control systems, efficient layouts, around the clock security and professional management provided by ENKA.
In 2013, rental sales amounted to €359 million, an increase of 5% on 2012. Total division EBITDA amounted €261 million, representing 34% of the Group’s total figure.
Trade & ManufacturingENKA's industrial investments in this segment began with the establishment of the Pimaş Plastic and Altaş Steel Hand Tool Factories in the 1960s. Its subsidiaries, Cimtas Pipe and Cimtas Ningbo (People's Republic of China), both incorporated in 2002, operate as dedicated pipe spool fabricators providing engineering and supply of process, power and OEM piping systems for the power, oil, gas and chemical industries.
In 2013, Trade & Manufacturing sales rose by 9% to €330 million while the EBITDA margin decreased by 0.1 percentage points to 6.8%.
ENKA's 2013 net attributable income reached €494 million, a 1% increase on 2012. The Engineering & construction and real estate divisions represent 33% and 40%, respectively, of total income.
ENKA

EPoC 2013 European powers of construction 77
Sales by segment
EnergyRentalConstructionTrade and manufacturing
0
1,000
2,000
3,000
4,000
5,000
2010201120122013
Sales by geographical area
Turkey
Russia and Kazakhstan
Rest of Europe
Other Countries
0
1,000
2,000
3,000
4,000
5,000
2010201120122013
Key Data 2013* 2012* 2011*Variation
2013-2012%
Assets
Non-current assets 3,840 3,828 3,639 0.3%
Current assets 2,303 2,415 2,127 (4.7%)
Total Assets 6,143 6,243 5,766 (1.6%)
Liabilities and shareholders' equity
Shareholders' equity 4,105 4,062 3,690 1.1%
Non-current liabilities 1,046 1,077 1,152 (2.8%)
Current liabilities 992 1,104 924 (10.2%)
Total liabilities and shareholders' equity
6,143 6,243 5,766 (1.6%)
Income statement
Sales 4,930 4,473 3,619 10.2%
National Sales 3,327 3,405 2,826 (2.3%)
International Sales 1,603 1,068 793 50.0%
Construction Sales 1,783 998 673 78.6%
Non construction Sales 3,147 3,475 2,946 (9.4%)
EBITDA 777 568 592 36.8%
EBIT 703 485 536 45.0%
Net income 522 512 303 1.9%
Net income attributable to the Group
494 490 296 0.8%
Other Key Data
Net Debt (645) (484) (223) 33.4%
Order Book N/A N,A N/A N.A
Market Capitalisation 6,464 6,301 7,922 2.6%
* Financial data has been converted into Euros, using the exchange rate prevailing at year end for balance sheet data, and the average exchange rate for the year for income statement data.

78
Carillion is one of the UK’s leading integrated support service companies, with extensive construction capabilities, a substantial portfolio of Public-Private Partnership projects and a sector-leading ability to deliver sustainable solutions. It was created as a result of the stock split of Tarmac Plc in 1999. The Tarmac Group demerged into a building materials company ('Tarmac') and a company focused on support services and construction services ('Carillion'). Carillion employs more than 41,000 people worldwide, with established businesses in the UK, Canada and the Middle East and North Africa.
At December 2013, Templeton Global Advisors Ltd was the only investor which had an ownership interest higher than 5% (5.22%). There are seven additional institutional shareholders with ownership interests ranging from 3% to 5%.
In 2013, total Group revenue fell by 12% to €4,805 million, primarily because of the rescaling of the UK construction activities.
Carillion’s portfolio includes Construction works (which the Group subdivides into Middle East and the rest of the world), Support Services and Public Private Partnership projects.
Support servicesCarillion is a leading international support services company with all the skills and capabilities needed to manage, maintain and operate buildings and infrastructure, notably for large property estates and for transport and utility networks. The Support Services division also provides services to public- and private-sector customers to support the delivery of public services and business objectives. In this segment the Group includes various activities, including most notably facilities management, facilities services, rail services, road maintenance, utility services and consultancy businesses.
The division’s sales fell by 7% to €2,707 million in 2013. Although revenue in support services was lower than in 2012, the division continued winning new contracts such as the extension to the contract with BT Openreach for Broadband Delivery worth some €600 million over three and a half years. The operating margin remained stable compared to 2012 at 5.1%.
Middle East construction servicesIn this segment the Group reports the results of its building and civil engineering activities in the Middle East and North Africa. Carillion has around 40 years’ experience in the Middle East and has delivered some of the region’s most prestigious buildings and infrastructure projects. The Group is mainly present in Abu Dhabi, Oman, Qatar and Dubai.
During 2013, total division sales amounted to €569 million while the operating margin was reduced to 4%. Nevertheless, in 2013 the Group won a number of substantial new contracts, such as the €156 million contract to build the Oman Convention and Exhibition Centre.
Construction services (excluding Middle East)This segment reports the results of UK building, civil engineering and development businesses, together with those of the construction activities in Canada.
Total sales decreased by 21% to €1,250 million. The Group’s performance in this segment continues to reflect the rescaling of the UK construction activities that were announced in 2010. Additionally, during 2013 the division won a number of significant new contracts such as a €400 million contract for the first phase of the redevelopment of Battersea Power Station.
Public Private Partnership projectsThe Group is a benchmark in Public Private Partnership (PPP) projects, both in the UK and Canada. This business uses private sector finance to deliver a wide range of asset-based services for central and local government.
In 2013, Carillion sold equity investments in seven projects for cash proceeds of €181 million and generated a pre-tax profit of approximately €53 million. Total sales decreased by 21% to €279 million mainly due to the effects of the aforementioned divestments. Operating profit increased by 25%, because profit from the sale of equity investments more than offset the equity returns no longer received from the investments sold.
The Group’s order book remained stable compared to 2012 and amounted to €21,591 million. The order book of the Support Services division represents 75.5% of the 2013 total.
Carillion

EPoC 2013 European powers of construction 79
Sales by geographical area
United Kingdom Canada
Middle East ANS North Africa Other countries
0
1000
2000
3000
4000
5000
6000
2010201120122013
Sales by segment
Support Services Other Construction Services
Middle East Construction Services
Private Finance
0
1,000
2,000
3,000
4,000
5,000
6,000
2010201120122013
Net attributable income fell by 40% to € 118 million in 2013 primarily as a result of the aforementioned rescaling of the UK construction market as well as a substantial increase in the net financial expense recorded.
Key Data 2013* 2012* 2011*Variation
2013-2012%
Assets
Non-current assets 2,347 2,484 2,431 (5.5%)
Current assets 2,019 2,248 1,998 (10.2%)
Total Assets 4,366 4,732 4,429 (7.7%)
Liabilities and shareholders' equity
Shareholders' equity 1,180 1,238 1,177 (4.7%)
Non-current liabilities 1,193 2,068 2,223 (42.3%)
Current liabilities 1,993 1,426 1,029 39.7%
Total liabilities and shareholders' equity
4,366 4,732 4,429 (7.7%)
Income statement
Sales 4,805 5,430 5,820 (11.5%)
National Sales 3,350 4,006 4,222 (16.4%)
International Sales 1,455 1,424 1,598 2.2%
Construction Sales 1,819 2,169 2,761 (16.1%)
Non construction Sales 2,986 3,261 3,059 (8.4%)
EBITDA 200 283 321 (29.3%)
EBIT 252 287 249 (12.1%)
Net income 125 205 159 (39.0%)
Net income attributable to the Group
118 197 155 (40.2%)
Other Key Data
Net Debt 258 191 61 35.2%
Order Book 21,591 22,179 22,866 (2.6%)
Market Capitalisation 1,706 1,671 1,549 2.1%
* Financial data has been converted into Euros, using the exchange rate prevailing at year end for balance sheet data, and the average exchange rate for the year for income statement data.

80
OHL is the result of the merger of Obrascon, Huarte and Lain in 1999 and is one of the largest international concession and construction groups in the world. Having been in business for over one hundred years, the Group has significant operations in 26 countries across all five continents. OHL has a workforce of around 24,000 employees.
Total Group sales decreased by 8.6% to €3,684 million in 2013. This reduction was mainly explained by lower construction activity (both own and subcontracted to third parties) in Mexico and the change in the consolidation method of the Poetas-Luis Cabrera toll road and others.
At 31 December 2013, Inmobiliaria Espacio, S.A., which controls 61.06% of the Group, was the only shareholder with an ownership interest higher than 10%.
In 2013, the Group increased its stake in Abertis, a Spanish listed company that is the world leader in toll road management, to 18.93%. Through this additional investment, OHL has become Abertis’s second largest shareholder.
OHL is composed of the following divisions: Concession Infrastructures, Construction and Other Activities.
ConcessionsThe activities carried out by this division consist of the development, management and maintenance of transportation infrastructure such as motorways, ports, airports and railways. OHL is one of the leading companies in the international market for public-private partnership projects, a sector in which it has become a strategic player in the promotion of transport infrastructure in all its forms.
Present in Spain and America, OHL Concesiones carries out direct management of 16 transportation infrastructure concessions. The Company participates in several toll roads with a total of 829 km, of which 711 km (86%) correspond to the 9 concessions that are in operation. Additionally, it manages an airport in Mexico (Toluca International Airport), 3 ports in Spain and Chile and railway concessions in Madrid with a total length
of 37 km. Latin America is the main destination for its investments, with total investments that exceeded €4,200 million in 10 highways, an airport and a port, accounting for 68% of the aggregate investment of the company worldwide.
Despite increasing traffic and tolls, total division sales decreased by 20% to €514 million mainly due to changes in the consolidation method of certain concessions. Concession business sales on a like-for-like basis grew by 8.7% in 2013. The division represents 85% of total Group EBIT recorded in 2013.
ConstructionThis segment focuses on civil engineering works and selective building construction in markets such as North America, Mexico and Latin America, Spain and the rest of Europe, the Middle East, Asia and the Pacific.
Total Construction business sales were slightly lower than in 2012, as the 9.0% increase in sales abroad failed to completely offset the decline in activity in Spain (which dropped by 34.2%), leading to an overall fall in sales of 2.5%. The total division’s margin rose by 0.2 percentage points to 5.8% in 2013.
Other activitiesOHL’s other revenue comes from its Industrial and Development Division. The industrial business is centred on the engineering and construction of industrial plants, and Development activities include works in areas of tourist and historical interest.
Revenue amounted to €501 million, down 22.9% on 2012, mainly due to less activity in the Industrial division as a result of having completed major contracts and still being at the launch phase of the new projects awarded, particularly in Mexico.
At December 2013, the Group's backlog amounted to €59,515 million. Approximately 14% of the total backlog is related to short-term projects, with long-term projects accounting for the remaining 86%. Concession business represents 86% of the total order book, while construction and other activities account for 13% and 1%, respectively.
OHL

EPoC 2013 European powers of construction 81
Sales by segment
Construction
Other activities
Concession infrastructures
0
1,000
2,000
3,000
4,000
5,000
2010201120122013
Sales by geographical area
Spain
Mexico
BrazilEastern Europe
The United States
Algeria
Qatar
Chile
Peru
CanadaArgentina
Other countries
0
1,000
2,000
3,000
4,000
5,000
2010201120122013
Since 2012 net attributable income was affected by the profit on the sale of its Brazilian and Chilean concessions. During 2013 net income fell to €270 million.
Key Data 2013 2012 2011Variation
2013-2012%
Assets
Non-current assets 10,104 8,622 8,763 17.2%
Current assets 3,576 3,585 4,163 (0.3%)
Total Assets 13,680 12,207 12,926 12.1%
Liabilities and shareholders' equity
Shareholders' equity 3,282 2,721 1,978 20.6%
Non-current liabilities 7,311 6,384 6,957 14.5%
Current liabilities 3,087 3,102 3,991 (0.5%)
Total liabilities and shareholders' equity
13,680 12,207 12,926 12.1%
Income statement
Sales 3,684 4,030 4,870 (8.6%)
National Sales 932 1,338 1,444 (30.3%)
International Sales 2,752 2,692 3,426 2.2%
Construction Sales 2,670 2,738 2,866 (2.5%)
Non construction Sales 1,014 1,292 2,004 (21.5%)
EBITDA 1,215 1,053 1,219 15.4%
EBIT 1,031 660 973 56.3%
Net income 405 1,101 349 (63.2%)
Net income attributable to the Group
270 1,005 223 (73.1%)
Other Key Data
Net Debt 5,542 4,198 5,109 32.0%
Order Book 59,515 53,413 81,352 11.4%
Market Capitalisation 2,937 2,189 1,933 34.1%

82
Barratt Developments PLC, founded more than 50 years ago, is one of the UK’s largest housebuilders with over 4,750 employees and 27 divisions throughout the UK. Focused in the UK, the Group builds developments nationwide, from Aberdeen to Plymouth. The Group has been listed on the London Stock Exchange since 1968.
As of June 2013, three investors held ownership interests of 4% or more in the Group. Blackrock Inc, Standard Life Investments Ltd and Ruffer LLP controlled 5.0%, 4.87% and 4.79% of the Group, respectively.
In 2013, total Group sales rose by 15% to €3,160 million while the operating margin jumped to 9.7%. Net debt was significantly reduced from €208 million in 2012 to €30 million in 2013.
Barratt divides its business portfolio into two main segments: House Building and Commercial Developments.
House buildingBarratt is a national housebuilder committed to operating throughout the UK, where it obtains 100% of total revenue. Operations in the UK are carried out under the Barratt Homes and David Wilson Homes brands, and in Kent and the South East of England also under the Ward Homes brand. The division operates across a broad spectrum of the market from flats to family homes and urban regeneration schemes. The segment’s strategy is based on improving the status of the homes in terms of location, design and construction quality.
In 2013, total sales rose by 16% to €3,143 million mainly as a result of higher average selling prices and larger units sold. Additionally, the announcement of the Help to Buy (Equity Loan) scheme boosted sales in the last quarter of the financial year. In 2013, total units sold rose by 5% to 13,246. Approximately 17% of units sold are categorised as “affordable” homes.
Commercial developmentsCommercial developments are delivered by Wilson Bowden Developments. The business also has a national footprint, with a particular focus on the Midlands and the North of England. The portfolio includes a wide range of commercial property, including offices, retail (both in town and out of town), leisure, industrial and distribution centres.
With a portfolio of around 1.5 million square metres of commercial space and an estimated gross value of €3.5 billion, the segment’s revenue amounted to €17 million in 2013 with a break-even operating position. Among other noteworthy events, the division completed a profitable land sale in the year and a 2,800 square metre office extension in Nottingham and delivered 13,800 square metres of stock property disposals.
In 2013, total net attributable income amounted to €91 million, 14% higher than in 2012. Excluding exceptional items, net attributable profit would have grown by 81% to approximately €172 million.Exceptional items include, among others, inventory write-downs.
Barratt

EPoC 2013 European powers of construction 83
Sales by segment
House-Building
Commercial developments
0
500
1,000
1,500
2,000
2,500
3,000
3,500
2010201120122013
Sales by geographical area
United Kingdom
0
500
1,000
1,500
2,000
2,500
3,000
3,500
2010201120122013
Key Data 2013* 2012* 2011*Variation
2013-2012%
Assets
Non-current assets 1,456 1,643 1,489 (11.4%)
Current assets 4,207 4,248 3,802 (1.0%)
Total Assets 5,663 5,891 5,291 (3.9%)
Liabilities and shareholders' equity
Shareholders' equity 3,585 3,686 3,246 (2.7%)
Non-current liabilities 683 949 894 (28.0%)
Current liabilities 1,395 1,257 1,151 11.0%
Total liabilities and shareholders' equity
5,663 5,891 5,291 (3.9%)
Income statement
Sales 3,160 2,749 2,375 15.0%
National Sales 3,160 2,749 2,375 15.0%
International Sales - - - -
Construction Sales 3,143 2,705 2,318 16.2%
Non construction Sales 17 44 57 (61.4%)
EBITDA 308 228 160 34.9%
EBIT 306 226 158 35.5%
Net income 91 80 (16) 14.0%
Net income attributable to the Group
91 80 (16) 14.0%
Other Key Data
Net Debt 30 208 357 (85.5%)
Order Book N,A N,A N,A N.A
Market Capitalisation 4,119 2,485 1,074 65.8%
* Financial data has been converted into Euros, using the exchange rate prevailing at year end for balance sheet data, and the average exchange rate for the year for income statement data.

84
European construction and infrastructure group contacts
Region Name Telephone Email
Austria Marieluise Krimmel +43 (1) 537 00 2412 [email protected]
Bruno Moritz +43 (1) 537 00 4300 [email protected]
Nikolaus Mueller +43 (1) 537 00 7575 [email protected]
Alexander Hohendanner +43 (1) 537 00 2700 [email protected]
Belgium Jean-Paul Loozen +32 (2) 639 49 40 [email protected]
Pierre-Hugues Bonnefoy +32 (2) 800 20 35 [email protected]
Rik Neckebroeck +32 (2) 800 20 22 [email protected]
Luc Van Coppenolle +32 (3) 800 89 05 [email protected]
Central Europe Diana Radl Rogerova +420 246 042 572 [email protected]
Miroslav Linhart +420 246 042 598 [email protected]
Maciej Krason +48 (22) 51 10 360 [email protected]
Denmark Thomas Frommelt +45 45 94 50 27 [email protected]
France Marc de Villartay +33 (1) 5561 2716 [email protected]
Laure Silvestre-Siaz +33 (1) 5561 2171 [email protected]
Germany Franz Klinger +49 (89) 29036 8362 [email protected]
Michael Mueller +49 (89) 29036 8428 [email protected]
André Bedenbecker +49 (0) 2118772 3503 [email protected]
Greece Alexis Damalas +30 (210) 678 1100 [email protected]
Michael Hadjipavlou +30 (210) 678 1100 [email protected]
Ireland Michael Flynn +353 (1) 417 2515 [email protected]
Kevin Sheehan +353 (1) 417 2218 [email protected]
Padraic Whelan +353 (1) 417 2848 [email protected]
Italy Elena Vistarini +39 (02) 833 25122 [email protected]
Andrea Restelli +39 (02) 833 22062 [email protected]
Luxembourg Benjamin Lam +(352) 451 452 429 [email protected]
The Netherlands Jurriën Veldhuizen +31 (0) 88 288 16 36 [email protected]
Paul Meulenberg +31 (0) 88 288 32 81 [email protected]
Norway Aase-Aamdal Lundgaard +47 (23) 279 282 [email protected]
Thorvald Nyquist +47 (23) 279 663 [email protected]
Portugal Joao Costa da Silva +351 (21) 042 7511 [email protected]
Miguel Eiras Antunes +351 (21) 042 3825 [email protected]
Jose Gabriel Chimeno +351 (21) 042 2512 [email protected]
Spain Javier Parada +34 (91) 514 5000 [email protected]
Miguel Laserna +34 (91) 514 5000 [email protected]
Turkey Erdem Selcuk +90 (212) 366 60 26 [email protected]
UK Makhan Chahal +44 (0) 20 7007 0626 [email protected]
Jack Kelly +44 (0) 20 7007 0826 [email protected]
Nigel Shilton +44 (0) 20 7007 7934 [email protected]


For more information, please, visit www.deloitte.es
Deloitte refers to one or more of Deloitte Touche Tohmatsu Limited, a UK private company limited by guarantee (“DTTL”), its network of member firms, and their related entities. DTTL and each of its member firms are legally separate and independent entities. DTTL (also referred to as “Deloitte Global”) does not provide services to clients. Please see www.deloitte.com/about for a more detailed description of DTTL and its member firms.
Deloitte provides audit, tax, consulting, and financial advisory services to public and private clients spanning multiple industries. With a globally connected network of member firms in more than 150 countries and territories, Deloitte brings world-class capabilities and high-quality service to clients, delivering the insights they need to address their most complex business challenges. Deloitte’s more than 200,000 professionals are committed to becoming the standard of excellence.
This communication contains general information only, and none of Deloitte Touche Tohmatsu Limited, its member firms, or their related entities (collectively, the “Deloitte Network”) is, by means of this communication, rendering professional advice or services. No entity in the Deloitte network shall be responsible for any loss whatsoever sustained by any person who relies on this communication.
© 2014. For information, contact Deloitte, S.L.
Designed and produced by CIBS, Communications, Corporate Image and Business Support, Madrid.