epm5700 project management and information technology
TRANSCRIPT
EPM5700 Project Management and Information Technology
Planning an IT project using software tools
Lecturer: Raphael M. Düa
FAICD, FAPE, FGPC(PC), FPMCOS, MACS(Snr), CP, IP³, Grad DISC About this course Copyright © 2019 Victoria University and Raphael M. Düa

Intellectual property Unless otherwise stated, this artefact is provided under the terms of the Victoria University copyright rules and student access. If using this content, you must attribute us (Victoria University) (VU) and the identified author Raphael M. Düa in accordance with the terms of the VU Licence. The Acknowledgements section is used to list, amongst other things, third party (Proprietary), content which is not subject to VU licensing. Proprietary content must always be used (retained) intact and in context to the content. The Acknowledgements section is also used to bring to your attention any other Special Restrictions which may apply to the content. For example, there may be times when the VU licence does not apply to any of the content even if owned by us (Victoria University). In these instances, unless stated otherwise, the content may be used for personal and non-commercial use. We have also identified as Proprietary other material included in the content which is subject to Victoria University Licence. These are VU logos, trading names and may extend to certain photographic and video images and sound recordings and any other material as may be brought to your attention. Unauthorised use of any of the content may constitute a breach of the terms and conditions and/or intellectual property laws. We reserve the right to alter, amend or end any terms and conditions provided here without notice. All rights falling outside the terms of the Victoria University licence are retained or controlled by Victoria University.
Contents
• Introduction • Learning outcomes • What are Critical Path Planning Techniques? • 1 The planning stage • 2 Taking an overview • 2.1 Introduction • 2.2 The classic six-stage project management model • 3 How does a project start? • 3.1 Barriers to planning • 3.2 The project plan • 3.3 Using a logic diagram to identify key stages • 4 Identifying deliverables • 5 Mapping tasks and activities • 5.1 Introduction • 5.2 Work breakdown • 5.3 Team structure and responsibilities • 6 Scheduling • 6.1 Introduction • 6.2 Gantt chart • 6.3 Identifying the critical path • 7 Estimating costs, revenues and intangible benefits • 7.1 Introduction • 7.2 Revenues • 7.3 Staff costs • 7.4 Equipment costs • 7.5 Materials costs • 7.6 Who should estimate? • 7.7 Planning for quality • 8 Drawing up the implementation plan • Conclusion • Further learning • References • Acknowledgements

1. Introduction This course will help you to develop the skills required when planning a project. You will examine the various components of a project plan and be introduced to several tools and techniques to aid planning. Amongst the many tools available this course will only reference the following: - • Microsoft Project V2019 • Oracle Primavera P6 V18.1 • Micro Planner X-Pert for Windows V3.51. • Project Libre (a free program)
Learning outcomes After studying this course, you should be able to: • Understand the basic concepts of Planning utilising critical path scheduling techniques • develop project plans with relevant people to achieve the project's goals • create work down break structures (WBS) to decompose all the project deliverables • through the WBS develop Planning Packages, Work Packages • from the work packages create tasks and determine through project life procedures • create and identify links and dependencies, and schedule to achieve deliverables • estimate and cost the human and plant resources required, and make plans to obtain the necessary resources to produce a budget • allocate with clear lines of responsibility and accountability. Development of a Critical Path Project Management Plan Basic Network Concepts A network is the pictorial representation of the Project Plan which shows the inter-relationships and inter- dependencies of the component tasks. It is sometimes known as a ‘logic diagram’ or ‘precedence diagram’, however the term ‘critical path network’ is more commonly used throughout industry and will be used for this course. Critical Path Techniques A network must logically express the sequence and pattern of work flow as well as the relationships and restraints implicit in the intended plan of operations. Since networks can be drawn for different levels of management, i.e. with greater or lesser detail, it is important to establish the nature and amount of detail to be included. Accurate network construction can often be achieved more readily as a team effort by key personnel having specific knowledge of the tasks and processes involved. The leader of the team should be fully conversant with the rules and conventions applicable to network logic. Critical Path Network Diagrams
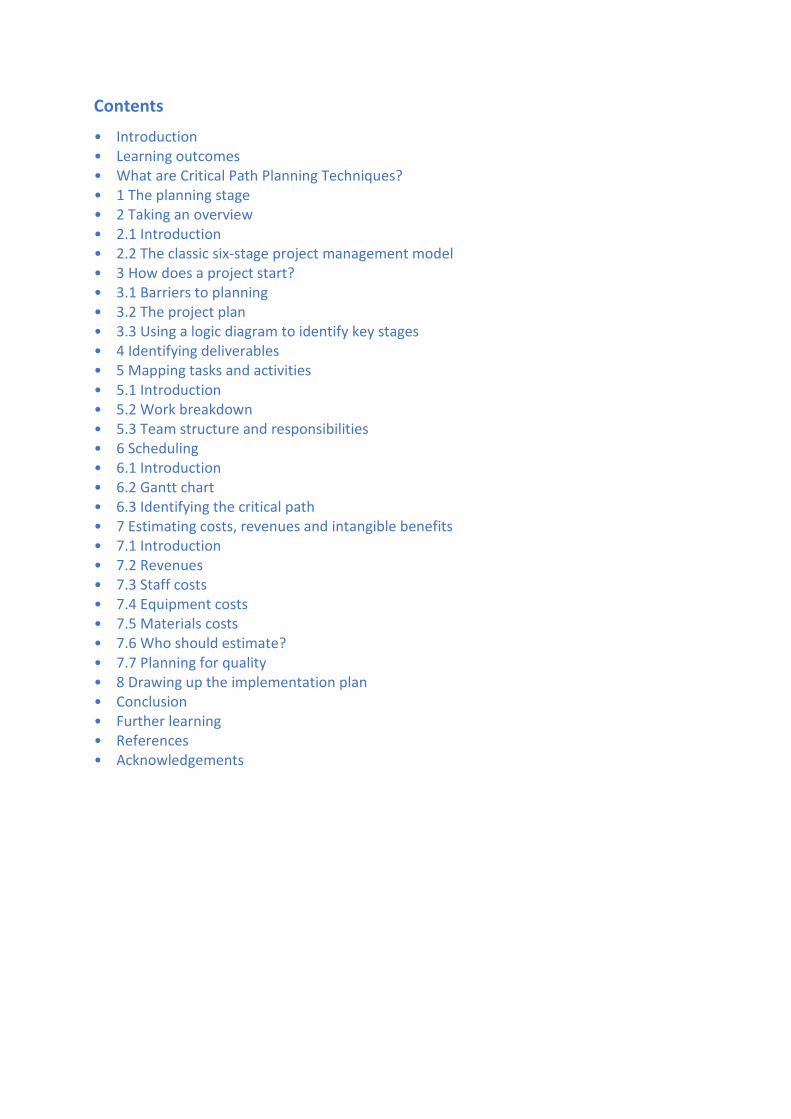
A network can be represented by one of two techniques - arrow diagrams or precedence diagrams. However, the general construction industry standard is to use the precedence diagram; the basic element of which is the task, which represents an amount of work to be performed. This is also the standard to be used by the PMIT course. Each task is given a duration, which defines the time required to complete the task as well as the resources require to carry out the task. Arrow Diagrams The two elements of an arrow diagram are directional lines (or arrows) each representing one activity, and circles representing events. Events represent the points at which activities start and finish. In the figure below BUILD SECTION 1 and MAKE UP COMPONENT 2 finish at event E4, is a name given to an event and is known as the identifier by their preceding event and succeeding event identifiers. Therefore, in Figure.1 the first activity is identified as E1-E2, its description is PREPARE SITE and it has duration of four (4) time periods. Events may also be given descriptive data. For example, event E1 can be described as START OF NET1. However, as previously stated an event cannot have duration. An event is achieved when its preceding activities are completed. For example, in Figure 1 event E4 (COMPONENT 2) and E2-E4 (BUILD SECTION 1) are complete.
Accurate representation of the project by the network is very important, since the data that defines the network is the basis on which analysis is performed. The activities must be placed in logical work sequence, showing which may be worked at the same time. In Figure 1: MANUFACTURE PART A, BUILD SECTION 1 AND BUILD SECTION 2 can be worked at the same time but cannot start until PREPARE SITE has finished. Activities may have properties that affect the way in which the network is processed. Such activities are described using the following activity types:

Activity Types Dummy Activity - This is an activity that represents not an actual task but a logical link between network paths Precedence Diagrams Precedence Diagrams use boxes to represent the basic network elements, the task. The other element of precedence networks is the dependency, which defines the logical link between tasks. A dependency is shown in a precedence network diagram as a line. In the precedence diagram below, the dependencies show that BUILD SECTION 4 is logically after BUILD SECTION 2, and that MANUFACTURE PART A, BUILD SECTION 1 AND BUILD SECTION 2, can all be worked at the same time but cannot start until PREPARE SITE is complete.
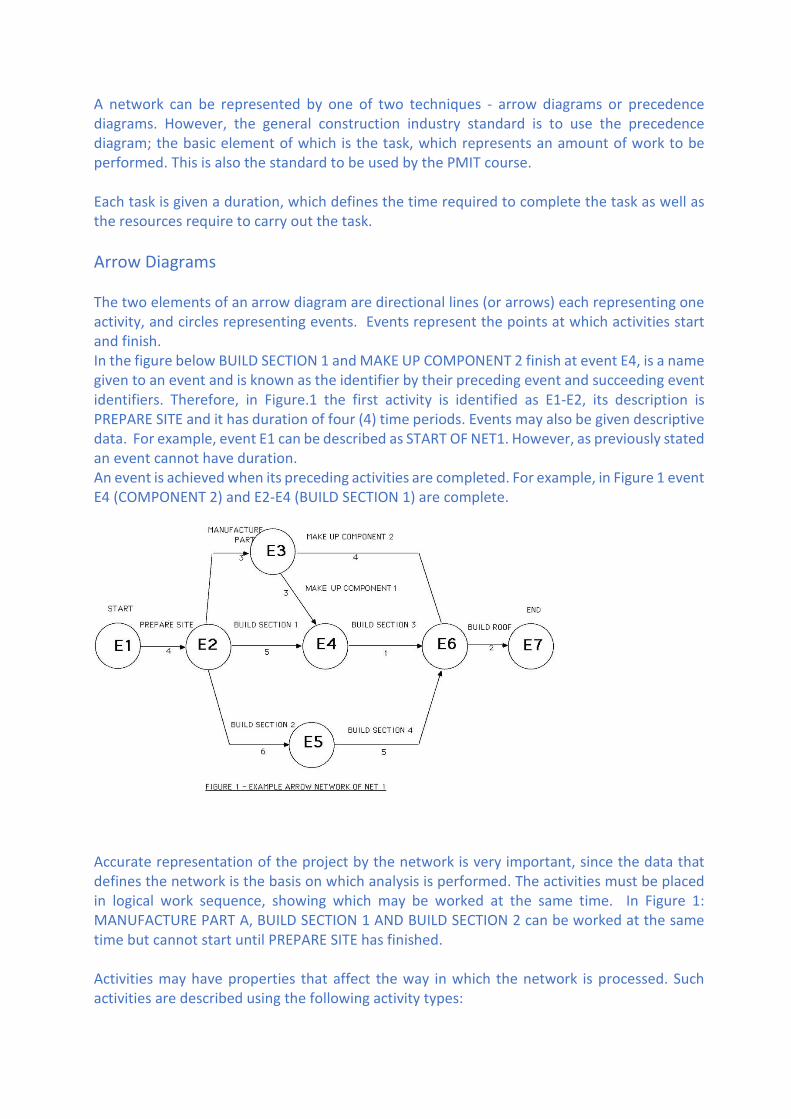
In precedence networks, tasks are identified by a task identifier; for example, ABC21001, ABC21002, ABC21003 etc. as shown below. Tasks have duration’s giving the period of time required to perform the task and may have descriptive data attached to them. Links or Dependencies in precedence networks are more flexible than events in arrow networks. These are four Link types, as shown below. • Finish to start • Finish to finish • Start to start • Start to finish
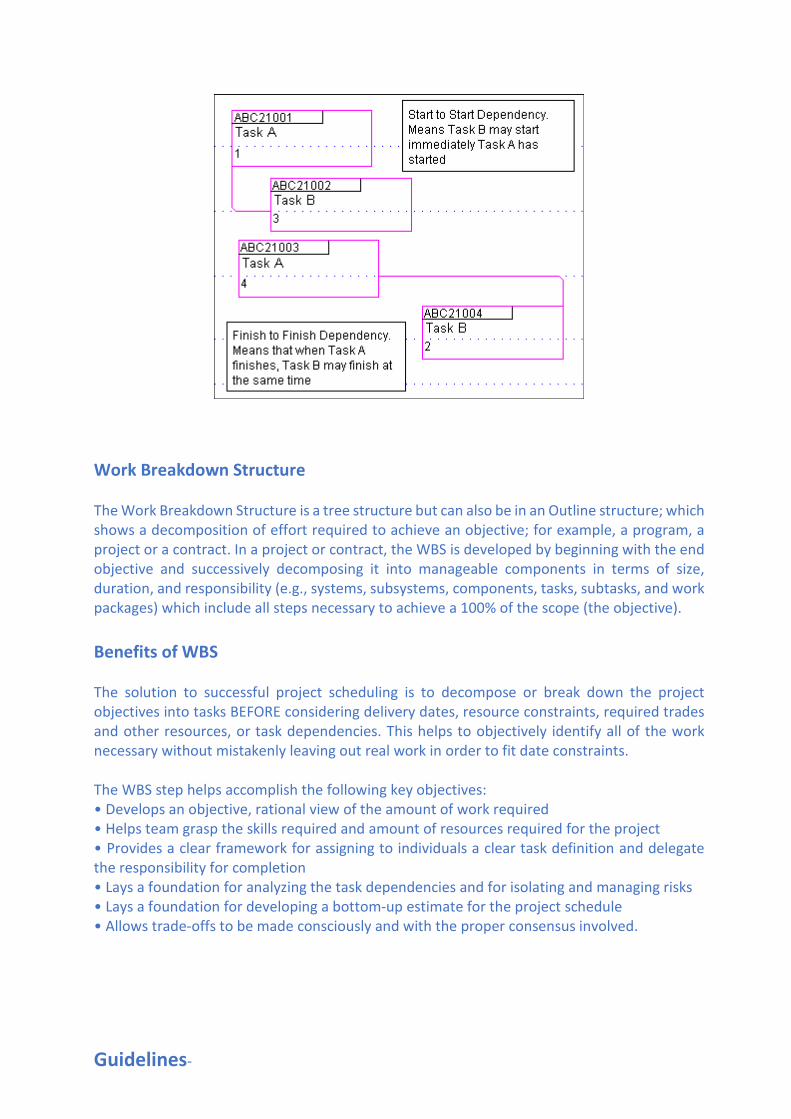
Work Breakdown Structure The Work Breakdown Structure is a tree structure but can also be in an Outline structure; which shows a decomposition of effort required to achieve an objective; for example, a program, a project or a contract. In a project or contract, the WBS is developed by beginning with the end objective and successively decomposing it into manageable components in terms of size, duration, and responsibility (e.g., systems, subsystems, components, tasks, subtasks, and work packages) which include all steps necessary to achieve a 100% of the scope (the objective). Benefits of WBS The solution to successful project scheduling is to decompose or break down the project objectives into tasks BEFORE considering delivery dates, resource constraints, required trades and other resources, or task dependencies. This helps to objectively identify all of the work necessary without mistakenly leaving out real work in order to fit date constraints. The WBS step helps accomplish the following key objectives: • Develops an objective, rational view of the amount of work required • Helps team grasp the skills required and amount of resources required for the project • Provides a clear framework for assigning to individuals a clear task definition and delegate the responsibility for completion • Lays a foundation for analyzing the task dependencies and for isolating and managing risks • Lays a foundation for developing a bottom-up estimate for the project schedule • Allows trade-offs to be made consciously and with the proper consensus involved. Guidelines-
Definitions The Work Breakdown Structure (WBS) is defined by A Guide to the Project Management Body of Knowledge 3rd Edition (PMBOK Guide) as: "A deliverable-oriented hierarchical decomposition of the work to be executed by the project team to accomplish the project objectives and create the required deliverables." (Each hierarchical decomposition may be known as a Breakdown Element) Purpose
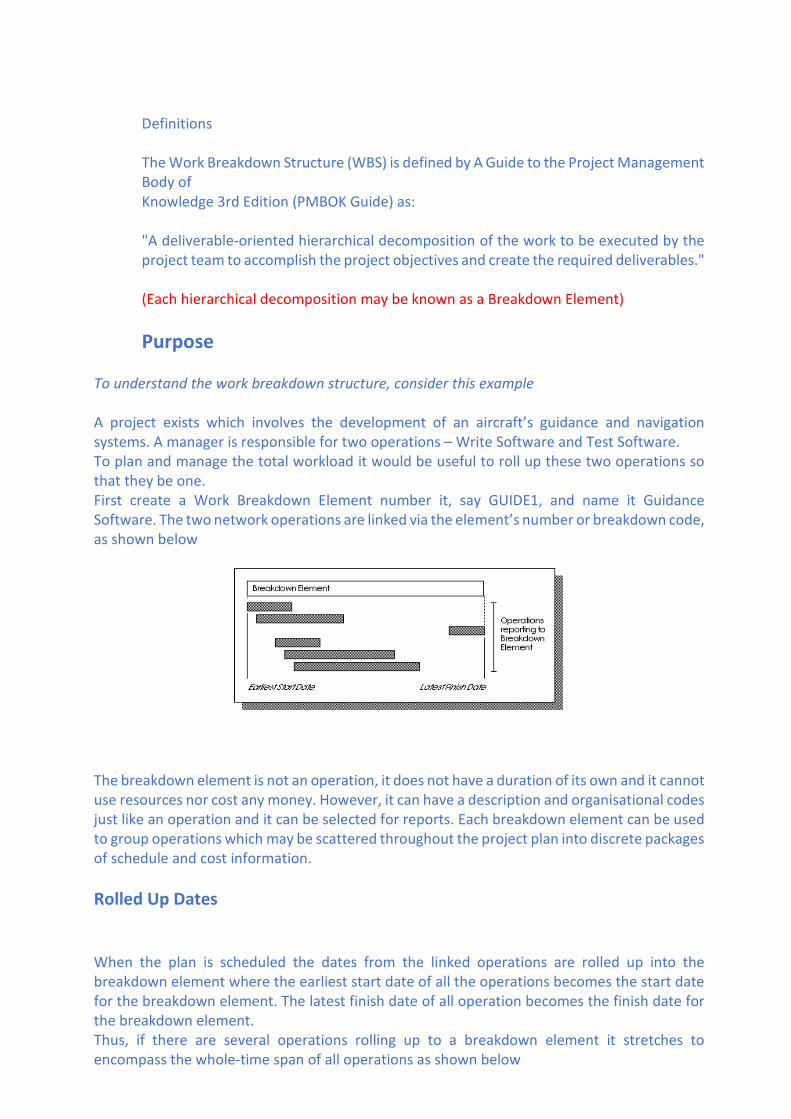
To understand the work breakdown structure, consider this example A project exists which involves the development of an aircraft’s guidance and navigation systems. A manager is responsible for two operations – Write Software and Test Software. To plan and manage the total workload it would be useful to roll up these two operations so that they be one. First create a Work Breakdown Element number it, say GUIDE1, and name it Guidance Software. The two network operations are linked via the element’s number or breakdown code, as shown below
The breakdown element is not an operation, it does not have a duration of its own and it cannot use resources nor cost any money. However, it can have a description and organisational codes just like an operation and it can be selected for reports. Each breakdown element can be used to group operations which may be scattered throughout the project plan into discrete packages of schedule and cost information. Rolled Up Dates When the plan is scheduled the dates from the linked operations are rolled up into the breakdown element where the earliest start date of all the operations becomes the start date for the breakdown element. The latest finish date of all operation becomes the finish date for the breakdown element. Thus, if there are several operations rolling up to a breakdown element it stretches to encompass the whole-time span of all operations as shown below

In a similar way, when a Resource Analysis is carried out, the Start and Finish dates from that analysis are rolled up to form the Resource Analysis for the breakdown element. This means that when a breakdown element is included on a report such as a Gantt Report, the scope of all the operations that roll up to it is included. Rolled Up Costs When Cost analysis is carried out, the cost results will roll up into a breakdown element so that it contains the summed totals of the cost values for all operation reporting to it. These will be the same values carried by the operations themselves:
Estimated Cost Earned Value Actual Cost Recoverable
Multiple Levels So far only a single work breakdown element has been considered where the costs have been rolled up. Now consider Guidance Software as part of a larger system ......
In the diagram above the breakdown element GUIDE has been broken down into GUIDE1, GUIDE2 and GUIDE3 ... and more. … – all part of the Guidance and Navigation System. Each one of these additional elements can have any number of network operations reporting to it – rolling up their dates and their cost results in the same way. In the diagram above, these elements are linked to a parent element – coded GUIDE – which represents the complete Guidance and Navigation System. The elements GUIDE1, GUIDE2,

GUIDE3 ... are all at the same level of the structure and that they are the children of GUIDE which is at a higher level. This means that the parent element GUIDE now has a Start Date which is the earliest of the Start dates of all its children – meaning the earliest of all operations which relate to the whole guidance and navigation system. Similarly, the Finish Date shows when all operations in that system are complete. By the same token, all the cost information for the entire guidance and navigation system is rolled up into that single element Consider that the Guidance and Navigation System is itself a child of a larger system – the Aircraft itself. Thus, the structure would look like The aircraft itself may also be just one child within a larger system that incorporates a total program of development. These examples below, illustrate how a tree structure can be constructed which allows the roll up of information to higher and higher levels of command. In this example the overall cost values for the Aircraft System are all available in the single element at the top of the tree. The values have been rolled up through the entire tree from all the operations within the structure.

Source DEF(AUST) S664 Issue A Typical Defence Style PROJECT WBS
Source DEF(AUST) S664 Issue A
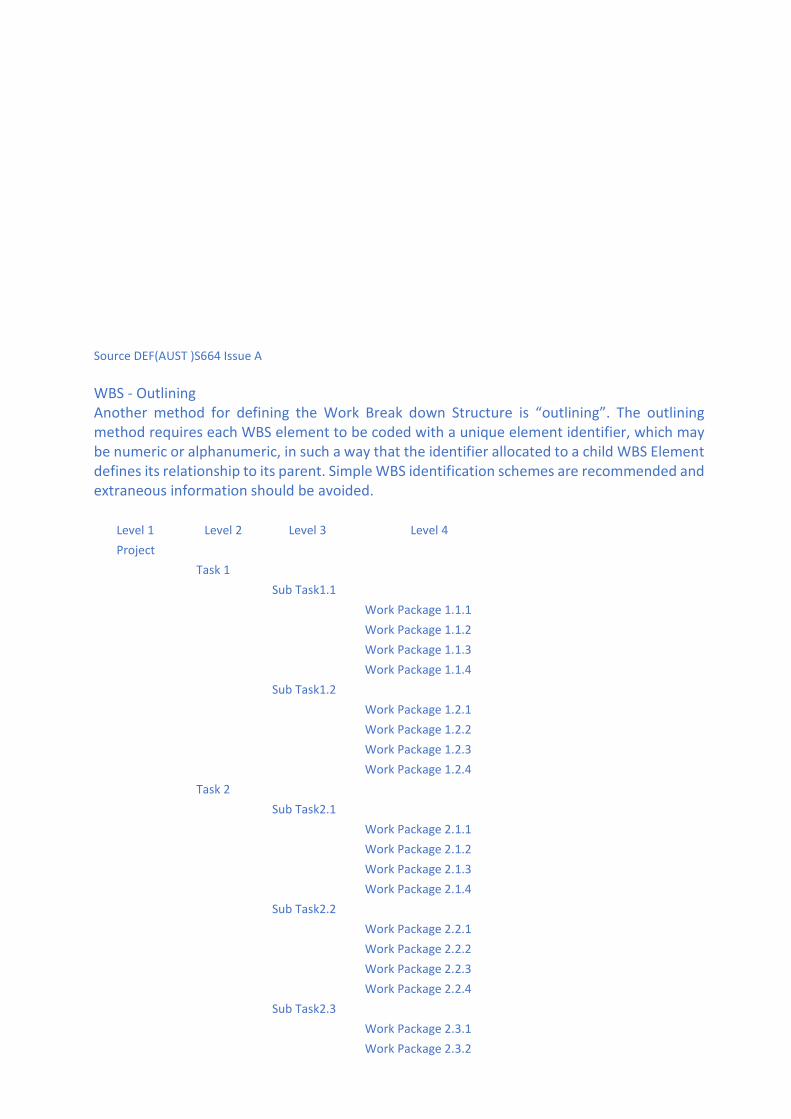
Source DEF(AUST )S664 Issue A WBS - Outlining Another method for defining the Work Break down Structure is “outlining”. The outlining method requires each WBS element to be coded with a unique element identifier, which may be numeric or alphanumeric, in such a way that the identifier allocated to a child WBS Element defines its relationship to its parent. Simple WBS identification schemes are recommended and extraneous information should be avoided.
Level 1 Level 2 Level 3 Level 4 Project
Task 1 Sub Task1.1 Work Package 1.1.1 Work Package 1.1.2 Work Package 1.1.3 Work Package 1.1.4 Sub Task1.2 Work Package 1.2.1 Work Package 1.2.2 Work Package 1.2.3 Work Package 1.2.4 Task 2 Sub Task2.1 Work Package 2.1.1 Work Package 2.1.2 Work Package 2.1.3 Work Package 2.1.4 Sub Task2.2 Work Package 2.2.1 Work Package 2.2.2 Work Package 2.2.3 Work Package 2.2.4 Sub Task2.3 Work Package 2.3.1 Work Package 2.3.2
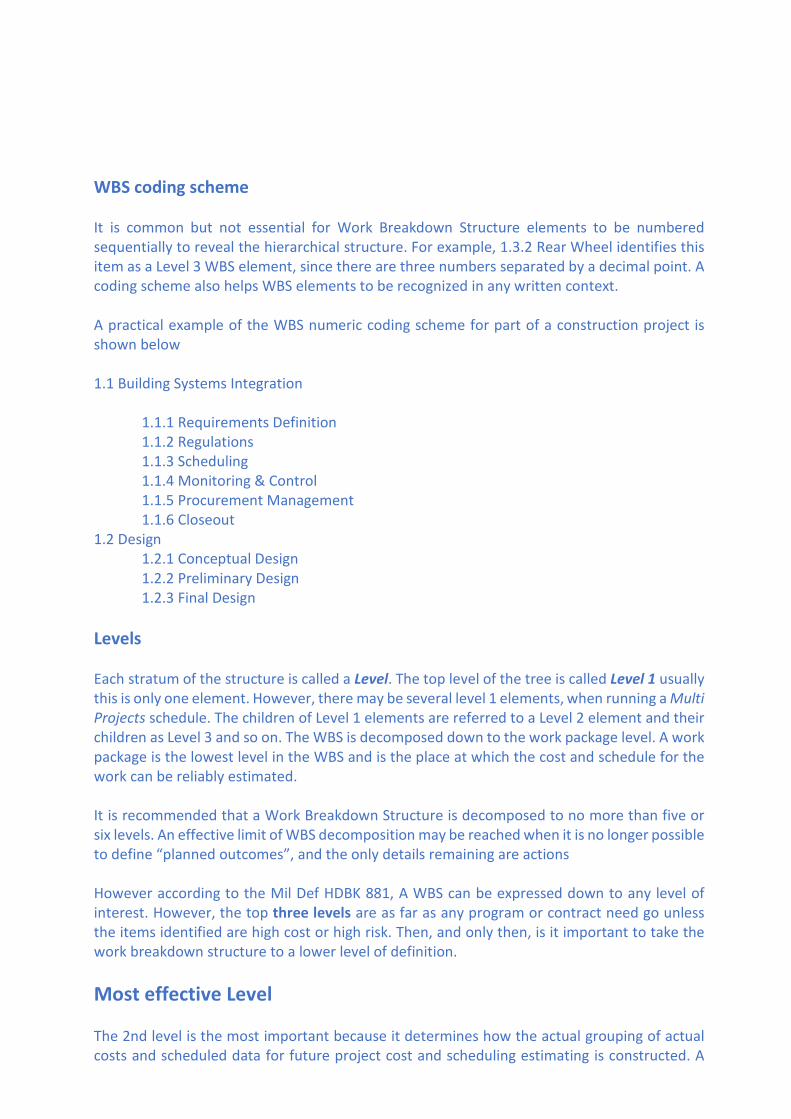
WBS coding scheme It is common but not essential for Work Breakdown Structure elements to be numbered sequentially to reveal the hierarchical structure. For example, 1.3.2 Rear Wheel identifies this item as a Level 3 WBS element, since there are three numbers separated by a decimal point. A coding scheme also helps WBS elements to be recognized in any written context. A practical example of the WBS numeric coding scheme for part of a construction project is shown below 1.1 Building Systems Integration
1.1.1 Requirements Definition 1.1.2 Regulations 1.1.3 Scheduling 1.1.4 Monitoring & Control 1.1.5 Procurement Management 1.1.6 Closeout
1.2 Design 1.2.1 Conceptual Design 1.2.2 Preliminary Design 1.2.3 Final Design
Levels Each stratum of the structure is called a Level. The top level of the tree is called Level 1 usually this is only one element. However, there may be several level 1 elements, when running a Multi Projects schedule. The children of Level 1 elements are referred to a Level 2 element and their children as Level 3 and so on. The WBS is decomposed down to the work package level. A work package is the lowest level in the WBS and is the place at which the cost and schedule for the work can be reliably estimated. It is recommended that a Work Breakdown Structure is decomposed to no more than five or six levels. An effective limit of WBS decomposition may be reached when it is no longer possible to define “planned outcomes”, and the only details remaining are actions However according to the Mil Def HDBK 881, A WBS can be expressed down to any level of interest. However, the top three levels are as far as any program or contract need go unless the items identified are high cost or high risk. Then, and only then, is it important to take the work breakdown structure to a lower level of definition. Most effective Level The 2nd level is the most important because it determines how the actual grouping of actual costs and scheduled data for future project cost and scheduling estimating is constructed. A
project manager may find it useful to know how much it cost to design (a major work element) a product after it had been completed so that the data can be used for future and analogous estimating. In other cases, the project manager may want to know how much a major part of the product cost after the project was completed General Requirements (as per DEF(AUST) 5664 Issue A) The WBS shall satisfy the following considerations • A single top WBS Element covers the total scope of work • Every WBS Element is a distinct Product or Enabling Service, which is mutually exclusive from other Products and Enabling services • Every WBS Element has either no children or multiple children • Every child WBS Element has only one parent and is a descendant of the top WBS Element • Every child WBS Element is needed to deliver the parent • If all child WBS Elements are complete, their parent is complete • The complete scope of work is captured in the WBS Default Condition Best Practices
The 100% Rule One of the most important WBS design principles is called the 100% Rule. The Practice Standard for Work Breakdown Structures (Second Edition), published by the PMI defines the 100% Rule as follows:
The 100% Rule ... states that the WBS includes 100% of the work defined by the project scope and captures ALL deliverables – internal, external, and interim – in terms of the work to be completed, including project management. The 100% Rule is one of the most important principles guiding the development, decomposition and evaluation of the WBS. The rule applies at all levels within the hierarchy: the sum of the work at the “child” level must equal 100A of the work represent by the “parent” and the WBS should not include any work that falls outside the actual scope of the project, that is, it cannot include more than 100% of the work. It is important to remember that the 100% rule also applies to the activity level. The work represented by the activities in each work package must add up to 100% of the work necessary to complete the work package
Planned Outcomes, Not Planned Actions If a WBS is built with too many action-oriented details in the WBS, it is likely to include too many actions or too few actions. Too many actions will most likely exceed 100% of the parent’s scope and too few will fall short of 100% of the parent’s scope. The best way to maintain the 100% Rule is to define the WBS elements in terms of outcomes. The WBS is an extremely valuable tool to the project planning and scheduling methodology. It can make or break a project. It creates the foundation for all of the project planning. A well-structured WBS helps ensure proper project baselines, estimating, resource use, scheduling, risk analysis, and procurement are achieved Contractor WBS Recommended Practices
Recommended Practice #1
The WBS should be decomposed to the level necessary to plan and manage the work to satisfy the project objectives
Recommended Practice #2 The WBS Dictionary should also include the following information for each WBS Element, where the information is applicable
1. Reference to lower-level WBS Elements 2. Contract Reference; 3. Entry and exit criteria, including acceptance requirements; and 4. Performance measure
Recommended Practice #3 The WBS should be prepared in a tool that enables the WBS to be contracted and expanded by WBS Element to facilitate review and to ascertain completeness
Recommended Practice #4 All internal Products should be identified in the WBS Recommended Practice #5 The WBS should not be determined by organisational arrangements
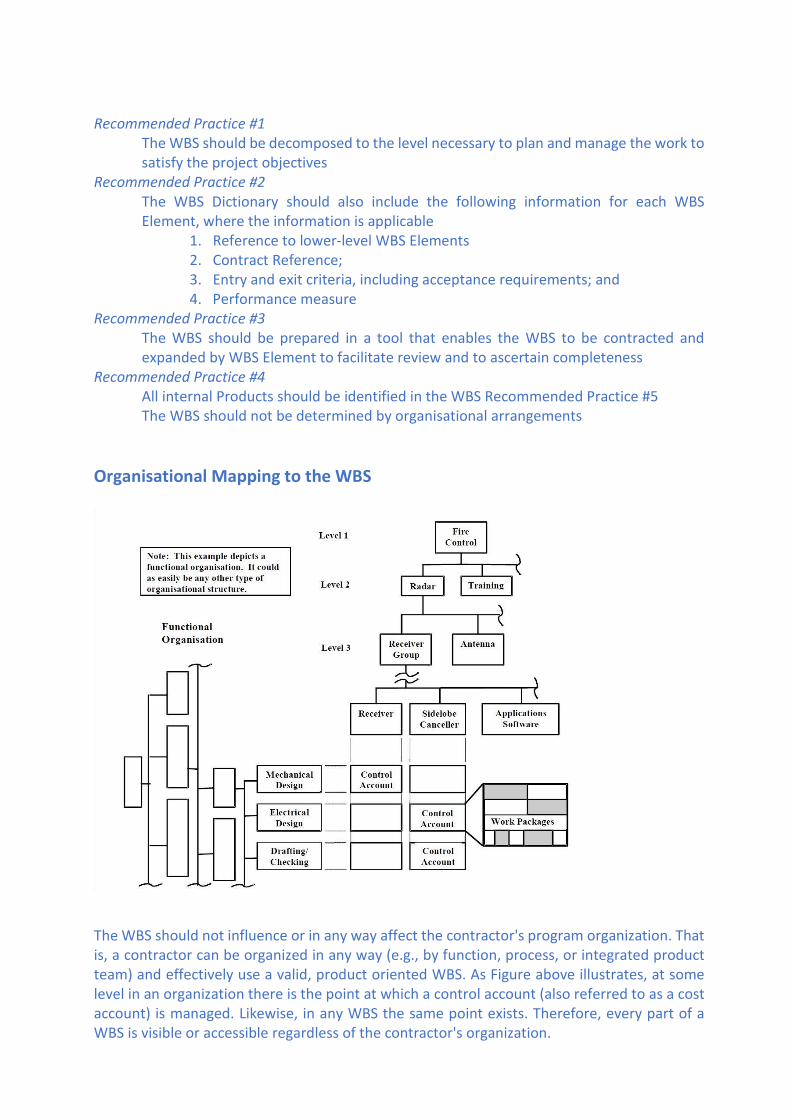
Organisational Mapping to the WBS The WBS should not influence or in any way affect the contractor's program organization. That is, a contractor can be organized in any way (e.g., by function, process, or integrated product team) and effectively use a valid, product oriented WBS. As Figure above illustrates, at some level in an organization there is the point at which a control account (also referred to as a cost account) is managed. Likewise, in any WBS the same point exists. Therefore, every part of a WBS is visible or accessible regardless of the contractor's organization.

For example, the management information needed by the government to manage the development of a radar receiver is available from the control accounts that are part of that effort's WBS. So too, the information the contractor needs to manage the development is available from the same control accounts, which in this example are a part of the contractor's Electrical Design Department. Figure 3-4 illustrates the same example but using an Integrated Product Team (IPT) structured organization and its interface with the Contract WBS. Advisories Avoiding Pitfalls in Constructing a Work Breakdown Structure Some common pitfalls to creating a WBS are indicated in the following items, keeping these few possible issues in mind when creating a WBS, the project team will be much more successful at creating a useful and accurate Work Breakdown Structure. 1. WBS is not a Plan or Schedule The WBS cannot be used as a replacement for the project plan or schedule. A WBS is not required to be created in any type of order or sequence. It is simply a visual breakdown of deliverables. 2. WBS is not an Organisational Hierarchy The WBS and Organisational Hierarchy chart are not the same thing. Although often similar looking in appearance, these two documents are very different. The Organisational Hierarchy illustrates things like chain of command and lines of communication, but the WBS is restricted simply to a project and shows only the deliverables and 100% scope of that project 3. Level of Work Package Detail When determining how specific and detailed to create work packages, care must be taken to not get too detailed. Otherwise this will cause the project manager to micromanage the project which will eventually slow down project progress. On the other hand, work packages whose details are too broad or too large become impossible for the project manager to manage. 4. Deliverables Not Activities or Tasks The WBS must contain a list of decomposed deliverables. In other words, what the client/stakeholder will get when the project is complete. It is NOT a list of specific activities and tasks used to accomplish the deliverables. How the work is completed (tasks and activities) can vary and change throughout the project, but deliverables cannot without a change request, thus do not want to list activities and tasks in the WBS. 5. WBS Updates Require Change Control Because the WBS is a formal project document, and thus any changes to it, will require the use of the project change control process. Any changes to the WBS change the deliverables and, therefore, the scope of the project. This is a most important point to help limit scope creep.

6. Avoid decomposing into too many levels A common mistake made is that decomposition of the project goes too far down. Usually five to six levels should be enough to define the Work Package A work package at the activity level is a task that:
• can be realistically and confidently estimated; • makes no sense practically to break down any further; • can be completed in accordance with one of the heuristics defined above;
• produces a deliverable which is measurable; and • Forms a unique package of work which can be outsourced or contracted out. 7. Avoid Overlapping Scope between two elements It is important that there is no overlap in scope definition between two elements of a WBS Some Additional Pitfalls According to the Mil Def 881 HDBK A sound work breakdown structure clearly describes what the program manager wants to acquire. It has a logical structure and is tailored to a defence materiel item. It can tie the statement of work, Contract Line Item Number structure, and the system description documents together. Remember: the work breakdown structure is product oriented. It addresses the products required, NOT the functions or costs associated with those products. Elements not to include The following expands the explanation of what elements are to be excluded from the WBS elements: 8.Do not include elements which are not products. For example, A signal processor, for example, is clearly a product, as are mock-ups and Computer Software Configuration Items (CSCIs). On the other hand, things like design engineering, requirements analysis, test engineering, aluminium stock, and direct costs, are not products. Design engineering, test engineering, and requirements analysis are all engineering functional efforts; aluminium is a material resource; and direct cost is an accounting classification. Thus, none of these elements are appropriate work breakdown structure elements. 9.Program phases (e. g., design, development, production, and types of funds, or research, development, test and evaluation) are inappropriate as elements in a work breakdown structure. 10. Rework, retesting and refurbishing are not separate elements in a work breakdown structure. They should be treated as part of the appropriate work breakdown structure element affected. 11.Non-recurring and recurring classifications are not work breakdown structure elements.
The reporting requirements of the CCDR will segregate each element into its recurring and non-recurring parts. 12.Cost saving efforts such as total quality management initiatives, could cost, and warranty are not part of the work breakdown structure. These efforts should be included in the cost of the item they affect, not captured separately. 13.Do not use the structure of the program office or the contractor's organization as the basis of a work breakdown structure. As previously stated, The Work Breakdown Structure is a tree structure but can also be in an Outline structure; which shows a decomposition of effort required to achieve an objective; for example, a program, a project or a contract. 14.Do not treat costs for meetings, travel, computer support, etc. as separate work breakdown structure elements. They are to be included with the work breakdown structure elements with which they are associated. 15.Use actual system names and nomenclature. Generic terms are inappropriate in a work breakdown structure. The work breakdown structure elements should clearly indicate the character of the product to avoid semantic confusion. For example, if the Level 1 system is Fire Control, then the Level 2 item (prime mission product) is Fire Control Radar. 16.Treat tooling as a functional cost, not a work breakdown structure element. Tooling (e.g., special test equipment, and factory support equipment like assembly tools, dies, jigs, fixtures, master forms, and handling equipment) should be included in the cost of the equipment being produced. If the tooling cannot be assigned to an identified subsystem or component, it should be included in the cost of integration, assembly, test, and checkout. 17.lnclude software costs in the cost of the equipment. For example, when a software development facility is created to support the development of software, the effort associated with this element is considered part of the CSCI it supports or, if more than one CSCI is involved, the software effort should be included under integration, assembly, test, and checkout. Software developed to reside on specific equipment must be identified as a subset of that equipment. Additional Considerations When the WBS process is rigorously applied, there should be:
o A clean structure for the organisation and management of the project o Clear accountabilities for project outcomes; and o The chance of work elements being missed has been minimised

10.0 The planning phase Once the project brief is agreed by the project sponsors and approved by the main stakeholders, move into the detailed planning phase. The project plan can become a working tool that will help to keep the project team focused on the project's tasks and activities and guides them towards completion in effect to “Done”. It enables managers to keep track of resources, time and progress towards achieving objectives of completeness, known as “Done”, that is there is no more chargeable work having now signed off the projects, completion and handover. In other words, it is “Done”, which must be specified in the project charter. All projects are different and the planning for each will be different. The difficulty with planning a unique activity is that there is no prototype from which to predict all the work that will need to be done, so the plan must evolve as work proceeds. Reviewing any similar projects that have been completed within the same organisation or in a similar setting to identify lessons that could be applied in a new project can be helpful. Planning can be approached by asking a series of questions:
• What activities are needed? • By when are these activities needed? • Who is going to do them? • What resources are required? • What other work is not going to be done? • How shall we know if it is working?
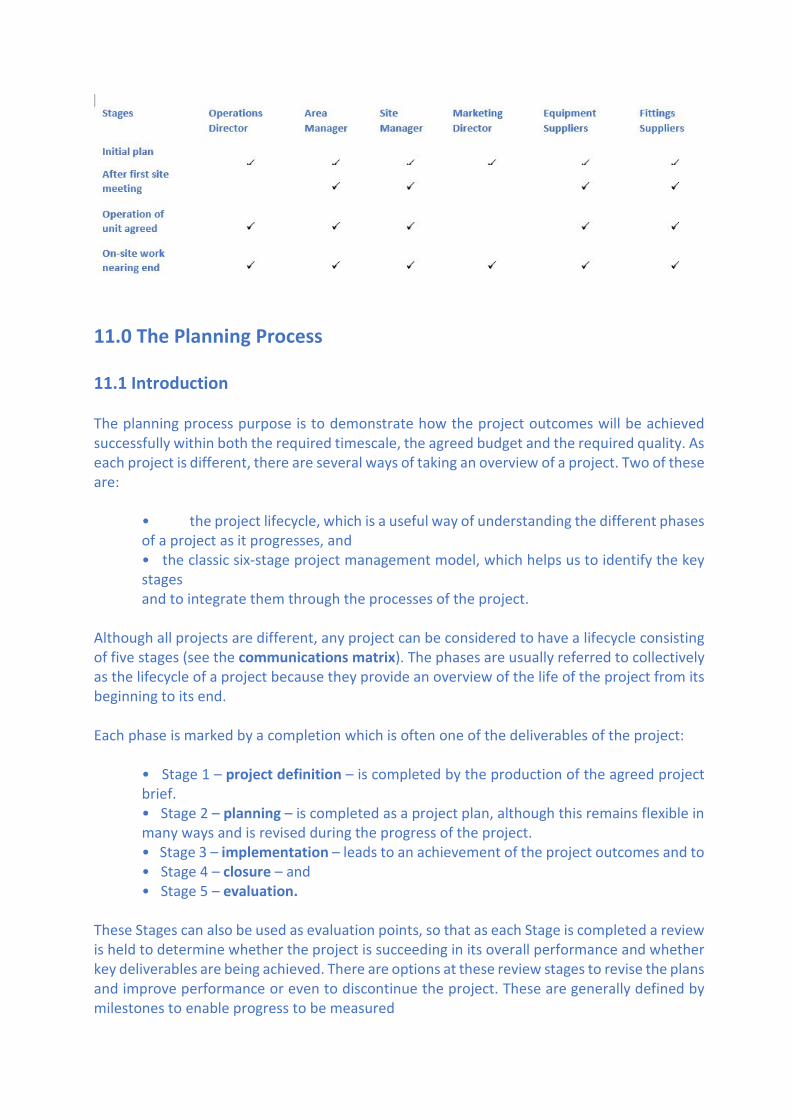
The project team must discuss the issues to produce an integrated joint plan otherwise the team usually will not create a sense of commitment which is crucial to the project's success. Identifying who the stakeholders are needs to be communicated with them and when at the different stages is paramount to the success of the project. An example of a communications matrix to provide guidance on this important part of the project is shown below. This course examines the various components of a project plan and introduces several tools and techniques to aid planning. A communications matrix The communications matrix is a way of noting who needs to be consulted and at what stage. It can be a formal chart or rough notes, but its purpose is to help minimise the problems that arise when people feel they have not been consulted. The communications matrix below shows an example of a communications matrix for putting a new building unit into use. It is an integral part of the Project Charter
11.0 The Planning Process 11.1 Introduction The planning process purpose is to demonstrate how the project outcomes will be achieved successfully within both the required timescale, the agreed budget and the required quality. As each project is different, there are several ways of taking an overview of a project. Two of these are:
• the project lifecycle, which is a useful way of understanding the different phases of a project as it progresses, and • the classic six-stage project management model, which helps us to identify the key stages and to integrate them through the processes of the project.
Although all projects are different, any project can be considered to have a lifecycle consisting of five stages (see the communications matrix). The phases are usually referred to collectively as the lifecycle of a project because they provide an overview of the life of the project from its beginning to its end. Each phase is marked by a completion which is often one of the deliverables of the project:
• Stage 1 – project definition – is completed by the production of the agreed project brief. • Stage 2 – planning – is completed as a project plan, although this remains flexible in many ways and is revised during the progress of the project. • Stage 3 – implementation – leads to an achievement of the project outcomes and to • Stage 4 – closure – and • Stage 5 – evaluation.
These Stages can also be used as evaluation points, so that as each Stage is completed a review is held to determine whether the project is succeeding in its overall performance and whether key deliverables are being achieved. There are options at these review stages to revise the plans and improve performance or even to discontinue the project. These are generally defined by milestones to enable progress to be measured

Every project is different, so each lifecycle varies also. Real life is more chaotic than the simple model shown in the communications matrix would suggest, but it can be used to provide a structure that helps to reduce the confusion by putting some limitations around different stages of the project.
Figure 2 The project lifecycle As can be seen Figure 2 is linear, the stages of a project are often iterative in practice, with refining and modification taking place throughout the life of the project. Projects can often change as they progress. This is particularly so in-service organisations such as software house or educational services, where projects are usually defined by needs and problems rather than by tangible outputs such as applications or various courses. Projects often take place in rapidly changing contexts and the impact of the changing environment on the lifecycle of a project must be managed. Flexibility is one of the keys to successful project management. 11.2 The PMI five-stage project management model At the start of a project, the amount of planning and work required can seem overwhelming. There may be dozens, or even hundreds of tasks that need to be completed at just the right time and in just the right sequence. Experienced project managers know it is often easier to handle the details of a project and take steps in the right order when you break the project down into phases. Dividing your project management efforts into these five phases can help give your efforts structure and simplify them into a series of logical and manageable steps. 1. Project Initiation
Initiation is the first phase of the project lifecycle. This is where the project’s value and feasibility are measured. Project managers typically use two evaluation tools to decide whether to pursue a project: • Business Case Document
• This document justifies the need for the project, and it includes an estimate of potential financial benefits.
Feasibility Study • This is an evaluation of the project’s goals, timeline and costs to
determine if the project should be executed. It balances the requirements of the project with available resources to see if pursuing the project makes sense.
• Teams abandon proposed projects that are labelled unprofitable and/or unfeasible.
• However, projects that pass these two tests can be assigned to a project team or designated project office.
2. Project Planning

Having received the go ahead for the project, it needs a solid plan to guide the team, as well as keep them on time and on budget. A well-written project plan gives guidance for obtaining resources, acquiring financing and procuring required materials. The project plan gives the team direction for producing quality outputs, handling risk, creating acceptance, communicating benefits to stakeholders and managing suppliers. The project plan also prepares teams for the obstacles they might encounter over the course of the project, and helps them understand the cost, scope and timeframe of the project. 3. Project Execution This is the phase that is most commonly associated with project management. Execution is all about building deliverables that satisfy the customer. Team leaders make this happen by allocating resources and keeping team members focused on their assigned tasks. Execution relies heavily on the planning phase. The work and efforts of the team during the execution phase are derived from the project plan. 4. Project Monitoring and Control Monitoring and control are sometimes combined with execution because they often occur at the same time. As teams execute their project plan, they must constantly monitor their own progress. To guarantee delivery of what was promised, teams must monitor tasks to prevent scope creep, calculate key performance indicators and track variations from allotted cost and time. This constant vigilance helps keep the project moving ahead smoothly. 5. Project Closure (Done) A project is “done” when the project teams deliver the finished project to the customer, communicating completion to stakeholders and releasing resources to other projects. This vital step in the project lifecycle allows the team to evaluate and document the project and move on the next one, using previous project mistakes and successes to build stronger processes and more successful teams. Although project management may seem overwhelming at times, breaking it down into the following six phases will help the team manage even the most complex projects and use time and resources more wisely. The six phases are: Define: The project must be discussed fully with all the stakeholders so that all key objectives and requirements are identified and documented. The costs and timescales are also established at this stage and there is often a feasibility study as well. This stage is complete when the project brief has been written and agreed. Plan: An initial plan is developed. Planning is an ongoing activity because the plan is the basis for reviews and revision when necessary, depending on how the project progresses.
Project Team: The project team members must be involved in developing the plan and are often able to contribute specialist knowledge and expertise. The building of this team and its motivation and leadership also continue until the project is finished. Communications: must take place continuously, both within the project team and between the project team and stakeholders in the project, including anyone who contributes to achievement of the outcomes. Some communications will be through formal reporting procedures, but generally many will be informal. Control: Implementation takes place during the control stage (stage 4 in the model). During this stage, the tasks and activities of the team will be monitored against the plan to assess the actual progress of the project against the planned progress. Control is essential to ensure that the objectives are met within the scheduled timescales, budgeted costs and quality. Regular reviews which may be weekly, fortnightly or monthly depending on the project duration are held to enable the plan to be revised and for any of the inevitable difficulties that arise to be resolved. Review and exit: The review is held to evaluate whether all the planned deliverables of the project have been met. It is also important because it enables information to be gathered about the processes used in carrying out the project from which lessons can be learned for the future. The exit from the project must be managed to ensure that:
• any outstanding tasks are completed; • all activities that were associated with the project are discontinued; • all resources are accounted for, including any that remain at the end and
must be transferred or perhaps written off • the project is “Done”
Many projects develop through a series of planning, actions, reviewing and re-planning in a loop. It is important to understand planning as a continuous activity rather than something that can be completed once and used without change for the duration of the project. Expect change and allow scope to change or modify the plan. 12.0 The Commencement of the Planning Stage? 12.1 Hazards to planning The planning stage of a project usually takes place before the activities start, but not always. In any case, planning always continues during the implementation of a project because there is always a need to change some aspects and to revise plans. 12.2 The project plan Although there are many approaches to planning a project, there are seven elements that are normally included in a project plan:
• a work breakdown structure to show separate tasks and activities;

• the team structure and responsibilities of key people; • an estimate of effort and duration for each task; • a schedule to show the sequence and timing of activities; • details of resources to be allocated to each task; • details of the budget to be allocated to each cost identified; • contingency plans to deal with risks identified.
The ways in which planning can be approached usually fall in one of the following:
• top-down – start by mapping out the major blocks of work that will need to be carried out and then break them down into their constituent tasks; by following the WBS • bottom-up – identify all the small tasks that need to be done and then group them into larger, more manageable blocks of work; • work backwards from the completion date if that is a given point in time, for say the start of the new financial year, July 1st, and then fill in the intermediate stages with the work that will enable the achievement of the project.
Each of these approaches has advantages and disadvantages and the one that best fits the projects circumstances will need to be chosen. In an ideal situation, should then use one of the other approaches to ensure that nothing has been missed out. It is important to document the team’s reasons and thinking and to keep any diagrams or charts produced as these will be required to provide detail in the initial plan. It is a common belief (mistakenly) by many new project managers that all that is required in planning a project is to make a list of tasks, classify them under headings, call the project team together and ask them to perform these tasks working towards the deadline. Based on experience, this will not work. Depending on the complexity of the project, high risks and cross-functional activities, this could very quickly lead to fire-fighting rather than managing the project. Project planning is about addressing the fundamental questions: what needs to happen and when? It is the process by which the activities in a project are defined, their logical sequence determined, and the effort required in terms of time, cost and quality is estimated. A project plan has two main purposes:
• it underpins the ‘business case’ (business approval to proceed with the implementation of the project, including a full investment appraisal);
• it provides a route map defining and communicating how the project will move from start to finish.
For the project manager, the project plan is the most important tool for monitoring and control. Most project planning tools and techniques have been around for a long time and have proved themselves to be useful, enabling the project manager to deliver his projects to time, cost and quality. In discussions I have had with many project managers from across the industry I found that where project planning is not given the priority it deserves, project managers failed to deliver their projects in a timely manner.

Some of the common mistakes made by new project managers, is that their planning was based on what they thought was the best way to plan the work. Some of those projects were late because they underestimated the resource requirements. Some were over budget because they did not carry out an impact analysis when the scope of the project changed and sometimes the project deliverables did not comply with the specification because they were not defined, and the monitoring of the deliverables was inadequate. Any project manager who does not produce a plan will soon run into unplanned activities, which incur unexpected costs. There is also the opportunity to filter out projects with negative returns at this point thus eliminating unproductive projects and avoiding abortive work. However, the project manager can only make these savings if they carry out cost-benefit analysis. Forcing a systematic project plan to be produced can eliminate some of the more frivolous projects. Use the project plan to check that the project is right for the business and meets the stated requirements of the project brief. A good plan can also show that the project manager took every possible precaution to ensure that the result was positive. To some project managers the downside of planning is cost. It takes time to plan and if planning goes on for too long it can drain the project budget. There is no doubt that project planning is a value-added activity. Contingency plans Contingency plans are needed to indicate what to do if unplanned events occur. They can be as simple as formalising and recording the thought processes when the question is asked w͚hat if …? and decide which options are required to follow if the ͚what if? event happened. The key points in contingency planning can be summarised as follows:
• Note where and how additional resources may be obtained in an emergency and understand the time in the plan where this may be required.
• Identify and document those dates, which if missed, will seriously affect the project
• delivery on time, e.g. gaining financial approval from the board committee that meets only once every four weeks.
• Understand the plan very thoroughly; probe for its weak points and identify those places where there is some ͚float which only the project manager knows about …
• Keep all those involved (including the project management team) well informed and up to date on progress so that problems can be addressed before they cause too much disruption.
• Recognise the key points in the project plan where there may be alternative courses of action and think through the possible scenarios for each one.
• Learn from experience – sometimes the unpredictable peaks and troughs in activity could be following a pattern – need to be able to recognise that
The following propositions for dealing with contingencies were all made by practising project managers:
• Break key tasks down to a greater level of detail to give better control. Ensure that no task is greater than two status periods
• Be prepared to overlap phases and tasks in the project plan to meet timescales but give the necessary additional commitment to communication and co-ordination this will require.
• Spend time at the beginning of the project to pre-empt many of the problems. A Peer Review of the project plan prior to commencement will provide valuable insights to potential problems
• Learn from experience, e.g. develop a list of reliable contractors, consultants, etc.
• Try and leave some float before and after things which may not be directly controlled, to minimise the downstream effect of any problems prior to, or during, such tasks.
12.3 Using a logic diagram to identify key stages To use a bottom-up approach to planning, the activity schedule is best compiled by drawing on the collective experience and knowledge of the project team that is going to carry out the tasks. Grouping their ideas into related tasks will remove duplication and enable them to start to identify activities which must run in series and those that could run concurrently. Some tasks must be sequential because they are dependent on one another: for example, cannot pour concrete until the trench has been dug and the steelwork put into place. Other tasks can run concurrently, and the plan needs to make the most of these opportunities: the most successful project plans tend to be those that optimise concurrency because this reduces the project length and intensifies the use of valuable resources. From the groups of activities and tasks, the project planner can begin to identify key stages by creating a logic diagram. This exercise can be approached by writing the key stages on cards or coloured post-it notes, so that they can move the notes around and then arrange them on a whiteboard or a large sheet of paper. Place cards labelled ͚start and ͚finish on the board first and then arrange the key stages between them in the appropriate sequence. Then draw arrows to link the stages in a logical sequence. The arrows indicate that each stage is dependent on another and sometimes more than one. 13.0 Processes in developing a project charter 13.1 Creating a Project Plan A company that provides work placements for the local unemployed people have been tasked by local council to create a job opportunities and services available for the unemployed adults in the community. The company project manager has identified the following key stages:
1 Apply for funds from council 2 Negotiate with other local, state and federal agencies 3 Form advisory group 4 Establish data collection plan 5 Collect data 6 Write directory text 7 Tender for a printer 8 Award print contracts 9 Print directories

10 Develop a distribution plan 11 Organise distribution 12 Distribute directory
The logic critical path diagram for directory production is shown below in Figure 4, illustrates each of these stages. Each stage has at least one arrow entering it and one leaving: for example, organising distribution (11) is dependent on agreeing a distribution plan (10) and collecting the data (5) cannot happen until a data collection plan has been established (4). However, preparatory activities for distribution (10 and 11) and printing (7 and 8) can run concurrently. It is assumed that the advisory group will make decisions about the acceptability of the data collection and distribution plans and will agree the printing contract.
Figure 4 Logic Critical Path Diagram The following conventions are generally accepted when drawing a logic diagram:
• time flows from ͚start on the left to f͚inish on the right, but there is no time-scale; • each key stage must be described separately; • the duration of key stages is not relevant yet; • if using coloured post-it different then coloured cards can be used for different
kinds of activities; • debate the position of each card in the diagram; • show the dependency links with arrows; • when the diagram is complete, try working backwards to check whether it will
work; • don't assign tasks to people yet; • keep a record of any decisions made and keep the diagram for future reference.
A comparison chart is not a formal technique as defined by the PMI and others but is a way of setting out for the project team and stakeholders and others the various merits of different approaches. The only essentials in this are the three criteria of quality, cost and time-scale against which subjective judgements are made. In this case study various elements of each approach are considered against these three criteria, but both the format and the method could have been different. 13.2 Identifying deliverables Project Brief

The project brief will identify the goals of the project and may express some of these as key objectives. At an early stage of planning there will be the need to identify all the project objectives and the deliverables that are implied or required from each objective. Each objective will identify a clear outcome. The outcome is the deliverable. In some cases, the outcome will be some sort of change achieved and in other cases it will be the production of something new. In either case, the project deliverables should be identified so that it will be easy to demonstrate that they have been achieved. Outputs Outputs are defined when there is a noticeably identifiable product, but outcomes are more holistic and can imply a changed state that might not be evident for some time. In certain circumstances, it may be difficult to demonstrate outcomes, for example, where cause and effect are uncertain. It is still important in such settings to identify goals and to define them in a way that will enable an appraisal of the extent to which the objectives of the project have been achieved. ͚How does the project team know when it has been successful? and what are the indicators that will indicate the successful completion has been made. Deliverables:
• need to be handed over to someone authorised to receive them; • at the handover, there should be a formal acknowledgement that the
specification has been fully met and each item has been ͚signed off in the project charter as fully acceptable;
• the deliverable will be something for which users may well will need some training to use or a product that needs to be implemented in some way. In these cases, once the deliverable has been identified, it is essential for the project manager to agree with the project team and stakeholders who will be responsible for the ongoing training or implementation, so that there are no misunderstandings about the boundary of the project.
14.0 Planning tasks and activities 14.1 Introduction One of the more difficult characteristics of planning a project is estimating how long it will take to complete each key stage. An estimate might be based on:
• the number of the tasks and the effort required to complete them; • the number of days that are not available for working on the project; • the tasks which are impacted by weather • historical data from other projects, including the experience of colleagues.
Where a project has a fixed end-date (for example, an event where a new software application is to be released on the market) it is normal to try to compress the schedule to fit all the key stages into the time available. Often it becomes clear during the execution of the project that the schedule is impossible to meet. It is beneficial to be realistic at the onset and have more accurate knowledge about what can be delivered and what cannot. Productivity may be such
that only 3.5 to 4 days each week is worked, and time needs to be built in for meetings, communication, co-ordination and the normal line-management arrangements. There is also a need to allow additional time for contingencies such as unexpected interruptions and eventualities that cannot be predicted. 14.1.1 SMART objectives Using the SMART acronym can help ensure that project managers and project team members share the same understanding of project goals and objectives set during planning and review conversations.
As goals are created, the following questions need to answer to ensure that the SMART approach is being followed:
• What is specific about the goal? • Is the goal measurable? (How do team members know the goal has been
achieved?) • Is the goal achievable? • Is the goal relevant to performance expectations or professional development? • Is the goal time-bound? (How often will this task be done? Or, by when will this
goal be accomplished?) A SMART goal could be: "Keep the Company's web page up-to-date. Does this meet the SMART criteria? What does "up-to-date" mean? How can the project team member and the project manager be sure that they are working to the same goals and objectives? How can each of them know that the member has met this goal? The following is a revised goal that meets the SMART criteria: The first Friday of every month, solicit updates and new material from the company's managers for the web page; publish this new material no later than the following Friday. Each time new material is published, review the company's web page for material that is out-of-date, and delete or archive that material. The revised goal is:
At a specific time solicit updates from a specific group of people, and at a specific time revise the web page.
Were updates solicited on schedule? Was the web page updated on schedule? These are both yes or no questions.
This requires some conversation are the updates too frequent? What should the team members do if company managers fail to respond? What other time-sensitive work is this member responsible for? With conversation, it should be possible to set a shared, achievable standard for updating the company's web page.
The goal needs to tie into the team member's key responsibilities and be relevant to the mission of the project and the company.
This sample goal does not end with a action or event but carries forward until the next review, or until it is changed for other reasons. Some goals might be time-bound by setting a deadline for the project or task to be completed. For example, "By March 31, include user instructions for downloading the new apps from the web page" When the project planning objectives have been identified, trying to ensure that each objective is SMART (Specific, Measurable, Achievable, Realistic and Timebound) is good practice or at least to have considered the extent to which these conditions could be met, as shown above. As in all planning, this process is continuous and as new information becomes available and as the project progresses, changes will need to be made to aspects of the objectives and to the sequences of tasks that contribute to achievement of the completed project. 14.3 Project Team structure and responsibilities Project teams can have great difficulty in working effectively if they are too large to work together conveniently. Experience indicates that six to eight people is often considered to be about right. Where the project needs more staff to deliver all the outcomes, the structure could consist of several teams, each with a team leader. In some projects there may not be a team but, instead, several individuals or groups making a specialist contribution at an appropriate time and a method for coordinating these inputs becomes vital. The team composition is then entered the Project Charter. At this stage, the roles will be identified in terms of the expertise or skills that are needed to complete each of the main tasks. Where members need to be recruited to the team, this process will help to identify the criteria for selection. If some of the project team have already been identified, or if the team leaders have been appointed, there is an opportunity to include them in determining the team structure. The key responsibilities can also be allocated and entered in the Project Scope and Responsibilities document

The project manager will retain the responsibility for ensuring that the decisions reflected in the authority chart are carried out. Once the levels of authority have been decided it is not difficult to decide how the approval will be sought and recorded, how those who should be informed will be told and how consultation will be arranged. All these activities involve subtasks that can be allocated to individual team members. 15 Scheduling 15.1 Introduction Scheduling is about deciding how long that each task will take to do and the sequence in which the tasks will be carried out. There are several approaches to estimating the time and effort (and, therefore, cost) required to complete a project. Some estimates may be based on experience but, because each project is essentially unique, this alone may not be enough. A clearer picture can be obtained by measuring each task in terms of the content of the work, the effort required to carry it out, and its duration. This then enables an estimate of resource requirements to execute the tasks and to begin scheduling, taking account of the current workloads of the members of the project team and their capacity to carry out the work. Generally, there are always some things that must be completed before others can be carried out. This is known as a dependency. When one task is dependent on another, the sequence needs to be planned, but there is also the possibility of delay if the dependent task cannot be started until the previous task is completed. The Gantt chart and critical path analysis are two techniques that will provide the way forward to plan for each of these issues. The Gantt chart enables the establishment of the sequence of tasks and to estimate a duration for each task. More importantly the necessary resources required to carry out the actual work are also indicated on the Gantt bars. It will show where periods of time may need to be block out throughout the duration of the project to ensure that it is completed on time. The Gantt chart is not a good tool for easily illustrating the dependencies and the impact of delay if any of the foundation tasks are not completed as scheduled. A technique called Critical Path Analysis (CPA) is frequently used to plan the implications of dependencies. 15.2 Gantt chart A Gantt chart is a graphical representation of the duration of tasks against the progression of time. Gantt charts are useful tools for planning and scheduling projects. A Gantt chart is helpful when monitoring a project's progress. A Gantt chart is a type of bar chart that illustrates a project schedule. Gantt charts illustrate the start and finish dates of the terminal elements and summary elements of a project. Terminal elements and summary elements comprise the work breakdown structure of the project. Some Gantt charts also show the dependency relationships between activities. Gantt charts can be used to show current schedule status using percent-complete shadings and a vertical

"Today" line. (See Figure 7 – Gantt chart for directory production). Use a Gantt chart to plan how long a project should take. A Gantt chart lays out the order in which the tasks need to be carried out. Early Gantt charts did not show dependencies between tasks but modern Gantt chart software provides this capability. Henry Laurence Gantt, an American mechanical engineer, is credited with the invention of the Gantt chart. A Gantt chart can be drawn quickly and easily and is often the first tool a project manager uses to provide a rough estimate of the time that it will take to complete the key tasks. Sometimes it is useful to start with the target deadline for completion of the whole project, because it is soon apparent if the timescale is too short or unnecessarily long. The detailed Gantt chart is usually constructed after the main objectives have been determined. Figure 7 Gantt chart for directory production Other information can be added to a Gantt chart, for example:
• milestones – contractual date requirements can be shown by using a symbol such as a diamond or triangle;
• project meetings could be indicated by another symbol such as a circle; • reviews of progress could be indicated by a square.
For a complex project a separate Gantt chart may be produced for each of the key stages. Usually this is done shortly before each key stage begins, this enables any last-minute contingencies to be considered. These charts provide a useful tool for monitoring and control as the project progresses. 15.3 Identifying the critical path
The critical path describes the sequence of tasks that would enable the project to be completed in the shortest possible time. It is based on the concept that some tasks must be completed before others can begin. if it is delayed for a day, the entire project will be delayed for a day unless the activity following the delayed activity is completed a day earlier. A critical path diagram is a useful tool for scheduling the dependencies and controlling a project. To identify the critical path, the length of time that each task will take must be calculated. The critical path is very useful in helping to manage any project. When the critical path has been identified, it can clearly be seen where effort cannot be compromised. If any of the activities on the critical path change, the end date of the project will be affected. Critical Path Analysis The work needed to complete the project needs to be broken down and all activities need to be defined. Once we know how long each activity will take, we can use this information to understand the duration of the project. A network schedule of activities needs to be completed. 16.0 Estimating costs, revenues and intangible benefits 16.1 Introduction Planning a project includes preparation of financial and related projections. Frequently, these will be used to:
• weigh up the economic feasibility of the project; • obtain approval from the Project Control Group or in many cases an Executive
Steering • Group in the organisation for the project to proceed; • set limits to delegation or empowerment in a formal budget; • provide the basis for accounting for project revenues and costs; • provide a means of diagnostic and, possibly, interactive control of the project.
At the beginning of the project establishment and planning stages, the project manager s focus is on understanding and determining the delivery of the project in the future. The important questions that should be addressed are shown below:
• What resources are required and what will they cost the organisation? • What products will be produced, in what quantity and of what quality? • Depending on the type of organisation, either:
o for what prices can the company a for-profit organisation sells these products and how much revenue will they generate?
o how much being a non-profit organisation, charge users for these products if these charges are to cover resource costs?
• In producing these products or offering these services, how much economic, political and/or social value will the governmental organisation delivering the project confer on their direct beneficiaries, and on other citizens and other
taxpayers generally; and by doing so, what private costs will that governmental organisation impose on citizens and other taxpayers?
• What cost savings will accrue to the client s organisation from these products As has been previously stated above planning a project is an iterative process, involving various concepts, trying them out and expressing them into something comprehensible enough to call an outline proposal for a project. These activities will result in an opportunity cost, mainly of staff time (spent on thinking, on-line discussions, meetings, etc.) that is not, being dedicated to other income earning activities. When most of these costs are incurred, however, they are sunk, irrecoverable and, therefore, immaterial to analysis of the future, at least in economic terms. A major problem to be managed is being drawn further and further into a project on the political grounds that the organisation has invested (or sunk) so much money and effort in it so far that it can't afford to pull out now. Projected benefits and costs must be calculated at an early stage in the life of the project, working as far ahead as possible, preferably until the project would be completed. There must be a business case that shows that the benefits exceed the costs by a large enough margin to warrant spending more planning time on the project, instead of working on alternative organisational activities. Estimates are the best guess that can be make given the information available at the time of estimating. It provides a way of testing the extent to which the desired aims are likely to be achieved by the organisation within the financial resources it can make available internally or raise externally. It is only when a detailed work breakdown structure has been developed and a schedule of timing that it will be possible to be more specific about the revenues and costs involved. It is probably true to state that few projects are unique. Many are look-alikes and a prime source of estimates is similar activities, past or present, elsewhere in the organisation. Data, published and otherwise, should be available from other organisations, especially those that that aren't direct competitors. Often there are industry specific cost schedules which can be used to improve the validity of the estimates. For example, “Function Point Analysis” for IT project estimating and “Rawlinson s” for construction estimating It is essential in any project to differentiate between capital costs (CAPEX) and operational costs (OPEX) and to analyse these further into stages or components of the project, based on Gantt and/or critical path charts. These elements will each require effort and resources, and they can be analysed and translated into monetary values simply by applying unit prices or rates. Revenue and intangible benefit estimates can be approached in a similar way, based on other experiences and components of the industry market. Care must be taken of financial amounts being assigned to intangible benefits because these may give rise to an impression of objectivity and preciseness that is not merited 16.2 Revenues Projects vary in how they are eventually financed. They can be purely commercial projects from which the products are sold at market prices, and so eventually the revenues they generate are
expected to cover the costs and provide an operating profit. In the meantime, development costs and working capital must be financed from share and loan capital raised by the organisation, the cost of which will be met from the profit the project makes. At the other extreme there are projects, in both for-profit and non-profit organisations, that are regarded as a cost item, for example, an IT staff training programme that is to be financed from within an organisation. There are projects in non-profit organisations in the private and public sectors, funded by a philanthropic organisation, government grant, whether it be local, state or federal, a community project financed by a grant from a major sponsor s advertising budget, such as a Power Station. Finally, in estimating revenues, it is usual to err on the low side: just as it is usual to err on the high side in estimating costs. That way there are in-built safeguards if things go slightly awry. Be careful, however, that you don't become too conservative with your estimates because this would kill off too many projects. 16.3 Project team costs All the project team and other related staff s time needs to be calculated and included in the CAPEX. These include salaries, taxes, GST, holidays, overtime, training, travel and subsistence, and accommodation for the number of project team members for the time they will be needed. This may raise various questions about the basis on which staff are costed and the relationship of the project budgeting system to other budgets and costing systems in the organisation. The basic assumptions underlying allocation of resources need careful consideration early in a project, particularly if there is likely to be substantial investment of staff time in the start-up of the performance of the project. An issue is that of how to deal with the use of existing staff and other resources that are to be allocated to the project on a temporary basis. It's common to miss accounting for these opportunity costs, or at least those when the project is a small part of any staff member s time because leaving out these costs will make the project look financially more attractive. Nevertheless, if the opportunity cost of existing staff time is not calculated in some way, there is a danger of overlooking this cost when these staff would normally be working on the core work of the organisation. This analysis could show that it may be less costly for an organisation to hire staff specifically to work on a project, rather than to redeploy existing staff. For example, situations occur when the skill requirements would mean training existing staff before they could carry out the project tasks than if experienced outside consultants were used. This raises another problem, because if part of the purpose of the project is to train staff to be more skilled, then the cost of training is a necessary project cost. Staff costs can be estimated by analysing the project into tasks that staff must complete, working out staff allocations in terms of the quantity and expertise, and finding out rates of pay, taxes and other costs. Organisations that regularly work on projects often have standard approaches to calculating and costing staff time. It is often said that construction or engineering projects (for example, roads, houses, office buildings or ships) may be unique, but as is often the case many of the project components are not, being replications of previous work. The uniqueness derives from the mixture of components and how they are to be combined. Service

types of projects e.g. schools, hospitals, freeway works often use formulae to develop operations costs. These formulae for example in a healthcare project include ratios of staff to clients (for example, the number of nurses to patients) and of one staff group to another (lecturing staff to administrative staff). 16.4 Equipment costs In many projects, staff costs generally may be the most expensive element, of course there are other costs to be considered, for example materials and equipment. Indeed, in some projects (for example, some defence and major infrastructure projects) these other costs are at least as significant as staff costs. For organisational accounting purposes, a distinction will be required between capital expenditure (CAPEX), or the acquisition of fixed assets, and revenue expenditure, or the incurring of expenses (OPEX). The work breakdown structure plan and the schedule give information about the nature of each task and this is then used to estimate the costs related to use of materials and equipment. If the organisation already has whatever equipment is needed, the only costs relating to the project may be those associated with redeploying the equipment for temporary use on the project, including any write downs of value through wear and tear. However, if equipment is normally in use elsewhere there will be an opportunity cost incurred in taking it away from its normal use. 16.5 Materials costs There are many categories of materials, supplies and consumables used in a project. As before, the materials that are in constant use and easily and f͚reely available in an organisation might be overlooked in costing the project. For example, it is easy to assume that stationery will be available in much the same way as it is for day-to-day work. However, a project is a limited activity, and if it is required to understand the full cost of achieving the outcomes, the project costing system will need to know how much the whole range of activity costs are. For example, a project can easily and inconspicuously increase the organisation's operating costs of wi-fi, IT equipment, Internet, mobile phone, paper and printing. For a project which involves construction using many materials there will be a cost related to raw materials, such as concrete, steel. Transport and storage will also need to be included. Materials which are fragile or that have a limited life may need special storage facilities. For example, if the purpose of the project is to place a special structural facade to a building, the timing and storage considerations will be very different from projects that involve use of materials that will last indefinitely. 16.6 Who should perform the estimate? The project manager is not necessarily the best person to prepare the estimates, although they should be closely involved, both as a source of information and because they need a clear understanding of what the estimates mean and what the estimators assume about outputs, inputs and the conversion process. Where there are others who have more experience or

knowledge about the work areas, then these people will be the best ones to make estimates for the project or parts of it. In some large projects there are several estimators and it is best to work independently and then through regular project estimating meetings compare estimates and brainstorm on how to arrive at realistic figures for revenues and costs. It is essential that all the estimators and any other staff who are preparing the estimate have thoroughly read the contract. It is not unusual for items in the element breakdown to be forgotten in the haste to prepare the tender estimate. Similarly, it is often helpful to involve other viewpoints to ensure that there is not any forgotten revenues and costs that arise as part of carrying out areas of work unfamiliar to the project team. Where there is person associated with the project who has experience of estimating it is undoubtably very useful to involve them. Receiving advice about any risks relating to the revenues and costs can often prevent an obvious costing error; for example, if there is a need to buy materials not generally used by the organisation, the prices of raw materials might vary over time or according to the quantity of the order. In a large project, the services of an experienced procurement officer will contribute cost savings. 16.7 Planning for quality Now having considered two of the project dimensions, that is, estimating for time and for costs, the third dimension of projects – quality, must now to be defined. The need to achieve a mature level of quality as described in ISO 9000 standard may mean that more time must be spent completing certain tasks and /or that more resources must be made available for a specific level of purpose. Having made the time and cost estimates, review them to ensure that these estimates will allow an achievement of the right quality. Most organisations have in house corporate quality assurance systems in place, which must be applied to any project for which they are responsible. However, difficulties may arise when several quality assurance systems are in operation in a multi-agency project. In such a case, it would be possible to include the development of an appropriate quality assurance framework as part of the project itself. Part of the documentation for a project will include a q͚uality manual which describes the aims of the project, how each part of the project system is organised functionally, procedural documentation that states how each task is to be completed, and any relevant technical specifications. The quality assurance process needs to be monitored and communicated to stakeholders, with regular reviews built into the reporting cycle as described in the ISO 9000 standards. 17.0 Drawing up the Implementation Schedule Once the detailed planning and risk assessments have been carried out, it is time to create the implementation schedule. A typical implementation schedule, including diagrams and charts where appropriate, will contain:
• a description of the background to the project; - the project charter, scope and objectives
• its goals and objectives in terms of intended outputs and/or outcomes; • the resource implications (budget, personnel – including any training
requirements – and facilities); • the project schedule; • how action will be taken and by whom; • a description of how the project will be managed; i.e. buildability of the project • the reporting and review arrangements; • the evaluation plan – how success will be measured; • the risks register and contingency plans. • Quality management plan
The project plan should also include an executive summary, providing the basic information and main goals and objectives succinctly in a few paragraphs.
18 High Level Project Management Software Micro Planner X-Pert Planning is a vital part of project management, but it is important to understand where the planning process finishes, and the control or management process takes over. The disciplines, which differentiate serious management from simple planning, are those concerned with:
• Setting Cost, Resource and Time baselines.
• Monitoring progress against those baselines.
• Taking remedial action and rescheduling.
• Reporting and communicating management intentions.
Micro Planner’s strengths in handling these disciplines is what sets X -Pert apart from ordinary planning packages. General Benefits
• Better control of time and resources saves money and increases margins.
• Delivery dates or other deadlines can be reliably forecast and met.
• Increased communication from easy-to-read reports helps to avoid confusion.
• Confidence is enhanced as risks are reduced.
• Opportunities for greater involvement of the whole project team in the actual planning process.
• Excellent value for money: low cost for a complete system when compared with similar functionality elsewhere.
• Ability to manage in a multi-project environment (programme management).
Ease of Use Without Compromise

Although it has arguably the most powerful and sophisticated analysis engine on the market, X-Pert is designed for ease of use - to be flexible and responsive to your requirements. After all, you need to be in control of your project right from the start - not wrestling with the software!
The X-Pert approach is to confront the complexities of project scheduling in order to focus on solutions. Rather than simplify the techniques it creates an intuitive graphical environment that provides a unique overview of your project data. X-Pert embodies a disciplined approach that enables you to use it as the cornerstone of your Project Management quality procedures. It does not duck out when the going gets tough. Beginners can use the software at a simple level - to “hit the ground running”. The more sophisticated features can remain out of sight to avoid confusion but as your knowledge of the package increases, you will not run out of power to tackle the most complex projects. Graphical Visibility X-Pert provides a unique “desktop” approach to the management of your projects. The desktop window is laid out with icons and “folders” providing mouse access to all the information in the project. In addition to the first Subproject icon, Work Breakdown icon and five folders provided in a new project, you can create new subprojects, new folders and icons, name them to suit your needs, and even nest folders inside other folders. Naturally, since folders are used for filing information about your project, you can decide where you wish to store items - networks, calendars, resources, reports etc. The Custom Menu folder provides a quick and easy method for selecting frequently used items, such as a weekly status report that you may have designed yourself. Items stored in this folder appear as a Custom Menu item accessible from the View menu. X-Pert gives you a unique overview of your project, empowering you to experiment with alternative schedules and adapt your schedule to accommodate the most unexpected circumstances. Multi-Platform Micro Planner X-Pert is available for computers running both Windows and MacOS. both systems share the same features and capacities, but the user interface has minor differences to conform to Windows or Macintosh standards wherever possible.
Collaboration
X-Pert has features that make it ideal for collaboration on large multi-site or multi-departmental projects. Self-contained project models can be created at each site using the resources at those sites and subject to different project management teams if necessary. However, where those different disciplines interface with each other, X-Pert has a unique feature to link projects together from one project file to another. This linking can take place across local or wide area networks or even from mailed-in floppy disks. Where there is a need to consolidate data from various disciplines then X-Pert can merge data from each site to form one large multi-project file where results from each section can then be viewed or rolled up into a single Work Break-down Structure.
While it is desirable that all parties collaborating should be using X-Pert, it is possible to consolidate projects with varying degrees of precision from other programs including Micro Planner Manager or Microsoft Project. Exporting and Importing In addition to its facilities to move information around from project to project, X-Pert also has Export and Import features which allow it to communicate with other software - typically databases or spreadsheets. Using basic data files that can be almost universally read, X-Pert exports selected task or cost data with specific fields. Using similar file formats, X-Pert is also able to import new tasks or update existing tasks from other software. It is therefore possible to create a scenario, for example, where project data may be updated to include actual cost information that has been generated by external financial software.
Multiple Projects If your organisation needs to manage several projects simultaneously or if there is a need for collaboration between a number of groups working on the same project you will find that X-Pert rises to the challenge: Programme Management When multiple schedules are running in parallel with each other, they can be entered as distinct network diagrams and segregated using X-Pert’s labelling system. During analysis, the program can take the requirements of all schedules into account, with the facility to impose specific priorities for particular schedules or tasks.
X-Pert’s ability to copy and paste sections of network from one place to another or to transfer whole subprojects from one project to another enable you to store libraries of standard plans or recycle previous plans.
The reporting facilities enable you to prepare reports for individual projects as well as the whole workload while integrated results for resource requirement or cash flow are also available.
Creating the Project Logic Networks Unlike many simple planning packages that rely on Gantt chart data entry, Micro Planner is designed to assemble projects as logic networks (sometimes referred to as PERT charts). This is a more professional approach that, as projects become more complex, provides greater discipline and proves easier to understand and manipulate. Gantt charts are, of course produced automatically as presentation reports and can be used to add progress or modify durations. There are two different techniques for drawing logic networks, Precedence or Activity-on-Arrow. X-Pert is one of the very few packages available that offers a choice of both techniques. It is the only package that can use both techniques within the same project.

Easy Drawing X-Pert’s unique network approach allows you to draw the network on screen more easily than using pencil and paper! Electronic drawing windows called Subprojects allow you to assemble networks of inter-linking operations that in turn can be linked to other subprojects. Networks produced on screen can be printed, retaining the layout in the same form as it was entered. Logic networks provide a powerful overview of the challenges facing a project and X-Pert’s clear view and responsive power allows project team members to work together at a computer screen to cooperate at the heart of the planning process. Rapid Network Construction A powerful facility allows you to save time by copying and pasting typical network sections from within the network or from library files. Whole subprojects can be merged from one datafile to another allowing rapid construction of standard project elements and cooperation between management teams. Open Access to All Information In addition to the network diagrams, the program offers a variety of ways to enter or modify your project informat ion …Spreadsheet -style tables allow bulk data entry. An outliner allows you to combine the construction of a Work Breakdown Structure (WBS) with task input. Information can be modified from any view including networks, Gantt charts cost reports etc., choose whichever method is appropriate. A Wealth of Features As your knowledge of the software increases, X-Pert provides an abundance of options to fully define each activity and ensure the accuracy of your plan –these include an organisational structure of three separate labels with a variable hierarchy, descriptions, sort codes, comment fields, WBS and explanatory illustrations. Durations can be expressed from weeks to minutes - even mixing scales in the same project. You can choose to run your project using calendar or numeric dates, choosing either or both for your reports. Milestones, overlapping relationships, ‘elastic’ tasks, and hammocks - all these and more are standard. Rapid Relocation
• X-Pert’s design allows rapid access to any information on the project model:
• Find facilities help to locate a task by identifying part of its description or its code name.
• Rapid opening and closing of subproject windows Zoom out, locate by sight and zoom in again.
• Multiple open windows.
These entire methods enable you move around your project model with a minimum of wasted time. Time Analysing the Project

Critical Path Analysis establishes each task’s start and finish dates, highlighting jobs that must not be delayed if the project is to finish on time. A host of facilities are available for controlling Time Analysis - including various types of imposed start and finish dates, dynamic linking from different project networks and negative float where the projects overrun contract deadlines. Getting It Right Following Time Analysis, you may wish to edit your project model to correct mistakes or adjust sequences to meet imposed requirements. You can alter or update project information by opening tasks from within any report or chart. Alternatively, you may prefer to drag the bars on a Gantt chart view to directly alter an operation ’s duration (or add progress at a later stage). Controlling paths, supercritical paths and listings of all preceding or succeeding events can be isolated for review. Activities can be overlapped using Start-to-Start, Start-to-Finish, and/or Finish- to-Finish dependencies in Precedence diagrams (or ladders in Arrow diagrams). Multiple calendars can be specified from five day to seven day or ‘weekend only’ work weeks (or any working pattern you specify), shift work and planned overtime can be introduced, and so on, until the Time Analysis results reflect your project’s exact requirements. Adding Resources and Costs Time Analysis provides you with accurate time constraints for your project but frequently it is the availability of resources that will determine your completion dates. Resources can include anything required to complete your project (people, plant or materials) and the balancing of those resources that are under the project’s control may be cr ucial to your plan. No matter how complex your project becomes, adding resources and their costs couldn’t be simpler: specify what resources can be used, how many there are and when they are available; apply cost rate changes to resources to build in real-time resource cost inflation. Tasks can use resources partially over the task’s duration, either at ‘rate -per-day’ or ‘total work- days’, or in quantity steps of 2 decimal places. Each resource can work to its own calendar if required, four cost rates (idle time, normal hours, overtime and overload) and availability profile with both normal and threshold levels. X-Pert also allows the use of Pool (consumable) resources like bricks or other bulk materials. Cash can be added as a resource when it covers costs that are independent of other resources. Skill Sets Individual resources with similar skills can be held in skill groups - each resource within a group can be allocated an efficiency percentage. When you assign a group resource to a task, X-Pert locates the least used but most effective member of the group for the work. Durations are normally based on everyone being 100% efficient if an individual is rated higher or lower, the duration is adjusted. Resource Analysing the Project Having allocated resources to your project, Resource Analysis shows you how long the project will take using the resources you have available (Resource Critical), or how many resources you will require to finish within the minimum time (Deadline Critical).

This powerful analysis process juggles the requirements for resources (maybe several per task), multiple calendars, varying priorities, group resources, splitting of tasks etc. - and it produces the results right down to the minute. Controlling Analysis In addition to the above Resource Critical and Deadline Critical options, you can choose Early or Late Aggregation (all activities starting on their earliest and latest dates respectively). With Deadline Critical Resource Smoothing, activities with float are delayed until they become critical, then resources are overloaded; Resource Critical smoothing does not overload resources until the project maximum delay (specified by you) is reached. You can decide whether to allow Resource Analysis to split activities when there are not enough resources available, or to demand an immediate start irrespective of resource availability. Specialist activities may be used to fine tune resource usage - for example, Sponge Hammocks may soak up spare resources carrying out fallback tasks. Find out what your staffing levels should be next year, or whether you can realistically slot in that extra contract without jeopardising existing work. Whether you have to say, “YES ” or “NO’, you can be confident of your future resource loading. Visible Analysis Results The revised timings that result from resource smoothing are placed in a specific time schedule that can be examined as a Gantt chart and compared directly with the original Time Analysis schedule. Resource Histograms give a clear overview of leveling results – you can freeze the current histogram, or have it updated with future leveling trials. Filtered network views represent another way to assess the full impact of resource smoothing. For example, you might display only those activities with a certain amount of free time or alternatively the most critical activities; such filtered displays reduce network clutter allowing you to focus on a project area and add refinements. Having assessed your Resource Analysis results, “What-if…” simulations allow you to experiment to find the best solution (a balance of time constraints versus the associated cost and resource implications) - one that fits your company’s policies and is realistically achievable. Project Costing When all is said and done, a Project Manager’s prime objectives are to complete the project on time and within budget. In order to meet those objectives, X-Pert offers facilities to build up a cost plan that is linked directly to the time and resource plan. In costing too, X-Pert maintains an extensive range of facilities. Costing results flow from resource analysis and go on to add cost accruals, monthly budgets for the next six months, Earned Value Analysis, budget-vs-actual cost comparisons, global or activity level adjustments and most of the other features required by current cost management standards. This means, for example, that inflation forecasts can be accounted for, as can fluctuations in charge out rates for hired equipment or personnel; it will also make allowances for the time lag between invoices being sent out and paid. In addition, resources may be switched off so that their costs are accumulated without the resource affecting the schedule. The program also has a unique facility to cost out resources that are NOT used X-Pert has several standard graphic, planning, and cost summaries. For example, a selection of cost reports provides cash flow forecasting, job costing, Earned Value

Analysis, and wastage analysis (charting inefficiencies when resources are under-utilized or over-utilised). Cost/Time curves show when money is spent, and Pie Charts can show where it is spent. Communicating the Plan Effective presentation and communication are essential for effective project management. X-Pert has a selection of Standard Reports that can be edited to suit your presentation needs. These include: Progress Report, Job Card, Milestone Report, and of course Gantt Reports (or bar charts). In addition to this suite of reports, X-Pert also provides a range of quick-view charts, allowing you to access project results more quickly - these include Gantt View, Linked Gantt Chart, Resource Histogram, and Network Diagram. The reporting facility allows tasks for inclusion in any of these reports to be selected and sorted on almost any field. Further fine-tuning allows you to hand-prune and delete unwanted reports without going through the process of re-selecting. Complex sorting and selection criteria can be saved as virtual macros for use in other reports or other projects. If none of the standard reports meet your exact requirements, you are free to design and save your own report layouts. Report Stationery allows you to create reusable report templates containing preferred fonts, logos and legends - as well as resources and tasks. X-Pert gives you a blank drawing area to arrange headers, footers, labels, resources and any data field - including static graphics or dynamic images that change with each record. The whole process is straightforward, just grab report components with the mouse and place them anywhere on the page. A ruler and guidelines help to precisely position elements. Moreover, reports can be saved in a Custom Report Menu for instant recall. Enhanced Reports Reports may be annotated with pictures or text to provide clarification of project phases. In addition, reports and charts can be saved in picture format for use in tender documents or other documents - you can even produce composite reports by placing a Gantt chart, Resource Histogram or Pie Chart as an illustration into another report. Immediate Access All your reports which include standard reports, schedules, histograms, cost pies and cost curves can be reduced to icons with all their settings on the X-Pert desktop and stored in folders. These icons are virtual macros which allow X-Pert to redisplay the report without your having to restructure the commands used to set them up in the first place. This means that a series of reports required, for example every time you update your project, can be opened and printed quickly and easily . Microsoft Project Here’s how Microsoft Project interface looks like

Microsoft Project allows companies to handle project portfolio investments, as well as successfully deliver projects with the intended business value. The tool is a flexible solution for your project portfolio management needs and daily operations, delivered through Office 365.
The tool gives companies a powerful, efficient, and visually enhanced way to manage a comprehensive range of their projects as well as programs. From meeting crucial deadlines, to selecting the right resources and boosting your office teams, Microsoft Project can deliver new and intuitive experiences to set up, manage, as well as collaborate with various teams, individuals, and enterprises.
One of important competitors of Asana and a great project management tool, Microsoft Project is a good choice for any business that is tired of attempting to improve its productivity with post-it notes, scraps of paper, and whiteboard scribblings.
Microsoft Project is created by people who have handled real-life projects and realize that some things and activities are always changing regularly. Thus, with this solution, adding new tasks or tweaking the organization of a task or a project midway through can be a fast thing to do. Microsoft Project deals with complexity in business operations in a very simple manner. While Project has an impressively comprehensive range of capabilities and features, it is relatively fast for any user to use it to perform exactly what she or he needs.
Extremely intuitive, Microsoft Project offers great balance of complexity and usability. No wonder, this project management solution is used in different industries including pharmaceuticals, construction, manufacturing, financial services, retail, health care, and government ones.
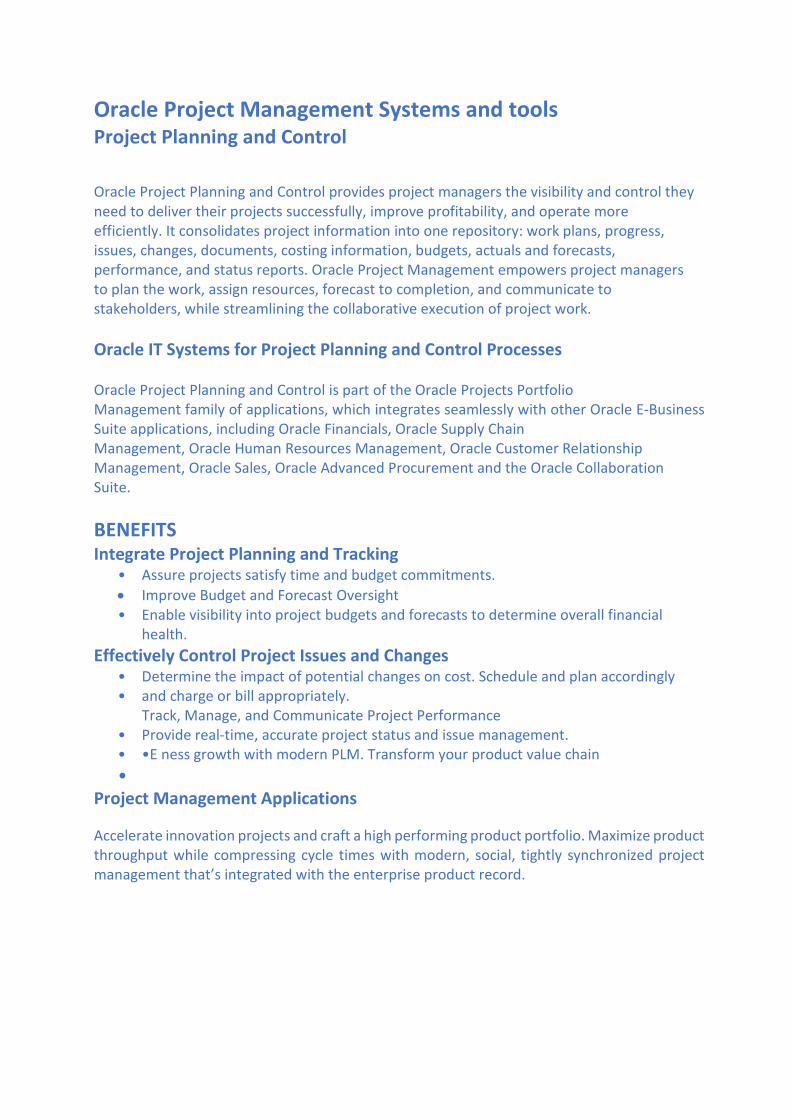
Oracle Project Management Systems and tools Project Planning and Control Oracle Project Planning and Control provides project managers the visibility and control they need to deliver their projects successfully, improve profitability, and operate more efficiently. It consolidates project information into one repository: work plans, progress, issues, changes, documents, costing information, budgets, actuals and forecasts, performance, and status reports. Oracle Project Management empowers project managers to plan the work, assign resources, forecast to completion, and communicate to stakeholders, while streamlining the collaborative execution of project work. Oracle IT Systems for Project Planning and Control Processes Oracle Project Planning and Control is part of the Oracle Projects Portfolio Management family of applications, which integrates seamlessly with other Oracle E-Business Suite applications, including Oracle Financials, Oracle Supply Chain Management, Oracle Human Resources Management, Oracle Customer Relationship Management, Oracle Sales, Oracle Advanced Procurement and the Oracle Collaboration Suite. BENEFITS Integrate Project Planning and Tracking
• Assure projects satisfy time and budget commitments. • Improve Budget and Forecast Oversight • Enable visibility into project budgets and forecasts to determine overall financial
health. Effectively Control Project Issues and Changes
• Determine the impact of potential changes on cost. Schedule and plan accordingly • and charge or bill appropriately.
Track, Manage, and Communicate Project Performance • Provide real-time, accurate project status and issue management. • •E ness growth with modern PLM. Transform your product value chain •
Project Management Applications Accelerate innovation projects and craft a high performing product portfolio. Maximize product throughput while compressing cycle times with modern, social, tightly synchronized project management that’s integrated with the enterprise product record.
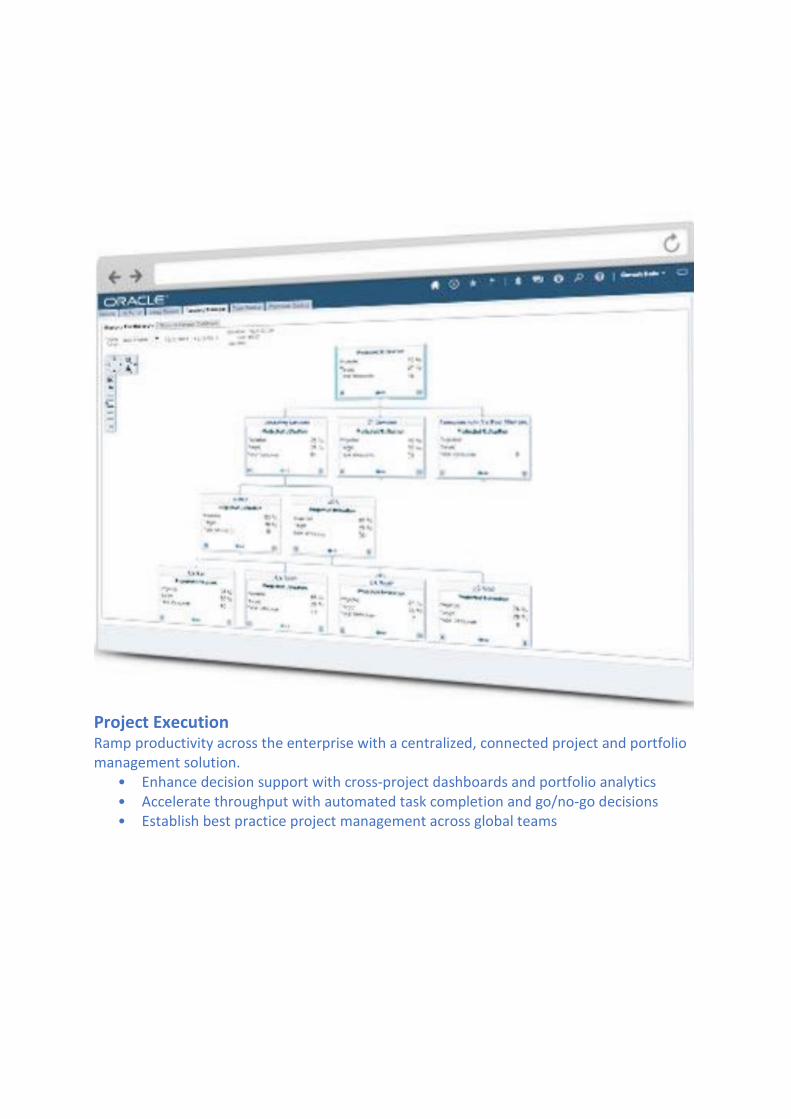
Project Execution Ramp productivity across the enterprise with a centralized, connected project and portfolio management solution.
• Enhance decision support with cross-project dashboards and portfolio analytics • Accelerate throughput with automated task completion and go/no-go decisions • Establish best practice project management across global teams
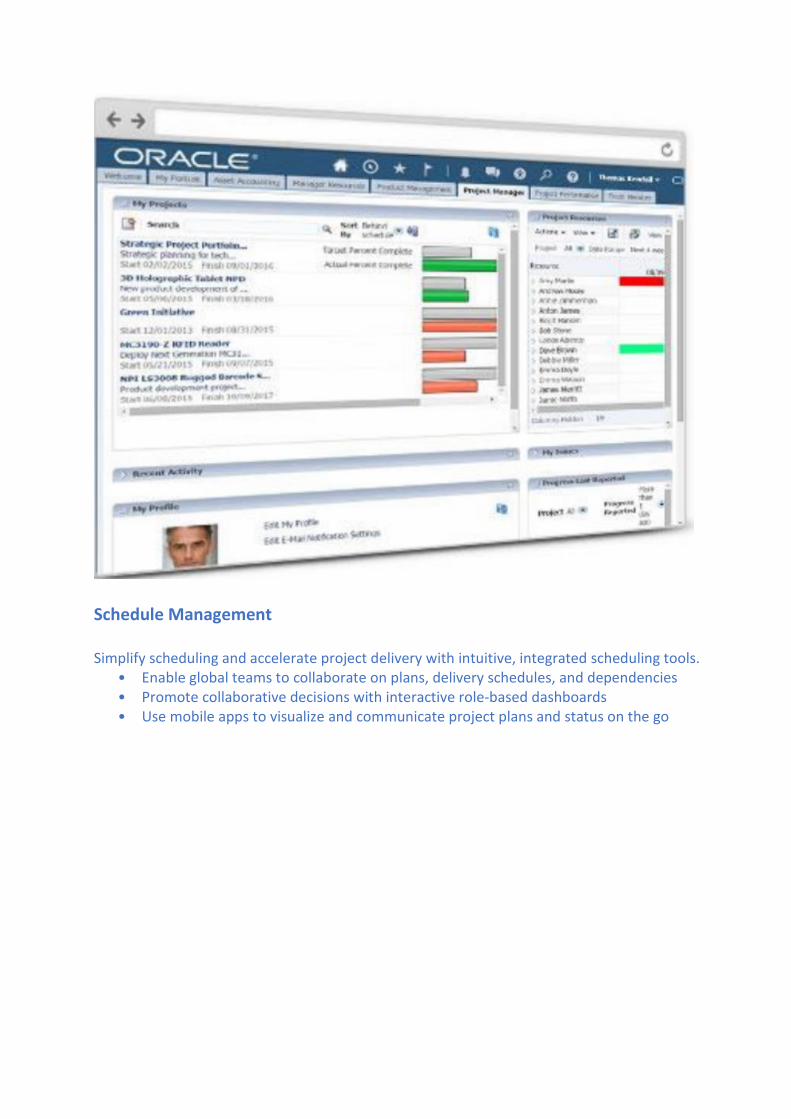
Schedule Management Simplify scheduling and accelerate project delivery with intuitive, integrated scheduling tools.
• Enable global teams to collaborate on plans, delivery schedules, and dependencies • Promote collaborative decisions with interactive role-based dashboards • Use mobile apps to visualize and communicate project plans and status on the go
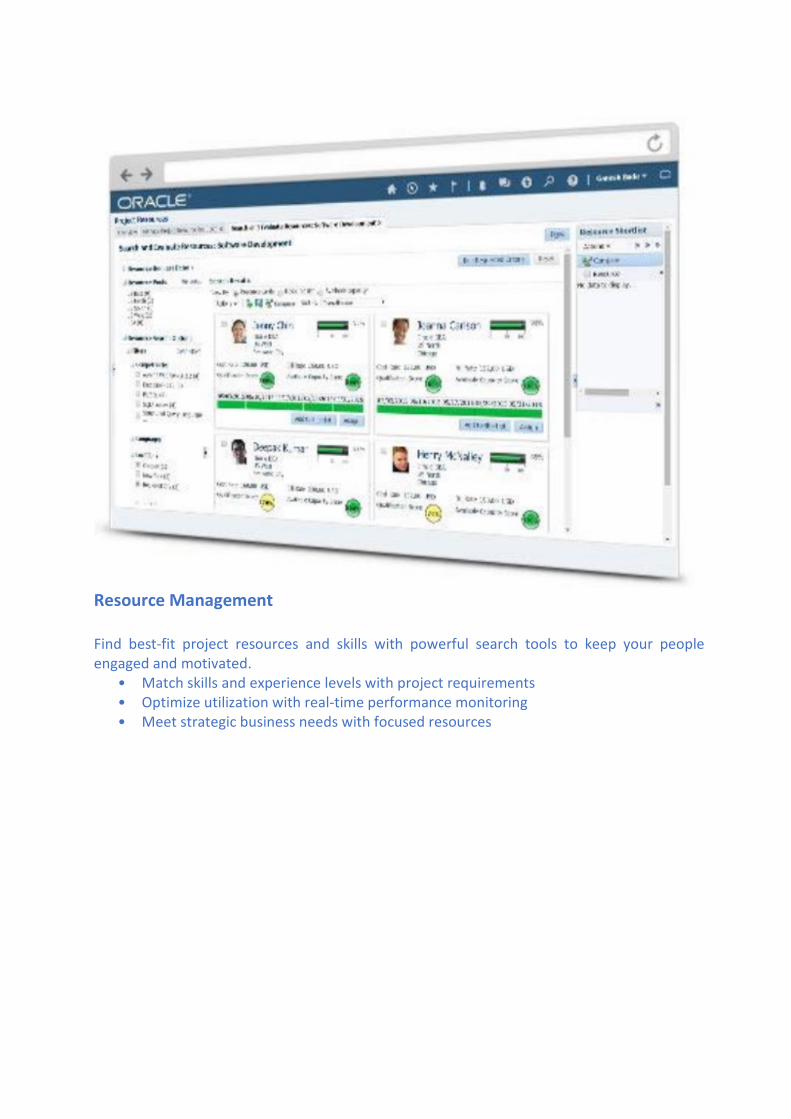
Resource Management Find best-fit project resources and skills with powerful search tools to keep your people engaged and motivated.
• Match skills and experience levels with project requirements • Optimize utilization with real-time performance monitoring • Meet strategic business needs with focused resources
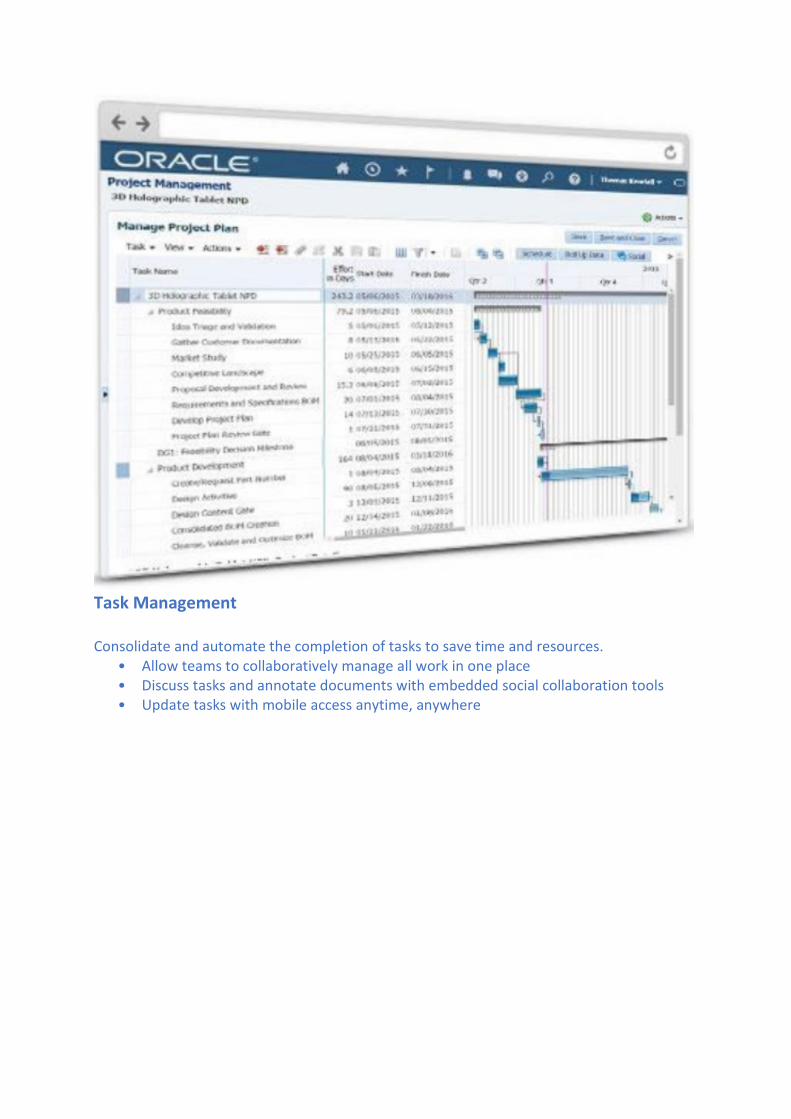
Task Management Consolidate and automate the completion of tasks to save time and resources.
• Allow teams to collaboratively manage all work in one place • Discuss tasks and annotate documents with embedded social collaboration tools • Update tasks with mobile access anytime, anywhere
Low level basic PM tools
Lany of the low level and basic Project management software is created to coordinate and streamline activities and efforts within a company. Important features of such software solutions enable the organization and delegation of tasks, essentially enhancing visualization levels of project timelines as well as processes. There are countless project management solutions that claim to be the “best” tool for entrepreneurs and businesses.
Thus, selecting the best solution can be a huge effort, as none of these tools are based on CPM technology and do not calculate to the known project management standards or best practices as defined by the ACS, AIPM, AACEi, Guild of Project Controls, ISO21500 PM standards and the PMI
ASANA Overview Asana claims to be the most popular project management software currently available on the market. However, another provider of these low-level apps is Wrike who claim to be now, the leader in the project management software category.
In general terms, Asana is a project and task management app that facilitates team communication and collaboration. You can use Asana to create projects and tasks within the projects and follow the progress of those tasks from various browser and devices. You can then add your team members to the projects and tasks, share files, and communicate with them.
Once set up, Asana eliminates the need to use email and third-party apps for corporate communication. Sharing notes, uploading several formats of attachments’, and organizing tasks is made easy, and eventually reflects on streamlined workflows and time-efficient delivery. As soon as a change is made, or a task is assigned, Asana users receive notifications in their inbox, and are invited to check, follow, like, or comment the update. You can even draw the attention of a user by simply mentioning him/her in task comments to make sure they’re in the loop. The same proce ss applies for each project-related activity, as this is the essential mechanism Asana uses to balance between prompt project delivery and adequate communication.
As to advanced features, Asana developers are proud to suggest task relating, following and searching public tasks, prioritizing completion, and change management. From the team’s perspective, the best thing about Asana is how it lets employees manage their working space, prioritize and organize tasks the way they deem necessary, upload files, delegate duties, and finally report in a clean and accurate way.
Finally, Asana genuinely complied with all customer support expectations, as it has a brilliant technical team you can contact in several ways. Technicians are fast, knowledgeable, and ready to help, and can also offer some quality onboarding for new and current integrations. If you’re lucky enough to run a small and efficient team, you may even benefit from Asana for free. Larger teams, on the other hand, make use of a moderate pricing scheme, where the amount to pay depends exclusively on the number of involved users. The more members your team has, the less you will pay for each of them. As simple as that!

Overview of ASANA benefits As noted previously, the secret of Asana’s success is the unique combination of project management and collaboration tasks, which eventually streamlines even the most complex workflows in the largest teams. The platform is most frequently applied to create, categorize, and schedule projects in a special calendar, prioritize daily tasks, and improve concentration using the outstanding Focus mode feature. As satisfied users confirm, the ability to add custom fields and track only what is exclusively important to you is the biggest catch about this system.
At the same time, Asana allows users to track their tasks and projects up to completion, and to generate amazingly detailed progress reports. Within the same platform, you can attach various file formats, and share project-related documents with your team without having to use emails or third-party communication channels. At the same time, projects and tasks can be starred or tagged as favourites, so that the seeker won’t have any trouble locating them in the database.
Another top benefit is that Asana eliminates most of the challenges large teams face when trying to keep their teams together, and that’s all thanks to its email notifications. For timely and easy viewing, team members can discuss the project’s progress while it is happening, share it, comment on it, upload a file, or simply let everybody know that they like the change. All relevant conversations are saved on Team Pages, which is where most innovative ideas come from.
This way, the employee won’t miss any important update; neither will the team deal with the consequence of duplicated work. As a project manager, you will oversee deciding who gets to do what and assign permissions for each project member/manager. Once they jump on their tasks, you can use the Harvest integration to follow their progress but leave an open opportunity for them to unfollow if the task does not concern them.
Page | 54 Copyright © 2019 Victoria University and Raphael M. Dua
As an employee, on the other hand, you should look forward to private and group conversations where you can exchange opinions and get involved abandoning neither the office nor the system.
What we’ve mentioned so far is critical to every project management system, but it doesn’t really show the competitive power of Asana compared to other collaboration and PM apps. For the purpose, one must try the product for free and navigate its intuitive interface or get a grasp on advanced features the way our experts did. What they really appreciate about this system are the efficient dashboards, where the structure is once again team friendly. Each member can simply log in and see how a project is doing, without necessarily attending meetings. As you can guess, this is a genuine blessing in disguise for remote teams.
Another advanced capture that deserves attention is the smart inbox – instead of tons of boring and unwanted messages, the employee will receive only important project updates, and convert them into actionable tasks the very same moment. Meetings, nevertheless, are not excluded from the game: they simply become more productive, particularly in terms of fixing bugs, generating leads, or hiring an applicant. Depending on the permissions assigned by the admin, the meetings can even be attended by guests, partners, and other external collaborators.
Overview of ASANA Features • Activity feed
• Add assignees, attachments, and hearts to tasks
• Automatic updates to email/inbox
• Create custom calendars and views
• Email bridge
• My Tasks list and Focus Mode
• Track tasks and add followers
• Get notifications and reminders
• iPhone support, HTML5 mobile site
• Multiple workspaces
• Project Sections and Search Views
• Real-time updates
• See team members’ tasks and priorities
• Set goals, priorities, and due dates
• Set project permissions
• Project and task creation
• Comment on tasks
• Task dependencies
• Gantt Charts (Asana has Timeline)

Page | 55 Copyright © 2019 Victoria University and Raphael M. Dua
• Kanban support (Asana has boards)
Wrike Wrike is a management and collaboration solution that can give you real-time project insights. Created with the aim of making your day-to-day work operations faster and more transparent for your teams, Wrike will work as your business project hub, allowing users to discuss tasks and ideas easily, manage schedules and securely store files in the cloud.
With Wrike, your teams can organize tasks and projects in a single, unified workspace. At any given time, your employees can easily access the uploaded files. Your managers can delegate tasks to employees, participate in group discussions, manage schedules using interactive Gantt charts, all in real time. This real-time feature is a crucial part of Wrike, as it aims to provide users the latest updates based on the status of your projects. Wrike’s built-in analytics tools on the other hand can give companies a quick visual update of their projects’ progress.
When it comes to management tools, the tool offers useful features that are mainly designed for management purposes. Depending on your management style, the tool’s wide range of features, such as the time-tracker, is effective in monitoring how the resources of your company are being managed. Trello
Trello claims to be another of the important Agile style PM apps and is better than it’s competitors. It is a uniquely structured and highly visual project management tool. Adopted from a Kanban model, Trello basically runs like a company bulletin board where you can use and pin virtual 3×5 cards. Though it’s a relatively simple tool, Trello offers many extra features including customizable permissions, file storage, and automatic email notifications.
Compared with Asana, the tool is more visual-oriented as Trello’s projects and tasks are pinned on cards. Other important features include checklists, card aging, the capacity to copy cards or boards, customizable permissions, producing templates for projects or tasks, markdown formatting, interface customization, and unlimited file attachments. JIRA –
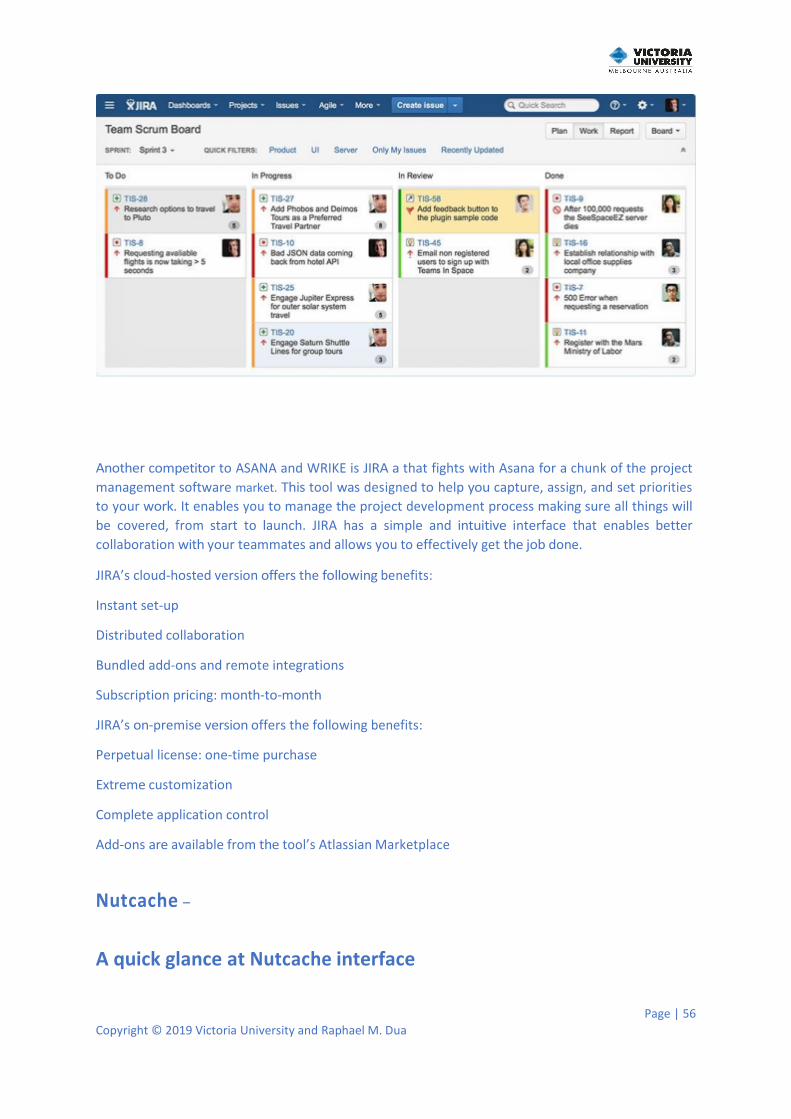
Page | 56 Copyright © 2019 Victoria University and Raphael M. Dua
Another competitor to ASANA and WRIKE is JIRA a that fights with Asana for a chunk of the project management software market. This tool was designed to help you capture, assign, and set priorities to your work. It enables you to manage the project development process making sure all things will be covered, from start to launch. JIRA has a simple and intuitive interface that enables better collaboration with your teammates and allows you to effectively get the job done.
JIRA’s cloud -hosted version offers the following benefits:
Instant set-up
Distributed collaboration
Bundled add-ons and remote integrations
Subscription pricing: month-to-month
JIRA’s on-premise version offers the following benefits:
Perpetual license: one-time purchase
Extreme customization
Complete application control
Add-ons are available from the tool’s Atlassian Marketplace Nutcache –
A quick glance at Nutcache interface

Page | 57 Copyright © 2019 Victoria University and Raphael M. Dua
Nutcache puts efficiency in your project management and collection process, monitoring the whole thing from estimates to you getting paid. The tool’s free version can immediately track the time you spent on your projects and quickly generate invoices. Developed by Dynacom Technologies, this project management solution allows you to send invoices and quotes to clients, allowing you to collect payments faster.
Being a good tool for small businesses and even large companies, Nutcache combines project management, time management, collaboration, and invoicing into a neat, single, but very powerful platform. Nutcache provides users with a platform that offers collaborative boards, a useful project dashboard, as well as invoicing and time management tools. In addition, Nutcache comes with a multilingual capacity, making it a good partner for companies that have a global reach and for firms that are based outside the United States. Basecamp
Basecamp is another app that offers a comprehensible solution across various devices
It boasts a phenomenal track record with a lot of popular companies such as Twitter, National Geographic, and Nike. Basecamp web portal has a to-do list and a discussion board, enabling your group members to comment on various tasks, while at the same time serving as a streamlined hub for your file sharing needs that you can quickly integrate with your email.
What’s more Basecamp features a user-friendly calendar so you can stay on top of deadlines and monitor progress on your tasks. Basecamp also provides you with the capacity to upload collaborative files as well as customize the site’s granular controls to only include relevant information to selected users. You can find more information about this tool in our detailed review of Basecamp.

Page | 58 Copyright © 2019 Victoria University and Raphael M. Dua
Conclusion This course has focused on planning a project. At this stage it may be useful to recap on the learning objectives introduced at the beginning of the course and to think about some of the issues associated with them. This will allow:
• The ability to be able to develop plans with relevant people to achieve the project's goals.
• This will involve identifying and finding ways of including the appropriate people in the project.
• The ability to be able to break work down into tasks and determine handover procedures
• so that the work is manageable, and progress can be tracked.
• The ability to be able to identify links and dependencies and schedule to achieve deliverables. We introduced techniques that will help you to schedule and to identify dependencies so that you can plan to use the concept of the critical path.
• Estimating is part of planning and now can be able to estimate and cost the human and physical resources required and make plans to obtain the necessary resources.
• The ability to be able to allocate roles with clear lines of responsibility and accountability and to allocate tasks that are realistic and equitable and accommodate other workloads. It is important that the team feel that their tasks are achievable and that they know to whom they are accountable.
• The ability to be able to plan for effective communications within the project activities by establishing appropriate and agreed meeting schedules and reporting control and communication methods.