epiwork - cordis...epiwork(d1.2((3! practical transmission measures in the presence of reinfection...
TRANSCRIPT
Information and Communication Technologies
EPIWORK
Developing the Framework for an Epidemic Forecast Infrastructure
http://www.epiwork.eu
Project no. 231807
D1.2 Practical transmission measures in the presence of re-infection
Period covered: month 13th – month 24th Start date of project: February 1st, 2009 Due date of deliverable: 1-31-11 Distribution: public
Date of preparation: Duration: 12 months Actual submission date: 2-15-11 Status:
Project Coordinator: Alessandro Vespignani Project Coordinator Organization Name: ISI Foundation Lead contractor for this deliverable:
2011 © Copyright lies with the respective authors and their institutions
2 EPIWORK D1.2
Work package participants
The following partners have taken active part in the work leading to the elaboration of this document, even if they might not have directly contributed writing parts of this document:
• TAU • FGC-IGC • LSHTM • BIU • FFCUL
Change log
Version Date Amended by Changes
Table of Contents
Practical transmission measures in the presence of reinfection 3 Epidemic threshold for models with reinfection on random networks 3 Epidemics with partial immunity to reinfection 6 Transmission measures and the Reinfection Threshold 11 A spatially stochastic epidemic model with partial immunization shows in mean field approximation the reinfection threshold 14 Measuring transmission and reinfection via internet-‐based surveillance during the 2009 H1N1 influenza pandemic 19

EPIWORK D1.2 3
Practical transmission measures in the presence of reinfection
Deliverable 1.2, entitled “Practical transmission measures in the presence of reinfection,” consists of major publications that are to appear or already appear in prestigious international journals dealing with theoretical biology and epidemiology. The articles represent the state-of-the-art in the field. Below we describe the key contributions of each article arranged by EPIWORK partner.
Epidemic threshold for models with reinfection on random networks
(Full details may be found in in Roni Parshani, Shai Carmi, and Shlomo Havlin (2010). Epidemic Threshold for the Susceptible-Infectious-Susceptible Model on Random Networks. Physics Review Letters 104:258701)
Diseases spread in a population as infected individuals infect other individuals with whom they are in contact. In recent years, several models have been developed to mathematically characterize the spread of diseases. The disease spreading is best modeled as a sparse network, where the individuals are the nodes and the contacts are the links connecting them. Two epidemic models of particular importance are the susceptible-infectious-recovered (SIR) and susceptible-infectious-susceptible (SIS). In these models, the N network nodes are initially susceptible (they currently do not have the disease, but might become infected later), except for one randomly chosen infected node. At each time step, an infected node infects each of its neighbors with probability r. Infected nodes remain as such for τ time steps, after which they become either recovered (cannot further infect or become infected) in SIR or susceptible again in SIS. Hence, in SIS individuals can be infected multiple times.
A fundamental question in the study of epidemics is, will a disease spread throughout the population, or will it die out? The answer to this question depends on the values of the infection and recovery rates, as well as on the nature of the connections between the individuals. For the SIR model on random networks, the epidemic threshold and the critical infection rate above which the disease infects a nonzero fraction of the population were previously derived. However, for the SIS model, the calculation of the critical infection rate is significantly more involved due to the possibility of multiple infections or REINFECTIONS of the same node.
Disease spreading can be seen as a growing percolation process, in which, starting from a given seed, links are being added to the growing network with probability p. The critical infection rate in which the disease spreads throughout the network is equivalent to the percolation threshold in which a spanning cluster appears. To complete the mapping, we specify the epidemic equivalent of p, that is, the probability of a node to infect its neighbor. This probability is different from r, since an infected node-i (see Fig. 1) can infect its neighbor-j only as long as it is still infected, for τ time steps. Therefore, the desired probability is given by:
1 (1 )p r τ= − − (1)

2011 © Copyright lies with the respective authors and their institutions
4 EPIWORK D1.2
The critical infection rate rc for a given τ can then be obtained by substituting pc in Eq. (1). To find pc, we define <ni>, the average number of susceptible nodes infected by an already infected node i. If <ni > >1, the disease will keep on spreading until a nonzero fraction of the network is covered [25].
In SIR, only the descendants of a node should be taken into account, whereas in SIS, the ancestor could also be reinfected. In terms of Fig. 1, node i, once infected, can infect not only its descendants j1; j2; . . . (in SIR) but also its ancestor a (in SIS).
Figure illustrating the reinfection path π for the SIS model on a random network. Now, the average number of neighbours infected by node-i for SIR model is
2
( ) ( 1) ( 1)
1 / 1
i SIRk
kP kn p k pk
wherek k
κ
κ
< > = − = −< >
− = < > < > −
∑
At the epidemic threshold 1/2( 1) 1 1
1c cp so that rτ
κκ
κ−⎛ ⎞
− = = − ⎜ ⎟−⎝ ⎠.
For the SIS model, we need the probability of reinfection π, as seen in the above Figure. This requires taking into account the following effects.
1) Since i must have been sick before infecting j1 in the first place, j1 can only reinfect i after i has recovered and become susceptible again.
2) Moreover one of the other descendants of i (j2, j3,… jk-1 in figure) might reinfect i before j1 does.
Now the average number of neighbours infected by node i is:
( 1)i SISn p κ π< > = − + The first term on the right is the standard SIR type term while the second term is the SIS-specific reinfection probability. The probability of j1 to infect i may be shown to be:
1 1
1
(1 ) 1 (1 )[1 (1 ) ]1 (1 ) 2
ss
ts
r r rrr r
ττ
τπ− +
=
− − −= − − =
− − −∑

EPIWORK D1.2 5
Taking into account that neighbours other than j1 may reinfect node-i first we obtain:
' 1 '1
' 0
1 ( ) (1 )' ' 1
k kt t
tk
p pk k
κκ κ π ππ π
− −−
=
−⎛ ⎞ −= ⎜ ⎟ +⎝ ⎠
∑
At the SIS epidemic threshold for both ER and scale-free networks we have:
( )( 1) ( ) 1.c cp r rκ π− + = Thus it is possible to plot the critical infection rate rc as a function of τ
Figure: Simulation results for critical infection rate. A) Simulation results (symbols) of rc versus ô for ER networks with <k>=2,4 and SF networks compared to theory (lines). b) Theoretical values of rc (solid line) compared to mean field (obtained by setting π=p ; dashed line) and simulations (circles) for <k>=4.
In summary, we analyzed the propagation of diseases on random networks according to the SIS model. The presence of reinfections in the model poses a great challenge since it can no longer be mapped into a simple branching process. We overcame this problem by calculating the reinfection probability. With this probability, we could recast the problem back into a branching process with an effective branching factor that takes into account not only the descendants of a node, but also its ancestor, weighted by the probability of reinfection. The condition for an outbreak was then found using the reinfection probability and percolation arguments. The full details of this study have been published in Roni Parshani, Shai Carmi, and Shlomo Havlin (2010). Epidemic Threshold for the Susceptible-Infectious-Susceptible Model on Random Networks. Physics Review Letters 104:258701

2011 © Copyright lies with the respective authors and their institutions
6 EPIWORK D1.2
Epidemics with partial immunity to reinfection
We studied the partial immunity SIR epidemic model of an important SIR model (Gomes et al.) in which infection confers partial immunity to reinfection. In particular we have been interested in the existence of a reinfection threshold which has been the subject of controversy over the last years. In Katriel (2011), we show that when the demographic process is excluded, the behavior switches from epidemic to endemic as the basic reproduction number R0 crosses the reinfection threshold R0=1/σ. Thus the concept of `reinfection threshold' is particularly clear in the case of no births and deaths, in which it represents a bifurcation. This is unlike the case where births and deaths are included, in which an endemic equilibrium exists for any R0>1, that is both below and above the reinfection threshold, and for which the reinfection threshold represents a sharp but smooth increase of the infected fraction of the population. The basic model may be written as:
( )S SII S R I IR RI I
β
β σ γ
σβ γ
ʹ′ = −
ʹ′ = + −
ʹ′ = − +
where as is usual, the proportions of susceptible, infected and recovered individuals are denoted by S, I and R. The parameter β measures the transmission rate of the infection to susceptibles, and 0 1σ< < is the reduction in susceptibility of individuals who have been infected at least once before, and γ is the rate of recovery.
Let 0 /R β γ= . It is easy to show that when 0 1/ ,R σ> the model has an endemic equilibrium
* * *
0, 0,0, 1 1/ 1/S I R R Rσ σ= = − = which is globally stable. Otherwise there is no endemic equilibrium. Thus 0 1/ ,R σ= is the reinfection threshold above which the disease transmission is strong enough to sustain the disease endemically, even without new susceptibles from births. Note that the presence of the reinfection threshold has been debated for years in the literature, while this simple model identifies the threshold unambiguously.
Fig.1 provides a graph of epidemics and shows the way in which they are governed by the infection threshold. In Fig. 1 we plot the epidemic curves for R0=1.5 and three values of σ. When σ = 0 or 0.5 we are below the reinfection threshold, so that we have an epidemic which dies down, while in the case σ =0.75 > 2/3 =1/R0 we are above the reinfection threshold, and we see I(t) approaching the endemic state I* = 1/9 .

EPIWORK D1.2 7
It is possible to make a deeper analysis which finds the following:
Size of the epidemic below the reinfection threshold It now becomes interesting to study the attack rate A which is the total fraction of the
population ever infected during the epidemic. And the final size Z which is the total number of infections divided by the population i.e, the average number of infections per individual. Unlike the SIR model, in this case these are not the same terms since Z counts reinfections while A does not. We have found:

2011 © Copyright lies with the respective authors and their institutions
8 EPIWORK D1.2
The results may be visualized as shown in Figure below where the attack rate A and final size Z is plotted as a function of R0, and nicely show the contributions of reinfection.
EPIWORK D1.2 9
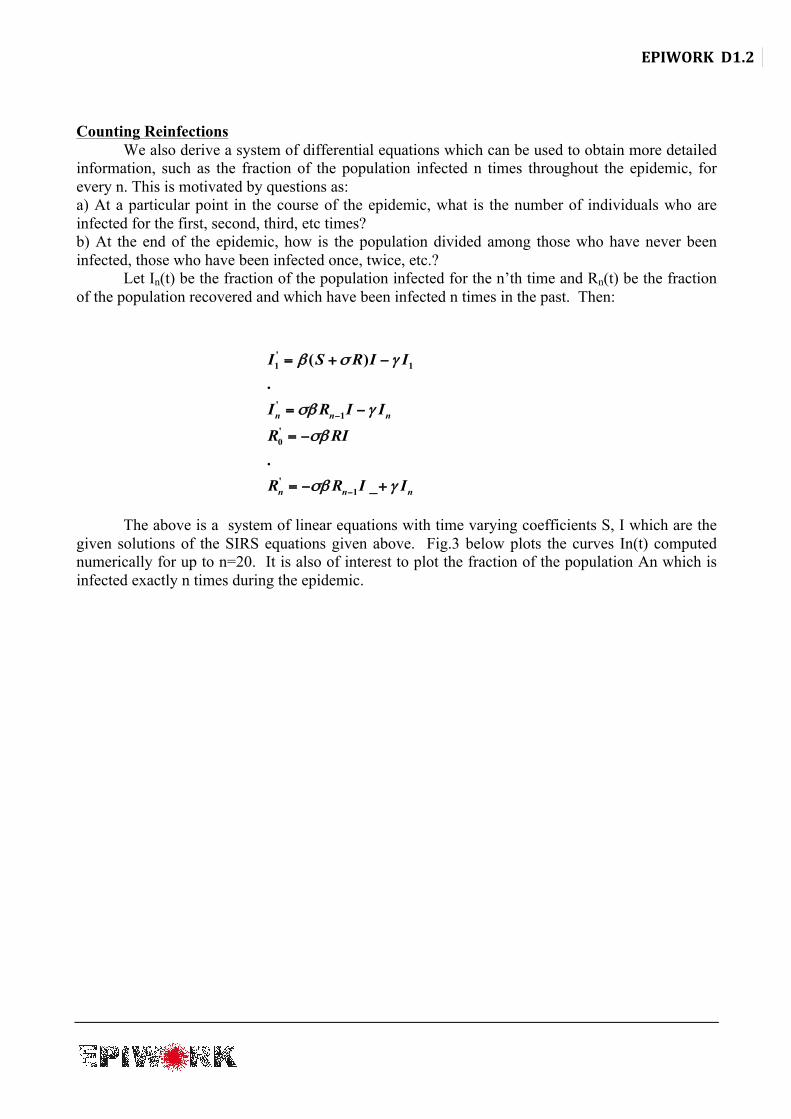
Counting Reinfections
We also derive a system of differential equations which can be used to obtain more detailed information, such as the fraction of the population infected n times throughout the epidemic, for every n. This is motivated by questions as: a) At a particular point in the course of the epidemic, what is the number of individuals who are infected for the first, second, third, etc times? b) At the end of the epidemic, how is the population divided among those who have never been infected, those who have been infected once, twice, etc.?
Let In(t) be the fraction of the population infected for the n’th time and Rn(t) be the fraction of the population recovered and which have been infected n times in the past. Then:
'1 1
'1
'0
'1
( ).
._
n n n
n n n
I S R I I
I R I I
R RI
R R I I
β σ γ
σβ γ
σβ
σβ γ
−
−
= + −
= −
= −
= − +
The above is a system of linear equations with time varying coefficients S, I which are the
given solutions of the SIRS equations given above. Fig.3 below plots the curves In(t) computed numerically for up to n=20. It is also of interest to plot the fraction of the population An which is infected exactly n times during the epidemic.

2011 © Copyright lies with the respective authors and their institutions
10 EPIWORK D1.2
The above figures give unusual visual interpretation of the extent of reinfections, their distribution and recirculation, and their proportional contributions to the final size Z.
The above analysis appears in more detail in the publication: Katriel G. (2011) Epidemics with partial immunity to reinfection. Mathematical BioSciences (in press)

EPIWORK D1.2 11
Transmission measures and the Reinfection Threshold
Vaccination against childhood infectious diseases has been a huge success and mathematical models have offered accurate transmission measures to guide the design of vaccination programmes. The unifying feature of this class of infections is that acquired immunity is highly protective and long lasting, so that recovered or vaccinated individuals are unlikely to be reinfected. However, many pathogens have evolved a variety of ways to circumvent immunity making us face vaccines whose effects are less powerful and more difficult to model. Relatively simple mathematical models have uncovered thresholds that appear critical to the success of interventions. However, their practical utility requires refined models that can make contact with data.
The most deadly human malaria parasite, Plasmodium falciparum, has an immense capacity to reinfect its human host, and this has been largely attributed to its ability to undergo antigenic variation. In van Noort et al (2010), we developed a model for antigenic variation in malaria parasites where, due to a dominance gradient on parasite variants and variant-specific antibody responses from the host, each infecting parasite carries information about past infection history of its host. This is the essence for a practical transmission measure for this complex system which, evidently, requires further testing, refinement and validation. We now proceed to describe the idea in more detail.
Although people living in malaria endemic regions typically carry Plasmodium falciparum parasites throughout life, clinical symptoms decrease markedly with age. Naturally acquired immunity to the disease involves many components and their relative importance is only partially understood. However, antibodies undoubtedly form a critical component of immunity to the asexual blood stages, and the parasite-encoded variant surface antigens (VSAs) exported to the surface of infected erythrocytes (IEs) are important targets. P. falciparum parasites possess several VSA families, of which the best characterized is P. falciparum erythrocyte membrane protein 1 (PfEMP1) encoded by approximately 60 var genes per genome. The level of diversity among var genes varies greatly both between and within individual genomes. The importance of PfEMP1 in malaria pathogenesis has motivated the development of theoretical models of diversity and immune selection.
Individual IEs express only a single PfEMP1 variant at a time. Early in blood stage infection after liver release, many var genes are transcribed by the various IEs, but gradually this pattern changes and particular subsets of var genes are predominantly expressed, while others may still be expressed at low frequency due to transcriptional switching. Variants that predominate in the early phase of infection probably have higher effective multiplication rates (possibly due to more efficient endothelial sequestration rates) or higher on-switching rates. In any case, the history of PfEMP1 expression is recorded in the antibody repertoires that accumulate in individual hosts, regardless of the molecular basis of the sequence of expression.
There is evidence that there is a threshold of PfEMP1 expression necessary for induction of an immune response. If so, low-level or heterogeneous expression of PfEMP1 variants, such as in the early stages of infection, might not be sufficient to induce immunity. As the immune system disables IEs expressing the dominant VSA, the parasite is either cleared from the host or parasites expressing an antigenically distinct VSA will come to dominate the infection. When a VSA is no longer expressed, antibody levels against it decrease, but immunological memory persists and antibody levels can be rapidly restored upon re-exposure.
We have investigated the role of variation in adhesion properties and cumulative antibody repertoires in selecting for the observed patterns in expression. Integrating these individual-level processes into a mathematical model of P. falciparum transmission, we refine the requirements for the emergence of realistic variation in VSA expression at the population level. The model allows
2011 © Copyright lies with the respective authors and their institutions
12 EPIWORK D1.2
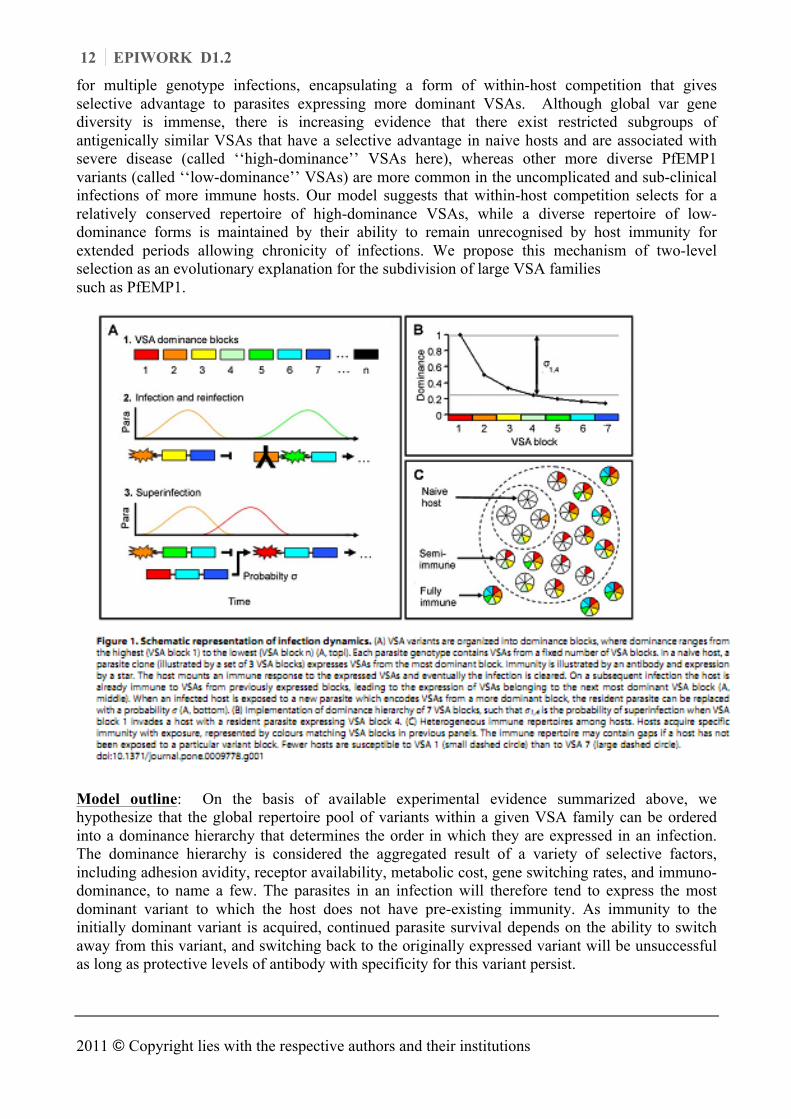
for multiple genotype infections, encapsulating a form of within-host competition that gives selective advantage to parasites expressing more dominant VSAs. Although global var gene diversity is immense, there is increasing evidence that there exist restricted subgroups of antigenically similar VSAs that have a selective advantage in naive hosts and are associated with severe disease (called ‘‘high-dominance’’ VSAs here), whereas other more diverse PfEMP1 variants (called ‘‘low-dominance’’ VSAs) are more common in the uncomplicated and sub-clinical infections of more immune hosts. Our model suggests that within-host competition selects for a relatively conserved repertoire of high-dominance VSAs, while a diverse repertoire of low-dominance forms is maintained by their ability to remain unrecognised by host immunity for extended periods allowing chronicity of infections. We propose this mechanism of two-level selection as an evolutionary explanation for the subdivision of large VSA families such as PfEMP1.
Model outline: On the basis of available experimental evidence summarized above, we hypothesize that the global repertoire pool of variants within a given VSA family can be ordered into a dominance hierarchy that determines the order in which they are expressed in an infection. The dominance hierarchy is considered the aggregated result of a variety of selective factors, including adhesion avidity, receptor availability, metabolic cost, gene switching rates, and immuno-dominance, to name a few. The parasites in an infection will therefore tend to express the most dominant variant to which the host does not have pre-existing immunity. As immunity to the initially dominant variant is acquired, continued parasite survival depends on the ability to switch away from this variant, and switching back to the originally expressed variant will be unsuccessful as long as protective levels of antibody with specificity for this variant persist.

EPIWORK D1.2 13
Before constructing the model we devised a scheme to aggregate the immense VSA diversity in a way that is both biologically meaningful and mathematically tractable. As we are mainly interested here to explore host population-level processes, we define ‘‘dominance blocks’’ as groupings of undefined numbers of consecutive variants. Since dominance reflects preferential expression, it is assumed here that antigenic switching during a single infection occurs among consecutive variants within a dominance block, and is therefore not visible at the scale of blocks. Dominance blocks are thus a convenient unit for the construction of transmission models at this level. Estimates of the duration of a P. falciparum infection are in the order of 200 to 700 days, with peaks in parasitaemia every 20–25 days. If peaks in parasitaemia correspond to clonal replacement of one variant by another, and in the absence of substantial cross-reactive immunity among intraclonal variants, between eight (an infection that lasts 200 days with peaks every 25 days) and 35 (peaks every 25 days of a 700 day infection) different VSAs can be assumed to be expressed in the course of an untreated monoclonal infection. This collection of VSAs corresponds to a dominance block.
The model is formulated in terms of blocks of VSAs, indexed such that a lower index represents a higher dominance (Fig. 1a, top). Each parasite can thus be assumed to possess between approximately two (at 35 variants per block) and seven (at eight variants per block) dominance blocks of a given VSA family such as the 60-member PfEMP1 family, and should therefore be able to re-infect a given host at least a corresponding number of times (each time expressing variants from a new block) before all family members have been expressed (Fig. 1a, middle). We hypothesize that VSA dominance not only determines the order of VSA expression of a single clonal lineage, but also the dynamics of multiple-clone infections. When an already infected host is exposed to a new parasite, we assume that the transmission potential of the invader in relation to the resident increases with the dominance difference between the respective VSAs.
Others have shown that such weighted processes can be mathematically simplified while maintaining the essence of the model dynamics, by assuming the polarized view that the invader replaces the resident parasite (superinfection) with a probability s (Fig. 1a) and is cleared otherwise. The probability s is formally defined as a function of the difference between the dominance blocks expressed by invader and resident parasites (Fig. 1b). As hosts in the population gradually acquire immunity to individual dominance blocks, they remain susceptible only to parasites which express blocks of lower dominance (Fig. 1c). A correlation between dominance and disease severity is implicit in the model, and is used to evaluate its performance. Immunity to specific VSA blocks wanes over time allowing reinfection. The mathematical formalism of the model is provided in full detail in van Noort et al. (2010).
The model’s equilibrium results from simulations of model realisations where parasites are best described by four dominance blocks drawn from a pool of seven. This greatly simplifies the description of the model output but retains the generality of the model performance. The vast majority of hosts without any pre-existing VSA-specific antibodies is predicted by the model to be infected by parasites expressing VSAs belonging to dominance block 1. As host repertoires of VSA-specific antibodies broaden, the probability that their infections will be dominated be parasites expressing VSAs from dominance blocks lower in the hierarchy increases, and the ability to predict which block is expressed in a given host decreases. If we associate high-dominance VSAs with more severe forms of malaria, and note that the antibody repertoire broadens with age, this output fits the observations that overall malaria severity decreases with age in endemic areas, and that low immunity and young age are associated with infections dominated by serologically similar VSAs, whereas VSA expression in older, more immune individuals with uncomplicated infections is much more diverse. The host’s capacity to clear an infection before exhausting the VSA repertoire of the infecting parasite (see Model outline above) and the non-random sequential expression of variants from high- to low-dominance, furthermore leads the model to predict a population-level gradient

2011 © Copyright lies with the respective authors and their institutions
14 EPIWORK D1.2
Our mathematical model demonstrates the interplay between two opposing selection pressures; one that favours virulent (high-dominance) VSAs in non-immune hosts, the other facilitating non-virulent (low-dominance) VSAs that allow chronic infections in individuals with substantial VSA-specific immunity. Our results complement previous models that have addressed expression patterns and acquisition of immunity. We introduce the concept of dominance blocks to describe the competitive interactions among the different VSAs of a single parasite (intra-clonal variation) and among the VSAs of different parasite clones (inter-clonal diversity). The model dynamics of VSA expression, within and between hosts, all follow from the dominance hierarchy. The preferential expression of high-dominance VSAs in naive hosts leads to host immunity and quickly exhaust the pool of susceptible hosts available to them. Low-dominance VSAs, on the other hand, allow persistent infections and thereby ensure efficient transmission from host to host. The ability of parasites encoding high-dominance VSAs to superinfect, favours their conservation. The output of our model is compatible with field observations. The existence of different levels of immune selection acting on VSAs has been suggested through the application of network approaches to serological data. It is reinforced here with a model that is the first to combine intra-host competition and inter-host transmission to investigate the combined effects of selection at multiple levels.
The model suggests a mechanism for the observed structuring of VSA into distinct clusters, reproducing important features of serological observations from the field. Although the results are general, it would be interesting to investigate how they might be modulated by transmission intensity and cross-immunity.
In summary, our model identifies the mechanisms that might be driving the evolution of separate clusters of VSAs, as seen for the var gene subfamilies of P. falciparum. The hypothesis predicts a restricted subset of high-dominance VSAs associated with severe malaria, and genetically and immunologically diverse low-dominance VSAs related to uncomplicated and asymptomatic infection. These principals lie at the basis for understanding immunity and reinfection in malaria transmission.
Publications: van Noort , Nunes MC, Weedall GD, Hviid L, Gomes MGM (2010) Immune selection and within-host competition can structure the repertoire of variant surface antigens in Plasmodium falciparum - A mathematical model. PLoS One 5(3): e9778. Kretzschmar M, Gomes MGM, Coutinho RA, Koopman JS (2010) Unlocking pathogen genotyping information for public health by mathematical modelling. Trends Microbiol 18: 406-412. Stollenwerk N, van Noort SP, Martins J, Aguiar M, Hilker FM, Pinto A, Gomes MGM (2010) A spatially stochastic epidemic model with partial immunization shows in mean field approximation the reinfection threshold. Journal of Biological Dynamics 4: 634-649.
A spatially stochastic epidemic model with partial immunization shows in mean field approximation the reinfection threshold
Recently, the notion of a reinfection threshold in epidemiological models of only partial immunity has been debated in the literature. In Stollenwerk et al. (2010) we present a rigorous analysis of a stochastic model of reinfection which shows a clear threshold behaviour at the parameter point where the reinfection threshold was originally described. Furthermore, we demonstrate that this threshold is the mean field version of a transition in corresponding spatial models of immunization. The reinfection threshold corresponds to the transition between annular
EPIWORK D1.2 15
growth of an epidemics spreading into a susceptible area leaving recovered behind and compact growth of a susceptible-infected-susceptible region growing into a susceptible area. This transition between annular growth and compact growth, as shown in Figure 1 below, was described in the physics literature long before the reinfection threshold debate broke out in the theoretical biology literature.
In 1997, Grassberger, Chaté and Rousseau considered a model for the spreading of an agent in a medium whose susceptibility changes irreversibly at the first infection which, in their words, ‘can model epidemics with partial immunization’, where after a first infection the recovered host only have partial immunity against the pathogen or a genetically close mutant pathogen. One driving question for looking at such models is the long going discussion in theoretical and computational physics about critical phenomena in models with absorbing states, especially with so-called frozen absorbing states.
While the susceptible-infected-susceptible epidemics (SIS) has one unique absorbing state, hence clearly falls into the universality class of directed percolation (DP)with respect to its critical transition behaviour, the susceptible-infected-recovered epidemics (SIR) shows many frozen absorbing states of various configurations of recovered and susceptibles once the infection has died out, the universality class of the phase transition being ordinary percolation, or as nowadays also called dynamic percolation (DyP) when it comes to more than the static aspects. The spatial stochastic model of spreading in media with long-time memory has the SIS and the SIR epidemics as special cases and interpolates between them. Below we will give a time continuous version of such a spatial SIRI epidemics, which shows, according to general knowledge of critical phenomena, the same universality as the originally considered time discrete model considered by Grassberger et al. Since partial immunity is a frequent feature of many pathogens, such as Neisseria meningitidis, Streptococcus pneumoniae, Mycobacterium tuberculosis, and especially those pathogens with pronounced multi-strain structure, in 2004 Gomes et al. (2004) discussed various models of waning immunity as well as partial immunity and found in their ordinary differential equations (ODE) what they coined ‘a reinfection threshold’. In order to obtain non-trivial stationary solutions, where not all the population become recovered, they had to consider, in addition to the SIRI-model of spread- ing, also terms describing input into the susceptible class from other classes. They use natural birth and death for the hosts of the epidemics. In their stationary states analysis, they found a first threshold between a disease-free state and a non-trivial state with strictly positive endemic equilibrium. Besides this first threshold, they found a second threshold characterized by the ratio between the infection and reinfection rates. This second threshold they call the ‘reinfection threshold’.
However, this notion of the reinfection threshold was questioned recently by Breban and Blower (2005), where they simply claim that ‘The reinfection threshold does not exist’. They do so on the basis that there would be nothing special going on in the stationary state solution at the point where the reinfection threshold was marked. An immediate reply by Gomes et al. on the importance of the reinfection threshold emphasizes the epidemiological implications of vaccine efforts being successful below the threshold but not above. Beyond the reinfection threshold, the stationary solution is ruled by the secondary infections in the IRI sub-compartment of the SIRI model which cannot be further affected by vaccination.Vaccination only brings susceptibles directly into the recovered class by circumventing the infection class.
In the light of discussion in the above-mentioned physics literature, we construct a stochastic spatial epidemiological model for the SIRI-system, which has the same critical behaviour as the model considered by Grassberger et al. Especially, it shows transitions between phases of no growth below the DP or DyP critical points which are joined by a phase transition line, and another transition between annular growth and compact growth in two and higher spatial dimensions.We calculate the mean field approximation of this stochastic spatial epidemiological SIRI-model for the

2011 © Copyright lies with the respective authors and their institutions
16 EPIWORK D1.2
dynamics of the mean total numbers of susceptibles, infected and recovered. This mean field dynamics is the core of the ODE-models considered by Gomes et al. for the reinfection mechanism. Instead of including the interactions of hosts birth and death, we just add to the spreading SIRI-model one more transition, namely from recovered to susceptibles with rate α, that ensures the existence of a non-trivial stationary solution and consider the limit of vanishing α. In that limit, we obtain a sharp threshold behaviour characterized by the parameter values of the reinfection threshold of Gomes et al.. The threshold behaviour is in analogy to the Ising spin threshold, for example, in the limit of vanishing external magnetic field. So we conclude that the reinfection threshold does exist in the sense that any other threshold in physical phase transitions exists or any bifurcation behaviour in mean field models exist. From the studies of spatial stochastic epidemics with partial immunization in two dimensions, we even know that the mean field threshold behaviour provides also a description of the threshold behaviour of spatial models, namely the transition between annular growth and compact growth. A model with partial immunization: SIRI
In the model with partial immunization, the SIRI-model, we have as transition rates the infection β as a transition from susceptible S to infected I , the recovery rate γ from I into the recovered R class, and as a special ingredient a rate of reinfection ˜ β as effect of only partial immunization of the recovered. The reaction schemes for transitions of the SIRI system is given by
S I I II R
R I I I
β
γ
β
+ ⎯⎯→ +
⎯⎯→
+ ⎯⎯→ +
(1) The master equations of this model are found in Stollenwerk et al. (2011). A first simulation of the model can be seen in Figure 1(a) and (b). For the simulation of the master equation, the so-called Gillespie algorithm was used, giving exponential waiting times

EPIWORK D1.2 17
Mean field model: SIRI with reintroduced susceptibles To obtain any useful insight into the mean field stationary state behaviour of the SIRI model, we investigate the model with the additional reintroduction of susceptibles. This can be done in various ways, e.g. with death from all classes S, I and R and reintroduction to the S class, i.e. birth into susceptibility [14] or by just taking the original SIR transition α from recovered to susceptibles. So we consider the following reaction scheme:
S I I II R
R I I IR S
β
γ
β
α
+ ⎯⎯→ +
⎯⎯→
+ ⎯⎯→ +
⎯⎯→
The master equations of this model are again found in Stollenwerk et al. (2011). The mean field approximation is:
2011 © Copyright lies with the respective authors and their institutions
18 EPIWORK D1.2
d QS R S Idt N
d Q QI S I I R Idt N Nd QR I R R Idt N
α β
β γ β
γ α β
= −
= − +
= − −
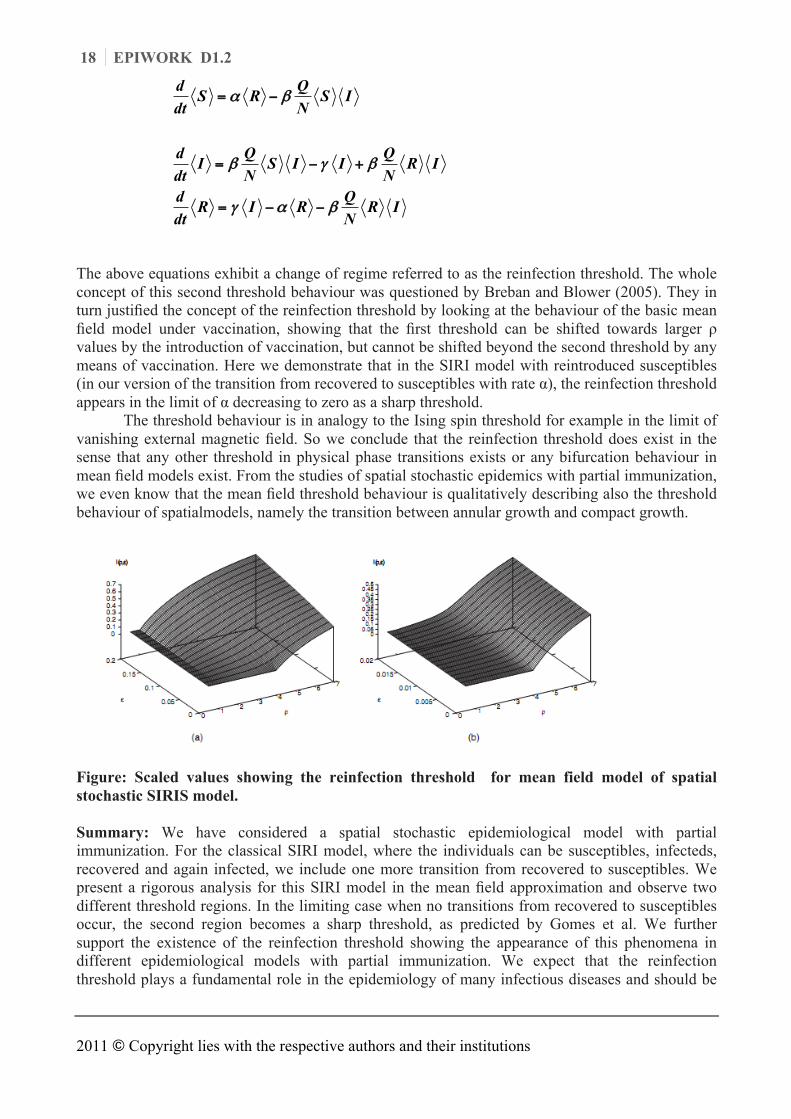
The above equations exhibit a change of regime referred to as the reinfection threshold. The whole concept of this second threshold behaviour was questioned by Breban and Blower (2005). They in turn justified the concept of the reinfection threshold by looking at the behaviour of the basic mean field model under vaccination, showing that the first threshold can be shifted towards larger ρ values by the introduction of vaccination, but cannot be shifted beyond the second threshold by any means of vaccination. Here we demonstrate that in the SIRI model with reintroduced susceptibles (in our version of the transition from recovered to susceptibles with rate α), the reinfection threshold appears in the limit of α decreasing to zero as a sharp threshold.
The threshold behaviour is in analogy to the Ising spin threshold for example in the limit of vanishing external magnetic field. So we conclude that the reinfection threshold does exist in the sense that any other threshold in physical phase transitions exists or any bifurcation behaviour in mean field models exist. From the studies of spatial stochastic epidemics with partial immunization, we even know that the mean field threshold behaviour is qualitatively describing also the threshold behaviour of spatialmodels, namely the transition between annular growth and compact growth.
Figure: Scaled values showing the reinfection threshold for mean field model of spatial stochastic SIRIS model. Summary: We have considered a spatial stochastic epidemiological model with partial immunization. For the classical SIRI model, where the individuals can be susceptibles, infecteds, recovered and again infected, we include one more transition from recovered to susceptibles. We present a rigorous analysis for this SIRI model in the mean field approximation and observe two different threshold regions. In the limiting case when no transitions from recovered to susceptibles occur, the second region becomes a sharp threshold, as predicted by Gomes et al. We further support the existence of the reinfection threshold showing the appearance of this phenomena in different epidemiological models with partial immunization. We expect that the reinfection threshold plays a fundamental role in the epidemiology of many infectious diseases and should be
EPIWORK D1.2 19
further explored both theoretically and in practical applications. In essence, it is a powerful source of variability explaining discrepancies between data collected in populations with different transmission intensities. Moreover, it brings out the need to carefully consider the characteristics of specific population when designing control programmes.
Measuring transmission and reinfection via internet-based surveillance during the 2009 H1N1 influenza pandemic
Internet-based surveillance systems to monitor influenza-like illness (ILI) have advantages over traditional (physician-based) reporting systems, as they can potentially monitor a wider range of cases (i.e.including those that do not seek care). Such systems have been in place in a number of European countries over the last few years, and in July 2009 this was extended to the UK. In Tilston et al. (2011) we present results of this survey with the aim of assessing the reliability of the data, and to evaluate methods to correct for possible biases.
Due to the fact that the so called SIS method produces a larger estimate of incidence than the SIR method (see Tileston et al. 2011) suggests that some participants experienced repeated infections of ILI. The reinfection rates according to GIS (82/391) and HPA (111/520) definitions of ILI is 21% and for CDC definition is 17% (54/313). This provides important information both for understanding influenza dynamics and for the different modeling activities of reinfection by the different EPIWORK partners. Natasha L Tilston, Ken TD Eames, Daniela Paolotti, Toby Ealden, W John Edmunds.
Internet-based surveillance of Influenza-like-illness in the UK during the 2009 H1N1 influenza pandemic. BMC Public Health 2010, 10:650