epidemiology of myelodysplastic syndromes and ... · epidemiology of myelodysplastic syndromes and...
TRANSCRIPT

Epidemiology of Myelodysplastic Syndromes and Myeloproliferative Neoplasms
Xiaomei Ma, Ph.D.Associate Professor of EpidemiologyYale School of Public Health
Co-Leader, Cancer Prevention and ControlYale Comprehensive Cancer Center

Outline• Burden of Disease• Etiology:
– Focus: factors that influence an individual’s risk to develop a disease
– Implication: primary prevention• Health Outcomes:
– Focus: factors that affect identification of disease or prognosis after disease develops
– Implication: secondary & tertiary prevention

Burden of Disease

Characterization of MDS and MPN
• In 2000, in the International Classification of Diseases for Oncology, 3rd edition (ICDO-3), the behavior code of myelodysplastic syndromes (MDS) and myeloproliferative neoplasms (MPN) changed from “1 (uncertain/borderline)” to “3 (malignant)”. 1
• In 2001, MDS and MPN became reportable to cancer registries, such as the National Cancer Institute’s Surveillance, Epidemiology, and End Results (SEER) program.
1. Fritz A, ed. World Health Organization. 2000.
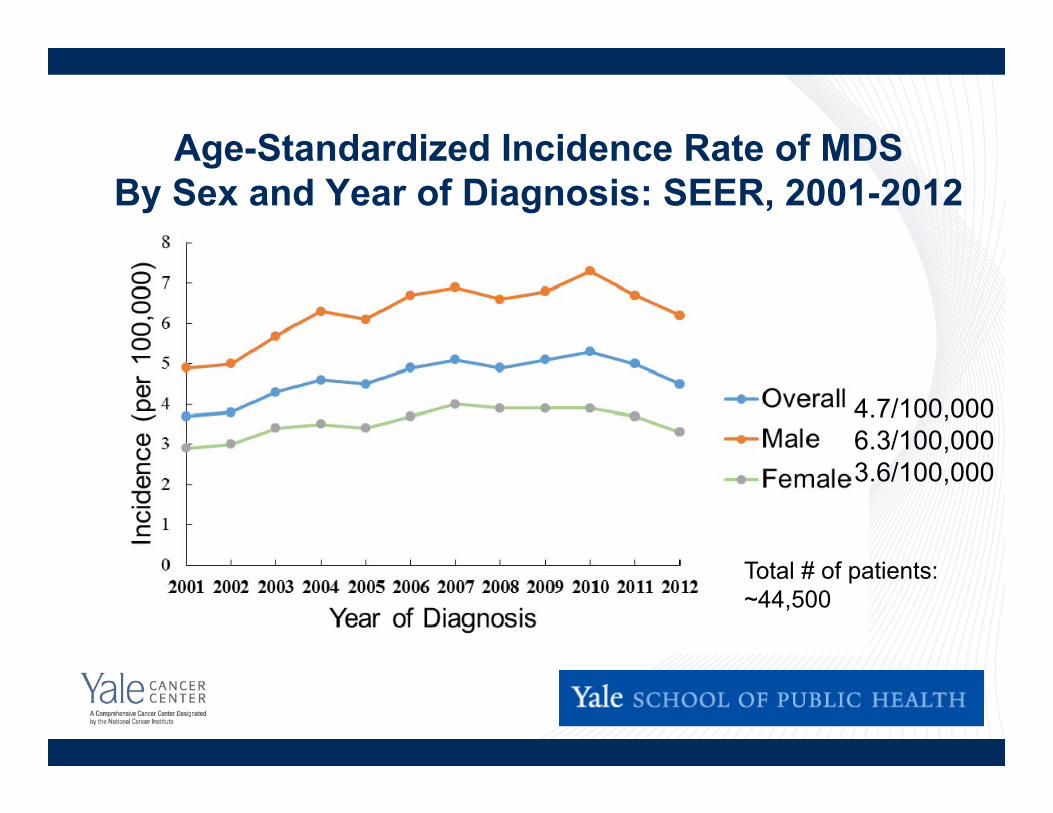
Age-Standardized Incidence Rate of MDS By Sex and Year of Diagnosis: SEER, 2001-2012
4.7/100,0006.3/100,0003.6/100,000
Total # of patients: ~44,500

MDS Incidence Rate By Age: SEER, 2001-2012
Median age at diagnosis: 76 years

# of New MDS Cases in the US Annually• Estimates vary substantially
– 1,500: a book published in 1995 1– ~ 10,000: two cancer registry-based studies
published in 2007 and 2008 2,3
– > 40,000: a 2010 study based on Medicare claims 4
• Registries such as SEER are usually considered an authoritative source for cancer incidence, but MDS is a challenging disease.
1. Schumacher N. MDS: Approach to diagnosis and treatment. 1995.2. Ma X et al. Cancer. 2007;109:1536-42.3. Rollison DE et al. Blood. 2008;112:45-52. 4. Goldberg SL et al. JCO. 2010;28:2847-52.

Probable Under-reporting by Cancer Registries
• Registries typically rely on inpatient surveillance for cancer incidence, but MDS is commonly diagnosed and managed outside the hospital setting.1
• During 2001-2009, SEER guidelines only required capture of the first myeloid malignancy.
• The extent to which MDS is under-reported is unclear.
1. Cogle CR et al. Blood. 2011;117:7121-5.
Studies Addressing Under-reporting
• A study using claims-based algorithms reported an annual incidence of 75 per 100,000 in persons ≥65 years, more than 3 times the SEER estimate. 1
• By reviewing electronic pathology reports, another study found that only two-thirds of true MDS cases were captured by the Florida Cancer Registry using current case-finding mechanisms. 2
1. Cogle CR et al. Blood. 2011;117:7121-5.2. Cogle CR et al. Leuk Res. 2014;38:71-5.

Prevalence of MDS• Estimated prevalence of 20.7/100,000 in Germany
– Translates to 60,000 people in the US? – Likely an underestimate due to failure to diagnose 1
• 945,000 individuals aged ≥ 65 years in the US had unexplained anemia as of 1990-1994, and MDS may be a more precise diagnosis for many of them. 2
1. Sekeres MA. Hematol Oncol Clin N Am. 2010;24:287-94. 2. Guralnik JM et al. Blood. 2004;104: 2263-8.
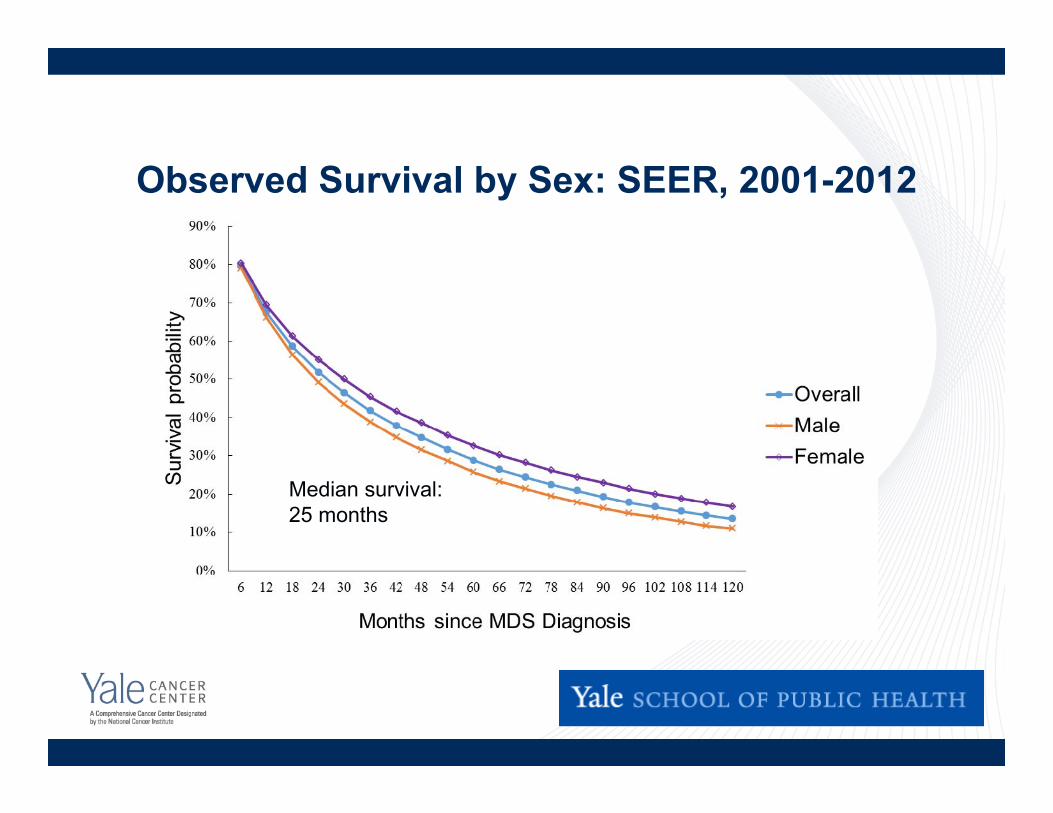
Observed Survival by Sex: SEER, 2001-2012
Median survival:25 months
Agents Approved for the Treatment of MDS by the US Food and Drug Administration
• Azacitidine: May 2004• Lenalidomide: December 2005• Decitabine: May 2006

SEER: Survival of MDS Patients by Year of Diagnosis
00.10.20.30.40.50.60.70.80.9
1
0 0.5 1 1.5 2 2.5 3 3.5 4
Surv
ival
pro
babi
lity
Years since MDS diagnosis
2001-20032007-2010
Log-rank p=0.08
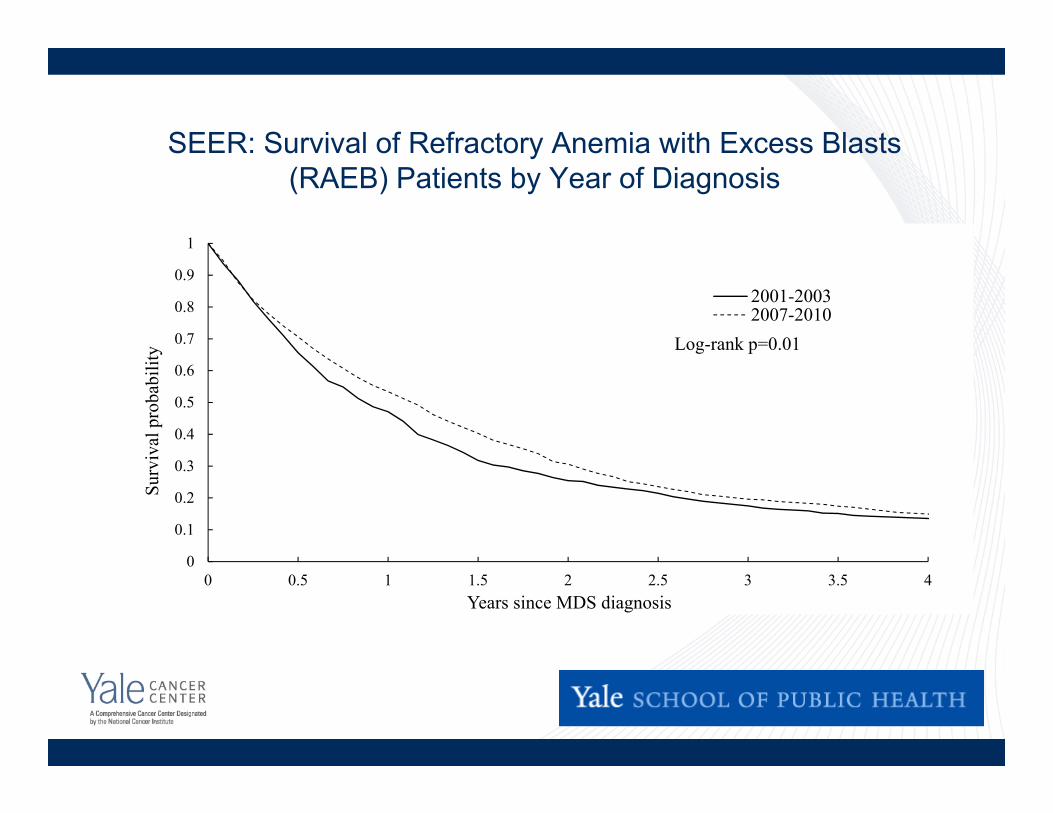
SEER: Survival of Refractory Anemia with Excess Blasts (RAEB) Patients by Year of Diagnosis
0
0.1
0.2
0.3
0.4
0.5
0.6
0.7
0.8
0.9
1
0 0.5 1 1.5 2 2.5 3 3.5 4
Surv
ival
pro
babi
lity
Years since MDS diagnosis
2001-20032007-2010
Log-rank p=0.01

Age-Standardized Incidence Rate of MPNBy Sex and Year of Diagnosis: SEER, 2001-2013
MPN
PV
MF
ET
0
0.5
1
1.5
2
2.5
3
2001 2002 2003 2004 2005 2006 2007 2008 2009 2010 2011 2012 2013
Age-
stan
dard
ized
inci
denc
e(p
er 1
00,0
00)
MPNPVMFET

Under-reporting of MPN by Cancer Registries(likely more severe than that of MDS)
• Substantial discrepancy in incidence rate of PV during 2001-2003 based on SEER records and Medicare claims 1– SEER-reported incidence rate: 3.5 – 4.1 per 100,000– Estimates from Medicare claims: 13.1 – 14.4 per 100,000
1. Selinger HA, Ma X. Am J Hematology. 2009;84:124-6.
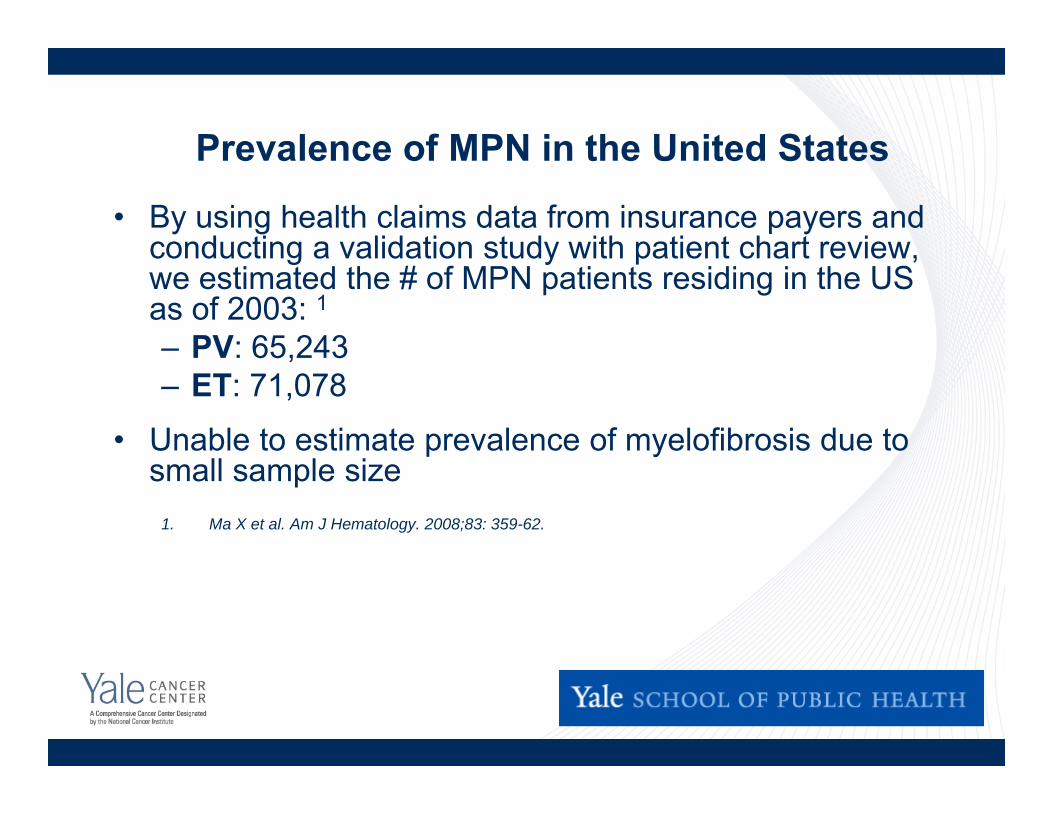
Prevalence of MPN in the United States
• By using health claims data from insurance payers and conducting a validation study with patient chart review, we estimated the # of MPN patients residing in the US as of 2003: 1– PV: 65,243– ET: 71,078
• Unable to estimate prevalence of myelofibrosis due to small sample size
1. Ma X et al. Am J Hematology. 2008;83: 359-62.
Etiology of MDS and MPN
Risk Factors for MDS
• Chemotherapy and/or radiotherapy for previous cancer
• Exposure to benzene
• Tobacco smoking
• Other possible risk factors: obesity, infection
1. Strom SS et al. Leukemia. 2005;19:1912-8. 2. Strom SS et al. Semin Hematol. 2008;45:8-13.
History of Radiotherapy and MDS
• The literature is fairly consistent that radiotherapy for a previous cancer is a risk factor for MDS.
• A retrospective cohort study of 10,924 prostate cancer patients diagnosed during 1986-2011 at Cleveland Clinic found that patients who received radiotherapy and those who underwent surgery had a similar incidence of subsequent MDS, with a median follow up of 3 years.1
1. Mukherjee S et al. JNCI. 2014; 106: djt462.

Influence of Lifestyle Factors on MDS Risk 1# of
CasesPerson-yrsof follow-up
Hazard Ratio (95% CI)
p for trend
Cigarette Smoking < 0.001Never 42 1,215,608 1.0Quit, 1 pack/day 56 954,835 1.55 (1.04-2.32)Quit, >1 pack/day 53 724,524 1.87 (1.23-2.83)Current, 1 pack/day 18 252,160 2.42 (1.39-4.21)Current, >1 pack/day 18 135,193 4.70 (2.68-8.24)
Body Mass Index (kg/m2) < 0.00118.5 BMI < 25 51 1,191,019 1.025 BMI < 30 78 1,476,192 1.15 (0.81-1.64)BMI 30 64 740,187 2.18 (1.51-3.17)
1. Ma X et al. Am J Epidemiol 2009;169:1492-9..Data from the NIH-AARP Diet and Health Study, 1995 - 2003.Cohort of 600,000 50-71 year olds.
Incident MDS cases and the infection hypothesis
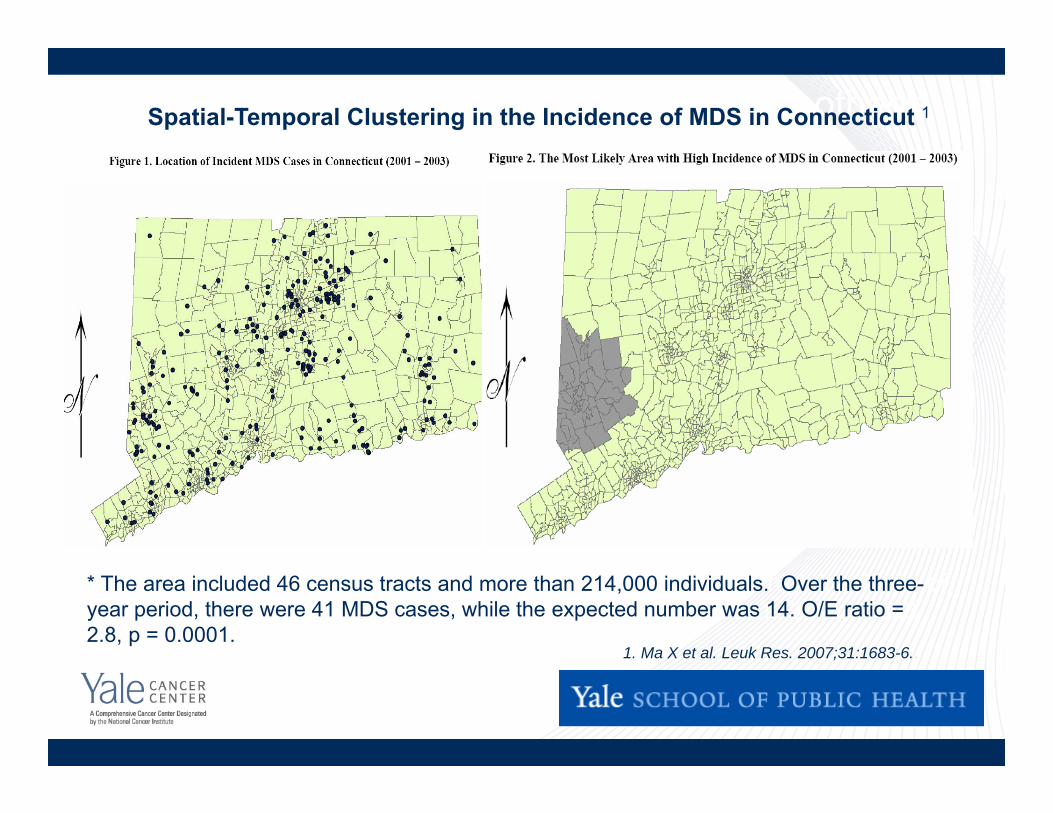
Location of incident MDS cases in Connecticut, 2001 - 2003
Most likely area* with high incidence ofMDS in Connecticut, 2001 - 2003
* The area included 46 census tracts and more than 214,000 individuals. Over the three-year period, there were 41 MDS cases, while the expected number was 14. O/E ratio = 2.8, p = 0.0001.
1. Ma X et al. Leuk Res. 2007;31:1683-6..
Spatial-Temporal Clustering in the Incidence of MDS in Connecticut 1
A Possible Etiologic Role for Obesity and Other Factors
• Association between obesity and MDS persisted in males and females, smokers and non-smokers, and individuals with different levels of physical activity. 1
• Spatial and space-time clustering of MDS may be consistent with hypotheses regarding infection and/or environmental chemicals. 2
• We are currently assessing exposure to traffic as a possible risk factor for MDS (R01 CA169043, PI: Ma & Guan).1. Ma X et al. Am J Epidemiol . 2009;169:1492-9. 2. Ma X et al. Leuk Res. 2007;31:1683-6..
Risk Factors for MPN
• Family history
• Exposure to benzene
• Other possible risk factors: tobacco smoking, history of autoimmune disease
• Very few existing studies
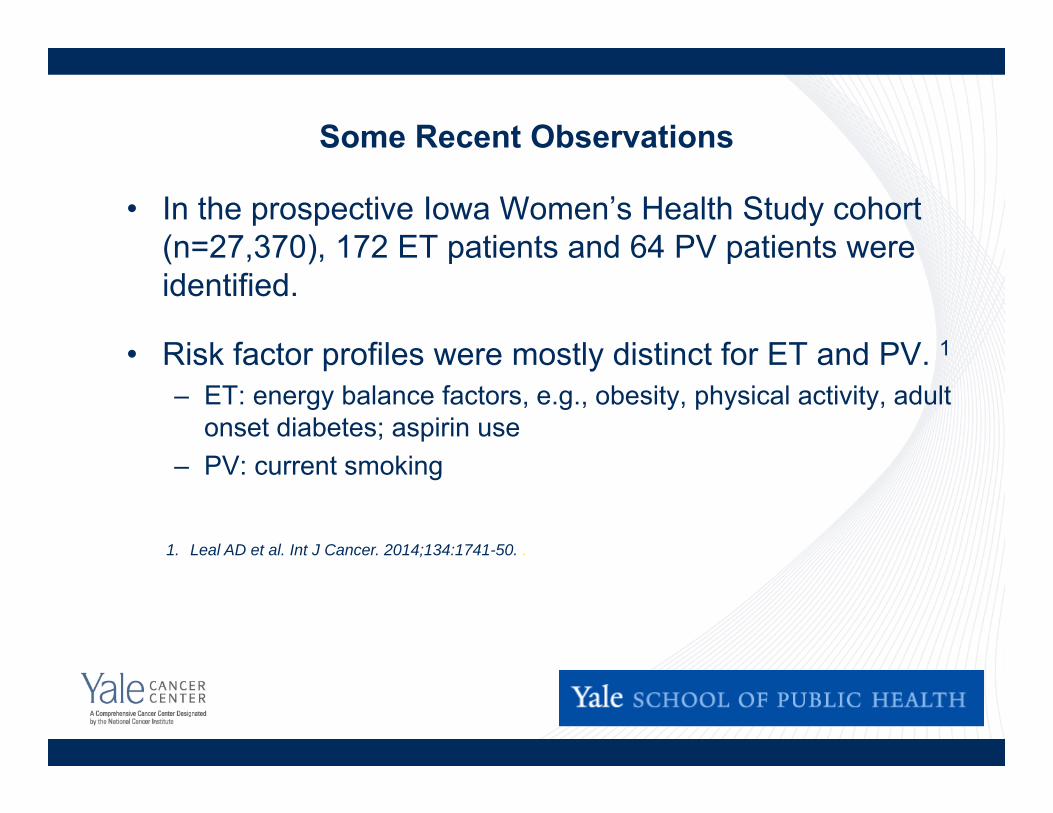
Some Recent Observations
• In the prospective Iowa Women’s Health Study cohort (n=27,370), 172 ET patients and 64 PV patients were identified.
• Risk factor profiles were mostly distinct for ET and PV. 1– ET: energy balance factors, e.g., obesity, physical activity, adult
onset diabetes; aspirin use – PV: current smoking
1. Leal AD et al. Int J Cancer. 2014;134:1741-50. .

Health Outcomes Research
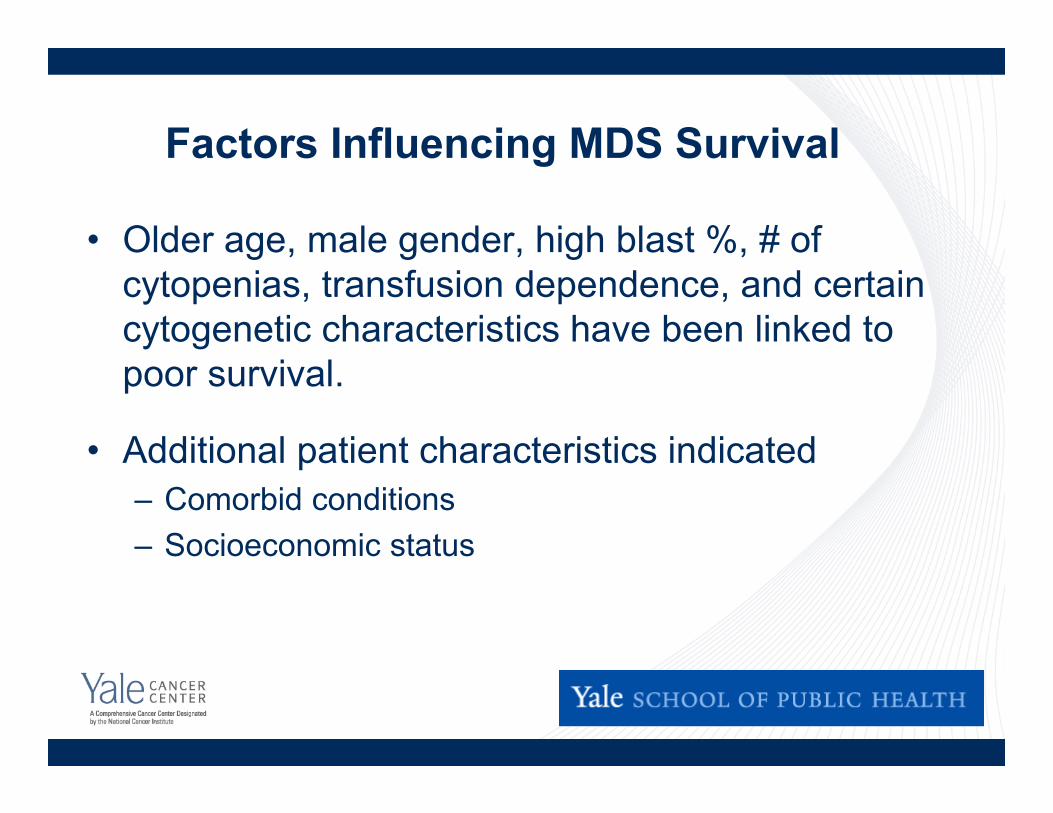
Factors Influencing MDS Survival
• Older age, male gender, high blast %, # of cytopenias, transfusion dependence, and certain cytogenetic characteristics have been linked to poor survival.
• Additional patient characteristics indicated– Comorbid conditions – Socioeconomic status

Comorbid Conditions %Diabetes 21.1Congestive heart failure 20.7Chronic obstructive pulmonary disease 18.6Cerebrovascular disease 8.2Peripheral vascular disease (diagnosis) 7.0Diabetes w/ sequelae 5.6Chronic renal failure 5.6Old myocardial infarction 4.4Rheumatoid diseases 3.5Myocardial infarction 3.0Acute ulcers 2.6
Prevalence of Comorbidities in MDS Patients 1
1. Wang R,…, Ma X. Leuk Res. 2009;33:1594-8.
Data from SEER-Medicare database: incident MDS cases reported to SEER, ≥66 years
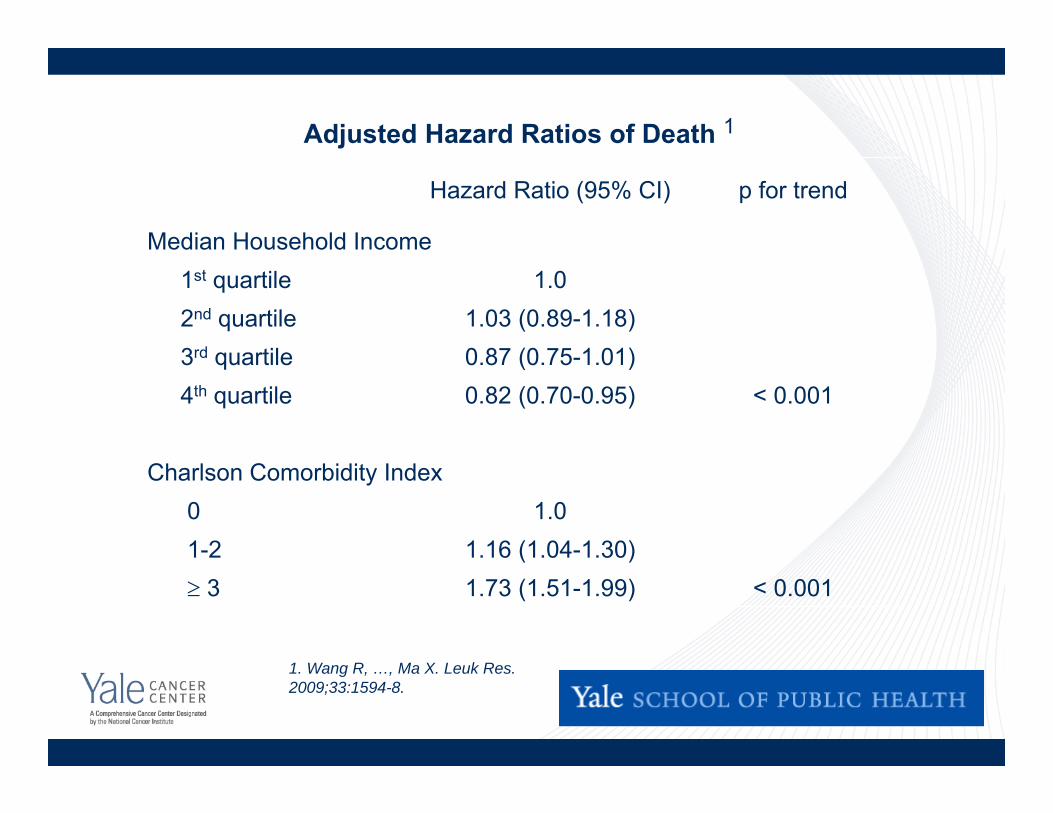
Hazard Ratio (95% CI) p for trend
Median Household Income1st quartile 1.02nd quartile 1.03 (0.89-1.18)3rd quartile 0.87 (0.75-1.01)4th quartile 0.82 (0.70-0.95) < 0.001
Charlson Comorbidity Index 0 1.01-2 1.16 (1.04-1.30) 3 1.73 (1.51-1.99) < 0.001
Adjusted Hazard Ratios of Death 1
1. Wang R, …, Ma X. Leuk Res. 2009;33:1594-8.

Comorbidity and Survival in MDS
Comorbid Conditions HR* 95% CICongestive heart failure 1.35 1.16-1.57Cerebrovascular disease 1.02 0.82-1.27Chronic obstructive pulmonary disease 1.36 1.16-1.58Diabetes 1.09 0.93-1.28*Adjusted for age, sex, median household income, MDS subtype and other comorbidities.
00.10.20.30.40.50.60.70.80.9
1
0 12 24 36 48Time (months)
Surv
ival
Pro
babi
lity
Charlson index: 0
Charlson index: 1-2
Charlson index: >2
Wang R, et al. Leuk Res 2009;33:1594-1598.
1. Wang R,…, Ma X. Leuk Res. 2009;33:1594-8.
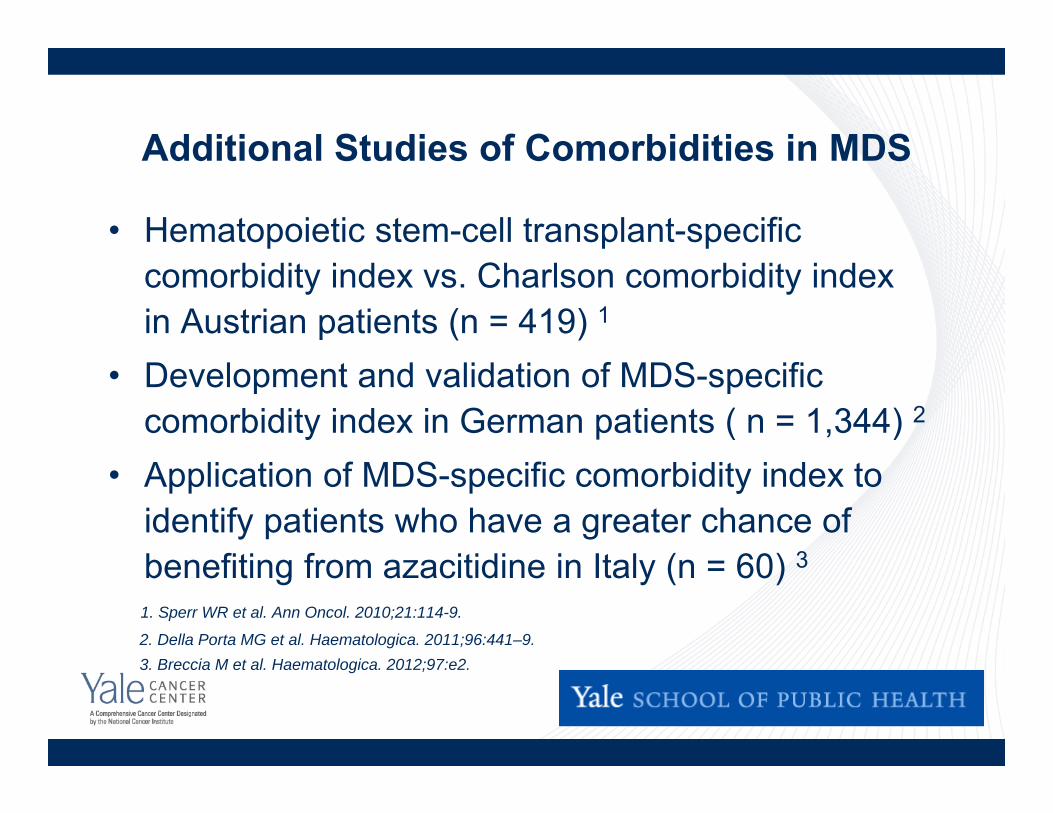
Additional Studies of Comorbidities in MDS
• Hematopoietic stem-cell transplant-specific comorbidity index vs. Charlson comorbidity index in Austrian patients (n = 419) 1
• Development and validation of MDS-specific comorbidity index in German patients ( n = 1,344) 2
• Application of MDS-specific comorbidity index to identify patients who have a greater chance of benefiting from azacitidine in Italy (n = 60) 31. Sperr WR et al. Ann Oncol. 2010;21:114-9.
2. Della Porta MG et al. Haematologica. 2011;96:441–9.3. Breccia M et al. Haematologica. 2012;97:e2.

Cost of Care for Elderly MDS Patients
• Among 6,556 MDS patients ≥ 66.5 years, the expected MDS-related 5-year cost was $63,223 (95% CI: $59,868–66,432 in 2009 dollars), higher than any of the 18 most prevalent cancers in the US. 1
• Medicare expenditure for elderly MDS patients varied considerably across SEER registries but was not associated with 2-year survival. 2
1. Wang R,…, Ma X. Leuk Res. 2012;36:1370-5.2. Zeidan A,…, Ma X. Cancer. 2016;122:1598-607.

Health Outcomes of MPN Patients
• 3-year relative survival of MPN as a group: 80% 1
• Median survival in an Italian patient cohort was 20 years for PV and 22.6 years for ET. 2
• In a SEER-Medicare population, MPN patients had significantly worse median survival than matched non-cancer “controls”. 3
– PV: 65 vs. 104 months– ET: 68 vs. 101 months– MF: 24 vs. 106 months1. Rollison DE et al. Blood. 2008;112:45-52. 2. Passamonti F et al. Am J Med. 2004; 117: 755-761.3. Price GL et al. PLoS One. 2014;9:e90299.
Impact of MPN on Health and Productivity• Of 813 MPN patients under active management in the US
(PV: 380, ET: 226, MF: 207), many had experienced MPN-related symptoms ≥ 1 year before diagnosis (PV: 61%, ET: 58%, MF: 49%). 1
• Many respondents, even those with low prognostic risk scores, reported reduced quality of life, reductions in activities of daily living, and lower work productivity.
1. Mesa R et al. BMC Cancer. 2016; 16: 167.
Summary• MDS and MPN are understudied, and the
disease burden will continue to increase.
• The etiology of both is not well understood.
• While newer treatments are available for MDS and MPN, the impact of these regimens remains to be evaluated.
Acknowledgement• Funding from the National Cancer Institute
– N01-PC-55020-20– K07 CA119108– R21 CA131927– P30 CA016359
• Collaborators– Yale University: Rong Wang, Cary Gross, Stephanie
Halene, Amy Davidoff, Steven Gore, Amer Zeidan– Columbia University: Azra Raza