epidemiology of hiv among hispanics reported in florida, through 2013 florida department of health...
TRANSCRIPT

Epidemiology of HIV Among Hispanics Reported in Florida,
Through 2013
Florida Department of HealthHIV/AIDS Section
Division of Disease Control and Health ProtectionAnnual data trends as of 12/31/2013
Living (Prevalence) data as of 06/30/2014
Created: 12/27/13
Revision: 09/09/14
To protect, promote and improve the health of all people in Florida through integrated state, county, and community efforts.

HIV and AIDS Case Data Adult cases represent ages 13 and older, pediatric
cases are those under the age of 13. For data by year, the age is by age of diagnosis. For living data, the age is by current age at the end of the most recent calendar year, regardless of age at diagnosis.
Unless otherwise noted, whites are non-Hispanic and blacks are non-Hispanic.
Total statewide data will include Department of Correction Cases (DOC) unless otherwise noted. County data will exclude DOC cases.
HIV prevalence data are generated later in the year, usually in May, when most of the “expected” death data are complete.
Selected slides from the Florida HIV Trends Slide Set, see site below for entire set. http://www.doh.state.fl.us/disease_ctrl/aids/trends/slides/slides.html


Adult HIV and AIDS Cases, by County of Residence Reported Among Hispanics in 2013, Florida
<20%
>20%
HIV AIDS

Statewide Data:N=1,521
State Rate = 41.2Rate per 100,000 Population
0.0 0.1 to 20.020.1 to 30.030.1 to 40.0> 40.0
Adult HIV Case Rates* Among Hispanics, by County of Residence,** Reported in 2013, Florida
Note: High rates in small counties may be unreliable due to small county population. *Population data are from Florida CHARTS**County totals exclude Department of Corrections cases (N=11).

0.0 0.1 to 25.025.1 to 50.050.1 to 75.0> 75.0
Adult AIDS Case Rates* Among Hispanics, by County of Residence,** Reported in 2013, Florida
Statewide Data among Hispanics:N=694
State Rate among Hispanics= 18.8Rate per 100,000 Population
Note: High rates in small counties may be unreliable due to small county population. *Population data are from Florida CHARTS**County totals exclude Department of Corrections cases (N=5).

Pediatric HIV Infection Cases N=2,561
Population Estimates N= 2,888,401
Pediatric HIV Infection Cases and State Population** in Children <13 years of age, by Race/Ethnicity,
Reported through 2013, Florida
10%
74%
14% 2%
WhiteBlackHispanicOther
43%
21%
30%
6%
**Source: Population estimates are provided by Florida CHARTS as of 06/03/2014.

Adult HIV Infection Casesby Race/Ethnicity and Year of Report,
Florida, 2004 – 2013
Percentage change from 2004 – 2013:Whites: 21% decreaseBlacks: 32% decrease Hispanics: 1% increase
*Other includes American Indian/Alaska Native, Asian/Pacific Islander, and multi-racial individuals.
2004 2005 2006 2007 2008 2009 2010 2011 2012 20130
500
1,000
1,500
2,000
2,500
3,000
3,500
Year of Report
Nu
mb
er o
f C
ases
Black
White
Hispanic Other*

Adult Male HIV Infection Cases, by Race/Ethnicity, and Year of Report, 2004–2013, Florida
Note: Over the past ten years, black men represented the highest proportion (> 35%) of male HIV infection cases by race/ethnicity. From 2004 to 2013, the percentage of male HIV cases increased among Hispanics by 7 percentage points. In contrast, the HIV cases decreased by 1 percentage point among whites and 5 percentage points among blacks over the same time period. *Other includes American Indian/Alaska Native, Asian/Pacific Islander, and multi-racial.
2004 2005 2006 2007 2008 2009 2010 2011 2012 201305
101520253035404550
Year of Report
Per
cen
t o
f C
ases
BlackWhite
Hispanic Other*

Adult Female HIV Infection Cases, by Race/Ethnicity, and Year of Report, 2004–2013, Florida
Note: HIV case disparities are more evident among women than men. For the past ten years, black women represented over 63% of the cases each year. From 2004 to 2013, the proportion of cases by race/ethnicity among women remained fairly stable. *Other includes American Indian/Alaska Native, Asian/Pacific Islander, and multi-racial.
2004 2005 2006 2007 2008 2009 2010 2011 2012 20130
10
20
30
40
50
60
70
80
Year of Report
Black
White
Hispanic
Other*
Per
cen
t o
f C
ases
AIDSN=3,279
2013 Florida* Population Estimates
N=16,430,458
HIVN=5,916
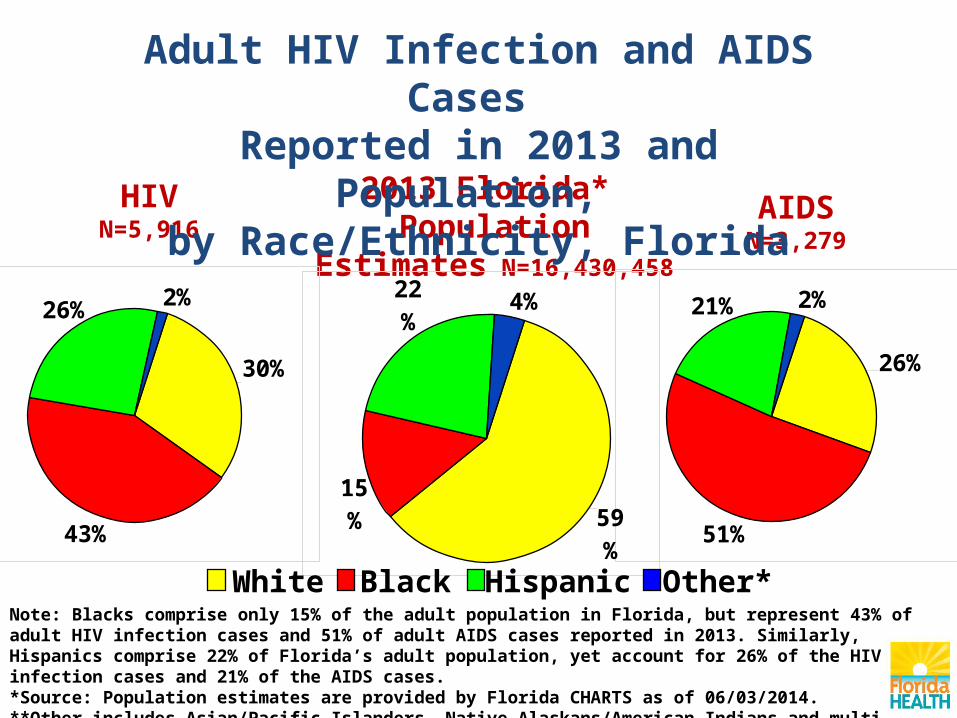
Note: Blacks comprise only 15% of the adult population in Florida, but represent 43% of adult HIV infection cases and 51% of adult AIDS cases reported in 2013. Similarly, Hispanics comprise 22% of Florida’s adult population, yet account for 26% of the HIV infection cases and 21% of the AIDS cases. *Source: Population estimates are provided by Florida CHARTS as of 06/03/2014.**Other includes Asian/Pacific Islanders, Native Alaskans/American Indians and multi-racial individuals.
Adult HIV Infection and AIDS Cases Reported in 2013 and Population,
by Race/Ethnicity, Florida
30%
43%
26%
2%
26%
51%
21%
2%
59%
15%
22%
4%
White Black Hispanic Other*

Note: In this snapshot of 2013, HIV cases by race/ethnicity among males is more evenly split compared to HIV cases among females where blacks are over-represented, accounting for 66% of adult cases among women. *Other includes Asian/Pacific Islanders, Native Alaskans/American Indians and mixed races
Adult HIV Infection Cases, by Sex and Race/Ethnicity,
Reported in 2013, FloridaMales
N=4,542FemalesN=1,374
34%
36%
29%2%
17%
66%
16% 1%
White Black Hispanic Other*

Note: Similar to AIDS, black men and, to an even greater extent, black women are over-represented in the HIV epidemic. The HIV case rate for 2013 is 4 times higher among black men than the rate among white men. Among black women, the HIV case rate is nearly 16-fold greater than the rate among white women. Hispanic male and female HIV case rate is higher than the rate among their white counterparts. *Source: Population estimates are provided by Florida CHARTS as of 06/03/2014.
Adult HIV Infection Case Rates* by Sex and Race/Ethnicity, Reported in 2013, Florida
Rate Ratios:MALES Black:White, 4.4:1 Hispanic:White, 2.2:1
FEMALES Black:White, 15.5:1 Hispanic:White, 2.6:1
Male Female0
20
40
60
80
100
120
140
160
32.5
4.6
144.1
71.871.6
11.9
White Black Hispanic
Rat
e p
er 1
00,0
00 P
op
ula
tio
n

Definitions of Mode of Exposure Categories
MSM = Men who have sex with men
IDU = Injection Drug User
MSM/IDU = Men who have sex with men & Injection Drug User
Heterosexual = Heterosexual contact with person with HIV/AIDS or known HIV risk
OTHER = includes hemophilia, transfusion, perinatal, other pediatric risks and other confirmed risks.
NIR = Cases reported with No Identified Risk
Redistribution of NIRs = This illustrates the effect of statistically assigning (redistributing) the NIRs to recognized exposure (risk) categories by applying the proportions of historically reclassified NIRs to the unresolved NIRs.

HIV Infection Cases Among Adult Hispanic Males, by Mode of Exposure
and Year of Report, 2004–2013, Florida
Note: NIRs redistributed. Men who have sex with men (MSM) remains as the primary mode of exposure among Hispanic male HIV cases in Florida, followed by heterosexual contact.
2004 2005 2006 2007 2008 2009 2010 2011 2012 20130
200
400
600
800
1,000
1,200MSM IDU MSM/IDU Heterosexual
Year of Report
Nu
mb
er o
f C
ases

HIV Infection Cases Among Adult Hispanic Females, by Mode of Exposure
and Year of Report, 2004–2013, Florida
Note: NIRs redistributed. The heterosexual risk continues to be the dominant mode of exposure among Hispanic females.
2004 2005 2006 2007 2008 2009 2010 2011 2012 20130
50
100
150
200
250
300
IDU Heterosexual
Year of Report
Nu
mb
er o
f C
ases

Cases Living with HIV Disease
Data in these slides represent cases living with HIV Disease, also referred to Persons Living with HIV/AIDS (PLWHAs), who were reported through the most recent calendar year. Living data are also referred as prevalence cases.
HIV prevalence data are generated later in the year, usually in July, when most of the “expected” death data are complete.
Adult cases represent ages 13 and older, pediatric cases are those under the age of 13. For data by year, the age is by age of diagnosis. For living data, the age is by current age at the end of the most recent calendar year, regardless of age at diagnosis.
Unless otherwise noted, whites are non-Hispanic and blacks are non-Hispanic.
Total statewide data will include Department of Correction Cases (DOC) unless otherwise noted. County data will exclude DOC cases.
Selected slides from the Florida HIV Prevalence Slide Set, see site below for entire set.http://www.floridahealth.gov/diseases-and-conditions/aids/surveillance/index.html

Hispanics Living with HIV/AIDS in the US* and in Florida
United States FloridaCDC estimates a total of 872,990 persons living A total of 102,189 persons living with a diagnosiswith a diagnosis of HIV infection through 2010 of HIV infection in Florida through 2013
Hispanics accounted for: Hispanics accounted for:19% of total (N=165,159) 21% of total
20% of adult men & 16% of adult women 24% of adult men & 14% of adult women 17% of the pediatric cases 14% of the pediatric cases
19% of MSM 26% of MSM21% of IDU 18% of IDU
17% of heterosexuals 14% of heterosexuals15% of deaths with HIV infection in 2010 12% of AIDS case deaths in 2013
According to the 2010 US Population Estimates, According to Florida's 2013 Pop estimates, 16% of the US population is Hispanic 24% of Florida's population is Hispanic
*Source: Source of US data: CDC HIV Surveillance Report 2011, Vol. #23, (2012 data not yet available, HIV data is for all 50 states). **Source: The Florida data represents living HIV/AIDS cases through 2013 as of 06/30/2014.

Adults Living with HIV Disease,by Sex and Race/Ethnicity
Reported through 2013, Florida
Note: Among adults living with HIV disease, blacks represent the race most affected among both males (39%) and females (69%). *Other includes Asian/Pacific Islanders, Native Alaskans/American Indians and Multi-racial individuals.
White Black Hispanic Other*
MalesN=72,133
FemalesN=29,844
15%
69%
14%2%
35%39%
24%1%

Case Rates* of Adults Living with HIV Disease, by Sex and Race/Ethnicity,
Reported through 2013, Florida
RATE RATIOS:
MALES Black:White, 4.7:1 Hispanic:White, 1.8:1 Other:White, 0.9:1FEMALES Black:White, 17.7:1 Hispanic:White, 2.3:1 Other:White, 1.8:1
Note: In 2013, among black males, the case rate is nearly 5 times higher than the rate among white males. Among black females, the case rate is nearly 18-fold greater than the rate among white females. Among Hispanic females, the case rate is nearly 2 times higher than the rate among their white counterparts. The case rate among Hispanic males is slightly lower to the rate among their white counterparts. *Source: Population estimates are provided by Florida CHARTS as of 06/03/2014.**Other includes Asian/Pacific Islanders, Native Alaskans/American Indians and Multi-racial individuals.
Male Female0
500
1,000
1,500
2,000
2,500
3,000
534.7
92.6
2514.9
1640.5
941.1
216.6
456
165.1
White Black Hispanic Other
Rat
e p
er 1
00,0
00 P
op
ula
tio
n

One-In-Statement for Adults
There were 101,977 reported adult (age 13+) Persons Living with HIV Disease (PLWHAs) in Florida through 2013.
1 in 189 adult Floridians are known to be currently living with HIV infection. By Race/Ethnicity (adults age 13+):• 1 in 366 whites are currently living with HIV infection• 1 in 61 blacks are currently living with HIV infection• 1 in 215 Hispanics are currently living with HIV infection
Data as of 06/30/2014
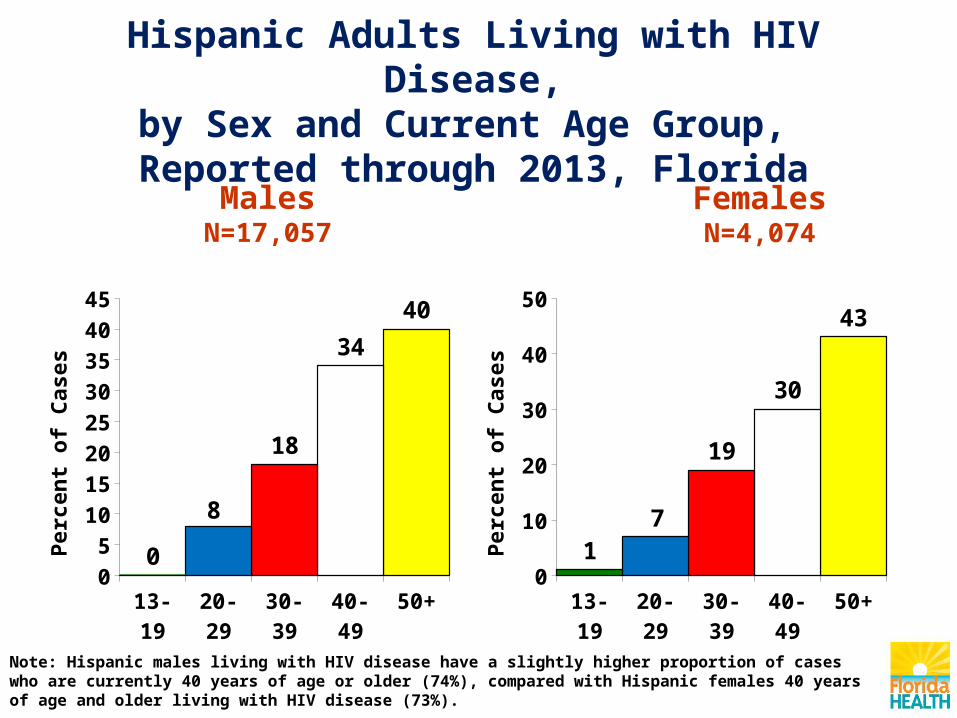
Hispanic Adults Living with HIV Disease,by Sex and Current Age Group, Reported through 2013, Florida
Note: Hispanic males living with HIV disease have a slightly higher proportion of cases who are currently 40 years of age or older (74%), compared with Hispanic females 40 years of age and older living with HIV disease (73%).
MalesN=17,057
13-19 20-29 30-39 40-49 50+0
5
10
15
20
25
30
35
40
45
0
8
18
34
40
Per
cen
t o
f C
ases
FemalesN=4,074
13-19 20-29 30-39 40-49 50+05
101520253035404550
17
19
30
43
Per
cen
t o
f C
ases

Among Hispanic males living with HIV, Florida has a larger proportion of MSM cases and a much smaller proportion of IDU cases compared to the U.S. Among Hispanic females living with HIV, Florida had a much larger proportion of heterosexual cases and a much smaller proportion of IDU cases than that for the U.S.*U.S. data: HIV Surveillance Report, 2011 (most recent available) Vol. 23
The Proportion of HIV Infection Among Hispanics Living with HIV, by Transmission Category in the
U.S.* Compared to Florida
FL through
2013
MSM 66% 75% ----- -----
IDU 17% 7% 25% 12%
MSM/IDU 6% 4% ----- -----
Heterosexual 10% 13% 71% 85%
Other 1% 1% 3% 3%
Males FemalesUS
through 2010
US through
2010
FL through
2013

84%
4% 6%5%
0%
45%11%
5%
38%2%
Other*N=1,375
BlackN=28,425
HispanicN=17,057
Adult Males Living with HIV Diseaseby Race/Ethnicity and Mode of Exposure,
Reported through 2013, Florida
MSM
IDU
MSM/IDU
Heterosexual
Other Risk**
71%
6%5% 16%
1%
75%
7%4% 13%
1%
WhiteN=25,276
* Other includes Asian/Pacific Islander, Native
Alaskan/American Indian and Multi-racial individuals. ** Other Risk includes
hemophilia, transfusion, perinatal and other pediatric
risks as well as other confirmed risks.
Note: NIRs redistributed.

12%
85%
3%
10%
87%
3%
Other*N=572
BlackN=20,588
HispanicN=4,074
Adult Females Living with HIV Diseaseby Race/Ethnicity and Mode of Exposure,
Reported through 2013, Florida
IDU
Heterosexual
Other Risk**
18%
80%
2%
WhiteN=4,610
29%
69%
2%
* Other includes Asian/Pacific Islander, Native
Alaskan/American Indian and Multi-racial individuals. ** Other Risk includes
hemophilia, transfusion, perinatal and other pediatric
risks as well as other confirmed risks.
Note: NIRs redistributed.

HIV Mortality in FloridaResident HIV deaths due to HIV disease represent persons who resided in Florida and whose underlying cause of death was HIV disease, regardless if they were reported with HIV disease in Florida or not.
• The data source is death certificate data from the Florida Department of Health, Bureau of Vital Statistics.
HIV case deaths are known cases of HIV disease (regardless of AIDS status) reported in Florida and are known to be dead, regardless of the cause of death. It is important to understand if any known HIV/AIDS cases died in any given year for estimates of the current burden of HIV/AIDS care and treatment needs within the state.
• The data source is the Florida HIV/AIDS Reporting System (eHARS) from the Florida Department of Health, Bureau of Communicable Diseases.
Selected slides from the Florida Deaths Slide Set, see site below for entire set.http://www.floridahealth.gov/diseases-and-conditions/aids/surveillance/index.html

57%
15%
24%4%
26%
58%
12%3%
White
Black
Hispanic
Other**
Population Estimates N=19,318,859
Resident DeathsN=935
Note: In this 2013 snapshot, the majority of resident deaths due to HIV disease were observed among blacks (58%), followed by whites (26%), then Hispanics (13%) and others (3%). Blacks represent 15% of Florida’s population yet account for the majority of resident deaths due to HIV disease. This indicates a disparity in resident deaths due to HIV disease among blacks. *Source: Population estimates are provided by Florida CHARTS **Other includes Asian/Pacific Islanders, Native Alaskans/American Indians and Multi-racial individuals.
Resident Deaths Due to HIV Disease, and State Population*, by Race/Ethnicity, 2013, Florida

MALES Rate ratios Black:White, 6.1:1 Hispanic:White, 1.1:1
FEMALES Rate ratios Black:White, 15.1:1 Hispanic:White, 1.1:1
Note: In 2013, black males were 6 times more likely than white males to die of HIV disease. The HIV disease death rate among black females was 15-fold greater than the rate among white females. Hispanic male and female rates were slightly higher than the rate among their white counterparts, respectively.
*Source: Population data were provided by Florida CHARTS (as of 06/03/2014). **Source: Florida Department of Health, Bureau of Vital Statistics, Death Certificates (as of 05/16/2014).
Rate* of Resident Deaths** Due to HIV Disease,By Sex and Race/Ethnicity, 2013, Florida
Male Female0
5
10
15
20
25
3.7
0.9
22.5
14
4.1
1
White Black Hispanic
Rat
e p
er 1
00,0
00 P
op
ula
tio
n

2004 2005 2006 2007 2008 2009 2010 2011 2012 20130
10
20
30
40
50
60
70Black White Hispanic
Year of Death
Per
cen
t o
f D
eath
sResident Deaths* Due to HIV Disease,
by Race/Ethnicity and Year of Death, 2004-2013, Florida
Note: In 2013, the proportional distribution of resident HIV deaths due to HIV by race/ethnicity was: 27% among whites, 59% among blacks, 12% among Hispanics. This compared to 24%, 62%, and 12%, respectively for 2012.
*Source: Florida Department of Health, Bureau of Vital Statistics, Death Certificates (as of 05/16/2014).

Leading Causes of Death Among Hispanics25-44 Years Old by Sex, 2013, Florida
CANCER ACCIDENTS HEART DISEASE
SUICIDE STROKE HOMICIDE DIABETES HIV DISEASE LIVER DISEASE
0102030405060708090
100 93
58
25 2217 14
7 6 4
Dea
ths
Hispanic WomenHIV is 8th leading cause
ACCIDENTS CANCER SUICIDE HOMICIDE HEART DISEASE
LIVER DISEASE
HIV DISEASE STROKE DIABETES0
50
100
150
200
250223
75 74 72 69
18 16 12 11
Dea
ths
Hispanic MenHIV is 7th leading cause

Median Survival Time (in months) from AIDS Diagnosis to Death, by Race/Ethnicity and
Time Period of Death, 1980-2013, Florida
Note: In the early years, survival times for increased for all race/ethnicity groups with the introduction of AZT in 1994. With the introduction of Highly Active Retroviral Therapy (HAART) in 1996, survival time increased significantly for all age groups, however, overall survival times are not without racial/ethnic disparities.
*Source: Florida Department of Health, Bureau of Communicable Diseases, HIV/AIDS Reporting System (as of 06/30/2014)
1980-1988 1989-1995 1996-2000 2001-2006 2007-2013
White 4 mo. 15 mo. 32 mo. 60 mo. 83 mo.
Black 1 mo. 10 mo. 22 mo. 41 mo. 62 mo.
Hispanic 3 mo. 12 mo. 23 mo. 45 mo. 61 mo.
Amer. Ind. n/a 14 mo. 21 mo. 23 mo. 79 mo.
Asian 1 mo. 13 mo. 24 mo. 21 mo. 28 mo.
Early Years
Time Period of DeathHAART

Selected slides from the Country of Birth Slide Set, see site below for entire set.http://www.floridahealth.gov/diseases-and-conditions/aids/surveillance/index.html
Impact of HIV DiseaseAmong Hispanics,
by Country of Birth in Florida,
Reported Through 2013

Hispanic Foreign-Born Adults Living with HIV Disease
by Country of Birth and Year of Report, 2004-2013, Florida
Note: For most of the years, the majority of Hispanic foreign-born HIV/AIDS cases with a known country of birth were Cuban-born followed by Puerto Rican-born.
2004 2005 2006 2007 2008 2009 2010 2011 2012 20130
100
200
300
400
500
600
700
800
900
1,000Total Foreign-Born Cases
Columbia
Cuba
Honduras
Mexico
Puerto Rico
Venezuela
Other/Unknown
Year of Report
Nu
mb
er o
f C
ases

Hispanic Foreign-Born Adult HIV Infection Cases, Known Dead, Regardless of Cause,
by Country of Birth and Year of Death, 2004-2013, Florida
Note: Each year, the majority of Hispanic foreign born HIV/AIDS case deaths with a known country of birth were Cuban born, followed by Puerto Rican born.
2004 2005 2006 2007 2008 2009 2010 2011 2012 20130
50
100
150
200
250
300
350Total Foreign-Born Cases
Columbia
Cuba
Honduras
Mexico
Puerto Rico
Venezuela
Other/Unknown
Year of Report
Nu
mb
er o
f C
ases

MalesN=17,057
FemalesN=4,074
Foreign-Born US Born Unknown
59%
29%
12%
53%
38%
9%
Note: The majority (59% for males and 53% for females) of Hispanics living with HIV disease in Florida were foreign-born.
Hispanic Adults Living with HIV Disease, by Country of Birth and Sex,
Reported through 2013, Florida

CubaN=3,294
Over 100 Cases51-100 Cases1-50 Cases0 Cases
Living HIV/AIDS Cases
Puerto RicoN=2,055
Hispanic Adults Living with HIV Disease, by Selected Country of Birth,
Reported through 2013, Florida

Country of Birth# % # % # % # %
United States 6,544 35% 2,278 24% 792 38% 337 37%
Cuba 3,354 18% 2,826 30% 158 8% 61 7%
Puerto Rico 2,122 11% 586 6% 218 10% 122 13%
Mexico 1,143 6% 273 3% 104 5% 130 14%
Columbia 875 5% 543 6% 153 7% 35 4%
Honduras 700 4% 489 5% 69 3% 27 3%
Venezuela 660 4% 457 5% 122 6% 12 1%
Nicaragua 457 2% 390 4% 25 1% 7 1%
Brazil 412 2% 190 2% 119 6% 27 3%
Guatemala 346 2% 108 1% 23 1% 63 7%
Other/Unknow n 2,139 11% 1,287 14% 321 15% 97 11%
TOTAL 18,752 100% 9,427 100% 2,104 100% 918 100%
Florida Miami-Dade Broward Palm Beach
*Data sorted by foreign country of birth by number of cases, and excludes cases whose country of birth is unknown. **County data exclude Department of Correction cases.
Hispanic Adults Living with HIV Disease, by Country of Birth*, Reported through 2013,
for Florida and Selected South Florida Counties**

Hispanic Adult Males Living with HIV Disease,by Selected Country of Birth and
Mode of Exposure, Reported through 2013, Florida
CubaN=3,040
Puerto RicoN=1,552
U.S. BornN=4,994
73%
9%6% 11%
1%
82%
3% 4%11%
<1%
MSM IDU MSM/IDU Heterosexual Other
55%
23%
9% 13%1%
Note: NIRs redistributed. Injection drug use is a much more common risk factor among male Puerto Rican-Born cases than their U.S.-Born or Cuban-Born counterparts.

CubaN=314
Puerto RicoN=570
U.S. BornN=1,550
Hispanic Adult Females Living with HIV Disease, by Selected Country of Birth and
Mode of Exposure, Reported through 2013, Florida
16%78%
6%
9%
90%
1%
IDU Heterosexual Other
19%
79%
2%
Note: NIRs redistributed. Injection drug use is a less common risk factor among female Cuban-Born cases than their U.S.-Born or Puerto Rican-Born counterparts.

- Amount of HIV already in the community- Late diagnosis of HIV or AIDS*
- Access to/acceptance of care*
- Stigma, denial*,
- Discrimination, homophobia*
- HIV/AIDS complacency*
- Poverty and unemployment
*Factors that HIV/AIDS initiatives can impact.
Underlying Factors Affecting HIV/AIDS Disparities

· Minorities are at high risk for HIV infection…· NOT because of their race· NOT because of their ethnicity…
• But BECAUSE of risk behaviors they may engage in.
IT’S NOT WHO YOU ARE,
BUT WHAT YOU DO.

For Florida HIV/AIDS Surveillance DataContact: (850) 245-4444
Lorene Maddox, MPH Ext. 2613 Tracina Bush, BSW Ext. 2612 Madgene Moise, MPH Ext. 2373
Visit Florida’s internet site for:Monthly Surveillance Reports
Slide Sets and Fact SheetsAnnual Reports and Epi Profiles
http://www.floridahealth.gov/diseases-and-conditions/aids/surveillance/index.html
Visit CDC’s HIV/AIDS internet site for:Surveillance Reports, fact sheets and slide sets
http://www.cdc.gov/hiv/topics/surveillance/resources/reports/index.htm