epa region 3 people current mid-atlantic land cover 70% forest cover 25% agriculture 2%...
TRANSCRIPT

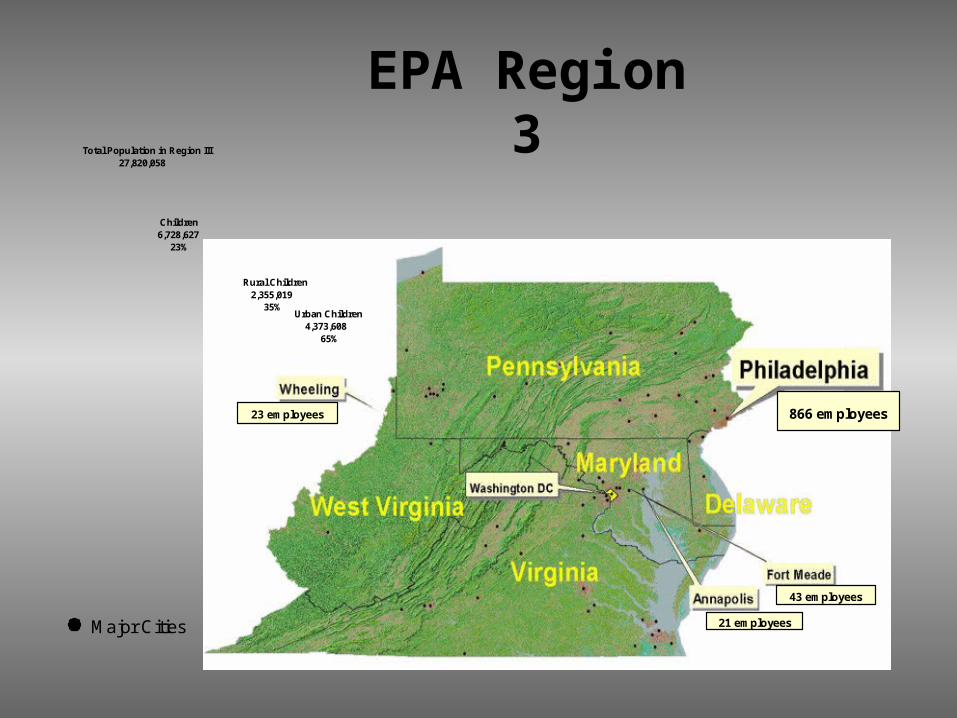
EPA Region 3
23 employees 866 employees
43 employees
21 employees
Children6,728,627 23%
Rural Children 2,355,019 35%
Urban Children 4,373,608 65%
Total Population in Region III 27,820,058
Major Cities

People

Current Mid-Atlantic Land Cover
• 70% Forest Cover• 25% Agriculture• 2%
Urban/Disturbed Areas
• 3% Other

How do we best protectpublic health and the environmentin Region 3?

Policy (or strategic direction)= Values x Indicators

Policy (or strategic direction): •What shall we work on, •Where shall we work, •How should we work,
Values:•What do we care about•How much do we care about each “what”?
Indicators:•What data best describes what we care about?
P=VI What is it?

PRIMARY LEVEL SECONDARY LEVEL THIRD LEVEL FOURTH LEVEL
Area Wide
Data Fit Population weighted
Design Value weighted
Attn. Threshold weighted
Area Wide
Region III Data Scatter Population weighted
Design Value weighted
Attn. Threshold weighted
Worst Outlier
Area Wide
Data Fit Population weighted
Design Value weighted
Attn. Threshold weighted
Area Wide
1-Hr O3 Non-Attainment Areas Data Scatter Population weighted
Design Value weighted
Attn. Threshold weighted
Ozone Air Quality Worst Outlier
Area WideData Fit Population weighted
Design Value weighted
Attn. Threshold weighted
Area Wide
1-Hr O3 Attainment Areas Data Scatter Population weighted
Design Value weighted
Attn. Threshold weighted
Worst Outlier
Area Wide
Data Fit Population weighted
Design Value weighted
Attn. Threshold weighted
Area Wide
Class I Areas Data Scatter Population weighted
Design Value weighted
Attn. Threshold weighted
Worst Outlier
Personnel Impact Monitor Servicing Distance
Work Load
Costs
Trends Impact
Data Collection Manager
Geostatistical Indicators Module
Fate and Transport Models
Programmatic and Budget Decision Analysis Module
P=VI How do we structure our analysis?
(Multi Criteria Integrated Resource Assessment)
MIRA

Human Health
Welfare
Future Vulnerability
Disease
Food Supply
Catastrophic
Ecosystem Integrity
Recreation
Infrastructure
Energy
Inhalation
Ingestion
Aquatic
Terrestrial
Lands
Wetlands
Waters
Exercise
Fishing
Natural
Built
. . . .
. . . .
. . . .
. . . .
. . . .
. . . .
. . . .
Simplified MIRA Hierarchy: context, values, data
180

Values Make a Difference!Values Change….Science & Data do not
Human Health Emphasis Welfare Emphasis

Policy Made TransparentBiofuels
Policy: Increase corn production in Chesapeake Bay Watershed
Indicators: Increased Nitrogen, Decreased Fisheries, Decreased Food Production, Deforestation
Value: Ag Economic and Energy psyche trump ecological

Region III Rivers and Streams Trend Analysis
303(d) impaired waters
303(d) Delisted Waters
Waters
0
1000
2000
3000
4000
5000
6000
7000
1998 2000 2002 2004 2006
Year
Mile
s o
f W
ater
s
0
1000
2000
3000
4000
5000
6000
Wat
ers
Assessed 43,243 66,166 94,212 105,225 123,672 Miles
GAP
Epiphanies lead to new approaches!
4000
8000
12000
16000
20000
24000
28000
TMDL's Completed and 303(d) Delisted
Headline: We are discovering polluted streams faster than we can clean them!
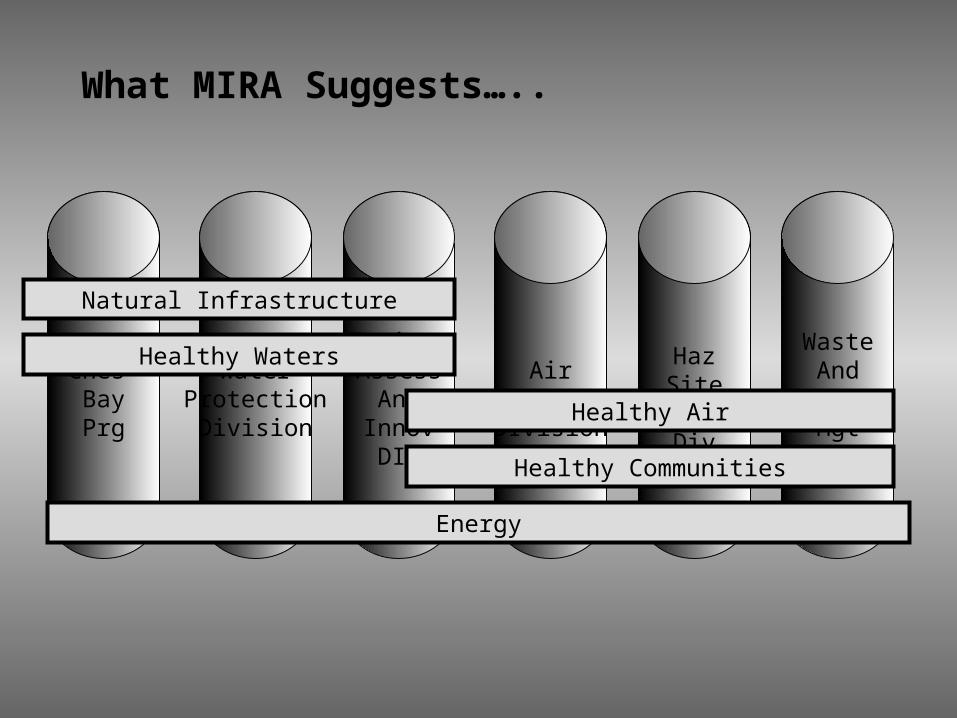
What MIRA Suggests…..
AirProtectionDIvision
HazSite
CleanupDiv
Ches BayPrg
EnvironAssess
AndInnovDIv
WaterProtectionDivision
WasteAnd
ChemMgtDiv
Natural Infrastructure
Healthy Waters
Healthy Air
Energy
Healthy Communities
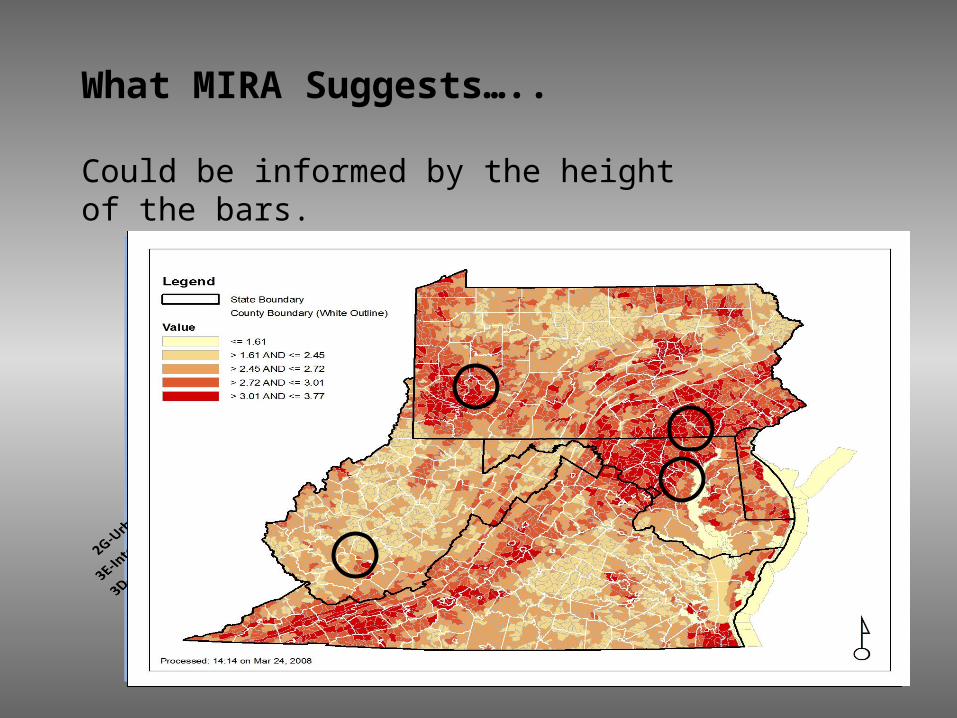
What MIRA Suggests…..
Could be informed by the height of the bars.
Potential Priorities
0%
5%
10%
15%
20%
25%
30%
35%
Energy
-RCC-20*
Natural
Infra
structu
re-45*
Health
y Waters-
80*
Homeland Se
curit
y-1*
Inhalation-In
door Air-
15*
Loca
l Community
Hea
lth-32
*

What’s more important to invest in today vs historic investments?