eosdis fy2009 annual metrics report prepared by: hyo duck chang adnet, inc. brian krupp adnet, inc....
TRANSCRIPT

EOSDIS FY2009
Annual Metrics Report
Prepared By:
Hyo Duck Chang Adnet, Inc.
Brian Krupp Adnet, Inc.
Lalit Wanchoo Adnet, Inc.
March 2010

2
Preface
The Earth Sciences Data and Information System (ESDIS) Project (Code 423) is pleased to present the following report on metrics from across the Earth Observation System Data and Information System (EOSDIS). The 12 Data Centers of EOSDIS support different scientific disciplines and provide an individualized set of products and services to their science community and the public. Although discipline oriented, the data centers engage in common data management functions of ingest, archive and distribution, as well as describing their data and services on web sites.
Metrics are collected on a daily basis from each data center. The ESDIS Project collects these metrics in a tool called the ESDIS Metrics System (EMS). Data center analysts can view their detailed metrics to assess internal performance and trends. The ESDIS project combines these metrics, not for comparisons between the data centers, but as a system level view of EOSDIS performance. This report provides snapshots of metrics as the combination of the individual data centers and from a purely system perspective.
The EOSDIS Annual Report for FY2009 (Oct. 1, 2008 – Sept. 30, 2009) presents a best effort to combine and present information from the collected metrics data. Some data centers are in the process of developing their interfaces with the EMS and testing is not yet complete. Therefore, some data centers do not yet deliver metrics data in all parameter categories – these will be added in future reports.
In keeping with previous years, and in order to support trend comparisons, the metrics data are presented on a fiscal year basis, not by calendar year.
If you have any questions or comments please contact Jeanne Behnke at (301) 614-5326 or [email protected] or Kevin Murphy at (301) 614-5580 or [email protected].
March 2010 FY2009 Annual Report

3
Introduction
• This report presents statistics on data metrics and web activity at the EOSDIS data centers during Fiscal Year 2009 (October 1, 2008 through September 30, 2009) from the Earth Science Data and Information System (ESDIS) Metrics System (EMS).
• EMS supports the ESDIS project management by collecting and organizing various metrics from the Earth Observing System (EOS) Data and Information System (DIS) Data Centers and other Data Providers. The EMS collects and presents data on the usage of products and services delivered via the Internet or managed in EOSDIS archives.
• EMS consists of a Data Metrics component and a Web Metrics component. The Data Metrics component provides statistics on data ingest, archive and distribution plus data users profile information collected from Data Providers. The Web Metrics component provides statistics on web site visits, views and visitors with a variety of related parameters.
• This report contains tables and graphs of FY2009 statistics and comparisons to previous years. Values for previous fiscal years are produced from EMS. Summary tables, text, graphs, and more detailed statistics tables are also included.
• Definitions for terms used in this report can be found at the end of this presentation.
March 2010 FY2009 Annual Report

Summary
4
Unique Data Sets: Total number of unique data sets distributed in the fiscal year
Distinct Users of EOSDIS Data and Services: Total unique users across EOSDIS Data Users and Web Visitors, per data center and summed
Web Site Visits: Sum of web visits for data centers where a visit represents a user session not broken by more than 30 minutes and a duration of at least one minute
Average Archive Growth: Sum across reporting data centers of the data volume added to the individual archives divided by the days in the year
Total Archive Volume: Sum across reporting data centers of the data volumes in the archive as of end of the fiscal year
End User Distribution Products: Total number of products distributed from all reporting data centers
End User Average Distribution Volume: Sum across reporting data centers of the data volume distributed for the fiscal year divided by the days in the year
March 2010 FY2009 Annual Report
Unique Data Sets > 4,000Distinct Users of EOSDIS Data and Services
> 910K
Web Site Visits > 1MAverage Archive Growth 1.8TB/dayTotal Archive Volume 4.2 PBEnd User Distribution Products > 254MEnd User Average Distribution Volume
6.7 TB/day
EOSDIS Metrics (Oct. 1, 2008 to Sept. 30, 2009)

5
Data Metrics
•Ingest•Archive•Total Archive•Data Users
−Distinct Users−Repeat Users−Top 20
Countries
•Distribution−By Data Center−Volume by
Domain−Products by
Domain−Top 20 Countries−Top 10 Products
March 2010 FY2009 Annual Report

6
Ingest
Ingest is the amount of data coming into a data center over a period of time and includes all product levels. For this report, the data is presented as the amount of data entered into each data center during FY2009. The sum of all data centers is the total ingest for EOSDIS. Only the major contributors (excluding LaTIS which is not available) are included in the count.
March 2010 FY2009 Annual Report
Data Ingested by Data Center
Volume (TBs) Files (Millions)
ASDC 100.33 2.13GESDISC 110.49 7.76GHRC 5.50 0.44LPDAAC 107.44 9.58MODAPS 48.76 0.25NSIDC 13.04 3.62PODAAC 1.74 0.22Total 387.30 24.01

7
ArchiveArchive is the amount of data added to the archive over a period of time and includes all products levels. SEDAC values represent very small amounts of data and are not counted. LaTIS, OBPG, and CDDIS data are not available at this time.
March 2010 FY2009 Annual Report
Data Archivedby Data Center
Volume (TBs)
Files(Millions)
ASDC 107.67 6.68ASF 4.84 0.00GESDISC 139.61 14.30GHRC 1.90 0.14LPDAAC 103.59 9.58MODAPS 267.60 6.71NSIDC 12.37 3.10PODAAC 8.62 0.64ORNL 0.01 0.00Total 646.21 41.16

8
Total Archive Size
The Total Archive Size describes the EOSDIS archive at the end of FY2009. These data account for all data (including ancillary data) but not data marked for deletion.
March 2010 FY2009 Annual Report
Total Archive SizeVolume (TBs)
Files(Millions)
ASDC 2,359.02 68.34ASF 376.69 0.13GESDISC 317.83 31.92GHRC 5.33 0.33LPDAAC 759.51 38.75MODAPS 392.53 18.46NSIDC 63.57 15.02PODAAC 29.62 2.13ORNL 0.39 0.14Total 4,304.49 175.22

9
Distribution By Data CenterDistribution presents the amount of data successfully distributed to Public Users.
*OBPG data taken from the Ocean Color web site
March 2010 FY2009 Annual Report
Distribution by Data Center
ASF CDDIS GESDISC GHRC ASDC LPDAACMODAPS/LAADS
NSIDC ORNL PO.DAAC SEDAC OBPG* Total
Total Volume (TBs)
41.98 9.20 487.32 8.63 187.92 538.94 866.75 120.00 2.86 91.35 0.32 73.96 2,429.21
Products (Millions)
0.47 37.06 54.50 5.68 5.11 38.83 47.21 17.25 7.70 31.72 0.49 8.66 254.66

10
Volume Distribution By Domain
*OBPG data taken from the Ocean Color web site
Volume Distribution presents the volume of data successfully distributed to Public Users by Domain.
March 2010 FY2009 Annual Report
Total Volume Distributed
ASF CDDISGES DISC
GHRC ASDC LP DAACMODAPS /LAADS
NSIDC ORNL PO.DAAC SEDAC OBPG* Total
Foreign 0.23 6.77 85.39 2.54 43.66 283.49 362.01 56.82 1.05 44.48 0.13 0.00 886.57US GOV 20.72 1.49 98.54 1.50 47.63 60.70 271.14 26.29 0.38 23.87 0.01 0.00 552.27US EDU 7.88 0.42 237.75 2.70 26.92 94.55 139.82 15.81 0.88 10.19 0.02 0.00 536.94US COM 11.23 0.17 5.25 0.53 4.80 85.02 21.51 5.58 0.18 1.33 0.06 0.00 135.65US ORG 1.56 0.04 3.24 0.00 0.05 3.56 2.68 0.71 0.00 0.00 0.00 0.00 11.86US Other 0.16 0.23 27.45 0.94 54.19 4.41 35.45 12.01 0.24 8.75 0.01 0.00 143.82Unknown 0.20 0.08 29.71 0.42 10.66 7.21 34.13 2.78 0.13 2.73 0.08 73.96 162.09Total Volume (TBs)
41.98 9.20 487.32 8.63 187.92 538.94 866.75 120.00 2.86 91.35 0.32 73.96 2,429.21

11
Product Distribution By Domain
*OBPG data taken from the Ocean Color web site
Product Distribution presents the number of products successfully distributed to Public Users by Domain.
March 2010 FY2009 Annual Report
Total Products Distributed
ASF CDDIS GES DISC GHRC ASDC LP DAACMODAPS /LAADS
NSIDC ORNL PO.DAAC SEDAC OBPG* Total
Foreign 0.02 27.73 18.01 0.86 1.71 25.96 19.49 9.42 0.64 16.78 0.23 0.00 120.84US GOV 0.04 3.44 12.31 0.18 0.60 5.19 12.70 1.65 1.85 5.35 0.01 0.00 43.30US EDU 0.04 3.44 16.40 4.14 0.64 3.71 8.46 2.15 2.26 3.47 0.04 0.00 44.76US COM 0.34 0.81 1.56 0.09 0.18 3.07 0.57 0.79 0.24 0.77 0.10 0.00 8.50US ORG 0.02 0.27 0.10 0.00 0.00 0.13 0.04 0.09 0.00 0.00 0.01 0.00 0.66US Other 0.01 0.70 2.36 0.18 1.40 0.46 1.84 2.61 2.70 3.57 0.02 0.00 15.84Unknown 0.01 0.67 3.76 0.23 0.58 0.32 4.11 0.55 0.01 1.79 0.09 8.66 20.77Total Products (Millions)
0.47 37.06 54.50 5.68 5.11 38.83 47.21 17.25 7.70 31.72 0.49 8.66 254.66

12
Data Distribution - Top 20 Countries
March 2010 FY2009 Annual Report
CountryVolume (GBs)
1 USA 1,415,908.802 JAPAN 168,926.423 CHINA 124,047.274 FRANCE 103,114.575 BELGIUM 60,052.706 CANADA 55,672.837 UNITED KINGDOM 50,838.728 KOREA, SOUTH 49,663.249 AUSTRALIA 47,396.9610 GERMANY 47,248.4511 ITALY 22,138.7712 BRAZIL 13,860.9513 NETHERLANDS 9,099.9814 SPAIN 8,501.8915 TAIWAN 7,423.9916 RUSSIA 7,351.7517 DENMARK 7,143.6218 INDIA 6,428.6819 HONG KONG 4,877.9620 NORWAY 4868.135
Top 20 Countries by Volume Distributed*
* Some products are inherently larger than other files in size and therefore may skew the results.** When counting # of files, metadata files are not included.
Country Products1 USA 112,972,1552 JAPAN 17,189,0073 CHINA 16,763,6924 UNITED KINGDOM 16,073,7895 GERMANY 6,087,1726 FRANCE 6,048,6127 KOREA, SOUTH 5,827,5228 BRAZIL 5,203,9899 ITALY 4,653,77110 DENMARK 4,190,71111 CANADA 4,140,62712 AUSTRALIA 3,272,45613 FINLAND 2,931,42014 LUXEMBOURG 2,798,36315 RUSSIA 2,700,75216 TAIWAN 2,391,58517 BELGIUM 2,029,19218 INDIA 1,728,39919 SPAIN 1,711,70420 SOUTH AFRICA 1,384,511
Top 20 Countries by Products Distributed**

13
Data Distribution - Top 10 Products
* Some products are inherently larger than other files in size and therefore may skew the results.
** When counting # of files, metadata files are not included.
March 2010 FY2009 Annual Report
Product Description GBs Files**1 AIRIBRAD AIRS/Aqua L1B infrared geolocated radian 196,138.51 4,372,2032 MOD021KM MODIS/Terra Calibrated Radiances 5-Min L1B Swath 1km 165,646.10 2,737,8783 MYD021KM MODIS/Aqua Calibrated Radiances 5-Min L1B Swath 1km 129,571.26 1,503,5964 MOD09GA MODIS/Terra Surface Reflectance Daily L2G Global 1KM and 500M SIN Grid 92,427.60 1,016,6175 AE_L2A AMRS-E/Aqua L2A Brightness Temperatures 76,964.52 1,271,5686 MOD02QKM MODIS/Terra Calibrated Radiances 5-Min L1B Swath 250m 76,299.11 519,7407 MOD13Q1 MODIS/Terra Level 3 16-Day Vegetation Indices - 250m 73,541.15 5,151,8418 MOD09GQ MODIS/Terra Surface Reflectance Daily L2G Global 250m SIN Grid 70,913.81 776,4529 MOD03 MODIS/Terra L1A Geolocation = 1 km 70,032.22 2,794,96610 MOD02HKM MODIS/Terra Calibrated Radiances 5-Min L1B Swath 500m 68,932.64 502,744
Top 10 Products Distributed By Volume*
Product Description Files** GBs1 GNSS_DAILY_D GNSS Daily Compact Observation Data 8,563,521 2,467.652 TRMM_3B42 TRMM 3B42 3-Hour 0.25deg x 0.25deg and Other-GPI Calibration Rainfall 8,045,425 8,537.753 MOD14 MODIS/Terra Thermal Anomalies/Fire 5-Min L2 Swath 1km 7,218,381 1,582.004 MYD14 MODIS/Aqua Thermal Anomalies/Fire 5-Min L2 Swath 1km 6,340,602 1,415.805 AIRX2RET AIRS/Aqua FINAL Level 2 Products (Without HSB) 6,246,276 7,757.086 MYD04_L2 MODIS/Aqua Level 2 Aerosol 6,053,135 6,706.027 GNSS_DAILY_O GNSS Daily Observation Data 5,495,849 2,977.948 GNSS_IGSTROP GNSS Final Troposphere Zenith Path Delay Product 5,467,986 12.819 MOD13Q1 MODIS/Terra Level 3 16-Day Vegetation Indices - 250m 5,151,841 73,541.1510 MOD04_L2 MODIS/Terra Aerosol 5-MIN L2 Swath 10KM 5,025,697 5,184.23
Top 10 Products Distributed By Files**

14
Distinct Data UsersDistinct Data Users presents the number of distinct public users* who received data product files .
* Does not include OBPG users
March 2010 FY2009 Annual Report
Distinct Data Users By Domain
ASF CDDISGES DISC
GHRC ASDC LP DAACMODAPS /LAADS
NSIDC ORNL PO.DAAC SEDAC Total
Foreign 8,751 22,355 17,857 1,346 686 11,114 59,207 6,221 8,696 13,688 42,394 192,315US GOV 49 1,274 3,797 149 200 661 1,038 602 444 1,145 450 9,809US EDU 171 933 4,412 225 254 1,876 1,572 1,600 1,687 1,824 2,749 17,303US COM 1,527 3,310 7,213 428 161 3,801 2,126 2,727 2,480 2,487 15,589 41,849US ORG 23 102 191 5 6 176 35 71 51 42 311 1,013US Other 258 1,848 2,117 190 185 403 781 837 841 850 3,427 11,737Unknown 1,092 1,437 2,383 522 29 443 1,143 770 772 1,123 7,799 17,513Total Distinct Data Users
11,871 31,259 37,970 2,865 1,521 18,474 65,902 12,828 14,971 21,159 72,719 291,539

15
Repeat Data UsersRepeat users are distinct Public users* who received data on more than one day in the fiscal year .
* Does not include OBPG users
March 2010 FY2009 Annual Report
Repeat Data Users By Domain
ASF CDDISGES DISC
GHRC ASDC LP DAACMODAPS /LAADS
NSIDC ORNL PO.DAAC SEDAC Total
Foreign 270 6,994 4,002 276 285 4,353 4,149 1,563 1,319 3,363 4,216 30,790US GOV 24 621 952 50 112 303 423 258 120 428 117 3,408US EDU 57 407 1,180 70 95 817 520 535 347 542 283 4,853US COM 243 1,276 706 110 59 1,535 700 437 552 364 1,106 7,088US ORG 6 57 36 1 3 81 11 31 10 7 65 308US Other 39 869 389 33 96 115 314 169 124 187 599 2,934Unknown 50 556 471 129 15 128 195 145 89 248 1,024 3,050Total Repeat Data Users
689 10,780 7,736 669 665 7,332 6,312 3,138 2,561 5,139 7,410 52,431

16
Data Users - Top 20 Countries
March 2010 FY2009 Annual Report
Country Users1 USA 78,5382 CHINA 50,3173 UNITED KINGDOM 9,4704 GERMANY 8,0985 CANADA 7,6536 JAPAN 6,3567 AUSTRALIA 4,9568 FRANCE 4,9519 INDIA 4,85610 ITALY 4,26411 SPAIN 3,54212 RUSSIA 3,23513 BRAZIL 2,88414 KOREA, SOUTH 2,35715 NETHERLANDS 2,16816 CHILE 1,93317 TAIWAN 1,74418 POLAND 1,33719 ARGENTINA 1,32520 UKRAINE 1,189
Top 20 Countries by Number of Users

FY2009 Annual Report 17March 2010
Foreign DistributionForeign Country # of Users # of Products (1000s) Vol (TBs)
EU 43,786 50,268 319.46Canada 7,653 4,141 54.37China 50,317 16,764 121.14Japan 6,356 17,189 164.97Other 84,203 32,482 226.67
EU includes 27 European Union member countries.China includes only People’s Republic of China and does not include Taiwan.

18
Web Metrics
•Visitors and Visits
•Repeat Visitors
•Top 20 Domains
•Top 20 Countries
March 2010 FY2009 Annual Report

19
Web Visitors and VisitsEOSIDS web activity is measured by the number of Visits made, the number of pages Viewed and the number of distinct Visitors. Visits, Views, and Visitors count visits greater than or equal to 1 minute. Visits of at least one minute are considered to represent significant work accomplished, and many of the shorter visits are of less than a second.
March 2010 FY2009 Annual Report
Month # Visits # Views# Unique Visitors
Oct-08 101,157 912,590 71,591
Nov-08 95,149 873,274 68,622
Dec-08 85,076 845,467 61,036
J an-09 95,925 971,734 69,596
Feb-09 104,115 983,594 75,899
Mar-09 104,267 1,025,714 76,029
Apr-09 100,596 1,096,707 73,019
May-09 85,957 936,211 60,277
J un-09 77,291 864,837 53,625
J ul-09 77,992 1,083,830 53,813
Aug-09 73,256 1,021,196 51,027
Sep-09 78,536 848,611 56,674
FY2009 1,079,317 11,463,765 771,208

20
Repeat Web VisitorsEOSDIS Web Visitors are characterized by the number of visits they make and how frequently they return. Visitors counted in the table below are those that stayed for one minute or more. Repeat Visitors are counted from the start of the Fiscal Year.
FY2009 Web Visitors for Visits of one minute or more
March 2010 FY2009 Annual Report
# of Visits 2 3 4 5-6 7-9 10 - 14 15 - 24 25 - 49 50 - 99 100+Total
VisitorsAll DAACs 63,398 21,096 9,926 9,367 5,760 3,528 2,236 1,128 338 109 116,886

21
Top 20 Domains By # Web VisitorsThe FY2009 Top 20 Domains for visits >= 1 minute is sorted by the # of Visitors. Domains are as defined by NetInsight.
March 2010 FY2009 Annual Report
Ranking Domain VisitorsPercent Visitors
VisitsPercent
VisitsViews
Percent Views
1 Unresolved 233,833 10.80% 388,998 10.10% 3,631,804 29.20%2 Network (.net) 134,644 6.20% 177,531 4.60% 1,334,439 10.70%3 Commercial (.com) 55,489 2.60% 82,253 2.10% 607,516 4.90%4 United States Educational 28,791 1.30% 60,242 1.60% 668,623 5.40%5 Australia 12,354 0.60% 18,367 0.50% 170,835 1.40%6 Canada 11,931 0.60% 19,293 0.50% 170,778 1.40%7 United States Government 11,122 0.50% 42,904 1.10% 526,023 4.20%8 Japan 5,999 0.30% 13,401 0.30% 158,687 1.30%9 United Kingdom 5,942 0.30% 10,598 0.30% 101,622 0.80%10 United States 5,662 0.30% 10,276 0.30% 121,426 1.00%11 India 4,838 0.20% 9,203 0.20% 92,580 0.70%12 Organization (.org) 4,717 0.20% 8,838 0.20% 109,020 0.90%13 Germany 4,004 0.20% 7,165 0.20% 68,314 0.60%14 Brazil 3,927 0.20% 5,541 0.10% 50,083 0.40%15 Mexico 3,125 0.10% 4,220 0.10% 42,610 0.30%16 China 2,714 0.10% 4,242 0.10% 46,733 0.40%17 Italy 2,683 0.10% 4,691 0.10% 53,356 0.40%18 Argentina 2,598 0.10% 3,931 0.10% 42,622 0.30%19 France 2,303 0.10% 4,457 0.10% 49,349 0.40%20 United States Military 1,914 0.10% 4,739 0.10% 38,642 0.30%

22
Top 20 Countries By # Web VisitsThe FY2009 Top 20 Countries for visits >= 1 minute is sorted by the # of Visits.
March 2010 FY2009 Annual Report
Country VisitorsPercent Visitors
VisitsPercent
VisitsViews
Percent Views
1 United States 253,601 11.70% 414,360 10.80% 3,719,209 29.90%
2 China 26,020 1.20% 56,503 1.50% 680,526 5.50%
3 Great Britain 35,213 1.60% 52,727 1.40% 384,073 3.10%
4 Canada 31,698 1.50% 47,692 1.20% 402,576 3.20%
5 Australia 16,820 0.80% 25,800 0.70% 229,413 1.80%
6 India 13,394 0.60% 24,701 0.60% 251,488 2.00%
7 Germany 15,897 0.70% 23,169 0.60% 209,600 1.70%
8 France 11,330 0.50% 18,737 0.50% 181,208 1.50%
9 Italy 10,501 0.50% 17,634 0.50% 184,526 1.50%
10 J apan 7,697 0.40% 17,613 0.50% 207,149 1.70%
11 Spain 10,634 0.50% 16,293 0.40% 176,779 1.40%
12 Netherlands 6,118 0.30% 15,929 0.40% 123,040 1.00%
13 Sweden 5,253 0.20% 9,473 0.20% 64,146 0.50%
14 Norway 4,330 0.20% 8,263 0.20% 56,669 0.50%
15 Brazil 5,354 0.20% 7,970 0.20% 73,340 0.60%
16 Russian Federation 3,802 0.20% 7,561 0.20% 82,632 0.70%
17 Korea, Republic of 3,438 0.20% 7,033 0.20% 96,574 0.80%
18 Ireland 2,564 0.10% 6,621 0.20% 36,475 0.30%
19 Finland 3,119 0.10% 6,287 0.20% 48,626 0.40%
20 Mexico 4,349 0.20% 6,267 0.20% 65,896 0.50%

23
Total Users and Trends
•Total Users
•Data Volume Distribution Trend
•Data Product Distribution Trend
•Top 10 Products Trend FY2008-FY2009
•Known U.S. - Foreign Product Distribution
Trend
•Web Trends (Visits and Visitors)March 2010 FY2009 Annual Report
FY2009 Annual Report 24March 2010
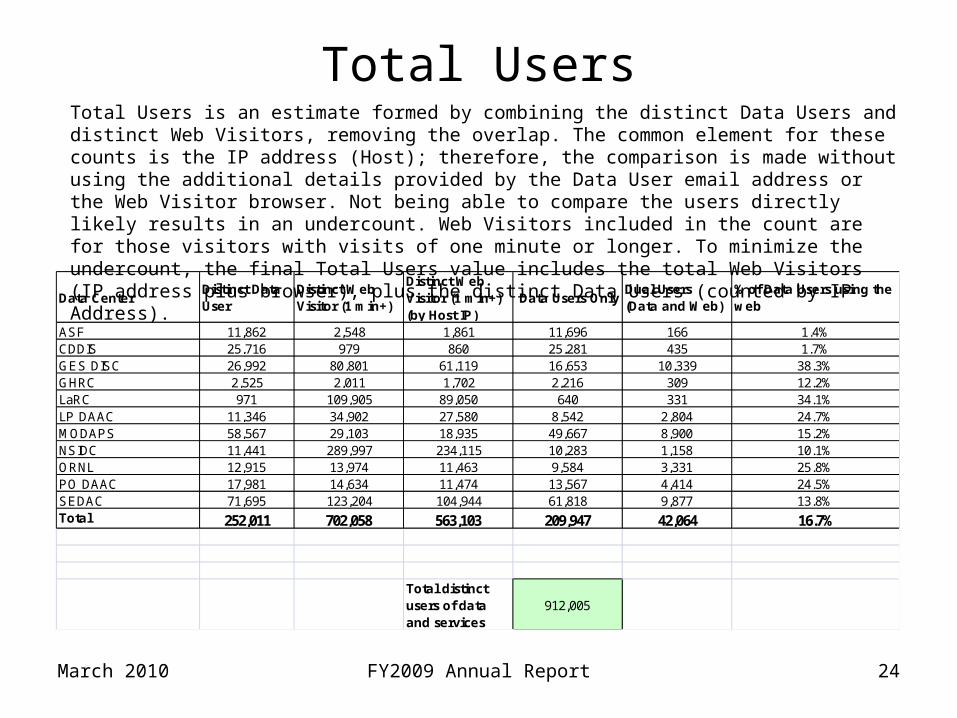
Total UsersTotal Users is an estimate formed by combining the distinct Data Users and distinct Web Visitors, removing the overlap. The common element for these counts is the IP address (Host); therefore, the comparison is made without using the additional details provided by the Data User email address or the Web Visitor browser. Not being able to compare the users directly likely results in an undercount. Web Visitors included in the count are for those visitors with visits of one minute or longer. To minimize the undercount, the final Total Users value includes the total Web Visitors (IP address plus browser), plus the distinct Data Users (counted by IP Address).
Data CenterDistinct Data User
Distinct Web Visitor (1 min+)
Distinct WebVisitor (1 min+)(by Host IP)
Data Users OnlyDual Users(Data and Web)
% of Data Users using the web
ASF 11,862 2,548 1,861 11,696 166 1.4%CDDIS 25,716 979 860 25,281 435 1.7%GES DISC 26,992 80,801 61,119 16,653 10,339 38.3%GHRC 2,525 2,011 1,702 2,216 309 12.2%LaRC 971 109,905 89,050 640 331 34.1%LP DAAC 11,346 34,902 27,580 8,542 2,804 24.7%MODAPS 58,567 29,103 18,935 49,667 8,900 15.2%NSIDC 11,441 289,997 234,115 10,283 1,158 10.1%ORNL 12,915 13,974 11,463 9,584 3,331 25.8%PO DAAC 17,981 14,634 11,474 13,567 4,414 24.5%SEDAC 71,695 123,204 104,944 61,818 9,877 13.8%Total 252,011 702,058 563,103 209,947 42,064 16.7%
Total distinct users of data and services
912,005

25
Data Volume Distribution TrendThe Volume Distribution Trend presents distributed volume counts from EMS by data center. OBPG* distribution metrics from the Ocean Color web site are included beginning in FY2004.
March 2010 FY2009 Annual Report
Volume Distributed (TBs)
ASF CDDIS GESDISC GHRC ASDC LP DAACMODAPS /LAADS
NSIDC ORNL PO.DAAC SEDAC OBPG* Total
FY00 0.01 20.99 0.63 6.32 8.69 0.00 0.24 0.01 1.85 0.08 38.82FY01 0.14 45.37 1.00 30.38 25.71 0.00 0.40 0.02 2.73 0.12 105.87FY02 0.05 82.97 1.25 62.53 171.32 0.00 1.36 0.47 4.92 0.17 325.03FY03 1.36 185.02 6.49 107.90 110.43 0.00 4.20 1.21 28.08 0.22 444.90FY04 2.35 278.13 7.70 147.01 209.82 0.00 15.91 1.23 37.49 0.16 2.97 702.75FY05 2.31 361.22 7.56 127.37 224.27 0.00 27.11 1.90 31.37 0.17 8.90 792.18FY06 1.88 493.29 9.10 204.70 329.00 18.48 55.69 0.95 36.55 0.16 24.28 1,174.07FY07 2.16 192.65 8.01 225.24 431.40 564.21 69.54 1.17 14.06 0.08 36.88 1,545.40FY08 16.50 302.80 12.08 167.14 448.12 813.94 81.32 0.74 62.17 0.06 61.04 1,965.91FY09 41.98 9.20 487.32 8.63 187.92 538.94 866.75 120.00 2.86 91.35 0.32 73.96 2,429.21Total Volume (TBs)
68.74 9.20 2,449.76 62.44 1,266.50 2,497.70 2,263.38 375.75 10.56 310.57 1.53 208.01 9,524.13

26
Data Product Distribution TrendThe Product Distribution Trend presents distributed product counts from EMS by data center. OBPG* distribution metrics from the Ocean Color web site are included beginning in FY2004.
March 2010 FY2009 Annual Report
Products Distributed (Millions)
ASF CDDIS GESDISC GHRC ASDC LPDAACMODAPS /LAADS
NSIDC ORNL PO.DAAC SEDAC OBPG*Total
Products
FY00 0.00 2.34 0.97 0.22 0.62 0.00 0.13 0.01 1.05 0.19 5.52FY01 0.00 2.64 1.03 0.97 1.24 0.00 0.25 0.03 2.08 0.26 8.49FY02 0.00 5.28 1.42 3.68 4.63 0.00 0.40 0.09 3.55 0.26 19.31FY03 0.03 10.92 4.68 4.15 3.72 0.00 0.86 0.11 10.45 0.30 35.21FY04 0.06 15.67 3.40 6.77 8.90 0.00 0.96 0.42 10.30 0.25 0.29 47.03FY05 0.06 26.55 3.58 5.70 15.08 0.00 1.80 0.49 12.83 0.26 1.71 68.06FY06 0.04 41.41 4.05 7.78 11.93 1.67 4.69 0.36 13.48 0.32 4.91 90.64FY07 0.05 30.98 9.29 7.32 24.32 33.36 8.13 1.22 5.71 0.11 7.04 127.54FY08 0.30 38.75 10.18 3.57 16.76 47.74 10.73 0.40 16.49 0.07 10.67 155.66FY09 0.47 37.06 54.50 5.68 5.11 38.83 47.21 17.25 7.70 31.72 0.49 8.66 254.66Total Products (Millions)
1.01 37.06 229.03 44.28 45.27 126.03 129.97 45.19 10.82 107.68 2.51 33.28 812.12

27
Top 10 Products Trend by VolumeFY2008 – FY2009
*Some products are inherently larger than other files in size and therefore may skew the results.
March 2010 FY2009 Annual Report
Product Description GBs Files1 MOD021KM MODIS/Terra Calibrated Radiances 5-Min L1B Swath 1km 124,618.63 2,771,0072 AIRIBRAD AIRS/Aqua L1B infrared geolocated radian 111,146.03 2,903,0733 MOD02HKM MODIS/Terra Calibrated Radiances 5-Min L1B Swath 500m 102,767.58 722,9314 MOD13Q1 MODIS/Terra Level 3 16-Day Vegetation Indices - 250m 93,648.47 976,4105 MOD02QKM MODIS/Terra Calibrated Radiances 5-Min L1B Swath 250m 86,588.36 571,8156 MYD021KM MODIS/Aqua Calibrated Radiances 5-Min L1B Swath 1km 82,150.44 2,361,6097 MYD02QKM MODIS/Aqua Calibrated Radiances 5-Min L1B Swath 250m 60,130.46 364,6388 MOD03 MODIS/Terra L1A Geolocation = 1 km 49,630.35 1,937,8719 MOD09A1 MODIS/Terra Level 3 8-Day Surface Reflectance - 500m 46,681.83 1,287,05410 AE_L2A AMRS-E/Aqua L2A Brightness Temperatures 45,379.45 1,050,686
Product Description GBs Files1 AIRIBRAD AIRS/Aqua L1B infrared geolocated radian 196,138.51 4,372,2032 MOD021KM MODIS/Terra Calibrated Radiances 5-Min L1B Swath 1km 165,987.99 2,740,6253 MYD021KM MODIS/Aqua Calibrated Radiances 5-Min L1B Swath 1km 129,814.39 1,505,5514 MOD09GA MODIS/Terra Surface Reflectance Daily L2G Global 1km and 500m SIN Grid 92,435.13 1,016,6175 AE_L2A AMRS-E/Aqua L2A Brightness Temperatures 76,969.07 1,271,5686 MOD02QKM MODIS/Terra Calibrated Radiances 5-Min L1B Swath 250m 76,395.48 520,3827 MOD13Q1 MODIS/Terra Level 3 16-Day Vegetation Indices - 250m 73,551.47 5,151,8418 MOD09GQ MODIS/Terra Surface Reflectance Daily L2G Global 250m SIN Grid 70,918.78 776,4529 MOD03 MODIS/Terra L1A Geolocation = 1 km 70,132.05 2,799,82010 MOD02HKM MODIS/Terra Calibrated Radiances 5-Min L1B Swath 500m 69,015.68 503,350
FY2008 Top 10 Products Distributed By Volume*
FY2009 Top 10 Products Distributed By Volume*

28
Top 10 Products Trend by #FilesFY2008 – FY2009
When counting # of files, metadata files are not included.
March 2010 FY2009 Annual Report
Product Description Files GBs1 AIRX2RET AIRS/Aqua FINAL Level 2 Products (Without HSB) 9,410,738 16,731.672 MYD04_L2 MODIS/Aqua Aerosol 5-Min L2 Swath 10km 5,320,157 5,462.873 MOD04_L2 MODIS/Terra Aerosol 5-Min L2 Swath 10km 4,710,287 5,248.004 TRMM_3B42 TRMM 3B42 3-Hour 0.25deg x 0.25deg and Other-GPI Calibration Rainfall 3,611,579 3,584.125 MOD14 MODIS/Terra Thermal Anomalies/Fire 5-Min L2 Swath 1km 3,053,976 694.656 AIRIBRAD AIRS/Aqua L1B infrared geolocated radiances 2,901,691 111,146.017 MYD14 MODIS/Aqua Thermal Anomalies/Fire 5-Min L2 Swath 1km 2,775,012 653.308 MOD021KM MODIS/Terra Calibrated Radiances 5-Min L1B Swath 1km 2,771,007 124,618.639 PODAAC 167 Jason-1 Operational Sensor Data Record (OSDR) 2,496,794 1,073.5310 NSIDC-0032 DMSP SSM/I Pathfinder Daily EASE-Grid Brightness Temperatures L3 2,485,467 1,808.74
Product Description Files GBs1 GNSS_DAILY_D GNSS Daily Compact Observation Data 8,563,521 2,467.652 TRMM_3B42 TRMM 3B42 3-Hour 0.25deg x 0.25deg and Other-GPI Calibration Rainfall 8,045,425 8,537.753 MOD14 MODIS/Terra Thermal Anomalies/Fire 5-Min L2 Swath 1km 7,218,381 1,582.004 MYD14 MODIS/Aqua Thermal Anomalies/Fire 5-Min L2 Swath 1km 6,340,602 1,415.805 AIRX2RET AIRS/Aqua FINAL Level 2 Products (Without HSB) 6,246,276 7,757.086 MYD04_L2 MODIS/Aqua Level 2 Aerosol 6,053,135 6,706.027 GNSS_DAILY_O GNSS Daily Observation Data 5,495,849 2,977.948 GNSS_IGSTROP GNSS Final Troposphere Zenith Path Delay Product 5,467,986 12.819 MOD13Q1 MODIS/Terra Level 3 16-Day Vegetation Indices - 250m 5,151,841 73,541.1510 MOD04_L2 MODIS/Terra Aerosol 5-MIN L2 Swath 10KM 5,025,697 5,184.23
FY2008 Top 10 Products Distributed By # of Files
FY2009 Top 10 Products Distributed By # of Files

29
Known U.S. - Foreign Product Distribution Trend
* Does not include product distribution where the destination could not be determined
March 2010 FY2009 Annual Report
Product Trend FY2007 FY2008 FY2009Foreign 35,960,845 56,769,710 120,843,195U.S. 65,563,006 69,857,119 113,052,619

30
Web TrendsWeb metrics data for EOSDIS became available as of FY2007, providing only one previous year to assess trends. Data for FY2007 is complete for 7 and FY2008 is complete for 8 of the 11 data centers providing metrics for FY2009. These web metrics are for visits of one minute or more.
March 2010 FY2009 Annual Report
Views Visits Visitors Repeat VisitorsFY2007 7,599,722 707,365 443,079 77,731FY2008 8,263,283 827,714 523,416 91,801FY2009 11,463,765 1,079,317 702,058 116,886

31
Definitions (1 of 2)
March 2010 FY2009 Annual Report
EMS Term Definition
Data Provider
EOSDIS element serving as a source of metrics information for describing the ingest, archive and distribution of EOSDIS science data; web activity metrics are also collected. For the EOSDIS annual reporting, metrics from individual data providers at a single site are combined (e.g., NSIDC = NSIDCECS + NSIDCV0).
Data Metrics
Metrics describing the ingest, archive and distribution of EOSDIS science data at EOSDIS Data Centers. This EOSDIS Annual Report presents data metrics from EOSDIS Data Centers. Most metrics can be found in the EMS HTMLDB interface (http://ops1.ems.eosdis.nasa.gov: 8000/pls/apex/f?p=111). Metrics from other sources are noted in the report where applicable.
Web MetricsMetrics describing the web activity at EOSDIS Data Center web sites and EOSDIS related web sites. This EOSDIS Annual Report presents web metrics by EOSDIS Data Centers. These metrics can be found in the EMS NetInsight interface (https://ems.eos.nasa.gov/NetInsight/index.html).
DomainDesignates the type of business or organization accessing EOSDIS. The domain is determined from the IP address and country.
EMS Data File Term
Definition
IngestIngest is the amount of data coming into a data center over a period of time and includes all product levels.
Archive Archive is the amount of data added to the archive over a period of time and includes all products levels.
Total Archive SizeThe Total Archive Size describes the EOSDIS archive at the end of the fiscal year. This includes all data (including ancillary) but not data marked for deletion.
Data User Any individual requesting data as defined by an IP address plus email, within the time period.Distinct Users The number of distinct (i.e., counted once) users receiving data during the report period.
GranuleThe smallest unit of data inventoried and distributed to users; typically, a granule is a single data file, though some granules may include multiple files.
ProductEMS counts individual files as distinct products. This is roughly equivalent to counting EOS granules, although in the case of some EOS instrument data, a granule may contain more than one file. If so, the files are counted as individual products.
Number of Products Delivered
The number of files successfully delivered to Public users. This count excludes METADATA file types. If the file type does not distinguish a file as a metadata or a science file, i.e., it is encoded as n/a, then the default process is to count the file as a science data product.
Volume of Products Delivered
The volume of data (in MBs) successfully delivered to Public users. This includes all file types, including METADATA.

32
Definitions (2 of 2)
March 2010 FY2009 Annual Report
EMS Data File Term
Definition
Public UserAny individual defined by an IP Address who requests and receives data for purposes other than product generation and quality assurance/testing.
QA/Test User Any identified and authorized user who requests data for the purposes of quality assurance/testing.Production User Any identified and authorized user who requests data for the purposes of product generation.All Users All distinct Public users requesting data within the time period.
Repeat UsersDistinct Public users requesting data more than once during the time period. If the user is requesting data for the first time ever within the specific time period and then requests data again during the specific time period, he/she would be counted as a repeat user.
EMS Web File Term
Definition
VisitorAny individual defined by IP Address+browser that views a web page. A visitor can also become a 'Data User' once data is requested.
Distinct Visitors The number of distinct (i.e., counted once) visitors to a provider's web sites during the time period.
ViewHit by a user during a session to a web page, excluding error hits and hits to user-defined files such as inline images (.JPG, .GIF, etc.), Java applets, and specific redirects or services provided by the data provider.
VisitA series of consecutive views of a website by the same user without continuous interruption of more than 30 minutes. If a user does not view a new page in a specified time, the next page viewed by that user is considered the start of a new visit.
EMS Web Views The number of page views to a provider's web pages over the time period. EMS Web Visits The number of visits over the time period.All Visitors All distinct visitors viewing a web page during the report time period.
Repeat VisitorsVisitors who view a web page during a specific time period who have accessed the system before. If the visitor accesses the system for the first time ever within the time period and then accesses the system again during the specific time period, he/she would be counted as a repeat visitor.
Report Term DefinitionStage 1 Metrics data directly from the EMS tools, presented by “data provider” as available.
Stage 2 Metrics data grouped by “data center”, augmented with external data, includes all twelve data centers.
Stage 3 Metrics data presented by the major contributing data centers, often accompanied by a graphic.