eos mls observations of ozone loss in the 2004–2005...
TRANSCRIPT
EOS MLS observations of ozone loss in the 2004–2005 Arctic winter
G. L. Manney,1,2 M. L. Santee,1 L. Froidevaux,1 K. Hoppel,3 N. J. Livesey,1
and J. W. Waters1
Received 26 August 2005; revised 15 December 2005; accepted 28 December 2005; published 16 February 2006.
[1] Earth Observing System Microwave Limb Sounder O3
and N2O are used to examine transport and chemical O3 lossin the unusually cold 2004–2005 Arctic winter. The vortexwas dynamically active, with episodic mixing eventsthroughout the winter; descent was the dominant transportprocess only through late January. Before the onset of lowerstratospheric chemical loss, O3 was higher near the vortexedge than in the vortex core, causing different effects ofmixing depending on the vortex region and time, eithermasking or mimicking chemical loss. O3 loss ceased by10 March because of an early final warming. Roughestimates suggest maximum vortex-averaged O3 loss of1.2–1.5 ppmv between 450 and 500 K, with up to �2 ppmvloss in the outer vortex near 500 K. Despite record cold,chemical O3 loss was less in 2004–2005 than in previouscold Arctic winters. Citation: Manney, G. L., M. L. Santee,
L. Froidevaux, K. Hoppel, N. J. Livesey, and J. W. Waters (2006),
EOS MLS observations of ozone loss in the 2004–2005 Arctic
winter, Geophys. Res. Lett., 33, L04802, doi:10.1029/
2005GL024494.
1. Introduction
[2] The 2004–2005 Arctic winter lower stratosphere wasthe coldest on record, with potential for polar stratosphericcloud (PSC) formation on more days and over a largerregion than in any previously observed northern hemisphere(NH) winter (Figure 1). It was the first NH winter observedby the Earth Observing System (EOS) Microwave LimbSounder (MLS). EOS MLS is a successor to the UpperAtmosphere Research Satellite (UARS) MLS, with greatlyenhanced capabilities for studying polar O3 [Waters et al.,2006]: O3 is measured with greater precision and temporaland spatial coverage than UARS MLS, without gaps in thepolar regions due to satellite yaws; EOS MLS N2O mea-surements provide a long-lived tracer for diagnosing trans-port, critical to assessing Arctic O3 loss [e.g., WorldMeteorological Organization, 2003].[3] EOS MLS observations indicate extensive PSC ac-
tivity after mid-December 2004 (M. L. Santee et al., A studyof stratospheric chlorine partitioning in the winter polarvortices based on new satellite measurements and modeling,manuscript in preparation, 2006, hereinafter referred to as
SA), including evidence of ice PSCs in late January. Studiesof chlorine from MLS and ACE-FTS (the AtmosphericChemistry Experiment-Fourier Transform Spectrometer)[Dufour et al., 2006; SA] indicate strong chlorine activationfrom early January through early March 2005, after whichlow temperatures and PSC existence were halted by a‘‘major final warming’’ (MFW, a major warming thatprogresses directly into the final warming [e.g., Labitzkeet al., 2002]). Here we discuss evidence for chemical O3
loss using MLS O3 and N2O observations viewed in relationto the vortex evolution.[4] The MLS data are the first publicly released version
(v1.51). In the lower stratosphere, vertical resolution is �3–4 km for N2O and O3, and estimated precisions are �20–30 ppbv and �0.2–0.3 ppmv, respectively; early validationresults show O3 agrees to within 5–15% with other datasets, and N2O agrees with balloon-borne observationswithin the expected precisions [Froidevaux et al., 2006].For maps and time series, MLS data are gridded at 2 � 5�(latitude � longitude) using a weighted average around eachgridpoint of 24 hours’ data. NASA’s Global Modeling andAssimilation Office Goddard Earth Observing SystemVersion 4.0.3 (GEOS-4) meteorological analyses [Bloomet al., 2005] are used for potential vorticity (PV),equivalent latitude (EqL, the latitude that would enclosethe same area between it and the pole as a given PVcontour) mapping, and interpolation to isentropic (potentialtemperature, q) surfaces. A few days when MLS data areunavailable are filled using a Kalman filter and areindicated by pale colors in the time series plots [e.g.,Santee et al., 2003].
2. MLS Observations of Vortex Evolution andOzone Loss
[5] Figure 2 shows 490 K (�19 km) MLS N2O and O3
maps during the 2004–2005 winter. The time evolution ofN2O and O3 is shown in more detail in Figure 3. Chlorinewas not substantially activated until late December 2004[SA]. Prior to significant chlorine activation, a region oflower O3 developed in the vortex core (via transportprocesses under investigation) during vortex formation.The vortex was frequently dynamically active during thiswinter. In early to mid-January and throughout February,evidence of mixing was seen in excursions of higher N2Odeeper into the vortex (Figure 3). This is reflected in the29 January maps, which suggest intrusions of extravortexair into the outer vortex (near 0� longitude) and intrusions ofvortex edge air into the core (near 30�E). N2O began toincrease throughout the vortex after about 1 February,indicating that descent was no longer the dominant transportprocess. Figure 3 shows excursions of high N2O into thevortex core starting in late February (also seen in 27 Febru-
GEOPHYSICAL RESEARCH LETTERS, VOL. 33, L04802, doi:10.1029/2005GL024494, 2006
1Jet Propulsion Laboratory, California Institute of Technology,Pasadena, California, USA.
2Also at Department of Physics, New Mexico Institute of Mining andTechnology, Socorro, New Mexico, USA.
3Naval Research Laboratory, Washington, D. C., USA.
Copyright 2006 by the American Geophysical Union.0094-8276/06/2005GL024494$05.00
L04802 1 of 5
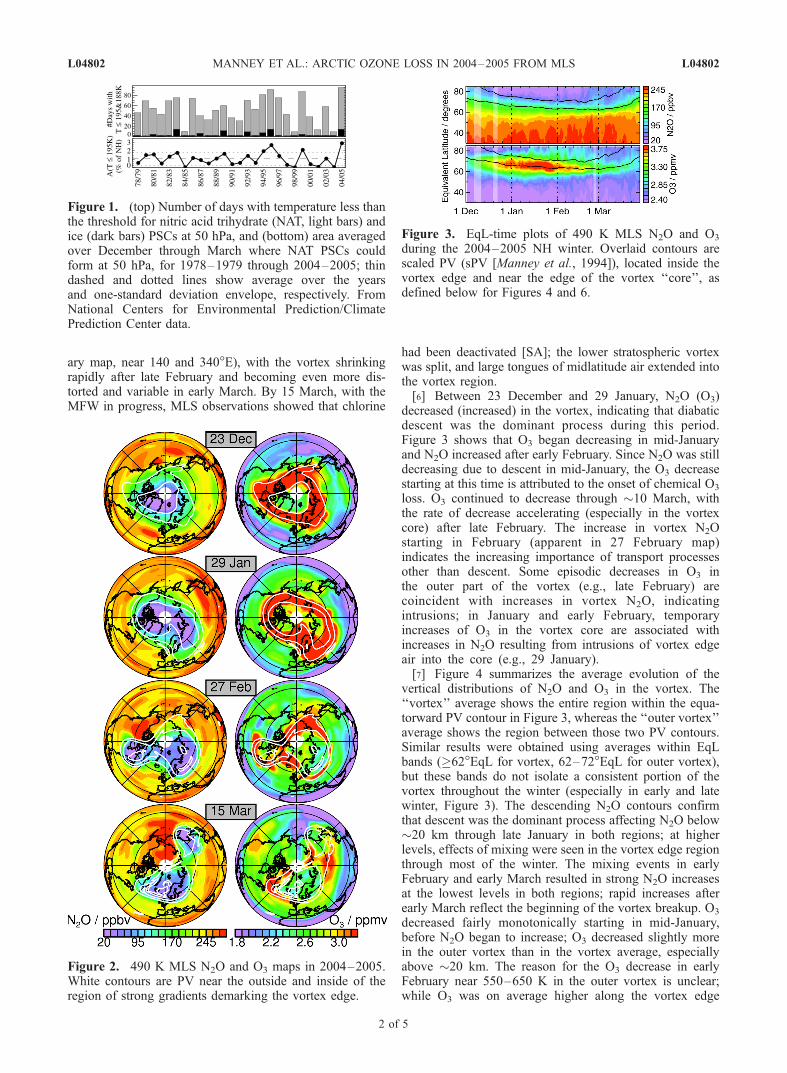
ary map, near 140 and 340�E), with the vortex shrinkingrapidly after late February and becoming even more dis-torted and variable in early March. By 15 March, with theMFW in progress, MLS observations showed that chlorine
had been deactivated [SA]; the lower stratospheric vortexwas split, and large tongues of midlatitude air extended intothe vortex region.[6] Between 23 December and 29 January, N2O (O3)
decreased (increased) in the vortex, indicating that diabaticdescent was the dominant process during this period.Figure 3 shows that O3 began decreasing in mid-Januaryand N2O increased after early February. Since N2O was stilldecreasing due to descent in mid-January, the O3 decreasestarting at this time is attributed to the onset of chemical O3
loss. O3 continued to decrease through �10 March, withthe rate of decrease accelerating (especially in the vortexcore) after late February. The increase in vortex N2Ostarting in February (apparent in 27 February map)indicates the increasing importance of transport processesother than descent. Some episodic decreases in O3 inthe outer part of the vortex (e.g., late February) arecoincident with increases in vortex N2O, indicatingintrusions; in January and early February, temporaryincreases of O3 in the vortex core are associated withincreases in N2O resulting from intrusions of vortex edgeair into the core (e.g., 29 January).[7] Figure 4 summarizes the average evolution of the
vertical distributions of N2O and O3 in the vortex. The‘‘vortex’’ average shows the entire region within the equa-torward PV contour in Figure 3, whereas the ‘‘outer vortex’’average shows the region between those two PV contours.Similar results were obtained using averages within EqLbands (�62�EqL for vortex, 62–72�EqL for outer vortex),but these bands do not isolate a consistent portion of thevortex throughout the winter (especially in early and latewinter, Figure 3). The descending N2O contours confirmthat descent was the dominant process affecting N2O below�20 km through late January in both regions; at higherlevels, effects of mixing were seen in the vortex edge regionthrough most of the winter. The mixing events in earlyFebruary and early March resulted in strong N2O increasesat the lowest levels in both regions; rapid increases afterearly March reflect the beginning of the vortex breakup. O3
decreased fairly monotonically starting in mid-January,before N2O began to increase; O3 decreased slightly morein the outer vortex than in the vortex average, especiallyabove �20 km. The reason for the O3 decrease in earlyFebruary near 550–650 K in the outer vortex is unclear;while O3 was on average higher along the vortex edge
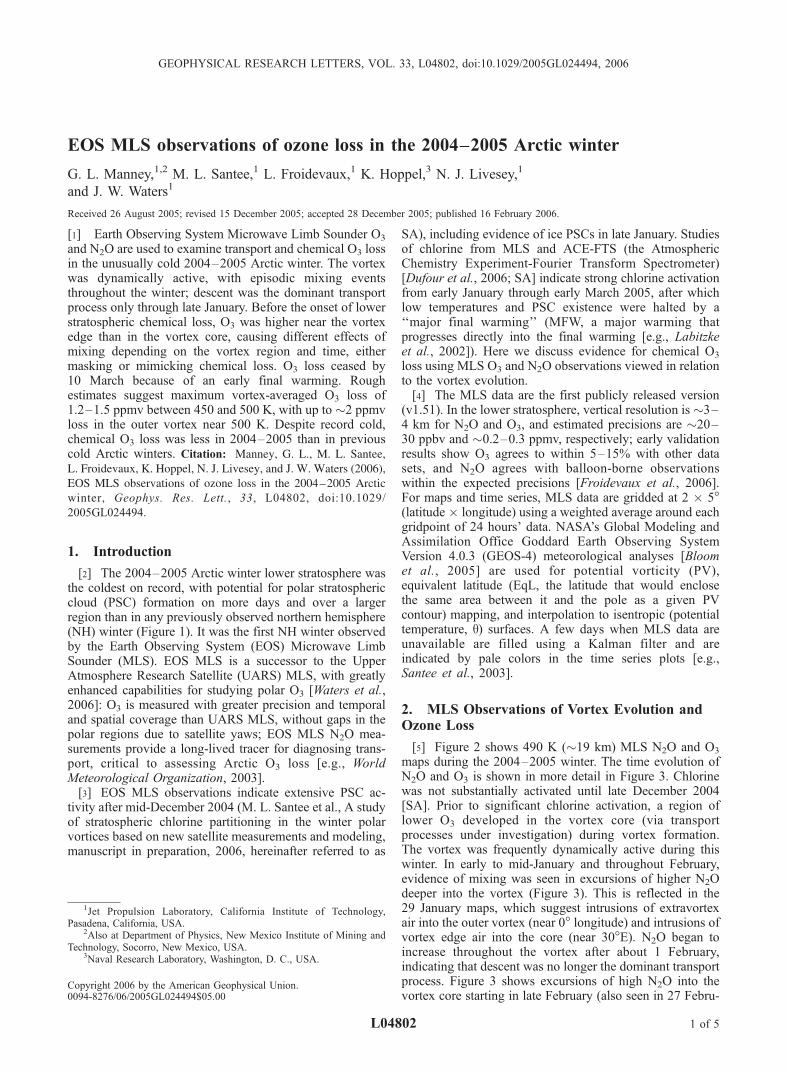
Figure 1. (top) Number of days with temperature less thanthe threshold for nitric acid trihydrate (NAT, light bars) andice (dark bars) PSCs at 50 hPa, and (bottom) area averagedover December through March where NAT PSCs couldform at 50 hPa, for 1978–1979 through 2004–2005; thindashed and dotted lines show average over the yearsand one-standard deviation envelope, respectively. FromNational Centers for Environmental Prediction/ClimatePrediction Center data.
Figure 2. 490 K MLS N2O and O3 maps in 2004–2005.White contours are PV near the outside and inside of theregion of strong gradients demarking the vortex edge.
Figure 3. EqL-time plots of 490 K MLS N2O and O3
during the 2004–2005 NH winter. Overlaid contours arescaled PV (sPV [Manney et al., 1994]), located inside thevortex edge and near the edge of the vortex ‘‘core’’, asdefined below for Figures 4 and 6.
L04802 MANNEY ET AL.: ARCTIC OZONE LOSS IN 2004–2005 FROM MLS L04802
2 of 5
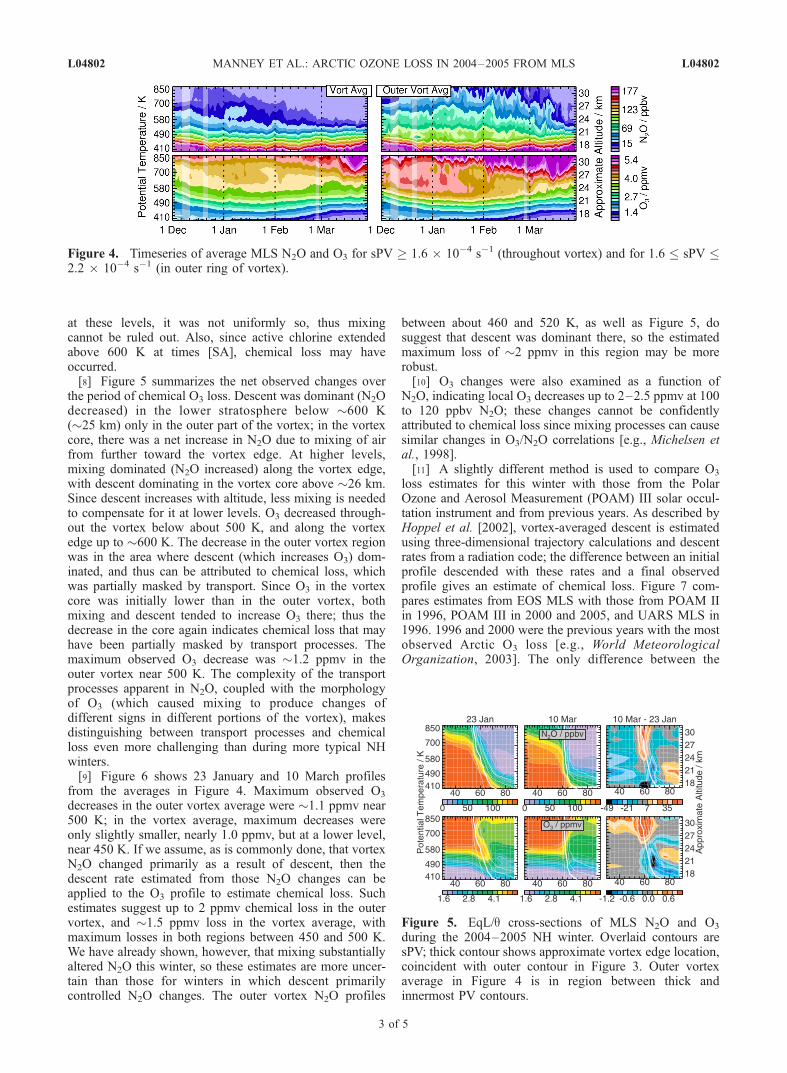
at these levels, it was not uniformly so, thus mixingcannot be ruled out. Also, since active chlorine extendedabove 600 K at times [SA], chemical loss may haveoccurred.[8] Figure 5 summarizes the net observed changes over
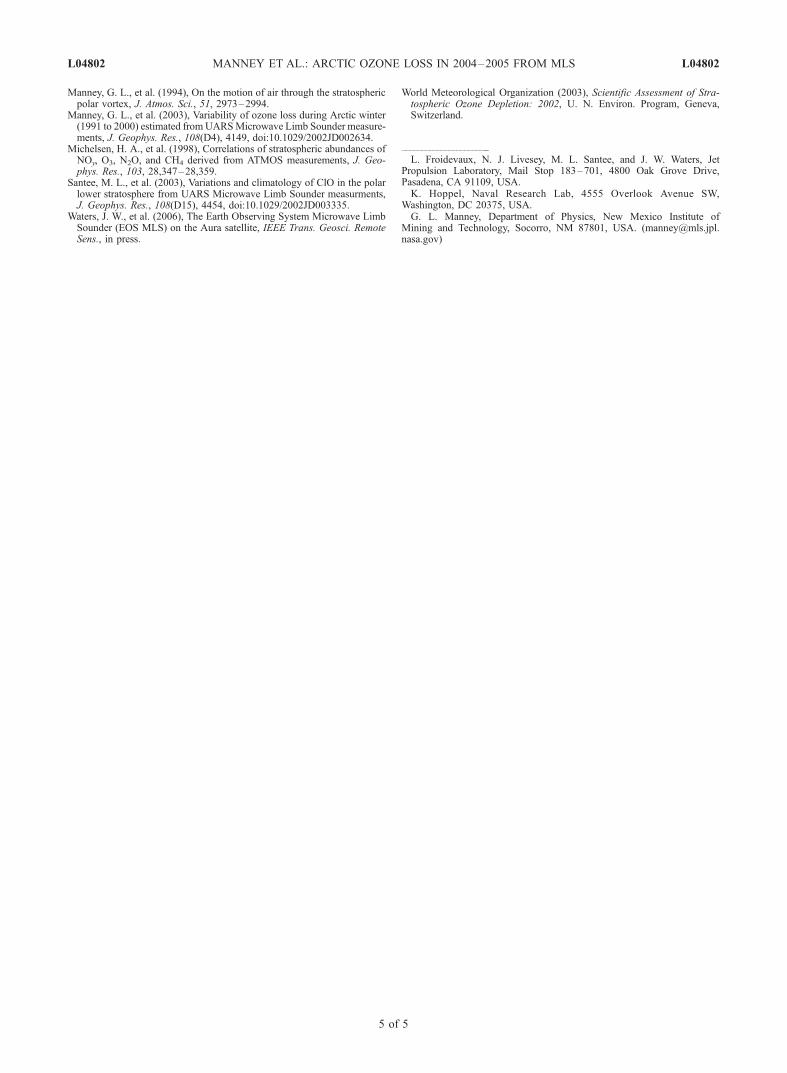
the period of chemical O3 loss. Descent was dominant (N2Odecreased) in the lower stratosphere below �600 K(�25 km) only in the outer part of the vortex; in the vortexcore, there was a net increase in N2O due to mixing of airfrom further toward the vortex edge. At higher levels,mixing dominated (N2O increased) along the vortex edge,with descent dominating in the vortex core above �26 km.Since descent increases with altitude, less mixing is neededto compensate for it at lower levels. O3 decreased through-out the vortex below about 500 K, and along the vortexedge up to �600 K. The decrease in the outer vortex regionwas in the area where descent (which increases O3) dom-inated, and thus can be attributed to chemical loss, whichwas partially masked by transport. Since O3 in the vortexcore was initially lower than in the outer vortex, bothmixing and descent tended to increase O3 there; thus thedecrease in the core again indicates chemical loss that mayhave been partially masked by transport processes. Themaximum observed O3 decrease was �1.2 ppmv in theouter vortex near 500 K. The complexity of the transportprocesses apparent in N2O, coupled with the morphologyof O3 (which caused mixing to produce changes ofdifferent signs in different portions of the vortex), makesdistinguishing between transport processes and chemicalloss even more challenging than during more typical NHwinters.[9] Figure 6 shows 23 January and 10 March profiles
from the averages in Figure 4. Maximum observed O3
decreases in the outer vortex average were �1.1 ppmv near500 K; in the vortex average, maximum decreases wereonly slightly smaller, nearly 1.0 ppmv, but at a lower level,near 450 K. If we assume, as is commonly done, that vortexN2O changed primarily as a result of descent, then thedescent rate estimated from those N2O changes can beapplied to the O3 profile to estimate chemical loss. Suchestimates suggest up to 2 ppmv chemical loss in the outervortex, and �1.5 ppmv loss in the vortex average, withmaximum losses in both regions between 450 and 500 K.We have already shown, however, that mixing substantiallyaltered N2O this winter, so these estimates are more uncer-tain than those for winters in which descent primarilycontrolled N2O changes. The outer vortex N2O profiles
between about 460 and 520 K, as well as Figure 5, dosuggest that descent was dominant there, so the estimatedmaximum loss of �2 ppmv in this region may be morerobust.[10] O3 changes were also examined as a function of
N2O, indicating local O3 decreases up to 2–2.5 ppmv at 100to 120 ppbv N2O; these changes cannot be confidentlyattributed to chemical loss since mixing processes can causesimilar changes in O3/N2O correlations [e.g., Michelsen etal., 1998].[11] A slightly different method is used to compare O3
loss estimates for this winter with those from the PolarOzone and Aerosol Measurement (POAM) III solar occul-tation instrument and from previous years. As described byHoppel et al. [2002], vortex-averaged descent is estimatedusing three-dimensional trajectory calculations and descentrates from a radiation code; the difference between an initialprofile descended with these rates and a final observedprofile gives an estimate of chemical loss. Figure 7 com-pares estimates from EOS MLS with those from POAM IIin 1996, POAM III in 2000 and 2005, and UARS MLS in1996. 1996 and 2000 were the previous years with the mostobserved Arctic O3 loss [e.g., World MeteorologicalOrganization, 2003]. The only difference between the
Figure 4. Timeseries of average MLS N2O and O3 for sPV � 1.6 � 10�4 s�1 (throughout vortex) and for 1.6 � sPV �2.2 � 10�4 s�1 (in outer ring of vortex).
Figure 5. EqL/q cross-sections of MLS N2O and O3
during the 2004–2005 NH winter. Overlaid contours aresPV; thick contour shows approximate vortex edge location,coincident with outer contour in Figure 3. Outer vortexaverage in Figure 4 is in region between thick andinnermost PV contours.
L04802 MANNEY ET AL.: ARCTIC OZONE LOSS IN 2004–2005 FROM MLS L04802
3 of 5

POAM and MLS calculations is the initial and final profilesused. Since POAM observes only a narrow latitude bandeach day, the representativeness of such a ‘‘vortex-average’’profile depends on the meteorological conditions and O3
morphology. In 2005, POAM and MLS results agree wellonly below �470 K, possibly suggesting that POAMsampling was less representative of the vortex at higheraltitudes this winter. The close agreement in 1996 suggeststhat POAM sampling was representative of the wholevortex then, when the vortex was less variable and O3
within it more uniform [Manney et al., 2003]; estimates for1996 may be less sensitive to sampling than those for 2005.[12] The 2005 estimates suggest maximum vortex-aver-
aged chemical O3 loss near 450 K of 1.2–1.3 ppmv. This isslightly less than the estimates from MLS N2O and O3
above, suggesting that the calculations using trajectories andthe radiation code may underestimate descent. The maxi-mum loss from UARS MLS in 1996 from this method isalso slightly less than the �1.4 ppmv found by Manney etal. [2003] for the same period, but within the uncertainties;these estimates agree well with those from vortex averagesof ozonesonde data for 1996 and 2000 (�1.2 and 1.5 ppmv,respectively, by early March), and find slightly lower lossthan the estimate from Match for 2000 (about 2.0 ppmv by10 March) [World Meteorological Organization, 2003]. Themaximum chemical loss estimated here for 2005 is compa-rable to that in 1996, but largest loss in 2005 was at loweraltitudes; considerably more loss (up to �1.6 ppmv near460 K) was seen in 2000. In addition, in both 1996 and2000, O3 loss continued after 10 March [e.g., WorldMeteorological Organization, 2003], whereas in 2005 thisrepresents the complete period of O3 loss. Thus, despitelower temperatures, the combination of conditions in 2005(vortex structure and evolution, and early cessation ofprocessing) resulted in less chemical O3 loss than in thecoldest previous NH winters.
3. Summary
[13] EOS MLS observations of O3 and N2O during theunusually cold 2004–2005 winter provide a detailed viewof transport and chemical O3 loss throughout the winter.Although the winter was the coldest on record, mixingprocesses were more important in determining trace gastransport in the vortex than during previous cold Arcticwinters. MLS N2O observations show mixing eventsthroughout the winter; descent was the dominant transportprocess only until late January. Prior to the onset ofchemical loss, O3 was higher near the lower stratospheric
vortex edge than in the vortex core; as a result, mixingprocesses either masked or mimicked chemical loss,depending on the part of the vortex in which they occurred.[14] Polar processing ceased by 10 March because of an
early final warming. Rough estimates of chemical loss usingN2O observations and vortex-averaged descent rates toestimate changes due to transport suggest maximum vor-tex-averaged O3 loss of 1.2–1.5 ppmv between 450 and500 K. In the outer vortex where observed decreases werelargest and where descent dominated N2O changesthroughout the winter, MLS data suggest localizedchemical loss up to �2 ppmv. Estimates using a vortex-averaged descent method for POAM and MLS data implythat O3 loss in 2004–2005 was comparable to that in 1996(but with the maximum loss at lower altitude) and lessthan that in 2000, the two previous years with most ArcticO3 loss. Thus, initial expectations (and reports in thepopular press) of unprecedented O3 loss during this coldestwinter did not, in fact, materialize because of dynamicalfactors, including enhanced mixing and an early finalwarming. Because of the complexity of the transportprocesses and the O3 morphology, a more precisedetermination of chemical loss during the 2004–2005Arctic winter will require extensive modeling and dataanalysis efforts.
[15] Acknowledgments. Thanks to NASA’s Global Modeling andAssimilation Office and Steven Pawson for GEOS-4 data and advice onits use; we thank Hope Michelsen and an anonymous reviewer for helpfulcomments. Work at the Jet Propulsion Laboratory, California Institute ofTechnology, was done under contract with the National Aeronautics andSpace Administration.
ReferencesBloom, S. C., et al. (2005), The Goddard Earth Observing Data Assimila-tion System, GEOS DAS Version 4.0.3: Documentation and validation,NASA Tech. Rep. 104606 V26.
Dufour, G., et al. (2006), Partitioning between the inorganic chlorine re-servoirs HCl and ClONO2 during the Arctic winter 2005 derived fromACE-FTS measurement, Atmos. Chem. Phys. Disc., in press.
Froidevaux, L., et al. (2006), Early validation analyses of atmosphericprofiles from EOS MLS on the Aura satellite, IEEE Trans. Geosci. Re-mote Sens., in press.
Hoppel, K. W., et al. (2002), POAM III observations of Arctic ozone lossfor the 1999/2000 winter, J. Geophys. Res., 107(D20), 8262,doi:10.1029/2001JD000476.
Labitzke, K. et al. (2002), The Berlin Stratospheric Data Series [CD-ROM], Meteorol. Inst., Free Univ. Berlin, Berlin, Germany.
Figure 7. Chemical O3 loss from 5 January through10 March estimated using ‘‘vortex-averaged descent’’ (seetext) from POAM (thin lines with dots) for 1996, 2000, and2005, and from UARS MLS for 1996 (for 25 December1995 through 3 March 1996) and EOS MLS for 2005 (thicklines with squares).
Figure 6. Average MLS N2O and O3 profiles in regionsgiven in Figure 4 on 23 January 2005 (red) and 10 March2005 (black) for vortex (solid) and outer vortex (dot-dashed,offset by +50 ppbv/+1 ppmv for N2O/O3).
L04802 MANNEY ET AL.: ARCTIC OZONE LOSS IN 2004–2005 FROM MLS L04802
4 of 5
Manney, G. L., et al. (1994), On the motion of air through the stratosphericpolar vortex, J. Atmos. Sci., 51, 2973–2994.
Manney, G. L., et al. (2003), Variability of ozone loss during Arctic winter(1991 to 2000) estimated from UARSMicrowave Limb Sounder measure-ments, J. Geophys. Res., 108(D4), 4149, doi:10.1029/2002JD002634.
Michelsen, H. A., et al. (1998), Correlations of stratospheric abundances ofNOy, O3, N2O, and CH4 derived from ATMOS measurements, J. Geo-phys. Res., 103, 28,347–28,359.
Santee, M. L., et al. (2003), Variations and climatology of ClO in the polarlower stratosphere from UARS Microwave Limb Sounder measurments,J. Geophys. Res., 108(D15), 4454, doi:10.1029/2002JD003335.
Waters, J. W., et al. (2006), The Earth Observing System Microwave LimbSounder (EOS MLS) on the Aura satellite, IEEE Trans. Geosci. RemoteSens., in press.
World Meteorological Organization (2003), Scientific Assessment of Stra-tospheric Ozone Depletion: 2002, U. N. Environ. Program, Geneva,Switzerland.
�����������������������L. Froidevaux, N. J. Livesey, M. L. Santee, and J. W. Waters, Jet
Propulsion Laboratory, Mail Stop 183–701, 4800 Oak Grove Drive,Pasadena, CA 91109, USA.K. Hoppel, Naval Research Lab, 4555 Overlook Avenue SW,
Washington, DC 20375, USA.G. L. Manney, Department of Physics, New Mexico Institute of
Mining and Technology, Socorro, NM 87801, USA. ([email protected])
L04802 MANNEY ET AL.: ARCTIC OZONE LOSS IN 2004–2005 FROM MLS L04802
5 of 5