eog resources, inc. p.o. box 4362 houston, tx 77210 · pdf filefor the period march 1 through...
TRANSCRIPT

News Release For Further Information Contact: Investors
Cedric W. Burgher (713) 571-4658 David J. Streit (713) 571-4902 Media and Investors Kimberly M. Ehmer (713) 571-4676
EOG Resources Announces Third Quarter 2016 Results; Raises 2020 Outlook and More Than Doubles Permian Basin Net Resource Potential
• Increases 2020 Crude Oil Production CAGR Outlook to 15 to 25 Percent • Expands Delaware Basin Net Resource Potential from 2.35 to 6.0 BnBoe (includes Assets
from Recent Yates Transaction) • Exceeds U.S. Production Targets • Raises 2016 U.S. Crude Oil Production Guidance • Updates Year-to-Date Proceeds from Asset Sales to $625 Million
FOR IMMEDIATE RELEASE: Thursday, November 3, 2016 HOUSTON – EOG Resources, Inc. (EOG) today reported a third quarter 2016 net loss of
$190.0 million, or $0.35 per share. This compares to a third quarter 2015 net loss of $4.1 billion, or
$7.47 per share.
Adjusted non-GAAP net loss for the third quarter 2016 was $220.8 million, or $0.40 per
share, compared to adjusted non-GAAP net income of $13.5 million, or $0.02 per share, for the
same prior year period. Adjusted non-GAAP net income (loss) is calculated by matching hedge
realizations to settlement months and making certain other adjustments in order to exclude non-
recurring and certain other items. For a reconciliation of non-GAAP measures to GAAP measures,
please refer to the attached tables.
Lower crude oil and natural gas prices more than offset significant well productivity
improvements and lease and well cost reductions, resulting in decreases in adjusted non-GAAP net
EOG Resources, Inc. P.O. Box 4362 Houston, TX 77210-4362
income, discretionary cash flow and EBITDAX during the third quarter 2016 compared to the third
quarter 2015. For a reconciliation of non-GAAP measures to GAAP measures, please refer to the
attached tables.
Operational Highlights
U.S. crude oil volumes of 275,700 barrels of oil per day (Bopd) in the third quarter 2016
exceeded the midpoint of the company’s guidance by 3 percent. Compared to the same prior year
period, lease and well expenses decreased 18 percent on a per-unit basis.
In the third quarter 2016, total crude oil production increased 1 percent while exploration and
development expenditures (excluding property acquisitions) decreased 32 percent, compared to the
same period last year. Natural gas liquids production increased 5 percent, while total natural gas
production for the third quarter 2016 decreased 10 percent versus the same prior year period.
“Even in a low commodity price environment, 2016 is proving to be a breakout year for EOG
with record well productivity, sustainable cost reductions and organic growth in all our core plays,
coupled with a historic transaction that adds substantial high-return growth potential,” said William
R. “Bill” Thomas, Chairman and Chief Executive Officer. “EOG’s third quarter accomplishments
reflect the hard work and ingenuity of our great employees and our unique culture.”
2020 Crude Oil Production Outlook and 2016 Capital Plan Update
As a result of continued improvements in capital efficiency which have been augmented by
the Yates transaction, EOG is increasing its crude oil organic production growth outlook through
2020. The long term outlook includes growth from key areas such as the Eagle Ford, Delaware
Basin, Rockies and the Bakken. In addition to the growth illustrated in the outlook, the company
continues to evaluate high-quality emerging plays through its ongoing exploration efforts.
Assuming balanced spending including dividend payments and a flat $50 West Texas
Intermediate crude oil (WTI) price, EOG now expects 15 percent compound annual crude oil
production growth through 2020. If the assumed WTI price is increased to $60, EOG would expect
25 percent compound annual crude oil production growth through 2020. This reflects an increase
from the company’s prior outlook of 10 to 20 percent growth at $50 to $60 WTI.
“EOG’s future has never been brighter, and we are already in a position to make a material
improvement to the long-term outlook we provided last quarter,” Thomas said. “The company-wide
premium drilling strategy and the recently closed Yates transaction are significantly boosting capital
efficiency and enabling us to extend our lead in unconventional resource productivity.”
For 2016, EOG is increasing its capital spending guidance range by $200 million to $2.6 to
$2.8 billion, excluding acquisitions. The spending increase will be directed toward well
completions, which are now targeted to increase from the initial plan of 270 and the prior revised
forecast of 350 to 450 net wells in 2016. Drilling productivity continues to improve, and the
company now expects to drill 290 net wells, 40 more than its prior forecast and 90 more than its
original 2016 plans.
Delaware Basin
EOG increased its Delaware Basin net resource potential by 155 percent to 6.0 billion barrels
of oil equivalent (BnBoe) in the third quarter 2016 (inclusive of the recent Yates transaction).
Delaware Basin net well locations increased by 27 percent to 6,330. The average planned lateral
length for these locations increased from 4,500 feet to over 7,000 feet.
“With the Yates transaction, EOG’s Delaware Basin position now exceeds 400,000 net acres
in the core window of this world-class play,” Thomas said. “Our technical and operational advances
applied to the combined assets have produced a major increase in EOG’s Delaware Basin potential.
As we continue to make advances in cost management and technology, we believe our resource
potential over time will continue to increase in both size and quality.”
In the Delaware Basin Wolfcamp, EOG increased its net resource potential from 1.3 BnBoe
to 2.9 BnBoe and net well locations from 2,130 to 2,660. For the Delaware Basin Wolfcamp oil
play, EOG’s average gross reserves per well increased to 1,330 thousand barrels of crude oil
equivalent (MBoe) from 750 MBoe, while average gross reserves per well increased to 1,550 MBoe
from 900 MBoe in the combo portion of the play.
For the Delaware Basin Second Bone Spring, EOG increased its net resource potential from
0.5 BnBoe to 1.4 BnBoe and net well locations from 1,250 to 1,870. Average gross reserves per
well increased to 950 MBoe from 500 MBoe.
EOG also increased its Delaware Basin Leonard net resource potential from 0.6 BnBoe to 1.7
BnBoe and net well locations from 1,600 to 1,800. Average gross reserves per well increased to
1,175 MBoe from 500 MBoe.
In the third quarter 2016, EOG completed 22 wells in the Delaware Basin Wolfcamp with an
average treated lateral length of 4,800 feet per well and an average 30-day initial production rate per
well of 2,350 barrels of oil equivalent per day (Boed), or 1,675 Bopd, 275 barrels per day (Bpd) of
natural gas liquids (NGLs) and 2.4 million cubic feet per day (MMcfd) of natural gas. In the
Delaware Basin Second Bone Spring, EOG completed four wells in the third quarter with an average

treated lateral length of 4,600 feet per well and an average 30-day initial production rate per well of
1,240 Boed, or 940 Bopd, 120 Bpd of NGLs and 1.1 MMcfd of natural gas.
South Texas Eagle Ford
EOG’s oil-rich South Texas Eagle Ford acreage continued to deliver exceptional results in
the third quarter 2016 and was once again the largest contributor to EOG’s U.S. crude oil
production.
In the third quarter, EOG completed 47 wells in the Eagle Ford with an average treated
lateral length of 5,700 feet per well and an average 30-day initial production rate per well of 1,825
Boed, or 1,425 Bopd, 190 Bpd of NGLs and 1.3 MMcfd of natural gas.
Rockies and the Bakken
In the third quarter, EOG completed nine wells in the Powder River Basin with an average
30-day initial production rate per well of 1,560 Boed, or 840 Bopd, 245 Bpd of NGLs and 2.8
MMcfd of natural gas.
In the DJ Basin Codell in Wyoming, EOG completed five wells in the third quarter with an
average 30-day initial production rate per well of 720 Boed, or 610 Bopd, 70 Bpd of NGLs and 0.3
MMcfd of natural gas.
In the North Dakota Bakken, EOG completed 13 wells in the third quarter with an average
30-day initial production rate per well of 850 Boed, or 763 Bopd, 45 Bpd of NGLs and 0.3 MMcfd
of natural gas.
Hedging Activity
For the period November 1 through December 31, 2016, EOG has crude oil financial price
collar contracts in place for 70,000 Bopd at an average ceiling price of $54.25 per barrel and an
average floor price of $45.00 per barrel.
For the period March 1 through November 30, 2017, EOG has natural gas financial price
swap contracts in place for 30,000 million British thermal units (MMBtu) per day at a weighted
average price of $3.10 per MMBtu.
For the period March 1 through November 30, 2017, EOG sold natural gas call option
contracts for 213,750 MMBtu per day at an average strike price of $3.44 per MMBtu. For the period
March 1 through November 30, 2018, EOG sold natural gas call option contracts for 120,000
MMBtu per day at an average strike price of $3.38 per MMBtu.
For the period March 1 through November 30, 2017, EOG purchased natural gas put option
contracts for 171,000 MMBtu per day at an average strike price of $2.92 per MMBtu. For the period
March 1 through November 30, 2018, EOG purchased natural gas put option contracts for 96,000
MMBtu per day at an average strike price of $2.94 per MMBtu.
A comprehensive summary of crude oil and natural gas derivative contracts is provided in the
attached tables.
Capital Structure and Asset Sales
At September 30, 2016, EOG’s total debt outstanding was $7.0 billion with a debt-to-total
capitalization ratio of 37 percent. Taking into account cash on the balance sheet of $1.1 billion at the
end of the third quarter, EOG’s net debt was $5.9 billion with a net debt-to-total capitalization ratio
of 33 percent. For a reconciliation of non-GAAP measures to GAAP measures, please refer to the
attached tables.
Proceeds from asset sales this year to date total $625 million. This includes proceeds from a
transaction that has already closed in the fourth quarter 2016. Associated production of the divested
assets was 80 MMcfd of natural gas, 3,400 Bopd and 4,290 Bpd of NGLs.
Conference Call November 4, 2016
EOG’s third quarter 2016 results conference call will be available via live audio webcast at 9
a.m. Central time (10 a.m. Eastern time) on Friday, November 4, 2016. To listen, log on to the
Investors Overview page on the EOG website at http://investors.eogresources.com/overview.
EOG Resources, Inc. is one of the largest independent (non-integrated) crude oil and natural
gas companies in the United States with proved reserves in the United States, Trinidad, the United
Kingdom and China. EOG Resources, Inc. is listed on the New York Stock Exchange and is traded
under the ticker symbol "EOG." For additional information about EOG, please visit
www.eogresources.com.
This press release includes forward-looking statements within the meaning of Section 27A of the Securities Act of 1933, as amended, and Section 21E of the Securities Exchange Act of 1934, as amended. All statements, other than statements of historical facts, including, among others, statements and projections regarding EOG's future financial position, operations, performance, business strategy, returns, budgets, reserves, levels of production and costs, statements regarding future commodity prices and statements regarding the plans and objectives of EOG's management for future operations, are forward-looking statements. EOG typically uses words such as "expect," "anticipate," "estimate," "project," "strategy," "intend," "plan," "target," "goal," "may," "will," "should" and "believe" or the negative of those terms or other variations or comparable terminology to identify its forward-looking statements. In particular, statements, express or implied, concerning EOG's future operating results and returns or EOG's ability to replace or increase reserves, increase production, reduce or otherwise control operating and capital costs, generate income or cash flows or pay dividends are forward-looking statements. Forward-looking statements are not guarantees of performance. Although EOG believes the expectations reflected in its forward-looking statements are reasonable and are based on reasonable assumptions, no

assurance can be given that these assumptions are accurate or that any of these expectations will be achieved (in full or at all) or will prove to have been correct. Moreover, EOG's forward-looking statements may be affected by known, unknown or currently unforeseen risks, events or circumstances that may be outside EOG's control. Important factors that could cause EOG's actual results to differ materially from the expectations reflected in EOG's forward-looking statements include, among others:
• the timing, extent and duration of changes in prices for, supplies of, and demand for, crude oil and condensate, natural gas liquids, natural gas and related commodities;
• the extent to which EOG is successful in its efforts to acquire or discover additional reserves; • the extent to which EOG is successful in its efforts to economically develop its acreage in, produce reserves
and achieve anticipated production levels from, and maximize reserve recovery from, its existing and future crude oil and natural gas exploration and development projects;
• the extent to which EOG is successful in its efforts to market its crude oil and condensate, natural gas liquids, natural gas and related commodity production;
• the availability, proximity and capacity of, and costs associated with, appropriate gathering, processing, compression, transportation and refining facilities;
• the availability, cost, terms and timing of issuance or execution of, and competition for, mineral licenses and leases and governmental and other permits and rights-of-way, and EOG’s ability to retain mineral licenses and leases;
• the impact of, and changes in, government policies, laws and regulations, including tax laws and regulations;
environmental, health and safety laws and regulations relating to air emissions, disposal of produced water, drilling fluids and other wastes, hydraulic fracturing and access to and use of water; laws and regulations
imposing conditions or restrictions on drilling and completion operations and on the transportation of crude oil and natural gas; laws and regulations with respect to derivatives and hedging activities; and laws and
regulations with respect to the import and export of crude oil, natural gas and related commodities; • EOG's ability to effectively integrate acquired crude oil and natural gas properties into its operations, fully
identify existing and potential problems with respect to such properties and accurately estimate reserves, production and costs with respect to such properties;
• the extent to which EOG's third-party-operated crude oil and natural gas properties are operated successfully and economically;
• competition in the oil and gas exploration and production industry for the acquisition of licenses, leases and properties, employees and other personnel, facilities, equipment, materials and services;
• the availability and cost of employees and other personnel, facilities, equipment, materials (such as water) and services;
• the accuracy of reserve estimates, which by their nature involve the exercise of professional judgment and may therefore be imprecise;
• weather, including its impact on crude oil and natural gas demand, and weather-related delays in drilling and in the installation and operation (by EOG or third parties) of production, gathering, processing, refining, compression and transportation facilities;
• the ability of EOG's customers and other contractual counterparties to satisfy their obligations to EOG and, related thereto, to access the credit and capital markets to obtain financing needed to satisfy their obligations to EOG;
• EOG's ability to access the commercial paper market and other credit and capital markets to obtain financing on terms it deems acceptable, if at all, and to otherwise satisfy its capital expenditure requirements;
• the extent and effect of any hedging activities engaged in by EOG; • the timing and extent of changes in foreign currency exchange rates, interest rates, inflation rates, global and
domestic financial market conditions and global and domestic general economic conditions; • political conditions and developments around the world (such as political instability and armed conflict),
including in the areas in which EOG operates; • the use of competing energy sources and the development of alternative energy sources;

• the extent to which EOG incurs uninsured losses and liabilities or losses and liabilities in excess of its insurance coverage;
• acts of war and terrorism and responses to these acts; • physical, electronic and cyber security breaches; and • the other factors described under ITEM 1A, Risk Factors, on pages 13 through 21 of EOG’s Annual Report
on Form 10-K for the fiscal year ended December 31, 2015, and any updates to those factors set forth in EOG's subsequent Quarterly Reports on Form 10-Q or Current Reports on Form 8-K.
In light of these risks, uncertainties and assumptions, the events anticipated by EOG's forward-looking statements may not occur, and, if any of such events do, we may not have anticipated the timing of their occurrence or the duration and extent of their impact on our actual results. Accordingly, you should not place any undue reliance on any of EOG's forward-looking statements. EOG's forward-looking statements speak only as of the date made, and EOG undertakes no obligation, other than as required by applicable law, to update or revise its forward-looking statements, whether as a result of new information, subsequent events, anticipated or unanticipated circumstances or otherwise. The United States Securities and Exchange Commission (SEC) permits oil and gas companies, in their filings with the SEC, to disclose not only “proved” reserves (i.e., quantities of oil and gas that are estimated to be recoverable with a high degree of confidence), but also “probable” reserves (i.e., quantities of oil and gas that are as likely as not to be recovered) as well as “possible” reserves (i.e., additional quantities of oil and gas that might be recovered, but with a lower probability than probable reserves). Statements of reserves are only estimates and may not correspond to the ultimate quantities of oil and gas recovered. Any reserve estimates provided in this press release that are not specifically designated as being estimates of proved reserves may include "potential" reserves and/or other estimated reserves not necessarily calculated in accordance with, or contemplated by, the SEC’s latest reserve reporting guidelines. Investors are urged to consider closely the disclosure in EOG’s Annual Report on Form 10-K for the fiscal year ended December 31, 2015, available from EOG at P.O. Box 4362, Houston, Texas 77210-4362 (Attn: Investor Relations). You can also obtain this report from the SEC by calling 1-800-SEC-0330 or from the SEC's website at www.sec.gov. In addition, reconciliation and calculation schedules for non-GAAP financial measures can be found on the EOG website at www.eogresources.com.
###
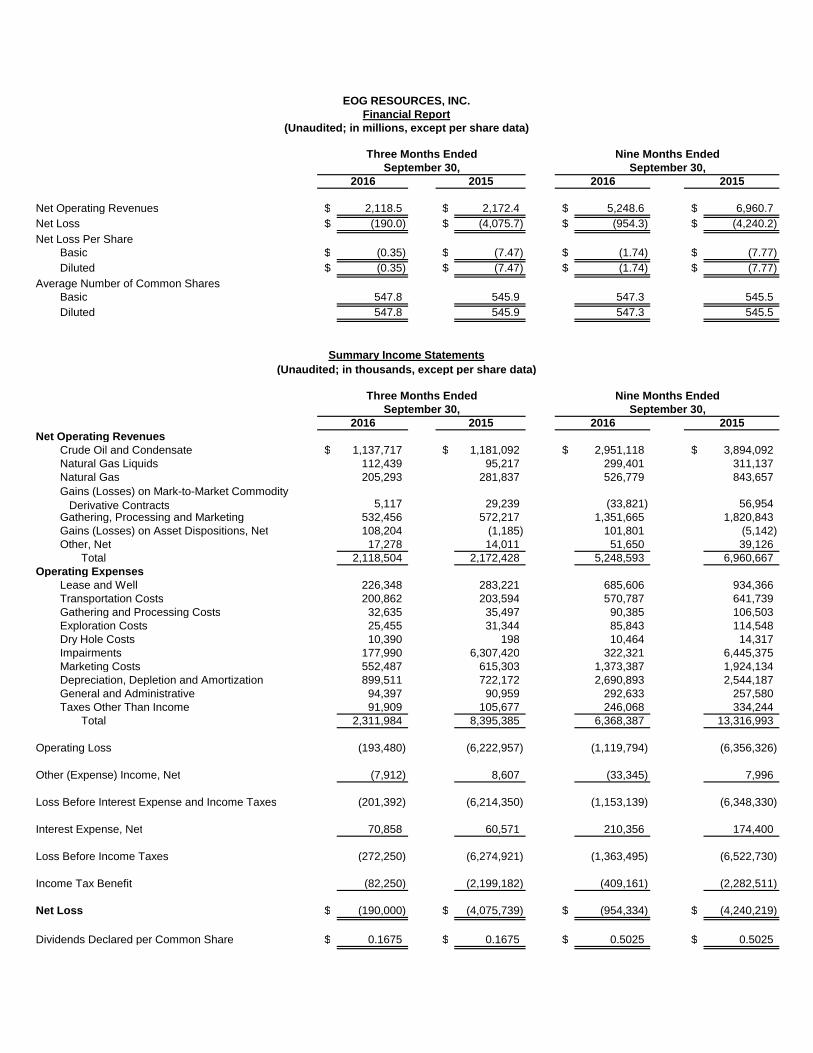
Net Operating Revenues $ 2,118.5 $ 2,172.4 $ 5,248.6 $ 6,960.7 Net Loss $ (190.0) $ (4,075.7) $ (954.3) $ (4,240.2) Net Loss Per Share Basic $ (0.35) $ (7.47) $ (1.74) $ (7.77) Diluted $ (0.35) $ (7.47) $ (1.74) $ (7.77) Average Number of Common Shares Basic 547.8 545.9 547.3 545.5 Diluted 547.8 545.9 547.3 545.5
Net Operating Revenues Crude Oil and Condensate $ 1,137,717 $ 1,181,092 $ 2,951,118 $ 3,894,092 Natural Gas Liquids 112,439 95,217 299,401 311,137 Natural Gas 205,293 281,837 526,779 843,657 Gains (Losses) on Mark-to-Market Commodity Derivative Contracts 5,117 29,239 (33,821) 56,954 Gathering, Processing and Marketing 532,456 572,217 1,351,665 1,820,843 Gains (Losses) on Asset Dispositions, Net 108,204 (1,185) 101,801 (5,142) Other, Net 17,278 14,011 51,650 39,126 Total 2,118,504 2,172,428 5,248,593 6,960,667 Operating Expenses Lease and Well 226,348 283,221 685,606 934,366 Transportation Costs 200,862 203,594 570,787 641,739 Gathering and Processing Costs 32,635 35,497 90,385 106,503 Exploration Costs 25,455 31,344 85,843 114,548 Dry Hole Costs 10,390 198 10,464 14,317 Impairments 177,990 6,307,420 322,321 6,445,375 Marketing Costs 552,487 615,303 1,373,387 1,924,134 Depreciation, Depletion and Amortization 899,511 722,172 2,690,893 2,544,187 General and Administrative 94,397 90,959 292,633 257,580 Taxes Other Than Income 91,909 105,677 246,068 334,244 Total 2,311,984 8,395,385 6,368,387 13,316,993
Operating Loss (193,480) (6,222,957) (1,119,794) (6,356,326)
Other (Expense) Income, Net (7,912) 8,607 (33,345) 7,996
Loss Before Interest Expense and Income Taxes (201,392) (6,214,350) (1,153,139) (6,348,330)
Interest Expense, Net 70,858 60,571 210,356 174,400
Loss Before Income Taxes (272,250) (6,274,921) (1,363,495) (6,522,730)
Income Tax Benefit (82,250) (2,199,182) (409,161) (2,282,511)
Net Loss $ (190,000) $ (4,075,739) $ (954,334) $ (4,240,219)
Dividends Declared per Common Share $ 0.1675 $ 0.1675 $ 0.5025 $ 0.5025
Three Months Ended Nine Months EndedSeptember 30, September 30,
2016 2015 2016 2015
(Unaudited; in thousands, except per share data)
EOG RESOURCES, INC.Financial Report
(Unaudited; in millions, except per share data)
Three Months Ended Nine Months EndedSeptember 30, September 30,
2016 2015 2016 2015
Summary Income Statements
Three Months Ended Nine Months EndedSeptember 30, September 30,
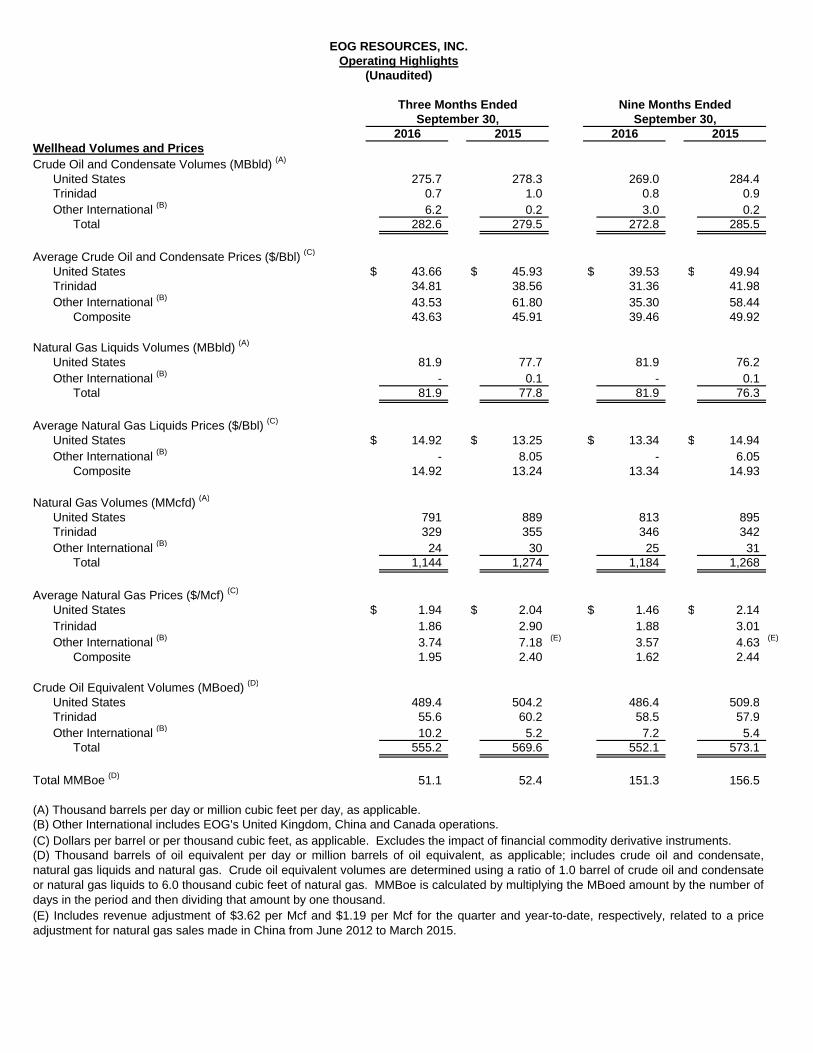
2016 2015 2016 2015Wellhead Volumes and PricesCrude Oil and Condensate Volumes (MBbld) (A)
United States 275.7 278.3 269.0 284.4 Trinidad 0.7 1.0 0.8 0.9 Other International (B) 6.2 0.2 3.0 0.2 Total 282.6 279.5 272.8 285.5
Average Crude Oil and Condensate Prices ($/Bbl) (C)
United States $ 43.66 $ 45.93 $ 39.53 $ 49.94 Trinidad 34.81 38.56 31.36 41.98 Other International (B) 43.53 61.80 35.30 58.44 Composite 43.63 45.91 39.46 49.92
Natural Gas Liquids Volumes (MBbld) (A)
United States 81.9 77.7 81.9 76.2 Other International (B) - 0.1 - 0.1 Total 81.9 77.8 81.9 76.3
Average Natural Gas Liquids Prices ($/Bbl) (C)
United States $ 14.92 $ 13.25 $ 13.34 $ 14.94 Other International (B) - 8.05 - 6.05 Composite 14.92 13.24 13.34 14.93
Natural Gas Volumes (MMcfd) (A)
United States 791 889 813 895 Trinidad 329 355 346 342 Other International (B) 24 30 25 31 Total 1,144 1,274 1,184 1,268
Average Natural Gas Prices ($/Mcf) (C)
United States $ 1.94 $ 2.04 $ 1.46 $ 2.14 Trinidad 1.86 2.90 1.88 3.01 Other International (B) 3.74 7.18 (E) 3.57 4.63 (E)
Composite 1.95 2.40 1.62 2.44
Crude Oil Equivalent Volumes (MBoed) (D)
United States 489.4 504.2 486.4 509.8 Trinidad 55.6 60.2 58.5 57.9 Other International (B) 10.2 5.2 7.2 5.4 Total 555.2 569.6 552.1 573.1
Total MMBoe (D) 51.1 52.4 151.3 156.5
(A) Thousand barrels per day or million cubic feet per day, as applicable.(B) Other International includes EOG's United Kingdom, China and Canada operations.(C) Dollars per barrel or per thousand cubic feet, as applicable. Excludes the impact of financial commodity derivative instruments.(D) Thousand barrels of oil equivalent per day or million barrels of oil equivalent, as applicable; includes crude oil and condensate,natural gas liquids and natural gas. Crude oil equivalent volumes are determined using a ratio of 1.0 barrel of crude oil and condensateor natural gas liquids to 6.0 thousand cubic feet of natural gas. MMBoe is calculated by multiplying the MBoed amount by the number ofdays in the period and then dividing that amount by one thousand.(E) Includes revenue adjustment of $3.62 per Mcf and $1.19 per Mcf for the quarter and year-to-date, respectively, related to a priceadjustment for natural gas sales made in China from June 2012 to March 2015.
EOG RESOURCES, INC.Operating Highlights
(Unaudited)

Current Assets Cash and Cash Equivalents $ 1,048,727 $ 718,506 Accounts Receivable, Net 920,189 930,610 Inventories 429,667 598,935 Assets from Price Risk Management Activities 2,185 - Income Taxes Receivable 178 40,704 Deferred Income Taxes 137,098 147,812 Other 199,720 155,677 Total 2,737,764 2,592,244
Property, Plant and Equipment Oil and Gas Properties (Successful Efforts Method) 50,465,979 50,613,241 Other Property, Plant and Equipment 4,013,602 3,986,610 Total Property, Plant and Equipment 54,479,581 54,599,851 Less: Accumulated Depreciation, Depletion and Amortization (31,835,196) (30,389,130) Total Property, Plant and Equipment, Net 22,644,385 24,210,721 Other Assets 172,772 167,505 Total Assets $ 25,554,921 $ 26,970,470
Current Liabilities Accounts Payable $ 1,296,240 $ 1,471,953 Accrued Taxes Payable 143,257 93,618 Dividends Payable 91,842 91,546 Current Portion of Long-Term Debt 6,579 6,579 Other 195,045 155,591 Total 1,732,963 1,819,287
Long-Term Debt 6,979,538 6,648,911 Other Liabilities 975,763 971,335 Deferred Income Taxes 4,068,345 4,587,902 Commitments and Contingencies
Stockholders' Equity Common Stock, $0.01 Par, 640,000,000 Shares Authorized and 551,425,785 Shares Issued at September 30, 2016 and 550,150,823 Shares Issued at December 31, 2015 205,514 205,502 Additional Paid in Capital 2,992,887 2,923,461 Accumulated Other Comprehensive Loss (25,100) (33,338) Retained Earnings 8,641,704 9,870,816 Common Stock Held in Treasury, 197,181 Shares at September 30, 2016 and 292,179 Shares at December 31, 2015 (16,693) (23,406) Total Stockholders' Equity 11,798,312 12,943,035 Total Liabilities and Stockholders’ Equity $ 25,554,921 $ 26,970,470
ASSETS
LIABILITIES AND STOCKHOLDERS' EQUITY
EOG RESOURCES, INC.Summary Balance Sheets
(Unaudited; in thousands, except share data)
September 30, December 31,2016 2015
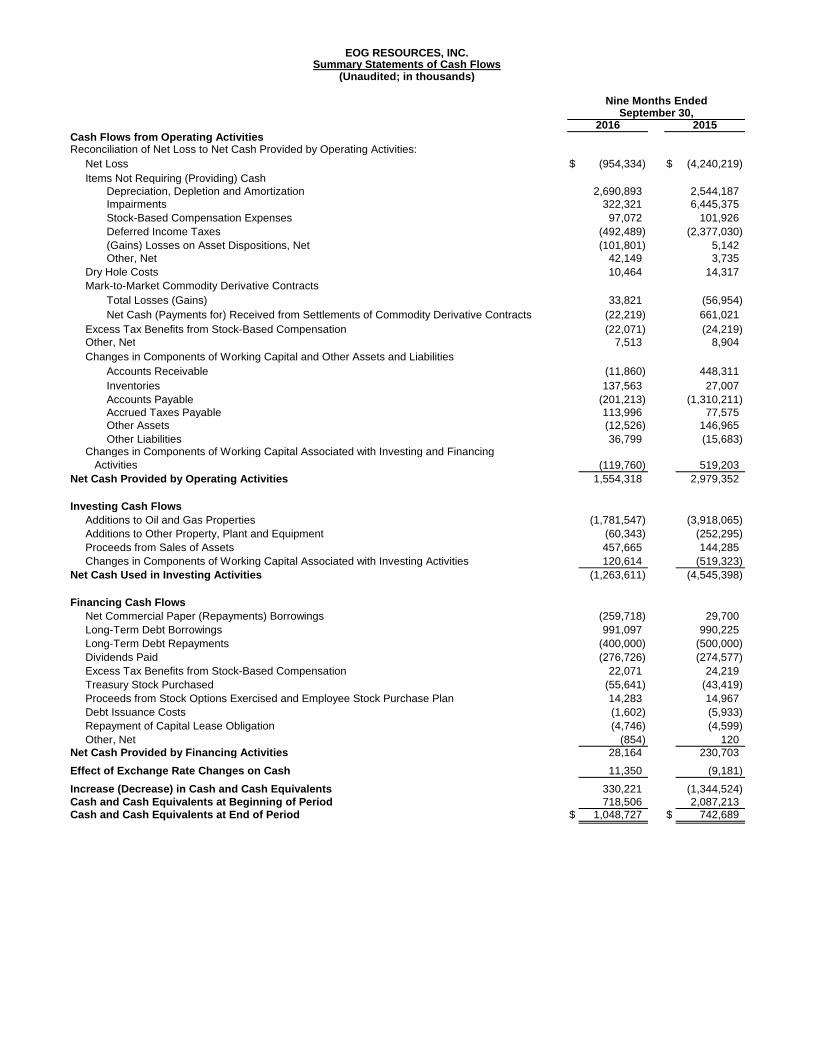
Cash Flows from Operating ActivitiesReconciliation of Net Loss to Net Cash Provided by Operating Activities: Net Loss $ (954,334) $ (4,240,219) Items Not Requiring (Providing) Cash Depreciation, Depletion and Amortization 2,690,893 2,544,187 Impairments 322,321 6,445,375 Stock-Based Compensation Expenses 97,072 101,926 Deferred Income Taxes (492,489) (2,377,030) (Gains) Losses on Asset Dispositions, Net (101,801) 5,142 Other, Net 42,149 3,735 Dry Hole Costs 10,464 14,317 Mark-to-Market Commodity Derivative Contracts Total Losses (Gains) 33,821 (56,954) Net Cash (Payments for) Received from Settlements of Commodity Derivative Contracts (22,219) 661,021 Excess Tax Benefits from Stock-Based Compensation (22,071) (24,219) Other, Net 7,513 8,904 Changes in Components of Working Capital and Other Assets and Liabilities Accounts Receivable (11,860) 448,311 Inventories 137,563 27,007 Accounts Payable (201,213) (1,310,211) Accrued Taxes Payable 113,996 77,575 Other Assets (12,526) 146,965 Other Liabilities 36,799 (15,683) Changes in Components of Working Capital Associated with Investing and Financing Activities (119,760) 519,203 Net Cash Provided by Operating Activities 1,554,318 2,979,352
Investing Cash Flows Additions to Oil and Gas Properties (1,781,547) (3,918,065) Additions to Other Property, Plant and Equipment (60,343) (252,295) Proceeds from Sales of Assets 457,665 144,285 Changes in Components of Working Capital Associated with Investing Activities 120,614 (519,323) Net Cash Used in Investing Activities (1,263,611) (4,545,398)
Financing Cash Flows Net Commercial Paper (Repayments) Borrowings (259,718) 29,700 Long-Term Debt Borrowings 991,097 990,225 Long-Term Debt Repayments (400,000) (500,000) Dividends Paid (276,726) (274,577) Excess Tax Benefits from Stock-Based Compensation 22,071 24,219 Treasury Stock Purchased (55,641) (43,419) Proceeds from Stock Options Exercised and Employee Stock Purchase Plan 14,283 14,967 Debt Issuance Costs (1,602) (5,933) Repayment of Capital Lease Obligation (4,746) (4,599) Other, Net (854) 120 Net Cash Provided by Financing Activities 28,164 230,703
Effect of Exchange Rate Changes on Cash 11,350 (9,181)
Increase (Decrease) in Cash and Cash Equivalents 330,221 (1,344,524) Cash and Cash Equivalents at Beginning of Period 718,506 2,087,213 Cash and Cash Equivalents at End of Period $ 1,048,727 $ 742,689
2016 2015
EOG RESOURCES, INC.Summary Statements of Cash Flows
(Unaudited; in thousands)
Nine Months EndedSeptember 30,
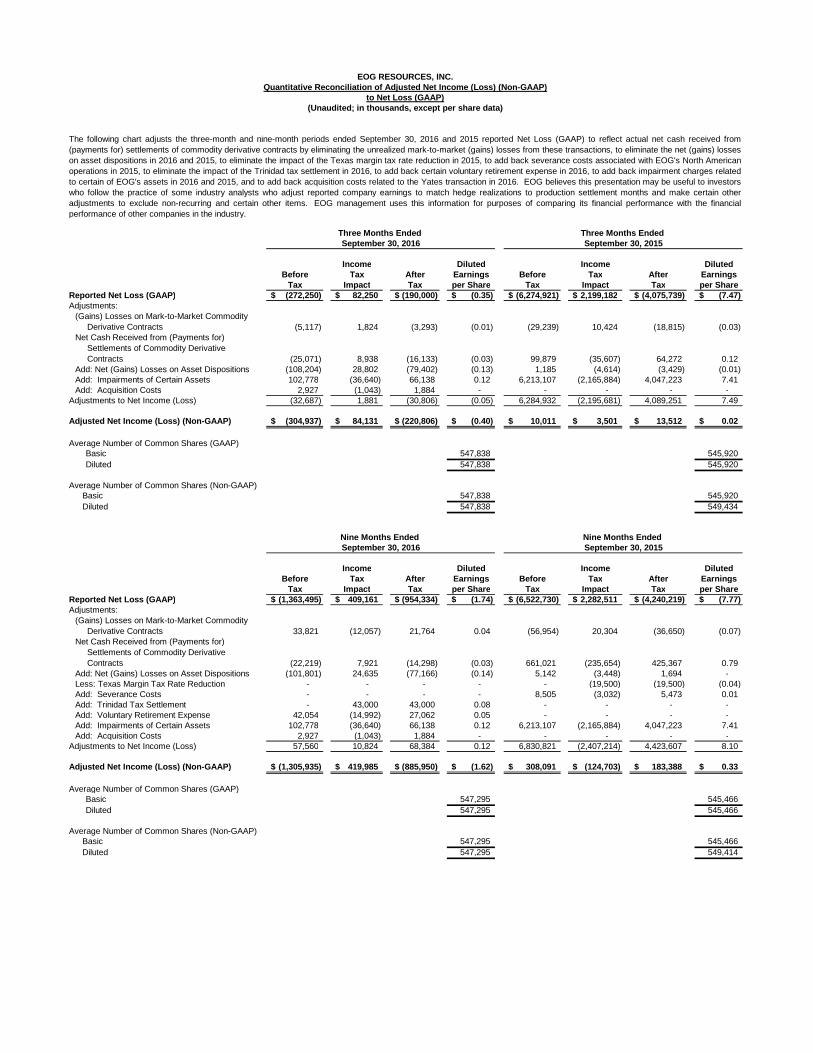
Income Diluted Income DilutedBefore Tax After Earnings Before Tax After Earnings
Tax Impact Tax per Share Tax Impact Tax per ShareReported Net Loss (GAAP) (272,250)$ 82,250$ (190,000)$ (0.35)$ (6,274,921)$ 2,199,182$ (4,075,739)$ (7.47)$ Adjustments:
(Gains) Losses on Mark-to-Market Commodity Derivative Contracts (5,117) 1,824 (3,293) (0.01) (29,239) 10,424 (18,815) (0.03) Net Cash Received from (Payments for) Settlements of Commodity Derivative Contracts (25,071) 8,938 (16,133) (0.03) 99,879 (35,607) 64,272 0.12 Add: Net (Gains) Losses on Asset Dispositions (108,204) 28,802 (79,402) (0.13) 1,185 (4,614) (3,429) (0.01) Add: Impairments of Certain Assets 102,778 (36,640) 66,138 0.12 6,213,107 (2,165,884) 4,047,223 7.41 Add: Acquisition Costs 2,927 (1,043) 1,884 - - - - -
Adjustments to Net Income (Loss) (32,687) 1,881 (30,806) (0.05) 6,284,932 (2,195,681) 4,089,251 7.49
Adjusted Net Income (Loss) (Non-GAAP) (304,937)$ 84,131$ (220,806)$ (0.40)$ 10,011$ 3,501$ 13,512$ 0.02$
Average Number of Common Shares (GAAP) Basic 547,838 545,920 Diluted 547,838 545,920
Average Number of Common Shares (Non-GAAP) Basic 547,838 545,920 Diluted 547,838 549,434
Income Diluted Income DilutedBefore Tax After Earnings Before Tax After Earnings
Tax Impact Tax per Share Tax Impact Tax per ShareReported Net Loss (GAAP) (1,363,495)$ 409,161$ (954,334)$ (1.74)$ (6,522,730)$ 2,282,511$ (4,240,219)$ (7.77)$ Adjustments:
(Gains) Losses on Mark-to-Market Commodity Derivative Contracts 33,821 (12,057) 21,764 0.04 (56,954) 20,304 (36,650) (0.07) Net Cash Received from (Payments for) Settlements of Commodity Derivative Contracts (22,219) 7,921 (14,298) (0.03) 661,021 (235,654) 425,367 0.79 Add: Net (Gains) Losses on Asset Dispositions (101,801) 24,635 (77,166) (0.14) 5,142 (3,448) 1,694 - Less: Texas Margin Tax Rate Reduction - - - - - (19,500) (19,500) (0.04) Add: Severance Costs - - - - 8,505 (3,032) 5,473 0.01 Add: Trinidad Tax Settlement - 43,000 43,000 0.08 - - - - Add: Voluntary Retirement Expense 42,054 (14,992) 27,062 0.05 - - - - Add: Impairments of Certain Assets 102,778 (36,640) 66,138 0.12 6,213,107 (2,165,884) 4,047,223 7.41 Add: Acquisition Costs 2,927 (1,043) 1,884 - - - - -
Adjustments to Net Income (Loss) 57,560 10,824 68,384 0.12 6,830,821 (2,407,214) 4,423,607 8.10
Adjusted Net Income (Loss) (Non-GAAP) (1,305,935)$ 419,985$ (885,950)$ (1.62)$ 308,091$ (124,703)$ 183,388$ 0.33$
Average Number of Common Shares (GAAP) Basic 547,295 545,466 Diluted 547,295 545,466
Average Number of Common Shares (Non-GAAP) Basic 547,295 545,466 Diluted 547,295 549,414
Three Months Ended Three Months Ended
EOG RESOURCES, INC.Quantitative Reconciliation of Adjusted Net Income (Loss) (Non-GAAP)
to Net Loss (GAAP)(Unaudited; in thousands, except per share data)
The following chart adjusts the three-month and nine-month periods ended September 30, 2016 and 2015 reported Net Loss (GAAP) to reflect actual net cash received from(payments for) settlements of commodity derivative contracts by eliminating the unrealized mark-to-market (gains) losses from these transactions, to eliminate the net (gains) losseson asset dispositions in 2016 and 2015, to eliminate the impact of the Texas margin tax rate reduction in 2015, to add back severance costs associated with EOG's North Americanoperations in 2015, to eliminate the impact of the Trinidad tax settlement in 2016, to add back certain voluntary retirement expense in 2016, to add back impairment charges relatedto certain of EOG's assets in 2016 and 2015, and to add back acquisition costs related to the Yates transaction in 2016. EOG believes this presentation may be useful to investorswho follow the practice of some industry analysts who adjust reported company earnings to match hedge realizations to production settlement months and make certain otheradjustments to exclude non-recurring and certain other items. EOG management uses this information for purposes of comparing its financial performance with the financialperformance of other companies in the industry.
Nine Months Ended Nine Months Ended September 30, 2016 September 30, 2015
September 30, 2016 September 30, 2015

$ 759,581 $ 1,131,432 $ 1,554,318 $ 2,979,352
Adjustments:Exploration Costs (excluding Stock-Based Compensation Expenses) 21,384 25,286 70,268 95,253 Excess Tax Benefits from Stock-Based Compensation 10,260 7,826 22,071 24,219 Changes in Components of Working Capital and Other Assets
and LiabilitiesAccounts Receivable (10,712) (150,128) 11,860 (448,311) Inventories (41,750) 10,602 (137,563) (27,007) Accounts Payable (2,145) 310,567 201,213 1,310,211 Accrued Taxes Payable (20,676) (13,451) (113,996) (77,575) Other Assets (21,063) (70,851) 12,526 (146,965) Other Liabilities (35,234) (33,165) (36,799) 15,683
Changes in Components of Working Capital Associated with Investing and Financing Activities 65,307 (349,401) 119,760 (519,203)
Discretionary Cash Flow (Non-GAAP) $ 724,952 $ 868,717 $ 1,703,658 $ 3,205,657
Discretionary Cash Flow (Non-GAAP) - Percentage Decrease -17% -47%
Net Cash Provided by Operating Activities (GAAP)
Three Months Ended Nine Months EndedSeptember 30, September 30,
2016 2015 2016 2015
The following chart reconciles the three-month and nine-month periods ended September 30, 2016 and 2015 Net Cash Provided by Operating Activities(GAAP) to Discretionary Cash Flow (Non-GAAP). EOG believes this presentation may be useful to investors who follow the practice of some industry analystswho adjust Net Cash Provided by Operating Activities for Exploration Costs (excluding Stock-Based Compensation Expenses), Excess Tax Benefits fromStock-Based Compensation, Changes in Components of Working Capital and Other Assets and Liabilities, and Changes in Components of Working CapitalAssociated with Investing and Financing Activities. EOG management uses this information for comparative purposes within the industry.
EOG RESOURCES, INC.Quantitative Reconciliation of Discretionary Cash F low (Non-GAAP)
to Net Cash Provided By Operating Activities (GAAP)(Unaudited; in thousands)

September 30, September 30,
Net Loss (GAAP) $ (190,000) $ (4,075,739) $ (954,334) $ (4,240,219)
Adjustments: Interest Expense, Net 70,858 60,571 210,356 174,400 Income Tax Benefit (82,250) (2,199,182) (409,161) (2,282,511) Depreciation, Depletion and Amortization 899,511 722,172 2,690,893 2,544,187 Exploration Costs 25,455 31,344 85,843 114,548 Dry Hole Costs 10,390 198 10,464 14,317 Impairments 177,990 6,307,420 322,321 6,445,375 EBITDAX (Non-GAAP) 911,954 846,784 1,956,382 2,770,097 Total (Gains) Losses on MTM Commodity Derivative Contracts (5,117) (29,239) 33,821 (56,954) Net Cash Received from (Payments for) Settlements of Commodity Derivative Contracts (25,071) 99,879 (22,219) 661,021 (Gains) Losses on Asset Dispositions, Net (108,204) 1,185 (101,801) 5,142
Adjusted EBITDAX (Non-GAAP) $ 773,562 $ 918,609 $ 1,866,183 $ 3,379,306
Adjusted EBITDAX (Non-GAAP) - Percentage Decrease -16% -45%
(Unaudited; in thousands)
EOG RESOURCES, INC.Quantitative Reconciliation of Adjusted Earnings Be fore Interest Expense,
Income Taxes, Depreciation, Depletion and Amortizat ion, Exploration Costs, Dry Hole Costs, Impairments and Additional Items (A djusted EBITDAX)
(Non-GAAP) to Net Loss (GAAP)
The following chart adjusts the three-month and nine-month periods ended September 30, 2016 and 2015 reported Net Loss (GAAP) to EarningsBefore Interest Expense, Income Taxes, Depreciation, Depletion and Amortization, Exploration Costs, Dry Hole Costs and Impairments (EBITDAX)(Non-GAAP) and further adjusts such amount to reflect actual net cash received from (payments for) settlements of commodity derivative contracts byeliminating the unrealized mark-to-market (MTM) (gains) losses from these transactions and to eliminate the net (gains) losses on asset dispositions.EOG believes this presentation may be useful to investors who follow the practice of some industry analysts who adjust reported Net Income (Loss)(GAAP) to add back Interest Expense, Income Taxes (Income Tax Benefit), Depreciation, Depletion and Amortization, Exploration Costs, Dry HoleCosts and Impairments and further adjust such amount to match realizations to production settlement months and make certain other adjustments toexclude non-recurring and certain other items. EOG management uses this information for purposes of comparing its financial performance with thefinancial performance of other companies in the industry.
Three Months Ended Nine Months Ended
2016 2015 2016 2015

Total Stockholders' Equity - (a) $ 11,798 $ 12,943
Current and Long-Term Debt (GAAP) - (b) 6,986 6,655 Less: Cash (1,049) (719) Net Debt (Non-GAAP) - (c) 5,937 5,936
Total Capitalization (GAAP) - (a) + (b) $ 18,784 $ 19,598
Total Capitalization (Non-GAAP) - (a) + (c) $ 17,735 $ 18,879
Debt-to-Total Capitalization (GAAP) - (b) / [(a) + (b)] 37% 34%
Net Debt-to-Total Capitalization (Non-GAAP) - (c) / [(a) + (c)] 33% 31%
2016 2015
EOG RESOURCES, INC.Quantitative Reconciliation of Net Debt (Non-GAAP) and Total
Capitalization (Non-GAAP) as Used in the Calculatio n ofthe Net Debt-to-Total Capitalization Ratio (Non-GAA P) to
Current and Long-Term Debt (GAAP) and Total Capital ization (GAAP)(Unaudited; in millions, except ratio data)
The following chart reconciles Current and Long-Term Debt (GAAP) to Net Debt (Non-GAAP) and TotalCapitalization (GAAP) to Total Capitalization (Non-GAAP), as used in the Net Debt-to-Total Capitalization ratiocalculation. A portion of the cash is associated with international subsidiaries; tax considerations may impact debtpaydown. EOG believes this presentation may be useful to investors who follow the practice of some industryanalysts who utilize Net Debt and Total Capitalization (Non-GAAP) in their Net Debt-to-Total Capitalization ratiocalculation. EOG management uses this information for comparative purposes within the industry.
At AtSeptember 30, December 31,
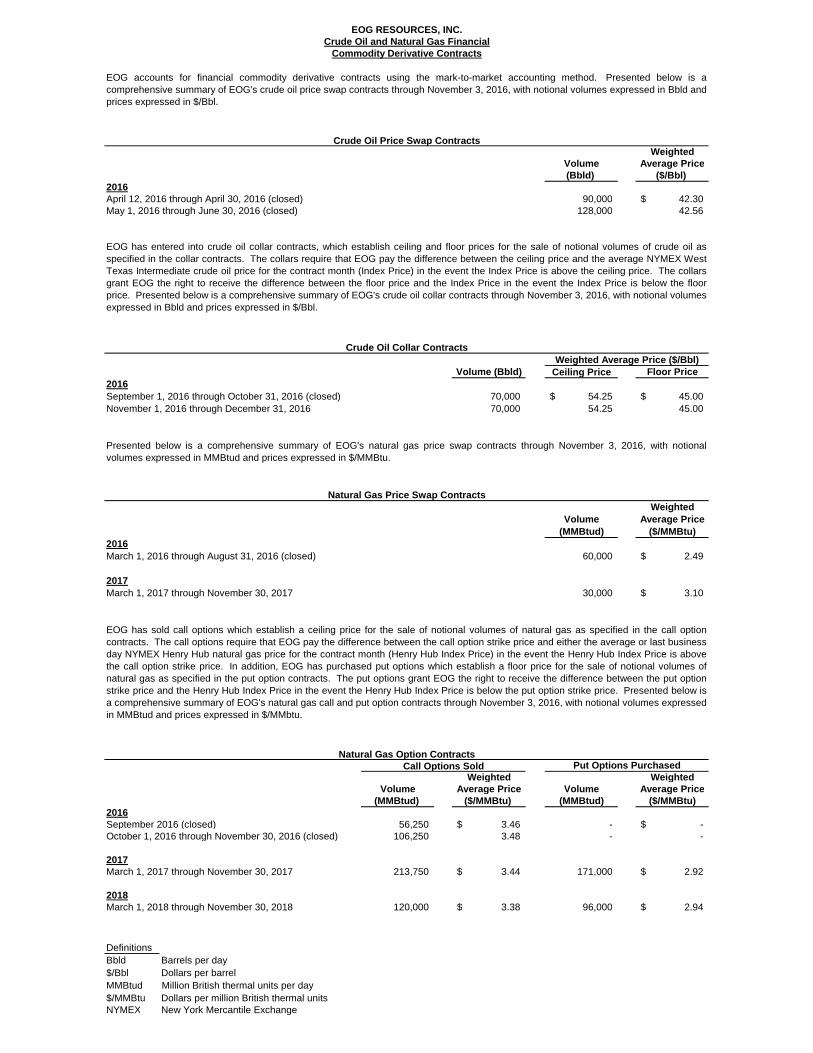
WeightedVolume Average Price(Bbld) ($/Bbl)
2016April 12, 2016 through April 30, 2016 (closed) 90,000 42.30$ May 1, 2016 through June 30, 2016 (closed) 128,000 42.56
Volume (Bbld) Ceiling Price Floor Price2016September 1, 2016 through October 31, 2016 (closed) 70,000 54.25$ 45.00$ November 1, 2016 through December 31, 2016 70,000 54.25 45.00
WeightedVolume Average Price
(MMBtud) ($/MMBtu)2016March 1, 2016 through August 31, 2016 (closed) 60,000 2.49$
2017March 1, 2017 through November 30, 2017 30,000 3.10$
Weighted WeightedVolume Average Price Volume Average Price
(MMBtud) ($/MMBtu) (MMBtud) ($/MMBtu)2016September 2016 (closed) 56,250 3.46$ - -$ October 1, 2016 through November 30, 2016 (closed) 106,250 3.48 - -
2017March 1, 2017 through November 30, 2017 213,750 3.44$ 171,000 2.92$
2018March 1, 2018 through November 30, 2018 120,000 3.38$ 96,000 2.94$
DefinitionsBbld Barrels per day$/Bbl Dollars per barrelMMBtud Million British thermal units per day$/MMBtu Dollars per million British thermal unitsNYMEX New York Mercantile Exchange
EOG has sold call options which establish a ceiling price for the sale of notional volumes of natural gas as specified in the call optioncontracts. The call options require that EOG pay the difference between the call option strike price and either the average or last businessday NYMEX Henry Hub natural gas price for the contract month (Henry Hub Index Price) in the event the Henry Hub Index Price is abovethe call option strike price. In addition, EOG has purchased put options which establish a floor price for the sale of notional volumes ofnatural gas as specified in the put option contracts. The put options grant EOG the right to receive the difference between the put optionstrike price and the Henry Hub Index Price in the event the Henry Hub Index Price is below the put option strike price. Presented below isa comprehensive summary of EOG's natural gas call and put option contracts through November 3, 2016, with notional volumes expressedin MMBtud and prices expressed in $/MMbtu.
Natural Gas Option ContractsCall Options Sold Put Options Purchased
EOG has entered into crude oil collar contracts, which establish ceiling and floor prices for the sale of notional volumes of crude oil asspecified in the collar contracts. The collars require that EOG pay the difference between the ceiling price and the average NYMEX WestTexas Intermediate crude oil price for the contract month (Index Price) in the event the Index Price is above the ceiling price. The collarsgrant EOG the right to receive the difference between the floor price and the Index Price in the event the Index Price is below the floorprice. Presented below is a comprehensive summary of EOG's crude oil collar contracts through November 3, 2016, with notional volumesexpressed in Bbld and prices expressed in $/Bbl.
Crude Oil Collar ContractsWeighted Average Price ($/Bbl)
Presented below is a comprehensive summary of EOG's natural gas price swap contracts through November 3, 2016, with notionalvolumes expressed in MMBtud and prices expressed in $/MMBtu.
Natural Gas Price Swap Contracts
EOG RESOURCES, INC.Crude Oil and Natural Gas Financial
Commodity Derivative Contracts
EOG accounts for financial commodity derivative contracts using the mark-to-market accounting method. Presented below is acomprehensive summary of EOG's crude oil price swap contracts through November 3, 2016, with notional volumes expressed in Bbld andprices expressed in $/Bbl.
Crude Oil Price Swap Contracts
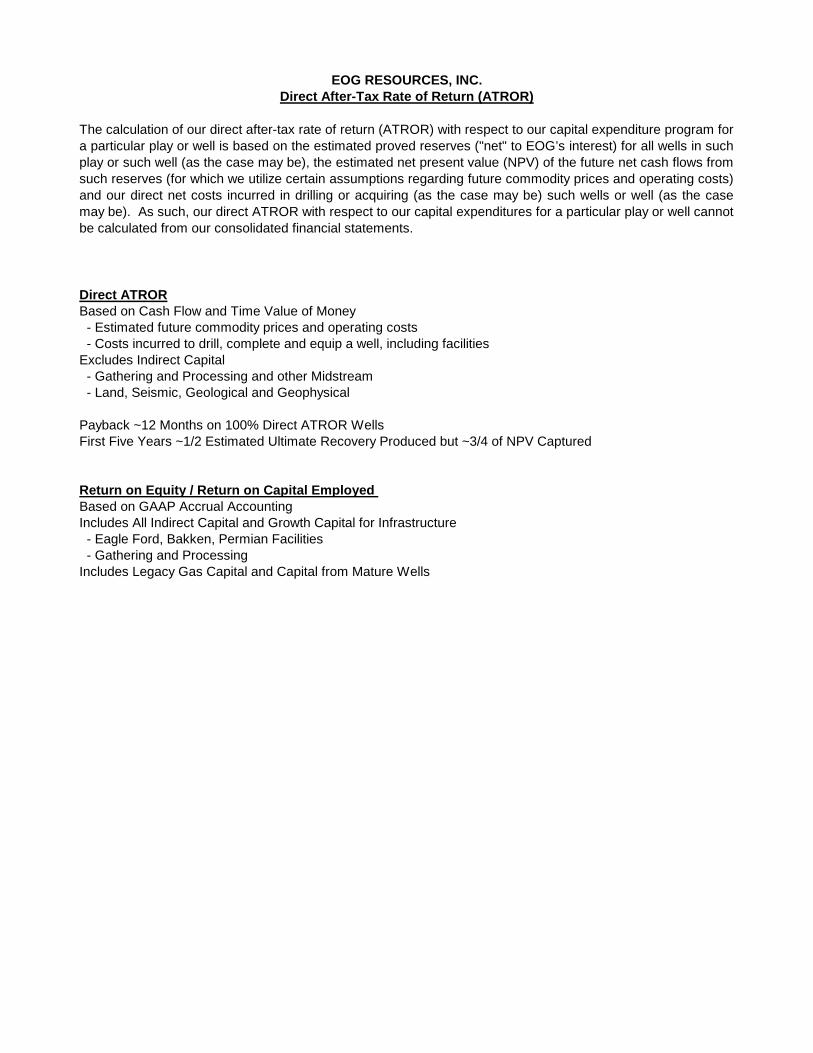
EOG RESOURCES, INC.Direct After-Tax Rate of Return (ATROR)
The calculation of our direct after-tax rate of return (ATROR) with respect to our capital expenditure program fora particular play or well is based on the estimated proved reserves ("net" to EOG’s interest) for all wells in suchplay or such well (as the case may be), the estimated net present value (NPV) of the future net cash flows fromsuch reserves (for which we utilize certain assumptions regarding future commodity prices and operating costs)and our direct net costs incurred in drilling or acquiring (as the case may be) such wells or well (as the casemay be). As such, our direct ATROR with respect to our capital expenditures for a particular play or well cannotbe calculated from our consolidated financial statements.
Direct ATRORBased on Cash Flow and Time Value of Money - Estimated future commodity prices and operating costs - Costs incurred to drill, complete and equip a well, including facilitiesExcludes Indirect Capital - Gathering and Processing and other Midstream - Land, Seismic, Geological and Geophysical
Payback ~12 Months on 100% Direct ATROR WellsFirst Five Years ~1/2 Estimated Ultimate Recovery Produced but ~3/4 of NPV Captured
Return on Equity / Return on Capital Employed Based on GAAP Accrual AccountingIncludes All Indirect Capital and Growth Capital for Infrastructure - Eagle Ford, Bakken, Permian Facilities - Gathering and ProcessingIncludes Legacy Gas Capital and Capital from Mature Wells

2015 2014 2013 2012Return on Capital Employed (ROCE) (Non-GAAP)
Net Interest Expense (GAAP) $ 237 $ 201 $ 235 Tax Benefit Imputed (based on 35%) (83) (70) (82) After-Tax Net Interest Expense (Non-GAAP) - (a) $ 154 $ 131 $ 153
Net Income (Loss) (GAAP) - (b) $ (4,525) $ 2,915 $ 2,197 Adjustments to Net Income (Loss), Net of Tax (See Accompanying Schedules) 4,559 (a) (199) (b) 49 (c)Adjusted Net Income (Non-GAAP) - (c) $ 34 $ 2,716 $ 2,246
Total Stockholders' Equity - (d) $ 12,943 $ 17,713 $ 15,418 $ 13,285
Average Total Stockholders' Equity * - (e) $ 15,328 $ 16,566 $ 14,352
Current and Long-Term Debt (GAAP) - (f) $ 6,660 $ 5,910 $ 5,913 $ 6,312 Less: Cash (719) (2,087) (1,318) (876) Net Debt (Non-GAAP) - (g) $ 5,941 $ 3,823 $ 4,595 $ 5,436
Total Capitalization (GAAP) - (d) + (f) $ 19,603 $ 23,623 $ 21,331 $ 19,597
Total Capitalization (Non-GAAP) - (d) + (g) $ 18,884 $ 21,536 $ 20,013 $ 18,721
Average Total Capitalization (Non-GAAP) * - (h) $ 20,210 $ 20,775 $ 19,367
ROCE (GAAP Net Income) - [(a) + (b)] / (h) -21.6% 14.7% 12.1%
ROCE (Non-GAAP Adjusted Net Income) - [(a) + (c)] / (h) 0.9% 13.7% 12.4%
Return on Equity (ROE) (Non-GAAP)
ROE (GAAP Net Income) - (b) / (e) -29.5% 17.6% 15.3%
ROE (Non-GAAP Adjusted Net Income) - (c) / (e) 0.2% 16.4% 15.6%
* Average for the current and immediately preceding year
The following chart reconciles Net Interest Expense (GAAP), Net Income (Loss) (GAAP), Current and Long-Term Debt (GAAP) and Total Capitalization(GAAP) to After-Tax Net Interest Expense (Non-GAAP), Adjusted Net Income (Non-GAAP), Net Debt (Non-GAAP) and Total Capitalization (Non-GAAP),respectively, as used in the Return on Capital Employed (ROCE) and Return on Equity (ROE) calculations. EOG believes this presentation may be usefulto investors who follow the practice of some industry analysts who utilize After-Tax Net Interest Expense, Adjusted Net Income, Net Debt and TotalCapitalization (Non-GAAP) in their ROCE and ROE calculations. EOG management uses this information for purposes of comparing its financialperformance with the financial performance of other companies in the industry.
EOG RESOURCES, INC.Quantitative Reconciliation of After-Tax Net Intere st Expense (Non-GAAP), Adjusted Net Income
(Non-GAAP), Net Debt (Non-GAAP) and Total Capitaliz ation (Non-GAAP) as used in the Calculations ofReturn on Capital Employed (Non-GAAP) and Return on Equity (Non-GAAP) to Net Interest Expense (GAAP),
Net Income (Loss) (GAAP), Current and Long-Term Deb t (GAAP) and Total Capitalization (GAAP), Respectiv ely(Unaudited; in millions, except ratio data)

Adjustments to Net Income (Loss) (GAAP)
(a) See below schedule for detail of adjustments to Net Income (Loss) (GAAP) in 2015:
Before Income Tax AfterTax Impact Tax
Adjustments: Add: Mark-to-Market Commodity Derivative Contracts Impact $ 668 $ (238) $ 430 Add: Impairments of Certain Assets 6,308 (2,183) 4,125 Less: Texas Margin Tax Rate Reduction - (20) (20) Add: Legal Settlement - Early Leasehold Termination 19 (6) 13 Add: Severance Costs 9 (3) 6 Add: Net Losses on Asset Dispositions 9 (4) 5 Total $ 7,013 $ (2,454) $ 4,559
(b) See below schedule for detail of adjustments to Net Income (Loss) (GAAP) in 2014:
Before Income Tax AfterTax Impact Tax
Adjustments: Less: Mark-to-Market Commodity Derivative Contracts Impact $ (800) $ 285 $ (515) Add: Impairments of Certain Assets 824 (271) 553 Less: Net Gains on Asset Dispositions (508) 21 (487) Add: Tax Expense Related to the Repatriation of Accumulated Foreign Earnings in Future Years - 250 250 Total $ (484) $ 285 $ (199)
(c) See below schedule for detail of adjustments to Net Income (Loss) (GAAP) in 2013:
Before Income Tax AfterTax Impact Tax
Adjustments: Add: Mark-to-Market Commodity Derivative Contracts Impact $ 283 $ (101) $ 182 Add: Impairments of Certain Assets 7 (3) 4 Less: Net Gains on Asset Dispositions (198) 61 (137) Total $ 92 $ (43) $ 49
Year Ended December 31, 2015
Year Ended December 31, 2014
Year Ended December 31, 2013
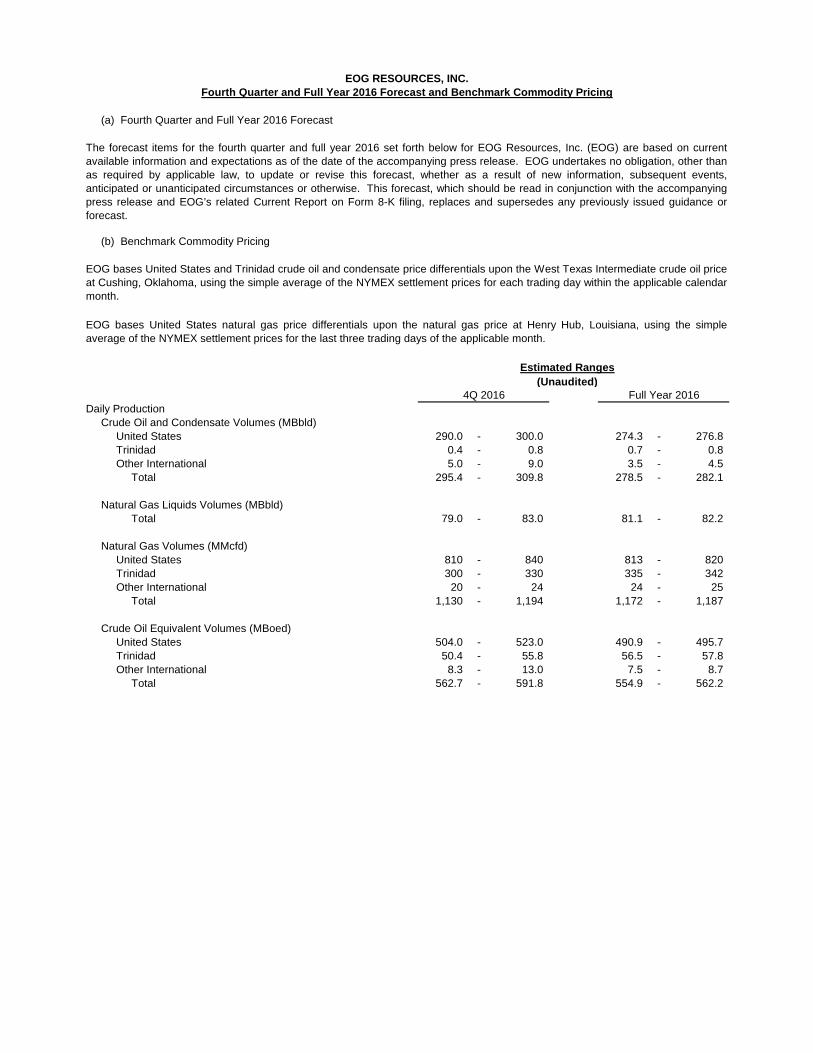
(a) Fourth Quarter and Full Year 2016 Forecast
(b) Benchmark Commodity Pricing
Estimated Ranges(Unaudited)
Daily Production Crude Oil and Condensate Volumes (MBbld) United States 290.0 - 300.0 274.3 - 276.8 Trinidad 0.4 - 0.8 0.7 - 0.8 Other International 5.0 - 9.0 3.5 - 4.5 Total 295.4 - 309.8 278.5 - 282.1
Natural Gas Liquids Volumes (MBbld) Total 79.0 - 83.0 81.1 - 82.2
Natural Gas Volumes (MMcfd) United States 810 - 840 813 - 820 Trinidad 300 - 330 335 - 342 Other International 20 - 24 24 - 25 Total 1,130 - 1,194 1,172 - 1,187
Crude Oil Equivalent Volumes (MBoed) United States 504.0 - 523.0 490.9 - 495.7 Trinidad 50.4 - 55.8 56.5 - 57.8 Other International 8.3 - 13.0 7.5 - 8.7 Total 562.7 - 591.8 554.9 - 562.2
EOG RESOURCES, INC.Fourth Quarter and Full Year 2016 Forecast and Bench mark Commodity Pricing
The forecast items for the fourth quarter and full year 2016 set forth below for EOG Resources, Inc. (EOG) are based on currentavailable information and expectations as of the date of the accompanying press release. EOG undertakes no obligation, other thanas required by applicable law, to update or revise this forecast, whether as a result of new information, subsequent events,anticipated or unanticipated circumstances or otherwise. This forecast, which should be read in conjunction with the accompanyingpress release and EOG’s related Current Report on Form 8-K filing, replaces and supersedes any previously issued guidance orforecast.
EOG bases United States and Trinidad crude oil and condensate price differentials upon the West Texas Intermediate crude oil priceat Cushing, Oklahoma, using the simple average of the NYMEX settlement prices for each trading day within the applicable calendarmonth.
EOG bases United States natural gas price differentials upon the natural gas price at Henry Hub, Louisiana, using the simpleaverage of the NYMEX settlement prices for the last three trading days of the applicable month.
4Q 2016 Full Year 2016
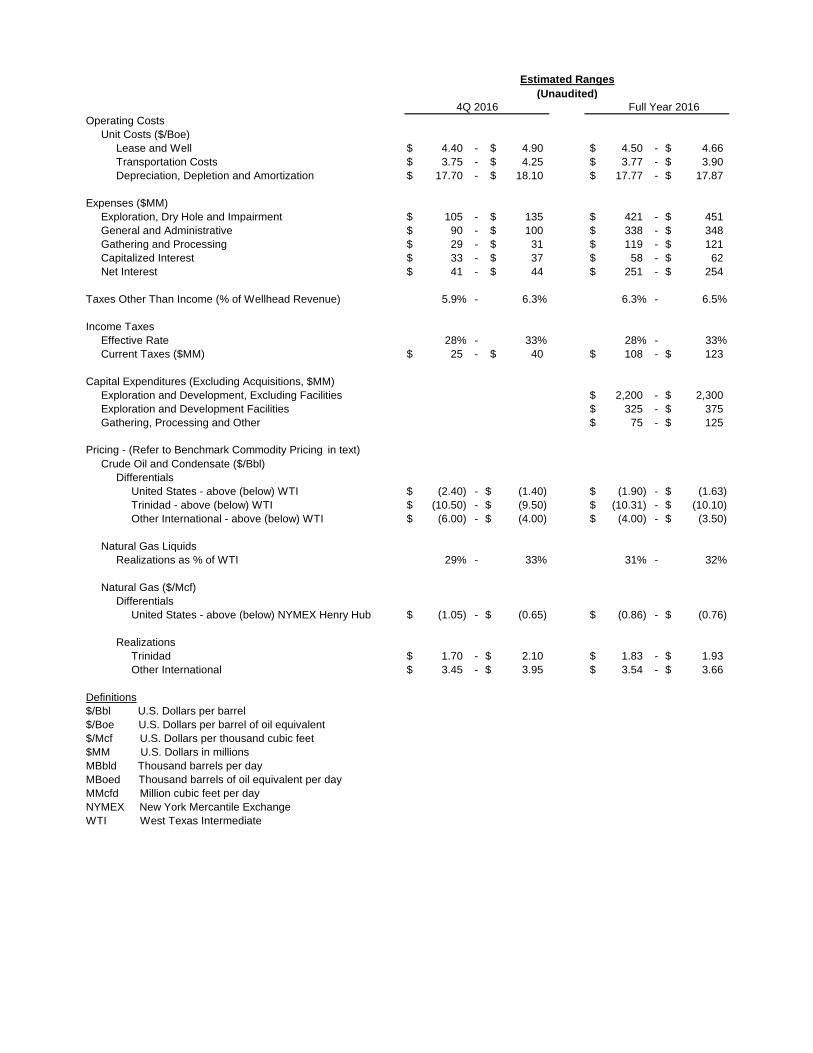
Estimated Ranges(Unaudited)
Operating Costs Unit Costs ($/Boe) Lease and Well $ 4.40 - $ 4.90 $ 4.50 - $ 4.66 Transportation Costs $ 3.75 - $ 4.25 $ 3.77 - $ 3.90 Depreciation, Depletion and Amortization $ 17.70 - $ 18.10 $ 17.77 - $ 17.87
Expenses ($MM) Exploration, Dry Hole and Impairment $ 105 - $ 135 $ 421 - $ 451 General and Administrative $ 90 - $ 100 $ 338 - $ 348 Gathering and Processing $ 29 - $ 31 $ 119 - $ 121 Capitalized Interest $ 33 - $ 37 $ 58 - $ 62 Net Interest $ 41 - $ 44 $ 251 - $ 254
Taxes Other Than Income (% of Wellhead Revenue) 5.9% - 6.3% 6.3% - 6.5%
Income Taxes Effective Rate 28% - 33% 28% - 33% Current Taxes ($MM) $ 25 - $ 40 $ 108 - $ 123
Capital Expenditures (Excluding Acquisitions, $MM) Exploration and Development, Excluding Facilities $ 2,200 - $ 2,300 Exploration and Development Facilities $ 325 - $ 375 Gathering, Processing and Other $ 75 - $ 125
Pricing - (Refer to Benchmark Commodity Pricing in text) Crude Oil and Condensate ($/Bbl) Differentials United States - above (below) WTI $ (2.40) - $ (1.40) $ (1.90) - $ (1.63) Trinidad - above (below) WTI $ (10.50) - $ (9.50) $ (10.31) - $ (10.10) Other International - above (below) WTI $ (6.00) - $ (4.00) $ (4.00) - $ (3.50)
Natural Gas Liquids Realizations as % of WTI 29% - 33% 31% - 32%
Natural Gas ($/Mcf) Differentials United States - above (below) NYMEX Henry Hub $ (1.05) - $ (0.65) $ (0.86) - $ (0.76)
Realizations Trinidad $ 1.70 - $ 2.10 $ 1.83 - $ 1.93 Other International $ 3.45 - $ 3.95 $ 3.54 - $ 3.66
Definitions$/Bbl U.S. Dollars per barrel$/Boe U.S. Dollars per barrel of oil equivalent$/Mcf U.S. Dollars per thousand cubic feet$MM U.S. Dollars in millionsMBbld Thousand barrels per dayMBoed Thousand barrels of oil equivalent per dayMMcfd Million cubic feet per dayNYMEX New York Mercantile ExchangeWTI West Texas Intermediate
4Q 2016 Full Year 2016