enzymes: principles of catalysis - web publishing · pdf filechapter 6 enzymes...
TRANSCRIPT
6| Enzymes

CHAPTER 6 Enzymes
– Physiological significance of enzymes
– Origin of catalytic power of enzymes
– Chemical mechanisms of catalysis
– Mechanisms of chymotrypsin and lysozyme
– Description of enzyme kinetics and inhibition
topics about enzyme function:
What are enzymes?
• Enzymes are catalysts
• Increase reaction rates without being used up
• Most enzymes are globular proteins
• However, some RNA (ribozymes and ribosomal RNA)
also catalyze reactions
• We will celebrate my inspiration, the Biochemist Louis
Pasteur.
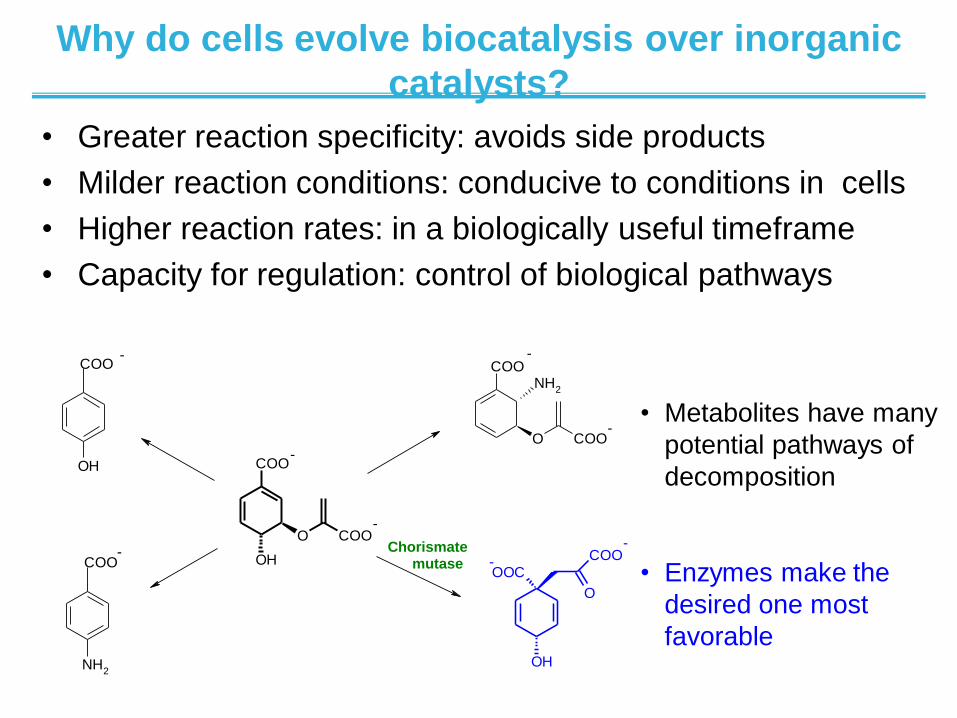
Why do cells evolve biocatalysis over inorganic
catalysts?
• Greater reaction specificity: avoids side products
• Milder reaction conditions: conducive to conditions in cells
• Higher reaction rates: in a biologically useful timeframe
• Capacity for regulation: control of biological pathways
COO
OH
O COO
COO
O COO
NH2
OOC
COO
O
OH
OH
COO
NH2
COO
-
-
-
-
-
-
-
-Chorismate mutase
• Metabolites have many
potential pathways of
decomposition
• Enzymes make the
desired one most
favorable
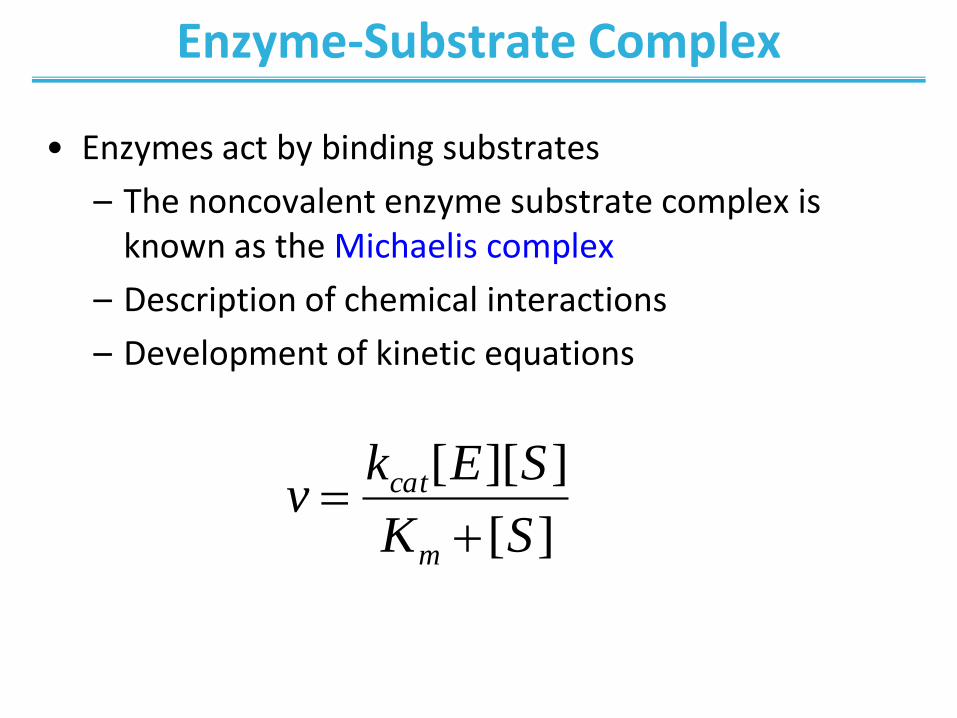
Enzyme-Substrate Complex
• Enzymes act by binding substrates
– The noncovalent enzyme substrate complex is known as the Michaelis complex
– Description of chemical interactions
– Development of kinetic equations
][
]][[
SK
SEkv
m
cat
Enzyme-Substrate Complex
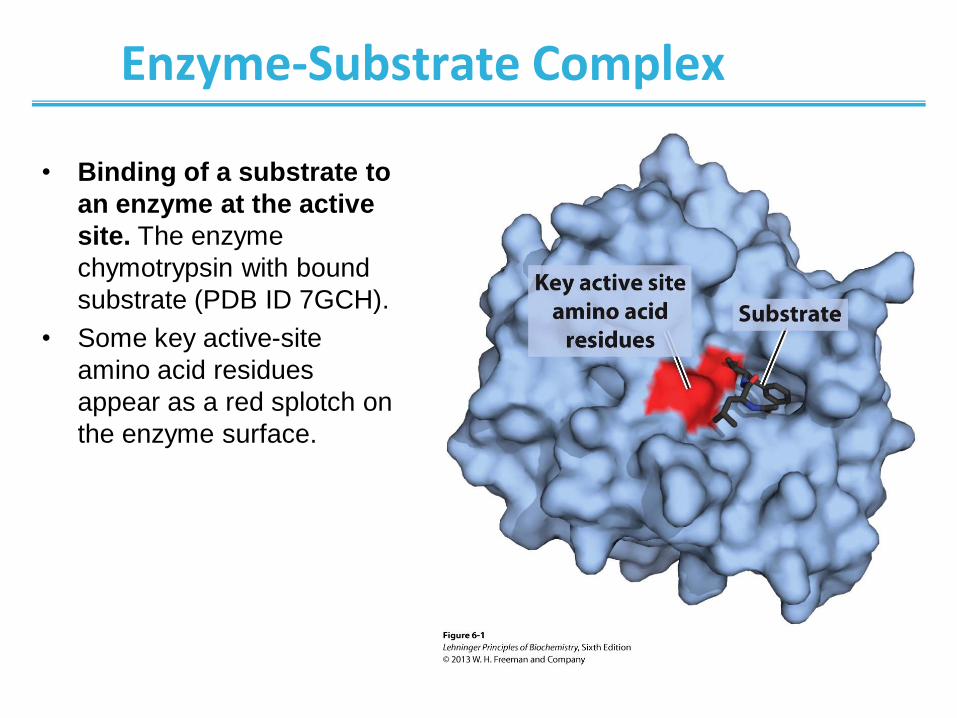
• Binding of a substrate to
an enzyme at the active
site. The enzyme
chymotrypsin with bound
substrate (PDB ID 7GCH).
• Some key active-site
amino acid residues
appear as a red splotch on
the enzyme surface.
Enzymatic Catalysis
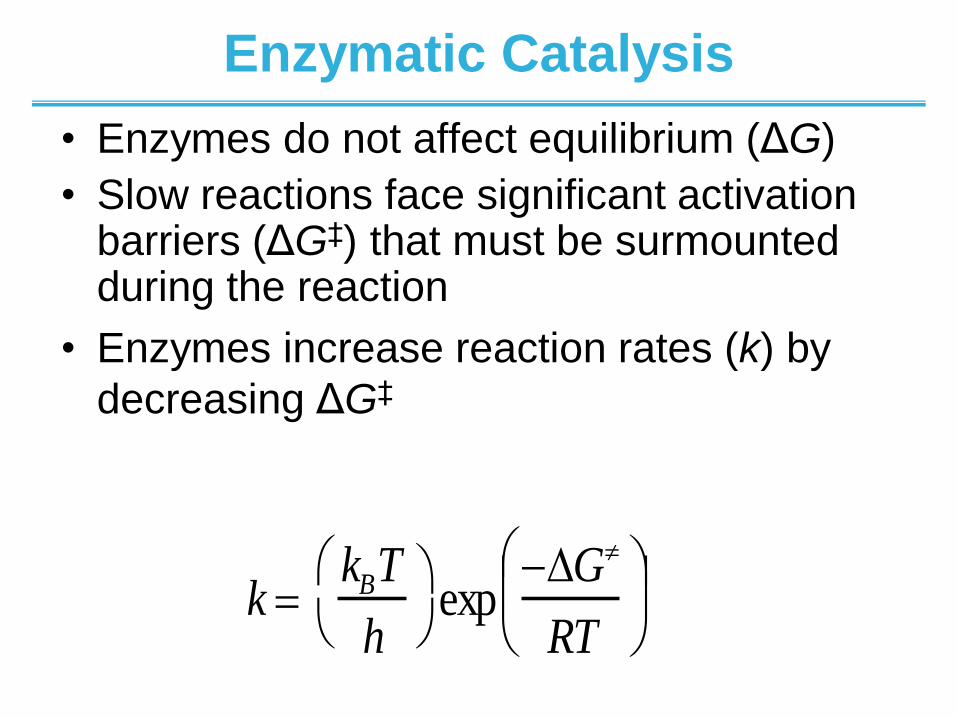
• Enzymes do not affect equilibrium (ΔG)
• Slow reactions face significant activation barriers (ΔG‡) that must be surmounted during the reaction
• Enzymes increase reaction rates (k) by
decreasing ΔG‡
k kBT
h
expG
RT
Reaction Coordinate Diagram
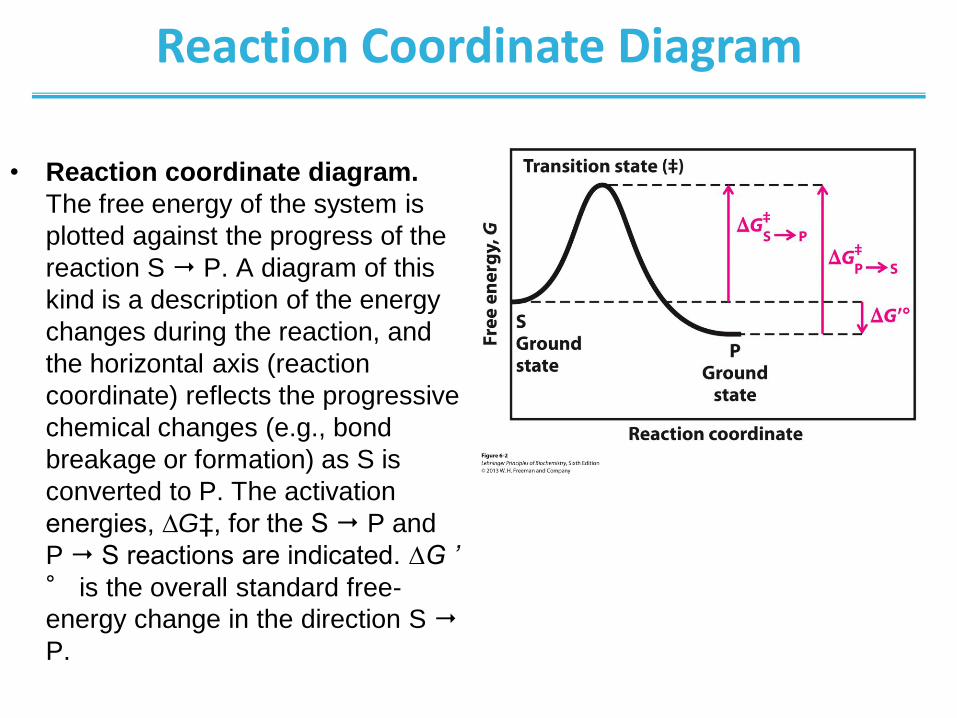
• Reaction coordinate diagram.
The free energy of the system is
plotted against the progress of the
reaction S P. A diagram of this
kind is a description of the energy
changes during the reaction, and
the horizontal axis (reaction
coordinate) reflects the progressive
chemical changes (e.g., bond
breakage or formation) as S is
converted to P. The activation
energies, ∆G‡, for the S P and
P S reactions are indicated. ∆G ’
° is the overall standard free-
energy change in the direction S
P.
Enzymes Decrease ΔG‡
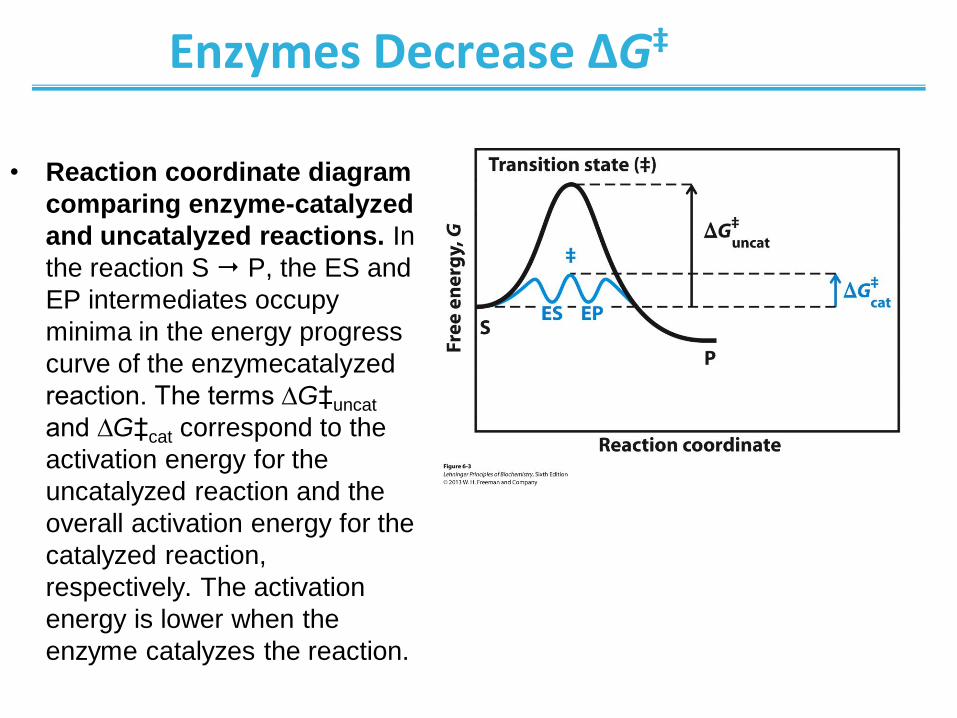
• Reaction coordinate diagram
comparing enzyme-catalyzed
and uncatalyzed reactions. In
the reaction S P, the ES and
EP intermediates occupy
minima in the energy progress
curve of the enzymecatalyzed
reaction. The terms ∆G‡uncat
and ∆G‡cat correspond to the
activation energy for the
uncatalyzed reaction and the
overall activation energy for the
catalyzed reaction,
respectively. The activation
energy is lower when the
enzyme catalyzes the reaction.
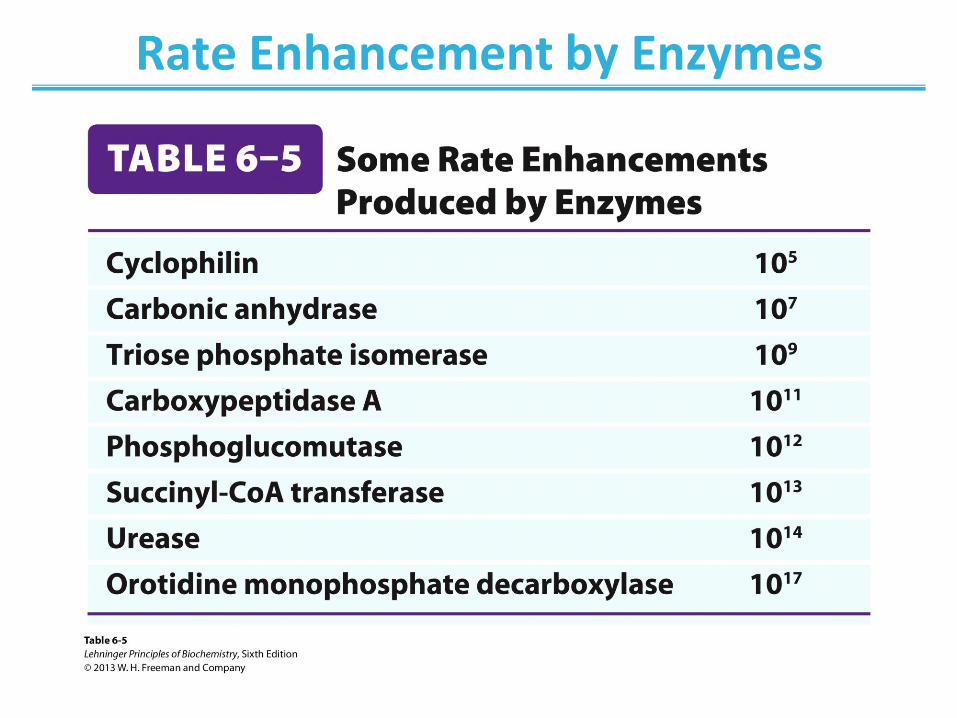
Rate Enhancement by Enzymes
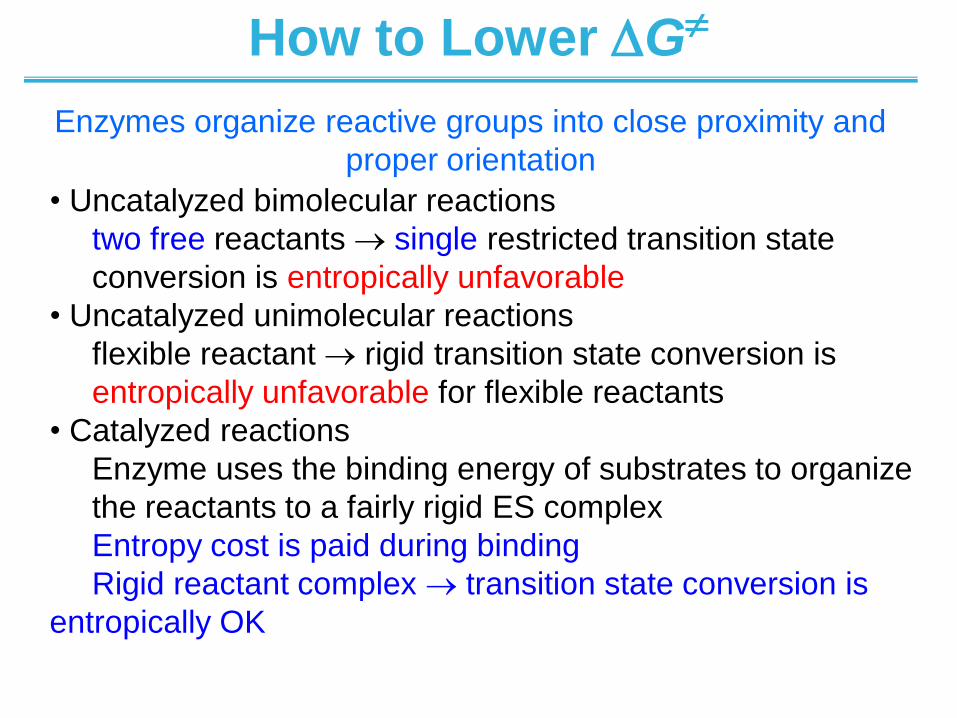
How to Lower G
Enzymes organize reactive groups into close proximity and
proper orientation
• Uncatalyzed bimolecular reactions
two free reactants single restricted transition state
conversion is entropically unfavorable
• Uncatalyzed unimolecular reactions
flexible reactant rigid transition state conversion is
entropically unfavorable for flexible reactants
• Catalyzed reactions
Enzyme uses the binding energy of substrates to organize
the reactants to a fairly rigid ES complex
Entropy cost is paid during binding
Rigid reactant complex transition state conversion is
entropically OK
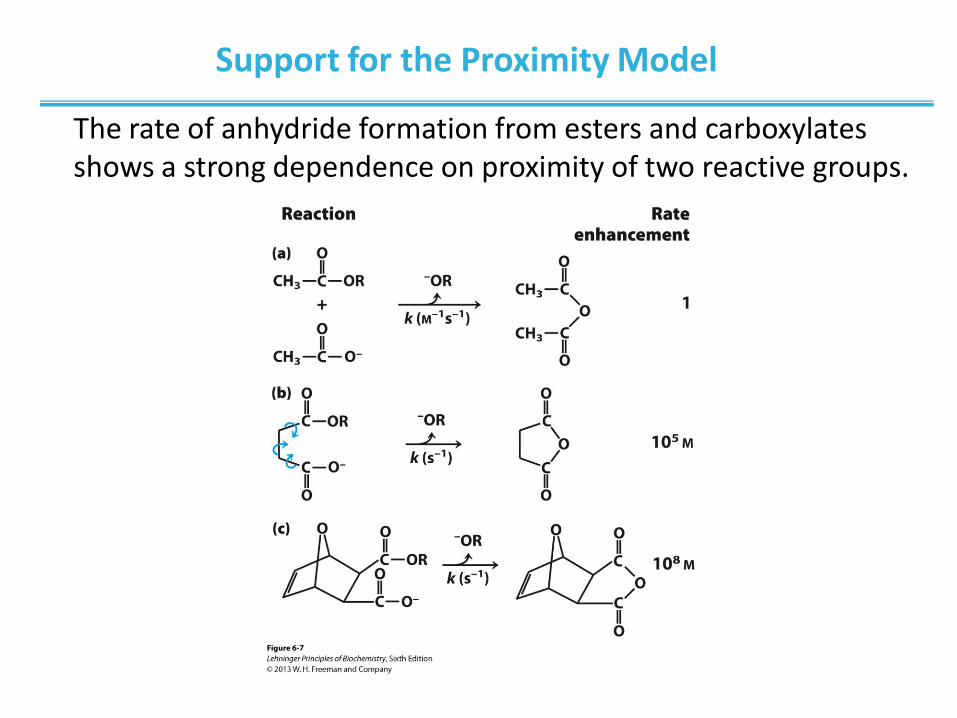
Support for the Proximity Model
The rate of anhydride formation from esters and carboxylates shows a strong dependence on proximity of two reactive groups.
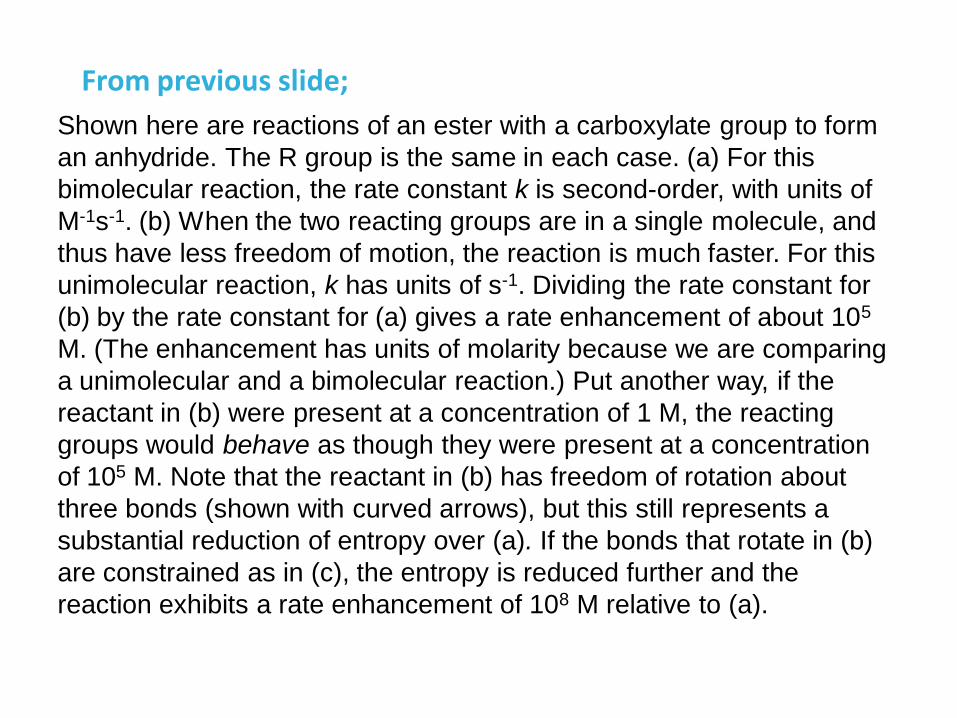
Shown here are reactions of an ester with a carboxylate group to form
an anhydride. The R group is the same in each case. (a) For this
bimolecular reaction, the rate constant k is second-order, with units of
M-1s-1. (b) When the two reacting groups are in a single molecule, and
thus have less freedom of motion, the reaction is much faster. For this
unimolecular reaction, k has units of s-1. Dividing the rate constant for
(b) by the rate constant for (a) gives a rate enhancement of about 105
M. (The enhancement has units of molarity because we are comparing
a unimolecular and a bimolecular reaction.) Put another way, if the
reactant in (b) were present at a concentration of 1 M, the reacting
groups would behave as though they were present at a concentration
of 105 M. Note that the reactant in (b) has freedom of rotation about
three bonds (shown with curved arrows), but this still represents a
substantial reduction of entropy over (a). If the bonds that rotate in (b)
are constrained as in (c), the entropy is reduced further and the
reaction exhibits a rate enhancement of 108 M relative to (a).
From previous slide;
How to Lower G
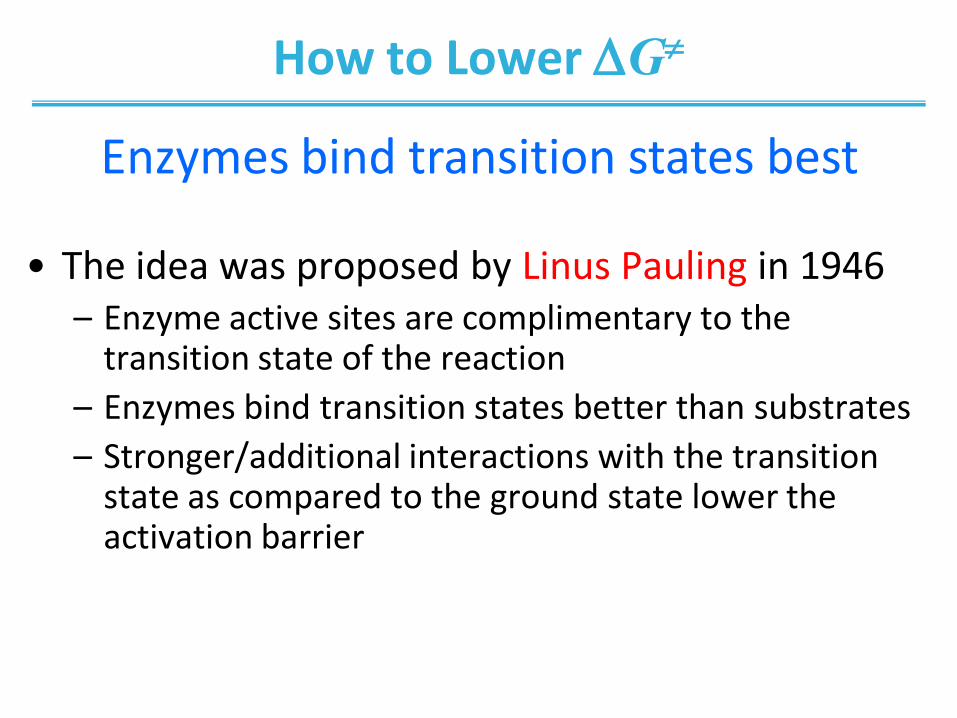
Enzymes bind transition states best
• The idea was proposed by Linus Pauling in 1946 – Enzyme active sites are complimentary to the
transition state of the reaction
– Enzymes bind transition states better than substrates
– Stronger/additional interactions with the transition state as compared to the ground state lower the activation barrier
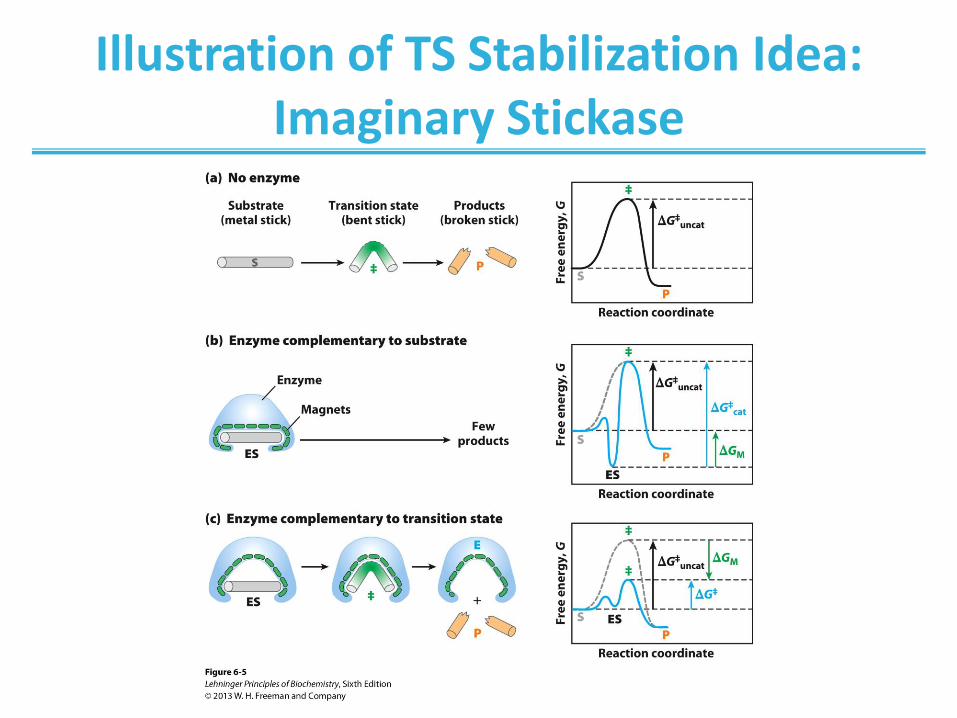
Illustration of TS Stabilization Idea: Imaginary Stickase
An imaginary enzyme (stickase) designed to catalyze breakage of a
metal stick. (a) Before the stick is broken, it must first be bent (the
transition state). In both stickase examples, magnetic interactions take the
place of weak bonding interactions between enzyme and substrate. (b) A
stickase with a magnet-lined pocket complementary in structure to the stick
(the substrate) stabilizes the substrate. Bending is impeded by the
magnetic attraction between stick and stickase. (c) An enzyme with a
pocket complementary to the reaction transition state helps to destabilize
the stick, contributing to catalysis of the reaction. The binding energy of the
magnetic interactions compensates for the increase in free energy required
to bend the stick. Reaction coordinate diagrams (right) show the energy
consequences of complementarity to substrate versus complementarity to
transition state (EP complexes are omitted). ∆GM, the difference between
the transition-state energies of the uncatalyzed and catalyzed reactions, is
contributed by the magnetic interactions between the stick and stickase.
When the enzyme is complementary to the substrate (b), the ES complex
is more stable and has less free energy in the ground state than substrate
alone. The result is an increase in the activation energy.
Catalytic Mechanisms
– acid-base catalysis: give and take protons
– covalent catalysis: change reaction paths
– metal ion catalysis: use redox cofactors, pKa
shifters
– electrostatic catalysis: preferential interactions with
TS
General Acid-Base Catalysis
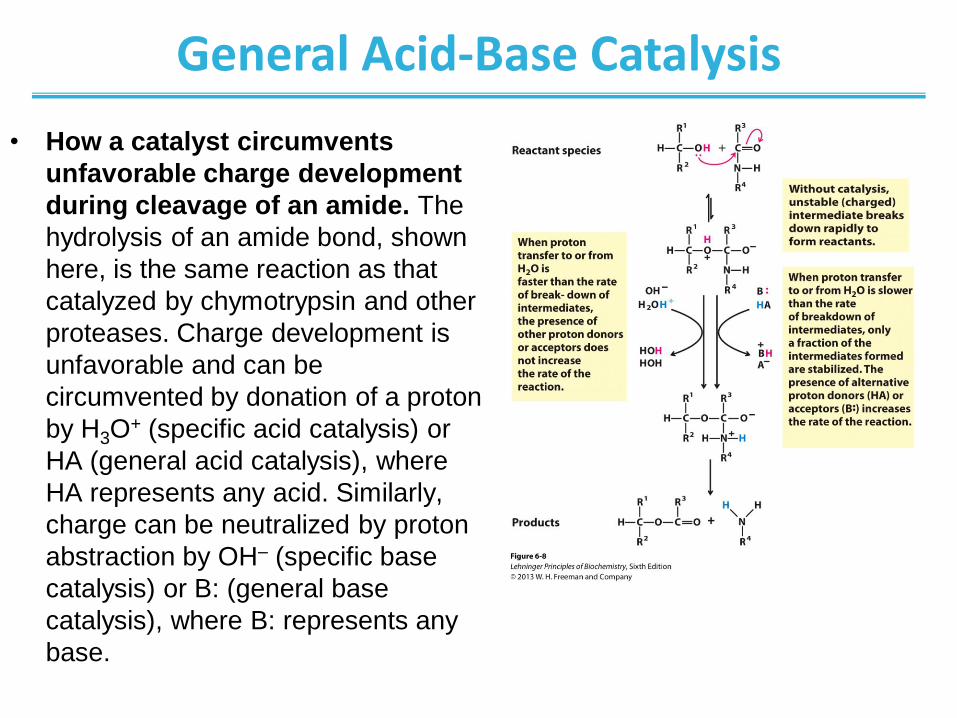
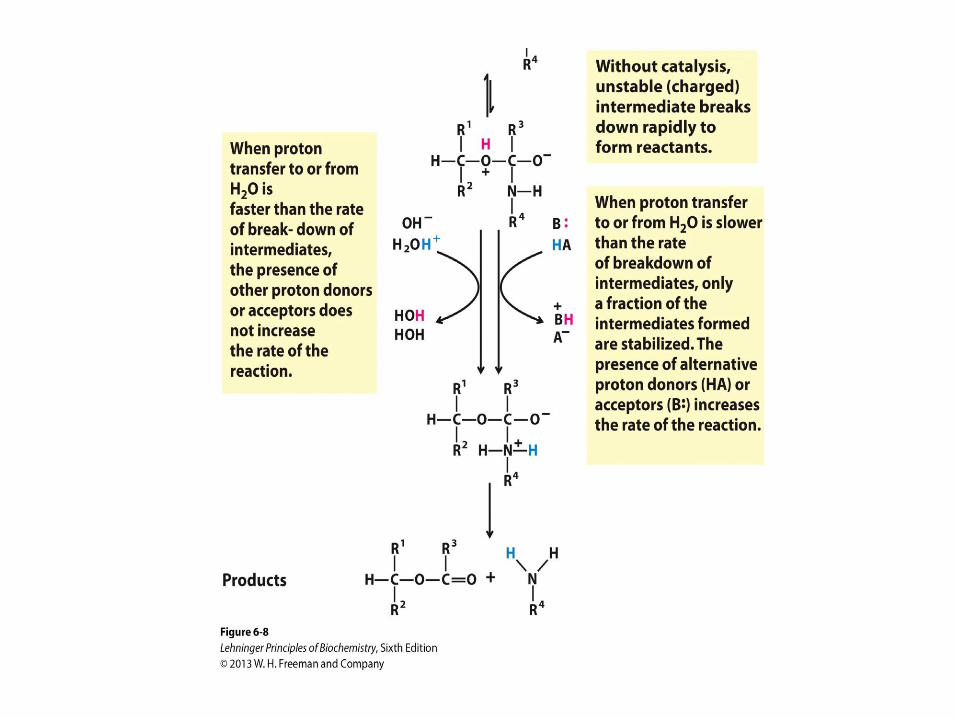
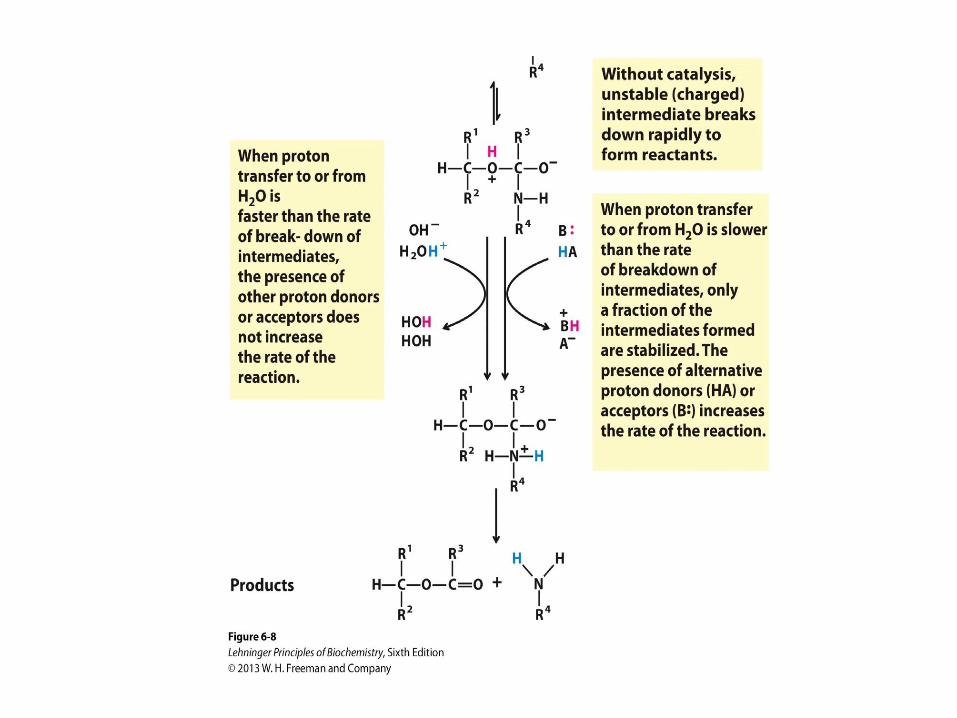
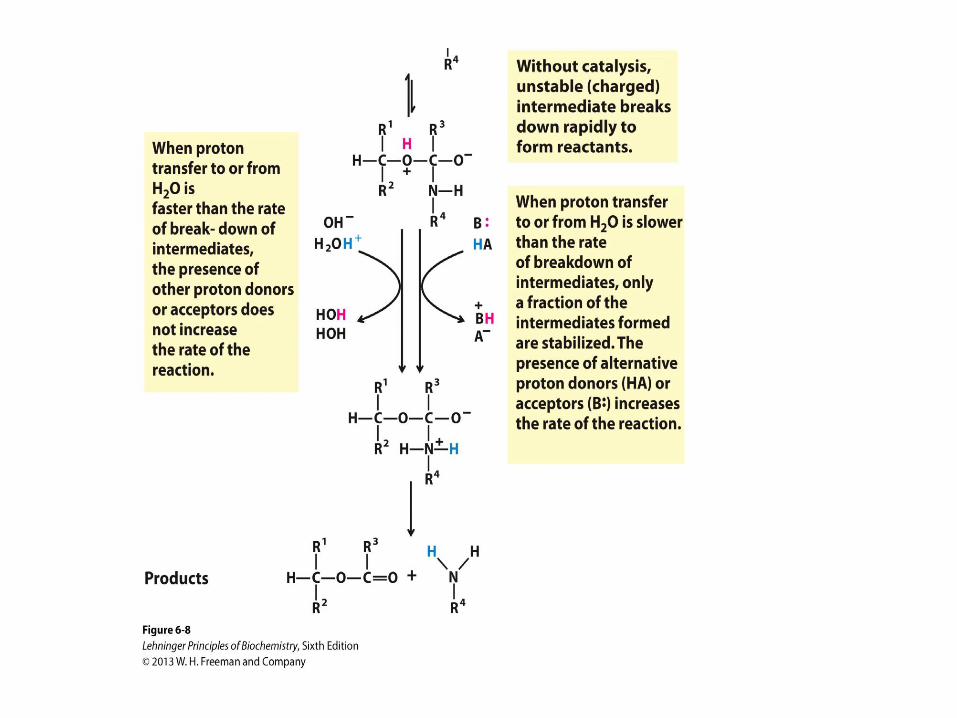
• How a catalyst circumvents
unfavorable charge development
during cleavage of an amide. The
hydrolysis of an amide bond, shown
here, is the same reaction as that
catalyzed by chymotrypsin and other
proteases. Charge development is
unfavorable and can be
circumvented by donation of a proton
by H3O+ (specific acid catalysis) or
HA (general acid catalysis), where
HA represents any acid. Similarly,
charge can be neutralized by proton
abstraction by OH– (specific base
catalysis) or B: (general base
catalysis), where B: represents any
base.
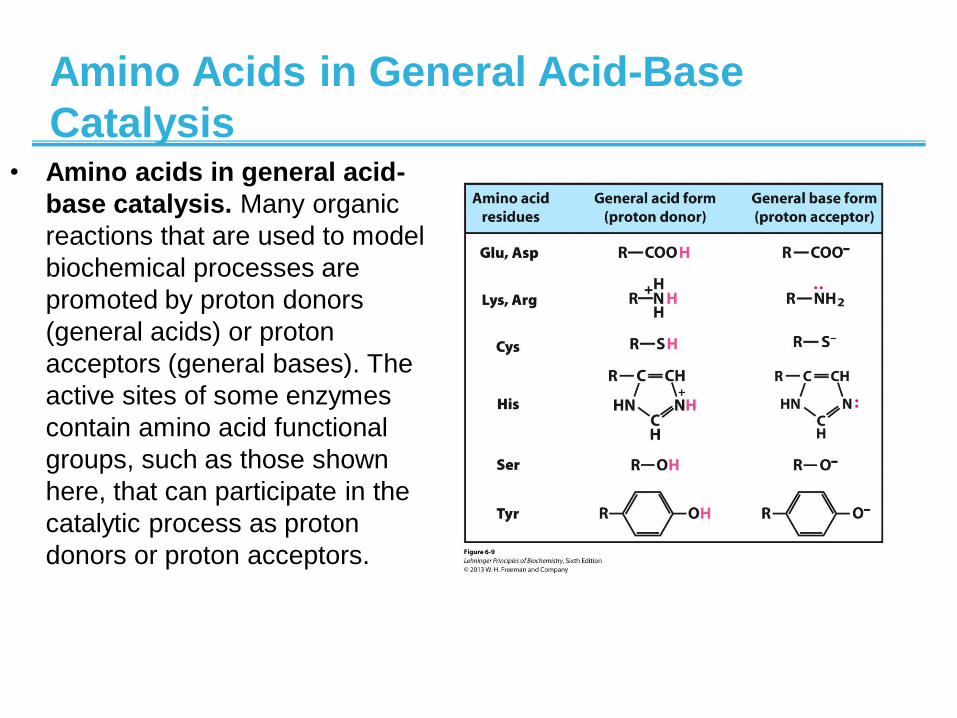
Amino Acids in General Acid-Base
Catalysis • Amino acids in general acid-
base catalysis. Many organic
reactions that are used to model
biochemical processes are
promoted by proton donors
(general acids) or proton
acceptors (general bases). The
active sites of some enzymes
contain amino acid functional
groups, such as those shown
here, that can participate in the
catalytic process as proton
donors or proton acceptors.
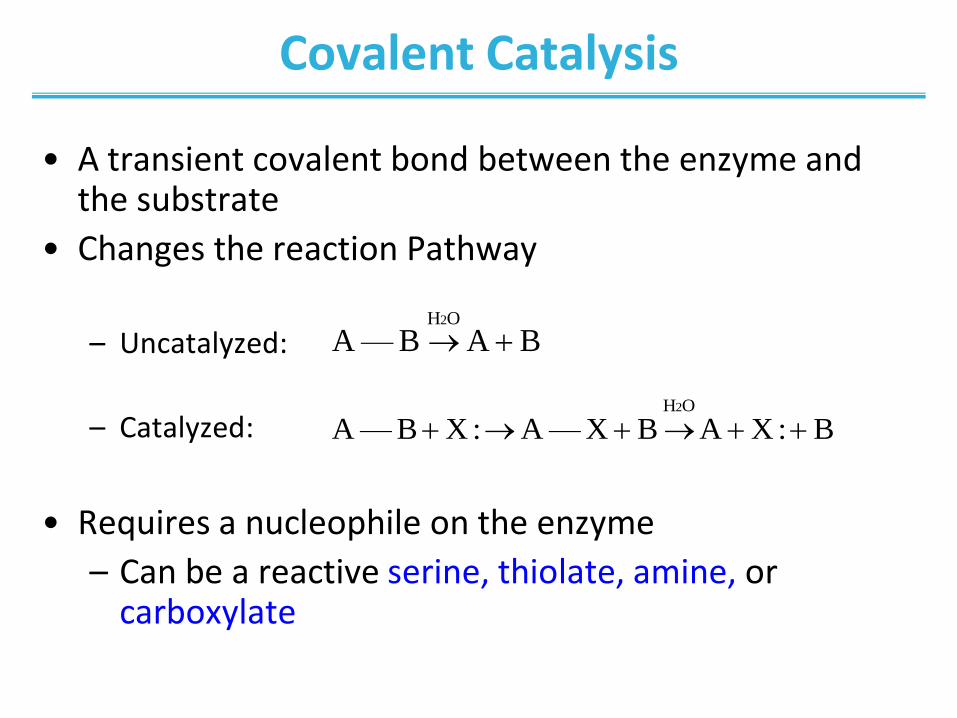
Covalent Catalysis
• A transient covalent bond between the enzyme and the substrate
• Changes the reaction Pathway
– Uncatalyzed:
– Catalyzed:
• Requires a nucleophile on the enzyme
– Can be a reactive serine, thiolate, amine, or carboxylate
B A B—AOH2
B :X A B X—A :X B—AOH2
Metal Ion Catalysis
• Involves a metal ion bound to the enzyme
• Interacts with substrate to facilitate binding
– Stabilizes negative charges
• Participates in oxidation reactions

Chymotrypsin uses most of
the enzymatic mechanisms
Structure of chymotrypsin. (PDB ID 7GCH) (c) The polypeptide
backbone as a ribbon structure. Disulfide bonds are yellow; the three
chains are colored as in part (a).
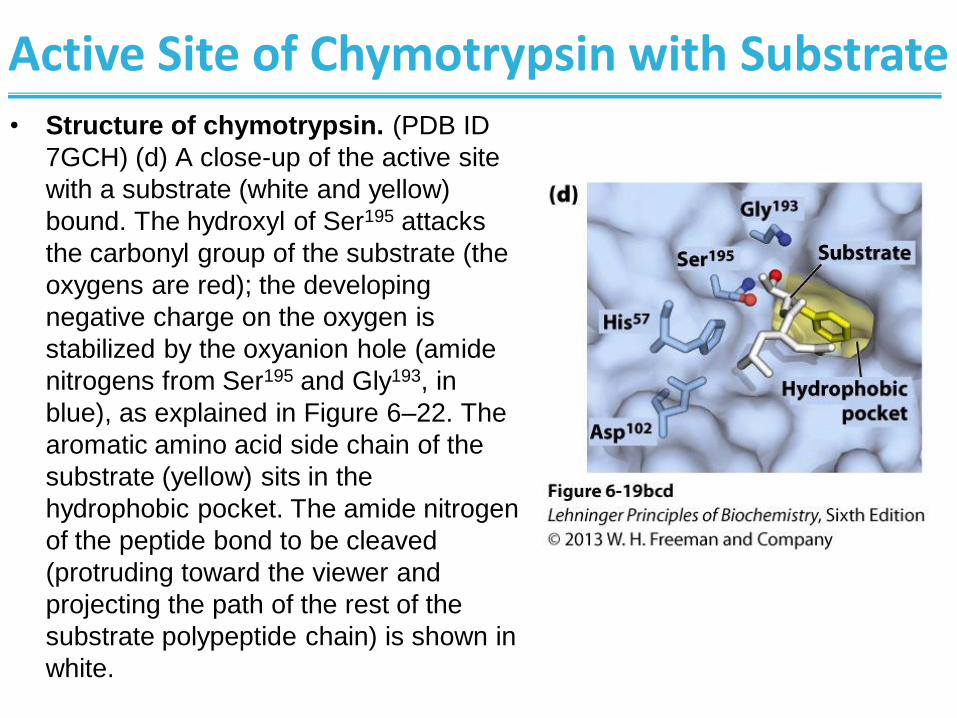
Active Site of Chymotrypsin with Substrate • Structure of chymotrypsin. (PDB ID
7GCH) (d) A close-up of the active site
with a substrate (white and yellow)
bound. The hydroxyl of Ser195 attacks
the carbonyl group of the substrate (the
oxygens are red); the developing
negative charge on the oxygen is
stabilized by the oxyanion hole (amide
nitrogens from Ser195 and Gly193, in
blue), as explained in Figure 6–22. The
aromatic amino acid side chain of the
substrate (yellow) sits in the
hydrophobic pocket. The amide nitrogen
of the peptide bond to be cleaved
(protruding toward the viewer and
projecting the path of the rest of the
substrate polypeptide chain) is shown in
white.
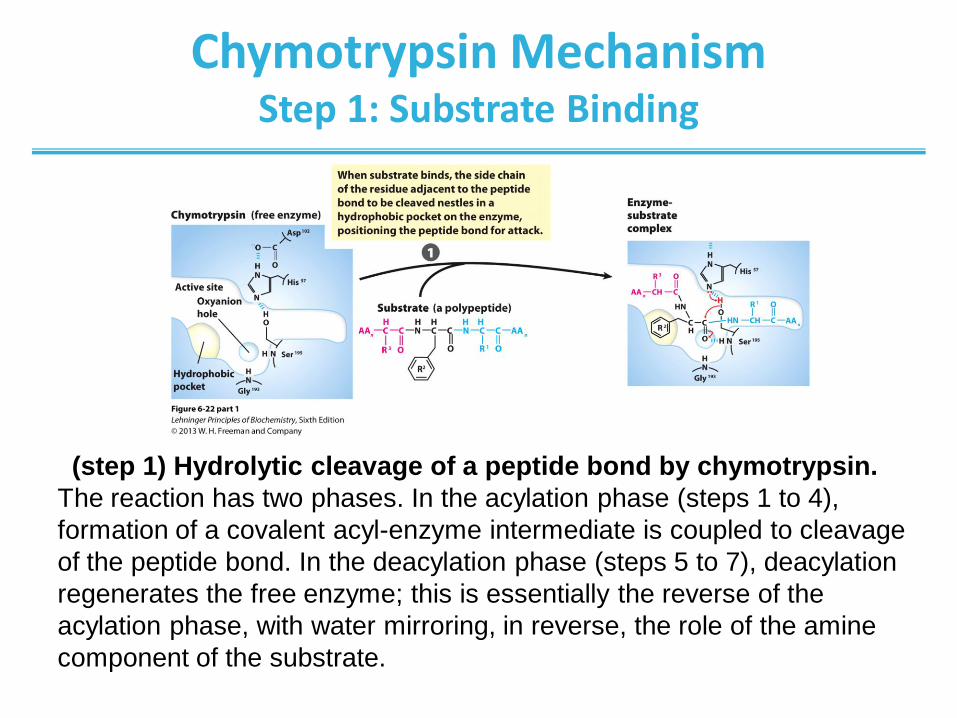
Chymotrypsin Mechanism Step 1: Substrate Binding
(step 1) Hydrolytic cleavage of a peptide bond by chymotrypsin.
The reaction has two phases. In the acylation phase (steps 1 to 4),
formation of a covalent acyl-enzyme intermediate is coupled to cleavage
of the peptide bond. In the deacylation phase (steps 5 to 7), deacylation
regenerates the free enzyme; this is essentially the reverse of the
acylation phase, with water mirroring, in reverse, the role of the amine
component of the substrate.
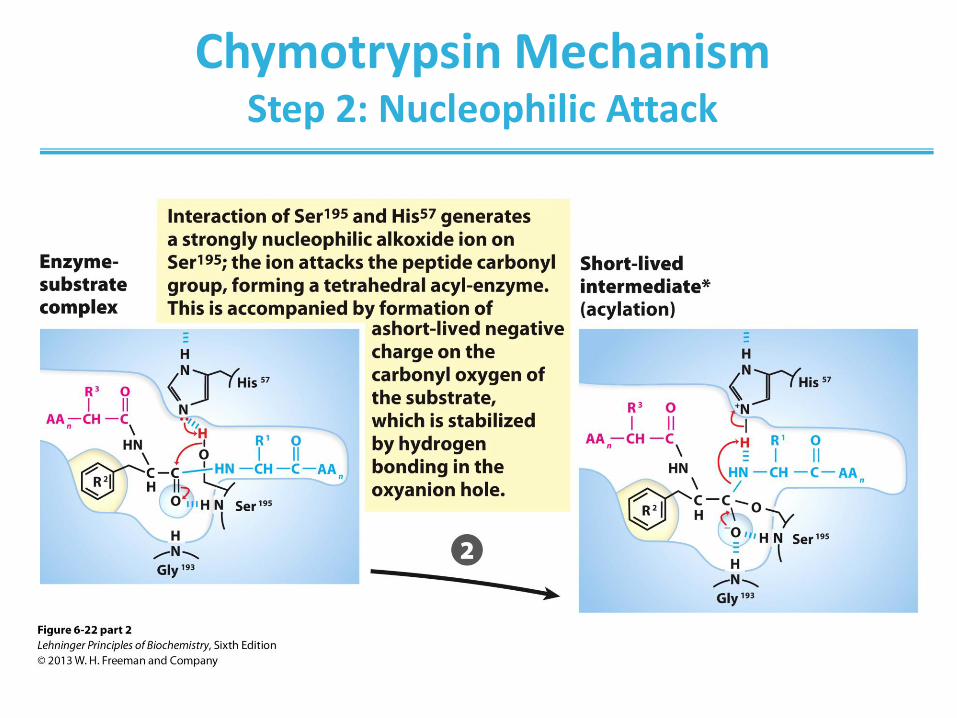
Chymotrypsin Mechanism Step 2: Nucleophilic Attack
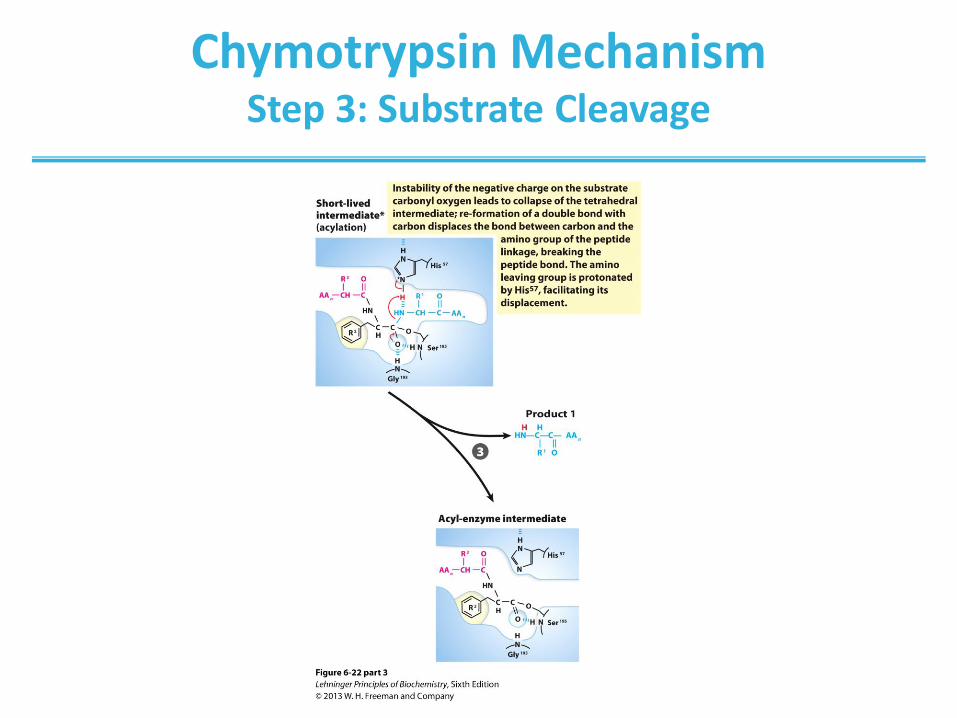
Chymotrypsin Mechanism Step 3: Substrate Cleavage
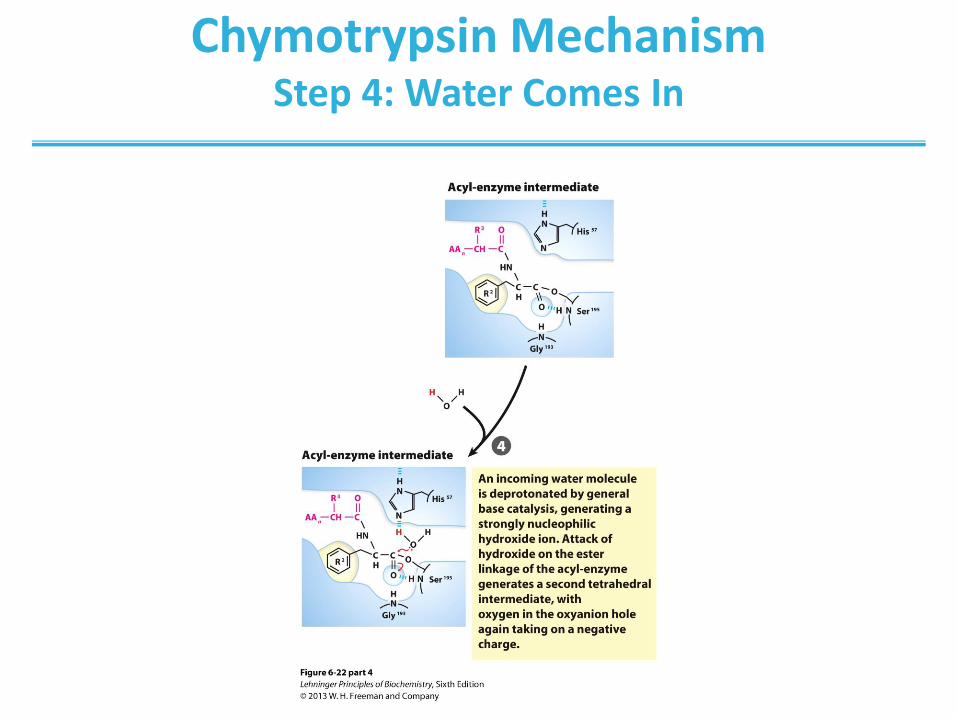
Chymotrypsin Mechanism Step 4: Water Comes In

Chymotrypsin Mechanism Step 5: Water Attacks
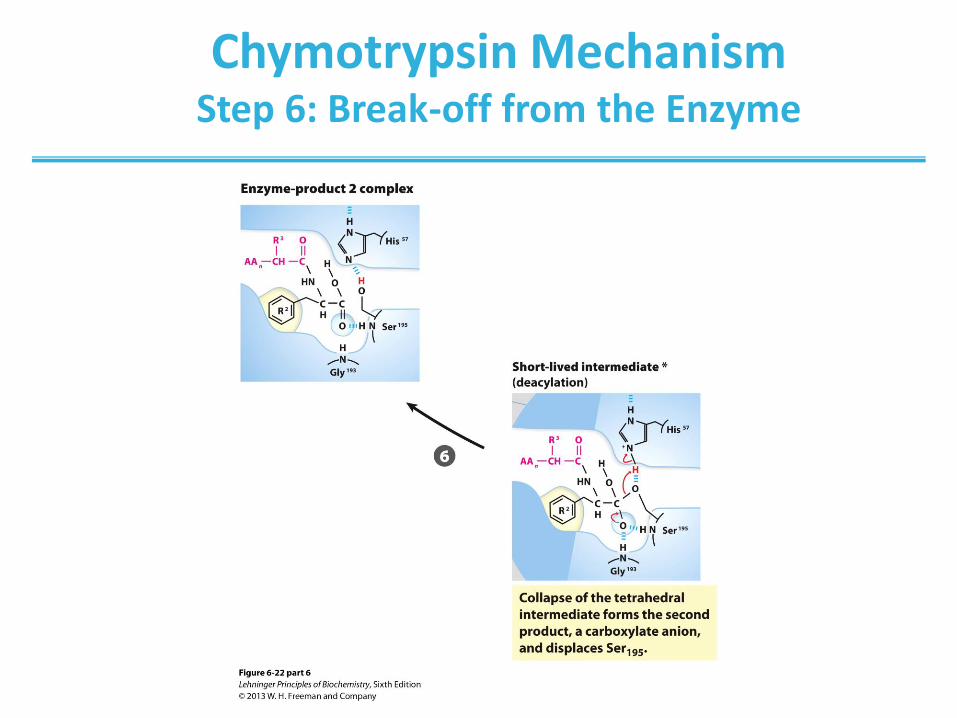
Chymotrypsin Mechanism Step 6: Break-off from the Enzyme
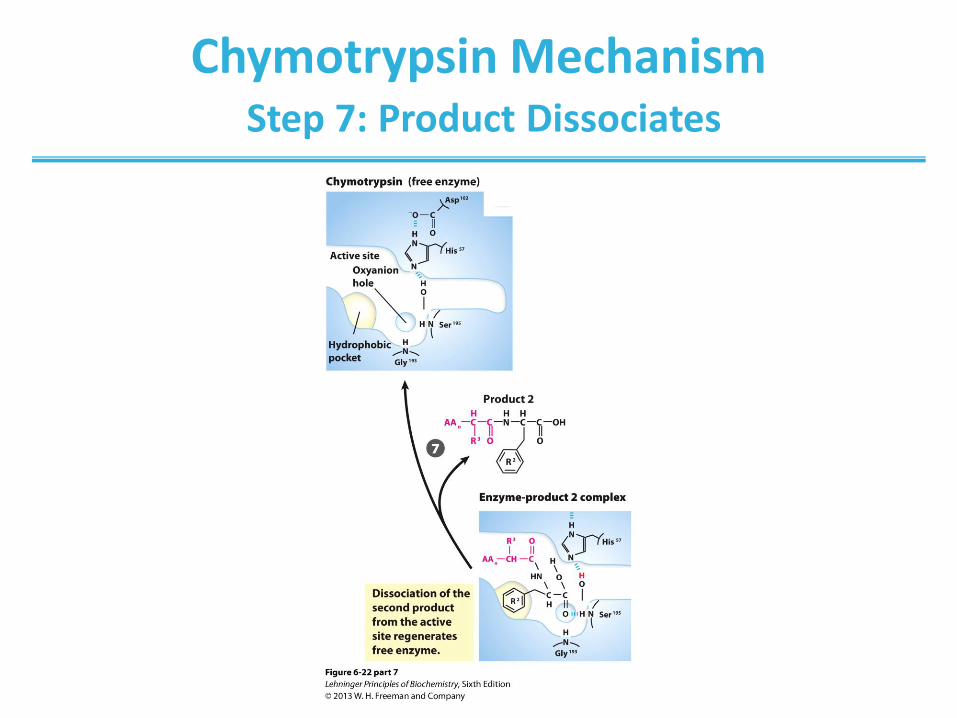
Chymotrypsin Mechanism Step 7: Product Dissociates
Peptidoglycan and Lysozyme
• Peptidoglycan is a polysaccharide found in many bacterial cell walls
• Cleavage of the cell wall leads to the lysis of bacteria
• Lysozyme is an antibacterial enzyme
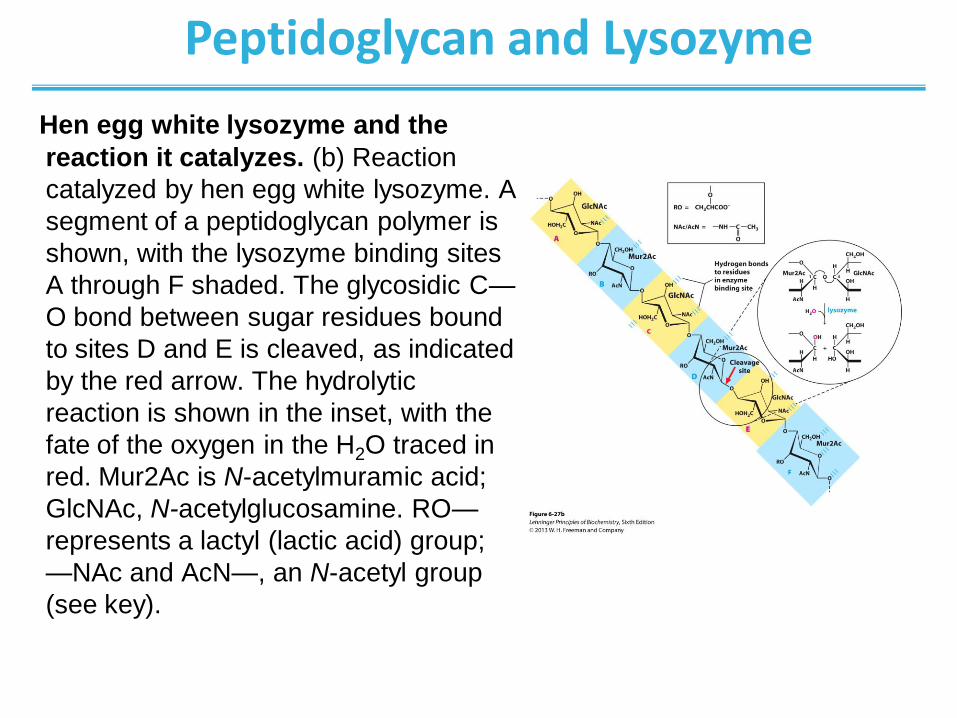
Peptidoglycan and Lysozyme
Hen egg white lysozyme and the
reaction it catalyzes. (b) Reaction
catalyzed by hen egg white lysozyme. A
segment of a peptidoglycan polymer is
shown, with the lysozyme binding sites
A through F shaded. The glycosidic C—
O bond between sugar residues bound
to sites D and E is cleaved, as indicated
by the red arrow. The hydrolytic
reaction is shown in the inset, with the
fate of the oxygen in the H2O traced in
red. Mur2Ac is N-acetylmuramic acid;
GlcNAc, N-acetylglucosamine. RO—
represents a lactyl (lactic acid) group;
—NAc and AcN—, an N-acetyl group
(see key).
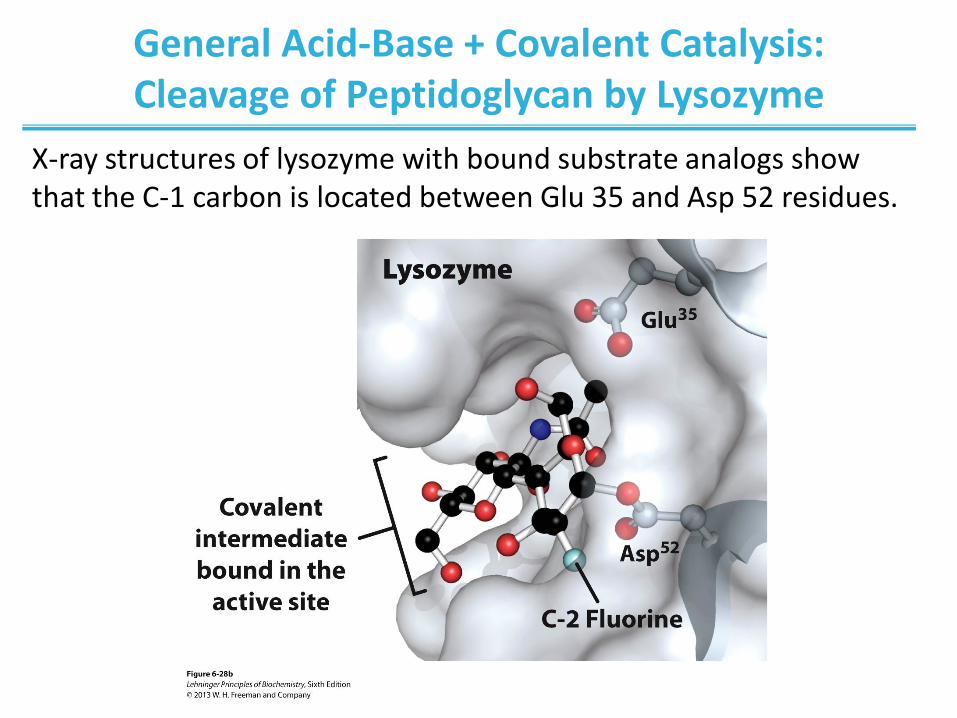
X-ray structures of lysozyme with bound substrate analogs show that the C-1 carbon is located between Glu 35 and Asp 52 residues.
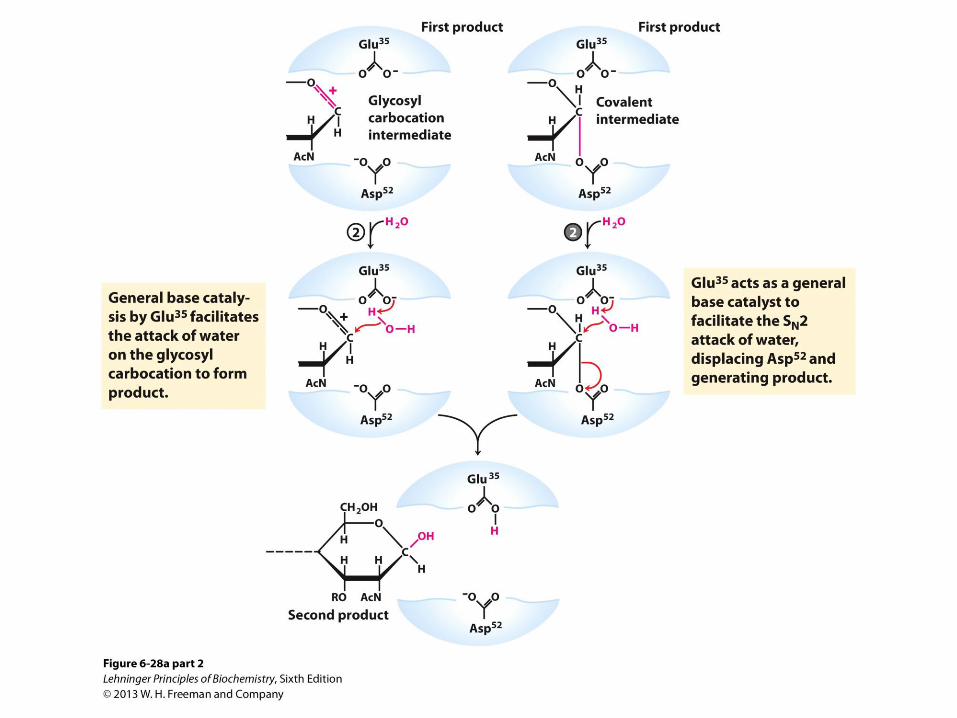
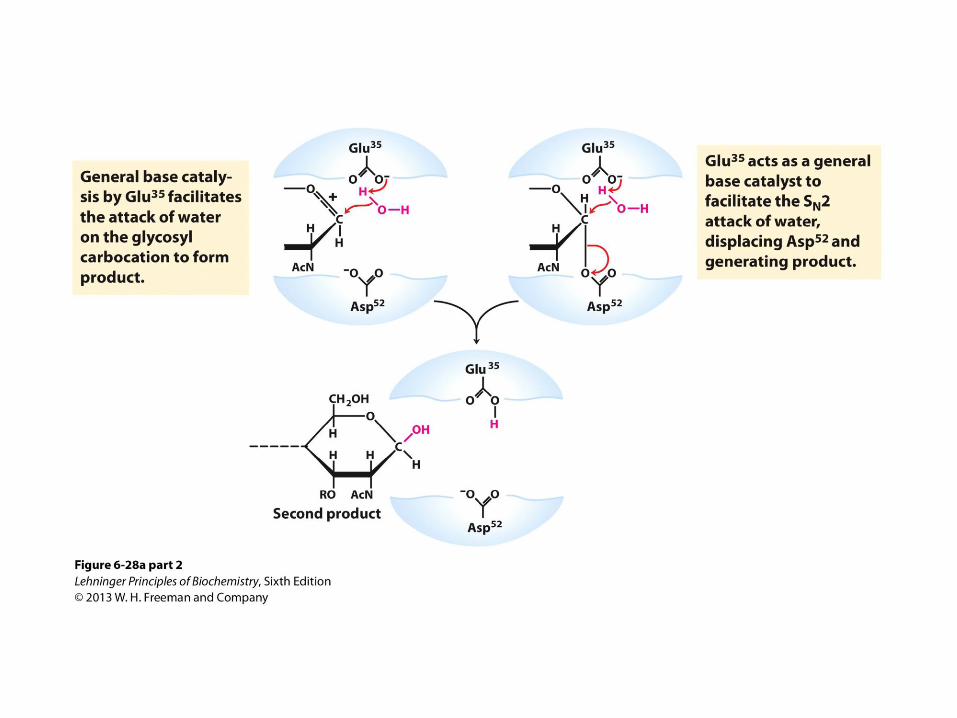
General Acid-Base + Covalent Catalysis: Cleavage of Peptidoglycan by Lysozyme
From previous slide; Lysozyme reaction.
• In this reaction, the water introduced into the product
at C-1 of Mur2Ac is in the same configuration as the
original glycosidic bond. The reaction is thus a
molecular substitution with retention of configuration.
(b) A surface rendering of the lysozyme active site
with the covalent enzyme-substrate intermediate
shown as a ball-and-stick structure. Side-chains of
active-site residues are shown as ball-and-stick
structures protruding from ribbons (PDB ID 1H6M).
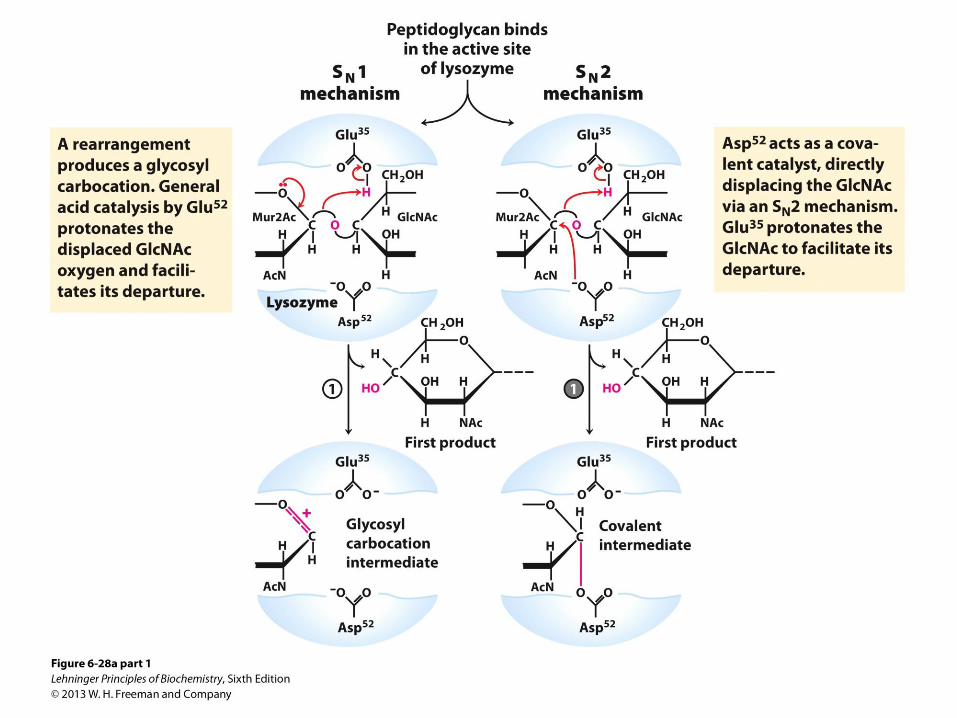
Cleavage of Peptidoglycan by Lysozyme: Two Successive SN2 Steps Model
• Asp 52 acts as a nucleophile to attack the anomeric carbon in the first SN2 step
• Glu 35 acts as a general acid and protonates the leaving group in the transition state
• Water hydrolyzes the covalent glycosyl-enzyme intermediate
• Glu 35 acts as a general base to deprotonate water in the second SN2 step
Experimental work I
am no longer
allowed to enjoy!

What are enzymes?
• Enzymes are catalysts
• Increase reaction rates without being used up
• Most enzymes are globular proteins
• However, some RNA (ribozymes and ribosomal RNA)
also catalyze reactions
• We will celebrate my inspiration, the Biochemist Louis
Pasteur.

Why biocatalysis over inorganic catalysts?
• Greater reaction specificity: avoids side products
• Milder reaction conditions: conducive to conditions in cells
• Higher reaction rates: in a biologically useful timeframe
• Capacity for regulation: control of biological pathways
COO
OH
O COO
COO
O COO
NH2
OOC
COO
O
OH
OH
COO
NH2
COO
-
-
-
-
-
-
-
-Chorismate mutase
• Metabolites have many
potential pathways of
decomposition
• Enzymes make the
desired one most
favorable
What is enzyme kinetics?
• Kinetics is the study of the rate at which compounds react
• Rate of enzymatic reaction is affected by:
– enzyme
– substrate
– effectors
– temperature
Why study enzyme kinetics?
• Quantitative description of biocatalysis
• Determine the order of binding of substrates
• Elucidate acid-base catalysis
• Understand catalytic mechanism
• Find effective inhibitors
• Understand regulation of activity
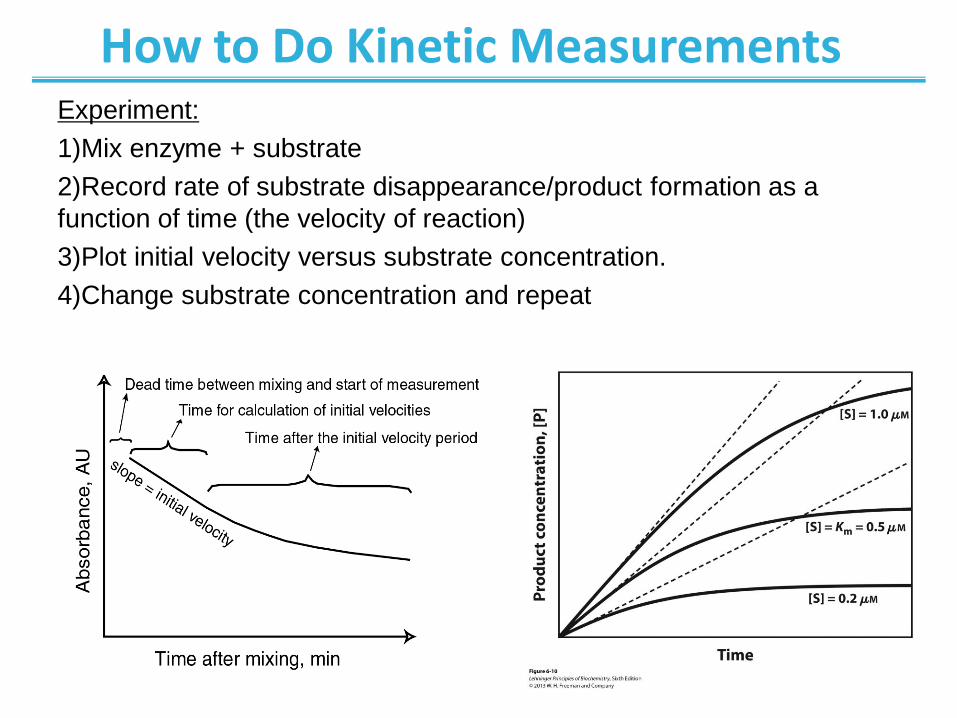
How to Do Kinetic Measurements Experiment:
1)Mix enzyme + substrate
2)Record rate of substrate disappearance/product formation as a
function of time (the velocity of reaction)
3)Plot initial velocity versus substrate concentration.
4)Change substrate concentration and repeat
A theoretical enzyme catalyzes the reaction S ↔ P, and is
present at a concentration sufficient to catalyze the
reaction at a maximum velocity, Vmax, of 1 μM/min. The
Michaelis constant, Km (explained in the text), is 0.5 μM.
Progress curves are shown for substrate concentrations
below, at, and above the Km. The rate of an enzyme-
catalyzed reaction declines as substrate is converted to
product. A tangent to each curve taken at time = 0 defines
the initial velocity, V0, of each reaction.
From previous slide; Initial velocities of enzyme- catalyzed reactions
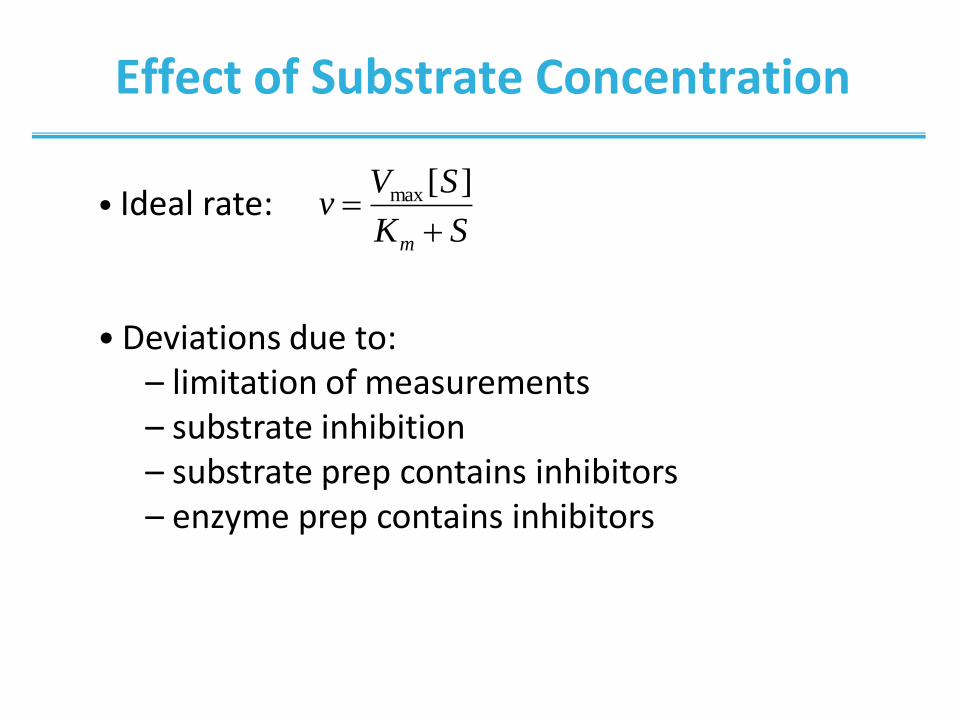
Effect of Substrate Concentration
• Ideal rate: • Deviations due to:
– limitation of measurements – substrate inhibition – substrate prep contains inhibitors – enzyme prep contains inhibitors
SK
SVv
m
][max
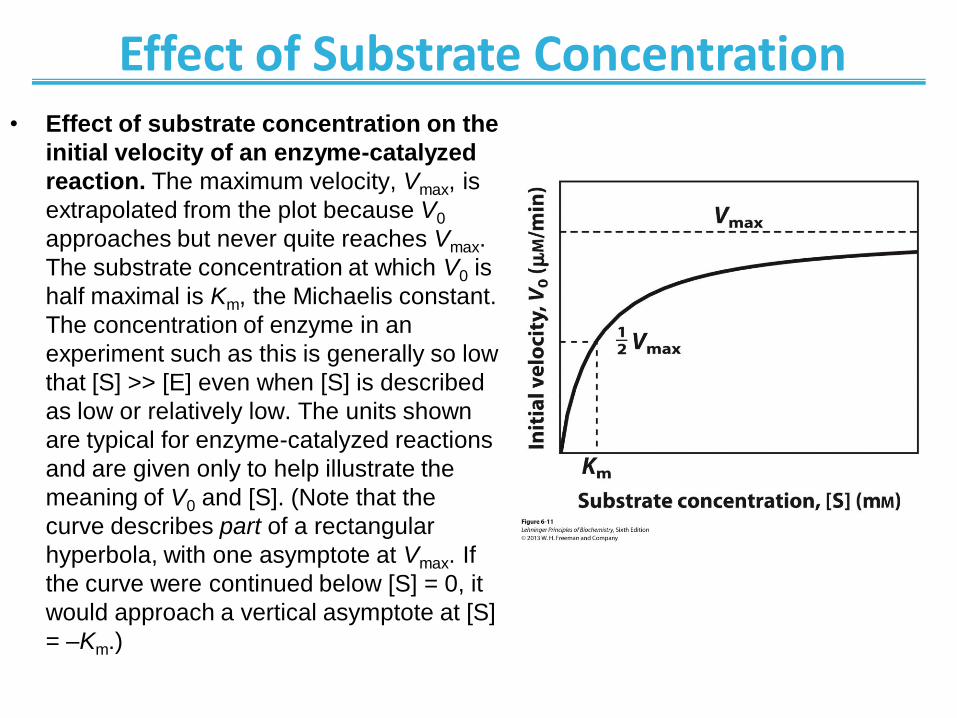
Effect of Substrate Concentration • Effect of substrate concentration on the
initial velocity of an enzyme-catalyzed
reaction. The maximum velocity, Vmax, is
extrapolated from the plot because V0
approaches but never quite reaches Vmax.
The substrate concentration at which V0 is
half maximal is Km, the Michaelis constant.
The concentration of enzyme in an
experiment such as this is generally so low
that [S] >> [E] even when [S] is described
as low or relatively low. The units shown
are typical for enzyme-catalyzed reactions
and are given only to help illustrate the
meaning of V0 and [S]. (Note that the
curve describes part of a rectangular
hyperbola, with one asymptote at Vmax. If
the curve were continued below [S] = 0, it
would approach a vertical asymptote at [S]
= –Km.)
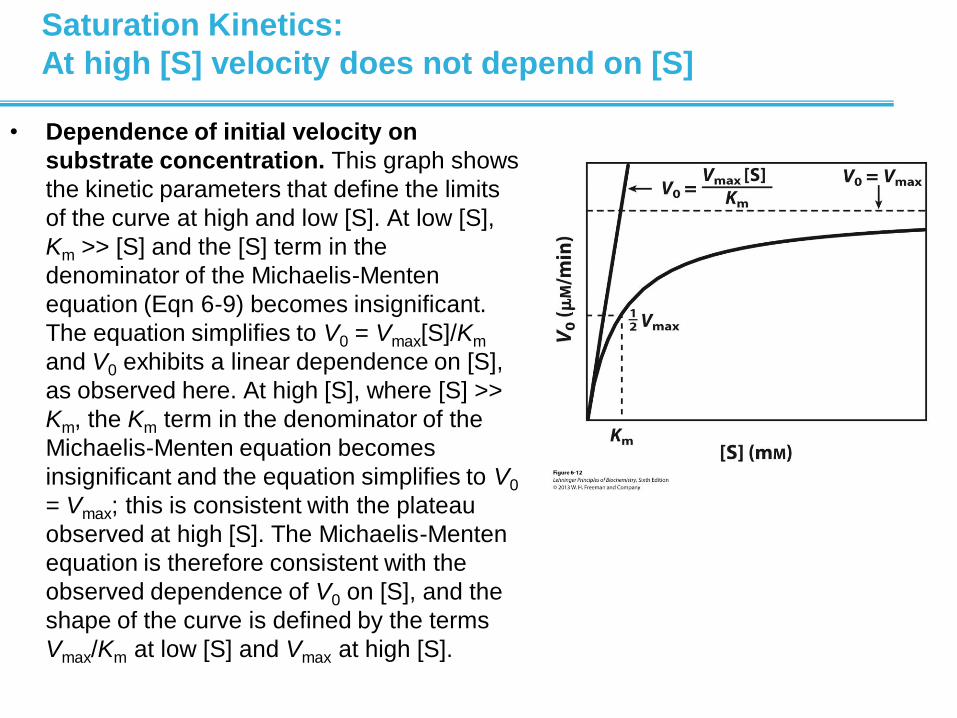
Saturation Kinetics:
At high [S] velocity does not depend on [S]
• Dependence of initial velocity on
substrate concentration. This graph shows
the kinetic parameters that define the limits
of the curve at high and low [S]. At low [S],
Km >> [S] and the [S] term in the
denominator of the Michaelis-Menten
equation (Eqn 6-9) becomes insignificant.
The equation simplifies to V0 = Vmax[S]/Km
and V0 exhibits a linear dependence on [S],
as observed here. At high [S], where [S] >>
Km, the Km term in the denominator of the
Michaelis-Menten equation becomes
insignificant and the equation simplifies to V0
= Vmax; this is consistent with the plateau
observed at high [S]. The Michaelis-Menten
equation is therefore consistent with the
observed dependence of V0 on [S], and the
shape of the curve is defined by the terms
Vmax/Km at low [S] and Vmax at high [S].
Determination of Kinetic Parameters
Nonlinear Michaelis-Menten plot should be used to calculate parameters Km and Vmax.
Linearized double-reciprocal plot is good for analysis of two-substrate data or inhibition.
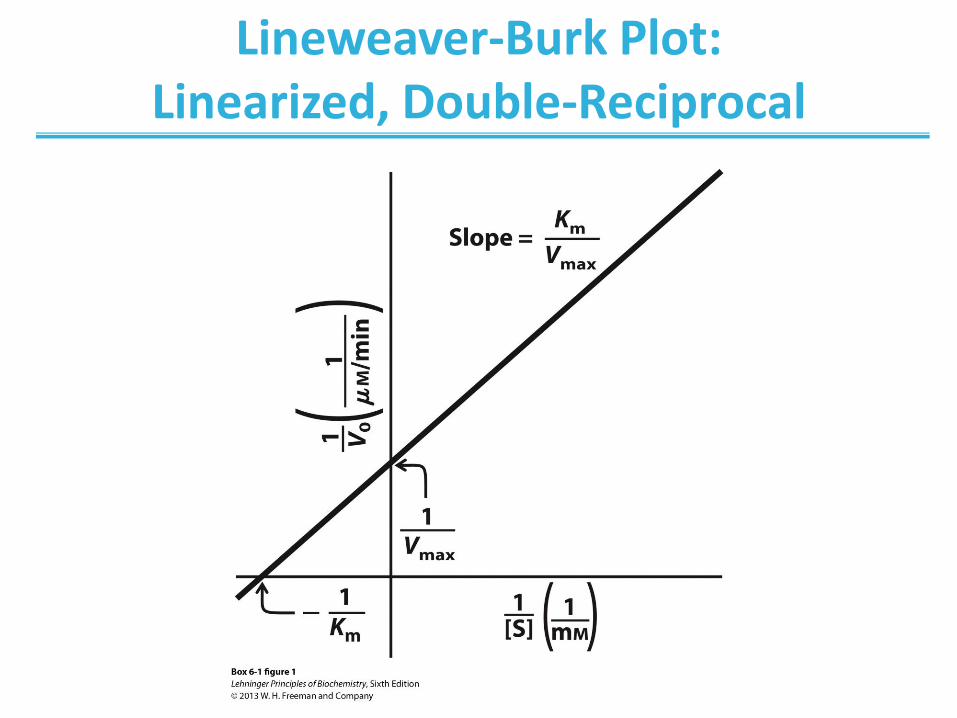
Lineweaver-Burk Plot: Linearized, Double-Reciprocal
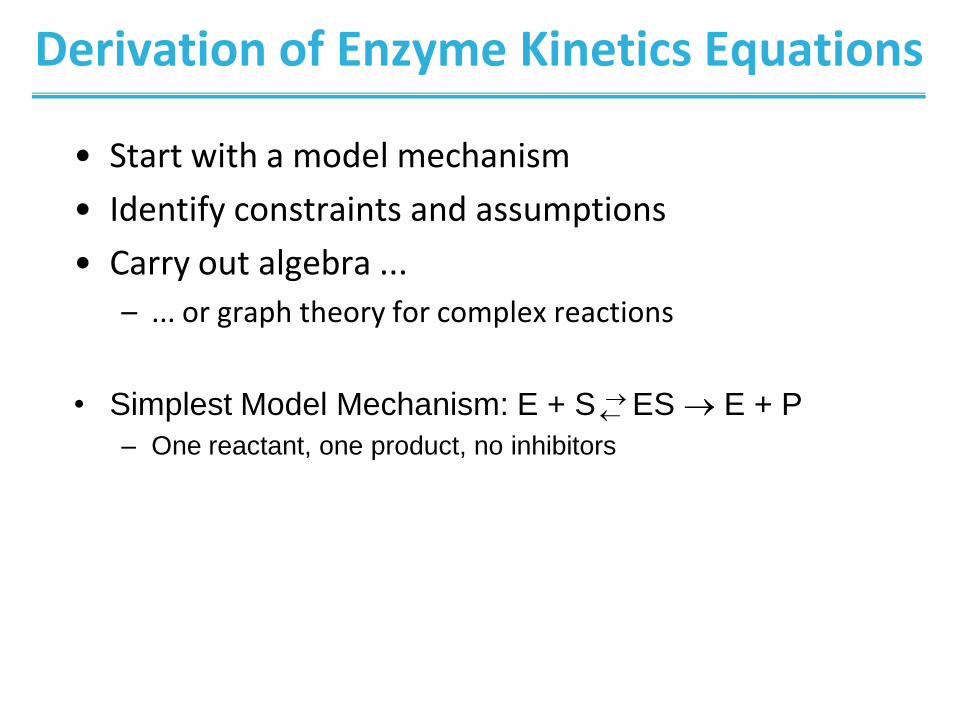
Derivation of Enzyme Kinetics Equations
• Start with a model mechanism
• Identify constraints and assumptions
• Carry out algebra ...
– ... or graph theory for complex reactions
• Simplest Model Mechanism: E + S ES E + P
– One reactant, one product, no inhibitors
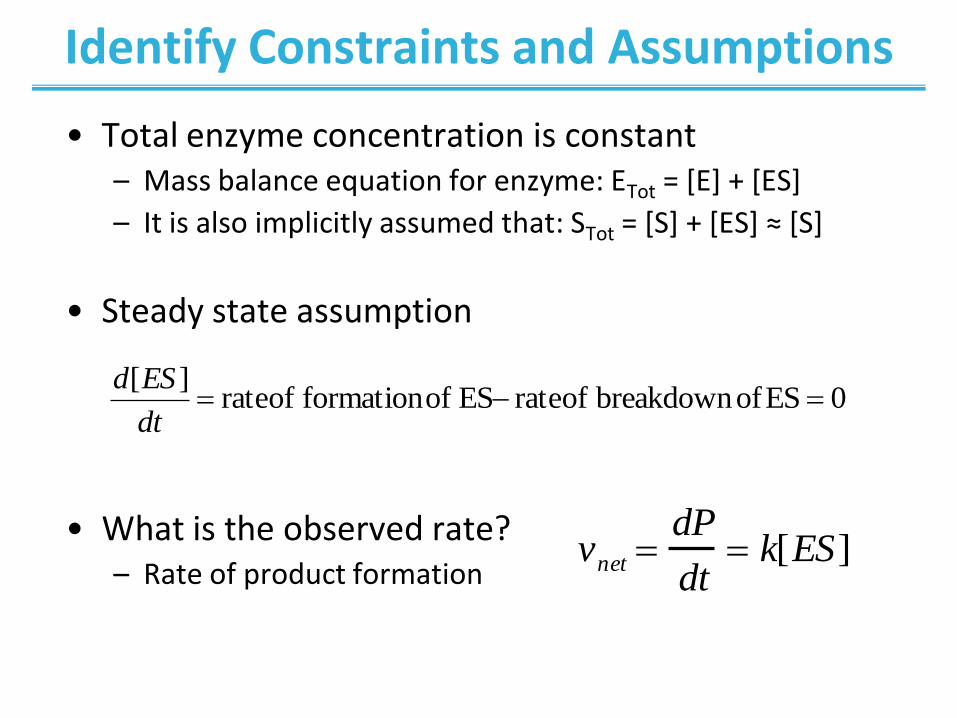
Identify Constraints and Assumptions
• Total enzyme concentration is constant – Mass balance equation for enzyme: ETot = [E] + [ES]
– It is also implicitly assumed that: STot = [S] + [ES] ≈ [S]
• Steady state assumption
• What is the observed rate? – Rate of product formation
vnet dP
dt k[ES]
0ESofbreakdownofrateESofformationofrate][
dt
ESd
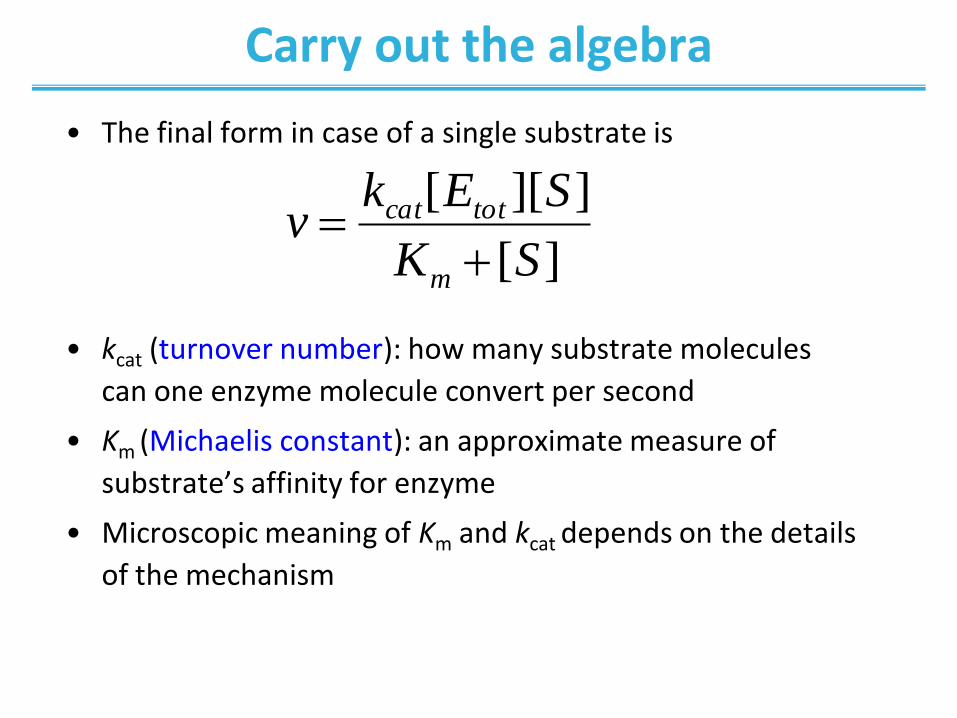
Carry out the algebra
• The final form in case of a single substrate is
• kcat (turnover number): how many substrate molecules
can one enzyme molecule convert per second
• Km (Michaelis constant): an approximate measure of
substrate’s affinity for enzyme
• Microscopic meaning of Km and kcat depends on the details
of the mechanism
][
]][[
SK
SEkv
m
totcat
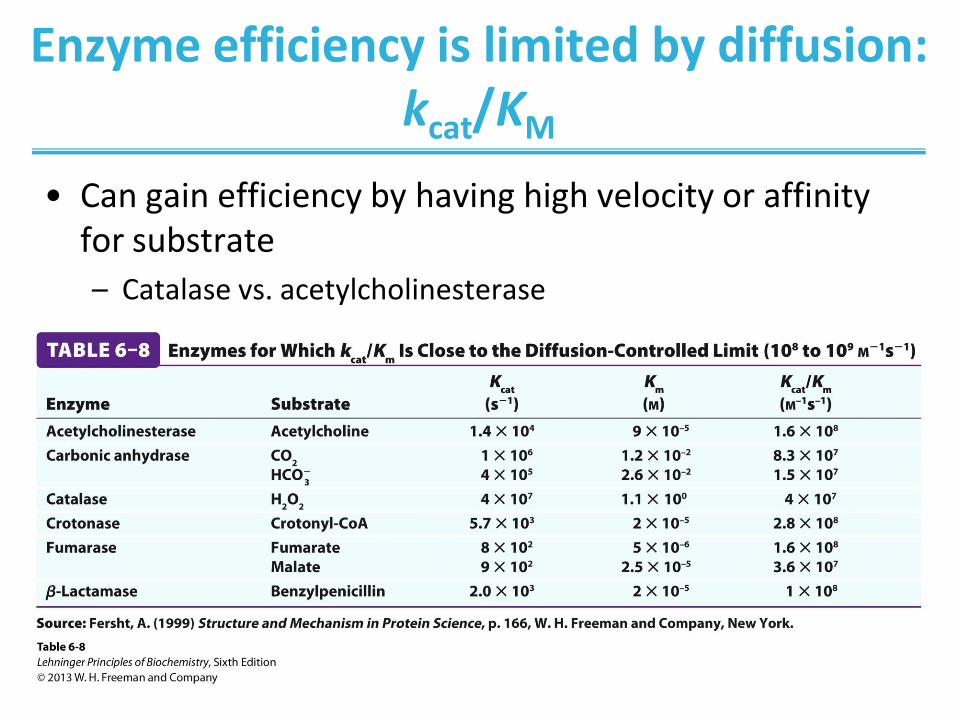
Enzyme efficiency is limited by diffusion: kcat/KM
• Can gain efficiency by having high velocity or affinity for substrate
– Catalase vs. acetylcholinesterase
Two-Substrate Reactions
• Kinetic mechanism: the order of binding of substrates and release of products
• When two or more reactants are involved, enzyme kinetics allows to distinguish between different kinetic mechanisms
– Sequential mechanism – Ping-Pong mechanism
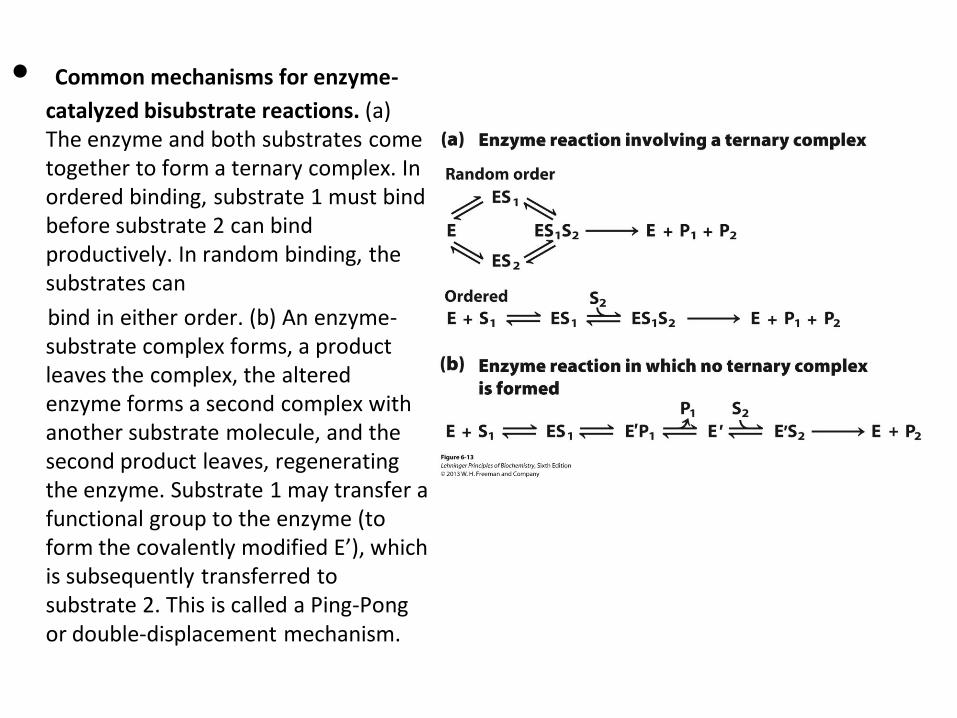
• Common mechanisms for enzyme-
catalyzed bisubstrate reactions. (a) The enzyme and both substrates come together to form a ternary complex. In ordered binding, substrate 1 must bind before substrate 2 can bind productively. In random binding, the substrates can
bind in either order. (b) An enzyme-substrate complex forms, a product leaves the complex, the altered enzyme forms a second complex with another substrate molecule, and the second product leaves, regenerating the enzyme. Substrate 1 may transfer a functional group to the enzyme (to form the covalently modified E’), which is subsequently transferred to substrate 2. This is called a Ping-Pong or double-displacement mechanism.

Sequential Kinetic Mechanism
• We cannot easily distinguish random from ordered • Random mechanisms in equilibrium will give
intersection point at y-axis • Lineweaver-Burk: lines intersect
• Steady-state kinetic analysis
of bisubstrate reactions. In
these double-reciprocal plots
(see Box 6-1), the concentration
of substrate 1 is varied while the
concentration of substrate 2 is
held constant. This is repeated
for several values of [S2],
generating several separate
lines. (a) Intersecting lines
indicate that a ternary complex is
formed in the reaction.
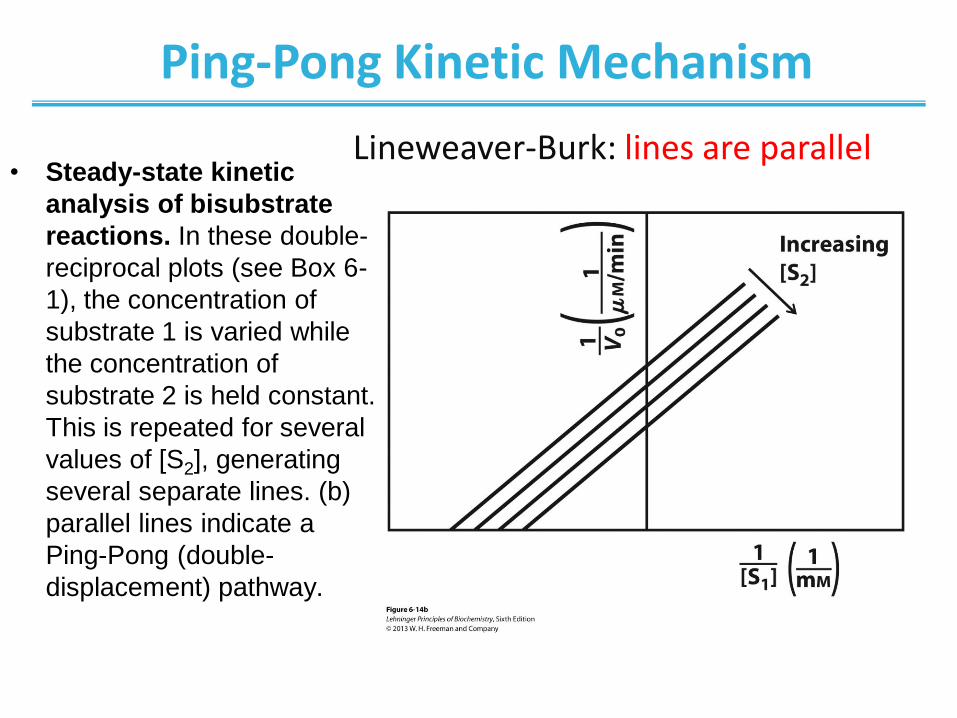
Ping-Pong Kinetic Mechanism
Lineweaver-Burk: lines are parallel • Steady-state kinetic
analysis of bisubstrate
reactions. In these double-
reciprocal plots (see Box 6-
1), the concentration of
substrate 1 is varied while
the concentration of
substrate 2 is held constant.
This is repeated for several
values of [S2], generating
several separate lines. (b)
parallel lines indicate a
Ping-Pong (double-
displacement) pathway.
Enzyme Inhibition
Inhibitors are compounds that decrease enzyme’s activity •Irreversible inhibitors (inactivators) react with the enzyme
• One inhibitor molecule can permanently shut off one enzyme molecule • They are often powerful toxins but also may be used as drugs
•Reversible inhibitors bind to and can dissociate from the enzyme • They are often structural analogs of substrates or products • They are often used as drugs to slow down a specific enzyme
•Reversible inhibitor can bind: • to the free enzyme and prevent the binding of the substrate • to the enzyme-substrate complex and prevent the reaction
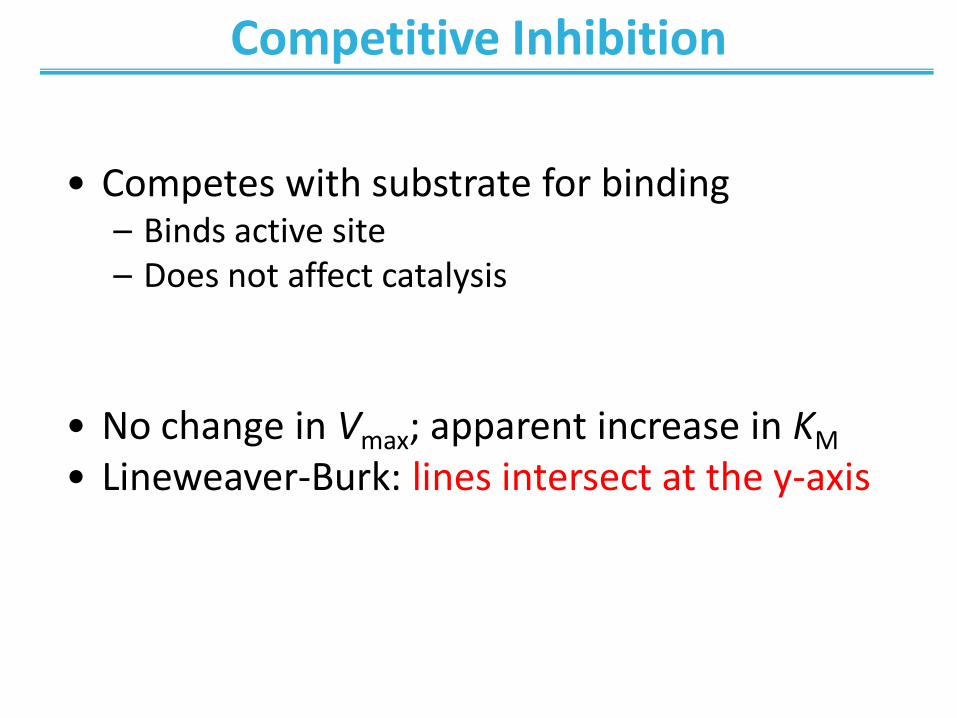
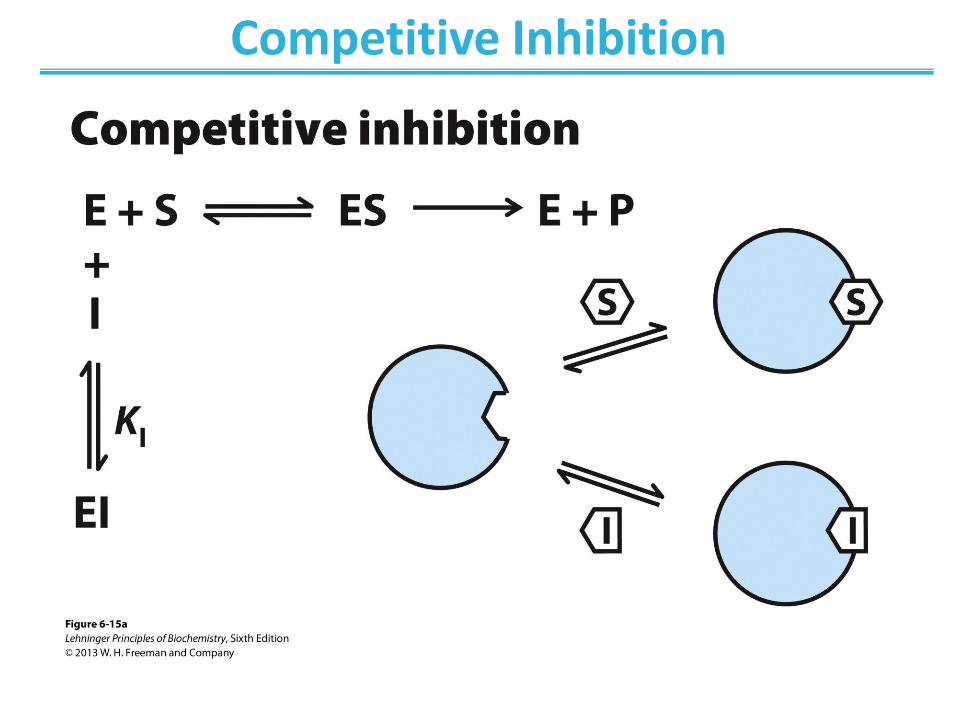
• Competes with substrate for binding – Binds active site – Does not affect catalysis
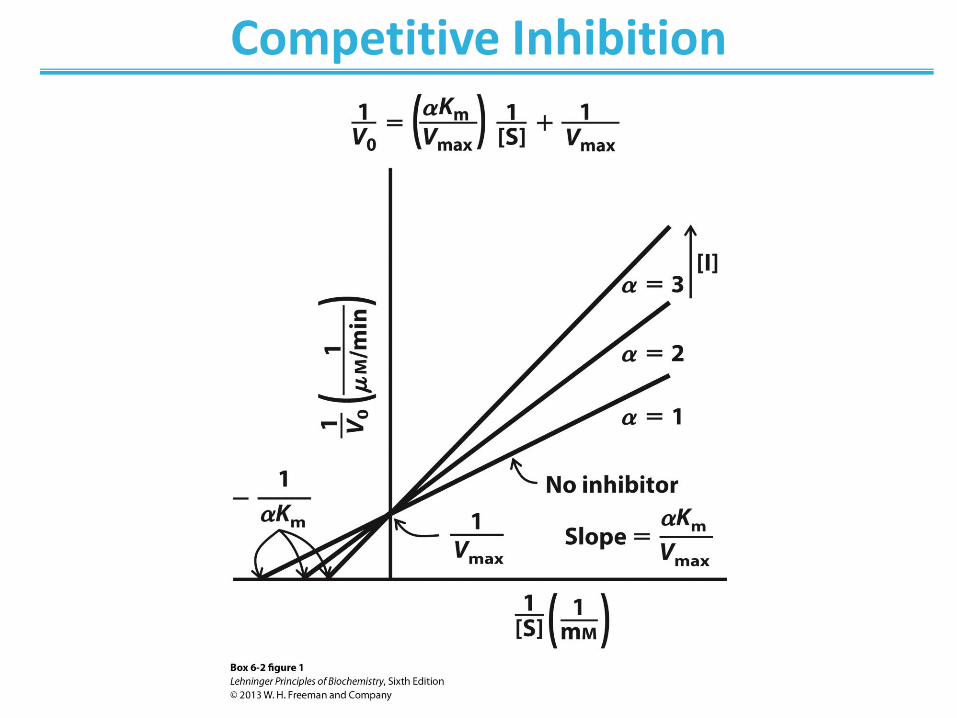
• No change in Vmax; apparent increase in KM
• Lineweaver-Burk: lines intersect at the y-axis
Competitive Inhibition
Competitive Inhibition
Competitive Inhibition
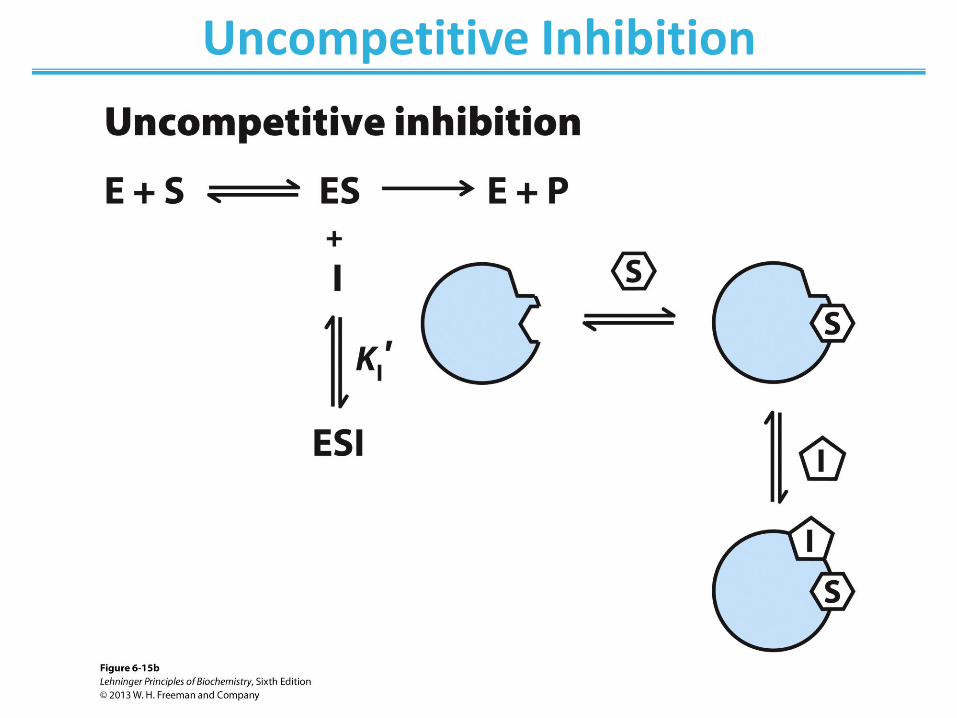
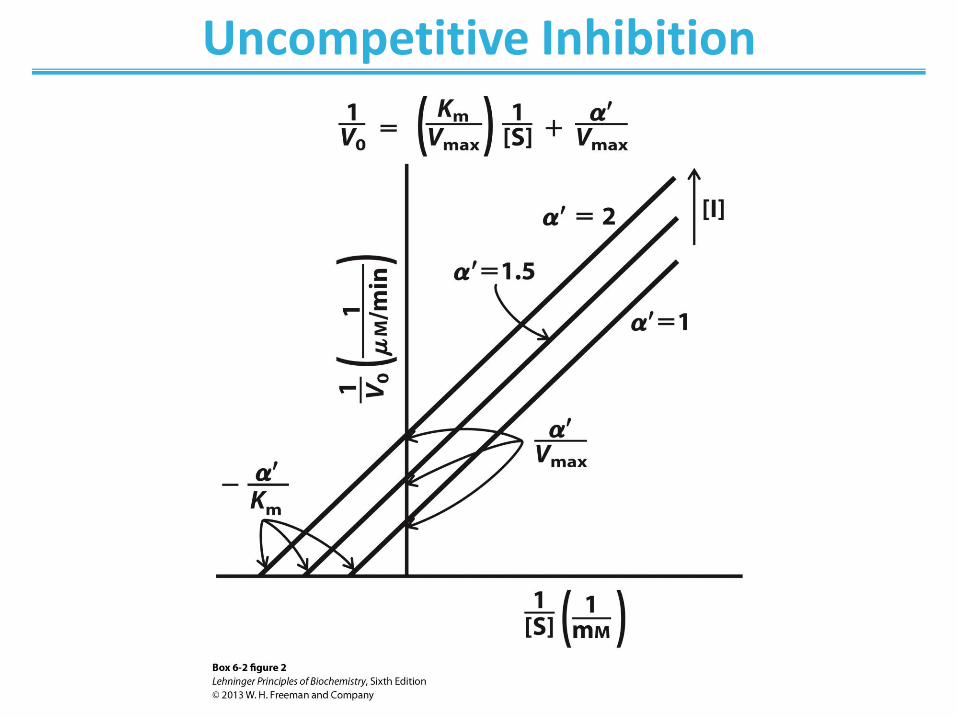
Uncompetitive Inhibition
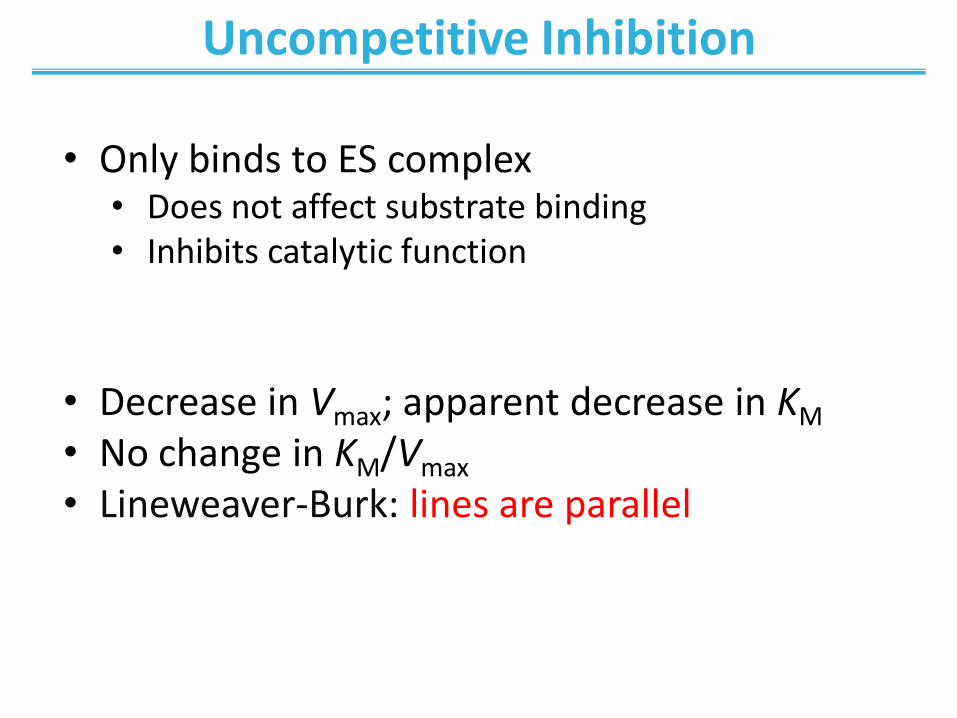
• Only binds to ES complex • Does not affect substrate binding • Inhibits catalytic function
• Decrease in Vmax; apparent decrease in KM
• No change in KM/Vmax • Lineweaver-Burk: lines are parallel
Uncompetitive Inhibition
Uncompetitive Inhibition
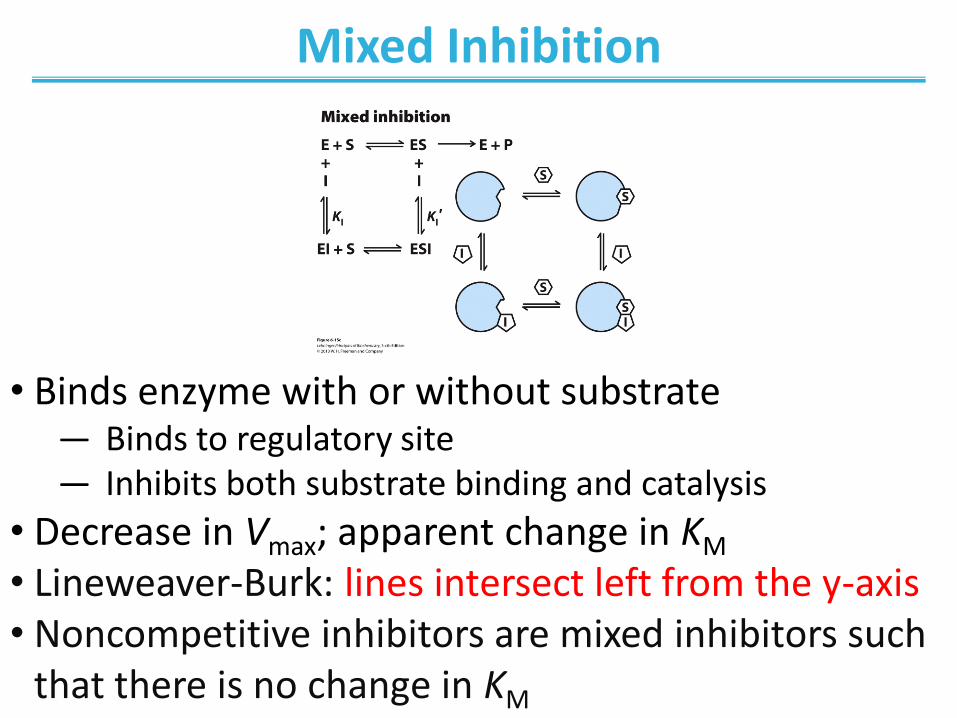
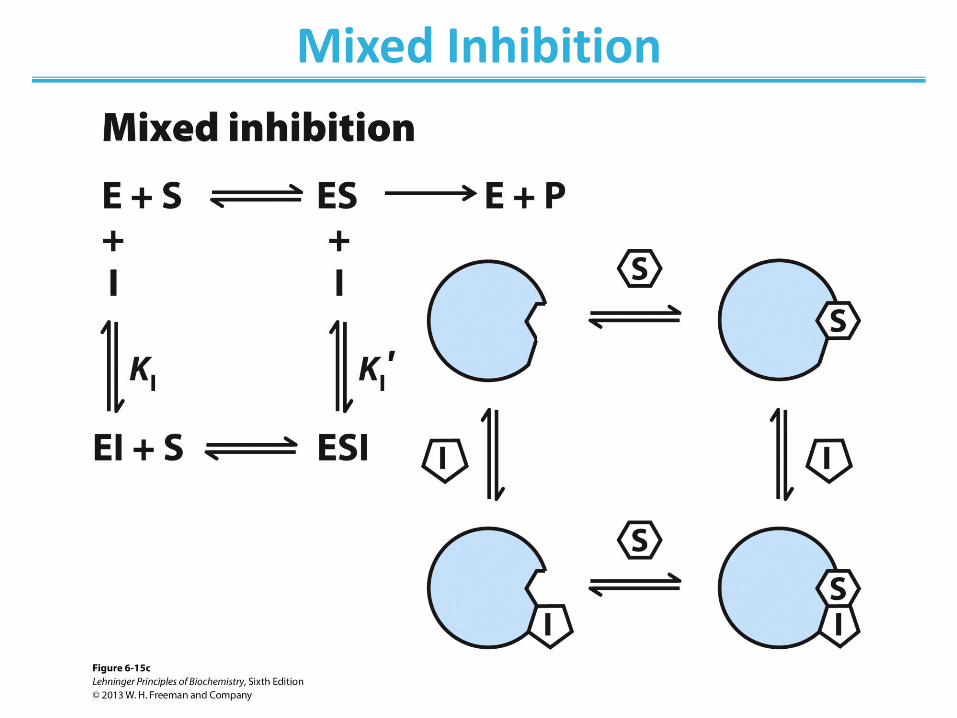
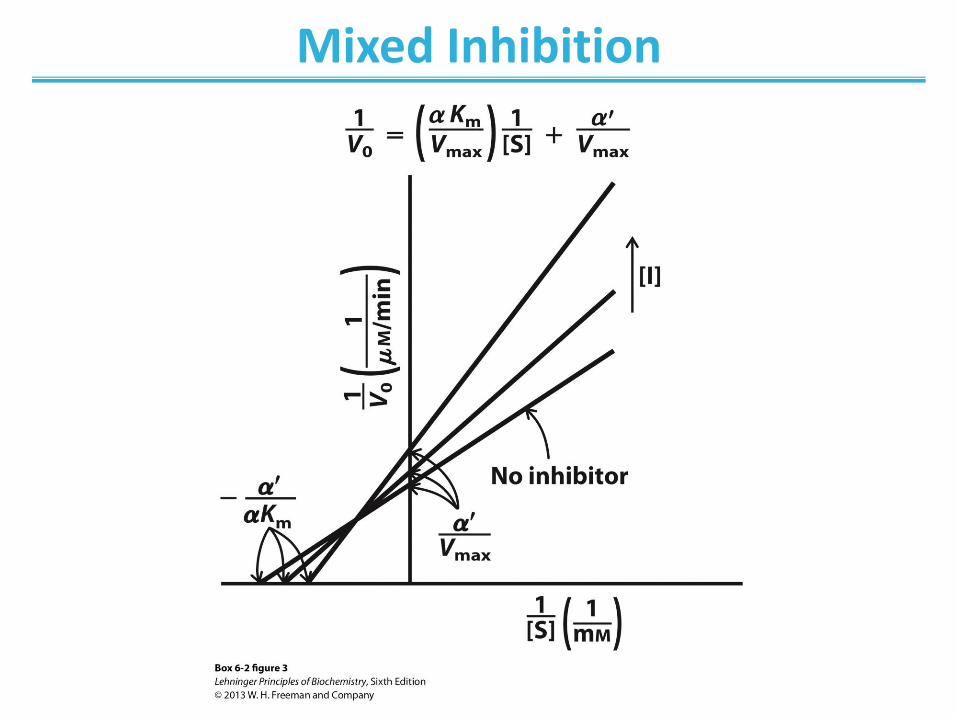
Mixed Inhibition
• Binds enzyme with or without substrate ― Binds to regulatory site ― Inhibits both substrate binding and catalysis
• Decrease in Vmax; apparent change in KM • Lineweaver-Burk: lines intersect left from the y-axis • Noncompetitive inhibitors are mixed inhibitors such
that there is no change in KM
Mixed Inhibition
Mixed Inhibition
Enzyme activity can be regulated
• Regulation can be: – noncovalent modification
– covalent modification
– irreversible
– reversible
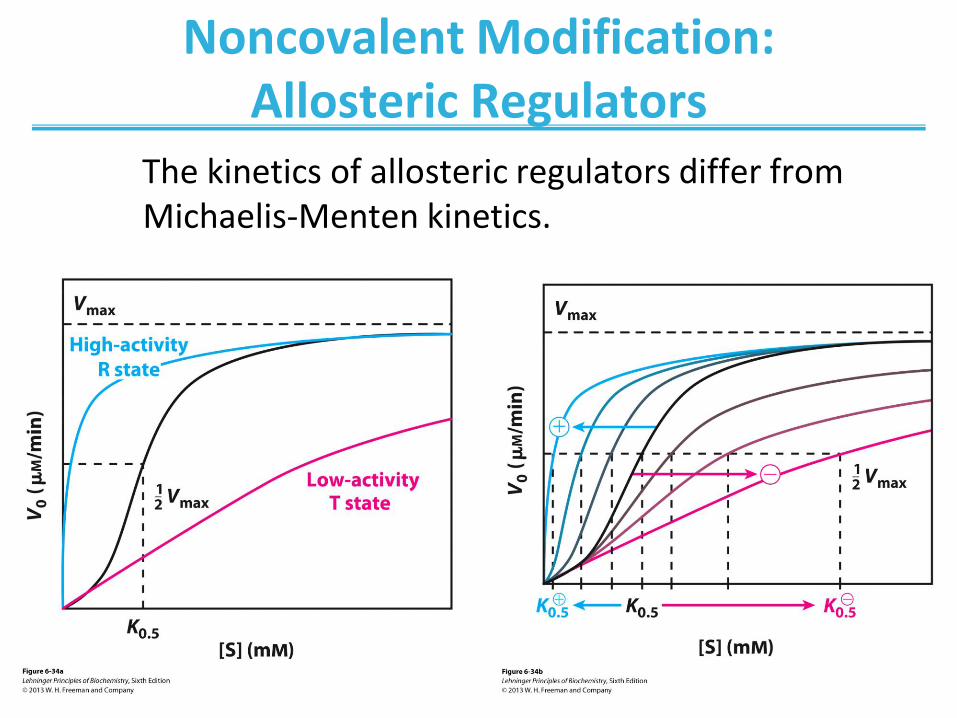
Noncovalent Modification: Allosteric Regulators
The kinetics of allosteric regulators differ from Michaelis-Menten kinetics.
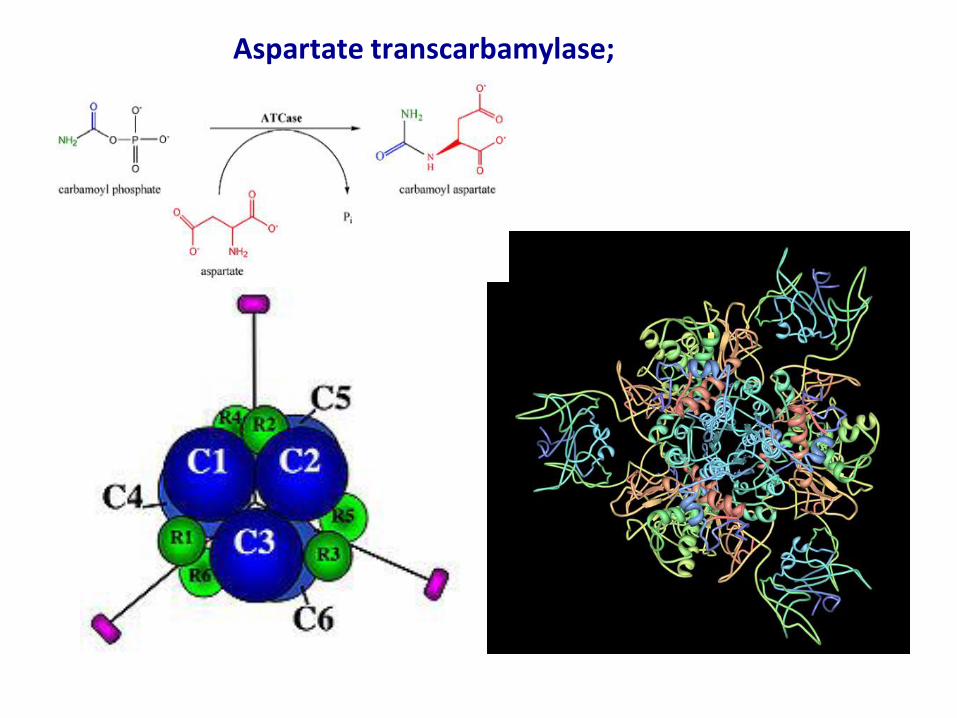
Aspartate transcarbamylase;
From previous slide
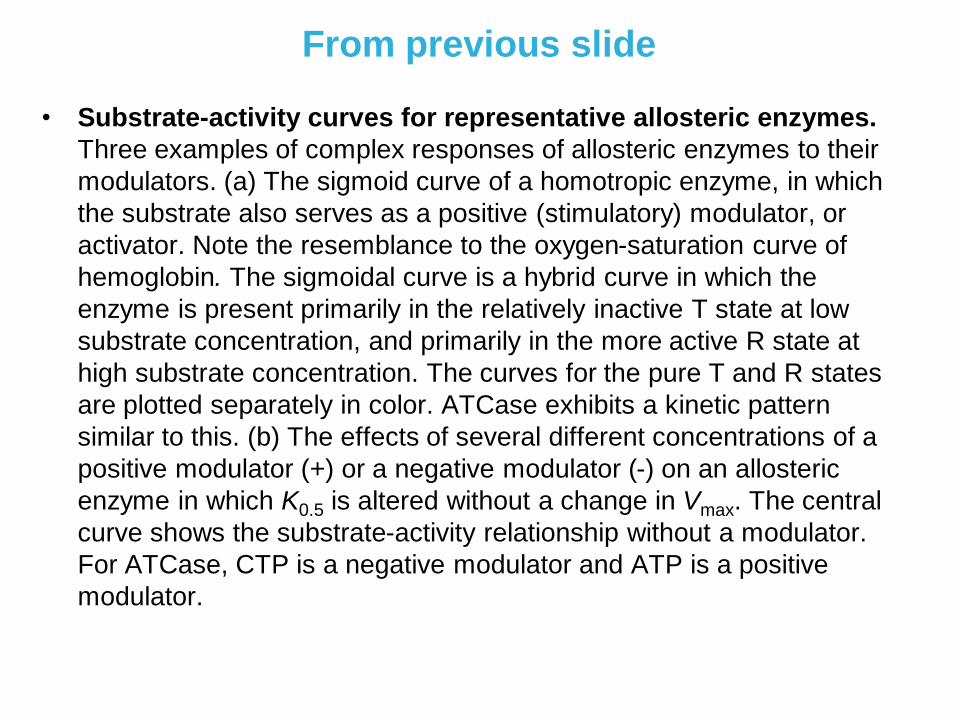
• Substrate-activity curves for representative allosteric enzymes.
Three examples of complex responses of allosteric enzymes to their
modulators. (a) The sigmoid curve of a homotropic enzyme, in which
the substrate also serves as a positive (stimulatory) modulator, or
activator. Note the resemblance to the oxygen-saturation curve of
hemoglobin. The sigmoidal curve is a hybrid curve in which the
enzyme is present primarily in the relatively inactive T state at low
substrate concentration, and primarily in the more active R state at
high substrate concentration. The curves for the pure T and R states
are plotted separately in color. ATCase exhibits a kinetic pattern
similar to this. (b) The effects of several different concentrations of a
positive modulator (+) or a negative modulator (-) on an allosteric
enzyme in which K0.5 is altered without a change in Vmax. The central
curve shows the substrate-activity relationship without a modulator.
For ATCase, CTP is a negative modulator and ATP is a positive
modulator.
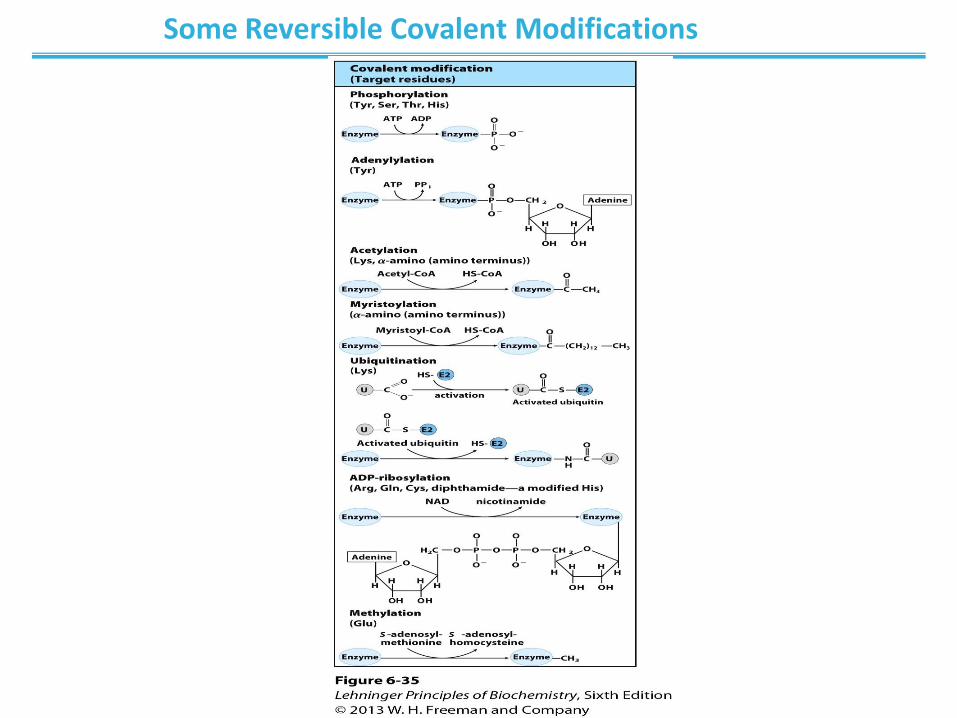
Some Reversible Covalent Modifications
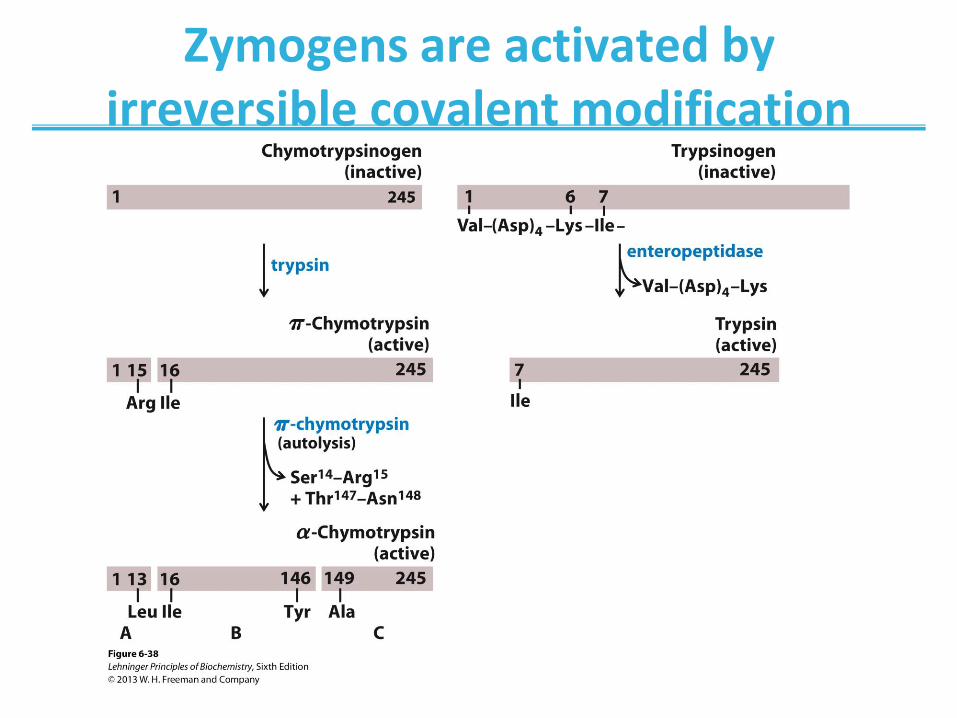
Zymogens are activated by irreversible covalent modification
From previous slide; Activation of zymogens by proteolytic cleavage.
• Shown here is the formation of chymotrypsin and trypsin from their zymogens, chymotrypsinogen and trypsinogen. The bars represent the amino acid sequences of the polypeptide chains, with numbers indicating the positions of the residues (the amino-terminal residue is number 1). Residues at the termini of the polypeptide fragments generated by cleavage are indicated below the bars. Note that in the final active forms, some numbered residues are missing. Recall that the three polypeptide chains (A, B, and C) of chymotrypsin are linked by disulfide bonds (see Fig. 6–19).
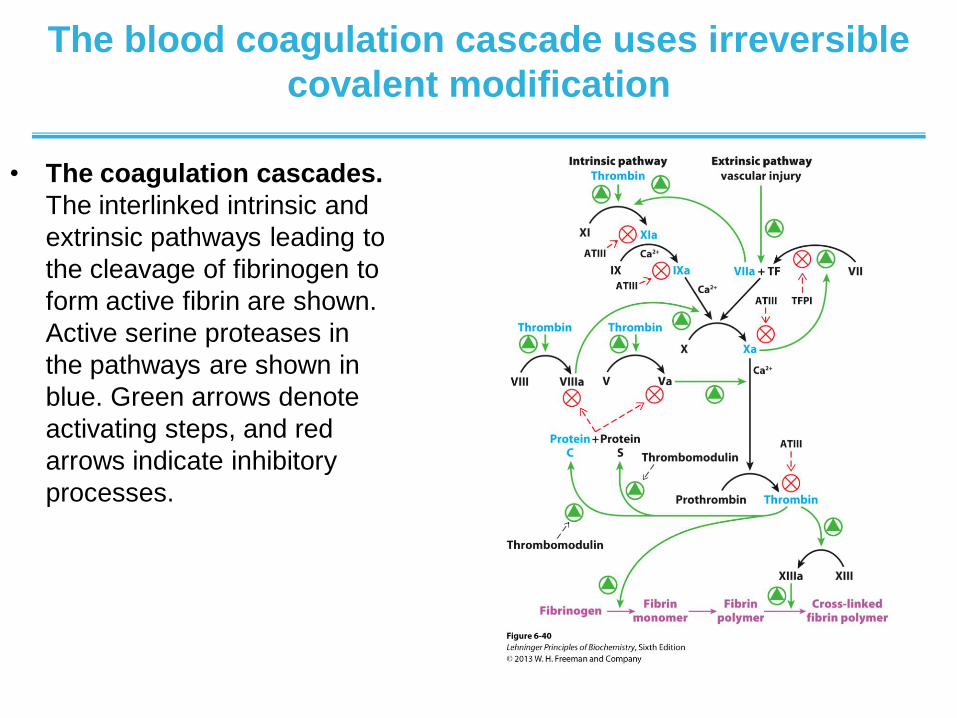
The blood coagulation cascade uses irreversible
covalent modification
• The coagulation cascades.
The interlinked intrinsic and
extrinsic pathways leading to
the cleavage of fibrinogen to
form active fibrin are shown.
Active serine proteases in
the pathways are shown in
blue. Green arrows denote
activating steps, and red
arrows indicate inhibitory
processes.
Some enzymes use
multiple types of regulation
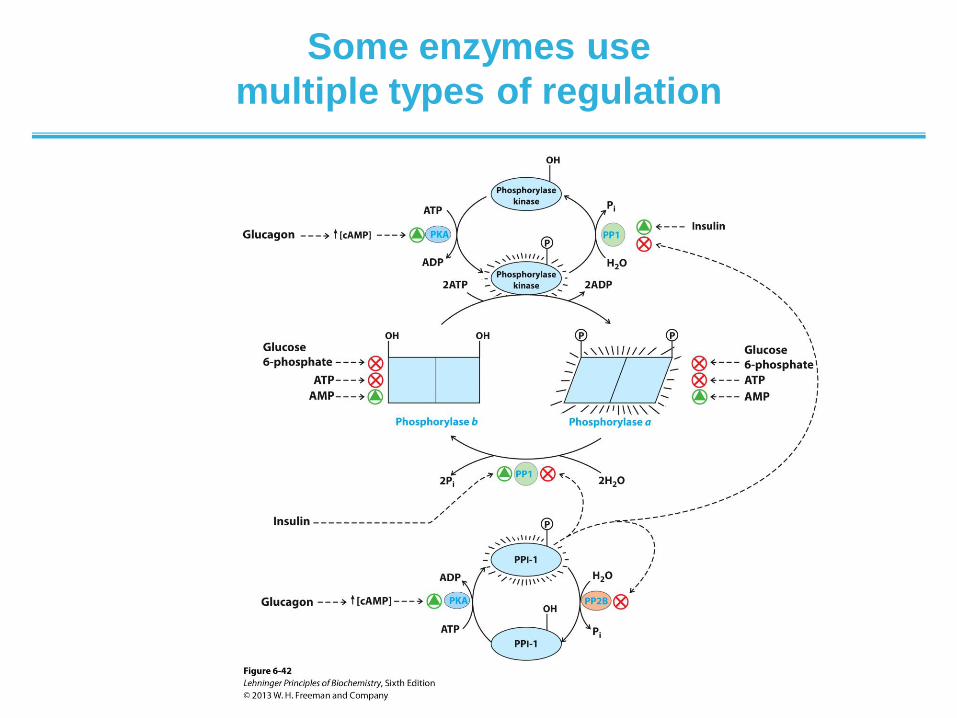
• Regulation of muscle glycogen phosphorylase activity by
phosphorylation. The activity of glycogen phosphorylase in muscle is
subjected to a multilevel system of regulation involving much more than the
covalent modification (phosphorylation) shown in Figure 6–36. Allosteric
regulation, and a regulatory cascade sensitive to hormonal status that acts on
the enzymes involved in phosphorylation and dephosphorylation, also play
important roles. The activity of both forms of the enzyme is allosterically
regulated by an activator (AMP) and by inhibitors (glucose 6-phosphate and
ATP) that bind to separate sites on the enzyme. The activities of phosphorylase
kinase and phosphorylase phosphatase 1 (PP1) are also regulated by covalent
modification, via a short pathway that responds to the hormones glucagon and
epinephrine. One path leads to the phosphorylation of phosphorylase kinase
and phosphoprotein phosphatase inhibitor 1 (PPI-1). The phosphorylated
phosphorylase kinase is activated and in turn phosphorylates and activates
glycogen phosphorylase. At the same time, the phosphorylated PPI-1 interacts
with and inhibits PP1. PPI-1 also keeps itself active (phosphorylated) by
inhibiting phosphoprotein phosphatase 2B (PP2B), the enzyme that
dephosphorylates (inactivates) it. In this way, the equilibrium between the a and
b forms of glycogen phosphorylase is shifted decisively toward the more active
glycogen phosphorylase a. Note that the two forms of phosphorylase kinase are
both activated to a degree by Ca2+ ion (not shown). This pathway is discussed
in more detail in Chapters 14, 15, and 23.