enzymatic activities and compostional properties of whole
TRANSCRIPT

University of Nebraska - LincolnDigitalCommons@University of Nebraska - LincolnDissertations, Theses, & Student Research in FoodScience and Technology Food Science and Technology Department
11-2018
Enzymatic Activities and Compostional Propertiesof Whole Wheat FlourRachana PoudelUniversity of Nebraska-Lincoln
Follow this and additional works at: http://digitalcommons.unl.edu/foodscidiss
This Article is brought to you for free and open access by the Food Science and Technology Department at DigitalCommons@University of Nebraska -Lincoln. It has been accepted for inclusion in Dissertations, Theses, & Student Research in Food Science and Technology by an authorizedadministrator of DigitalCommons@University of Nebraska - Lincoln.
Poudel, Rachana, "Enzymatic Activities and Compostional Properties of Whole Wheat Flour" (2018). Dissertations, Theses, & StudentResearch in Food Science and Technology. 97.http://digitalcommons.unl.edu/foodscidiss/97

ENZYMATIC ACTIVITIES AND COMPOSITIONAL PROPERTIES OF WHOLE WHEAT
FLOUR
by
Rachana Poudel
A DISSERTATION
Presented to the Faculty of
The Graduate College at the University of Nebraska
In Partial Fulfillment of Requirements
For the Degree of Doctor of Philosophy
Major: Food Science and Technology
Under the Supervision of Professor Devin J. Rose
Lincoln, Nebraska
November, 2018

ENZYMATIC ACTIVITIES AND COMPOSITIONAL PROPERTIES OF WHOLE WHEAT
FLOUR
Rachana Poudel, Ph.D.
University of Nebraska, 2018
Advisor: Devin J. Rose
The numerous enzymes present in the bran and germ fractions of a wheat kernel initiate
many chemical changes that affect the compositional and functional properties of whole wheat
flour. This dissertation was focused on enzyme activities and compositional properties of whole
wheat flour in different applications. In the first study, lipolytic activity, which leads to rancidity
during storage of wheat, was affected by environment, fungicide application, disease resistance
of cultivars, and the substrate being used in the assay. Subsequently, steaming of grains for 90 s
before milling was found to reduce lipolytic activities and accumulation of free fatty acids during
storage and reduce oxidation once the flour was made into a dough without affecting starch and
gluten properties. In another study, germination of wheat increased lipolytic activities and
affected several compositional and functional properties mainly due to germination time rather
than drying temperature. A small proportion of germinated flour added to a whole wheat bread
formulation was found to improve bread quality except when the flour from extensive
germination or higher inclusion percentage was used. Next, a sensory-driven approach was taken
to estimate the shelf-life of whole wheat flour. The estimated shelf life of whole wheat flour
stored at 35 °C ranged from 8-11 months and was dependent on the wheat cultivar. In a
comparative study between historical and modern wheat cultivars, minimal changes in
compositional properties (except for tryptophan) were found due to year of introduction. Finally,
evidence of the asparaginase activity in wheat kernels and their possible genotypic variation was

discovered. In conclusion, the enzymatic activities and compositional properties of whole wheat
flour were dependent on the genotype, environment, their interactions, and different processing
methods.

iii
ACKNOWLEDGMENTS
“Love the book you are reading and think big, dream big then you will find all the
adversaries too small to think about” these two suggestions by my brother, Bijay, paved my
thought process and had motivated me in each step of my life.
I would like to express my sincere gratitude to Dr. Rose for providing an opportunity in
his lab. Your guidance and suggestions had motivated and inspired me each day to explore more
in cereal science. I would like to extend my special thanks to my committee members Dr. Ozan
Ciftci, Dr. Andrea Bianchini, Dr. Teshome Regassa, Dr. P. Stephen Baenziger, and Dr. Yuzhen
Zhou. The regular meetings and suggestions on my research had helped me to develop
professionally. I appreciate Dr. Wehling, Dr. Martha Morton, and Dr. Sophie Alvarez, for
providing me suggestion related to cereals, helping with the NMR, and GC-MS, respectively.
Also, I would like to acknowledge Julie Reiling for helping me in the sensory panel and Marc
Walter for helping me in wheat quality and milling lab whenever needed. I am thankful to my lab
mates for the wonderful time that we spent in the office and of course in the lab.
I am heavily inspired from you, dad and mom. I am still amazed at the way you have
balanced your professional and personal life. You both are my best pals and I am thankful to you
for being my best friends and being there for me whenever needed. I appreciate my husband,
Madhav, for guiding and helping me throughout this journey. To meet you in our undergraduate
program and being together since then is one of the best things happened in my life. In the end, I
would like to thank God for providing a silver lining and a positive attitude whenever I felt low.
A huge respect and love to all of you!!!

iv
PREFACE
Introduction
Demand from consumers for healthier food options in recent years has created an
opportunity for food industries to launch healthy foods/snacks in the market. Of such, whole
grains have garnered huge interest from consumers, food companies, and researchers due to their
increased nutritive value and impacts on health (Hübner and Arendt, 2013; Ohm et al., 2016;
Slavin, 2004). According to the US National Data Survey, the use of whole grain has increased
by more than 50% since 2003-04 to 2013-14 (Whole Grain Statistics 2018). On a similar survey
by the International Food Information Council in 2017, 84% of consumers recognize whole
grains as healthy and health was the driving force to make any purchases in the stores (Whole
Grain Statistics 2018). The niche for foods based on whole grains is expected to grow in the
future at a compound annual growth rate of 6.6% (Stratistics, 2016). Currently, the total whole
wheat flour production is ~5% of total wheat flour production, however, it is expected to grow in
future to meet the market demand for whole wheat-based products (USDA 2018).
Although whole wheat flour is gaining a lot of interest, there are many challenges to
milling companies and the food industry. One of the challenges faced by the industry is the
stability of whole wheat flour during storage (Doblado-Maldonado et al., 2012). The
development of hydrolytic and oxidative rancidity during storage decreases the sensory
acceptability as well as the compositional and functional properties of flour (Doblado-
Maldonado et al., 2012; Heiniö et al., 2016; Jiang and Peterson, 2013; Tait and Galliard, 1988).
Due to these reasons, maintaining the quality of whole wheat flour to be used in product
development and formulations is a challenge to milling companies and the food industry.

v
In addition to the stability of whole wheat flour, the acrylamide concentration in baked
products is another major concern (Xu et al. 2016). Acrylamide is formed due to the Maillard
reaction between reducing sugars and free amino acids primarily asparagine (Stadler et al., 2002;
Tareke et al., 2002).
Besides above-mentioned challenges, wheat breeding programs have faced criticism from
the public that modern wheat may contain new components that have adverse impacts on human
health (Brouns et al., 2013). These challenges and criticisms negatively affect the quantity and
quality of whole wheat flour production and consumption. This present study is focused on the
stability of whole wheat flour during storage, the relationship between compositional properties
and year of introduction of wheat cultivars, and finally evidence of asparaginase activity in
wheat. Therefore, the objectives of this dissertation were:
1. To understand the effects of genotype, environment, management practices, and their
interactions on lipolytic activity in wheat. Lipase activity is mainly concentrated in the
pericarp region of a kernel (O’Connor and Harwood 1992), whereas lipoxygenase
activity is concentrated in the germ of wheat (Every et al. 2006). Lipoxygenase activity in
plants is associated with providing hydroperoxide substrates and volatile aldehydes for
the synthesis and activation of plant defense mechanisms against pathogens (Prost et al.
2005; Matsui 2006). Therefore, it was hypothesized that lipase and lipoxygenase
activities were influenced by growing conditions, fungicide application, and genotypic
differences among cultivars.
2. To observe the effects of steaming on the compositional and functional properties of
whole wheat flour. The accumulation of free fatty acids in flour during storage was
positively related with the initial lipase activity of flour (Tait and Galliard 1988).

vi
Reducing/inactivating lipase activity would be one of the methods to reduce the free fatty
acids accumulation. Therefore, it was hypothesized that steaming of grains (up to 90 s)
would be efficient in inactivating lipase activity, as they are located on outer part of a
grain, and whole wheat flour stored from such treated grains would have low free fatty
acid accumulation. Furthermore, it was hypothesized that steaming of grains for 90 s
would not be enough to penetrate moisture inside the kernel and hence would have a
minimal impact on the starch and gluten properties of flour and the original flour property
would be retained for a product development.
3. To observe the effects of germination on the compositional and functional properties of
whole wheat flour. Germination is a natural processing method to improve the nutritive
value of flour. However, increases in lipase and lipoxygenase activities may increase the
susceptibility of the flour toward rancidity, and increases in protease and amylase
activities increase the protein and starch degradation and decline the functionality of
flour. These changes to flour are dependent on germination conditions. Therefore, it was
hypothesized that the changes in flour composition and functionality due to germination
are related to germination time, drying temperature, and differences in wheat lots.
4. To estimate the shelf life of whole wheat flour based on sensory acceptability and relate
this with chemical changes in flour. It was hypothesized that particle size, storage
temperature, and wheat cultivars affect the shelf life of whole wheat flour by affecting
sensory acceptability of bread. Fine flour was expected to have a shorter shelf life
compared to coarse flour. Similarly, flour stored at elevated temperature was expected to
have a lower shelf life compared to flour stored at room temperature.

vii
5. To compare the compositional properties of historical and modern wheat cultivars. It was
hypothesized that compositional properties of historical and modern wheat cultivars were
the same and wheat breeding efforts over the years did not affect the quality of flour.
6. To explore the evidence of endogenous asparaginase activity in whole wheat flour. It was
hypothesized that asparaginase enzyme is present in wheat kernels and the activity can be
quantified by measuring the liberated ammonia from the hydrolysis of asparagine. Like
several other enzymes, variation in asparaginase activity was expected among diverse
wheat genotypes.
Organization of the dissertation
This dissertation includes seven chapters. The first four chapters focus on the lipolytic
activities and shelf life of whole wheat flour. Chapter 1 shows the genotype x environment
interactions for the lipase and lipoxygenase activities in whole wheat flour, which has been
published in Cereal Chemistry (Poudel et al. 2017). Chapter 2 showed the changes in lipolytic
degradation and functionality of whole wheat flour due to steaming of wheat kernels. This
chapter has been published in Food Chemistry (Poudel and Rose, 2018). Chapter 3 describes the
effect of germination time and drying temperature on the compositional and functional properties
of whole wheat flour. This chapter is currently under review in Journal of Cereal Science.
Chapter 4 shows the estimation of the shelf life of whole wheat flour using sensory evaluation.
This chapter is formatted using the Journal of Sensory Studies guidelines. Chapter 5 describes
the comparison between historical and modern wheat cultivars based on metabolites profiled
using 1H NMR, and Chapter 6 describes a preliminary protocol to quantify asparaginase activity
in whole wheat flour. Chapters 5 and 6 are formatted using Journal of Cereal Science guidelines.
The overall findings from each chapter are included in Chapter 7.

viii
References
Brouns, F.J.P.H., van Buul, V.J., Shewry, P.R., 2013. Does wheat make us fat and sick? Journal
of Cereal Science 58, 209–215. https://doi.org/10.1016/j.jcs.2013.06.002
Doblado-Maldonado, A.F., Pike, O.A., Sweley, J.C., Rose, D.J., 2012. Key issues and challenges
in whole wheat flour milling and storage. Journal of Cereal Science 56, 119–126.
https://doi.org/10.1016/j.jcs.2012.02.015
Heiniö, R.L., Noort, M.W.J., Katina, K., Alam, S.A., Sozer, N., de Kock, H.L., Hersleth, M.,
Poutanen, K., 2016. Sensory characteristics of wholegrain and bran-rich cereal foods – A review.
Trends in Food Science & Technology 47, 25–38. https://doi.org/10.1016/j.tifs.2015.11.002
Hübner, F., Arendt, E.K., 2013. Germination of Cereal Grains as a Way to Improve the
Nutritional Value: A Review. Critical Reviews in Food Science and Nutrition 53, 853–861.
https://doi.org/10.1080/10408398.2011.562060
Jiang, D., Peterson, D.G., 2013. Identification of bitter compounds in whole wheat bread. Food
Chem 141, 1345–1353. https://doi.org/10.1016/j.foodchem.2013.03.021
Ohm, J.-B., Lee, C.W., Cho, K., 2016. Germinated Wheat: Phytochemical Composition and
Mixing Characteristics. Cereal Chemistry Journal 93, 612–617. https://doi.org/10.1094/CCHEM-
01-16-0006-R
Slavin, J., 2004. Whole grains and human health. Nutrition Research Reviews 17, 99.
https://doi.org/10.1079/NRR200374
Stadler, R.H., Blank, I., Varga, N., Robert, F., Hau, J., Guy, P.A., Robert, M.-C., Riediker, S.,
2002. Acrylamide from Maillard reaction products. Nature 419, 449–450.

ix
Stratistics. 2016. Whole grain and high fiber—Global market outlook (2015–2022).
www.strategymrc.com/report/whole-grain-and-high-fibermarket. Stratistics: Gaithersburg, MD.
https://doi.org/10.1038/419449a
Tait, S.P.C., Galliard, T., 1988. Effect on baking quality of changes in lipid composition during
wholemeal storage. Journal of Cereal Science 8, 125–137. https://doi.org/10.1016/S0733-
5210(88)80023-7
Tareke, E., Rydberg, P., Karlsson, P., Eriksson, S., Törnqvist, M., 2002. Analysis of acrylamide,
a carcinogen formed in heated foodstuffs. J. Agric. Food Chem. 50, 4998–5006.
USDA. 2018. Flour milling products: 2017 summary.
http://usda.mannlib.cornell.edu/usda/current/FlourMillAnn/FlourMillAnn-05-02-2016.pdf.
USDA: Washington, DC.
Whole Grain Statistics | The Whole Grains Council
https://wholegrainscouncil.org/newsroom/whole-grain-statistics (accessed 10.16.18).
x
TABLE OF CONTENTS
LIST OF TABLES ........................................................................................................... xiv
LIST OF FIGURES ......................................................................................................... xvi
CHAPTER 1 INFLUENCE OF FOLIAR FUNGICIDE TREATMENT ON LIPOLYTIC
ENZYME ACTIVITY OF WHOLE WHEAT ................................................................... 1
1.1. ABSTRACT ......................................................................................................................... 1
1.2. INTRODUCTION ................................................................................................................ 2
1.3. MATERIALS AND METHODS ......................................................................................... 4
1.3.1. Experimental design ...................................................................................................... 5
1.3.2. Weather and agronomic data ......................................................................................... 5
1.3.3. Kernel characteristics .................................................................................................... 6
1.3.4. Lipase activity using olive oil substrate ........................................................................ 6
1.3.5. Lipase activity using p-nitrophenyl palmitate as substrate ............................................ 6
1.3.6. Esterase activity using p-nitrophenyl butyrate as substrate ........................................... 7
1.3.7. Lipoxygenase activity .................................................................................................... 8
1.3.8. Data analysis .................................................................................................................. 8
1.4. RESULTS............................................................................................................................. 8
1.4.1. Weather and agronomic data ......................................................................................... 9
1.4.2. Kernel characteristics .................................................................................................. 10
1.4.3. Lipase activity using olive oil substrate ...................................................................... 10
1.4.4. Lipase activity using p-nitrophenyl palmitate as substrate .......................................... 11
1.4.5. Esterase activity using p-nitrophenyl butyrate as substrate ......................................... 11
1.4.6. Lipoxygenase activity .................................................................................................. 11
1.4.7. Correlations among response variables ....................................................................... 12
1.5. DISCUSSION .................................................................................................................... 12
1.6. CONCLUSION .................................................................................................................. 15
1.7. REFERENCES ................................................................................................................... 16
CHAPTER 2 CHANGES IN ENZYMATIC ACTIVITIES AND FUNCTIONALITY OF
WHOLE WHEAT FLOUR DUE TO STEAMING OF WHEAT KERNELS
..................................................................................... …………………………………..30
2.1. ABSTRACT ....................................................................................................................... 30
2.2. INTRODUCTION .............................................................................................................. 31

xi
2.3. MATERIALS AND METHODS ....................................................................................... 33
2.3.1. Chemicals and reagents ............................................................................................... 33
2.3.2. Sample preparation and treatment ............................................................................... 33
2.3.3. Enzymatic activities in fresh whole wheat flour ......................................................... 34
2.3.4. Functional properties of fresh whole wheat flour ........................................................ 35
2.3.5. Products of lipolytic degradation in stored whole wheat flour .................................... 36
2.3.6. Data analysis ................................................................................................................ 37
2.4. RESULTS AND DISCUSSION ........................................................................................ 38
2.4.1. Moisture content in grains and flour ............................................................................ 38
2.4.2. Enzymatic activities in fresh whole wheat flour ......................................................... 39
2.4.3. Functional properties of fresh whole wheat flour ........................................................ 39
2.4.4. Products of lipolytic degradation in stored whole wheat flour .................................... 41
2.5. CONCLUSIONS ................................................................................................................ 42
2.6. REFERENCES ................................................................................................................... 43
CHAPTER 3 GERMINATION TIME AND DRYING TEMPERATURE AFFECT
COMPOSITIONAL AND FUNCTIONAL PROPERTIES OF GERMINATED WHEAT
FLOUR…………………………………………………………………………………………..53
3.1. ABSTRACT ....................................................................................................................... 53
3.2. INTRODUCTION .............................................................................................................. 54
3.3. EXPERIMENTAL ............................................................................................................. 55
3.3.1. Chemicals and reagents ............................................................................................... 55
3.3.2. Germination procedure and sample preparation .......................................................... 55
3.3.3. Composition of germinated flours ............................................................................... 56
3.3.4. Enzyme activities of germinated flour......................................................................... 58
3.3.5. Mixing properties of germinated flours ....................................................................... 58
3.3.6. Mixing and baking properties of composite flours ...................................................... 58
3.3.7. Statistical analysis........................................................................................................ 59
3.4. RESULTS AND DISCUSSION ........................................................................................ 60
3.4.1. Composition of germinated flour ................................................................................ 60
3.4.2. Lipase, esterase, and lipoxygenase activities of germinated flour .............................. 63
3.4.3. Mixing properties of germinated flour ........................................................................ 65
3.4.4. Multivariate analysis of compositional, enzymatic, and mixing properties of
germinated flours ................................................................................................................... 66

xii
3.4.5. Mixing properties, falling number, and bread characteristics of composite flours …..66
3.4.6. Multivariate analysis of mixing properties, falling number, and bread characteristics
of composite flours .............................................................................................................. ..69
3.5. CONCLUSION .................................................................................................................. 70
3.6. REFERENCES……………………………………………………………………………72
CHAPTER 4 SENSORY-DRIVEN SHELF-LIFE ESTIMATION OF WHOLE WHEAT
FLOUR…………………………………………………………………………………………..82
4.1. Abstract …………………………………………………………………………………...82
4.2. Introduction ........................................................................................................................ 83
4.3. Materials and Methods ....................................................................................................... 84
4.3.1. Preparation of whole wheat flour, storage, and sampling ........................................... 84
4.3.2. Sensory evaluation of the bread................................................................................... 85
4.3.3. Lactic acid solvent retention capacity (LA-SRC) ........................................................ 85
4.3.4. Free fatty acids on whole wheat flour ......................................................................... 85
4.3.5. Statistical analysis........................................................................................................ 86
4.4. RESULTS AND DISCUSSION ........................................................................................ 87
4.4.1. Estimated shelf life of whole wheat flours stored at room temperature and 35 ºC ..... 88
4.4.2. Moisture content of whole wheat flour during storage. ............................................... 88
4.4.3. Accumulation of free fatty acids during storage. ........................................................ 90
4.4.4. Lactic acid SRC values of whole wheat flour during storage. .................................... 90
4.5. CONCLUSIONS ................................................................................................................ 91
4.6. REFERENCES ................................................................................................................... 93
CHAPTER 5 WHEAT METABOLITES PROFILING IN HISTORICAL AND MODERN
WHEAT CULTIVARS USING PROTON NUCLEAR MAGNETIC RESONANCE (1H NMR)
SPECTROSCOPY
…………………………………………………………………………………………………..103
5.1. ABSTRACT ..................................................................................................................... 103
5.2. INTRODUCTION ............................................................................................................ 104
5.3. MATERIALS AND METHODS ..................................................................................... 105
5.3.1. Plant materials ........................................................................................................... 105
5.3.2. Grain yield, grain volume weight, and grain protein concentration .......................... 106
5.3.3. 1H NMR sample preparation, profiling, and selected metabolites in whole wheat flour
............................................................................................................................................. 106
5.3.4. Statistical analysis...................................................................................................... 107

xiii
5.4. RESULTS AND DISCUSSION ...................................................................................... 107
5.4.1. Changes in grain yield, grain volume weight, and grain protein concentration with
cultivar year of introduction ................................................................................................ 107
5.4.2. Changes in wheat metabolites including total amino acid, carbohydrate, phenolic
acids, and carboxylic acid with cultivar year of introduction .............................................. 108
5.4.3. Multivariate analysis of wheat metabolites, grain yield, grain volume weight, and
grain protein concentration of cultivars. .............................................................................. 110
5.5. CONCLUSION .............................................................................................................. ..111
5.6. REFERENCES ................................................................................................................. 112
CHAPTER 6 PRELIMINARY EVIDENCE OF ASPARAGINASE ACTIVITY IN WHOLE
WHEAT FLOUR
…………………………………………………………………………………………………..122
6.1. ABSTRACT ..................................................................................................................... 122
6.2. INTRODUCTION ............................................................................................................ 123
6.3. MATERIALS AND METHODS ..................................................................................... 124
6.3.1. Development of the protocol ..................................................................................... 124
6.4. RESULTS......................................................................................................................... 126
6.4.1. Challenges during the protocol development ............................................................ 126
6.4.2. Asparaginase activity ................................................................................................. 126
6.4.3. Future plans ............................................................................................................... 126
6.5. REFERENCES ................................................................................................................. 127
CHAPTER 7 OVERALL CONCLUSIONS AND FUTURE INSIGHTS……………………..133

xiv
LIST OF TABLES
Table 1.1. Mean temperature and total precipitation in two growing seasons (2014 and 2015) at
Havelock, Lincoln, NE USA.A………………………………………………………………….21
Table 1.2. Analysis of variance (mean squares) for disease severity, enzyme activities and falling
number.A…………………………………………………………………………………………22
Table 1.3. Pearson partial correlation coefficients (year as a partial variable) among response
variables.A………………………………………………………………………………………..23
Table 2.1. Mean values of differential scanning calorimeter (DSC) gelatinization endotherms
and rapid visco analyzer (RVA) pasting properties of untreated and steam-treated whole wheat
flours.A ………………………………………………………………………………………….47
Table 3.1. Analysis of variance (mean squares) of measured variables on 100% germinated
flour…………………………………………………………………………………………….76
Table 3.2. Falling number and bread characteristics and of composite flours made by mixing
ungerminated whole wheat flour and germinated whole flours from different germination time
(GT) and at different proportions (amount)……………………………………………………77
Table 4.1. The number of acceptable (+) and unacceptable (-) responses and percent
acceptability (% ‘+’) of the whole wheat bread made from flour stored at room temperature for
different lengths of time…………………………………………………………………………97
Table 4.2. The number of acceptable (+), unacceptable (-) responses, and percentage
acceptability (% ‘+’) of the whole wheat bread at different time points made from stored flour at
35 ºC temperature………………………………………………………………………………98
Table 4.3. Analysis of variance (mean squares) of measured variables on whole wheat flourA..99
Table 5.1. Selected historical and modern wheat cultivars and their released year……………116

xv
Table 5.2. Metabolites identified in modern and old wheat varieties from 1H NMR……...…..117
Table 5.3. Analysis of variance (mean squares) on metabolites (mg/kg) on whole wheat flour,
grain yield (kg/ha), grain volume weight (GVW) (kg/hl), and grain protein concentration
(%)A……………………………………………………………………………………………118
Table 5.4. Regression analysis parameters for relationships of wheat metabolites, grain yield,
grain volume weight, protein concentration and released year (RY)…………………………..119
Table 6.1. Mean absorbance readings of wheat cultivars and their respective blanks during
asparaginase activity assay……………………………………………………………………..131

xvi
LIST OF FIGURES
Figure 1.1. Plots of significant cultivar, treatment, and year effects on measured agronomic
characteristics: disease severity (DS; a-c) and flowering date (FD; d); F0 = no fungicide
application; F1 = fungicide application; means with different letters are significantly different
within each subplot…………………………………………………………………………….25
Figure 1.2. Plots of significant cultivar, treatment, and year effects on measured kernel
characteristics: total grain protein (TGP; a), thousand kernel weight (TKW; b-c) and falling
number (D); F0 = no fungicide application; F1 = fungicide application; means with different
letters are significantly different within each subplot……………………………………………26
Figure 1.3. Plots of significant cultivar, treatment, and year effects on lipase activity measured
with olive oil (LA-O; a-b) or p-nitrophenyl palmitate (LA-P; c) as substrate; F0 = no fungicide
application; F1 = fungicide application; means with different letters are significantly different
within each subplot……………………………………………………………………………..27
Figure 1.4. Plot of significant cultivar, treatment, and year effects on esterase activity measured
with p-nitrophenyl butyrate as substrate (EA-B) as substrate; F0 = no fungicide application; F1 =
fungicide application; means with different letters are significantly different within each
subplot…………………………………………………………………………………………..28
Figure 1.5. Plot of significant cultivar, treatment, and year effects on lipoxygenase (LOX)
activity; F0 = no fungicide application; F1 = fungicide application; means with different letters
are significantly different within each subplot………………………………………………….29
Figure 2.1. Flow diagram of experimental design………………………………………………48
Figure 2.2. Reduction in enzyme activities as a function of time of steaming: (a) lipase using p-
nitrophenyl palmitate (LA-P), olive oil (LA-O), and esterase using p-nitrophenyl butyrate (EA-

xvii
B) as substrates; (b) lipoxygenase (LOX); (c) polyphenol oxidase (PPO); and (d) peroxidase
(POD); within each subfigure points labeled with different lower-case letters are significantly
different at α=0.05. …………………………………………………………………………….49
Figure 2.3. Products of lipid degradation measured in stored whole wheat flours that were milled
from untreated or steam-treated wheat: (a) free fatty acids (FFA); (b) conjugated dienes (CD); (c)
peroxide value (PV); and (d) hexanal; within each subfigure bars labeled with different lower-
case letters are significantly different at α=0.05………………………………………………..50
Figure 2.4. Carbonyl compounds produced in dough made from stored whole wheat flours that
were milled from untreated or steam-treated wheat; bars labeled with different lower-case letters
are significantly different at α=0.05…………………………………………………………….51
Figure 2.5. Influence of steaming on gluten protein properties: (a) lactic acid solvent retention
capacity (SRC); (b) extractability of gliadin-rich fraction; and (c) extractability of glutenin-rich
fraction; within each subfigure no bars are significantly different at α=0.05……………………52
Figure 3.1. Composition of ungerminated and germinated whole wheat flours; only factors
(wheat lot, germination duration, drying temperature) with significant effects are shown (see
Table 1 for ANOVA results); A) phytic acid; B, C) thiamine; D) available lysine; E) asparagine;
F) γ- aminobutyric acid; within subfigure, bars marked with different letters are significantly
different (p<0.05)………………………………………………………………………………..78
Figure 3.2. Lipolytic activities of ungerminated and germinated whole wheat flours; only factors
(wheat lot, germination time, drying temperature) with significant effects are shown (see Table 1
for ANOVA results); A, B) lipase activity measured with olive oil as the substrate; C) lipase
activity measured with p-nitrophenyl palmitate as the substrate; D, E) esterase activity; F)

xviii
lipoxygense activity; within subfigure, bars marked with different letters are significantly
different (p<0.05)…………………………………………………………………………...……79
Figure 3.3. Principal components analysis biplot based on composition, enzymatic activities, and
mixing properties of germinated flour. GABA= γ-aminobutyric acid; LA-P= lipase activity
measured with p-nitrophenyl palmitate as the substrate; LA-O= lipase activity measured with
olive oil as the substrate; EA-B= esterase activity; LOX= lipoxygenase activity; MPV= midline
peak value; MPT= midline peak time………………………………………………………...….80
Figure 3.4. Principal component analysis biplot based on mixing and baking properties of bread
made from the composite flour. Composite flour is the mixture of ungerminated whole wheat
flour and germinated flour from 24 h, 48 h, and 72 h of germination at 2, 5, and 10%. MPV=
midline peak value; MPT= midline peak time; SB= slice brightness; FN= falling number; LV=
loaf volume; Hmax= height; TC= total concavity; Cell volume= cell volume (map); NCE= net
cell elongation; TOPC= top concavity; Texture= bread texture…………………………………81
Figure 4.1. Moisture content of the whole wheat flour during storage at room and 35 ºC
temperatures……………………………………………………………………………………100
Figure 4.2. Effect of particle size and cultivar (2A), time and cultivar (2B), storage time and
particle size (2C), and storage temperature and cultivar (2D) on the accumulation of free fatty
acid of whole wheat flour; within each subfigures bar labelled with different lowercase letters
were significantly different at α=0.05 level of significance……………………………………101
Figure 4.3. Effect of particle size and cultivar (3A), storage temperature and cultivar (3B),
storage time and cultivar (3C), storage time and temperature (3D) on gluten strength as given by
lactic acid- solvent retention capacity (LA-SRC); within each subfigures bar labelled with
different lowercase letters were significantly different at α=0.05 level of significance………..102

xix
Figure 5.1. Principal component biplot analysis based on measured metabolites (mg/Kg), grain
yield (Kg/ha), grain volume weight (GVW) (Kg/hL), grain protein concentration (%), and three
groups of wheat cultivars based on their released year…………………………………………120
Figure 5.2. Relationship between cultivar year of introduction and Eigenvalues on principal
component (PC) 1 from PC analysis based on the metabolic composition of the cultivars…..121
Figure 6.1. Asparaginase activity in whole wheat flour among four wheat cultivars. Different
lowercase results in each bar represented significant differences at P- value=0.05. …………..132

1
CHAPTER 1 INFLUENCE OF FOLIAR FUNGICIDE TREATMENT ON LIPOLYTIC
ENZYME ACTIVITY OF WHOLE WHEAT
1.1. ABSTRACT
Lipolytic enzymes play a key role in the deterioration of whole wheat flour upon storage
but may also be involved in plant disease and stress tolerance while the crop is in the field.
Therefore, the purpose of this study was to determine the effect of foliar fungicide treatment on
lipolytic activity in wheat. A significant cultivar x fungicide x year interaction for esterase [p-
nitrophenyl butyrate (EA-B) as substrate] and lipoxygenase (LOX) activities was observed;
however, a large portion of the variability was due to year (environment). Fungicide influenced
lipase [olive oil as substrate (LA-O)], EA-B, and LOX activities. Lipase [p-nitrophenyl palmitate
(LA-P) as substrate] showed variation in terms of cultivar and year rather than the application of
fungicide. Partial correlation (year as a partial variable) between LA-P and EA-B activities was
observed (r=0.78, p<0.001), although neither was correlated with LA-O. The influence of foliar
fungicide on lipolytic enzyme activities depends mostly on growing conditions, but is also
affected by disease stress, disease resistance of the varieties tested, and the substrate being used
in the assay.

2
1.2. INTRODUCTION
The 2015 Dietary Guidelines for Americans (USDA and USDHHS 2015) recommended
the consumption of at least half of grain-based foods as whole grains. In a 2015 survey of 1,510
US adults, 63% of respondents indicated that they consume whole grains at least half of the time
and 31% indicated that they nearly always choose whole grains (Whole Grains Council 2015).
This was in contrast to only 4% in 2010. Additionally, the market for whole grain and high fiber
foods is expected to grow at a compound annual growth rate of 6.6% through 2022 (Stratistics
2016). Thus, although whole wheat flour production is only about 6% of total wheat flour
production today (USDA 2016), it can be expected to grow to meet consumer demands.
Whole wheat flour includes the bran and germ fractions of the kernel together with the
endosperm. A majority of the enzymatic activities are present in the bran and germ fractions of
wheat (O’Connor and Harwood 1992; Every et al 2006) and may contribute to the functionality
of whole flours (Hansen and Rose 1996; Tait and Galliard 1988). Of particular relevance is the
activity of lipolytic enzymes in the bran and germ, which have been the subject of study for
many years, and can contribute to whole wheat flour deterioration (Tait and Galliard 1988).
Lipolytic enzymes play a vital role in the functional changes in whole wheat (Triticum
aestivium L.) flour during storage (Doblado-Maldonado et al 2013). Lipase (triacylglycerol
hydrolase, EC 3.1.1.3) contributes hydrolytic rancidity to whole wheat flour by producing free
fatty acids through the hydrolysis of triacylglycerols (O’Connor et al 1992). Subsequently,
linoleic and linolenic acids generated by lipase can be oxidized by lipoxygenase (LOX, EC
1.13.11.12) in hydrated flour (Gardner 1987). Ultimately, hydrolytic and oxidative mediated
degradation (collectively lipolytic degradation) cause the development of rancidity resulting in

3
poor bread quality (Tait and Galliard 1988) and unacceptable sensory properties (Hansen and
Rose 1996; Bin and Peterson 2016).
Lipase activity is concentrated in the pericarp and germ portions of the kernel with the
majority located in the pericarp (O’Connor et al 1992). The total lipase activity of wheat may
originate from a combination of endogenous lipases as well as microbial lipases on the surface of
the grain (O’Connor et al 1992). Fungal lipases on the surface of the grain may be involved in
virulence of plant pathogens (Gaillardin 2010). During germination endogenous lipase activity
increases and it was found to be the function of coleoptile length and germination conditions
(Brijs et al 2009). High lipase activity was found when wheat was germinated in the dark and at
higher temperatures (Brijs et al 2009).
In contrast to lipase, the germ of wheat shows maximum LOX activity followed by the
pericarp (Every et al 2006). LOX activity in plants is associated with providing hydroperoxide
substrates and volatile aldehydes for the synthesis and activation of plant defense mechanisms
against pathogens (Prost et al 2005; Matsui K 2006). The involvement of LOX was found in the
mechanisms for disease resistance in tobacco leaves (Shah 2005) and against fungal pathogens.
During germination of maize, activity of LOX was increased in parallel to lipase activity (Lin et
al 1983).
One important agronomic practice of interest during wheat production is in-season
application of fungicide to prevent or minimize yield loss due to fungal disease in wheat
(Dimmock and Gooding 2002; Ruske et al 2003). As stated in the presiding discussions, it is
likely that lipase activity in grain is related to fungal contamination and LOX activity could be
related to disease resistance (stress tolerance). Therefore, quantification of the lipolytic activities
in wheat in context of in-season fungicide application needs to be addressed.

4
True lipases are active on ester-linkages on water-insoluble substrates at the oil-water
interface. Related enzymes, esterases (carboxyl ester hydrolases, EC 3.1.1.1), are active on the
same chemical bond, but show propensity toward water-soluble substrates. Several water-soluble
and -insoluble substrates are commonly used to assay lipase. Three of the most common
substrates that have been used to assay cereal grain lipases are triacylglycerol (typically triolein
or olive oil), p-nitrophenyl palmitate, and p-nitrophenyl butyrate (Prabhu et al 1999; Suzuki et al
2004; Wrolstad et al 2005; Palacios et al 2014). p-Nitrophenyl butyrate is a water-soluble
substrate and would therefore be expected to capture general esterase activity. Triacylglycerols
and p-nitrophenyl palmitate are not water-soluble and thus should capture true lipase activity,
although p-nitrophenyl palmitate would be more convenient to assay than triacylglycerol due to
its color generation upon hydrolysis. Since loss of flour quality seems to be a function mostly of
liberation and subsequent oxidation of unsaturated long-chain fatty acids, it would seem that true
lipase activity would be more relevant to wheat quality than general esterase activity. Previous
studies have based conclusions on the lipase activity measured by one substrate (Doblado-
Maldonado et al 2013; De Almeida et al 2014). However, as the activity could differ among
substrates it is relevant to compare lipase activity measurements among substrates.
Therefore, this study had both a primary and a secondary objective. The primary
objective was to evaluate the consequences of in-season foliar fungicide treatment on the
activities of lipolytic enzymes in wheat. The secondary objective was to determine the
relationships among lipase and esterase activities in wheat assayed using different substrates.
1.3. MATERIALS AND METHODS

5
1.3.1. Experimental design
Hard red winter wheat samples were produced at the agronomy research farm located at
Havelock, Nebraska, USA (40°51'15.077" N and 96°36'46.828" W) under rain-fed conditions
during two growing seasons (2014 and 2015). Six hard red winter wheat cultivars that are
commonly produced in this region were used in this study: ‘Freeman’ (Reg. no. CV-1098, PI
667038) (Baenziger et al 2014), ‘Millennium’ (Reg. no. CV-908, PI 613099) (Baenziger et al
2001), ‘Overland’ (Reg. no. CV-1020, PI 647959) (Baenziger et al 2008), ‘Pronghorn’ (Reg. no.
CV-848, PI 593047) (Baenziger et al 1997), ‘Robidoux’ (Reg. no. CV-1064, PI 659690)
(Baenziger et al 2012), and ‘Settler CL’ (Reg. no. CV-1051, PI 653833) (Baenziger et al 2011).
Wheat grains used in this study were randomly sampled from four field replications that received
two fungicide treatments: with (F1) and without (F0) foliar fungicide [Prosaro® 421 SC,
(prothioconazole + tebuconazole)] application at the rate of 455 mL ha-1 with the addition of a
non-ionic surfactant at 0.125%v/v when all plants reached flag leaf stage (Zadoks growth stage
39).
1.3.2. Weather and agronomic data
Weather data for the field experiment site were obtained from the Automated Weather
Data Network of the High Plains Regional Climate Center (http://www.hprcc.unl.edu/). Only
weather conditions from flowering to harvest were reported.
Wheat cultivars were planted on 2 October 2013 for 2014 trials and 17 September 2014
for 2015 trials. Plants were harvested on 9 July 2014 and 13 July 2015. Days to flowering (FD)
was the number of days after 30 April when 50% of the plants had protruded anthers (Zadoks
growth stage 65). Visual assessment of disease severity (DS) evaluation was made for all foliar

6
diseases combined from the top two leaves in each plot as percent diseased leaf area on a scale of
0% to 100% (Bhatta 2015).
1.3.3. Kernel characteristics
Total grain protein (TGP) concentration was determined using a near infrared analyzer
(DA 7250, Perten Instruments, Springfield, IL), calibrated to combustion analysis using a LECO
FP528 (Approved Methods 44-19.01, AACC International 2013) as described (Bhatta 2015).
Thousand kernel weight (TKW) was measured using a seed counter model ESC-1 (Agriculex,
Inc, Guelph, Canada) by weighing 1000 kernels from each genotype on each plot.
Falling number was analyzed using AACC International approved method 56-81.03.
Values > 300 s were considered to indicate no sprout damage.
1.3.4. Lipase activity using olive oil substrate
Lipase activity using olive oil as the substrate was determined as previously described
(Doblado-Maldonado et al. 2013). Briefly, wheat grains were milled using a cyclone mill (UDY,
Fort Collins, CO USA) equipped with a 1 mm screen. Two hundred milligrams of whole wheat
flour was defatted with 1 mL of hexane (1:5 wt/vol). The supernatant was discarded after
centrifuging (13,793 X g, 5 min). Lipid extraction with hexane was repeated again. The defatted
pellet was dried until there was no hexane odor and then 0.12 mL of refined commercial olive oil
(Vigo Importing Co., Tampa, FL USA) and 0.03 mL of water were added and mixed with a
toothpick until the mass appeared homogenous. The samples were then incubated at 40 °C for 16
h. After incubation 1.2 mL of 2,2,4-trimethylpentane was added and the mixture was shaken
vigorously for 1 min and then centrifuged. One mL of the supernatant was mixed with 0.2 mL of
cupric-acetate pyridine reagent. The absorbance of the 2,2,4-trimethylpentane layer was then

7
measured at 715 nm. A standard curve was created using oleic acid (Alfa Aesar, Thermo Fisher
Scientific) (0-10 mM in 2,2,4-trimethylpentane). The enzyme activity was expressed as U/g
where U was defined as the micromoles of oleic acid equivalents liberated per h during the
reaction.
1.3.5. Lipase activity using p-nitrophenyl palmitate as substrate
Lipase activity using p-nitrophenyl palmitate as substrate was determined as described by
Wrolstad et al (2005) with a few modifications. To 1 g of milled sample, 5 mL of deionized
water was added. The samples were vortexed and then shaken horizontally for 30 min at room
temperature and then centrifuged (4500 X g, 15 min). The supernatant was separated and used as
crude enzyme extract. To 0.5 mL of crude enzyme extract, 1.25 mL of Tris-Cl buffer (0.1 M, pH
8.2) and 1.25 mL of substrate solution were added. The substrate solution was prepared by
adding 15.9 mg p-nitrophenyl palmitate (1492-30-4, Sigma-Aldrich, St. Louis, MO USA), 17 mg
of sodium dodecyl sulfate, and 1 g of triton X-100 to a total volume of 100 mL of deionized
water. This solution was heated in water bath at 65 °C for 15 min to remove turbidity and then
cooled to ambient temperature prior to use. The assay mixture was incubated at 37 °C for 15 min
and then the absorbance was analyzed at 400 nm. A standard curve was prepared using p-
nitrophenol (100-02-7, ACROS, Thermo Fisher Scientific, Waltham, MA) (0-0.1 mM in Tris-Cl
buffer). Lipase activity measured using p-nitrophenyl palmitate as the substrate was abbreviated
as LA-P. The units for LA-P were U/g, where U was defined as the micromoles of p-nitrophenol
released per hour.

8
1.3.6. Esterase activity using p-nitrophenyl butyrate as substrate
Esterase activity was analyzed using p-nitrophenyl butyrate (2635-84-9, Sigma-Aldrich)
as the substrate. The crude enzyme extract and substrate solution were prepared analogous to the
LA-P assay, except the SDS and Triton X-100 were not added to the substrate solution. EA
measured using p-nitrophenyl butyrate as the substrate was abbreviated as EA-B. The units for
EA-B were U/g, where U was defined as the micromoles of p-nitrophenol released per hour.
1.3.7. Lipoxygenase activity
LOX was analyzed following Gökmen et al (2007) with a few modifications. To 1 g of
flour, 5 mL of phosphate buffer (pH 6.5) was added and the tubes were horizontally shaken. The
mixture was centrifuged at 5,000 X g for 15 min at 4 °C. The supernatant was used as the crude
enzyme extract for further analysis. For the substrate solution, linoleic acid (L-1376, Sigma-
Aldrich) (157 µl) and tween 20 (157 µl) were mixed and then emulsified into 5 mL of distilled
water after which the volume was then brought to 200 mL with phosphate buffer (pH 6.5). The
substrate solution was flushed with nitrogen to prevent any oxidation. One hundred microliters of
crude enzyme extract was added to 2.9 mL of substrate solution in a water bath at 30 °C. After
2.5 min, 1 mL was transferred to 4 mL of 0.1 M sodium hydroxide to stop the enzymatic reaction
and improve the clarity of solution by the formation of Na-salt with linoleic acid (Wrolstad et al
2005). The units of LOX activity were U/g, where U was defined as the numeric increase in
absorbance at 234 nm per minute of the reaction.
1.3.8. Data analysis
Data were analyzed using SAS (version 9.4, SAS Institute, Cary, NC USA). Data were
initially analyzed using a three factor factorial ANOVA. Cultivar, treatment, and year and their

9
interactions were fixed effects and replication nested within year was a random effect. Due to
large differences in environmental conditions between 2014 and 2015, data were also analyzed
by year to estimate the factorial effects of cultivar and foliar fungicide treatments and associated
interaction in the two environments (years). Differences among least squares means were gaged
using Fisher’s protected least significant difference (LSD) test at P≤ 0.05. Pearson’s partial
correlation analysis was calculated on least squares means to examine the relationship among
measured variables; DS, FD, TGP, TKW, FN, LA-O, LA-P, EA-B, and LOX.
1.4. RESULTS
1.4.1. Weather and agronomic data
The average air temperature was similar for both growing seasons (Table 1.1), although a
considerable difference in rainfall was observed. As expected, the differences between these
environments provided a significant year effect on DS that varied with cultivar and foliar
fungicide treatment (Table 1.2). Major diseases observed in 2014 were Septoria tritici blotch and
tan spot, while in the wetter season (2015), fusarium head blight and stripe rust predominated.
Freeman showed similar DS regardless of the fungicide treatment (Fig. 1.1a). When fungicide
was applied Robidoux showed the highest DS, whereas the rest of the cultivars showed similar
DS. Millennium, Overland, Pronghorn, and Settler CL had higher DS in 2015 than in 2014 (Fig.
1.1b) indicating that these cultivars were more susceptible to stripe rust and fusarium head blight
than to Septoria tritici blotch and tan spot. Application of fungicide against pathogens was found
to be more effective when the environment for disease development was favorable: in 2015 DS
was reduced from 74% to 16% when fungicide was applied (Fig. 1.1c).

10
The average days to flowering were 27.9 days in 2014 and 28.3 days in 2015. These days
refer to the number of days after 30 April. A significant cultivar x year interaction was observed
for FD (Table 1.2). Except for Millennium and Overland other cultivars had similar FD on both
years (Fig. 1.1d). In 2015, Millennium and Overland had higher FD than in 2014.
1.4.2. Kernel characteristics
TGP of cultivars varied over the years (Table 1.2): TGP of all the cultivars were higher in
2015 than in 2014 (Fig. 1.2a). Robidoux (in 2015) had the highest TGP.
The cultivar x year and treatment x year interactions were significant for TKW (Table
1.2). TKW of all cultivars were higher in 2014 than in 2015 (Fig. 1.2b). In 2015, except
Robidoux all cultivar had similar TKW. TKW of cultivars treated with fungicide were higher in
both years (Fig. 1.2c).
A significant cultivar x treatment x year interaction was observed for FN (Table 1.2);
however, true sprouting damage was not observed in either year (FN >300 s) for all cultivars.
The variation in FN was mainly contributed by year (81%). Millennium, Overland and
Pronghorn had higher FN in 2014 than in 2015 (Fig. 1.2d). The range of FN was 311 to 457 in
2015, and 459 to 549 in 2014. Application of fungicide was not found to affect FN except for
Freeman in 2015.
1.4.3. Lipase activity using olive oil substrate
The cultivar x year and treatment x year interactions were significant for LA-O (Table
1.2). The application of fungicide did not affect LA-O in 2014, but reduced LA-O in 2015 (Fig
1.3a). For all cultivars, LA-O was an order of magnitude higher in 2015 compared with 2014
(Fig. 1.3b). There were no differences among cultivars for their LA-O in 2014 (Fig. 1.3b). In

11
2015 the highest and lowest LA-O were found in Millennium and Pronghorn respectively.
Interestingly, Freeman showed an increase in LA-O despite the low DS in 2015.
1.4.4. Lipase activity using p-nitrophenyl palmitate as substrate
A significant cultivar x year interaction was observed for LA-P mainly due to the effect
of year (Table 1.2). As seen with LA-O, a similar dramatic increase was seen in LA-P when
comparing 2014 to 2015 (Fig. 1.3c). Additionally, there were no differences among cultivars for
LA-P in 2014, but in 2015 significant differences were observed. In contrast to results for LA-O,
fungicide treatment did not affect LA-P activity. The cultivars also had different rankings for
LA-P: Robidoux showed the highest LA-P in 2015 followed by Pronghorn and rest of the
cultivars had similar LA-P.
1.4.5. Esterase activity using p-nitrophenyl butyrate as substrate
A significant 3-way interaction (cultivar x treatment x year) was observed for EA-B
(Table 1.2), with a large portion of the variability contributed by year (89%). EA-B of all the
cultivars were higher in 2015 compared to 2014 with Robidoux having the highest EA-B (Fig.
1.4). Application of fungicide was found to influence EA-B in 2015 for Freeman and Overland
with EA-B being higher when fungicide was not applied. In 2014, there were no differences
among cultivars for EA-B and the application of foliar fungicide did not influence EA-B.
Overall, it appeared that fungicide treatment had minimal impact on EA-B, which was similar to
findings with LA-P.
1.4.6. Lipoxygenase activity
The cultivar x treatment x year interaction was significant for LOX (Table 1.2). As with
EA-B, most of the variation was attributed to the difference between the years, although in
12
contrast to EA-B, the three-way interaction and the two-way interaction of cultivar x treatment
contributed substantially to the source variance (5.8% and 11%, respectively), indicating
different responses among the cultivars to the fungicide application depending on year. LOX
activity decreased with the application of fungicide in both years for Freeman and Robidoux
(Fig. 1.5). This suggested the consistent response of these cultivars to the application of
fungicide across years. In 2014 LOX activities of Overland and Settler CL were reduced when
fungicide was sprayed but no such effect was observed in 2015. Interestingly in 2015,
Millennium and Pronghorn showed higher LOX activity in case of fungicide treatment.
Fungicide application had no effect on these cultivars in 2014. The growing conditions and
interaction of the cultivar x treatment x year are the major factor for such differences in LOX
activity.
1.4.7. Correlations among response variables
DS was negatively correlated with TKW (Table 1.3). DS was correlated with EA-B and
LOX. A significant negative correlation of FD was observed with LA-O, and EA-B. TGP and
EA-B were correlated. TKW was negatively correlated with LA-P, EA-B, and LOX. LA-P and
EA-B were highly correlated.
1.5. DISCUSSION
The objective of this study was to determine the influence of fungicide application on
lipolytic activities of wheat and to determine the relationship among measured enzymatic
activities. Our results suggested that the influence of foliar fungicide on lipolytic enzyme activity
in wheat is dependent mainly on the growing conditions of the plants. The presence of disease in
the field, disease resistance of the cultivars, and the enzyme being studied are crucial in

13
determining the influence of fungicide on enzymatic activities. Environmental conditions in 2014
were characterized by typical rainfall and low disease severity in the field providing a normal
growing season for plants. However, high rainfall in 2015 favored disease outbreak including
fusarium head blight and stripe rust. The activation of endogenous enzymes expressed during
stressed conditions together with the presence of exogenous enzymes (fungal/microbial
enzymes) may have resulted in higher enzymatic activities in many cultivars in 2015.
Significant cultivar x year x treatment interactions were observed among cultivars for
EA-B, LOX, and FN. However, the major portion of variation was attributed to different
growing conditions across years. In addition to the difference in growing conditions between the
two years, it is expected that the efficacy of foliar fungicide is dependent on DS and disease
resistance for each cultivar (Wegulo et al 2011). This may be the reason for differences in
enzymatic activities in 2015 caused by the application of foliar fungicide. The influence of foliar
fungicide on enzyme activity is also dependent on the enzyme being measured and the substrate
being used in the assay. For instance, LA-P of the cultivars were not influenced by the
application of foliar fungicide, whereas LA-O, which is also a measure of lipase activity, was
influenced by fungicide.
Lipase activities using different substrates, LA-O and LA-P, were not correlated. This
may be due to the presence of different enzymes or other compounds that inhibit or activate the
enzymes, since LA-O was measured on whole milled kernels and LA-P was measured on an
extract. The affinity of lipase enzymes for different substrates may be another reason for the lack
of correlation between LA-O and LA-P (O’Connor and Harwood 1992). Further research is
needed to determine which substrate gives a better indication of flour stability during storage.

14
The higher activity of most enzymes in 2015 compared with 2014 suggests that disease
pressure influences the activity of lipolytic enzymes. However, significant correlations with DS
were only found for EA-B and LOX. This suggested that DS is not the only factor to change
lipolytic activity in wheat. The presence of mold or injury to the plant may have elevated lipase
activity despite of low DS in those cultivars. Another explanation may be that the disease
pressure was enough to increase enzymatic activities, but visual signs and symptoms of disease
were yet to be expressed in the plants.
As enzyme activities generally increase during sprouting, FN was assayed to determine if
lipolytic activities were related to pre-harvest sprouting. No sprouting damage was observed in
either year of this study and no enzyme activities were correlated with FN. Therefore, differences
in lipolytic activity among cultivars in this study were not due to pre-harvest sprouting.
However, high rainfall and disease pressure in 2015 resulted in lower falling number than in
2014.
Different agronomic characteristics, including FD, TGP, and TKW, were accounted for
in this study since previous studies have shown relationships between these variables and
(exogenous) enzymatic activity (Dornez et al 2006). Due to higher rainfall in 2015 FD was
delayed, whereas TKW was lower due to higher DS. TKW and enzyme activity (LA-P, EA-B,
and LOX) were negatively correlated in our study. This may be because the majority of enzymes
in our study are located in the outer portions (bran and germ) of the kernel (O’Connor and
Harwood 1992; Every et al 2006) and smaller kernels have more surface area per unit weight of
wheat.

15
1.6. CONCLUSION
Enzymatic activities were mostly dependent on growing conditions, with a much lower
contribution of cultivar and fungicide treatment. When the environment was conducive to
disease development, fungicide application influenced DS, TKW, LA-O, EA-B, LOX, and FN.
In the future, it would be interesting to determine how specific diseases influence lipolytic
activities in wheat. EA-B, LOX, and FN were dependent on the interaction of cultivar, treatment,
and growing conditions. The variation in lipolytic activities in terms of cultivars widens the
scope in crop management and variety selection in order develop and grow wheat varieties with
low lipolytic activities for the whole grain flour market. However, further studies on relationship
of lipolytic activities and stability of flour under different storage conditions, levels of
anticipated field stress conditions, and different agronomic practices should be explored to
predict if low lipolytic activities in flour is predictive of improved flour shelf-life and quality.
16
1.7. REFERENCES
AACC International. Approved Methods of Analysis, 11th Ed. Method 56-81.03 Determination
of Falling Number. Approved November, 1999. AACC International: St. Paul, MN.
http://dx.doi.org/10.1094/AACCIntMethod-56-81.03
Baenziger, P.S., Beecher, B., Graybosch, R.A., Ibrahim, A.M.H., Baltensperger, D.D., Nelson,
L.A., Jin, Y., Wegulo, S.N., Watkins, J.E., Hatchett, J.H., Chen, M.S., and Bai, G. 2008.
Registration of “NE01643” wheat. J Plant Regist 2:36-42.
Baenziger, P.S., Graybosch, R.A., Nelson, L.A., Regassa, T., Klein, R.N., Baltensperger, D.D.,
Santra, D.K., Ibrahim, A.M.H., Berzonsky, W., Krall, J.M., Xu, L., Wegulo S.N., Bernards,
M.L., Jin, Y., Kolmer, J., Hatchett, J.H., Chen, M.S., and Bai, G. 2011. Registration of
“NH03614 CL” wheat. J. Plant Regist 5:75-80.
Baenziger, P.S., Graybosch, R.A., Regassa, T., Klein, R.N., Kruger, G.R., Santra, D.K., Xu, L.,
Rose, D.J., Wegulo, S.N., Jin ,Y., Kolmer, J., Hein, G.L., Chen, M.S., Bai, G., Bowden, R.L.,
and Poland, J. 2014. Registration of “NE06545” (Husker Genetics Brand Freeman) hard red
winter wheat. J Plant Regist 8:279-284.
Baenziger, P.S., Graybosch, R.A., Regassa, T., Nelson, L.A., Klein, R.N., Santra, D.K.,
Baltensperger, D.D., Krall, J.M., Xu, L., Wegulo, S.N., and Jin,Y. 2012. Registration of
‘NI04421’hard red winter wheat. J of Plant Regist. 6:54-59.
Baenziger, P.S., Moreno-Sevilla, B., Peterson, C.J., Shelton, D.R., Elmore, R.W., Nordquist,
P.T., Klein, R.N., Baltensperger, D.D., Nelson, L.A., McVey, D.V., Watkins, J.E. 2001.
Registration of ‘Millennium' Wheat. Crop Sci 41: 1367-1367.

17
Baenziger, P.S., Moreno-Sevilla ,B., Peterson, C.J., Shelton, D.R., Krall, J., Baltensperger, D.D.,
Haley, S.D., Nelson, L.A., McVey, D.V., Watkins, J.E., and Hatchett, J.H. 1997. Registration of
‘Pronghorn' wheat. Crop Sci 37:1006.
Bhatta, M. 2015. Effect of genotype, environment, and production packages on yield, agronomic
characteristics, and end-Use quality of winter wheat. M.S. thesis. Univ. of Nebraska, Lincoln.
Bin, Q., and Peterson, D.G. 2016. Identification of bitter compounds in whole wheat bread
crumb. Food Chem 203: 8-15.
De Almeida, J.L., Pareyt, B., Gerits, L.R., and Delcour, J.A. 2014. Effect of wheat grain
steaming and washing on lipase activity in whole grain flour. Cereal Chem 91:321-326.
Dimmock, J.P., and Gooding, M.J. 2002. The effects of fungicides on Hagberg falling number
and blackpoint in winter wheat. Crop Prot 21: 475-487.
Doblado-Maldonado, A.F., Arndt, E.A., and Rose, D.J. 2013. Effect of salt solutions applied
during wheat conditioning on lipase activity and lipid stability of whole wheat flour. Food Chem
140: 204-209.
Dornez, E., Joye, I.J., Gebruers, K., Lenartz, J., Massaux, C., Bodson, B., Delcour J.A., Courtin,
C.M. 2006. Insight into variability of apparent endoxylanase and endoxylanase inhibitor levels in
wheat kernels. J Sci Food Agr 86:1610-1617.
Brijs, K., Courtin, C.M., Goesaert, H., Gebruers, K., Delcour, J.A., Shewry, P.R., Henry, R.J.,
Nicolas, J., Potus, J., Garcia, R., Davidou, S. 2009. Enzymes and enzyme inhibitors endogenous
to wheat. Pages 401-423 in: Wheat Chemistry and Technology. K. Khan and P.R. Shewry, eds.
AACC International, St. Paul, MN.

18
Every, D., Simmons, L. D., and Ross, M.P. 2006. Distribution of redox enzymes in millstreams
and relationships to chemical and baking properties of flour. Cereal Chem 83:62-68.
Gaillardin, C. 2010. Lipases as pathogenicity factors of fungi. Pages 3260-3266 in: Handbook of
Hydrocarbon and Lipid Microbiology. K.N. Timmis, ed. Springer Link, Berlin Heidelberg.
Gardner, H.W. 1987. Lipoxygenase pathway in cereals. Pages 161-215 in Advances in: Cereal
Science and Technology. Y. Pomeranz, ed. American Association of Cereal Chemists,
Minnesota.
Gökmen, V., Serpen, A., Atli, A., and Kökse, l.H. 2007. A practical spectrophotometric approach
for the determination of lipoxygenase activity of durum wheat. Cereal Chem 84: 290-293.
Hansen, L., and Rose, M.S. 1996. Sensory acceptability is inversely related to development of fat
rancidity in bread made from stored flour. J of the Am Diet Assoc 96: 792-793.
Lin, Y.H., Wimer, L.T., and Huang, A.H. 1983. Lipase in the lipid bodies of corn scutella during
seedling growth. Plant Physiol 73:460-463.
Matsui, K. 2006. Green leaf volatiles: hydroperoxides lyase pathway of oxylipin metabolism.
Curr Opin Plant Biol 9:274-280.
O'Connor, J., and Harwood, J.L. 1992. Solubilization and purification of membrane-bound
lipases from wheat flour. J of Cereal Sci 16:141-52 (1992).
Palacios, D., Busto, M.D., and Ortega, N. 2014. Study of a new spectrophotometric end-point
assay for lipase activity determination in aqueous media. LWT-Food Sci and Technol 55:536-
542.

19
Prabhu, A.V., Tambe, S.P., Gandhi, N.N., Sawant, S.B., and Joshi, J.B. 1999. Rice bran lipase:
extraction, activity, and stability. Biotechnol Prog 15:1083-1089.
Prost, I., Dhondt, S., Rothe, G., Vicente, J., Rodriguez, M.J., Kift, N., Carbonne, F., Griffiths, G.,
Esquerré-Tugayé, M.T., Rosahl, S., and Castresana, C. 2005. Evaluation of the antimicrobial
activities of plant oxylipins supports their involvement in defense against pathogens. Plant
Physiol 139: 1902-1913.
Ruske, R.E., Gooding, M.J., and Jones, S.A. 2003. The effects of adding picoxystrobin,
azoxystrobin and nitrogen to a triazole programme on disease control, flag leaf senescence, yield
and grain quality of winter wheat. Crop Prot 22:975-987.
Shah, J. 2005. Lipids, lipases, and lipid-modifying enzymes in plant disease resistance. Annu
Rev Phytopathol 43:229-260.
Stratistics. 2016. Whole grain and high fiber - Global market outlook (2015-2022). Gaithersburg,
MD. Available at: http://www.strategymrc.com/report/whole-grain-and-high-fiber-market
Suzuki, T., Honda, Y., and Mukasa, Y. 2004. Purification and characterization of lipase in
buckwheat seed. J Agric Food Chem 52:7407-7411.
Tait, S.P., and Galliard, T. 1988. Effect on baking quality of changes in lipid composition during
wholemeal storage. J of Cereal Sci 8: 125-137.
USDA and USDHHS. 2015. 2015-2020 Dietary Guidelines for Americans (eighth ed.).
Washington DC. Available at: http://health.gov/dietaryguidelines/2015/guidelines/.
USDA. 2016. Flour milling products 2015 summary. Washington DC. Available at:
http://usda.mannlib.cornell.edu/usda/current/FlourMillAnn/FlourMillAnn-05-02-2016.pdf.

20
Wegulo, A.N., Zwingman,M.V., Breathnach, J.A., Baenziger, P.S. 2011. Economic return from
fungicide application to control foliar fungal diseases in winter wheat. Crop Prot 30:685-692.
Whole Grains Council. 2015. Survey: Two-thirds of Americans make half their grains whole.
Bonston, MA. Available at: http://wholegrainscouncil.org/blog/2015/08/survey-two-thirds-
americans-make-half-their-grains-whole.
Wrolstad, R.E., Acree, T.E., Decker, E.A., Penner, M.H., Reid, D.S., Schwartz, S.J., Shoemaker,
C.F., Smith, D.M., and Sporns, P. 2005. Handbook of Food Analytical Chemistry: Water,
Proteins, Enzymes, Lipids, and Carbohydrates. John Wiley & Sons, Inc., New York.

21
Table 1.1. Mean temperature and total precipitation in two growing seasons (2014 and 2015) at
Havelock, Lincoln, NE USA.A
Month
Year 2014 Year 2015
Temperature (°C) Precipitation (mm) Temperature (°C) Precipitation (mm)
April 11.5 88.9
12.2 50.5
May 18.4 134
16.4 277
June 23.3 150
23.0 195
July 23.9 13.0
25.1 60.7
Mean/total 19.3 385 19.2 583
AHigh Plains Climate Center, University of Nebraska-Lincoln.

22
22
Table 1.2. Analysis of variance (mean squares) for disease severity, enzyme activities and falling number.A
Source of variance df DS FD TGP TKW FN LA-O LA-P EA-B LOX
Full model
Year 1 4597*** 8.16 46.48*** 993.11*** 232610*** 86.7*** 9135*** 80256*** 132***
Error a = Rep(Year) 6 91.4 5.1 0.2 4.7 326.7 0.3 21 167.2 0.2
Cultivar 5 1803*** 39.14*** 2.52*** 27.3*** 9022* 0.91*** 156*** 1936*** 25.7***
Treatment 1 30099*** 1.52 0 189.8*** 28998** 0.76* 47.97 1621** 1.26***
Cultivar x Treatment 5 889*** 0.19 0.4 1.82 1074 0.07 9.84 108.9 10.6***
Cultivar x Year 5 343* 7.79** 1.92*** 18.2*** 6014* 0.63*** 156*** 1815*** 7.42***
Treatment x Year 1 12027*** 1.52 0.04 56.16 4081.2 0.47* 28.29 1295* 0.66***
Cultivar x Treatment x
Year 5 101.6 0.95 0.12 3.9 6229* 0.09 7.38 375* 7.62***
Error 66 127 1.9 0.4 2.6 2148 0.1 12.3 121 0.1
Year 2014
Cultivar 5 1407** 8.28*** 0.7 24.15*** 10799* 0.044* 3.528 77.16 5.04***
Treatment 1 2050* 0 0.07 19.5** 5814.9 0.02 1.4** 12.86 2.29***
Cultivar x Treatment 5 503* 0.27 0.42 1.15 1107.6 0.003 0.56 83.59 0.414*
Error 33 201 0.9 0.7 2.3 2769 0.01 0.56 64.3 0.09
Year 2015
Cultivar 5 811*** 39.9*** 3.62*** 20.44*** 4428* 1.70*** 312*** 3540*** 46***
Treatment 1 40221*** 3 0.02 220.9*** 27333** 1.47* 75.02 2903** 0.08

23
23
Cultivar x Treatment 5 478*** 0.9 0.09 4.48 6108* 0.184 16.94 407.1 28.2***
Error 33 53.7 3 0.1 2.8 1527 0.23 24.2 177 0.2
ADS, disease severity; FD, days to flowering; TGP, total grain protein; TKW, thousand kernel weight; FN, falling number; LA-O,
lipase activity using olive oil as the substrate; LA-P, lipase activity using p-nitrophenyl palmitate as the substrate; EA-B, esterase
activity using p-nitrophenyl butyrate as the substrate; LOX, lipoxygenase activity*p<0.05; **p<0.01; ***p<0.001.*p<0.05; **p<0.01;
***p<0.001.

24
Table 1.3. Pearson partial correlation coefficients (year as a partial variable) among response
variables.A
FD TGP TKW FN LA-O LA-P EA-B LOX
DS -0.16 0.13 -0.68*** -0.05 0.33 0.35 0.41* 0.44*
FD
0.09 0.15 0.22 0.48* -0.35 -0.57** 0.08
TGP
-0.21 0.25 0.28 0.49 0.42** 0.28
TKW
-0.05 -0.12 -0.62** -0.53** -0.51*
FN
0.03 -0.002 0.01 -0.0003
LA-O
-0.32 -0.13 0.20
LA-P
0.79*** 0.26
EA-B
0.24
ADS, disease severity; FD, days to flowering; TGP, total grain protein; TKW, thousand kernel
weight; FN, falling number; LA-O, lipase activity using olive oil as the substrate; LA-P, lipase
activity using p-nitrophenyl palmitate as the substrate; EA-B, esterase activity using p-
nitrophenyl butyrate as the substrate; LOX, lipoxygenase activity*p<0.05; **p<0.01;
***p<0.001.

25
Figure 1.1. Plots of significant cultivar, treatment, and year effects on measured agronomic
characteristics: disease severity (DS; a-c) and flowering date (FD; d); F0 = no fungicide
application; F1 = fungicide application; means with different letters are significantly different
within each subplot.

26
Figure 1.2. Plots of significant cultivar, treatment, and year effects on measured kernel
characteristics: total grain protein (TGP; a), thousand kernel weight (TKW; b-c),and falling
number (D); F0 = no fungicide application; F1 = fungicide application; means with different
letters are significantly different within each subplot.

27
Figure 1.3. Plots of significant cultivar, treatment, and year effects on lipase activity measured
with olive oil (LA-O; a-b) or p-nitrophenyl palmitate (LA-P; c) as substrate; F0 = no fungicide
application; F1 = fungicide application; means with different letters are significantly different
within each subplot.

28
Figure 1.4. Plot of significant cultivar, treatment, and year effects on esterase activity measured
with p-nitrophenyl butyrate as substrate (EA-B) as substrate; F0 = no fungicide application; F1 =
fungicide application; means with different letters are significantly different within each subplot.

29
Figure 1.5. Plot of significant cultivar, treatment, and year effects on lipoxygenase (LOX)
activity; F0 = no fungicide application; F1 = fungicide application; means with different letters
are significantly different within each subplot.

30
CHAPTER 2 : CHANGES IN ENZYMATIC ACTIVITIES AND FUNCTIONALITY OF
WHOLE WHEAT FLOUR DUE TO STEAMING OF WHEAT KERNELS
2.1. ABSTRACT
The effects of steaming wheat kernels on lipolytic degradation of resulting whole flour was
studied by quantifying enzyme activities and lipid degradation products during storage. Lipase,
lipoxygenase, polyphenol oxidase, and peroxidase activities were decreased by up to 81%, 63%,
22%, and 34%, respectively, as the time of steaming increased up to 90 s. Steaming had no effect
on starch and gluten properties. Upon storage free fatty acids decreased with respect to time of
steaming. Time of steaming did not affect lipid oxidation in flour; however, total carbonyls
produced in dough made from stored flour were decreased with the increase in steaming
duration. Thus, steaming wheat kernels prior to milling reduced lipase activity and consequently
hydrolytic rancidity during storage without affecting starch and gluten fractions. Steam treatment
did not affect oxidative rancidity in flour during storage but did reduce oxidation once the flour
was made into a dough.
Keywords: lipase; lipoxygenase; flour storage; free fatty acids; rancidity

31
2.2. INTRODUCTION
Unlike refined wheat flour, which is essentially free of the bran and germ fractions, the
functionality of whole wheat flour decreases rapidly upon storage due to the occurrence of
enzymes present in the bran and germ fractions that initiate lipolytic rancidity (O’Connor, Perry,
& Harwood, 1992). Of the many enzymes in wheat bran and germ, lipase (triacylglycerol
hydrolase, EC 3.1.1.3) and esterase (carboxyl ester hydrolases, EC 3.1.1.1), mainly present in the
outer bran fraction of the wheat kernel, hydrolyze water insoluble and soluble esters yielding free
fatty acids (FFA) that contribute to hydrolytic rancidity (Doblado-Maldondao, Pike, Sweley, &
Rose 2012; Goffman & Bergman, 2003). These FFA accumulate upon storage and are oxidized
either non-enzymatically or enzymatically in hydrated flour by lipoxygenase (LOX, EC
1.13.11.12). Although, LOX is often added to bread formulations due to its ability to oxidize
disulfide bonds (enhance loaf volume) and degrade carotenoid pigments (dough bleaching), it
can have detrimental effects on flour quality by oxidizing polyunsaturated fatty acids arising
from lipase activity in the presence of excess moisture during dough mixing (Mann & Morrison,
1975; Delcros et al. 1998). The hydroperoxide derivatives generated due to LOX activity
undergo rearrangement and decomposition to yield secondary oxidation products including
volatile compounds like hexanal and other ketones (Doblado-Maldondao et al. 2012). Products
of hydrolytic and oxidative rancidity result in poor bread quality (Tait & Galliard, 1988; Zhang
& Moore, 1999), production of bitter compounds (Bin & Peterson, 2016), and a decline in
sensory properties (Hansen & Rose, 1996).
Besides lipase and LOX, the influence of polyphenol oxidase (PPO) and peroxidase
(POD, EC 1.11.1.7) activities are important because they degrade hydrogen peroxide, which is
an inhibitor of LOX, and they produce free radicals during oxidation that can attack unsaturated

32
fatty acids and contribute to oxidative rancidity by promoting oxidation of FFA (Nicolas &
Dapron, 1988). Like LOX, PPO and POD improve dough strength by crosslinking with gluten
proteins or by cross linking gluten with polysaccharides, but can also contribute to oxidative
rancidity (Takasaki, Kato, Murata, Homma, & Kawakishi, 2005; Matheis & Whitaker, 1983).
Due to the development of undesirable chemical changes in flour during storage,
inactivation of enzyme activities may be an appropriate strategy to extend shelf life and maintain
the functional properties of whole wheat flour. Previous studies have used different thermal
processing methods including steaming, microwave heating, and passing through infrared and
gamma radiation (De Almeida, Pareyt, Gerits ,& Delcour, 2014; Rose, Ogden, Dunn, & Pike,
2008; Li et al. 2016; Jha, Kudachikar, & Kumar, 2013) to decrease lipolytic activities. Rose et al.
(2008) reported a decrease in lipase activity of 93% and 96% when wheat bran was microwaved
(1000 W) and steam treated for 60 s, respectively. Similarly, a reduction in lipase activity of 84%
was observed when wheat grains were steam treated for 240 s (De Almeida et al. 2014). The
residual lipase activity of wheat germ treated with infrared (90 °C for 20 min) was found to be
18.02% (Li et al.2016), whereas the lipase of wheat germ was inactivated by 31.2% when
irradiated with 30 kGy gamma radiation (Jha et al. 2013). Although these studies have shown a
decrease in lipase activity due to one or more thermal processing techniques, there is not much
information on reaction products of lipolytic degradation on flours from steam treated grains
during storage. Also, the steam treatment applied to grains may degrade starch (De Almeida et
al. 2014) and denature gluten proteins (Prakash & Rao, 1999), which in turn may affect end use
quality (Shin, Kim, & Kim, 2013) and dough properties of flour.
Given that most enzyme activity, especially lipase activity, is concentrated in the outer
layers of the wheat kernel while the gluten proteins and starch are located within the kernel and

33
protected by the bran layer, we hypothesized that steaming wheat kernels prior to milling would
inactivate lipase (and other enzymes) and thus stabilize lipids during storage without damaging
flour end-use quality. The objectives of this study were to (1) quantify lipase, esterase, LOX,
PPO, and POD activities in whole wheat flour obtained from steam-treated grains and determine
the effects of steaming on the functionality of flour; and (2) determine the changes in hydrolytic
and oxidative rancidity during storage of steam-treated whole wheat flour compared with non-
steam-treated flour.
2.2. MATERIALS AND METHODS
2.2.1. Chemicals and reagents
The chemicals and reagents used in this study were: 3,4-dihydroxybenzene (catechol)
(120-80-9, ACROS), 3-(N-morpholino) propane sulfonic acid (MOPS) (1132-61-2, ACROS),
potassium phosphate (7778-7-0, Fisher Bioreagents), 2,2′-azino-bis (3-ethylbenzthiazoline-6-
sulfonic acid) (ABTS) (30931-67-0, Sigma), hydrogen peroxide (7722-84-1, Fisher Bioreagents)
n-propanol (71-23-8, Fisher Chemical), dithiothreitol (DTT) (3483-12-3, Fisher Bioreagent),
lactic acid (50-21-5, Fisher Chemical), hexane (110-54-3, Fisher Chemical), chloroform (67-66-
3, Fisher Chemical), methanol (67-56-1, Fisher Chemical), 3,3′-Bis[N,N-
bis(carboxymethyl)aminomethyl]-o-cresolsulfonephthalein tetra sodium salt (xylenol orange)
(3618-43-7, ACROS), barium chloride (10326-27-9, Fisher Bioreagent), iron (II) sulfate (7782-
63-0, Sigma), iron (III) chloride (10025-77-1, Sigma), 2-propanol (67-63-0, Fisher Chemical),
triphenylphosphine (603-35-0, Sigma), 2,4-dinitrophenylhydrazine (2,4-DNP) (119-26-6,
Sigma), and potassium hydroxide (1310-58-3, Fisher Bioreagents).
2.2.2. Sample preparation and treatment

34
Two commercial blends from different lots of hard winter wheat were obtained from Bay
State Milling (Winona, MN), and were steamed in the lab. Wheat kernels were steamed for 90 s
in 15 s intervals. For each time interval, 25 g of kernels were spread in an even layer over a 40
mesh (0.42 mm) standard testing sieve. The sieve containing the kernels was then covered and
placed over a boiling water bath. The distance between the grains on sieve and water was
approximately 8 cm. After steaming, the grains were sealed in a plastic bag and kept at room
temperature overnight and then milled with a cyclone mill equipped with a 1 mm screen (UDY,
Fort Collins, CO, U.S.A). The milled whole wheat flours were re-packaged in plastic bags until
analysis. Milled whole grain flour thus obtained was used to quantify enzyme activity assays,
functionality, and evaluate changes in lipid rancidity after storing for 6 months at ambient
conditions (room temperature enclosed in a plastic sample bag) (Fig. 2.1). The moisture content
of grains and flours were measured according to a standard method (approved method 44-19.01;
AACC International, 2017). All measured response variables were reported on a dry weight
basis.
2.2.3. Enzymatic activities in fresh whole wheat flour
Lipase, esterase, and LOX activities were measured as described (Poudel, Bhatta,
Regassa, & Rose, 2017).
PPO was measured as described (Anderson & Morris, 2001) with a few modifications.
To 0.2 g of whole wheat flour, 1.5 mL of catechol in 0.05 M MOPS buffer (pH 6.5) was added
and vortexed. This was followed by incubation at room temperature (22 °C) for 1 h with
continuous horizontal shaking at 200 rpm in a reciprocal shaking water bath (model 2872,
Thermo Scientific). Afterwards, the tubes were centrifuged and absorbance was recorded at 410
nm. The change in absorbance was compared against the substrate absorbance reading. PPO

35
activity was expressed as U/g, where 1 U is defined as the increase in an absorbance per minute.
POD activity was measured as described (De Almeida et al. 2014). To 0.125 g of whole wheat
flour, 2.5 mL of 0.1 M potassium phosphate buffer (pH 5.0) was added which was followed by
shaking (150 rpm) at room temperature for 30 min and centrifuging at 538 x g for 10 min. The
supernatant was separated and considered as a crude enzyme extract. To a separate tube 2.9 mL
of 9.1 mM ABTS, 0.1 mL of 0.3% (w/w) hydrogen peroxide, and 0.05 mL of crude enzyme
extract were added. For the blank reading, enzyme extract was replaced with buffer. The
absorbance readings were taken at 405 nm. POD activity was expressed as U/g, where U was
defined as the increase in absorbance at 405 nm per minute of the reaction.
2.2.4. Functional properties of fresh whole wheat flour
Changes in thermal and pasting properties of starch were assessed using a differential
scanning calorimeter (DSC) (Pyris 1, Perkin-Elmer Co., Norwalk, Connecticut, USA) and a
rapid visco analyzer (RVA) (RVA-4, Newport Scientific, Australia) respectively. For DSC, the
method described by Ratnayake, Otani, and Jackson (2009) was used with minor modifications.
Briefly, 10 mg of flour was weighed into an aluminum pan (B016-9321, Perkin-Elmer) and 0.03
mL of deionized water was added. The pan was hermetically sealed and kept at room
temperature for 4 h and then analyzed. Each experimental replicate was analyzed twice. Thermal
properties of starch were described by onset (To), peak (Tp), and conclusion (Tc) temperatures,
and enthalpy of gelatinization. Pasting profile using RVA was analyzed according to a standard
method (approved method 76-21.01; AACC International, 2017).
In addition to starch, changes in extractability of gluten proteins were assessed. Protein
fractionation was performed as described in Suchy, Lukow, Brown, DePauw, Fox, & Humphreys
(2007). Briefly, 10 mg of flour was extracted with 1.8 mL of 50% (v/v) n-propanol for 30 min at

36
25 °C with occasional vortex mixing. After centrifuging (13500 x g) for 5 min, the absorbance of
the supernatant was recorded at 280 nm. This absorbance reading, 50PS, contained mainly
gliadin. For the total soluble protein (TSP), the extraction process was similar to the 50PS
fraction, except the solvent was 50% (v/v) propan-1-ol containing 0.2% (w/v) DTT and the
extraction temperature was 55 °C. The difference between TSP and 50PS gave a measure of the
amount of high molecular weight glutenin. The gliadin and glutenin fractions were expressed as
the percentage of total extractable protein. Besides protein fractionation, solvent retention
capacity (SRC) using lactic acid, which is related to gluten protein functionality, was done
according to a standard method (approved method 56-11.02; AACC International, 2017).
2.2.5. Products of lipolytic degradation in stored whole wheat flour
FFA, conjugated dienes, peroxide value, and hexanal were measured on stored flour. FFA
and conjugated dienes were measured as described (Doblado-Maldonado, Arndt, & Rose, 2013).
Peroxide value was measured as described (Wrolstad et al. 2005) with a few modifications. To
0.5 g of flour, 7 mL of hexane was added and the sample was vortexed for 5 min. Five mL of the
supernatant was transferred to round bottom flask and the hexane was removed under partial
vacuum at 37 °C on a rotary evaporator. The extract was dissolved in 9.9 mL of chloroform:
methanol (7:3, v/v) and then 0.05 mL of 0.01 M xylenol orange and 0.05 mL of iron (II)
chloride. Iron (II) chloride solution was prepared by the addition of barium chloride solution (0.4
g BaCl2. 2H20 in 50 mL water) to iron (II) sulfate solution (0.5 g FeSO4. 7H2O in 50 mL water)
with constant stirring followed by the addition of 2 mL concentrated HCl. The barium sulfate
precipitate was filtered using Whatman no. 1 filter paper and the resulting solution was stored in
an amber bottle. The sample was incubated at room temperature for 5 min and then the
absorbance was measured at 560 nm against a reagent blank. Peroxide value was expressed as

37
mEq active oxygen/g of flour. The standard curve was constructed using varying concentration
of 0.05 mL iron (III) chloride (0.05 g iron (III) chloride, 5 mL concentrated HCl, and 0.1 mL of
30% hydrogen peroxide per 50 mL total solution) dissolved in 9.9 mL of chloroform: methanol
(7:3, v/v) and 0.05 mL of xylenol orange. The reagent preparation and absorbance reading were
taken in subdued light.
The production of carbonyl compounds in dough made from stored flours were quantified
as described (Endo, Li, Tagiri-Endo, & Fujimoto, 2001) with a few modifications. The dough
was prepared by adding water (flour: water, 1:1). After thoroughly mixing the flour and water to
facilitate the production of carbonyl compounds from the action of LOX on polyunsaturated fatty
acids released by lipase, the dough was rested for 2.5 h at room temperature. To the dough, 7 mL
of 2-propanol was then added and vortexed for 5 min followed by centrifuging at 4713 x g for 7
min. Five mL supernatant and 5 mL of 2-propanol containing triphenylphosphine (0.4 mg/mL)
were added in a separate tube and vortexed for 2 min which was referred as the sample solution.
In a separate 15 mL glass tube, 1 mL of sample solution and 1 mL of 2,4-DNP were added to
start the reaction. 2,4-DNP solution was prepared by dissolving 0.05 g 2,4- DNP in 100mL 2-
propanol containing 3.5 mL of concentrated HCl. The glass tubes were capped and incubated in
water bath for 20 min at 40 °C. After cooling under running water, 8 mL of 2% potassium
hydroxide dissolved in 2-propanol was added. The test tube was centrifuged for 5 min at room
temperature and the absorbance reading of the upper layer was measured at 430 nm. The
carbonyl values were expressed as U/g, where 1 U is defined as μ mole of carbonyl released per
minute.
2.2.6. Data analysis

38
Data were analyzed using SAS software (version 9.4, SAS Institute, Cary, NC, USA).
Mean Comparisons were done using Tukey adjustment at P ≤ 0.05. Percentage reduction in
enzymatic activities with respect to time of steaming were reported. Pearson’s correlations were
calculated to quantify the relationships among response variables.
2.2 RESULTS AND DISCUSSION
2.3.1. Moisture content in grains and flour
An increase in moisture content of steamed grains (measured 12 h after steaming) with
respect to time of steaming was observed (Supplementary Table 1). In particular there was an
increase of 5% moisture, from 8.8% to 13.7%, in wheat kernels steamed for 90 s compared with
the control that was steamed for 0 s (i.e.,not steamed). Since steamed grain samples were sealed
immediately in a plastic bag to prevent moisture loss, difference in flour moisture content was
expected in our study. Since the moisture content of even the samples steamed for the longest
time (90 s) was not excessive, it would be interesting in the future to study how steaming could
be used not only as a means of stabilizing whole wheat flour, but also as a means of delivering
moisture to wheat kernels for tempering in preparation for milling.
An increase in moisture content up to 17% (90 s, control = 12.8%) was reported by Rose
et al. (2008) following steaming of wheat bran; however, they did not find any difference when
moisture was measured after 24 h. The increase in moisture content of wheat grains with the
extended time of steaming was expected and had been reported by De Almeida et al. (2014)
previously. However, they found the time of steaming had no effect on flour moisture content
after milling, which contrasted with our findings. In both studies, they have stored grains either
on paper bag (Rose et al. 2008) or plastic trays (De Almeida et al. 2014) for a certain duration
39
before milling, which may have caused loss of moisture from grains and hence no change was
reflected in the flour.
2.3.2. Enzymatic activities in fresh whole wheat flour
Lipase (LA-O and LA-P), lipoxygenase, and esterase activities were decreased with an
increase in time of steaming of grains (Fig. 2.2a-b). A decrease in lipase activity by 81% (LA-O),
97% (LA-P), esterase activity by 60%, and LOX activity by 64% were observed. The different
reduction percentage of lipase activity using different substrate was expected, since we
previously reported that these substrates were found to give different results for the same wheat
samples (Poudel et al. 2017). Our results suggested that LA-O measured the lipase activity that
was more stable to steam treatment than that measured with LA-P. The other possible reason for
difference may be the isozymes measured using LA-P were right on the surface of kernel thus
had more exposure to heat during steaming than the isozymes measured using LA-O.
PPO and POD activities were decreased slightly with extended steaming time up to 22%
and 34%, respectively (Fig. 2.2c-d). De Almeida et al. (2014) found a decrease in lipase and
POD activities of 75.3% and 90.2% respectively when the grains were steamed for 120 s. As
POD enzyme is more heat stable than lipase enzyme (Cenkowski, Ames, & Muir, 2006;
Bookwalter, Lyle, & Nelsen, 1991) the 90 s of steam time in our study appears enough to
inactivate lipolytic enzymes with only slight effect on POD activity. Initially, an increase in PPO
activity was observed due to steam treatment, which may be due to inactivation of a PPO
inhibitor. Extended steaming then decreased PPO activity, presumably due to denaturation of the
enzyme.
2.3.3. Functional properties of fresh whole wheat flour

40
From the DSC thermograms, a difference in onset temperature (To ) of starch
gelatinization was observed, however, there were no differences in conclusion temperature (Tc),
peak temperature (Tp), and enthalpy of starch due to steaming of grains (Table 1). This implies
that the initial stages of gelatinization were affected by the steam treatments, but after continued
heating all samples achieved similar properties. Although there were subtle differences in onset
temperature, the differences appeared unrelated to the time of steaming. This indicated that the
steaming treatment used in this study had minimal effects on starch gelatinization properties.
This is in agreement with De Almeida et al. (2014), who also reported minimal effects of
steaming wheat kernels on starch gelatinization. However, using a steam treatment of 170 °C for
4 min, gelatinization of wheat starch was observed (Hu, Wang, Zhu, & Li, 2017).
The pasting profile from RVA showed no differences for peak viscosity, breakdown,
final viscosity, setback, peak time, and pasting temperature due to steaming (Table 1). Previous
studies have shown a decrease in the peak, trough, and final viscosities due to steaming (Hidalgo,
Brandolini, & Gazza, 2008; Hu et al. 2017). However, the steaming conditions applied in those
studies were different than ours. Hidalgo et al. (2008) used hulled kernels for steam treatment at
varying temperature, time and pressure combination from 115 °C, 5 min , 1.8 bar up to 120
°C,15 min, and 2.1 bar, whereas Hu et al. (2017) applied the steam treatment in soft wheat flours.
There were no differences in lactic acid SRC values and protein extractability due to
steaming of grains (Fig. 2.3). Both results suggested no change in functional contribution of
gluten protein with respect to non-steamed samples. In contrast to our results, denaturation of
gluten and increase in dough stiffness were reported due to steam treatment of wheat flour
(Prakash & Rao, 1999). However, the steam treatment was different in their study compared to

41
ours. Prakash and Rao (1999) applied steam treatment on wheat flour up to 30 min, whereas
wheat kernels were steamed only for 90 s in our study.
2.3.4. Products of lipolytic degradation in stored whole wheat flour
The accumulation of FFA in the stored flour was inversely related to the time of steaming
with 2.2 and 8.8 μmol/ g FFA liberated in flour made from wheat kernels steamed for 90 s and 0
s, respectively (Fig. 2.4). This was expected because the lipase activity was greatly reduced due
to steaming of grains and evolution of FFA was a function of lipase activity over time (Rose &
Pike 2006). FFA in stored flour were highly correlated with the lipase activity of fresh flour (LA-
O: r=0.95, p<0.001; LA-P: r=0.91, p=0.002).
Unlike FFA, steaming of grains did not affect the primary oxidation products, conjugated
dienes and peroxide value, or the secondary oxidation product, hexanal (Fig. 2.4). When bran
fractions were given steam treatment for 60 s, no effect of treatment was reported for conjugated
dienes (Rose et al. 2008). The whole wheat flour was stored in low-density polyethene (LDPE)
plastic bags. These bags were not impermeable to oxygen (Evans & Quinton, 1978). Over a
period of 6 months, the cumulative permeation of oxygen into the storage bag would have been
significant. Furthermore, no effort was made to expel oxygen when sealing the bags for storage.
Therefore, we expect that low availability of oxygen was not the reason that we did not observe
lipid oxidation during storage. The reason for no effect of steaming on oxidation products in our
study may be due to short storage time, which did not provide enough time for oxidation in flour.
Although the stored whole grain flour did not show signs of lipid oxidation, we
hypothesized that the stored flours that had higher accumulation of FFA would be more prone to
oxidation once the flour was mixed with water (i.e., made into a dough). Therefore, we measured

42
the change in carbonyl compounds, which are one of the major end products of lipid
hydroperoxide breakdown, upon making the flour into a dough.
Dough made from the control flour had more carbonyls than the dough made from steam
treated flours (Fig. 2.5). The production of carbonyls in the dough was correlated with the FFA
concentration in the stored flour (r=0.81, p=0.01) and LOX activity in fresh flour (r=0.88,
p=0.001). Therefore, it appeared that the steam treatment was able to prevent lipid oxidation
once flour was made into a dough by limiting the substrates (FFA) available for oxidation and by
partially inactivating LOX. This would be expected to produce a better product from a sensory
point of view, since lipid oxidation products arising from stored whole grain products have been
described as undesirable (Doblado-Maldonado et al., 2012; Bin & Peterson, 2016) Future studies
targeting the decrease in LOX activity and FFA accumulation, along with the addition of
antioxidants at various concentrations, will be interesting and may have an advantage to the
industry to prevent lipid oxidation during dough mixing and handling.
2.4. CONCLUSION
Results from our study suggested that lipolytic activities of whole wheat flour can be
reduced by steaming of wheat kernels without deteriorating starch and gluten properties.
Reduction in lipolytic activity reduced the evolution of FFA during storage and prevented the
generation of lipid oxidation products in dough made from stored whole wheat flour. In addition,
the correlation of FFA and LOX activity with total carbonyl compounds in the dough provides
an opportunity to understand and prevent lipid oxidation in prepared doughs. Furthermore, it
would be interesting to study sensory properties of flour from steamed grains and if steaming can
be applied as a measure to reduce the microbial loads on wheat grains.

43
2.5. REFERENCES
AACC International. (2017). Method 61-02.01 Determination of the pasting properties of rice
with the rapid visco analyser; 56-11.02 Solvent retention capacity profile. In: Approved
Methods of Analysis, 11th ed. St. Paul, MN, USA: AACC International. URL:
http://methods.aaccnet.org/toc.aspx. Accessed 27 June 2017
Anderson, J.V., & Morris, C.F. (2001). An improved whole-seed assay for screening wheat
germplasm for polyphenol oxidase activity. Crop Science, 41, 1697-1705.
Bin, Q., & Peterson, D.G. (2016). Identification of bitter compounds in whole wheat bread
crumb. Food Chemistry, 203, 8-15.
Bookwalter, G.N., Lyle, S.A., & Nelsen, T.C. (1991). Enzyme inactivation improves stability of
self‐rising corn meals. Journal of food science, 56, 494-496.
Cenkowski, S., Ames, N., & Muir, W.E. (2006). Infrared processing of oat groats in a
laboratory-scale electric micronizer. Canadian Biosystems Engineering, 48, 3.17-3.25.
De Almeida, J.L., Pareyt, B., Gerits, L.R., & Delcour, J.A. (2014). Effect of wheat grain
steaming and washing on lipase activity in whole grain flour. Cereal Chemistry, 91, 321-
326.
Delcros, J.F., Rakotozafy, L., Boussard, A., Davidou, S., Porte, C., Potus, J., & Nicolas, J.
(1998). Effect of mixing conditions on the behavior of lipoxygenase, peroxidase, and
catalase in wheat flour doughs. Cereal Chemistry, 75, 85-93.
Doblado-Maldonado, A.F., Pike, O.A., Sweley, J.C., & Rose, D.J. (2012). Key issues and
challenges in whole wheat flour milling and storage. Journal of cereal science, 56, 119-
126.

44
Doblado-Maldonado, A.F., Arndt, E.A., & Rose, D.J. (2013). Effect of salt solutions applied
during wheat conditioning on lipase activity and lipid stability of whole wheat flour.
Food Chemistry, 140, 204-209.
Endo, Y., Li, C. M., Tagiri-Endo, M., & Fujimoto, K. (2001). A modified method for the
estimation of total carbonyl compounds in heated and frying oils using 2-propanol as a
solvent. Journal of the American Oil Chemists' Society, 78, 1021-1024.
Evans, N.T.S., & Quinton, T.H. (1978). Permeability and diffusion coefficient of oxygen in
membranes for oxygen electrodes. Respiration physiology, 35, 89-99.
Goffman, F.D., & Bergman, C. (2003). Relationship between hydrolytic rancidity, oil
concentration, and esterase activity in rice bran. Cereal chemistry, 80, 689-692.
Hansen, L., & Rose, M.S. (1996). Sensory acceptability is inversely related to development of fat
rancidity in bread made from stored flour. Journal of the Academy of Nutrition and
Dietetics, 96, 792.
Hidalgo, A., Brandolini, A., & Gazza, L. (2008). Influence of steaming treatment on chemical
and technological characteristics of einkorn (Triticum monococcum L. ssp. monococcum)
wholemeal flour. Food chemistry, 111, 549-555.
Hu, Y., Wang, L., Zhu, H., & Li, Z. (2017). Modification of physicochemical properties and in
vitro digestibility of wheat flour through superheated steam processing. Journal of Cereal
Science, 74, 231-237.
Jha, P.K., Kudachikar, V.B., & Kumar, S. (2013). Lipase inactivation in wheat germ by gamma
irradiation. Radiation Physics and Chemistry, 86, 136-139.
Li, B., Zhao, L., Chen, H., Sun, D., Deng, B., Li, J., Liu, Y., & Wang, F. (2016). Inactivation of
lipase and lipoxygenase of wheat germ with temperature-controlled short wave infrared

45
radiation and its effect on storage stability and quality of wheat germ oil. PloS one, 11,
e0167330. doi:10.1371/journal.pone.0167330
Mann, D.L., & Morrison, W.R. (1975). Effects of ingredients on the oxidation of linoleic acid by
lipoxygenase in bread doughs. Journal of the Science of Food and Agriculture, 26, 493-
505.
Matheis, G., & Whitaker, J.R. (1984). Modification of proteins by polyphenol oxidase and
peroxidase and their products. Journal of Food Biochemistry, 8, 137-162.
Nicolas, J., & Drapron. R. (1983). Lipoxygenase and some related enzymes in breadmaking. In
P.J. Barnes (Ed.), Lipids in Cereal Technology (pp 213-236). New York: Academic
Press.
O'Connor, J., Perry, H.J., & Harwood, J.L. (1992). A comparison of lipase activity in various
cereal grains. Journal of Cereal Science, 16, 153-163.
Poudel, R., Bhatta, M., Regassa, T., & Rose, D.J. (2017). Influence of foliar fungicide treatment
on lipolytic enzyme activity of whole wheat. Cereal Chemistry, 94, 633-639
Prakash, M., & Rao, P.H. (1999). Effect of steaming on the rheological characteristics of wheat
flour dough. European Food Research and Technology, 209, 122-125.
Rani, K.U., Rao, U.P., Leelavathi, K., & Rao, P.H. (2001). Distribution of enzymes in wheat
flour mill streams. Journal of Cereal Science, 34, 233-242.
Ratnayake, W.S., Otani, C., & Jackson, D.S. (2009). DSC enthalpic transitions during starch
gelatinisation in excess water, dilute sodium chloride and dilute sucrose solutions.
Journal of the Science of Food and Agriculture, 89, 2156-2164.

46
Rose, D.J., Ogden, L.V., Dunn, M.L., & Pike, O.A. (2008). Enhanced lipid stability in whole
wheat flour by lipase inactivation and antioxidant retention. Cereal Chemistry, 85, 218-
223.
Rose, D.J., & Pike, O.A. (2006). A simple method to measure lipase activity in wheat and wheat
bran as an estimation of storage quality. Journal of the American Oil Chemists' Society,
83, 415-419.
Shin, D.J., Kim, W., & Kim, Y. (2013). Physicochemical and sensory properties of soy bread
made with germinated, steamed, and roasted soy flour. Food Chemistry, 141, 517-523.
Suchy, J., Lukow, O.M., Brown, D., DePauw, R., Fox, S., & Humphreys, G. (2007). Rapid
assessment of glutenin and gliadin in wheat by UV spectrophotometer. Crop science, 47,
91-99.
Tait, S.P.C., & Galliard, T. (1988). Effect on baking quality of changes in lipid composition
during wholemeal storage. Journal of Cereal Science, 8, 125-137.
Takasaki, S., Kato, Y., Murata, M., Homma, S., & Kawakishi, S. (2005). Effects of peroxidase
and hydrogen peroxide on the dityrosine formation and the mixing characteristics of
wheat-flour dough. Bioscience, biotechnology, and biochemistry, 69, 1686-1692.
Wrolstad, R. E., Acree, T. E., Decker, E. A., Penner, M. H., Reid, D. S., Schwartz, S. J.,
Shoemaker, C. F., Smith, D. M., & Sporns, P. (2005). Handbook of Food Analytical
Chemistry: Water, Proteins, Enzymes, Lipids, and Carbohydrates. New York: Wiley,
(Chapter D2).
Zhang, D., & Moore, W.R. (1999). Wheat bran particle size effects on bread baking performance
and quality. Journal of the Science of Food and Agriculture, 79, 805-809.

47
47
Table 2.1. Mean values of differential scanning calorimeter (DSC) gelatinization endotherms and rapid visco analyzer (RVA) pasting
properties of untreated and steam-treated whole wheat flours.A
DSC RVA
Time of
steaming
(s) To (°C) Tp (°C) Tc (°C) ΔH (J/g)
Peak
viscosity
(cP)
Trough
viscosity
(cP)
Break-
down (cP)
Final
viscosity
(cP)
Setback
viscosity
(cP)
Peak time
(min)
Pasting
temper-
ature (°C)
0
(control) 62.0bc 65.4 68.0 6.0 895 647 248 1452 806 5.3 89.2
15 62.2bc 65.2 68.1 5.9 888 628 259 1445 817 5.2 89.2
30 61.7c 65.1 68.0 6.3 887 650 238 1431 782 5.4 88.8
45 61.9bc 66.4 68.3 6.4 888 649 239 1424 775 5.3 89.2
60 62.9ab 66.0 68.9 5.9 892 633 260 1409 776 5.3 89.2
75 61.7c 65.2 68.3 6.6 888 620 268 1412 792 5.3 89.2
90 63.9a 66.9 69.8 5.9 884 608 276 1433 825 5.3 89.5
p-value 0.03 0.13 0.18 0.25 0.37 0.75 0.8 0.35 0.71 0.49 0.84 A Means followed by different lower-case letters within a column are significantly different at α=0.05.

48
Figure 2.1. Flow diagram of experimental design.
Two lots of wheat kernels
Steam treatment
(15-90 s)
Whole wheat flour
Steam treated wheat
Milling
Fresh flour Storage for 6 months
• Enzyme activities • Physicochemical
changes in starch and protein
• Hydrolytic rancidity
• Oxidative rancidity
Control (steam treatment 0 s)

49
Figure 2.2. Reduction in enzyme activities as a function of time of steaming: (a) lipase using p-
nitrophenyl palmitate (LA-P), olive oil (LA-O), and esterase using p-nitrophenyl butyrate (EA-
B) as substrates; (b) lipoxygenase (LOX); (c) polyphenol oxidase (PPO); and (d) peroxidase
(POD); within each subfigure points labeled with different lower-case letters are significantly
different at α=0.05.

50
Figure 2.3. Influence of steaming on gluten protein properties: (a) lactic acid solvent retention
capacity (SRC); (b) extractability of gliadin-rich fraction; and (c) extractability of glutenin-rich
fraction; within each subfigure no bars are significantly different at α=0.05.

51
Figure 2.4. Products of lipid degradation measured in stored whole wheat flours that were milled
from untreated or steam-treated wheat: (a) free fatty acids (FFA); (b) conjugated dienes (CD); (c)
peroxide value (PV); and (d) hexanal; within each subfigure bars labeled with different lower-
case letters are significantly different at α=0.05.

52
Figure 2.5. Carbonyl compounds produced in dough made from stored whole wheat flours that
were milled from untreated or steam-treated wheat; bars labeled with different lower-case letters
are significantly different at α=0.05.

53
CHAPTER 3 GERMINATION TIME AND DRYING TEMPERATURE AFFECT
COMPOSITIONAL AND FUNCTIONAL PROPERTIES OF GERMINATED WHEAT
FLOUR
3.1. ABSTRACT
The compositional [phytic acid, thiamine, lysine, free asparagine, and γ-aminobutyric
acid (GABA)] and functional (dough mixing properties and lipolytic activities including lipase,
esterase, and lipoxygenase) properties were quantified in germinated flour obtained from wheat
kernels germinated for 24 h, 48 h, or 72 h and dried at either 40 °C or 60 °C. The phytic acid,
thiamine, and dough strength of germinated whole grain flour decreased, whereas lysine,
asparagine, GABA, lipase, esterase, and lipoxygenase activities increased compared with
ungerminated flour. The mixing time was not affected by germination time. A small but
significant effect of drying temperature was observed for free asparagine, GABA, dough
strength, and lipase and esterase activities. Drying temperature did not show any differences
when the grains were germinated for up to 48 h. Germinated whole grain flour was added to
ungerminated flour at 2, 5, and 10 % (flour basis). Doughs and breads made from these
composite flours had improved mixing characteristics, loaf volume, and texture, except at the
highest proportions and from longer germination times. The findings from this study may
provide important information to the food industry when formulating germinated, grain-based
products.
Keywords: phytic acid, thiamine, lysine, free asparagine, γ-aminobutyric acid, dough mixing
properties, lipolytic activities

54
3.2. INTRODUCTION
Germination is a physiological process where a cascade of biochemical changes occur to
facilitate the development of a seedling. During germination of wheat, the composition is altered,
including increases in free amino acids, free and bound phenolics, enzymatic activities, and
protein and starch hydrolysis (Ohm et al., 2016; Simsek et al., 2014). The digestibility of protein
and mineral dialyzability of grains are also improved as a result of germination (Albarracín et al.,
2013). The increase in γ-aminobutyric acid (GABA) during germination has attracted the interest
of many researchers since GABA was first associated with the treatment of neurological
disorders (Mody et al., 1994).
Due to these beneficial changes occurring during germination, there has been an increase
in demand for sprouted grains (Whole grain council, 2018). The number of new products based
on sprouted or germinated grains has increased by 26% in the last four years and is expected to
continue to grow (Pagand et al., 2016).
Despite the improved nutritional value of sprouted or germinated wheat, an increase in
amylolytic and proteolytic activities may degrade the functionality of the resulting flour making
product development difficult (Baranzelli et al., 2018). Furthermore, an increase in lipolytic
activities during germination may increase susceptibility to rancidity (Doblado-Maldonado et al.,
2013).
Previously, several studies have focused on the phytochemical composition of
germinated grains and their possible health benefits (Imam et al., 2012; Ohm et al., 2016);
however, there is limited information regarding the effect of germination conditions on
compositional and mixing properties of germination flour. Alterations in composition due to
germination time and kilning temperature may have a confounding effect on the composition of

55
the germinated grains (Brennan et al., 2011). Thus, the objectives of this study were to 1)
quantify the compositional and functional properties of germinated whole wheat flour; and 2)
determine the mixing and baking properties of whole wheat flour supplemented with germinated
flour at different proportions.
3.3. EXPERIMENTAL
3.3.1. Chemicals and reagents
The chemicals and reagents used in this study were: ferric ammonium sulfate (7783-83-7,
MP Biomedicals,LLC), 2,2’-bipyridine, thioglycolic acid (68-11-1, Alfa Aesar), phytic acid,
sodium salt (14306-25-3,Sigma), tetrasodium pyrophosphate (7722-88-5, Sigma), picrylsulfonic
acid solution (2508-19-2, Sigma), lysine-HCl (potassium ferric cyanide (13746-66-2, Fisher
Chemical), anhydrous sodium acetate (127-09-3), pancreatin from porcine pancreas (8049-47-6,
Sigma), sodium hydroxide (1310-73-2, Fisher Scientific), isobutanol (78-83-1, Alfa Aesar),
thiamine hydrochloride (67-03-8, Sigma), phosphorous pentoxide (1314-56-3, Fisher Chemical),
quinine sulfate (6119-70-6, ACROS), sulfuric acid, deuterium oxide (D2O) (7789-20-0),
methanol-d1 (CH3OD) (1455-13-6), 3-(trimethylsilyl)propionic-2,2,3,3-d4 acid sodium salt
(24493-21-8, Alfa Aesar), oleic acid (112-80-1, Alfa Aesar), linoleic acid (60-33-3, ACROS), p-
nitrophenyl palmitate (1492-30-4, Sigma), p-nitrophenyl butyrate (2635-84-9, Sigma), p-
nitrophenol (100-02-7,ACROS, Thermo Fisher Scientific), sodium dodecyl sulfate (151-21-3,
Fisher Bioreagents), and triton X-100 (9002-93-1, Calbiochem).
3.3.2. Germination procedure and sample preparation
Four commercial blends of hard wheat were obtained from Bay State Milling (Winona,
MN). Foreign material was removed by hand and ~400 g of cleaned wheat was soaked in water
in duplicate for 4-5 h. After draining the water, the grains were spread on a paper plate lined with

56
two damp, water absorbent paper towels. The wheat was then covered with a single layer of wet
absorbent paper and an inverted paper plate and kept at 22 °C (room temperature) for 24, 48, or
72 h for germination. To prevent mold accumulation, the plates were flipped three times per day
and the wheat was moved to new paper plates every 24 h. To maintain moisture, the wheat grains
were misted 3 times per d with water from a manual spray bottle (~2 mL water per application).
Following the prescribed germination time, the grains were dried in a forced air draft
oven at 40 °C or 60 °C for 12 h and then milled using a cyclone mill equipped with a 1 mm
screen (UDY Corp., Fort Collins, CO, USA).
3.3.3. Composition of germinated flours
Phytic acid was quantified as described (Gulati and Rose, 2018) with a few
modifications. To 0.2 g of flour, 10 mL of 0.2 N HCl was added followed by continuous
horizontal shaking at 80 rpm at 4 °C overnight. Afterward, the tubes were centrifuged at 5000g
for 15 min at 4 °C. The supernatant was diluted with distilled water by 2.5-fold and was used for
the further analysis. To a separate tube, 0.2 mL of diluted extract, 0.8 mL of 0.2 N HCl, and 1
mL of ferric ammonium sulfate (415 µM) were added, and the tubes were kept in a boiling water
bath for 30 min. After cooling to room temperature, the tubes were centrifuged for 15 min. One
mL of the supernatant was added to 1.5 mL of 2,2’-bipyridine solution (1 g of 2,2’-bipyridine
and 1 mL of thioglycolic acid diluted to 100 mL with water) to develop the color. The
absorbance was recorded at 522 nm. Quantification was by means of external calibration using
phytate standard solutions ranging from 0 to 25 µg/mL. The concentration of phytic acid in the
sodium salt used for external calibration was determined using inductively coupled plasma-mass
spectrometry as described (Gulati and Rose, 2018).

57
Lysine was quantified as described (Singh et al. 2001) with a few modifications. Briefly,
1.5 mL of 0.05 M tetrasodium pyrophosphate-HCl (pH 9.4) was added to a 2 mL
microcentrifuge tubes containing 0.01 g of flour. The tubes were extracted on a horizontal
reciprocal shaker at 80 rpm for one hour at room temperature followed by the centrifugation at
13500g for 8 min. The supernatant was diluted 2-fold with the extraction buffer, and 1 mL of
diluted sample was added to a separate tube followed by the addition of 0.01 mL of 2,4,6-
trinitrobenzenesulfonic acid solution (3.4 mM) and the reaction proceeded for 1 h at room
temperature. The absorbance readings were taken at 420 nm. Quantification was by means of
external calibration using lysine-HCl standard solutions ranging from 0-100 µg/mL.
Thiamine was quantified as described in AACCI approved method 86-80.01.
Free asparagine and GABA were quantified using nuclear magnetic spectroscopy (NMR)
as described (Baker et al., 2006). Briefly, 1 mL of D2O:CH3OD (80:20, v/v) was added to a 2 mL
microcentrifuge tube containing 30 mg of flour. The tubes were extracted at 90 °C for 10 min
followed by centrifugation at 5000g and 4 °C for 10 min. The supernatant was transferred to a
separate tube and kept at 4 °C for 45 min. The tubes were again centrifuged for 5 min and 0.4
mL of this supernatant was transferred to a 5 mm NMR tube followed by the addition of 0.06 mL
internal standard [3-(trimethylsilyl)propionic-2,2,3,3-d4, 0.125 mg/mL]. The regions selected for
free asparagine quantification were δ2.92-2.97 ppm and δ1.88-1.89 and for GABA: δ2.28-2.29
and δ3.01-3.02 ppm (Baker et al., 2006). All compositional components were expressed on a dry
weight basis.
3.3.4. Enzyme activities of germinated flour
Lipase (triacylglycerol hydrolase, EC 3.1.1.3), esterase (carboxyl ester hydrolases, EC
3.1.1.1), and lipoxygenase (LOX, EC 1.13.11.12) activities were quantified as described in

58
Poudel et al. (2017). Lipase activity was quantified using olive oil as the substrate (LA-O) and
using p-nitrophenyl palmitate (LA-P) as the substrate. This was done because our previous
publication showed that these two substrates give different results. Esterase was quantified using
the water-soluble p-nitrophenyl butyrate as substrate (EA-B). All enzymatic activities were
expressed on a dry weight basis.
3.3.5. Mixing properties of germinated flours
Mixing properties of germinated flours were quantified as described (approved method
54-40.02, AACC International 2018). The mixograms were evaluated with the Mixsmart
software (version 4.0, National manufacturing) and 44 midline and envelope output variables
were obtained.
3.3.6. Mixing and baking properties of composite flours
To observe the change in mixing and baking properties of whole wheat flour due to the
addition of germinated flour, samples dried at 40 °C from 24, 48, and 72 h of germination were
used to prepare composite flour. Samples dried at 60 °C were not used due to the similarity in
composition and enzyme activity to those dried at 40 °C. The germinated flour was added to
commercial whole wheat flour at 2, 5, and 10% (flour basis) in two replications.
Mixing properties and falling number of composite flours were quantified as described
(approved methods 54-40.02 and 56-80.03, AACC International 2018).
Bread made from composite flours was baked using a straight dough breadmaking
method as described (approved method 10-10.03, AACC International 2018), where water
absorption and mixing time were estimated from the Mixograph outputs. Bread crumb structure
was evaluated using an imaging system (C-Cell, Calibre Control International, Warrington, UK).

59
Bread loaf volume and texture were measured as described (approved methods 10-05.01 and 74-
10.02; AACC International 2018).
3.3.7. Statistical analysis
The experimental design was a randomized complete block design and the treatment
structures were augmented factorials [wheat lot (lot) X germination time (GT) X drying
temperature (Temp) + control]. A three-way analysis of variance (ANOVA) was used to test the
main and simple effects of the treatments. The least squares means of the main effects and two-
way interactions were not estimable due to the augmented factorials (Marini, 2003). Therefore,
response variables were averaged across their respective two-way interactions or main effects.
Mean separations were performed using Fisher’s least significant difference procedure.
Pearson’s correlation coefficients and principal component analysis (PCA) were calculated based
on the least squares means.
The Mixograph and C-Cell outputs gave too many variables to reasonably report.
Therefore, ANOVA, PCA, and correlation were used to systematically reduce the number of
variables and retain only those variables that independently described the significant differences
among samples. Specifically, ANOVA was performed on all variables and the variables that
showed significance for at least one term in the model were retained for PCA. In the PCA
analysis, principal components explaining a combined >65% of the variation in the data were
retained. Then, variables with Eigenvectors in the top and bottom 20% on those principal
components were retained. The selected variables were analyzed by correlation, and uncorrelated
(independent) variables (r<0.65) were finally selected for the data presentation. For the
germinated and composite flours, midline peak time (MPT) and midline peak value (MPV) were
selected from the original 44 Mixograph variables. For the bread crumb characteristics, cell
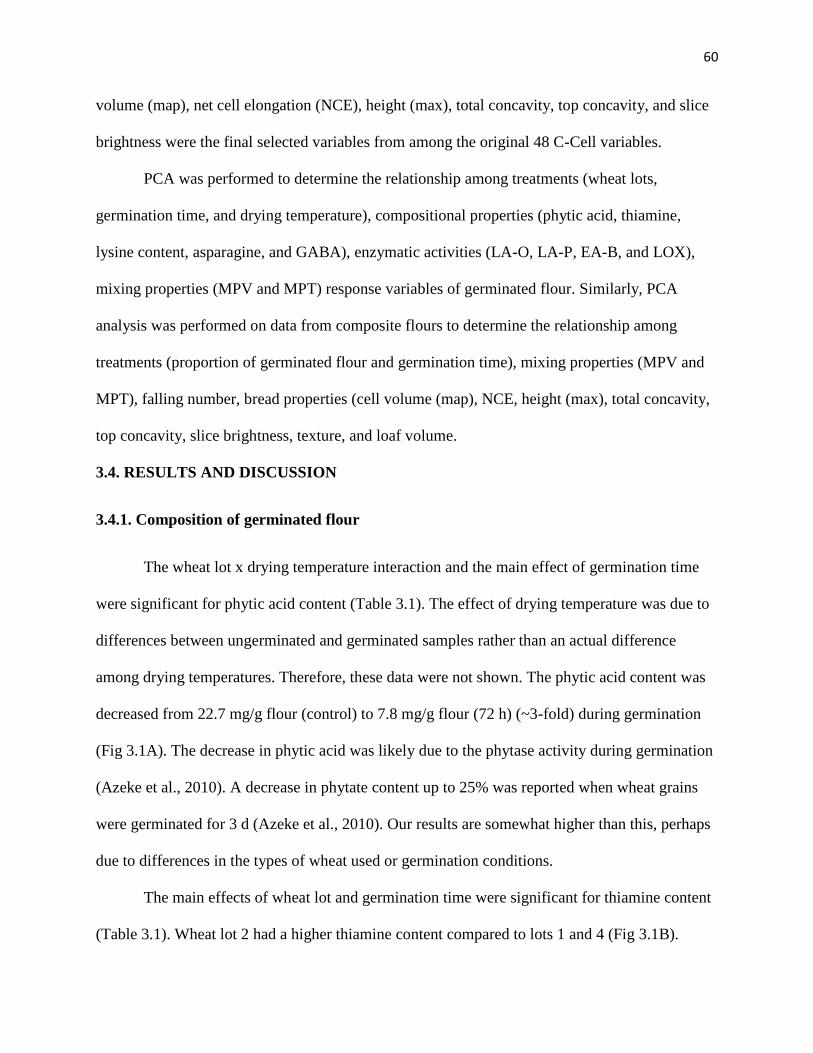
60
volume (map), net cell elongation (NCE), height (max), total concavity, top concavity, and slice
brightness were the final selected variables from among the original 48 C-Cell variables.
PCA was performed to determine the relationship among treatments (wheat lots,
germination time, and drying temperature), compositional properties (phytic acid, thiamine,
lysine content, asparagine, and GABA), enzymatic activities (LA-O, LA-P, EA-B, and LOX),
mixing properties (MPV and MPT) response variables of germinated flour. Similarly, PCA
analysis was performed on data from composite flours to determine the relationship among
treatments (proportion of germinated flour and germination time), mixing properties (MPV and
MPT), falling number, bread properties (cell volume (map), NCE, height (max), total concavity,
top concavity, slice brightness, texture, and loaf volume.
3.4. RESULTS AND DISCUSSION
3.4.1. Composition of germinated flour
The wheat lot x drying temperature interaction and the main effect of germination time
were significant for phytic acid content (Table 3.1). The effect of drying temperature was due to
differences between ungerminated and germinated samples rather than an actual difference
among drying temperatures. Therefore, these data were not shown. The phytic acid content was
decreased from 22.7 mg/g flour (control) to 7.8 mg/g flour (72 h) (~3-fold) during germination
(Fig 3.1A). The decrease in phytic acid was likely due to the phytase activity during germination
(Azeke et al., 2010). A decrease in phytate content up to 25% was reported when wheat grains
were germinated for 3 d (Azeke et al., 2010). Our results are somewhat higher than this, perhaps
due to differences in the types of wheat used or germination conditions.
The main effects of wheat lot and germination time were significant for thiamine content
(Table 3.1). Wheat lot 2 had a higher thiamine content compared to lots 1 and 4 (Fig 3.1B).

61
Thiamine content decreased by about 20% during 72 h of germination (Fig 3.1C). In accordance
with our result, Žilić et al. (2013) found a slight decrease in thiamine content in sprouted wheat
samples. Metabolism of thiamine or leaching during the soaking step or from the sprout to the
environment may be reasons for a decrease in thiamine (Golda et al., 2004).
The wheat lot x drying temperature and wheat lot x germination time interactions were
significant for available lysine (Table 3.1). Like phytic acid, the interaction of wheat lot x drying
temperature was due to differences from the control rather than an actual difference of drying
temperature. Therefore, these data were not shown. All germinated samples (except lot 3)
increased from ~0.8 mg available lysine/g in ungerminated flour to 1.8-2.0 mg/g in germinated
flours (2-3-fold increase; Fig 3.1D). As much as a 5-fold increase in available lysine was
previously reported when the wheat was germinated for 2 d (Hamad and Fields, 1979). The
increase in available lysine has been attributed to the degradation of storage proteins with a
corresponding increase in albumins (Simsek et al., 2014). Interestingly, the available lysine in lot
3 did not change due to germination, which hinted that not all grains would produce similar
responses during germination.
The three-way wheat lot x germination time x drying temperature interaction was
significant for asparagine concentration (Table 3.1). Because the significant effect of wheat lot
appeared to be due to differences in magnitude rather than a true crossover effect, and the
interaction of germination time x drying temperature was not significant, only the main effects of
germination time were shown. The asparagine concentration increased over the course of
germination from ~0.3 mg/g in ungerminated flour to ~6.2 mg/g in flour from 72 h germination
time (Fig 3.1E). There was no difference between flour germinated for 24 h and ungerminated
flour in our study, which suggested that the increase in free asparagine in the flour occurs during

62
later stages of germination. The increase in asparagine content in the germinated sample has
been attributed to protein hydrolysis (Simsek et al., 2014). The increase in free asparagine in the
germinated flour may have a detrimental effect on the human health because of the involvement
of free asparagine in Maillard reaction to produce the carcinogenic compound, acrylamide
(Granby et al., 2008). In a previous study, wheat germinated for 5 d at room temperature showed
an increase in free asparagine from 0.3 to 1.1 mg/g flour (Ohm et al., 2016). The increase in free
asparagine in our study was higher compared to Ohm et al. (2016) which may be due to different
methods used to quantify asparagine, germinating conditions, and genetic differences among the
wheat samples. Indeed, the variation among the different wheat lots used in our study indicated
that the increase in asparagine concentration over the course of germination is highly variable.
A significant three-way interaction between wheat lot x germination time x drying
temperature was observed for GABA (Table 3.1). The effect of wheat lot was due to a change in
magnitude rather than a crossover; therefore, only the two-way interaction of germination time
and drying temperature was shown. A differential effect of drying temperature on GABA was
observed in flours germinated for 72 h (Fig 3.1F). In contrast, no such differences with respect to
temperature were observed at 24 h and 48 h of germination. It appeared that the drying affects
the concentration of GABA, but only after extended germination. The GABA concentration
increased from ~0.1 mg/g in ungerminated flour to 3-5 mg/g in germinated flour (72 h of
germination). Ohm et al. (2016) reported that the GABA concentration was increased up to 249.3
± 5.2 µg/g flour after five days of germination, whereas the GABA concentration was not
detected in ungerminated flour. The increase in GABA during germination has been attributed to
the increase in activity of glutamate decarboxylase, which decarboxylates L-glutamate and
releases GABA (Baranzelli et al., 2018).

63
3.4.2. Lipase, esterase, and lipoxygenase activities of germinated flour
All two-way interactions were significant for lipase activity measured with olive oil as
the substrate (LA-O) (Table 3.1). Similar to phytic acid and lysine, the effect of drying
temperature on the interaction of drying temperature x germination time was due to differences
from the control rather than an actual difference between 40 °C and 60 °C. Therefore, these data
were not shown. The interaction of wheat lot and germination time showed no differences
between the control and 24 h germinated flour samples (Fig 3.2A). Among wheat lots, LA-O was
lower in lot 4 compared to other lots at 48 h and 72 h of germination. The LA-O activities of
wheat lot 1 and lot 2 were higher when the wheat was dried at 40 °C compared to 60 °C, whereas
no such effect was observed for other lots (Fig 3.2B).
A significant effect of drying temperature x germination time was observed for lipase
activity measured with p-nitrophenyl palmitate as the substrate (LA-P) (Table 3.1). The LA-P
activity increased 3-fold during germination, ranging from 0.8 to 2.5 (U/g) (Fig 3.2C). The LA-P
activity at 48 h and 72 h of germination was higher at 40 °C than 60 °C. The reason for the lower
LA-P at 60 °C may be the partial denaturation of the enzyme at a high temperature. The LA-P
activity was more heat liable compared to the LA-O activity (Poudel and Rose, 2018), which
may be the reason for the differences in LA-O and LA-P activities with respect to drying
temperature.
An increase in lipase activity during germination had been reported in wheat, oats, barley,
and other cereal grains (Tavener and Laidmain, 1972). The increase in lipase activity may aid to
mobilize the energy from storage triacylglycerols to the developing sprouts. The increase in
lipase activity only after 48 h of germination suggests that lipase activity is initiated later in the
germination process. Similar results were reported by Tavener and Laidman (1972), who found

64
low (almost none) lipase activity in the bran of wheat after 24 h of the germination, however, the
activity was increased after 6 d of germination.
The main effects of wheat lot, temperature, and germination time were significant for
esterase activity with p-nitrophenyl butyrate as the substrate (EA-B) (Table 3.1). The differences
among lots were minor, with wheat lot 4 having the lowest EA-B (mean ± SD: 17 ± 3.1 U/g) and
lots 1 and 2 having the highest (18 ± 2.6 U/g). Therefore, these data were not shown. An increase
in EA-B activity from 15 to 20 U/g was observed due to germination (Fig 3.2D). The EA-B
activity was higher at 48 h and 72 h of germination compared to the control and the samples
germinated for 24 h. The EA-B activity was higher at 40 °C than 60 °C, which suggested that the
higher drying temperature reduces the EA-B activity (Fig 3.2E). In comparison to lipase activity
(LA-O and LA-P), the increase in esterase activity (EA-B) during germination was slower in our
study. Similar results were reported in rice, where the increase in lipase activity was initially
faster compared to the increase in esterase activity during the germination period of 7 d
(Palmiano and Juliano, 1973).
The main effects of germination time and drying temperature were significant for
lipoxygenase (LOX) activity (Table 3.1). Although significant, there was only a slight effect on
LOX activity when samples were dried at 40 °C (mean ± SD: 6.1 ± 1.0 U/g) compared with 60
°C (mean ± SD: 6.4 ± 0.9 U/g). Therefore, these data were not shown. The LOX activity initially
decreased (24 h) and then increased (48 h and 72 h) during the germination process (Fig 3.2F).
An initial decrease in LOX activity followed by the increase in prolonged germination time was
reported in wheat (Sun et al., 2012). Like lipase, LOX plays an important role in mobilizing
energy during sprouting by oxidizing storage lipids (Kubicka et al., 2000) and similar to lipase,

65
the expression of lipoxygenase is delayed in the germinated grains, which may be a reason for
increased LOX activity after 48 h of germination in our study.
3.4.3. Mixing properties of germinated flour
As explained, MPT and MPV were ultimately selected from among the original 44 Mixograph
variables to describe the mixing properties of germinated flours. The MPT and MPV gave
information about the mixing time required to develop the dough and the strength of the dough at
the peak time, respectively.
The mixing time of germinated flour was influenced by the germination time (Table 3.1).
There was no difference in mixing time between the control (3.7 ± 0.4 min) and the germinated
flours; however, the mixing time of the samples germinated for 24 h (4.7 ± 1.0 min) was longer
than samples germinated for 48 h (3.2 ± 0.8 min), and 72 h (3.4 ± 2.7 min). In a previous study,
mixing time of flour was reduced from 5.2 ± 0.22 min to 1.3 ± 0.25 min after 3 d of germination
(Ohm et al., 2016), which is lower compared to our study.
The main effects of germination time and drying temperature significantly affected dough
strength of germinated flours (Table 3.1). The dough strength decreased progressively with
longer germination times (48.9 ± 3.5 %, 31.4 ± 3.5 %, 30.1 ± 4.7 %, and 18.9 ± 6.5 % for the
control, 24 h, 48 h, and 72 h germinated flours, respectively). A decline in dough strength by
50% compared to ungerminated flour after 3 d of germination was reported previously (Ohm et
al., 2016). The decline in dough strength was likely due to proteolytic degradation of high
molecular weight (HMW) proteins (Simsek et al., 2014). The dough strength of flour dried at 40
°C (28.9 ± 5.3 %) was significantly higher compared to the GF dried at 60 °C (24.6 ± 8.7 %).
3.4.4. Multivariate analysis of compositional, enzymatic, and mixing properties of
germinated flours

66
Principal components analysis was used to visualize the relationships among samples
based on compositional, enzymatic, and the selected mixing properties data. The first two PCs
accounted for a large percentage (70%) of the variance among germinated flour data (Fig 3.3).
Variables with high Eigenvectors on PC1 were phytic acid, thiamine, dough strength, GABA,
and asparagine. Thiamine, phytic acid, and dough strength were negatively correlated with
asparagine and GABA. Variables with high Eigenvectors on PC2 were mixing time and enzyme
activities. The scatter plot of PC1 and PC2 showed that samples clustered based on germination
time. Dough strength, phytic acid, and thiamine were closely associated with the control. Mixing
time was closely associated with the samples that had been germinated for 24 h. Enzyme
activities and free amino acids were associated with the samples that had been germinated for 72
h. The samples that were germinated for 48 h clustered in the center of the plot, indicating that
these samples had moderate levels of all variables. These data support the ANOVA results
reported above, but also clearly indicate the overarching importance of germination time over
drying temperature and wheat lot to the compositional and functional properties of the
germinated whole grain flours.
3.4.5. Mixing properties, falling number, and bread characteristics of composite flours
To determine the effect of the addition of a small proportion of germinated flour on the
functional properties of ungerminated flour, composite flours were made by combining
germinated flour at up to 10% of the ungerminated flour weight. Dough strength of the
composite flours was affected by the addition of germinated flour at different proportions rather
than the length of germination time. The dough strength of composite flours was 47.2 ± 2.8 (0%
germinated flour), 49.9 ± 2.8 (2% germinated flour), 45.9 ± 2.3 (5% germinated flour), and 45.5
± 2.9 (10% germinated flour). The dough strength of composite flour containing 2% germinated

67
flour was significantly higher than composite flours containing 5 and 10% germinated flour, but
no difference was observed when compared to samples containing ungerminated flour. It
appeared that the addition of germinated flour at low proportions improved or maintained the
dough strength. The different proportions used in this study were not enough to show a decline in
dough strength compared to ungerminated flour, although it is likely from the germinated flour
data that very high proportions of germinated flour may decrease dough strength.
The mixing time of composite flours was affected by the germination time rather than the
proportion of germinated flour. The mixing time of composite flours was 3.4 ± 0.4 min
(ungerminated), 5.9 ± 0.3 min (germinated 24 h), 5.6 ± 0.7 min (48 h), and 6.5 ± 0.5 min (72 h).
This result was in line with Ritcher et al. (2014), who reported better (i.e., longer) mixing
properties of partially germinated flour than the ungerminated flour.
The falling number of composite flours was affected by the interaction of germination
time and proportion of germinated flour (Table 3.2). The falling number declined with the
increase in germination time and the proportion of germinated flour. The falling number of
ungerminated flour was 301 s and it declined to 62 s when 10% germinated flour (72 h) was
added, which may be due to the increase in α-amylase activity by the addition of germinated
flour (Ral et al., 2016). Falling numbers >300 s are considered free of sprout damage and
considered sound wheat grains, while falling numbers <160 s are unsuitable for breadmaking
(Kruger, 1994). In our study, only composite flours that had been germinated for 24 h (all
proportions) and 48 h (2% proportion only) had falling numbers >160 s.
For bread made from composite flours, the cell volume, NCE, height (max)/ px, total
concavity, top concavity, slice brightness, and loaf volume were significantly affected by the
interaction of germination time and proportion of germinated flour (Table 3.2). The bread made

68
from composite flours containing flour that had been germinated for 24 h at 2% and 5% addition
and 72 h at 10% proportion had larger cell volume compared to the bread made from
ungerminated flour (control). The cell volume ranged from 5.5 ± 0.4 to 6.9 ± 0.2. The net cell
elongation of bread made from composite flours containing flour that had been germinated for 24
h at 2% addition, 48 h at 5% addition, and 72 h at 2% addition were lower than the control.
Although significant differences were observed for NCE, the magnitude of the difference was
low. The cell volume and cell elongation represented a scoring system which was related to the
sensory evaluation of the bread, with larger cell volume and elongated cells being more desirable
compared to small cell volumes and spherical/round cells (C-Cell, 2018). It appeared that the
addition of germinated flour improved or maintained the bread quality as given by bread scoring.
The shape of the bread made from composite flours, as measured by height (max), top
concavity, and total concavity, were similar to the bread made from ungerminated flour (Table
3.2). The bread made from composite flours containing flour that had been germinated for 24 h
at 5% addition, 48 h at all proportions, and 72 h at 2% and 10% addition showed a difference in
the bread shapes compared to the control as given by height, total concavity, and top concavity.
Except for the height of the bread made from composite flour containing flour that had been
germinated for 72 h (10%), the shape of the bread from other formulations was comparable or
slightly improved compared to the control.
The addition of germinated flour improved the slice brightness compared to control
(Table 3.2). The slice brightness was improved either by the addition of a large proportion of
germinated flour from short germination time or by the addition of small amount of germinated
flour from long germination time.

69
The loaf volume of bread was improved by the addition of germinated flour in all
formulations except for composite flour containing flour that had been germinated for 72 h at
10% addition. An increase in loaf volume by 5-9% was reported in bread made with sprouted
wheat flour (Richter et al., 2014). Composite flour containing flour that had been germinated for
72 h at 10% addition likely had reduced quality due to excessive amylase or protease activity
(Olaerts and Courtin, 2018). The bread firmness was not influenced by the germination time and
proportion of germinated flour added to the ungerminated flour (Table 3.2). In contrast to our
results, crumb texture of the bread made from sprout damaged wheat grains (falling number
<200 s) was deteriorated compared to bread made from sound wheat grains (falling number >
300 s) (Olarets and Courtin, 2018). Though the falling number of composite flours in our study
reduced to 62 s, we did not find any difference in bread firmness, which may be due to the
differences in the degradation of starch matrix resulting from different sprouting conditions and
genetic differences of the samples.
3.4.6. Multivariate analysis of mixing properties, falling number, and bread characteristics
of composite flours
As with the germinated flours, principal components analysis was used to visualize the
relationships among samples based on mixing properties, falling number, and bread
characteristics. In composite flours and breads, the first two PCs accounted for a large percentage
(65%) of the variation. Variables with high Eigenvectors on principal component 1 were texture,
dough strength, mixing time, cell volume, slice brightness, total concavity, and falling number
(Fig 3.4). Variables with high Eigenvectors on principal component 2 were loaf volume, height
(max), and NCE. The scatter plot of principal components 1 and 2 showed composite flours
containing flour that had been germinated for 24 h (all proportions) clustered together and were

70
associated with loaf volume and slice brightness. The composite flour containing flours that had
been germinated for 48 h and 72 h were scattered in the PC. The composite flour containing flour
that had been germinated for 72 h at 2% addition was close to the composite flours containing
the 24 h germination time flour. The falling number, texture, and NCE were associated with the
composite flours containing flour that had been germinated for 48 h at 2% and 5% addition. The
cell volume and mixing time were associated with composite flours containing flour that had
been germinated for 48 h at 10% addition and 72 h at 5% addition, whereas total concavity and
height (max) were associated with composite flours containing 72 h germinated flours.
The responses of composite flours containing flour from the short germination times were
similar regardless of the amount of flour added. Both germination time and proportion of the
flour being added played an important role in the functional properties of flour supplemented
with flour that had been germinated for the longest time (72 h). Overall these findings showed
that composite flour supplemented with germinated flour at a lower proportion from long
germination time showed a similar response to the flour supplemented with germinated flour
from a short time at higher proportions.
3.5. CONCLUSION
Results from this study suggested that the compositional and functional properties of the
wheat grains were primarily influenced by germination duration rather than wheat lot or drying
temperature. The biochemical reaction pathways during germination bring many desirable and
undesirable changes. The decrease in phytic acid and increase in lysine and GABA improved the
nutritive value of the flour, whereas an increase in lipolytic activities (lipase, esterase, and
lipoxygenase) may lower the shelf life of the flour. Furthermore, an increase in free asparagine
may increase the risk of increased acrylamide in the baked products via Maillard reaction. When
71
germinated flour was added to sound flour at low percentages (up to 10%), the mixing and
baking characteristics of the bread made from the composite flour was generally improved;
however, extensive germination duration or high inclusion percentages lowered the quality of the
bread. In future, it would be interesting to look at the sensory properties of the bread made from
such composite flour.

72
3.6. REFERENCES
AACC International., 2018. Method 86-80.01 Thiamine -Thiochrome method; 54-40.02
Mixograph method; 56-81.03 Determination of falling number; 10-10.03 Optimized
Straight-Dough Bread-Making Method10-05.01 Guidelines for Measurement of Volume
by Rapeseed Displacement; 74-10.02 Measurement of Bread Firmness -- Compression
Test. In: Approved Methods of Analysis, 11th ed. St. Paul, MN, USA: AACC
International. URL: http://methods.aaccnet.org/toc.aspx Accessed in July 2018.
Albarracín, M., González, R.J., Drago, S.R., 2013. Effect of soaking process on nutrient bio-
accessibility and phytic acid content of brown rice cultivar. LWT- Food Sci. Technol. 53,
76-80.
Azeke, M.A., Egielewa, S.J., Eigbogbo, M.U. Ihimire, I.G., 2011. Effect of germination on the
phytase activity, phytate and total phosphorus contents of rice (Oryza sativa), maize (Zea
mays), millet (Panicum miliaceum), sorghum (Sorghum bicolor) and wheat (Triticum
aestivum). J. Food Sci. Technol. 48, 724–729.
Baker, J.M., Hawkins, N.D., Ward, J.L., Lovegrove, A., Napier, J.A., Shewry, P.R., Beale, M.H.,
2006. A metabolomic study of substantial equivalence of field‐grown genetically
modified wheat. Plant Biotechnol. J. 4, 381–392.
Baranzelli, J., Kringel, D.H., Colussi, R., Paiva, F.F., Aranha, B.C., de Miranda, M.Z., da Rosa
Zavareze, E., Dias, A.R.G., 2018. Changes in enzymatic activity, technological quality
and gamma-aminobutyric acid (GABA) content of wheat flour as affected by
germination. LWT- Food Sci. Technol. 90, 483-490.

73
Brennan, C., Brennan, M., Derbyshire, E., Tiwari, B.K., 2011. Effects of extrusion on the
polyphenols, vitamins and antioxidant activity of foods. Trends Food Sci. Technol. 22,
570-575.
C-cell, 2018. Bread baking. https://www.bakingqualityanalyser.com/bread-bakers/ Accessed in
August 2018.
Doblado-Maldonado, A.F., Pike, O.A., Sweley, J.C., Rose, D.J., 2012. Key issues and challenges
in whole wheat flour milling and storage. J. Cereal Sci. 56, 119–126.
Golda, A., Szyniarowski, P., Ostrowska, K., Kozik, A., Rąpała-Kozik, M., 2004. Thiamine
binding and metabolism in germinating seeds of selected cereals and legumes. Plant
Physiol. Biochem. 42,187-195.
Granby, K., Nielsen, N.J., Hedegaard, R.V., Christensen, T., Kann, M., Skibsted, L.H., 2008.
Acrylamide–asparagine relationship in baked/toasted wheat and rye breads. Food Addit.
Contam. Part A 25, 921-929.
Gulati, P., Rose, D.J., 2018. Effect of extrusion on folic acid concentration and mineral element
dialyzability in Great Northern beans (Phaseolus vulgaris L.). Food Chem. 269, 118-124.
Hamad, A.M., Fields, M.L., 1979. Evaluation of the protein quality and available lysine of
germinated and fermented cereals. J. Food Sci. 44, 456-459.
Imam, M.U., Azmi, N.H., Bhanger, M.I., Ismail, N. and Ismail, M., 2012. Antidiabetic properties
of germinated brown rice: a systematic review. Evid. Based Complement. Alternat. Med.
Article ID 816501
Kubicka, E., Grabska, J., Jedrychowski, L. and Czyz, B., 2000. Changes of specific activity of
lipase and lipoxygenase during germination of wheat and barley. Int. J. Food Sci. Nutr.
51, 301-304.

74
Kruger, J.E., 1994. Enzymes of sprouted wheat and their possible technological significance, in:
Bushuk, W., Rasper, V.F. (Eds.), Wheat: Production, Properties and Quality. Springer
US, Boston, MA, pp. 143–153.
Marini, R.P., 2003. Approaches to analyzing experiments with factorial arrangements of
treatments plus other treatments. HortScience, 38, 117-120.
Mody, I., De Koninck, Y., Otis, T.S., Soltesz, I., 1994. Bridging the cleft at GABA synapses in
the brain. Trends Neurosci.17, 517-525.
Olaerts, H., Vandekerckhove, L., Courtin, C.M., 2018. A closer look at the bread making process
and the quality of bread as a function of the degree of preharvest sprouting of wheat
(Triticum aestivum). J. Cereal Sci. 80,188-197.
Ohm, J.B., Lee, C.W., Cho, K., 2016. Germinated wheat: Phytochemical composition and
mixing characteristics. Cereal Chem. 93, 612-617.
Palmiano, E.P., Juliano, B.O., 1973. Changes in the activity of some hydrolases, peroxidase, and
catalase in the rice seed during germination. Plant Physiol. 52, 274-277.
Pagand, J., Heirbaut, P., Pierre, A., Pareyt, B., 2017. The magic and challenges of sprouted
grains. Cereal Foods World, 62, 221-226.
Poudel, R., Bhatta, M., Regassa, T., Rose, D.J., 2017. Influence of foliar fungicide treatment on
lipolytic enzyme activity of whole wheat. Cereal Chem. 94, 633-639.
Poudel, R., Rose, D.J., 2018. Changes in enzymatic activities and functionality of whole wheat
flour due to steaming of wheat kernels. Food Chem. 263, 315-320.
Ral, J.-P., Whan, A., Larroque, O., Leyne, E., Pritchard, J., Dielen, A.-S., Howitt, C.A., Morell,
M.K., Newberry, M., 2016. Engineering high α‐amylase levels in wheat grain lowers
Falling Number but improves baking properties. Plant Biotechnol. J. 14, 364-376.

75
Richter, K., Christiansen, K., Guo, G., 2014. Wheat sprouting enhances bread baking
performance. Cereal Foods World 59, 231-233.
Simsek, S., Ohm, J.-B., Lu, H., Rugg, M., Berzonsky, W., Alamri, M.S., Mergoum, M., 2014.
Effect of pre‐harvest sprouting on physicochemical changes of proteins in wheat. J. Sci.
Food Agric. 94, 205-212.
Sun, W., Du, J., Jin, Y., Liu, J., Kong, L., 2012. Preliminary research on wheat lipoxygenase
during malting. J. Inst. Brew. 118, 192-197.
Tavener, R. J. A., D. L. Laidman., 1972. The induction of lipase activity in the germinating
wheat grain. Phytochemistry 11, 989-997.
Whole Grain Council., 2018. Sprouted whole grains. https://wholegrainscouncil.org/whole-
grains-101/whats-whole-grain-refined-grain/sprouted-whole-grains Accessed in July
2018.
Žilić, S., Basić, Z., Hadži‐Tašković Šukalović, V., Maksimović, V., Janković, M., Filipović, M.,
2014. Can the sprouting process applied to wheat improve the contents of vitamins and
phenolic compounds and antioxidant capacity of the flour? Int. J. Food Sci. Technol. 49,
1040-1047.

76
76
Table 3.1. Analysis of variance (mean squares) of measured variables on 100% germinated flour.
Source DF PA Thiamine Lysine ASN GABA LA-O LA-P EA-B LOX MPV MPT
Block 1 4.2 0.01 0.18** 1.6 0.8 0.01 0.3* 0.1 0.8 130* 13.4*
Wheat lot 3 11.7** 0.13** 3.2*** 3.5* 3.0*** 0.3*** 0.1 7.3* 0.3 31.5 1.8
Germination time
(GT)
2 141*** 0.13* 1.4*** 139*** 61*** 4.3*** 7.9*** 113*** 18.3*** 765*** 12.1*
Drying Temperature
(T)
1 5.0 0.01 0.3*** 1.3 4.6*** 0.1*** 2.6*** 20.1** 1.2* 232** 7.1
Lot X GT 6 1.5 0.01 0.2*** 3.4** 1.9*** 0.1*** 0.02 2.3 0.3 16.6 2.9
Lot X T 3 15.7** 0.01 0.1* 2.9* 1.0* 0.03*** 0.1 2.8 0.2 10.7 4.3
GT X T 2 7.0 0.01 0.01 1.3 5.6*** 0.03*** 0.4*** 2.3 0.3 65.1 3.3
Lot X GT X T 6 2.8 0.02 0.02 3.9** 0.8* 0.01 0.1 2.8 0.3 11.1 1.9
Residual 27 2.4 0.03 0.02 0.8 0.2 0.002 0.05 1.9 0.2 20.8 2.6
df= degrees of freedom; PA= phytic acid; ASN=asparagine; GABA= γ-aminobutyric acid; LA-O=lipase activity measured with olive
oil as a substrate; LA-P=lipase activity measured with p-nitrophenyl palmitate as a substrate; EA-B= esterase activity; LOX=
lipoxygenase activity; MPV=midline peak value; MPT=midline peak time.
*P <0.05; **P <0.01; ***P<0.001.

77
77
Table 3.2. Falling number and bread characteristics and of composite flours made by mixing ungerminated whole wheat flour and
germinated whole flours from different germination time (GT) and at different proportions (amount).
GT Amount FN CV NCE Hmax TC TOPC SB Texture LV
Ungerminated 301±1a 5.5±0.4c 1.1±0.03a 134±1.7bcd 1.9±0.3bc 0.22±0.1bc 88.6±0.8bc 4.3±0.28a 622.5±17.5b
24 h 2% 271±1b 6.5±0.3ab 1.04±0.01c 134±5.7bcd 2.9±1.1abc 0.24±0.06b 91.3±0.9a 4.3±0.35a 652.5±22.5ab
5% 230.5±0.5c 6.5±0.1ab 1.08±0.04abc 143±2.1a 2.3±0.6abc 0.23±0.04bc 88.3±1.1bc 4.2±0.02a 675±0.1a
10% 188±2d 6±0.1bc 1.08±0.02abc 139±1.3abc 2.7±1.5abc 0.26±0.03b 91.1±0.2a 3.8±0.33a 680±5a
48 h 2% 160.5±2.5e 5.8±0.4bc 1.08±0.02abc 133±3.7cd 1.5±0.2c 0.43±0.18a 91.7±2.06a 4.4±0.18a 645±5ab
5% 102.5±0.5g 5.6±0.3bc 1.1±0.01ab 129±3.4de 3.4±1.4a 0.25±0.07b 85.6±1.1d 4.2±0.11a 632.5±2.5
10% 65.5±0.5h 6.1±0.1abc 1.03±0.01c 139±1.0abc 3.5±0.2a 0.23±0.09bc 87.4±0.8cd 3.9±0.03a 620±30b
72 h 2% 113.5±2.5f 6.1±0.4abc 1.05±0.02bc 140±5.1ab 3.5±1.1a 0.1±0.004c 90.1±1.5ab 3.9±0.06a 677.5±2.5a
5% 63.5±0.5h 6.2±0.6abc 1.07±0.02abc 133±6.0cd 2.4±0.2abc 0.17±0.03bc 82.2±0.3e 3.9±0.32a 650±10ab
10% 62±0.01h 6.9±0.2a 1.1±0.01ab 124.4±3.2e 2.0±0.2abc 0.15±0.04bc 80.7±1.74e 3.6±0.21a 580±5c
Mean ± standard deviation of FN= falling number (s), CV= cell volume, NCE= net cell elongation, Hmax=height (mm), TC= total
concavity (%), TOPC= top concavity (%), SB= slice brightness, Texture (N), and LV=loaf volume (cm3) from the different
germination time and proportion combinations.
Means followed by different letters in a column are significantly different (P<0.0

78
Figure 3.1. Composition of ungerminated and germinated whole wheat flours; only factors
(wheat lot, germination duration, drying temperature) with significant effects are shown (see
Table 1 for ANOVA results); A) phytic acid; B, C) thiamine; D) available lysine; E) asparagine;
F) γ- aminobutyric acid; within subfigure, bars marked with different letters are significantly
different (p<0.05)
dd d
d
cbc
d
c
aab
d
aaa
d
a
0
1
2
3
Lot1 Lot2 Lot3 Lot4
Ava
ilable
lysin
e (
mg
/g
flo
ur)
DControl 24 h 48 h 72 h
b
aab
b
0
0.2
0.4
0.6
0.8
1
1.2
1.4
Lot1 Lot2 Lot3 Lot4
Th
iam
ine
(µ
g/g
flo
ur)
B
aa
b b
0
0.2
0.4
0.6
0.8
1
1.2
1.4
Control 24 h 48 h 72 h
Th
iam
ine
(µ
g/g
flo
ur)
C
cc
b
a
0
1
2
3
4
5
6
7
Control 24 h 48 h 72 h
Asp
ara
gin
e (
mg
/g flo
ur)
E
de e
cd c
b
a
e
0
1
2
3
4
5
6
Control 40 °C 60 °C
γ-a
min
obu
tyric a
cid
(m
g/g
flo
ur)
F24 h 48 h 72 h Control
a
bc
d
0
5
10
15
20
25
Control 24 h 48 h 72 h
Ph
ytic a
cid
co
nte
nt (m
g/g
flour)
A

79
Figure 3.2. Lipolytic activities of ungerminated and germinated whole wheat flours; only factors
(wheat lot, germination time, drying temperature) with significant effects are shown (see Table 1
for ANOVA results); A, B) lipase activity measured with olive oil as the substrate; C) lipase
activity measured with p-nitrophenyl palmitate as the substrate; D, E) esterase activity; F)
lipoxygense activity; within subfigure, bars marked with different letters are significantly
different (p<0.05).
b
c
ba
0
2
4
6
8
Control 24 h 48 h 72 h
LO
X a
ctivity (
U/g
)
F
c c
ba
0
5
10
15
20
25
Control 24 h 48 h 72 h
EA
-B a
ctivity (
U/g
)
D
c
a b
0
5
10
15
20
25
Control 40 °C 60 °C
EA
-B a
ctivity (
U/g
)
E
f ff
ff f f f
d
c
d
e
ab ab
d
0
0.3
0.6
0.9
1.2
1.5
1.8
Lot1 Lot2 Lot3 Lot4
LA
-O (
U/g
)A Control 24 h 48 h 72 h
e
a
c
e
ab
e
c c
e
d d
0
0.3
0.6
0.9
1.2
1.5
1.8
Control 40 °C 60 °C
LA
-O (
U/g
)
BLot1 Lot2 Lot3 Lot4
dd
b
c
a
b
d
0
0.5
1
1.5
2
2.5
3
Control 40 °C 60 °C
LA
-P (
U/g
)
C24 h 48 h 72 h Control

80
80
Figure 3.3. Principal components analysis biplot based on composition, enzymatic activities, and mixing properties of germinated
flour. GABA= γ-aminobutyric acid; LA-P= lipase activity measured with p-nitrophenyl palmitate as the substrate; LA-O= lipase
activity measured with olive oil as the substrate; EA-B= esterase activity; LOX= lipoxygenase activity; MPV= midline peak value;
MPT= midline peak time.
Thiamine
EA-B
GABA
LOX
ASN
Lysine
MPT
MPV
Phytic acid
LA-O
LA-P
-2.5
-2
-1.5
-1
-0.5
0
0.5
1
1.5
2
2.5
-3 -2 -1 0 1 2 3
Prin
cip
al co
mp
on
en
t 2
(1
1.4
%)
Principal component 1 (59.5%)
Control (lot 1)Control (lot 2)Control (lot 3)Control (lot 4)24 h (lot 1, 40 °C)24 h (lot 1, 60 °C)24 h (lot 2, 40 °C)24 h (lot 2, 60 °C)24 h (lot 3, 40 °C)24 h (lot 3, 60 °C)24 h (lot 4, 40 °C)24 h (lot 4, 60 °C)48 h (lot 1, 40 °C)48 h (lot 1, 60 °C)48 h (lot 2, 40 °C)48 h (lot 2, 60 °C)48 h (lot 3, 40 °C)48 h (lot 3, 60 °C)48 h (lot 4, 40 °C)48 h (lot 4, 60 °C)72 h (lot 1, 40 °C)72 h (lot 1, 60 °C)72 h (lot 2, 40 °C)72 h (lot 2, 60 °C)72 h (lot 3, 40 °C)72 h (lot 3, 60 °C)72 h (lot 4, 40 °C)72 h (lot 4, 60 °C)

81
Figure 3.4. Principal component analysis biplot based on mixing and baking properties of bread
made from the composite flour. Composite flour is the mixture of ungerminated whole wheat
flour and germinated flour from 24 h, 48 h, and 72 h of germination at 2, 5, and 10%. MPV=
midline peak value; MPT= midline peak time; SB= slice brightness; FN= falling number; LV=
loaf volume; Hmax= height; TC= total concavity; Cell volume= cell volume (map); NCE= net
cell elongation; TOPC= top concavity; Texture= bread texture.
SB
TOPC
FN
HmaxLoaf volume
MPT MPV
NCE
Cell volume
TC
Texture
-2.5
-2
-1.5
-1
-0.5
0
0.5
1
1.5
2
2.5
-3 -2 -1 0 1 2 3
Prin
cip
al co
mp
on
en
t (2
4.4
%)
Principal component (36.8%)
Ungerminated24 h (2%)24 h (5%)24 h (10%)48 h (2%)48 h (5%)48 h (10%)72 h (2%)72 h (5%)72h (10%)

82
CHAPTER 4 SENSORY-DRIVEN SHELF-LIFE ESTIMATION OF WHOLE WHEAT
FLOUR
4.1 ABSTRACT
A decline in functional attributes of whole wheat flour and development of rancidity during
storage have been extensively studied. However, the relationship of these changes to the shelf-
life of whole wheat flour from the consumer perspective is not known. Therefore, a sensory
based approach was used to estimate the shelf life of whole wheat flour containing bran of two
particle sizes (0.6 mm, fine; 1.6 mm, coarse) obtained from four hard winter wheat cultivars
(Anton, Freeman, Overland, and Wesley) and stored at two temperatures (room and 35 °C) for
12 months. The changes in chemical properties during storage were measured by quantifying
free fatty acids (FFA) and lactic acid solvent retention capacity (LA-SRC). The shelf-life of
whole wheat flour stored at room temperature was found to be more than 12 months, whereas at
35 °C the shelf life varied from 8-11 months depending on cultivar. FFA increased at different
rates depending on cultivars. The accumulation of FFA was higher in fine flour compared to
course flour. The LA-SRC values were higher in fine flour and at 35 °C. LA-SRC value was
highest for the Anton which had the least FFA accumulation during storage. In conclusion,
estimated shelf-life based on the sensory evaluation of whole wheat flour was mainly affected by
the cultivar and storage temperature. The chemical stability and functionality of flour were
mainly affected by the storage temperature and time; cultivar, had more effect on the chemical
stability and functionality of the flour, whereas a minimal effect of particle size was observed.
Keywords: sensory evaluation, storage temperature, particle size, free fatty acids, lactic acid
solvent retention capacity

83
4.2 INTRODUCTION
The hydrolysis and oxidation of flour lipids increase rancidity of whole wheat flour
during storage (Doblado-Maldonado, Pike, Sweley, & Rose, 2012). The increase in rancidity
increases the development of different off-flavors which decline the sensory attributes of the
final products (Heiniö et al., 2016; Jiang & Peterson, 2013). Hansen and Rose (1996) showed an
inverse relationship of rancidity and sensory properties (taste and odor) of whole wheat bread. In
addition, the increase in rancidity was related to changes in functionality and baking quality of
the flour (Heiniö et al., 2016; Tait & Galliard, 1988). Although previous research has shown a
relationship between flour rancidity and a decline in sensory properties, no previous studies have
attempted to use these data to quantify shelf-life.
The shelf life of whole wheat flours has been mainly estimated on the basis of lipid
hydrolyzing enzyme activity and accumulation of free fatty acids in flour over the time (Tait &
Galliard, 1988). These chemical changes in flour are dependent on storage temperature
(Maraschin et al., 2008), particle size (Noort, van Haaster, Hemery, Schols, & Hamer, 2010), and
duration of storage (Poudel & Rose, 2018). A wide variation in the activity of lipid degrading
enzymes among different wheat cultivars had been reported previously (Poudel, Bhatta, Regassa,
& Rose, 2017). Therefore, genetic differences in lipid-degrading enzymes may influence the
shelf life of flour.
Although the measure of chemical changes is crucial in explaining the lower shelf life of
flour, sensory acceptability of the final products remains the ultimate criteria to determine the
end of a shelf life of any products (Jensen, Oestdal, Skibsted, Larsen, & Thybo, 2011).
Therefore, a solid estimation of the shelf life of whole wheat flour from a sensory perspective
needs to be addressed. The objectives of this study were (i) to use a sensory-based approach to

84
predict the shelf life of whole wheat flour and (ii) to quantify chemical changes in whole wheat
flour during storage.
4.3. MATERIALS AND METHODS
4.3.1 Preparation of whole wheat flour, storage, and sampling
Three hard red winter wheat cultivars (‘Freeman’, ‘Overland’, and ‘Wesley’) and one
hard white cultivar (‘Anton’) were obtained from the Husker Genetics, University of Nebraska
Lincoln (UNL) Foundation Seed Division. The wheat grains were tempered to 15.6% moisture
as described in AACCI approved method 26-20.02. Tempered wheat grains were milled with a
Buhler experimental mill (Buhler, Minneapolis MN) and separated into coarse bran, fine bran
(shorts), and flour (endosperm) fractions. The bran fractions were combined and then divided in
half. One half was milled to a fine particle size using a hammer mill equipped with a 0.6 mm
screen; the other half was milled to a coarse particle size in like manner except the screen
contained 1.6 mm openings. The whole wheat flour was prepared by recombining the milled
bran and flour fractions at appropriate proportions to make whole wheat flour in a tumbling
mixer.
The whole wheat flour thus prepared was stored in 275 g aliquots in low-density
polythene (LDPE) plastic bags to be used for the sensory and chemical analysis. The sample
bags were stored at room temperature (22 °C) and 35 ºC to evaluate the effect of temperature
during storage. The samples were stored for one year (July 2016-July 2017) and each month a
total of 8 sample bags of each cultivar were pulled (two particle size x two temperature x two
replications) for chemical analysis. Chemical analyses were performed at the end of the storage
time on samples stored at -20 °C since pulling from storage. For the sensory analysis, four (two
for each particle size) sample bags of each cultivar were pulled at six time points. The first

85
sampling time was 3 months for samples stored at 35 ºC and 4 months for the samples stored at
room temperature. Subsequently, the samples were evaluated at two-month intervals until failure,
which was when ≥50% of the consumers found the bread unacceptable. After failure, the
samples were evaluated every month until the six sensory evaluation or the end of storage time
(12 months) whichever came first.
4.3.2 Sensory evaluation of the bread
Mixing properties of whole wheat flour were quantified as described (approved method
54-40.02, AACC International 2018) to get information about optimum mixing time and water
absorption values. This information was used to bake breads using a straight-dough breadmaking
method as described (approved method 10-10.03, AACC International 2018). The loaves of
bread were stored in a polythene bag (up to ~6 hrs before the sensory evaluation) at room
temperature and sliced (~12.5 mm) using an electric knife and a bread-slicing guide (Black &
Decker Corporation, Towson, MD, USA) on the day of sensory panel. Untrained sensory
panelists (aged between 22-50 years), consisting of students and staff at the University of
Nebraska-Lincoln, were presented 8 bread samples one at a time. Water and unsalted crackers
were available to cleanse the palate after tasting each bread sample. The panelists were asked
only if the sample was acceptable, where acceptable was defined as a willingness to eat a whole
slice of the bread if presented to them in the future.
4.3.3 Lactic acid solvent retention capacity (LA-SRC)
Solvent retention capacity using lactic acid was quantified as described in AACCI
approved method 56-11.02. Solvent retention capacity is correlated with gluten strength of flour.
4.3.4 Free fatty acids on whole wheat flour

86
Free fatty acids were quantified as described previously (Doblado-Maldonado, Arndt, &
Rose, 2013).
4.3.5 Statistical analysis
The experimental design for the samples used in the chemical analysis was split plot
design where cultivar being the whole plot factor and particle size, storage temperature, and time
being the split plots, respectively.
A staggered sampling design was used for the sensory evaluation of whole wheat bread
and bread was evaluated based on Weibull probability distribution as described (Cardelli, &
Labuza, 2001). The sensory evaluation started with ‘n’ number of panelists (in our study n= 3)
and was increased by C = 1 at each sampling time until the samples failed (Cardelli et al., 2001.).
After that, the number of panelists was increased by C + U at each time point where U = number
of unacceptable responses at the previous time point. The number of acceptable (+) and
unacceptable responses (-) were tallied (Supplementary Table 1). The number of unacceptable
response were ranked starting from the last/sixth sensory data point in ascending order. The
hazard values (H) for each rank were calculated as H=100/rank (Supplementary Table 2). The
shape factor (β) was calculated as 1/slope from the equation obtained by plotting the log of the
cumulative hazard values against the log of storage time. β values between 2 and 4 have been
shown to lead to accurate shelf-life estimation as the Weibull distribution is unskewed in that
range (Cardelli, & Labuza., 2001). Therefore, β values between 2 and 4 were used directly to
predict shelf-life of the samples. If the β values were outside of this range, the data were
replotted to include only up to a cumulative hazard value 100 to fit the β values in the required
range. The equation obtained from this new plot was used to estimate the shelf life of the flour.
The equation used to predict shelf-life was: estimated shelf life (y) = slope x (cumulative hazard

87
corresponding to 50% probability failure) + intercept. The 50% probability failure was the time
when at least half of the panelists gave unacceptable responses for a sample, which corresponded
to 69.3 cumulative hazard value (Fu & Labuza, 1997). The storage time corresponding to 69.3
cumulative hazard was considered as the estimated shelf life of the product. After obtaining the
estimated shelf life of samples, 95% confidence limits were constructed and reported.
4.4. RESULTS AND DISCUSSION
4.4.1 Estimated shelf life of whole wheat flours stored at room temperature and 35 ºC
The number of acceptable and unacceptable responses followed by the probability of
acceptability at each time point was given for the samples stored at room temperature (Table
4.1). Wesley had the lowest probability of acceptability at 12 months, at 37.5% (fine) and 25%
(coarse). All other cultivars and particle sizes had ≥50% acceptability at 12 months. Since the
shelf-life study was only designed to last for 12 months, there were no samples available for the
accelerated phase of the product failure. Therefore, a precise measurement of shelf-life could not
be determined. Several samples reached 50% acceptable at 12 months and would have begun the
accelerated phase at 13 months. Presumably, flour that reached 50% failure would have shorter
shelf life compared to flour that did not fail throughout the study.
Similarly, the total number of acceptable and unacceptable responses followed by the
probability of acceptability at each time for the samples stored at 35 ºC was given in Table 4.2.
The shape factors (β) were Anton (fine=3.5, coarse= 3.6), Freeman (fine = 4.32, coarse= 3.67),
Overland (fine = 5.41, coarse =4.1), and Wesley (fine=coarse= 5.5). This showed that Freeman
(fine), Overland, and Wesley were tested beyond the shelf-life as the β values were >4 (Fu &
Labuza, 1997). After replotting, β values were 2.57, 3.46, 2.50, 3.60, and 3.45, respectively, for
Freeman (fine), Overland (fine and coarse), and Wesley (fine and coarse). The estimated shelf

88
life of Anton was 9.1 [95 % confidence limits (CL)= 8.4- 9.8] and 9.2 (95% CL = 8.3- 10.1),
Freeman = 9.7 (95% CL= 8.7-10.7) and 10.5 (95% CL= 8.3- 10.1), Overland = 8.7 (95% CL=
8.2 -9.2) and 9.3 (95% CL= 8.4 -10.2), and Wesley = 8.5 (95% CL = 8.1- 9.1) and 8.7 (95% CL
=8.2 - 9.3) months for fine and coarse flour particle size, respectively.
On the basis of sensory evaluation, the shelf life of Wesley was lower compared to other
cultivars. A minimal effect of particle size was observed on the estimated shelf life with a
slightly longer shelf life of coarse flour than fine flour. The estimated shelf life of whole wheat
flour stored at room temperature was higher than at 35 °C. The shorter estimated shelf life of
whole wheat flour stored at 35 °C compared to the room temperature suggested a rapid decline in
the sensory attributes in the former storage temperature. A similar decline in sensory properties
of wheat flour and cornmeal were observed at 34 °C and 25 °C storage temperatures (Bothast.,
Anderson., Warner., & Kwolek., 1981).
4.4.2 Moisture content of whole wheat flour during storage
A significant storage time x temperature interaction was observed for moisture content
(Table 4.3). The moisture content of flour decreased at the rate of 0.3% during room temperature
storage, whereas it decreased at the rate of 0.7% at 35 ° C (Fig 4.1). The moisture content
decreased from 13.6 to 10.6 % at room temperature, whereas it decreased from 13.6 to 5.4% at
35 °C (Fig 4.1). Similar decline in moisture contents with respect to storage temperature were
observed in rice flour (Park et al. 2012) and wheat grains (Rehman et al. 1999). Both studies
used polythene bags and bottles to store rice flour and wheat grains, respectively.
As there was a difference in moisture content for samples stored at room and 35 °C,
measured variables were reported on a dry weight basis.
4.4.3 Accumulation of free fatty acids during storage

89
Significant three-and-four-way interactions were observed for FFA (Table 4.3). However,
non-crossover interactions were observed for both three-way and four-way interactions.
Therefore, significant two way-interactions were reported for the further analysis. The significant
two-way interactions for FFA were particle size x cultivar, storage time x cultivar, storage time x
particle size, and storage time x temperature (Table 4.3). The accumulation of FFA was higher in
fine flour compared to coarse flour in all cultivars except Anton (Fig 4.2A). The increase in
surface area for the interaction between triacylglycerol and lipid-degrading enzymes may be the
reason for higher FFA accumulation in fine flour (Noort et al., 2010).
A linear increase in FFA concentration was observed for about 5 months during storage
(Fig 4.2B). The linear increase rates of increase in FFA were 1.3, 3.2, 3.9, and 4.3 µmol/g/month
in Anton, Freeman, Overland, and Wesley, respectively (Fig 4.2B). Although the FFA in fresh
flour of Freeman and Overland were similar, the accumulation of FFA increased at different
rates in these cultivars. After 5-month, the accumulation of FFA leveled off dramatically.
Although a slight decrease was observed the decrease was non-significant in all cultivars except
Wesley. The increase in FFA was likely due to a higher lipase activity in these flours (Poudel &
Rose, 2018). The decrease in rate of FFA accumulation during storage could be due to reduced
substrate availability or product inhibition on enzymatic activity (Lacerda, Soares Júnior,
Bassinello, Caliari, & Castro, 2013; Maraschin et al., 2008). A decrease in FFA during the
storage may be due to oxidation of FFA. A variation in the accumulation of FFA in different rice
cultivars during storage up to 12 months was observed (Dhaliwal et al. 1991). A similar trend of
rapid increase followed by a non-significant increase in FFA accumulation was observed in a
stored flour (Bell, Chamberlain, Collins, Daniels, & Fisher, 1979).

90
A significant but small effect of particle size was observed in FFA accumulation over
time (Fig 4.2C), with fine particles having more FFA accumulation compared to coarse flour.
The initial rate of increase in fine and coarse flours for 5 months was same, however, on
extended storage, fine flour had slightly higher FFA accumulation. For instance, the FFA
accumulation in finely milled samples increased from 10 to 28 (fresh to 12-month) µmol/ g flour,
whereas it increased from 8.4 to 27 µmol/ g flour in coarse flour. Similar results were obtained
when the accumulation of FFA on flour <0.5 mm bran size was compared to flours with >0.5
mm bran size when stored at 20 ºC for 16 weeks (Galliard & Gallagher, 1988). The higher FFA
accumulation in fine flour was attributed to the increased surface area for the interaction of lipid
hydrolyzing enzymes and lipid (Noort et al. 2010).
The FFA accumulation was higher on the flour samples stored at 35 ºC compared to room
temperature at all time points except at 12 months (Fig 4.2D). FFA increased at the rate of 2.5
and 3.7 µmol/g flour for the first 5 months of storage at room temperature and 35 ºC,
respectively. The loss of fatty acids in triacylglycerol (TAG) were higher in whole wheat flour
stored at elevated temperature compared to room temperature (Maraschin et al., 2008). This loss
of fatty acids in TAG was highly correlated with the increase of fatty acids FFA (Maraschin et
al., 2008), which may explain the reason for differences in FFA accumulation at two different
storage temperature in our study.
4.4.4 Lactic acid SRC values of whole wheat flour during storage
Similar to FFA, non-cross over three- and four-ways interactions were significant for LA-
SRC (Table 4.1) and significant two-way interactions were reported hereafter. Significant two-
way interactions were observed for particle size x cultivar, temperature x cultivar, storage time x
cultivar, and storage time x temperature (Table 4.3). The LA-SRC values of Overland and

91
Wesley cultivars were influenced by flour particle size, however, no such differences were
observed in Anton and Freeman (Fig 4.3A). The LA-SRC of Overland and Wesley were lower in
coarse flour compared to fine flour. The information about the swelling behavior of flour gluten
as given by LA-SRC values was used to represent the gluten quality and functionality (Kweon,
Slade, & Levine, 2011). Several studies had shown a decline in dough strength (gluten
properties) due to the coarse bran compared to fine bran particles (Zhang & Moore, 1999, 1997).
The lactic acid-SRC values were higher in flours stored at 35 ºC compared to flour stored
at room temperature (Fig 4.3B and 4.3C). The LA-SRC values for Anton were higher compared
to other cultivars (Freeman, Overland, and Wesley) at both storage temperatures. An increase of
13-16% for LA-SRC values were observed due to the storage at a higher temperature. Similarly,
there was an increase in LA-SRC values compared to the fresh flour, which may be due to the
flour maturation (oxidation) during storage (Maraschin et al., 2008).
The LA-SRC values increased similarly in all cultivars during storage (Fig 4.3D). Unlike
FFA, LA-SRC values were higher in Anton compared to other cultivars.
4.5. CONCLUSIONS
Sensory evaluation of whole wheat bread suggested that the shelf life of whole wheat
flour was greatly influenced by the storage temperature and wheat cultivar, while it was
minimally affected by flour particle size. The differences due to cultivar could be both genetic
and environmental. The estimated shelf life of the whole wheat flours ranged from 8.5-10.5
months when stored at 35 ºC; at room temperature the shelf-life was >12 months. Although there
was no influence of particle size on the sensory evaluation, chemical changes in whole wheat
flour were influenced by particle size and other factors including cultivars, storage temperature,
and length of the storage. The FFA accumulation and LA-SRC values increased with respect to

92
the time of storage. In future, it would be interesting to quantify the oxygenated fatty acids and
other volatile compounds in the bread and see the relationship with the sensory acceptability.

93
4.6 REFERENCES
AACC International., 2018. Method 10-10.03 Optimized Straight-Dough Bread-Making Method;
56-11.02 Solvent retention capacity profile. In: Approved Methods of Analysis, 11th ed. St. Paul,
MN, USA.
Bell, B. M., Chamberlain, N., Collins, T. H., Daniels, D. G. H., & Fisher, N. (1979). The
composition, rheological properties and breadmaking behaviour of stored flours. Journal of the
Science of Food and Agriculture, 30(12), 1111–1122. https://doi.org/10.1002/jsfa.2740301202
Bothast, R. J. (1981). Effects of moisture and temperature on microbiological and sensory
properties of wheat flour and corn meal during storage. Cereal Chemistry, v. 58(4), 309–311.
Cardelli, C. E., Cardelli, C., & Labuza, T. P. (n.d.). Application of Weibull Hazard Analysis to
the Determination of the Shelf Life of Roasted and Ground.
Cenkowski, S., Dexter, J. E., & Scanlon, M. G. (2000). Mechanical compaction of flour: The
effect of storage temperature.
Doblado-Maldonado, Andrés F., Arndt, E. A., & Rose, D. J. (2013). Effect of salt solutions
applied during wheat conditioning on lipase activity and lipid stability of whole wheat flour.
Food Chemistry, 140(1), 204–209. https://doi.org/10.1016/j.foodchem.2013.02.071
Doblado-Maldonado, Andres F., Pike, O. A., Sweley, J. C., & Rose, D. J. (2012). Key issues and
challenges in whole wheat flour milling and storage. Journal of Cereal Science, 56(2), 119–126.
https://doi.org/10.1016/j.jcs.2012.02.015

94
Fu, B., & Labuza, T. P. (1997). Shelf-Life Testing: Procedures and Prediction Methods. In M. C.
Erickson & Y.-C. Hung (Eds.), Quality in Frozen Food (pp. 377–415). Boston, MA: Springer
US. https://doi.org/10.1007/978-1-4615-5975-7_19
Galliard, T., & Gallagher, D. M. (1988). The effects of wheat bran particle size and storage
period on bran flavour and baking quality of bran/flour blends. Journal of Cereal Science, 8(2),
147–154. https://doi.org/10.1016/S0733-5210(88)80025-0
Heiniö, R. L., Noort, M. W. J., Katina, K., Alam, S. A., Sozer, N., de Kock, H. L., … Poutanen,
K. (2016). Sensory characteristics of wholegrain and bran-rich cereal foods – A review. Trends
in Food Science & Technology, 47, 25–38. https://doi.org/10.1016/j.tifs.2015.11.002
Jensen, S., Oestdal, H., Skibsted, L. H., Larsen, E., & Thybo, A. K. (2011). Chemical changes in
wheat pan bread during storage and how it affects the sensory perception of aroma, flavour, and
taste. Journal of Cereal Science, 53(2), 259–268. https://doi.org/10.1016/j.jcs.2010.11.007
Jiang, D., & Peterson, D. G. (2013). Identification of bitter compounds in whole wheat bread.
Food Chemistry, 141(2), 1345–1353. https://doi.org/10.1016/j.foodchem.2013.03.021
Kweon, M., Slade, L., & Levine, H. (2011). Solvent Retention Capacity (SRC) Testing of Wheat
Flour: Principles and Value in Predicting Flour Functionality in Different Wheat-Based Food
Processes and in Wheat Breeding—A Review. Cereal Chemistry, 88(6), 537–552.
https://doi.org/10.1094/CCHEM-07-11-0092
Lacerda, D. B. C. L., Soares Júnior, M. S., Bassinello, P. Z., Caliari, M., & Castro, M. V. L.
(2013). The kinetics of lipase activity and hydrolytic rancidity of raw, parboiled, and extruded
rice bran during storage. Food Science and Technology, 33(2), 376–381.
https://doi.org/10.1590/S0101-20612013005000053

95
Maraschin, C., Robert, H., Boussard, A., Potus, J., Baret, J.-L., & Nicolas, J. (2008). Effect of
Storage Temperature and Flour Water Content on Lipids, Lipoxygenase Activity, and Oxygen
Uptake During Dough Mixing. Cereal Chemistry, 85(3), 372–378.
https://doi.org/10.1094/CCHEM-85-3-0372
Noort, M. W. J., van Haaster, D., Hemery, Y., Schols, H. A., & Hamer, R. J. (2010). The effect
of particle size of wheat bran fractions on bread quality – Evidence for fibre–protein interactions.
Journal of Cereal Science, 52(1), 59–64. https://doi.org/10.1016/j.jcs.2010.03.003
Poudel, R., Bhatta, M., Regassa, T., & Rose, D. J. (2017). Influence of Foliar Fungicide
Treatment on Lipolytic Enzyme Activity of Whole Wheat. Cereal Chemistry Journal, 94(3),
633–639. https://doi.org/10.1094/CCHEM-11-16-0279-R
Poudel, R., & Rose, D. J. (2018). Changes in enzymatic activities and functionality of whole
wheat flour due to steaming of wheat kernels. Food Chemistry, 263, 315–320.
https://doi.org/10.1016/j.foodchem.2018.05.022
Tait, S. P. C., & Galliard, T. (1988). Effect on baking quality of changes in lipid composition
during wholemeal storage. Journal of Cereal Science, 8(2), 125–137.
https://doi.org/10.1016/S0733-5210(88)80023-7
Toci, A. T., Neto, V. J. M. F., Torres, A. G., & Farah, A. (2013). Changes in triacylglycerols and
free fatty acids composition during storage of roasted coffee. LWT - Food Science and
Technology, 50(2), 581–590. https://doi.org/10.1016/j.lwt.2012.08.007
Zhang, D., & Moore, W. R. (1999). Wheat bran particle size effects on bread baking
performance and quality. Journal of the Science of Food and Agriculture, 79(6), 805–809.
https://doi.org/10.1002/(SICI)1097-0010(19990501)79:6<805::AID-JSFA285>3.0.CO;2-E

96
Zhang, Decai, & Moore, W. R. (1997). Effect of Wheat Bran Particle Size on Dough
Rheological Properties. Journal of the Science of Food and Agriculture, 74(4), 490–496.
https://doi.org/10.1002/(SICI)1097-0010(199708)74:4<490::AID-JSFA822>3.0.CO;2-0

97
97
Table 4.1. The number of acceptable (+) and unacceptable (-) responses and percent acceptability (% ‘+’) of the whole wheat bread
made from flour stored at room temperature for different lengths of time.
Cultivar Particle
size (mm)
Time of storage (months)
0 4 6 8 10 12
+ - % '+' + - % '+' + - % '+' + - % '+' + - % '+' + - % '+'
Anton 0.6 3 0 100 3 1 75 4 1 80 5 1 83.3 5 2 71.4 5 4 62.5 1.6 3 0 100 3 1 75 4 1 80 5 1 83.3 4 3 57.1 5 3 62.5
Freeman 0.6 3 0 100 3 1 75 3 2 60 5 1 83.3 4 3 57.1 5 3 62.5 1.6 3 0 100 3 1 75 3 2 60 5 1 83.3 4 3 57.1 4 4 50
Overland 0.6 3 0 100 3 1 75 3 2 60 5 1 83.3 4 3 57.1 4 4 50 1.6 3 0 100 3 1 75 4 1 80 5 1 83.3 4 3 57.1 5 3 62.5
Wesley 0.6 3 0 100 3 1 75 3 2 60 4 2 67 6 1 85.0 3 5 37.5
1.6 3 0 100 3 1 75 4 1 80 4 2 66.7 5 2 71.4 2 6 25

98
98
Table 4.2. The number of acceptable (+), unacceptable (-) responses, and percentage acceptability (% ‘+’) of the whole wheat bread at
different time points made from stored flour at 35 ºC temperature.
Cultivar Particle size
(mm)
Time of storage (month) at 35 °C
0 3 5 7 8 9 10
+ - %'+' + - %'+' + - %'+' + - %'+' + - %'+' + - %'+' + - %'+'
Anton 0.6 3 0 100 3 1 75 3 2 60 4 2 66.7
NA
3 4 43 4 8 33.3
1.6 3 0 100 3 1 75 3 2 60 5 1 83.3 2 5 28.5 5 8 38.4
Freeman 0.6 3 0 100 3 1 75 4 1 80 5 1 83.3 1 6 14.2 5 9 35.7
1.6 3 0 100 3 1 75 3 2 60 5 1 83.3 2 5 28.5 5 8 38.4
Overland 0.6 3 0 100 3 1 75 3 2 60 3 3 50 4 6 40 1 16 5.9 NA
1.6 3 0 100 3 1 75 4 1 80 4 2 66.7 NA 2 5 28.5 4 8 33.3
Wesley 0.6 3 0 100 3 1 75 4 1 80 3 3 50 4 6 40 7 10 23.5 NA
1.6 3 0 100 3 1 75 4 1 80 3 3 50 4 6 40 4 13 41.1

99
Table 4.3. Analysis of variance (mean squares) of measured variables on whole wheat flourA
Source df Moisture FFA LA-SRC
Cultivar 3 2.6 8343*** 1160.7***
Error a (Ea) = Rep (Cultivar) 4 0.32 1.2 3.7
Particle size (PS) 1 1.7 386.8** 525***
PS X Cultivar 3 0.1 79.3* 97.5**
Eb= PS X Rep (Cultivar) 4 0.2 10.1 5.1
Temperature 1 1149*** 1019.2*** 15000***
T X Cultivar 3 5.14 10.3 90.2**
T X PS 1 0.95 24.5 15.5
T X PS X Cultivar 3 0.53 5.5 17.2
Ec= T X PS X Rep (Cultivar) 8 0.44 4.8 7.1
Storage time (time) 11 133.9*** 470.9*** 610.3***
Time X Cultivar 33 0.84 29.8*** 9.6***
Time X PS 11 0.45 12.2** 3.4
Time X PS X Cultivar 33 0.42 16.8*** 4
Time X T 11 33.9*** 72*** 316.1***
Time X Temp X Cultivar 33 0.34 17.4*** 6.9*
Time X T X PS 33 0.5 11.3** 3.8
Time X T X PS X Cultivar 33 0.35 11*** 4.6
Residual 176 0.38 4.0 4.2 A df= degrees of freedom; Moisture=moisture content of whole wheat flour; FFA= free fatty
acids; and LA-SRC=Solvent retention capacity measured with lactic acid. *P <0.05; **P <0.01;
***P<0.001.

100
Figure 4.1. Moisture content of the whole wheat flour during storage at room and 35 ºC
temperatures.
Moisture (room) = -0.3x + 13.8, R² = 0.88
Moisture ((35 °C) = -0.7x + 13.1, R² = 0.95
0
2
4
6
8
10
12
14
16
0 2 4 6 8 10 12 14
Mo
istu
re c
onte
nt (%
)
Time of storage (month)
Room 35 °C

101
Figure 4.2. Effect of particle size and cultivar (2A), time and cultivar (2B), storage time and
particle size (2C), and storage temperature and cultivar (2D) on the accumulation of free fatty
acid of whole wheat flour; RT= room temperature; within each subfigures bar labelled with
different lowercase letters were significantly different at α=0.05 level of significance.
Anton = 1.3x + 5.3, R² = 0.81Freeman = 3.2x + 10, R² = 0.95
Overland = 3.9x + 11.3, R² = 0.98Wesley = 4.3x + 15.4, R² = 0.93
0
10
20
30
40
50
0 1 2 3 4 5 6 7 8 9 10 11 12
FF
A (
µm
ol/g
)
Time of storage (month)
B Anton FreemanOverland Wesley
Room = 2.5x + 10, R² = 0.91
35 °C = 3.7x + 11.9, R² = 0.96
0
10
20
30
40
50
0 1 2 3 4 5 6 7 8 9 10 11 12
FF
A (
µm
ol/g
)
Time of storage (month)
DRoom 35 °C
Coarse = 3.2x + 9.8, R² = 0.92
Fine = 3.2x + 11.3, R² = 0.97
0
10
20
30
40
50
0 1 2 3 4 5 6 7 8 9 101112
FF
A (
µm
ol/g
)
Time of storage (month)
C
Fine Coarse
g
ec
a
g
f
db
0
10
20
30
40
50
Anton FreemanOverland Wesley
FF
A (
µm
ol/g
)A Fine Coarse
RT
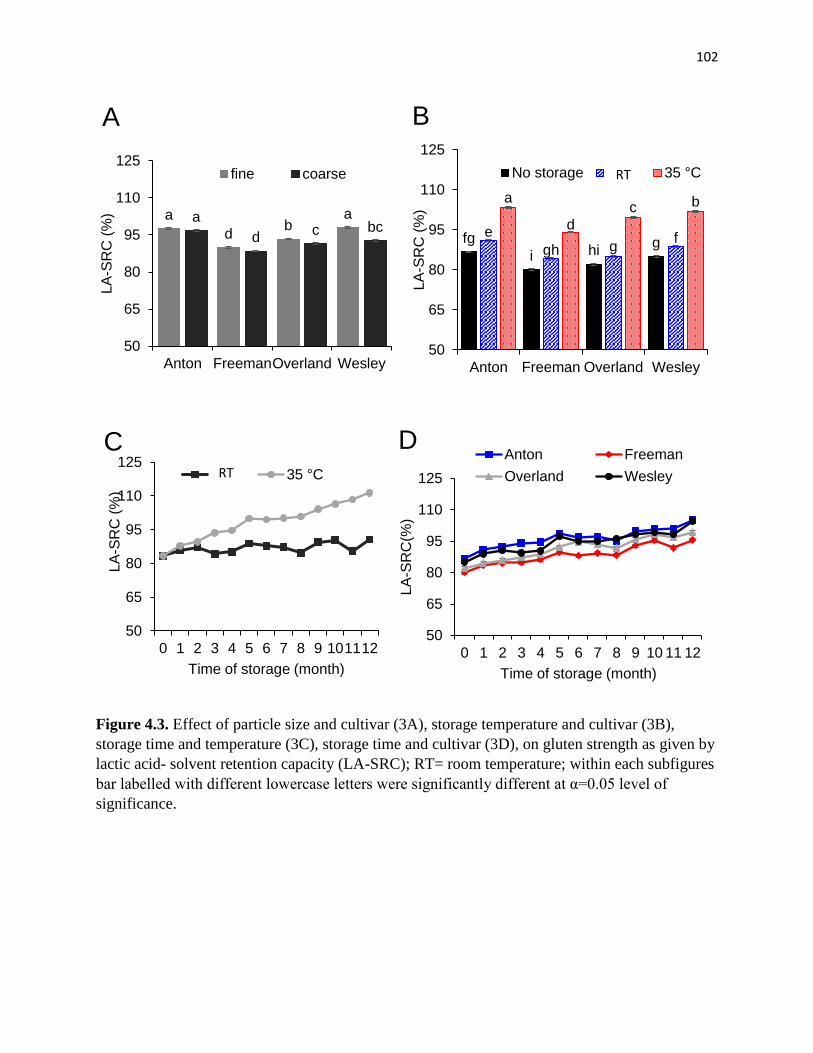
102
Figure 4.3. Effect of particle size and cultivar (3A), storage temperature and cultivar (3B),
storage time and temperature (3C), storage time and cultivar (3D), on gluten strength as given by
lactic acid- solvent retention capacity (LA-SRC); RT= room temperature; within each subfigures
bar labelled with different lowercase letters were significantly different at α=0.05 level of
significance.
fg
i hig
e
gh gf
a
d
c b
50
65
80
95
110
125
Anton Freeman Overland Wesley
LA
-SR
C (
%)
B
No storage room 35 °C
a
db
aa
dc bc
50
65
80
95
110
125
Anton FreemanOverland Wesley
LA
-SR
C (
%)
A
fine coarse
50
65
80
95
110
125
0 1 2 3 4 5 6 7 8 9 101112
LA
-SR
C (
%)
Time of storage (month)
CRoom 35 °C
50
65
80
95
110
125
0 1 2 3 4 5 6 7 8 9 10 11 12
LA
-SR
C(%
)
Time of storage (month)
DAnton Freeman
Overland Wesley
RT
RT

103
CHAPTER 5. WHEAT METABOLITES PROFILING IN HISTORICAL AND MODERN
WHEAT CULTIVARS USING PROTON NUCLEAR MAGNETIC RESONANCE (1H
NMR) SPECTROSCOPY
5.1 ABSTRACT
Comparative studies between historical and modern wheat cultivars have primarily
focused on yield- and end use quality-related attributes. Changes in the compositional properties
of historical and modern wheat cultivars with respect to year of introduction are largely
unknown. Therefore, small molecules from 21 wheat cultivars released between 1870 and 2013
and grown over two crop years were extracted using aqueous alcohol and analyzed using 1H
NMR profiling. In total, 16 compounds (three carbohydrates, eight amino acids, four phenolic
acid, and fumaric acid) were identified and quantified. Grain yield, grain volume weight, and
grain protein concentration were also measured. Grain yield increased at a rate of 28.7
kg/ha/year, whereas protein concentration decreased at a rate of 0.02%/year. Except for free
tryptophan, which showed an increase at the rate of 0.3 mg/kg wheat/year, there was no
significant effect of year of introduction on the measured metabolites. However, principal
components analysis showed a separation between historical and modern wheats. Grain yield,
phenolic acids, and tryptophan were mainly associated with modern cultivars, whereas grain
protein concentration and the other amino acids, including alanine and asparagine, were
associated with the historical cultivars. The findings from this study showed that grain yield,
grain protein, and tryptophan contents have changed over time. At the same time, small changes
in other wheat metabolites due to year of introduction may have occurred.
Keywords: wheat metabolites, grain yield, grain protein, historical and modern wheat

104
5.2 INTRODUCTION
The association of humans with wheat cultivation and consumption began about 10000
years ago (Shewry, 2009). Early wheat farmers selected wheats based on desirable
characteristics, but without any defined methodological approaches or knowledge of genetics.
Only in the last century have modern wheat breeding programs been initiated to develop semi-
dwarf and high yielding varieties of wheat with excellent end-use quality (Guzmán et al., 2017).
Since then, the selective breeding of wheat has contributed to the development of many modern
wheat cultivars with improved yield characteristics (Guzmán et al., 2017). Furthermore, many
recent studies are focused towards improving genetic diversity in wheat germplasm for the
development of cultivars with improved end-use properties (Bushuk, 1997) and grain yield even
in the presence of biotic and abiotic stresses and climate change (Bhatta et al., 2018).
Despite the advancements in wheat germplasm, wheat breeders and wheat breeding
programs have faced criticism from the general public that modern wheat may contain new
components that have adverse impacts on human health (Brouns et al., 2013). Although such
concerns have not been supported with scientific studies and reviews (Brouns et al., 2013;
Shewry, 2018), comparative studies have been carried out to quantify the changes in
compositional properties with respect to year that the cultivars were introduced (Boukid et al.,
2018).
In previous studies, a decrease in grain protein content and grain mineral concentrations
(iron, phosphorus, sulfur, and zinc) were reported in modern wheat cultivars (De vita et al. 2007
and Guttieri et al. 2015), which were attributed to the yield dilution phenomenon (Shewry et al.
2016). The phenolic profiles of historical wheat were higher than modern cultivars as given by
total phenolic compounds and isomer forms (Dinelli et al., 2011, 2009), which was contrary to

105
the findings of Shewry et al. (2011). A study on modern and historic wheat cultivars reported
that modern wheat cultivars were beneficial in gluten sensitive consumers compared to old wheat
consumers (Prandi et al., 2017), which was contrary to van den Broeck et al. (2010).
These contradictory findings may have increased doubts about modern wheat and
suggested a need for studies focusing on the compositional and nutritional properties of historical
wheat compared to modern wheat. Thus, the purpose of this study was to focus on the
compositional properties of historical and modern wheat cultivars and which could assist in
developing wheat breeding strategies for improving wheat quality.
5.3 MATERIALS AND METHODS
5.3.1 Plant materials
Wheat grain samples were produced at the agronomy research farm located at Mead,
Nebraska, USA (41°13'20.40" N -96°29'10.79" W) under rainfed conditions. The 21 wheat
cultivars selected in this study were: ‘Anton’, ‘Centura’, ‘Centruk78’, ‘Cheyenne’, ‘Clark’s
Cream’, ‘Freeman’, ‘Jagalene’, ‘Kharkof’, ‘Lancer’, ‘Mattern’, ‘Overland’, ‘Red Chief’, ‘Settler
CL’, ‘Scout 66’, ‘Sturdy’, ‘TAM 107’, ‘Triumph 64’, ‘Turkey’, ‘Warrior’, ‘Wesley’, and
‘Wichita’. The year of introduction of these cultivars varied from 1870 to 2013 AD (Table 5.1).
The experimental design was a randomized complete block design with three replicates in
two growing years (2016 and 2017). The only exceptions to this were that in 2016, two of the
cultivars were planted in less than three replications due to limited seed availability (Red Chief:
one replication and Anton: two replications). Standard management practices for wheat
production were followed. Commercial fungicides were applied during development, flowering,
and grain filling according to the manufacturer’s instructions. Seed samples from each plot were
taken in bulk and the clean grain samples (~25 g) were milled using a cyclone mill (UDY, Fort

106
Collins, CO, U.S.A.) equipped with 1 mm screen. The milled seed was used to quantify
metabolites using 1H NMR.
5.3.2 Grain yield, grain volume weight, and grain protein concentration
Grain yield and grain volume weight (GVW) were measured as described previously
(Bhatta et al., 2017a and 2017b). Grain protein concentration was measured using a near infrared
reflectance analyzer (DA7250, Perten Instruments, Springfield, IL, USA) (Bhatta et al., 2017b).
5.3.3 1H NMR sample preparation, profiling, and selected metabolites in whole wheat flour
The quantification of metabolites present in whole wheat flour was accomplished as
described previously (Baker et al., 2006). To 30 mg of flour, 1 mL D2O:CH3OD (80:20, v/v) was
added in a 2 mL microcentrifuge tube. After extraction at 90 °C for 10 min, the contents were
centrifuged at 5000g and 4 °C for 10 min and then the supernatant was transferred to a separate
tube and kept at 4 °C for 45 min. After centrifuging the tube for an additional 5 min, 0.4 mL of
this supernatant was transferred to a 5 mm NMR tube followed by the addition of 0.06 mL
internal standard [3-(trimethylsilyl)propionic-2,2,3,3-d4, 0.125 mg/mL]. The internal chemical
shift and the quantification of metabolites were based on the internal standard.
The 1H NMR spectra were acquired using Topspin version 3.5 on a Burker NMR
spectrometer operating at 700 MHz fitted with a 5 mm selective inverse probe. The Fourier
transformed spectra were processed to correct the phase and baseline followed by the calibration
of d4-TSP at δ = 0.00 ppm manually. Data were processed using Chenomx NMR Suite software
version 8.4 (Chenomx Inc., Edmonton, Alberta, Canada). The Chenomx library had a database of
338 compounds and the compounds present in a sample were quantified relative to the internal
standard. The resonances that matched to resonances in the database were selected and reported
in this study.

107
Similar to (Baker et al., 2006), δ 0.9 to 3 ppm contained the aliphatic compounds, δ 3 to
4.3 ppm contained overlapping carbohydrate peaks, δ 4.5 to 5.5 ppm showed non-overlapping
carbohydrate resonances, and δ 6.5- 8.0 ppm showed aromatic compounds. A total of 16
compounds were identified from 1H NMR in our wheat samples. These compounds were divided
into four groups as amino acids (alanine, asparagine, betaine, isoleucine, leucine, threonine,
tryptophan, and valine), carbohydrates (glucose, maltose, and sucrose), phenolic acids (ferulic
acid, chlorogenic acid, syringic acid, and vanillic acid), and carboxylic acid (fumaric acid). The
regions selected for the identified compounds in the NMR spectra are given in Table 5.2.
5.3.4 Statistical analysis
A two-way analysis of variance (ANOVA) was performed to test the main and
interaction effects of the cultivar and growing year. A regression analysis was performed to
observe changes in wheat metabolites, grain yield, GVW, and grain protein concentration over
time. Cultivar year of introduction (release year) was considered as the independent variable and
measured metabolites, grain yield, GVW, and grain protein concentration were considered as
dependent variables. Principal components (PC) analysis was performed to observe the
association among the response variables and three groups of cultivars using correlation matrix.
5.4 RESULTS AND DISCUSSION
5.4.1 Changes in grain yield, grain volume weight, and grain protein concentration with
cultivar year of introduction
ANOVA showed the main effect of cultivar was significant for grain yield and protein
concentration, while the cultivar x growing year interaction was significant for GVW (Table
5.3). The interaction effect was due to a difference in magnitude across growing years rather than

108
a true crossover interaction effect. Therefore, least squares means (lsmeans) of cultivars obtained
from combining two growing years were used for further analysis.
Linear regression between release year and grain yield showed that the grain yield
increased at the rate of 28.7 kg/ha/year, and year of introduction explained 64% of the variation
in grain yield (Table 5.4). Similarly, the grain protein concentration decreased at the rate of
0.02%/year, and release year explained 65% of the variation in grain protein concentration.
Guttieri et al. (2015) showed similar results when grain yield and grain protein concentration of
the historical and modern wheat cultivars were analyzed over release year. An increase in yield
and a decrease in protein concentration were attributed to the yield dilution effect (Bhatta et al.,
2017a; Guttieri et al., 2015; Shewry et al., 2016).
5.4.2 Changes in wheat metabolites including total amino acid, carbohydrate, phenolic
acids, and carboxylic acid with release year of cultivars
The ANOVA showed cultivar x growing year interactions for alanine, asparagine, and
betaine (Table 5.3). The main effect of cultivar was significant for isoleucine and tryptophan,
whereas the main effect of growing year was significant for leucine, tryptophan, valine, and total
amino acids (sum of measured amino acids). The effect of year was a non-crossover, therefore,
least squares means (lsmeans) of cultivars obtained from combining two growing years were
used for further analysis.
Linear regression between release year and tryptophan showed that the tryptophan
concentration increased at a rate of 0.3 mg/year/kg wheat, and release year explained 28% of the
variation in tryptophan content (Table 5.4). The increase in tryptophan in modern cultivars is
interesting because tryptophan was identified as a major bitter compound in a sensory analysis of
whole wheat bread (Jiang and Peterson, 2013). Furthermore, the sensory evaluation of bread

109
made from old and modern cultivars showed preference for bread made from old wheat
(Migliorini et al., 2016). Although the taste of a final product is affected by several compounds
present in wheat as well as the bread formulation and production process, it would be interesting
to identify if the sensory perception of bread and other products are related to the released year
of cultivars.
There were no other significant trends for the other amino acids with respect to year of
introduction (Table 5.4). These findings were in line with the results of Abdel-Aal and Hucl
(2002), who found no difference in amino acid composition between ancient (enkiron and spelt)
and modern wheat (hard spring wheat).
Analysis of variance showed a significant main effect of cultivar for maltose, sucrose,
and total carbohydrates (sum of measured carbohydrates) (Table 5.3). In addition to cultivar,
main effects of growing year were observed for sucrose and total carbohydrates (Table 5.3). The
effect of the growing year was a non-cross over like other amino acids explained above. There
was no significant trend for maltose, sucrose, glucose, and total carbohydrate with respect to
release year (Table 5.4). There was a trend toward an increase in glucose content at the rate of
0.77 mg/kg/year (p=0.1).
The main effects of cultivar and growing year were significant for chlorogenic, syringic,
vanillic, and total phenolics (sum of measured phenolics), whereas only main effect of cultivar
was observed for ferulic acid (Table 5.3). Similar to amino acids and carbohydrates, the effect of
a growing year was a non-cross over. Syringic acid, vanillic acid, and total phenolics showed
increasing trends with respect to release year (p<0.1; Table 5.4). A future study on a larger set of
wheat cultivars with broad genetic backgrounds may provide additional insights on trend over
time. Chlorogenic and ferulic acids did not change with respect to release year. Previously,
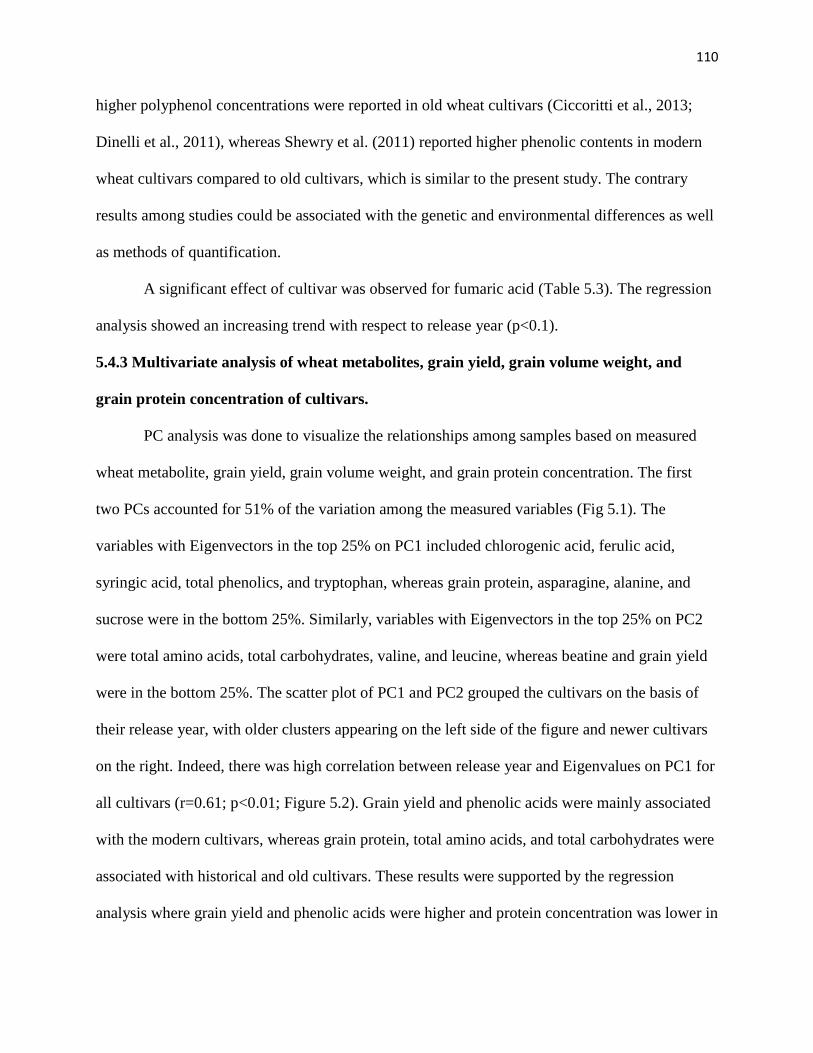
110
higher polyphenol concentrations were reported in old wheat cultivars (Ciccoritti et al., 2013;
Dinelli et al., 2011), whereas Shewry et al. (2011) reported higher phenolic contents in modern
wheat cultivars compared to old cultivars, which is similar to the present study. The contrary
results among studies could be associated with the genetic and environmental differences as well
as methods of quantification.
A significant effect of cultivar was observed for fumaric acid (Table 5.3). The regression
analysis showed an increasing trend with respect to release year (p<0.1).
5.4.3 Multivariate analysis of wheat metabolites, grain yield, grain volume weight, and
grain protein concentration of cultivars.
PC analysis was done to visualize the relationships among samples based on measured
wheat metabolite, grain yield, grain volume weight, and grain protein concentration. The first
two PCs accounted for 51% of the variation among the measured variables (Fig 5.1). The
variables with Eigenvectors in the top 25% on PC1 included chlorogenic acid, ferulic acid,
syringic acid, total phenolics, and tryptophan, whereas grain protein, asparagine, alanine, and
sucrose were in the bottom 25%. Similarly, variables with Eigenvectors in the top 25% on PC2
were total amino acids, total carbohydrates, valine, and leucine, whereas beatine and grain yield
were in the bottom 25%. The scatter plot of PC1 and PC2 grouped the cultivars on the basis of
their release year, with older clusters appearing on the left side of the figure and newer cultivars
on the right. Indeed, there was high correlation between release year and Eigenvalues on PC1 for
all cultivars (r=0.61; p<0.01; Figure 5.2). Grain yield and phenolic acids were mainly associated
with the modern cultivars, whereas grain protein, total amino acids, and total carbohydrates were
associated with historical and old cultivars. These results were supported by the regression
analysis where grain yield and phenolic acids were higher and protein concentration was lower in

111
modern cultivars. One newer cultivar, Mattern, did not group with the rest of the newer cultivars.
This result was not all together unexpected as Mattern is a waxy winter wheat, whereas others
were non-waxy wheat, implying differences in endosperm composition.
5.5 CONCLUSION
Results from this study showed that grain yield and protein concentration changed
dramatically over time, whereas there were only small changes in the metabolic composition of
modern cultivars. Tryptophan concentration showed a significant increase over time, while the
concentration of some other amino acids and phenolic acids tended to increase. Principal
components analysis did reveal a separation between historical and modern wheat. It appeared
that wheat breeding had a small impact on the metabolic composition of wheat. Future studies
involving large numbers of diverse genotypes over several decades may provide additional
insights into the compositional, nutraceutical, and functional properties of the wheat cultivars.
Furthermore, it would be interesting to study the sensory and baking quality of modern and old
wheat cultivars as they play an important role in the acceptability of any cultivar.

112
5.6 REFERENCES
Abdel-Aal, E.-S.M., Hucl, P., 2002. Amino Acid Composition and In Vitro Protein Digestibility
of Selected Ancient Wheats and their End Products. Journal of Food Composition and Analysis
15, 737–747. https://doi.org/10.1006/jfca.2002.1094
Baker, J.M., Hawkins, N.D., Ward, J.L., Lovegrove, A., Napier, J.A., Shewry, P.R., Beale, M.H.,
2006. A metabolomic study of substantial equivalence of field-grown genetically modified
wheat. Plant Biotechnology Journal 4, 381–392. https://doi.org/10.1111/j.1467-
7652.2006.00197.x
Bhatta, M., Eskridge, K.M., Rose, D.J., Santra, D.K., Baenziger, P.S., Regassa, T., 2017a.
Seeding Rate, Genotype, and Topdressed Nitrogen Effects on Yield and Agronomic
Characteristics of Winter Wheat. Crop Science 57, 951–963.
https://doi.org/10.2135/cropsci2016.02.0103
Bhatta, M., Morgounov, A., Belamkar, V., Baenziger, P., Bhatta, M., Morgounov, A., Belamkar,
V., Baenziger, P.S., 2018. Genome-Wide Association Study Reveals Novel Genomic Regions
for Grain Yield and Yield-Related Traits in Drought-Stressed Synthetic Hexaploid Wheat.
International Journal of Molecular Sciences 19, 3011. https://doi.org/10.3390/ijms19103011
Bhatta, M., Regassa, T., Rose, D.J., Baenziger, P.S., Eskridge, K.M., Santra, D.K., Poudel, R.,
2017b. Genotype, environment, seeding rate, and top-dressed nitrogen effects on end-use quality
of modern Nebraska winter wheat. Journal of the Science of Food and Agriculture 97, 5311–
5318. https://doi.org/10.1002/jsfa.8417
Boukid, F., Folloni, S., Sforza, S., Vittadini, E., Prandi, B., 2018. Current Trends in Ancient
Grains-Based Foodstuffs: Insights into Nutritional Aspects and Technological Applications.

113
Comprehensive Reviews in Food Science and Food Safety 17, 123–136.
https://doi.org/10.1111/1541-4337.12315
Brouns, F.J.P.H., van Buul, V.J., Shewry, P.R., 2013. Does wheat make us fat and sick? Journal
of Cereal Science 58, 209–215. https://doi.org/10.1016/j.jcs.2013.06.002
Bushuk, W., 1997. Wheat breeding for end-product use, in: Braun, H.-J., Altay, F., Kronstad,
W.E., Beniwal, S.P.S., McNab, A. (Eds.), Wheat: Prospects for Global Improvement:
Proceedings of the 5th International Wheat Conference, 10–14 June, 1996, Ankara, Turkey,
Developments in Plant Breeding. Springer Netherlands, Dordrecht, pp. 203–211.
https://doi.org/10.1007/978-94-011-4896-2_27
Ciccoritti, R., Carbone, K., Bellato, S., Pogna, N., Sgrulletta, D., 2013. Content and relative
composition of some phytochemicals in diploid, tetraploid and hexaploid Triticum species with
potential nutraceutical properties. Journal of Cereal Science, EuroCereal 2011 57, 200–206.
https://doi.org/10.1016/j.jcs.2012.07.009
De Vita, P., Nicosia, O.L.D., Nigro, F., Platani, C., Riefolo, C., Di Fonzo, N. and Cattivelli, L.,
2007. Breeding progress in morpho-physiological, agronomical and qualitative traits of durum
wheat cultivars released in Italy during the 20th century. European Journal of Agronomy, 26(1),
pp.39-53.
Dinelli, G., Segura Carretero, A., Di Silvestro, R., Marotti, I., Fu, S., Benedettelli, S., Ghiselli,
L., Fernández Gutiérrez, A., 2009. Determination of phenolic compounds in modern and old
varieties of durum wheat using liquid chromatography coupled with time-of-flight mass
spectrometry. Journal of Chromatography A, Advanced Separation Methods in Food Analysis
1216, 7229–7240. https://doi.org/10.1016/j.chroma.2009.08.041

114
Dinelli, G., Segura-Carretero, A., Di Silvestro, R., Marotti, I., Arráez-Román, D., Benedettelli,
S., Ghiselli, L., Fernadez-Gutierrez, A., 2011. Profiles of phenolic compounds in modern and old
common wheat varieties determined by liquid chromatography coupled with time-of-flight mass
spectrometry. Journal of Chromatography A, Advanced Food Analysis 1218, 7670–7681.
https://doi.org/10.1016/j.chroma.2011.05.065
Guttieri, M.J., Baenziger, P.S., Frels, K., Carver, B., Arnall, B., Waters, B.M., 2015. Variation
for Grain Mineral Concentration in a Diversity Panel of Current and Historical Great Plains Hard
Winter Wheat Germplasm. Crop Science 55, 1035–1052.
https://doi.org/10.2135/cropsci2014.07.0506
Guzmán, C., Autrique, E., Mondal, S., Huerta-Espino, J., Singh, R.P., Vargas, M., Crossa, J.,
Amaya, A., Peña, R.J., 2017. Genetic improvement of grain quality traits for CIMMYT semi-
dwarf spring bread wheat varieties developed during 1965–2015: 50 years of breeding. Field
Crops Research 210, 192–196. https://doi.org/10.1016/j.fcr.2017.06.002
Jiang, D., Peterson, D.G., 2013. Identification of bitter compounds in whole wheat bread. Food
Chem 141, 1345–1353. https://doi.org/10.1016/j.foodchem.2013.03.021
Lopes, M.S., El-Basyoni, I., Baenziger, P.S., Singh, S., Royo, C., Ozbek, K., Aktas, H., Ozer, E.,
Ozdemir, F., Manickavelu, A., Ban, T., Vikram, P., 2015. Exploiting genetic diversity from
landraces in wheat breeding for adaptation to climate change. J. Exp. Bot. 66, 3477–3486.
https://doi.org/10.1093/jxb/erv122
Migliorini, P., Spagnolo, S., Torri, L., Arnoulet, M., Lazzerini, G., Ceccarelli, S., 2016.
Agronomic and quality characteristics of old, modern and mixture wheat varieties and landraces

115
for organic bread chain in diverse environments of northern Italy. European Journal of
Agronomy 79, 131–141. https://doi.org/10.1016/j.eja.2016.05.011
Prandi, B., Tedeschi, T., Folloni, S., Galaverna, G., Sforza, S., 2017. Peptides from gluten
digestion: A comparison between old and modern wheat varieties. Food Research International
91, 92–102. https://doi.org/10.1016/j.foodres.2016.11.034
Shewry, P.R., 2018. Do ancient types of wheat have health benefits compared with modern bread
wheat? Journal of Cereal Science 79, 469–476. https://doi.org/10.1016/j.jcs.2017.11.010
Shewry, P.R., 2009. Wheat. Journal of Experimental Botany 60, 1537–1553.
https://doi.org/10.1093/jxb/erp058
Shewry, P.R., Gebruers, K., Andersson, A.A.M., Aman, P., Piironen, V., Lampi, A.-M., Boros,
D., Rakszegi, M., Bedo, Z., Ward, J.L., 2011. Relationship between the contents of bioactive
components in grain and the release dates of wheat lines in the HEALTHGRAIN diversity
screen. J. Agric. Food Chem. 59, 928–933. https://doi.org/10.1021/jf103860x
Shewry, P.R., Pellny, T.K., Lovegrove, A., 2016. Is modern wheat bad for health? [WWW
Document]. Nature Plants. https://doi.org/10.1038/nplants.2016.97

116
Table 5.1. Selected historical and modern wheat cultivars and their year of introduction.
Cultivars Year of introduction
Anton 2007
Centura 1983
Centurk78 1978
Cheyenne 1933
ClarksCream 1972
Freeman 2013
Jagalene 2002
Kharkof 1900
Lancer 1963
Mattern 2012
Overland 2007
RedChief 1940
Scout66 1967
SettlerCL 2008
Sturdy 1966
TAM107 1984
Triumph64 1964
Turkey 1870
Warrior 1960
Wesley 1998
Wichita 1944

117
Table 5.2. Metabolites identified in modern and old wheat varieties from 1H NMR
Groups Compounds ppm
Amino acids Alanine δ 1.4
Asparagine δ 2.92-2.96
Betaine δ 1.8
Isoleucine δ 1.1
Leucine δ 1.1
Threonine δ 1.3
Tryptophan δ 7.0
Valine δ 1.1
Carbohydrates Glucose δ 4.4, 5.2
Maltose δ 4.6, 5.4
Sucrose δ 5.4, 4.6
Phenolic acids Ferulic acid δ 7.0, 3.6
Chlorogenic acid δ 7.2
Syringic acid δ 7.3,7.3
Vanillic acid δ 7.7
Carboxylic acid Fumaric acid δ 4.0

118
11
8
Table 5.3. Analysis of variance (mean squares) on metabolites (mg/kg) on whole wheat flour, grain yield (kg/ha), grain volume
weight (GVW) (kg/hl), and grain protein concentration (%)A
A df= degrees of freedom; *P <0.05; **P <0.01; ***P<0.001.
Source df
Component
Alanine Asparagine Betaine Isoleucine Leucine Threonine Tryptophan Valine
Total
Amino acids
Growing
year (GY) 1 15788*** 21421* 1453 434.7* 1899* 2656 20747* 984* 247034
Error a=
Rep(GY) 4 38 2077 3080 27 121 389 2155 74 14075
Cultivar (C) 20 169*** 2327*** 2094** 94 166 285 2328** 135 6939
C x GY 20 196*** 986** 2251*** 86 153 421 1043 164 7265
Error 77 51 489 792 78 110 464 981 110 4828
Source df Glucose Maltose Sucrose
Total
CHO
Chlorogenic
acid
Ferulic
acid
Syringic
acid
Vanillic
acid
Total
Phenolics
GY 1 142111 205313 5868778*** 3121565* 17288** 1104 540** 4882* 49450**
Error a=
Rep(GY) 4 25968 43405 30088 149138 437 339 19 184 1238
C 20 35349 45752* 255990*** 406564** 892*** 632* 264* 713* 7054**
C x GY 20 36647 32764 71677 284595 440 338 126.4 485 3497
Error 77 35539 23939 53799 159103 325 346 135 358 2698
Source df
Fumaric
acid Yield GVW Protein
GY 1 27 3826926 595*** 19.6
Error a=
Rep(GY) 4 74 544439 4 7.6
C 20 284*** 10285155*** 7*** 4.6***
C x GY 20 68 478506 2.58** 0.6*
Error 77 64 621607 0.5 0.33

119
Table 5.4. Regression analysis parameters for relationships of wheat metabolites, grain yield,
grain volume weight, protein concentration and released year (RY).
Response variable Regression equation Units R2 P-value of slope
Alanine 59 -0.8 x 10⁻² x RY mg/kg 0.003 0.79
Asparagine 454 -0.2 x RY mg/kg 0.09 0.18
Betaine 254 - 0.1 x RY mg/kg 0.04 0.35
Isoleucine 43.4 - 0.01 x RY mg/kg 0.01 0.61
Leucine 53.6 -0.9 x 10⁻² x RY mg/kg 0.04 0.76
Threonine 84.4 - 0.03 x RY mg/kg 0.02 0.5
Tryptophan -517.2 + 0.3 x RY mg/kg 0.28 0.01*
Valine 0.04 + 0.3x 10⁻⁵ x RY mg/kg 0.02 0.76
Total amino acids 447-0.04 x RY mg/kg 0.002 0.8
Glucose -1024 + 0.77 x RY mg/kg 0.14 0.09
Maltose 523 + 0.01 x RY mg/kg 0.0001 0.97
Sucrose -434.2 + 0.92 x RY mg/kg 0.02 0.47
Total carbohydrate -934 + 1.7 x RY mg/kg 0.07 0.2
Chlorogenic acid -209 + 0.13 x RY mg/kg 0.14 0.1
Ferulic acid -124.4 + 0.08 x RY mg/kg 0.09 0.18
Syringic acid -114.4 + 0.06 x RY mg/kg 0.14 0.09
Vanillic acid -199 + 0.12 x RY mg/kg 0.16 0.07
Total phenolics -647 + 0.4 x RY mg/kg 0.18 0.051
Fumaric acid -0.27 + 0.01 x 10⁻² x RY mg/kg 0.05 0.06
Grain yield --52186 + 28.7 x RY kg/ ha 0.64 <0.0001**
Grain volume
weight 66.1+ 0.47 x 10⁻² x RY kg/hl 0.02 0.52
Protein 52.1 - 0.02 x RY % 0.65 <0.0001**
*Regression model of tryptophan was significant at P <0.05, whereas grain yield, grain protein
concentration models were significant at P <0.0001.

120
Figure 5.1. Principal component biplot analysis based on measured metabolites (mg/kg), grain
yield (kg/ha), grain volume weight (GVW) (kg/hl), grain protein concentration (%), and three
groups of wheat cultivars based on their released year.
Alanaine
Asparagine
Chlorogenic acid
Fumaric acid
Glucose
GVW
Isoleucine
Leucine
Maltose
Protein
Sucrose
Syringic acid
Tryptophan
Valine
Vanillic acid
YieldBeatine
Ferulic acid
Total amino acids
Total carbohydrates
Total phenolics
Threonine
-2.5
-2
-1.5
-1
-0.5
0
0.5
1
1.5
2
2.5
-2.5 -2 -1.5 -1 -0.5 0 0.5 1 1.5 2 2.5
PC
2 (
18%
)
PC1 (32%)
Year of release 1870-1944 AD
Year of release 1960-1984 AD
Year of release 1900-2013 AD

121
Figure 5.2. Relationship between cultivar year of introduction and Eigenvalues on principal
component (PC) 1 from PC analysis based on the metabolic composition of the cultivars.
-2
-1.5
-1
-0.5
0
0.5
1
1.5
2
2.5
1850 1900 1950 2000 2050
Eig
enval
ue
on P
C1
Year of introduction

122
CHAPTER 6: PRELIMINARY EVIDENCE OF ASPARAGINASE ACTIVITY IN
WHOLE WHEAT FLOUR
6.1 ABSTRACT
The use of exogenous asparaginase has been shown to be effective at reducing the
acrylamide concentration in baked goods; however, no studies have reported the presence of
endogenous asparaginase activity in wheat and its potential in reducing acrylamide concentration
in baked goods. This study focused on developing a simple colorimetric procedure for the
quantification of asparaginase activity in milled wheat by measuring the liberated ammonia in
the hydrolysis reaction catalyzed by the asparaginase. Four hard winter wheat cultivars grown in
Nebraska were used to establish the protocol. The quantification of asparaginase activity showed
a significant genotypic difference among the cultivars. The highest asparaginase activity was
observed in Overland, whereas Freeman showed the lowest activity. This protocol will be
informative to measure and characterize the endogenous asparaginase activity in whole wheat
flour.
123
6.2 INTRODUCTION
A considerable amount of acrylamide (neurotoxin) was reported in thermally processed
foods due to the Maillard reaction between reducing sugars and primarily asparagine (Stadler et
al., 2002; Tareke et al., 2002). Over the years, several studies have focused on the different
strategies to reduce the acrylamide concentration in fried and baked products (de Boer et al.,
2005; Hanley et al., 2005; Xu et al., 2016).
One of the strategies to reduce the acrylamide concentration in baked wheat-based
products is the application of asparaginase (L-asparagine amidohydrolases EC 3.5.1.1) enzyme
during dough formation stage (Xu et al., 2016). Asparaginase catalyzes the hydrolysis of
asparagine to aspartate and ammonia, and thus effectively removes free asparagine for
participation in the Maillard reaction (Zyzak et al., 2003). The application of asparaginase during
dough formation was found to reduce the acrylamide concentration by 70% (Vass et al., 2004).
Several other studies have shown the potential of asparaginase in reducing the acrylamide
concentration in final products (Huang et al., 2014; Tuncel et al., 2010).
The action of asparaginase to reduce the acrylamide concentration is dependent on
different factors including the source of enzyme (microorganisms), pH of the dough, the reaction
time, and the temperature at which the reaction occur (Anese et al., 2011). Although the use of
exogenous asparaginase was successful to reduce the acrylamide to some extent, the cost of the
production of asparaginase enzyme from the exogenous source is expensive and the final yield of
the enzyme is very low (Xu et al., 2016). Additionally, the exogenous application of enzyme
may raise the concern of safety as well as the sensory and other related attributes of the final
products.

124
During quantification of asparagine in a previous study (Navrotskyi et al., 2018), we
observed a decline in asparagine with prolonged extraction times (data not shown). This led us to
hypothesize that wheat may have an endogenous or grain-associated asparaginase that could be
relevant to acrylamide formation in baked goods. Furthermore, because most enzymatic activity
in wheat is present in the outer layers of the wheat kernel (germ, aleurone, pericarp), we
anticipated that asparaginase activity would be more relevant to whole grain baked good
compared with refined products. Therefore, the purpose of this study was to develop an assay for
the quantification of the endogenous asparaginase activity in wheat and identify a possible
genetic variation in wheat cultivars. The first part of the study focuses on the development of a
simple colorimetric method to quantify the asparaginase activity by measuring the released
ammonia during the hydrolysis of asparagine, whereas the second part focuses on the variation
of asparaginase activity in four hard winter wheat cultivars.
6.3 MATERIALS AND METHODS
6.3.2 Development of the protocol
The quantification of asparaginase activity was based on the colorimetric quantification
of ammonia generated during the hydrolyzing reaction of asparaginase. The quantification of
asparaginase activity followed steps 1 to 8 as described below.
Step 1: Two-hundred milligrams of whole wheat flour in a 10 mL centrifuge tube was vortexed
(5 s) to aerate. Two mL of ice-cold 25 mM sodium-HEPES buffer (pH=8) containing 1 mM
ethylenediaminetetraacetic acid (EDTA) and 20 mM potassium chloride was added. The tubes
were then subjected to continuous shaking in a horizontal shaker (150 rpm) at 4 °C for 30 min.
Following extraction, the tubes were centrifuged at 4500g for 20 min at 4 °C.

125
Step 2: The supernatants (0.4 mL) were transferred to a mini-dialysis tube (69553, 2000 MWCO,
Thermo Scientific) containing 0.12 g of solid ammonium sulfate and dialyzed in water for 5 h.
The container with water was kept above magnetic stir plate and water was changed every hour
to ensure proper diffusion of solutes.
Step 3: Four-hundred microliters of the supernatant from the dialysis tubes was transferred to a
separate 5 mL centrifuge tube. Sodium-HEPES buffer (pH=8; 0.5 mL) was added to the dialysis
tube as a washing step to ensure all the supernatant were drawn for the further analysis. The
washing step was repeated two more times.
Step 4: After centrifuging for 3 min, 0.7 mL of the enzyme extract was transferred to a separate
tube followed by the addition of 0.5 mL of Na-HEPES buffer (pH=8) containing 25 mM
asparagine. Concurrently, another tube containing 0.7 mL of enzyme extract and 0.5 mL Na-
HEPES (pH=8) buffer without asparagine was prepared to get blank readings.
Step 5: The tubes were incubated at 30 °C for 5 min and a 0.8 mL aliquot was transferred to
another tube containing 0.1 mL of 1 M sodium hydroxide.
Step 6: After the addition of alkali, 0.6 mL of this aliquot was transferred to a separate tube and
40 μl of phenol-alcohol solution was added which was followed by the addition of 40 μl of 0.5%
sodium nitroprusside in water. The tubes were closed and inverted a few times. 0.1 mL of freshly
prepared oxidizing solution [four parts of alkaline solution (10 g of trisodium citrate and 0.5 g of
sodium hydroxide in 50 mL water) and 1 part of liquid bleach] was added and the tubes were
inverted a few times.
Step 7: The absorbances readings were measured at 640 nm after allowing the color development
for 5 min at room temperature.

126
Step 8: Ammonia was quantified by means of external calibration with ammonium chloride (1-
10 μM ammonia, which was ~0.05 -0.5 mg ammonium chloride/L).
6.4 RESULTS
6.4.1 Challenges during the protocol development
The major challenge faced during the protocol development was the higher absorbance
readings for blank (aliquot containing no added asparagine). The higher blank readings may be
due to the interference from the ammonium sulfate or endogenous asparagine. Therefore, the
washing step was introduced (step 3) before adding a buffer containing asparagine.
6.4.2 Asparaginase activity
There was a significant difference among cultivars for the asparaginase activity (P-value
= 0.02). The highest asparaginase concentration was observed in Overland followed by Kharkof
and the lowest activity was observed in Freeman (Fig 6.1). The asparaginase activity in Overland
was 2.2 µ mol/g/min. The differences among cultivars for asparaginase activity was promising
as it showed the possible genotypic variation among the cultivars.
6.5 FUTURE PLANS
6.5.1 Optimizing the protocol
This study quantified the asparaginase activity using ammonium sulfate, which took
considerable time and purification steps to get a lower blank reading (Table 6.1). Trichloroacetic
acid (TCA) is another popular reagent to precipitate the protein and if we could quantify
asparaginase activity using TCA buffer then the interference in the blank reading due to
ammonia released from ammonium sulfate could be omitted.
The protocol was developed using pH buffer 8. At this pH, many fungal enzymes were
reported to be active (Janakiraman, 2015). Therefore, the reflected asparaginase activity may not

127
truly represent the endogenous asparaginase activity of wheat. The next step would be to
quantify the asparaginase activity following the same method described above except using a
low pH buffer (pH=5). The reasons to select pH=5 were (i) the optimum pH of dough during
fermentation was 5 and (ii) it is an optimum pH for many other enzymes present in wheat (Khan,
2016).
6.5.2 Variation of asparaginase activity
The quantification of asparaginase activity across diverse wheat genotypes would help to
estimate the range of endogenous activity in wheat. Furthermore, it would be interesting to look
at the relationship of asparagine and asparaginase in whole wheat flour to the acrylamide
concentration in baked products and observe if the acrylamide concentration is a function of
asparagine, asparaginase activity or both.

128
6.6 REFERENCES
Anese, M., Quarta, B., Frias, J., 2011. Modelling the effect of asparaginase in reducing
acrylamide formation in biscuits. Food Chemistry 126, 435–440.
de Boer, L., Heeremans, C.E.M., Meima, R.B., 2005. Reduction of acrylamide formation In
bakery products by application of Aspergillus niger asparaginase, in: Cauvain, S.P., Salmon,
S.S., Young, L.S. (Eds.), Using Cereal Science and Technology for the Benefit of Consumers,
Woodhead Publishing Series in Food Science, Technology and Nutrition. Woodhead Publishing,
pp. 401–405.
Hanley, A.B., Offen, C., Clarke, M., Ing, B., Roberts, M., Burch, R., 2005. Acrylamide reduction
in processed foods. Adv. Exp. Med. Biol. 561, 387–392.
Huang, L., Liu, Y., Sun, Y., Yan, Q., Jiang, Z., 2014. Biochemical Characterization of a Novel l-
Asparaginase with Low Glutaminase Activity from Rhizomucor miehei and Its Application in
Food Safety and Leukemia Treatment. Appl. Environ. Microbiol. 80, 1561–1569.
Janakiraman, S., 2015. Purification and Characterization of Therapeutic Enzyme L-Asparaginase
from a Tropical Soil Fungal Isolate Fusarium Culmorum ASP-87. MOJ Proteomics &
Bioinformatics 2.
Khan, K., 2016. Wheat: Chemistry and Technology. Elsevier.
Navrotskyi, S., Baenziger, P.S., Regassa, T., Guttieri, M.J., Rose, D.J., 2018. Variation in
asparagine concentration in Nebraska wheat. Cereal Chemistry 95, 264–273.
Stadler, R.H., Blank, I., Varga, N., Robert, F., Hau, J., Guy, P.A., Robert, M.-C., Riediker, S.,
2002. Acrylamide from Maillard reaction products. Nature 419, 449–450.

129
Tareke, E., Rydberg, P., Karlsson, P., Eriksson, S., Törnqvist, M., 2002. Analysis of acrylamide,
a carcinogen formed in heated foodstuffs. J. Agric. Food Chem. 50, 4998–5006.
Tuncel, N.B., Yılmaz, N., Şener, E., 2010. The effect of pea (Pisum sativum L.)‐originated
asparaginase on acrylamide formation in certain bread types. International Journal of Food
Science & Technology 45, 2470–2476.
Vass, M., M Amrein, T., Schönbächler, B., Escher, F., Amadò, R., 2004. Ways to reduce the
acrylamide formation in cracker products. Czech Journal of Food Sciences 22, S19–S21.
Xu, F., Oruna-Concha, M.-J., Elmore, J.S., 2016. The use of asparaginase to reduce acrylamide
levels in cooked food. Food Chemistry 210, 163–171.
Zyzak, D.V., Sanders, R.A., Stojanovic, M., Tallmadge, D.H., Eberhart, B.L., Ewald, D.K.,
Gruber, D.C., Morsch, T.R., Strothers, M.A., Rizzi, G.P., Villagran, M.D., 2003. Acrylamide
formation mechanism in heated foods. J. Agric. Food Chem. 51, 4782–4787.

130
Table 6.1. Mean absorbance readings of wheat cultivars and their respective blanks during
asparaginase activity assay.
Absorbance readings
Cultivars Replication Samples Blank
Kharkof 1 0.443 1.17
2 0.468 1.18
Clarks'Cream 1 0.588 0.3705
2 0.3165 0.298
Freeman 1 0.175 1.62
2 0.188 1.04
Overland 1 0.506 0.291
2 0.695 0.301

131
Figure 6.1. Asparaginase activity in whole wheat flour among four wheat cultivars. Different
lowercase results in each bar represented significant differences at P- value=0.05.
bc
c
ab
a
0
0.5
1
1.5
2
2.5
ClarksCream Freeman Kharkof Overland
Asp
arag
inas
e ac
tivit
y
(µm
ol/
g/m
in)

132
CHAPTER 7 OVERALL CONCLUSIONS AND FUTURE INSIGHTS
The first objective of this study was to understand the effects of genotype, environment,
and management practices (fungicide application) on lipolytic (lipase, esterase, and
lipoxygenase) activities. Significant genotype x environment x fungicide interactions were
observed for esterase and lipoxygenase activities; however, a large portion of the variability was
due to the environment. Lipase activity varied due to genotypic differences, environment and
fungicide application independently rather than their interactions. When the environment was
conducive to disease development, fungicide application was effective at reducing lipolytic
activity. The findings from this study supported our hypothesis that lipolytic activities were
influenced by genotype, environment, and management practices. In the future, it would be
interesting to study genotype x environment variation on different compositional and functional
properties of whole wheat flour. As the applied management practices and growing environment
are related, it would be interesting how different management practices including herbicide and
fertilizers application would affect flour properties and final products.
The second and third objective of this study was to understand the effects of different
processing methods (steaming and germination) on lipolytic activities. Results from the steaming
study showed that lipase, lipoxygenase, polyphenol oxidase, and peroxidase activities decreased
by up to 81%, 63%, 22%, and 34%, respectively, as the time of steaming increased up to 90 s.
Steaming had no effect on starch and gluten properties. Upon storage, free fatty acids decreased
with respect to time of steaming. Time of steaming did not affect lipid oxidation in flour;
however, total carbonyls produced in dough made from stored flour were decreased with the
increase in steaming duration. These findings supported our hypothesis that steaming would be
effective in reducing lipase activity of whole wheat flour and the reduction of lipase activity

133
would reduce the accumulation of FFA during storage. Future studies can be directed towards
the sensory properties of the products made from steam-treated grains before milling.
Furthermore, it would be interesting to study if steaming of grains could be one of the efficient
and easy ways to reduce microbial load and possible pathogens on grains.
The germination study showed that the compositional and functional properties of wheat
grains were primarily influenced by germination duration rather than wheat lot or drying
temperature. The decrease in phytic acid and increase in lysine and γ-aminobutyric acid
improved the nutritive value of the flour, whereas an increase in lipolytic activities (lipase,
esterase, and lipoxygenase) may lower the shelf life of the flour. Furthermore, an increase in free
asparagine may increase the concentration of acrylamide in the baked products via the Maillard
reaction. When germinated flour was added to regular whole wheat flour at low percentages (up
to 10%), the mixing and baking characteristics of the bread made from the composite flour was
generally improved; however, a long germination duration or high inclusion percentages lowered
the quality of the bread. Results from this study supported our hypothesis that germination time,
drying temperature, and differences in wheat lots affect the changes in flour due to germination.
However, the effect of germination time was dominant on most of the measured variables,
whereas drying temperature and differences in wheat lots had smaller effects. In the future, the
sensory properties of the products made from germinated flour and the use of germinated wheat
flour to develop gluten free products would be interesting to study. This study can be extended to
study microbiological loads on grains during germination and if the consumption of germinated
flour-based products changes or improves gut health.
The fourth objective was to estimate the shelf life of whole wheat flour by relating
chemical changes in flour with the sensory acceptability of the bread. The changes in chemical

134
properties during storage were measured by quantifying FFA and lactic acid solvent retention
capacity (LA-SRC). FFA accumulation increased in flour stored at 35 °C for the first five
months of storage and the rate of increase was different among cultivars. The accumulation of
FFA was higher in fine flour compared to course flour. The LA-SRC values were higher in fine
flour and at 35 °C. The estimated shelf life of the whole wheat flours ranged from 8.5-10.5
months when stored at 35 ºC, whereas the shelf-life at room temperature was >12 months. These
results supported our hypothesis; however, storage temperature, time, and cultivars were found
to have more effect on the chemical stability and functionality of flour compared to particle size.
Future studies can be directed to quantify oxygenated fatty acids and other volatile compounds
and observe their relationship with the sensory acceptability.
The fifth objective was to compare historical and modern cultivars for their
compositional properties, grain yield, grain protein content, and grain volume weight. A distinct
separation of modern and historical cultivars on the basis of grain yield, grain protein content,
tryptophan, and phenolics acid concentrations in flour was observed. However, overall
composition of flour on the basis of measured amino acids (alanine, asparagine, betaine,
isoleucine, leucine, threonine, and valine), carbohydrates (maltose and sucrose), and fumaric
acids showed no differences among historical and modern cultivars. These results supported our
hypothesis that compositional properties of flour did not decline due to wheat breeding program.
In the future, a large diverse set of cultivars can be studied for nutraceuticals and functional
properties and mineral concentrations of flour. Furthermore, it would be interesting to study the
sensory and baking quality of modern and historical wheat cultivars as they play an important
role in the acceptability of any cultivar.

135
The objective of this study was focused on developing a simple colorimetric procedure
for the quantification of asparaginase activity in whole wheat flour. A preliminary colorimetric
quantification of the activity was developed and a significant variation among cultivars were
observed for the asparaginase activity. The variation among cultivars for the asparaginase
activity supported our hypothesis about the evidence of asparaginase activity and genotypic
differences among cultivars for asparaginase activity. In the future, diverse wheat genotypes can
be used to estimate the range of endogenous asparaginase activity in wheat and observe the
interactions (if any) among free asparagine concentration and asparaginase activity on
acrylamide formation in baked products.
