environmentalshocks,religiousstruggle,andresilience
TRANSCRIPT
Zurich Open Repository andArchiveUniversity of ZurichMain LibraryStrickhofstrasse 39CH-8057 Zurichwww.zora.uzh.ch
Year: 2019
Environmental shocks, religious struggle, and resilience: a contribution tothe economic history of Ancien Régime France
Chambru, Cédric
Abstract: The potential link between climate variability, conflict, and migration is increasingly viewed asa security issue by policy makers. Climate variability and extremes raise critical challenges to agricultureand food production all over the world, and lead to diminished coping capacity, loss of livelihoods, aswell as migration flows. The essays in this dissertation raise the question of resilience to shocks in pre-industrial economies using the cases of France and Savoy during the Ancien Régime. More specifically,it documents the role of institutions and migration in reducing the vulnerability to climate shocks andhence violence. It further studies both the effect of seasonal migration as a resilience strategy againstadverse economic conditions, and the socio-economic consequences of large and unexpected episode ofmigration.
DOI: https://doi.org/10.13097/archive-ouverte/unige:119759
Posted at the Zurich Open Repository and Archive, University of ZurichZORA URL: https://doi.org/10.5167/uzh-186278DissertationPublished Version
Originally published at:Chambru, Cédric. Environmental shocks, religious struggle, and resilience: a contribution to the economichistory of Ancien Régime France. 2019, Université de Genève.DOI: https://doi.org/10.13097/archive-ouverte/unige:119759
Abstract
ENVIRONMENTAL SHOCKS,RELIGIOUS STRUGGLE, AND
RESILIENCEA Contribution to the Economic History
of Ancien Régime France
By
Cédric CHAMBRU
A thesis submitted to theGeneva School of Social Sciences,
University of Geneva, Switzerland,in fulfilment of the requirements for the degree of
PhD in Social Sciences
Members of the thesis committee:Prof. Mathieu COUTTENIER, Adviser, Université de Genève
& Université de Lyon, ENS LyonProf. Michael HUBERMAN, Adviser, Université de MontréalProf. Pilar NOGUES-MARCO, Chair, Université de Genève
Prof. Guido ALFANI, Università Commerciale Luigi BocconiProf. Roberto GALBIATI, CNRS-Sciences Po ParisProf. Mathias THOENIG, Université de Lausanne
Thesis No. 117May 3, 2019

iii
La Faculté des Sciences de la Société, sur préavis du jury, a autorisé l’impressionde la présente thèse, sans entendre, par-là, émettre aucune opinion sur lespropositions qui s’y trouvent énoncées et qui n’engagent que la responsabilitéde leur auteur.
Genève, le 24 mai 2019
Le doyenBernard DEBARBIEUX
Impression d’après le manuscrit de l’auteur

Résumé
Le lien entre la variabilité climatique, les conflits et la migration est de plus en
plus souvent pointé comme un problème de sécurité majeur par les organisations
internationales et autres décideurs politiques. Avec l’augmentation prévue des
températures dans les prochaines décennies, les projections indiquent que la
fréquence et la gravité des catastrophes naturelles, notamment les vagues de
chaleur, les sécheresses et les fortes précipitations, vont également augmenter.
Dans la dernière édition de The State of Food Security and Nutrition in the World
(2018), l’Organisation des Nations Unies pour l’alimentation et l’agriculture
(FAO) a souligné que la variabilité du climat et les extrêmes météorologiques
sont parmi les principales causes de la récente hausse de la faim dans le monde
et l’une des sources de crises alimentaires. Ces phénomènes extrêmes posent des
problèmes critiques pour l’agriculture et la production alimentaire dans le monde
entier, entraînant une diminution de la capacité d’adaptation des communautés
locales, une perte des moyens de subsistance et des flux migratoires.
Les chocs climatiques et la faim ont entraîné de nombreuses violences inter-
personnelles et des conflits civils au cours des siècles derniers. L’objectif de cette
thèse est de documenter les conséquences des chocs climatiques et migratoires
sur la violence au cours des XVIIe et XVIIIe siècles. Bien que formellement
indépendants, les chapitres de cette thèse portent tous sur les défis posés par la
variabilité climatique, les chocs météorologiques et migratoires. Ces chapitres
se différencient de la littérature en abordant ces questions d’un point de vue
historique. Ils soulèvent la question de la résilience aux chocs dans les économies
préindustrielles en utilisant les cas de la France et de la Savoie pendant l’Ancien
Régime. La période allant du XIVe siècle au début du XIXe siècle est appelée
le « Petit Âge Glaciaire », et correspond à une période de froid et de forte
variabilité météorologique en Europe. À l’époque, entre 70 et 80 % de la
v
vi Résumé
population européenne dépendait de la production agricole pour vivre. Pour
décrire les conséquences socio-économiques des chocs migratoires et climatiques
en France et en Savoie aux XVIIe et XVIIIe siècles, ces chapitres s’appuient sur un
travail en archives et des analyses statistiques issues de nouvelles bases données
rassemblées par l’auteur.
Cette thèse contribue à divers domaines de la littérature en économie et en
histoire. Elle fait échos aux travaux issus d’un courant de l’historiographie
française, débuté dans les années 1950, et qui se concentrent sur les causes des
révoltes populaires et de la criminalité dans la France moderne, ainsi qu’aux
travaux plus récents issus de la littérature en économie qui étudient les détermi-
nants des conflits interpersonnels et intergroupes à travers le monde. Cette thèse
contribue également à la littérature empirique sur le rôle des institutions, et plus
particulièrement de la représentation des individus au sein de ces institutions,
dans l’atténuation des chocs de revenus induits par les aléas climatiques. En
outre, elle fournit de nouvelles preuves empiriques à la littérature examinant
les effets de l’émigration en tant que stratégie d’adaptation pour faire face
aux chocs. Enfin, elle concerne la littérature consacrée à la recherche des
déterminants historiques et des conséquences socio-économiques de la Réforme
pendant l’époque Moderne. Cette thèse se compose de quatre chapitres.
Le premier chapitre peut être décrit comme un mini-exercice d’ « histoire
totale ». Il a vocation à fournir aux lecteurs une introduction approfondie sur
les différents aspects socio-économiques et administratifs de la France à l’époque
moderne. Il permet ainsi de mieux comprendre et resituer les questions de
recherche traitées dans les chapitres suivants.
Le chapitre 2 analyse la relation entre les chocs climatiques, le prix des
céréales et les conflits sociaux en France entre 1661 et 1789. Il souligne également
l’importance du capital humain et social inhérent aux années d’expérience locale
des intendants pour appréhender leur capacité à lutter efficacement contre les
effets négatifs associés aux chocs météorologiques. Il documente également le
rôle des institutions religieuses dans la lutte contre la pauvreté. Pour cela, nous
appareillons des données sur les températures et les précipitations à de nouveaux
jeux de données sur les conflits sociaux, les prix des céréales, les caractéristiques
individuelles des intendants et les revenus des monastères. Nous utilisons
Résumé vii
ensuite un modèle de probabilité linéaire avec des effets fixes subdélégation-
année pour établir un lien de causalité entre les chocs climatiques et les conflits
sociaux. Nous montrons que les chocs de revenus induits par les intempéries
augmentent significativement la probabilité d’observer des émeutes liées à la
subsistance, et plus généralement de conflits sociaux. Une augmentation d’un
écart-type vers une température plus chaude augmente la probabilité de conflits
sociaux et d’émeutes de subsistance de respectivement 5,3 % et 19 %. S’exprimant
sur la qualité d’un bon intendant, Jacques Necker, ancien contrôleur général
des finances, a souligné l’importance du temps passé dans une province pour
acquérir une expérience et des connaissances locales, et tisser un ensemble de
relations sociales fortes. Pour déterminer si des intendants possédant un niveau
d’expérience local plus élevé étaient mieux à même d’atténuer l’effet négatif
des chocs climatiques, nous avons assemblé une nouvelle base de données sur
l’univers des intendants français nommés entre 1661 et 1789. Les résultats des
analyses statistiques révèlent que les années d’expérience locale des intendants
sont un facteur clé de leur capacité à faire face efficacement aux chocs climatiques.
Enfin, nous montrons que le système d’assurance sociale placé sous l’égide de
l’église, à travers les dîmes, ne fonctionnait pas ou mal et ne parvenait pas à at-
ténuer suffisamment les conséquences associées aux des chocs météorologiques.
Le chapitre 3 met en lumière l’effet de la conjoncture économique sur la
survenue de crimes contre la propriété et de crimes contre les personnes. Pour
cela, nous exploitons l’occurrence des chocs de revenus négatifs induits par les
variations de température au sein des provinces du Duché de Savoie entre 1749
et 1789. Nous étudions par ailleurs le rôle de la migration saisonnière en tant
que mécanismes d’adaptation à travers lesquels les communautés locales ont
renforcé leur résilience aux épisodes de chocs climatiques. Ces hypothèses sont
testées avec de nouvelles données sur l’occurrence des crimes, des prix des grains
et du vin, et des données de température issues de la paléoclimatologie. Nous
montrons que les chocs transitoires de revenu induits par les chocs climatiques
ont augmenté significativement la propension à commettre des crimes contre les
biens et réduit significativement la propension à commettre des crimes contre
les personnes. Une augmentation d’un écart type de la température résulte
dans une hausse du taux de crimes contre les biens de 6,4 % et une baisse du

viii Résumé
taux de crimes contre les personnes de 6,2 %. Nous montrons en outre que la
migration saisonnière réduit la nécessité de voler pour survivre. Elle constituait
en cela une stratégie efficace pour atténuer les effets négatifs induits par les
chocs météorologiques. Chaque point de pourcentage supplémentaire du taux
de migration saisonnière réduit l’incidence des crimes contre la propriété de
1,3 %. En effet, les rentrées de fonds générées par les saisonniers ainsi que la
réduction temporaire de la contrainte malthusienne amélioraient la résilience
des communautés locales faces aux épisodes de stress climatiques. Enfin, nous
analysons le rôle des institutions d’assistance dans le Duché de Savoie. En
s’appuyant notamment sur un travail d’archives, nous montrons que le système
d’assistance mis en place au début du XVIIIe siècle par Victor Amédée II
fonctionnait bien et permettait de soulager les nécessiteux en situation de crise.
Le chapitre 4 documente les déterminants de la diffusion du protestantisme en
France au XVIe siècle et les conséquences socio-économiques liées à la révocation
de l’Édit de Nantes en 1685. Pour cela, nous combinons, dans un premier temps,
de nouvelles données à l’échelle des communes sur l’emplacement des églises
collégiales et des imprimeries avec des données sur la présence de temples protes-
tants. Nous montrons que les villes ayant plus d’églises collégiales en 1520–
un substitut pour la fourniture de services religieux– sont moins susceptibles
d’abriter un temple protestant en 1567. Ce résultat renforce l’idée que les facteurs
culturels sont aussi au moins aussi importants que les déterminants économiques
pour expliquer la diffusion du protestantisme. Par ailleurs, la présence d’une
imprimerie en 1500 réduit la probabilité qu’une ville abrite un temple protes-
tant en 1567. Ces résultats suggèrent que la répression s’abattant pendant la
première moitié du XVIe siècle sur les possesseurs de livres « hérétiques »et
sur les imprimeries utilisées pour les produire a renforcé l’adhésion à la religion
catholique, qui à son tour a réduit le risque de conversion. Dans un second temps,
nous appareillons des données, au niveau des départements, sur la présence de
protestants dans les années 1670 avec des données sur le taux d’alphabétisation
des hommes à la fin du XVIIe siècle (1686–1690) et à la fin du XVIIIe siècle
(1786–1790). Les résultats obtenus confirment l’hypothèse wébérienne que le
protestantisme promeut l’éducation. En utilisant de nouvelles données sur le lieu
d’origine des réfugiés Huguenots après la Révocation, nous montrons que l’effet
Résumé ix
du protestantisme sur le taux d’alphabétisation en 1786–1790 est moindre dans
les départements où la part des réfugiés Huguenots est supérieure à la moyenne
nationale. Cette persistance peut être expliquée par le fait (i) que de nombreux
ex-protestants sont restés fidèles à leur religion au cours du XVIIIe siècle malgré
les conversions forcées, (ii) après 1685, de nombreuses écoles ont été ouvertes
afin d’éduquer les populations de nouveaux convertis, (iii) la population dans
les départements ayant des taux d’émigration élevés ont pu bénéficier d’une
amélioration du niveau de vie plus élevé. À cet égard, nous montrons que
ces départements n’ont connu aucune variation relative du prix des céréales–
un indicateur de la productivité agricole– après 1685 et significativement moins
d’émeutes de subsistance, ceteris paribus.

Abstract
The potential link between climate variability, conflict, and migration is increas-
ingly viewed as a security issue by policy makers. With global temperatures
expected to continue increasing in the foreseeable future, projections indicate that
the regularity and severity of natural disasters, including heatwaves, droughts
and heavy rainfall events, will also increase. In the last edition of The State of Food
Security and Nutrition in the World (2018), the Food and Agriculture Organization
of the United Nations highlights that climate variability and extremes were a
key force behind the recent rise in global hunger and one of the leading causes
of severe food crises. Climate variability and extremes raise critical challenges
to agriculture and food production all over the world, and lead to diminished
coping capacity, loss of livelihoods, as well as migration flows.
In particular, climate shocks and hunger have led to numerous outbreaks of
interpersonal violence and civil conflicts. The purpose of this dissertation is to
inform on the consequences of weather shocks and out-migration on violence in
early modern Europe. While formally independent, the essays in this dissertation
are all broadly concerned with the challenges raised by climate variability,
weather and migration shocks. All three depart from most of the standard
literature by addressing these questions from a historical perspective.1 They raise
the question of resilience to shocks in pre-industrial economies using the cases of
France and Savoy during the Ancien Régime. The period dating from the 14th
century to the turn of 19th century is referred to as the Little Ice Age, a period
of regionally cold conditions and high weather variability in Europe. At the
time, seventy to eighty per cent of the European population relied on agricultural
output for their livelihood. These essays chart the socio-economic consequences
1 The dissertation consists of four essays, but the first essay could be described as a mini exerciseof “total history”: it provides the readers with an in-depth introduction on the various socio-economic and administrative aspects of early modern France.
xi
xii Abstract
of migration and weather shocks in 17th- and 18th-century France and Savoy by
combining archival and historical evidence with statistical analyses of new data
that I assembled.
This dissertation contributes to various strands of the literature in economics
and in history. It relates to the stream of French historiography that focuses on
the causes of popular revolts and criminality in early modern France, as well
as to the more recent literature in economics that studies the determinants of
interpersonal and intergroup conflicts across the world. It also contributes to
the empirical literature studying the role of institutions, and more specifically
the agency of individuals within these institutions, in the mitigation of weather-
induced income shocks. Additionally, it provides new empirical evidence to
the literature examining the effects of out-migration as adaptation strategy to
cope with shocks. Finally, it relates to the literature investigating the historical
determinants and the socio-economic consequences of the Reformation in early
modern Europe.
Chapter 2 analyses the relationship between weather shocks, grain prices,
and social conflicts in France between 1661 and 1789. It further highlights the
importance of the human and social capital embedded in years of local experience
of the intendant in the mitigation of weather shocks. It also documents the role
religious institutions in the provision of poverty relief. In this chapter, I link
existing temperature and precipitation data to new data sets on social conflicts,
grain prices, individual characteristics of the intendants– the administrative
heads of provinces–, and monasteries’ income. I use a linear probability model
with district and year fixed effects to establish a causal connection between
temperature shocks and social conflicts. I show that weather-induced income
shocks significantly increased the likelihood of subsistence-related conflicts, and
more broadly of social conflicts. A one standard deviation increase toward
warmer temperature increases the probability of social conflicts and food riots
by 5.3 per cent and 19 per cent, respectively. Discussing the quality of a good
intendant, Necker emphasised the importance of the time spent in a province to
acquire local experience and accumulated human and social capital. Following
Necker’s argument, I build a new database on the universe of French intendants
appointed between 1661 and 1789 and investigate whether intendants with
Abstract xiii
a higher level of local experience were better able to mitigate the negative
effect of temperature shocks. My findings reveal that intendants’ years of local
experience– a proxy for province-specific social and human capital– were a key
factor in his ability to cope with weather shocks. Finally, I suggest that the social
insurance system under the aegis of the church, namely the tithes, failed to fulfil
its role and provide sufficient relief to alleviate the effects of weather shocks.
Chapter 3 sheds light on the effect of economic conditions on the occurrence of
property and violent crimes by exploiting within-province variations in weather-
induced negative income shocks in Savoy from 1749 to 1789. I further analyse
the role of seasonal migration as a coping mechanism through which local
communities enhanced their resilience to shocks and stresses. These hypotheses
are tested with new micro data. I show that transitory negative income shocks
associated with weather shocks significantly increased the occurrence of property
crimes, and significantly decreased the occurrence of violent crimes. A one
standard deviation increase in temperature increased property crime rate by
6.4 per cent, and decreased violent crime rate by 6.2 per cent. I further show
that seasonal migration reduced the need for stealing to survive, and was an
efficient strategy to mitigate the negative effect of weather shocks. An additional
percentage point in the seasonal migration rate reduced the incidence of property
crime by 1.3 per cent. Historical evidence suggests that the cash inflow generated
by seasonal migrants, as well as the temporary relief of Malthusian constraints,
contributed to the mitigation of adverse weather shocks. Finally, I analyse the
role of relief institutions. I provide tentative evidence showing that they may
have also helped to mitigate efficiently the effect of weather shocks.
Chapter 4 documents the determinants of the spread of Protestantism in
France during the 16th century and the socio-economic consequences associated
with the revocation of the Edict of Nantes in 1685. First, I combine new geo-
coded data on the location of collegiate churches and printing presses with
information on the presence of Protestant temples at the city level. I show
that towns with more collegiate churches in 1520– a proxy for the provision of
religious services– were less likely to house a Protestant temple in 1567. This
result provides further support to the idea that cultural factors are as much
important as economic determinants in explaining the diffusion of Protestantism.
xiv Abstract
In addition, I find that having a printing press in 1500 reduced the likelihood
of a city still housing a Protestant temple in 1567. The results suggest that
the repression of the possession of “heretical” books and the printing presses
used to produce them during the first half of the 16th fortified the adherence
of locals to Catholic doctrine, which in turn reduced the likelihood of conversion.
Second, I match data on the presence of Protestants in the 1670s with data on
the male literacy rate at the department level in the late 17th century (1686–
90) and the late 18th century (1786–90). I find support for the hypothesis that
Protestantism led to better education. Using new data on the place of origin
of Huguenot refugees after the Revocation of the Edict of Nantes in 1685, I
show that the effect of Protestantism on the male literacy rate in the late 18th
century was smaller in departments where the share of Huguenot refugees was
above the national mean. This persistence can be explained by the fact (i) many
former Protestants remained faithful to their religion during the 18th century, (ii)
after 1685, many schools were opened to educate in Catholic manners children
from former Huguenot families, (iii) local population in departments with high
migration rates could have benefited from higher living standards. In this regard,
I show that these departments experienced no relative changes in grain prices–
a proxy for agricultural productivity– and significantly less subsistence-related
conflicts, ceteris paribus.
xv
À mes parents, à ma famille,
à mes amis

Acknowledgments
This dissertation was long in the making, and it is a pleasure to acknowledge the
many debts of gratitude incurred on its slow path to completion.
As an economics undergraduate student at the University of Lyon, I was
taught about the importance to study history to develop better understanding
of contemporary society. I am grateful to Laure Bazzoli for introducing me to
economic history and insisting that “everyone should read Braudel’s work at
least once in a lifetime”. I opted to read La Méditerranée et le Monde méditerranéen à
l’époque de Philippe II. From that decision, springs my interest in economic history
and the work done by Annales historians. The whole idea for this thesis, however,
arose a few years later when I was a graduate student at Sciences Po. I followed
David Stasavage’s course on the Political Economy of Inequality, Redistribution,
and Development, which included topics such as the development of state
institutions, wars and democracy. As far as I knew, weather conditions had a
strong influence on agricultural output which itself influenced social and political
stability in pre-industrial societies. No research had, at the time, attempted to use
historical data and econometrics tools to analyse this relationship in early modern
Europe. I began to collect various data related to these questions and rapidly
came across Jean Nicolas’s landmark book, La rébellion française. Mouvements
populaires et conscience sociale (1661–1789), which depicts the evolution of the social
grievances and conflicts throughout the 17th and the 18th centuries. Several
discussions with Jean Nicolas encouraged me to pursue this line of research and
undertook a PhD. I express here my debt to them all.
I was lucky to have two fantastic supervisors. I am grateful to Michael
Huberman, who in a distant 2013 read some lines of a very preliminary research
proposal and believed enough in what he read to accept becoming my supervisor.
I am also heavily indebted to Mathieu Couttenier who accepted to become my
xvii
xviii Acknowledgments
second supervisor from 2016 onward. Their patience, considered guidance and
challenging thoughts helped me to relentlessly go beyond my limits. I would also
like to express my special thanks to James Fenske who thoroughly supervised my
research during my stay at the University of Oxford. Finally, I would like to thank
the members of my thesis committee: Pilar Nogues-Marco, Guido Alfani, Roberto
Galbiati and Mathias Thoenig for their insightful comments and encouragement.
Part of the research for the thesis was generously supported the Swiss National
Science Foundation grant P1GEP1_161588.
While working on this thesis, I benefited from suggestions and criticisms
made when I presented papers at many workshops, seminars and conference.
The advice, ideas, and encouragement that a number of people offered proved
to be very useful. I would like to thank in particular Johannes Buggle, Qiang
Chen, Daniel Curtis, Noel Johnson, Jérémy Luchetti, Kostadis Papaioannou, and
Myung Soo Cha. Albert Hamscher, André Abbiateci, Gérald Béaur, Dominique
Bouverat, Daren Crook, Jessica Dijkman, Michel Gautier, Serge Guiboud-Ribaud,
Jeremy Hayhoe, Inga Labuhn, Claude Motte, Tommy Murphy and David Chilosi,
and Georges Pichard kindly shared data with me. I would like to thank them for
their generosity.
Much of the original research towards this thesis was conducted in the
Archives Nationales in Paris and in various Archives Départementales across France.
I have also been able to make considerable use of the collections of the Bibliothèque
de Genève (BGE), and various libraries in France. I would like to thank the staffs
at all these institutions for their kindness and availability.
It would be very remiss of me not to mention and show appreciation to the
commitment of the often invisible hands behind LATEX, QGIS, and The R Project
for Statistical Computing. I have made extensive use of the following R packages,
and I am deeply grateful to all those who contributed of the development of these
packages: stargazer (Hlavac, 2018), sf (Pebesma, 2018), tmap (Tennekes, 2018),
and tidyverse (Wickham, 2017). Writing this thesis would have been much harder
without their contributions and the support of the Stack Overflow community.
This thesis was carried out at the Paul Bairoch Institute of Economic History
of the University of Geneva from 2013 to 2019. It has proved an ideal place
to do a PhD. Faculty and fellow PhD students have been a great source of
Acknowledgments xix
support and academic rigour, through informal graduate seminars and more
casual discussions over coffee, or more likely, a pint. There are too many people to
name individually but I would like to mention Jérémy, Edoardo, Laura, Maleke,
Paul, and Sabine. Special consideration goes to Maleke for reading through early
versions of the manuscript, spotting errors, and making insightful suggestions.
For conversation, inspiration, and proof-reading the manuscript at various stages
I would also like to thank Ariane, Inhye, Jamieson, Jérémy, Greg, Nathalie and
Rasha. Their numerous and thorough comments forced me to rethink and rewrite
many sections of the thesis. Additional thanks to all OUAC members, Corinne,
Kathryn, and Peter who contributed to my wonderful time in Oxford.
I am also grateful to all of those with whom I have had the pleasure to work
during this thesis and on other research projects. I would like to give a special
mention to my wonderful co-authors: Maleke Fourati, Paul Maneuvrier-Hervieu,
and Scott Viallet-Thévenin. You offered me the opportunity to delve into
new archives and learn about Tunisian colonial history, pre-industrial Normans
economic development, and social mobility within the French colonial empire.
Thanks to you, I never felt torpid or languorous during all these years!
I want to express my deep gratitude to all my friends that accompanied me
along the way, and with whom I have shared moments of anxiety but also of
big excitement: my adventure fellows (Béryl, Lolie, Scott), my daily creative
writers (Goldfish, Lilliputian), my old companions (Ève, Quentin, Raphaël),
my Parisian walking buddies (Anna, Mathilde), my personal LATEX debuggers
(Jérémy, Maleke), my postcards writers (Jinhyeon, Youngsil), and my Swiss
history teacher (Sabine).
Nobody has been more important to me in the pursuit of this project than
the members of my family. I would like to thank my parents, whose love and
guidance are with me in whatever I pursue. Partout toujours. En vert et contre tout.

Table of contents
Résumé v
Abstract xi
Acknowledgments xvii
Table of contents xxiii
List of tables xxvi
List of figures xxviii
List of abbreviations xxix
Introduction 1
I France before the Revolution: An Overview 7
Introduction 71 Administrative boundaries 92 Role of the provincial administration 11
2.1 The Intendants 112.2 The Subdélégués 14
3 Fiscal organisation 153.1 State finance 153.2 Fiscal capacity 163.3 Direct taxation 173.4 Indirect taxation 19
4 Social structure 204.1 Three Orders 204.2 Society structure, occupations and inequalities 22
5 Demography 305.1 Population estimates 30
xxi

xxii Table of contents
5.2 Exogenous shocks and demographic crises 315.3 Urbanisation and population density 345.4 Standards of living 37
6 Economic situation 406.1 Agricultural progress 406.2 Regional disparities 446.3 Proto-industrialisation 47
Appendix 57I.A The introduction of the potato in France 57
II Do the Right Thing! Leaders, Weather Shocks and Social Conflicts inPre-Industrial France 93
Introduction 931 Historical background 100
1.1 The French economy before 1789 1011.2 Administrative organisation and the role of intendants 1051.3 Assistance, poor relief and absorption of weather shocks 110
2 Data 1152.1 Conflict data 1152.2 Independent variables 119
3 Empirical strategy and results 1233.1 Temperature shocks and social conflicts 1233.2 The role of local leaders and social conflicts 1283.3 Religious institutions and social conflicts 133
4 Conclusion 136Appendix 167II.A The theoretical determinants of conflicts 167
II.A.1 Conflict: Plus quam civilia bella? 167II.A.2 Theoretical models 170
II.B Temperature shocks, grain prices and social conflicts 175
III Weather Shocks, Poverty and Crime in 18th-Century Savoy 183
Introduction 1831 Historical background 188
1.1 Administrative organisation 1881.2 Climate, weather variability and institutional relief 1911.3 Living standards 1931.4 Population and migration in Savoy 195
2 Data 198
Table of contents xxiii
2.1 Crime data 1992.2 Weather data 2012.3 Socio-economic data 202
3 Empirical strategy and results 2043.1 Property crime and violent crime 2043.2 The role of seasonal migration 207
4 Conclusion 209Appendix 229III.A Fiscal organisation and reforms 229III.B Other coping mechanisms 231
III.B.1 Poverty shocks and public assistance 231III.B.2 A mixed agro-pastoral system 234
IV Was Louis XIV Wrong? Socio-Economic Consequences of Protestantismin Early Modern France 243Introduction 2431 Historical background 251
1.1 The spread of Protestantism in France 2511.2 The revocation of the Edict of Nantes 254
2 Data 2582.1 Huguenots data 2582.2 Collegiate churches data 2612.3 Literacy data 2612.4 Crop prices and social conflicts data 2632.5 Control variables 264
3 Empirical strategy and results 2653.1 The spread of the Reformation 2653.2 The socio-economic effects of the Revocation 269
4 Conclusion 275
Conclusion 295
Glossary 299
Bibliography 305


List of Tables
I.1 The heterogeneity of the rural Third Estate 23I.2 Inferred socio-economic structure in north of Francea (distribution
of the population paying the capitation) 24I.3 Occupational structure in 18th-century France (percentage of house-
holds) 26I.4 Distribution of income based on capitation assessments (percent-
age of assessments by taxpayer groups)a 28I.5 Income distribution by social group in 1788a 28I.6 Urban population growth in 18th-century Francea 35
II.1 Harvest failure and poor relief in Languedoc in 1773 153II.2 Summary statistics 153II.3 Temperature shocks and social conflicts in France (1661–1789) 154II.4 Urban and rural social conflicts (1661-1789) 155II.5 Robustness checks: Large social conflicts (1661–1789) 156II.6 Robustness checks: Alternative measures of temperature 156II.7 Robustness checks: Inclusion of additional weather variables 157II.8 Robustness checks: Alternative measures of temperature 158II.9 Robustness checks: District-specific economic and geographic con-
trols 159II.10 Robustness checks: Logit estimates 159II.11 Robustness checks: Exclusion of Paris and years 1788-89 160II.12 Robustness check: Province level 160II.13 Robustness checks: Alternative cut-off Conley SE 161II.14 Intendant’s experience and social conflicts in France (1661-1789) 162II.15 Intendant’s experience and social conflicts in France (1703–13) 163II.16 Intendant’s prior experience and social conflicts in France (1661-
1789) 164II.17 Intendant’s prior experience and social conflicts in France (1703–13) 165II.18 Monastic charity and conflicts in France (1661-1789) 166II.19 Temperature shocks and wheat prices in France (1756–89) 180II.20 Wheat prices and social conflicts in France (1756–89) 181II.21 Temperature shocks and wheat prices in France (1767–68) 181II.22 Wheat prices and social conflicts in France (1767–68) 182
III.1 Subsistence lifestyle: Baskets of goods in Savoy (c.1780) 219III.2 Summary statistics 219III.3 Temperature shocks and crime rates in Savoy (1749–89) 220
xxv
xxvi List of tables
III.4 Robustness checks: Inclusion of additional weather variables 220III.5 Robustness checks: Alternative measures of temperature 221III.6 Robustness checks: Alternative measures of temperature 221III.7 Robustness checks: Droughts, floods and crime rate in Savoy
(1749–89) 222III.8 The effect of seasonal migration: Intensive margins 223III.9 The effect of seasonal migration: Extensive margins 224III.10Mitigation of physical violence against persons 225III.11Mitigation of thefts of edible products 226III.12Temperature shocks and wheat prices in Savoy (1717-89) 227III.13Temperature shocks and wine prices in Savoy (1741–89) 227III.14Temperature shocks and social conflicts in Savoy (1650–1789) 239III.15The effect of livestock breeding: Intensive margins 240III.16The effect of livestock breeding: Extensive margins 241
IV.1 The determinants of the spread of Protestantism at the city level 283IV.2 The determinants of the spread of Protestantism at the city level
(with distance to Mainz) 284IV.3 The determinants of the spread of Protestantism at the department
level 285IV.4 The effect of Protestantism on literacy: Population share 286IV.5 The effect of Protestantism on literacy: Population share (Decile) 287IV.6 The effect of Protestantism on literacy: Temples 288IV.7 The effect of Protestantism on literacy: Pastors 289IV.8 The effect of Protestantism on literacy: Registers of consistories 290IV.9 The effect of Counter-Reformation on literacy: Jesuit colleges 291IV.10The effect of Protestantism on literacy: Heterogneous effect 292IV.11The socio-economic effects of Huguenots’ exile (1670–1700) 293
List of Figures
I.1 Pays d’États and pays d’élection in 1789 51I.2 Salt tax (gabelle) in 1781 52I.3 French internal trade zones (traites), c. 1760 52I.4 Total population and urbanisation rate, 1650–1800 53I.5 Crude birth rate per généralité in 1783 53I.6 Crude death rate per généralité in 1783 54I.7 French cities larger than 10,000 inhabitants in 1700 54I.8 Urbanisation rate (%) per subdélégation in 1793 55I.9 Population density per subdélégation in 1793 55I.10 The introduction of the potato in France 92
II.1 Distribution of seasonal temperature long-term means (1500–1600) 138II.2 Distribution of seasonal precipitation long-term means (1500–1600) 139II.3 Distribution of seasonal temperature (1661–1789) 139II.4 Distribution of seasonal precipitation (1661–1789) 140II.5 Correlation between paleoclimatological and instrumental temper-
ature series (1745–92) 140II.6 Correlation between paleoclimatological and instrumental precip-
itation series (1714–92) 141II.7 Correlation between summer temperature reconstructions and
grape harvest dates (1600–1800) 142II.8 Number of years of intendants’ local experience in 1680 142II.9 Number of years of intendants’ local experience in 1710 143II.10 Number of years of intendants’ local experience in 1740 143II.11 Number of years of intendants’ local experience in 1770 144II.12 Wheat prices in the province of Flanders (1765) 144II.13 Variations of wheat prices (%) in the province of Flanders (1765) 145II.14 Wheat prices in the province of Brittany (1771) 145II.15 Variations of wheat prices (%) in the province of Brittany (1771) 146II.16 Wheat prices across French provinces in 1760 146II.17 Wheat prices across French provinces in 1770 147II.18 Wheat prices across French provinces in 1780 147II.19 Wheat prices across French districts in 1768 148II.20 Variations of wheat prices (%) within French provinces in 1768 148II.21 Correlation between prices samples at the level of provinces (1767–8)149II.22 Correlation between abbeys’ income per capita at the district level
in 1750 and 1780 150
xxvii

xxviii List of figures
II.23 Estimated coefficients of intendant-province fixed effects on socialconflicts 150
II.24 Estimated coefficients of intendant-province fixed effects on subsistence-related conflicts 151
II.25 Determinants of intendants’ survival 152II.26 Summer temperature shocks and wheat prices (1756–89) 179II.27 Summer temperature shocks and wheat prices (1767–8) 179
III.1 The Kingdom of Piedmont-Sardinia (c. 1780) 211III.2 The Duchy of Savoy (c. 1750) 212III.3 Annual number of disasters reported in the Duchy of Savoy (1713–
92) 212III.4 Official query regarding the situation of the poor in Savoy in
January 1759 213III.5 Total number of property crimes in Savoy (1749–89) 214III.6 Total number of property crimes in Savoy (1749–89) 214III.7 Distribution of seasonal temperature (1749–89) 215III.8 Distribution of seasonal precipitation (1749–89) 215III.9 Grape harvest date and summer temperature in Chablais (1688–1794)216III.10Grape harvest date and summer temperature in Maurienne (1713–90)216III.11Correlation matrix of grape harvest date around the Alpine Arc
(1688–1794) 217III.12Wheat prices in the provinces of Genevois and Savoie (1717–89) 217
IV.1 Total number of Protestant temples by department (c. 1560) 277IV.2 Correlation matrix of variables on the spread of Protestantism 278IV.3 Total number of collegiate churches temples (1520) 278IV.4 Share of Huguenots in total department population (c. 1670) 279IV.5 Share of Huguenot refugees in total department population (1686–
1700) 279IV.6 Correlation between the share of department urban population in
1700 and 1793 280IV.7 Share of grooms signing their marriage certificate (1686–90) 280IV.8 Share of grooms signing their marriage certificate (1786–90) 281IV.9 Correlation between the share of grooms signing their marriage
certificate (late 18th century) in the Maggiolo’s sample and theauthor’s sample 281
List of abbreviations
In reproducing quotations from seventeenth- en eighteenth-century document,
I have kept the orthographic peculiarities which appear in the original texts.
Translation are my own, unless otherwise stated. For convenience and brevity,
I have used the following abbreviations throughout the thesis:
A.N. Archives Nationales.
BnF Bibliothèque nationale de France.
Ms. fr. Manuscrit(s) français at BnF.
A.D. Archives Départementales de ...
A.M. Archives Municipales de ...
Bib. Bibliothèque Publique (or Municipale) de ...
xxix

xxx
Introduction
The potential link between climate variability, conflict, and migration is increas-
ingly viewed as a security issue by policy makers. With global temperatures
expected to continue increasing in the foreseeable future, projections indicate that
the regularity and severity of natural disasters, including heatwaves, droughts
and heavy rainfall events, will also increase. Researchers have now documented
how these events can act as a “risk multiplier” and exacerbate the economic
vulnerabilities of human societies. Weather shocks, and more broadly adverse
economic shocks, directly and indirectly increase the risks of violence and
conflicts (Carleton, Hsiang and Burke, 2016; Carleton and Hsiang, 2016; Hsiang
and Kopp, 2018) as well as in- and out-migration flows (Beine and Parsons,
2015; Piguet, 2010; Reuveny, 2007).2 Studying human responses to environmental
stresses can help to identify effective adaptation strategies and better understand
the mediating role played by formal and informal institutions.
While formally independent, the essays in this dissertation are all broadly con-
cerned with the challenges raised by climate variability, weather and migration
shocks. However, all three depart from most of the aforementioned literature by
addressing these questions from a historical perspective. They raise the question
of resilience to shocks in pre-industrial economies. The period dating from the
14th century to the turn of 19th century is referred to as the Little Ice Age, a period
of regionally cold conditions and high weather variability in Europe. At the
time, seventy to eighty per cent of the European population relied on agricultural
output for their livelihood. These essays chart the socio-economic consequences
of migration and weather shocks in 17th- and 18th-century France and Savoy by
2 For an overview of the literature linking together the climate variability, conflict and migration,see Burrows and Kinney (2016).
1

2 Introduction
combining archival and historical evidence with statistical analyses of new data
that I assembled.
The starting point of these three studies can be traced to two streams of
French historiography that emerged more than half a century ago. In the 1950s
and the 1960s, French historians from the Annales school were eager to look for
all kinds of trends that could determine the economic and social development
of past societies. In a series of pioneering articles, Emmanuel Le Roy Ladurie
used documentary evidence on weather to investigate how historical climatic
variability influenced past societies through its effect on agricultural output
(Le Roy Ladurie, 1959, 1960). About a decade later, his pioneering monograph
on the climate of the last millennium and its impact on society and history lay
the groundwork for European historical climatology (Le Roy Ladurie, 1967).3
Following a similar line of investigation, many researchers have combined data
from documentary evidence, grape harvest dates and other paleoclimatological
proxies on the one hand and socio-economic data on the other hand in order to
examine how changes in climate and weather could shape past societies (Alfani,
2010; Brázdil et al., 2018; Camenisch and Rohr, 2018; Campbell, 2016; Huhtamaa,
2018; Pfister and Brázdil, 2006).
The translation of Boris Porchnev’s book on popular uprisings in France
between 1623 and 1648 (Porchnev, 1963) ignited a decades-long debate on the
causes of social conflicts.4 Porchnev argued that the struggle against feudal order
universally constituted the origins of spontaneous peasants uprisings as early
as the first half of the seventeenth century. An alternative interpretation posits
that the causes of protest were not restricted to the struggle against the feudal
order, but had multiple origins (Bercé, 1974; Le Roy Ladurie, 1974; Lebrun, 1967;
Mousnier, 1967; Pillorget, 1975).5 Simultaneously, another wave of scholarship
3 In 1966, in “without any doubt one of the most important, if not the most important, monographof the French Annales school [...]” (Goldsmith, 1976), Le Roy Ladurie (1966) already relied onnewly assembled time series data on grain prices, diseases, demographic trends, taxation andweather to depict the evolution of the agrarian society in southern France from the late 15thcentury to the 18th century.
4 French historians first noticed Porchnev’s work after the appearance of a German translation in1954.
5 For a literature survey, see Aubert (2015), Lemarchand (2000), and Salmon (1967). Cohn (2009,pp. 25–52) shows that identifying the underlying causes of peasant revolts in Medieval Europeand distinguishing between social, economic, political revolts is not as straightforward asPorchnev suggested.
3
focusing on historical criminology emerged in the late 1960s and extended the
traditional interpretations of crime beyond the legal sphere by taking into account
its social, political, and economic context.6
Capitalising on the experience he acquired while studying social disturbances
in Savoy (Nicolas, 1973, 1974), Nicolas endeavoured to transcend the regionally-
limited framework of previous studies and examine the phenomenon of social
protest in France from 1661 to the spring of 1789. For over two decades, Nicolas
has been at the helm of a team of researchers that scoured local and national
archives to identify episodes of social protest. Overall, Nicolas assembled a
database of 8,528 entries and on that basis was able to relate the temporal and
spatial variations of social conflicts to the occurrence of wars, popular fear,
taxation and food shortages caused by more or less severe weather disruption
(Nicolas, 2002).7
The approaching 500-year anniversary of the Protestant Reformation in 2017
sparked a renewed interest in its causes and consequences among social scientists
(Becker, Pfaff and Rubin, 2016). In his attempt to write a “total history” of the
early modern Languedoc region, Le Roy Ladurie (1966, pp. 349–51) noted that the
trade migration pattern and the appetite for reading of the inhabitants of region’s
Cévennes mountains may have contributed to the rapid spread of the Reformation
in this area. After the revocation of the Edict of Nantes in 1685, the area suffered
from the exodus of Huguenot refugees and the rebellion of Camisard between
1702 and 1710. Fifty years after the publication of The Peasants of Languedoc,
the understanding of the socio-economic consequences of Protestantism and the
Revocation has made little progress. Scoville (1953, 1960) remained the most
complete work on this question.
The essays in this dissertation aim at contributing to the French historiog-
raphy and to the stream of scholarship focusing on the climate-conflict nexus
and the socio-economic effects of religious competition. In the following four
chapters, I successively (i) describe the socio-political characteristics of France
during the Ancien Régime; (ii) examine the role of French provincial leaders–
6 See Garnot (1989) and Rousseaux (2006) for a literature survey.7 For an insightful discussion of Nicolas’ work and the related literature, see Kaplan (2015, pp. 95–
116). For two other important studies on the food riots and fiscal uprisings, see Bourguignat(2002) and Aubert (2014), respectively.
4 Introduction
the intendants– in the mitigation of the effects of weather shocks on social
conflicts; (iii) document how seasonal migration helped Savoyard communities
build resilience against weather shocks and mitigate the effect of transitory
income shocks on crimes rates; (iv) and identify the determinants of the spread of
Protestantism in 16th century France and explore its impact on literacy, prices and
conflicts before and after the Revocation. In the remainder of this introduction, I
briefly summarise the main findings of the essays presented in this dissertation.
Chapter 1 introduces the readers to the socio-economic and administra-
tive landscape of early modern France.8 Prior to 1789, the country could be
subdivided along various boundaries based on administrative, military, and
economic criteria. The chapter attempts to provide a clear picture of these
divisions and their repercussions on the organisation of local administrations
and the tax system. I also depict the social structures of French society and
expose how exogenous shocks affected living standards. Finally, I summarise
the historiography on the transformation of French agriculture during the 17th
and the 18th centuries, before offering an overview of its regional disparities.
In Chapter 2, I use spatial and temporal variation in temperature shocks to
examine the effect of adverse weather conditions on the onset of social conflicts
in 17th- and 18th-century France. The contribution is threefold. First, I document
the effect of temperature shocks on standards of living using cross-section and
panel prices data. Second, I combine high-resolution temperature data and
information on the occurrence of social conflicts between 1661 and 1789 with
new data I compile on French provincial leaders (i.e. intendants). I use a
linear probability model with district and year fixed effects to establish a causal
connection between temperature shocks and conflicts. My findings reveal that a
one standard deviation increase in seasonal temperature increased the likelihood
of social conflicts and subsistence-related conflicts by 5.3 per cent and 19 per
cent, respectively. Third, I show that the longer an intendant spent overseeing
a province the better he was able to cope with adverse weather conditions. I
argue that the number of years spent in a given province were a key determinant
in the intendant’s ability to administer efficiently his province and reduced
8 Therefore, there is no specific research question in this chapter. It could be described as a miniexercise of “total history”– despite the elusiveness of this concept–, embracing all the social andeconomic aspects of the French society under the Ancien Régime (Furet, 1983, p. 394).

5
the occurrence of weather-related conflicts. This interpretation is supported by
historical evidence.
Chapter 3 sheds light on the effect of economic conditions on property and
violent crimes by exploiting within-province variations in weather-induced neg-
ative income shocks in Savoy from 1749 to 1789. Furthermore, I use the unique
geographical characteristics of the Duchy of Savoy to explore the dynamics of
adaptation of communities to economic constraints, and the resulting effects
on their resilience. I document how seasonal migration may help to increase
the coping capacity of local communities in which they were widely used. By
moving temporarily to distant areas migrants labourers could provide their
communities with remittances that supplemented their resources, while their
absence meant there were less mouths to feed. I show that temperature shocks
were strongly associated with increases in property crimes rates, but that the
effect is much more limited in provinces with high levels of seasonal migration.
I provide historical evidence to show that the inflow of remittances may drive
this relationship. By analysing the role of relief institutions, I provide tentative
evidence showing that they may have also helped to mitigate efficiently the effect
of weather shocks.
In Chapter 4, I examine the determinants of the spread of Protestantism
in France during the 16th century as well as the socio-economic consequences
associated with the revocation of the Edict of Nantes in 1685. First, I contribute
the recent research on the origins of the Reformation to tackle the issue of
geographical spread of the Reformation in 16th-century France. I combine new
data on the location of collegiate churches and printing presses with information
on the presence of Protestant temples at the city level. I show that towns with
more collegiate churches in 1520 were less likely to house a Protestant temple
in 1567. In addition, I find that having a printing press in 1500 reduced the
likelihood of a city still housing a Protestant temple in 1567. The results suggest
that the repression of the possession of “heretical” books and the printing presses
used to produce them during the first half of the 16th fortified the adherence of
locals to Catholic doctrine, which in turn reduced the likelihood of conversion.
Second, I investigate the relationship between Protestantism and male literacy in
the late 17th century (1686–90) and the late 18th century (1786–90). Increasing
6 Introduction
the share of Huguenots in a department by one percentage point increased the
male literacy rate by 1.8 per cent in 1686–90. The effect persisted over the
18th century. Using new data on the place of origin of Huguenot refugees
after 1685, I show that the effect of Protestantism on literacy was weaker in
departments where the share of Huguenot refugees was above the national mean.
Turning to the analysis of the economic consequences of the Revocation, I find
the departure of Huguenots had no effect on the agricultural productivity, as
measured by annual changes in wheat prices. Departments with a higher share
of refugees, nonetheless, experienced less subsistence-related conflicts after 1685.
This suggests that the remaining population was better off in those departments.
Chapter I
France before the Revolution: AnOverview
The purpose of this chapter is to introduce the readers to the landscape of
early modern France. Indeed, despite being an unified Kingdom, it is difficult
to speak of France as a whole given its many divisions. Administrative,
military, and geographical boundaries did not always correspond as well as social
structure, demographic and economic trends varied widely across and within
regions. Pierre Goubert famously summarised the situation of French agriculture
by writing that “there is no French peasantry, but twenty different peasantry
developing their own activities within their country” (Duma, 2013).
Prior to 1789, the Kingdom of France was an absolute monarchy with a
complex hierarchical structure inherited from the late medieval period. In March
1661, after the death of his chief minister, Mazarin, Louis XIV decided to abolish
the position of prime minister and ruled the kingdom personally. In this regard,
the behavior of Louis XIV embodied the concept of absolutism as defined by
Franklin (1973): “Absolutism (...) is the idea that the ruler, however much he
may be responsible to God for observation of the higher law, does not require
the consent of any other human agent in making public policy”. Beik (2005),
however, argues that even though the King’s reach was in theory limited only by
religion and the fundamental laws of the Kingdom, governance relied in practice
on social collaboration with socially powerful elites sharing common interests.
An analysis of the financial relations between the Crown and the local elites of
the Estate of Burgundy also reveals the existence of a dialectical relationship.
In general, Estates bargained for privileges, autonomy and political power in
7

8 Chapter I. The French Economy before the Revolution
exchange for safeguarding the Crown against default by raising loans (Potter and
Rosenthal, 1997).1 Swann (2001, p. 145) summarised the situation as follow:
“Although absolute in theory, the power of French kings was
much more limited in practice. France had no common legal code
or administrative system, many of its people spoke languages other
than French, and individuals, towns, corporations, and provinces all
possessed a bewildering array of privileges.”
Meanwhile, the state developed an increasingly rationalised bureaucracy
together with an efficient system of information-gathering for purposes of state
decision-making and policy implementation (Barbiche, 2012).2 Sarmant (2012)
calls Louis XIV the bureaucratic King (roi-bureaucrate), and Barbiche (2012, p. 17)
uses the notion of “administrative monarchy” to denote these shifts. Numerous
attempts had been made to increase the efficiency of the central and provincial
administrations by implementing new reforms.3 Some of these reforms, however,
resulted in additional layers of officeholders, and only increased the complexity
of the organisational structure (Campbell, 2012). Inheritance and construction of
new judicial and financial boundaries contributed to this intricate administrative
structure.
Section 1 provides a description of the overlaying boundaries existing in the
Kingdom prior to 1789. Section 2 describes the role of intendants and subdélégués
who were the main administrative officials in provincial France. In Section 3, the
1 See also Legay (2001) who analyses the relationship between the Crown and the estates ofArtois, Walloon Flanders, and Cambrésis. For a challenging view on the alliance between theKing and the local social elites, see Hurt (2004).
2 For instance, Ouellet (2014, p. 94) reports that in the early 18th century, the intendants of Brittanyand Tours sent on average from five to twelve letters a month to the controller-general offinances in Paris. Rule and Trotter (2014) describe the ongoing in the bureaucratization processof the Department of Foreign Affairs during the last two decades of Louis XIV’s reign. Aninformationalisation of work both in French embassies abroad and in the provinces under theresponsibility of the foreign secretary, Charles Colbert de Torcy, was taking place.
3 Intendancies underwent rationalization process during the second half of the 18th century tocope with ‘overwhelming mass of work’ they were facing (Grevet, 2003, p. 17). New waysof processing administrative correspondence were implemented such as the systematic use ofsingle topic letters and the abandonment of numerous superlative, but useless, formula. Despitethese improvements, the local administration was more and more criticised by contemporariesfor its inefficiency, and also hated by the populace. After 1789, 60 per cent of the intendantsprosecuted have been sentenced to death (Cohen, 2009).

9
rise of the central state, together with the fiscal system, is depicted. Section 4
takes up a closer look at the social structure of French society. Inequality between
Orders as well as within-groups are described in two subsections. Section 5
addresses the question of demographic crises and standards of living as well as
their impact on urbanisation and longer demographic trends. Finally, Section 6
provides an account of the debate about the progress of French agriculture, before
emphasising agricultural regional disparities.
1 Administrative boundaries
In 1789, there was up to four different sets of boundaries delimiting inner regions
of the Kingdom.4 The judicial system was organised along three different levels.
At the bottom of the hierarchy, about 100,000 seigneurial courts were charged
with judging rural affairs involving penalties not exceeding 60 sous. The baillages
(bailiwicks), which numbered approximately to 400 in 1789,5 constituted the
second layer in the judicial hierarchy. Royal judges were judging cas royaux (royal
cases), including treason, heresy, criminal affairs, unlawful assemblies, sedition
and popular disturbances, noble-related affairs, as well as appeals of judgements
rendered in the seigneurial courts were tried in the baillage courts (Ruff, 1984,
pp. 26–8). In parallel, prévotés were empowered to judge judicial affairs of
higher importance. Because they were considered as dangerous, cases of armed
theft, able-bodied beggars, riots and armed assemblies, burglaries accomplished
with public violence, and crime perpetrated by vagabonds and soldiers, were
judged without the possibility of appealing the sentence (Hamscher, 2012). The
thirteen provincial Parliaments acted as the highest courts of appeal within their
jurisdictions and could serve as first instance court for some individual of high
standing, such as peers of the Kingdom (Ruff, 1984, pp. 33–4).6
4 Religious boundaries also existed, but were outside the responsibility of the King. France wasdivided into sixteen ecclesiastical provinces themselves divided in several dioceses under therule of a bishop.
5 Didier (2014) gives an estimate of 434.6 Présidiaux courts also existed since the mid 16th century. Henri II created them in order to
reduce the cost of appealing against baillage decisions. Their role, however, remained limitedbecause of the fierce competition of the Parliaments.
10 Chapter I. The French Economy before the Revolution
France was further divided into 34 military provinces in 1789, even though
smaller feudal divisions remained in existence until the Revolution. At the head
of each province was a military governor whose main tasks were to ensure the
military defense of the Kingdom and maintain public order (Barbiche, 2012).
These military borders, however, did not always overlay with civil boundaries
of the généralités. For instance, the military province of Normandy encompassed
the généralités of Alençon, Caen, and Rouen, whereas the military provinces
of Bourbonnais, Nivernais, and Haute-Marche belonged to same généralité,
knowingly Moulins.
The généralités were fiscal divisions and constituted the framework of the
central administration. Each généralité was under the personal care of an
intendant, who was the direct representative of the King. Généralités were divided
in a various number of subdélégations themselves divided in élection composed
of several parishes (Barbiche, 2012).7 Barbiche suggests an average of seven
employees under the direct command of an intendant in the mid 18th century,
even though this number rose in the following decades. Overall, Grevet (2003)
estimates that the provincial administration employed about 2,000 individuals in
the 1780s.
It is also possible to divide the Kingdom of France according the way direct
taxes were administrated (Figure I.1). In Pays d’États, Parliaments annually
consented to make a free gift (don gratuit) to the Crown, and accordingly allocated
taxes between each élection. In the Pays d’élection, intendants allocated taxes to
each élection, in which elected individuals had then to collect and remit them
to the administration. The Pays d’imposition corresponded to the most recently
conquered territories, such as Alsace, Corsica and Roussillon. In these territories,
taxes were directly collected by intendants, whose role and power thus varied
from one place to another.
7 Subdélégations were not fixed territories, and the intendants sometimes proceeded to adjust-ment by merging or creating new subdélégations (Didier, 2014). Traditionally, subdélégationscorresponded to bailiwicks in the Pays d’États and to élection in Pays d’Élection, but therewas no formal rule and important regional variations subsisted. Grevet (2003, p. 9) lists 702subdélégations under the responsability of 32 intendants in 1789.

11
2 Role of the provincial administration
2.1 The Intendants
As head of généralités, intendants had power in the sphere of finance, justice, and
police within their territory, and were partly responsible for the maintenance
of social order.8 They also had the prerogative to grant tax exemptions and
provide poor-relief in times of crisis. The role of these high-rank administrative
officials was thus essential in the management of the economic situation of the
Kingdom. Intendants very often recruited among the Master of Requests (Maître
des Requêtes), who were high-level judicial officers of administrative law.9 During
the reign of Louis XIV, 120 out of the 150 appointed intendants originated from
this administrative body (Biard, 2007; Smedley-Weill, 1995). Individuals usually
had the opportunity to hold the position of intendant two times, with an average
duration of 40 months for each nomination (Biard, 2007).
One of their main tasks was to monitor the stock of grains available through-
out the year and to evaluate the prospects of the current harvest. The decision
to undertake action to ensure the stability of grain supply was then taken on this
information. Allowing the export of grains was another possibility, although it
was hated by the populace, and responsible for many food disturbances even
in good years (Nicolas, 2002).10 Intendants were also in charge of public works,
mainly road maintenance. They could also decide to build water-management
infrastructure to prevent floods, and new roads to ease communication.11 In
Dauphiné, major improvements in the road network had been made during
the second half of the 18th century with the construction of approximately 750
kilometres of roads. Intendants wished to facilitate the movement of troops
toward the border, and to ease long-distance trade with neighbouring areas
(Favier, 1992).12 In Burgundy, from 1760 onward, local authorities and the
8 The role of intendants evolved from a role of inspection to administration with the Edict of May1635. On the creation of the function of intendant in France, see Biard (2007, pp. 72–82).
9 These prestigious offices were not hereditary and were sold at a high price, although one couldbe also appointed as Master of Requests by the King.
10 See Bourde (1967, pp. 1376–95) for a detailed review of the role of intendants in promoting newagriculture techniques, and managing agricultural resources.
11 For a review of the development of the road infrastructure during the second half of the 18thcentury, see Arbellot (1973).
12 As a result, the tolls income in Vienne increased by 615 per cent between 1727 and 1789.
12 Chapter I. The French Economy before the Revolution
intendant collaborated to develop the road network in Bresse. By diminishing
the travelling time and extending the annual circulation period, the new roads
facilitated trade with the Duchy of Savoy and Italian cities (Champier, 1948; Saint-
Jacob, 1960).13 Intendants, nonetheless, often had to compete with other local
authorities in their généralité, whether the military governor or the Parliament,
which remained important and powerful governmental institutions (Beik, 2005;
Bordes, 1960; Swann, 2001).14
In the spheres of justice and public authority, intendants enforced the regula-
tions passed along to them by the Crown. Even though the royal arrêts, issued
in the name of the King and representing its willingness, could not be set aside
by provincial custom or law, intendants often had to interpret news regulations
in the light of practical experience and regional circumstances (Hamscher, 2012;
Root, 1992). In terms of their judicial tasks, intendants intervened by approving
or modifying the orders of payment related to criminal judgements. Indeed,
the Crown often advanced the costs for prosecution (frais de justice) in order
to expedite the judgement of criminal cases, and avoid disputes about money
among king’s judges.15 Regarding public order, intendants supervised the raising
of the militia regiments, and worked in close collaboration with the military
governor of the province and the police force, known as the maréchaussée.16
Military forces were rarely used (Ruff, 2001), but from the end of the 17th century
the King’s Musketeers, an elite military troops, were more and more involved in
13 During the second half of the 18th century, the expansion of public works was a generaltendency across the kingdom. In Brittany, a sixfold increase in public works expendituresoccurred between the 1740s and the 1780s. By 1786, £600,000, i.e. about two per cent of theprovincial budget, were budgeted annually to develop the infrastructure (Nières, 2004, p. 563).
14 Swann (2003) provides a detailed account of the role of the Estates General of Burgundy from1661 to 1789. In particular, she demonstrates how the Estates engaged in a process of bargainingwith the royal state, gained its trust and posed itself as a reliable partner to execute new tasks,formerly in the hands of the intendants, such as the management of the lodging of the militarytroops. See also Legay (2001). For a detailed description of intendants’ activities under the ruleof Louis XIV, see Smedley-Weill (1995).
15 Reimbursement from the parties was sought afterward, when these were liable. At firstquite inefficient, this system of recovery improved after the implementation in the 1730s ofthe systematic use of recovery rolls (rôles de recouvrements) listing individuals from whom thefinancial administration expected reimbursement.
16 The role of the maréchaussée considerably increased after the criminal ordinance of 1670. TheEdict of 1720 and a number of subsequent laws completely reorganised the structure of themaréchaussée in the 18th century. They gave it a local basis and increased its capacities ofintervention. After 1720, there was a company of marchaussée in each généralité. Their totalforces amounted to approximately 3,000 men.
13
the maintenance and the restoration of public order (Masson, 2013).
Finally, intendants allocated taxes on the behalf of the King. In Pays d’Élection,
they divided the total amount of taxes between each élection, and then between
each parish within each élection. The taille was levied on individuals’ wealth
so that individuals had incentives to seem poor in order to evade tax. Within
the parish, one commoner was elected during parish assemblies to be collector,
and to distribute the tax burden among the inhabitants.17 Then, the collector
had to remit the taxes to the receveurs particuliers of the élection who passed
it on to the general receiver of the généralité. Goldhammer and Elster (2011)
show that this system sometimes resulted in arbitrary allocations because the
collector could favour his kin and his friends, creating conflict within the peasant
community and leading to tax litigation.18 In Pays d’États, Parliaments annually
consented to make a don gratuit (free gift) to the Crown, and accordingly decided
by themselves the allocation of the taille between each élection. The taille was then
levied on real estate, which means that the individual share was constant over
years, creating less conflictual situations (Goldhammer and Elster, 2011). Thus,
in Pays d’États, the intendants had less freedom to act upon their own will, and
their role was reduced to the management of new taxes, such as the head tax
implemented in 1695 (Swann, 2001).
In addition, intendants had the power to grant tax breaks and exemptions,
for instance to favour the clearing of land for farming (Bordes, 1962). Relieving
population from the fiscal burden after the occurrence of natural disasters was
another motive to grant tax breaks and exemptions (Antoine, 2009). There
was, nonetheless, no formal rule, and exemption decisions as well as disasters
indemnification were discretionary (Favier, 2007).19 For example, in the généralité
of Dauphiné, an edict of 1639 provided an annual maximum of £50,000 in form of
tax breaks to compensate individual for losses related to natural disasters (Favier,
2011). In times of economic crisis, the role of intendants was thus fundamental as
17 See Dontenwill (2007, pp. 124–7) for a description of the conduct of such assemblies in the centerof France.
18 For more details on the role of intendants in the judgement of the fiscal litigation, see Pigeon(2011) whose analysis focuses on the intendants of the généralité of Rouen during the 18thcentury.
19 Interestingly, Favier reports intendants’ complains about the fact that these tax breaks wereoften considered as perennial by the inhabitants who did not hesitate to ask for an additionaltax break only few years after receiving the first one.

14 Chapter I. The French Economy before the Revolution
they could increase resilience by implementing efficient accommodation strate-
gies.20 For instance, in the généralité of Grenoble, the total amount devoted to tax
exemptions and public assistance quadrupled in the late 1760s, reaching £400,000
a year. In the subsequent years during which weather was more favourable
and harvest more abundant, the amount of exemption and public assistance
fluctuated between £50,000 and 100,000 per year (Krautberger, 2013).21
2.2 The Subdélégués
As heads of subdélégations, subdélégués helped the intendant to carry his daily
tasks in the sphere of finance, justice and police, but did not have any power
per se.22
Created as temporarily position in the 1620s, subdélégations became perennial
positions in the 1660s (Didier, 2014).23 Individuals could be revoked at will by
the intendant, but usually held these positions as long as possible. For instance,
Antoine de Goyon de Lassale was subdélégué of Condom, in the southwest of
France, from 1708 to 1758. Charles de Goyon de Lassale succeeded to his
father and remained subdélégué from 1758 to 1786. Similarly, the Labrousse du
Bosfrand, father and son, held the subdélégation of Nontron for 53 consecutive
years (Antoine, 1974).
Contrary to intendants, these individuals were mainly members of the local
bourgeoisie or nobility that had a good knowledge of the area (Le Yaouanc, 1978).
Subdélégués had to pass on information to the intendant on the judicial activities
and the socio-economic conditions in their territory. Ensuring the execution of
new laws and supervising the tax collection process were also among their tasks.
20 After the break out of events, such as famines, plagues, fires, and floods, the central governmentalso played a role in the mitigation of crisis. Although, Hufton (1974) suggests that in the 1770s,the yearly average amount spent per inhabitant never exceeded £1.
21 Focusing on England, Greif and Iyigun (2013a) have argued that this relief function wasparticularly important in the early modern period as social safety nets favoured risk-takingbehaviours leading to innovation and economic growth.
22 In his dictionary, Denisart defined subdélégué as “a man of confidence appointed by the head ofthe généralité, the intendant, to execute his orders and those of the royal court”. Denisart, Jean-Baptiste (1764). Collection de décisions nouvelles et de notions relatives à la jurisprudence actuelle.Tome III, Paris, p. 114.
23 The Edict of April 1704 transformed them into a hereditary office and institutionalised theprofession, even though the status of office was abrogated in 1715 (Barbiche, 2012).
15
Subdélégués could also grant relief and tax exemptions to the populace within
the limits fixed by the intendant, and require help from the central government
(Le Yaouanc, 1978).24
3 Fiscal organisation
3.1 State finance
Raising and spending money, principally for waging war, was a fundamental
feature of the French Crown. Between 1661 and 1789, the revenue of the central
government tripled in real terms: its average per capita revenue increased from
2.16 grams of gold in 1660 to 5.47 grams of gold in 1788 (Dincecco, 2009). The
agricultural sector borne a disproportionate share of this fiscal burden, despite
the growth of commercial and industrial activities during the 18th century. The
government, however, continuously ran chronic deficits. The venality of office
and loans were the two privileged tools to balance its budget (Bonney, 1999,
p. 152–3).25 According to Guéry (1978), the use of such expedients rather than
regular taxes, and the lack of proper budgetary techniques were the main reasons
behind the persistent financial instability. By 1788, the state spent half of its
budget in the repayment of its debt, about one fourth to cover military and
diplomatic expenditures, and devoted the rest to civil affairs (Guéry, 1978, p. 231).
Velde and Weir (1992) have provided an account of the state reliance on financial
markets in the second half of the 18th century. Poorly designed rentes viagères (life
annuities) constituted the bulk of the debt and burdened the financial capacity of
the government. Velde and Weir assert that due to its history of defaults and debt
repudiations, the market extracted a risk premium to hold the French debt. On
average, the French government paid an additional two per cent on the interest
rate of bonds compared to its English counterpart.
24 For instance, in 1770, the Crown granted £50,000 of relief to the généralité of Franche-Comtéin reaction to a letter sent by the subdédélégué of Saint-Amour informing the Crown that ‘thevast majority of the populace were eating grass harvested in their field’ to survive to the foodshortage (Merlin, 1994, p. 45).
25 In 1788, the Company of General Farms (Fermes générales), which had the monopsony over thecollection of tobacco tax, the traites, and the gabelles, held £68,840,000 of the Crown’s long-termdebt (Johnson, 2006).
16 Chapter I. The French Economy before the Revolution
3.2 Fiscal capacity
Bonney (1999, pp. 123–76) and Bonney (2012, pp. 93–110) provide extensive study
on the formation of the fiscal state in France. In this regard, the year 1360
constitutes a landmark in French fiscal history. For the first time the Crown levied
an annual tax over the entire kingdom to pay for the ransom of the King, John II,
captured by the English during the battle of Poitiers in 1356. However, the real
turning point in the structure and the organisation of the fiscal state happened
during the first half of the sixteenth century under Francis I (Hamon, 1994).
The imposition of the salt taxes and the establishment of venality of office as a
fiscal instrument can be traced to this period. These increases in revenues were
necessary to pay for the royal expenses related to repeated warfare. In Tilly’s
opinion, the creation of regional bureaucracies and financial infrastructure to
extract revenues from subjects were no more than byproducts of preparations
for war (Tilly, 1990).
More recently, Dincecco and Prado (2012) contend that constant warfare in
Europe spurred fiscal innovations allowing the states to increase their fiscal
revenue. More precisely, Gennaioli and Voth (2015) demonstrate how the
“Military Revolution”, which occurred in Europe after 1500, resulted in the
building of state capacity. The transformation of armed conflict by the use
of gunpowder, more expensive defences to build, the introduction of standing
professional armies, and the surge in military capacity drove new scale and cost
of warfare, leading governments to create effective fiscal infrastructures.26 In
France, the fiscal capacity of the state continuously increased during the 17th
and 18th centuries. Increasing demand for inside finance, i.e. the access of
loans short of notice from the tax collectors, had been associated with a shift
from competitive allocation of tax rights to cabal tax farming (Johnson and
Koyama, 2014). This movement was accompanied by many attempts to increase
fiscal standardization and regulations, for instance, by uniforming weights and
measures or by reducing the number of seigneurial institutions, such as the
26 The French military strength mushroomed from 50,000 men in 1550 to about 260,000 in the 1780.Such military forces demanded a high level of financial resources, and represented from 25 percent in peace time to 75 per cent in war time of the total state expenditures (Onorato, Scheveand Stasavage, 2014).
17
local tolls27 and tariffs.28 Some of these changes aimed at implementing new
enforcement mechanisms to improve consent among taxpayers, and to reduce
each and every opportunity for fraudulent gain among tax collectors.29 These
new high levels of taxation maintained in peace time, however, represented a
constant factor of social and political instability.
In this vein, Kiser and Linton (2001) claim that wars had a cumulative effect
on the state-making process in the early modern era, because once taxes went up
to pay for war expenditures, they rarely went down. Thus, the standardization
and the centralization process undertook to increase the state fiscal capacity was
not temporary but permanent. Dincecco and Katz (2016) trace the development
of state capacity in Europe to two major evolutions: fiscal centralization and the
decline local political power.30
3.3 Direct taxation
Historically, direct taxes were generally collected using affermage (leasing), a
process in which tax-collection was subcontracted out to an individual who
obtained the right to collect taxes and duties on behalf of the King under six-year
agreements. From 1598, in an effort to reduce the number of farmers, the Crown
began to reform this institution, and in 1726, all farms were finally merged into a
single lease, the Fermes générales. To enforce their monopoly, the forty individuals
owning the Fermes relied on their own private police constituted of nearly 20,000
men by the end of the 18th century. Although mainly used against smugglers, this
paramilitary force had the right to use armed force and to search any house.31
27 For an in-depth review of government actions towards the reduction of the number of tollsduring the 18th century, see Conchon (2002).
28 For instance, Louis XIV issued a royal ordinance in 1697 redefining the droits d’aubaine, a rightheld by seigneurs to seize the property of foreigners dying within their territory. The ordinanceinstead imposed a universal naturalization tax on all foreigners (Beik, 2005).
29 See Lemarchand (2010) and White (2004) for a synthesis on the transition from competitive togovernment tax farming.
30 For a review of the literature on the development of state capacity in Europe, see Dincecco(2015). Dincecco emphasises the existence of two equilibria. The “Old Regime” equilibriumcorresponds to a situation in which fiscal rights are fragmented and where there is noconstraint on the spending. The “effective state” equilibrium corresponds to a situation of fiscalcentralization and oversighted spending by Parliament.
31 Their abuses often infuriated the population, and resulted in episodes of violence against them(White, 2004).
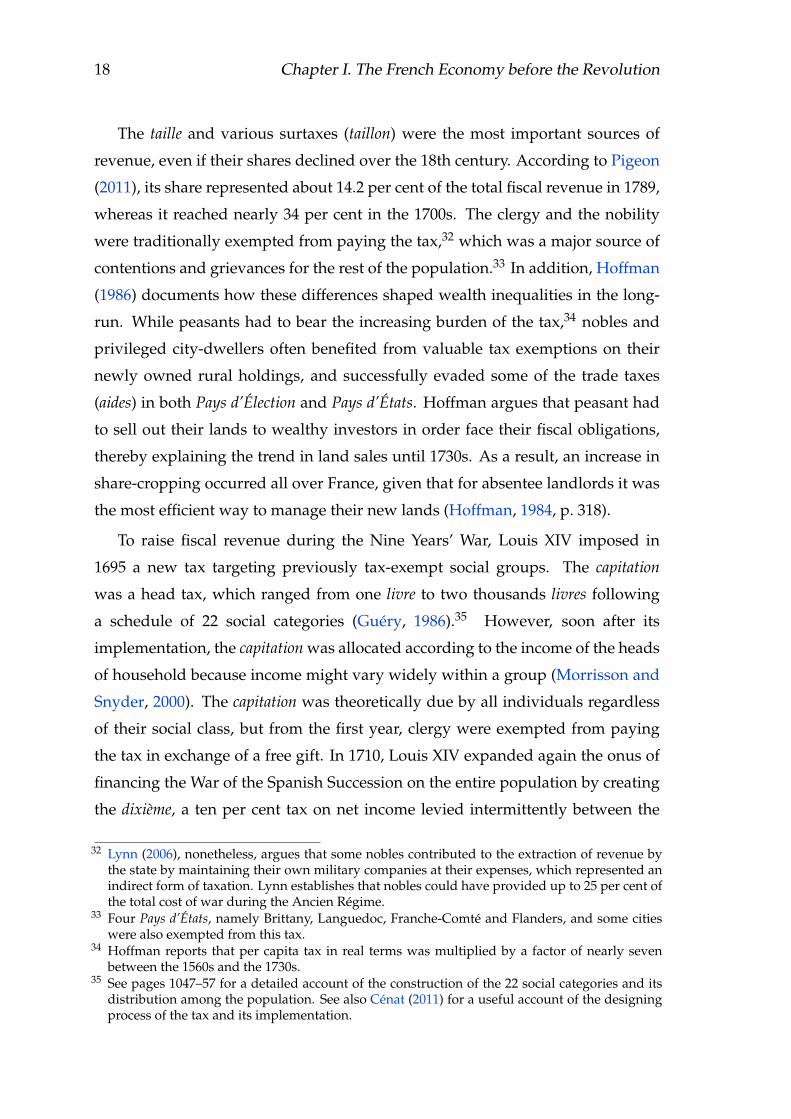
18 Chapter I. The French Economy before the Revolution
The taille and various surtaxes (taillon) were the most important sources of
revenue, even if their shares declined over the 18th century. According to Pigeon
(2011), its share represented about 14.2 per cent of the total fiscal revenue in 1789,
whereas it reached nearly 34 per cent in the 1700s. The clergy and the nobility
were traditionally exempted from paying the tax,32 which was a major source of
contentions and grievances for the rest of the population.33 In addition, Hoffman
(1986) documents how these differences shaped wealth inequalities in the long-
run. While peasants had to bear the increasing burden of the tax,34 nobles and
privileged city-dwellers often benefited from valuable tax exemptions on their
newly owned rural holdings, and successfully evaded some of the trade taxes
(aides) in both Pays d’Élection and Pays d’États. Hoffman argues that peasant had
to sell out their lands to wealthy investors in order face their fiscal obligations,
thereby explaining the trend in land sales until 1730s. As a result, an increase in
share-cropping occurred all over France, given that for absentee landlords it was
the most efficient way to manage their new lands (Hoffman, 1984, p. 318).
To raise fiscal revenue during the Nine Years’ War, Louis XIV imposed in
1695 a new tax targeting previously tax-exempt social groups. The capitation
was a head tax, which ranged from one livre to two thousands livres following
a schedule of 22 social categories (Guéry, 1986).35 However, soon after its
implementation, the capitation was allocated according to the income of the heads
of household because income might vary widely within a group (Morrisson and
Snyder, 2000). The capitation was theoretically due by all individuals regardless
of their social class, but from the first year, clergy were exempted from paying
the tax in exchange of a free gift. In 1710, Louis XIV expanded again the onus of
financing the War of the Spanish Succession on the entire population by creating
the dixième, a ten per cent tax on net income levied intermittently between the
32 Lynn (2006), nonetheless, argues that some nobles contributed to the extraction of revenue bythe state by maintaining their own military companies at their expenses, which represented anindirect form of taxation. Lynn establishes that nobles could have provided up to 25 per cent ofthe total cost of war during the Ancien Régime.
33 Four Pays d’États, namely Brittany, Languedoc, Franche-Comté and Flanders, and some citieswere also exempted from this tax.
34 Hoffman reports that per capita tax in real terms was multiplied by a factor of nearly sevenbetween the 1560s and the 1730s.
35 See pages 1047–57 for a detailed account of the construction of the 22 social categories and itsdistribution among the population. See also Cénat (2011) for a useful account of the designingprocess of the tax and its implementation.
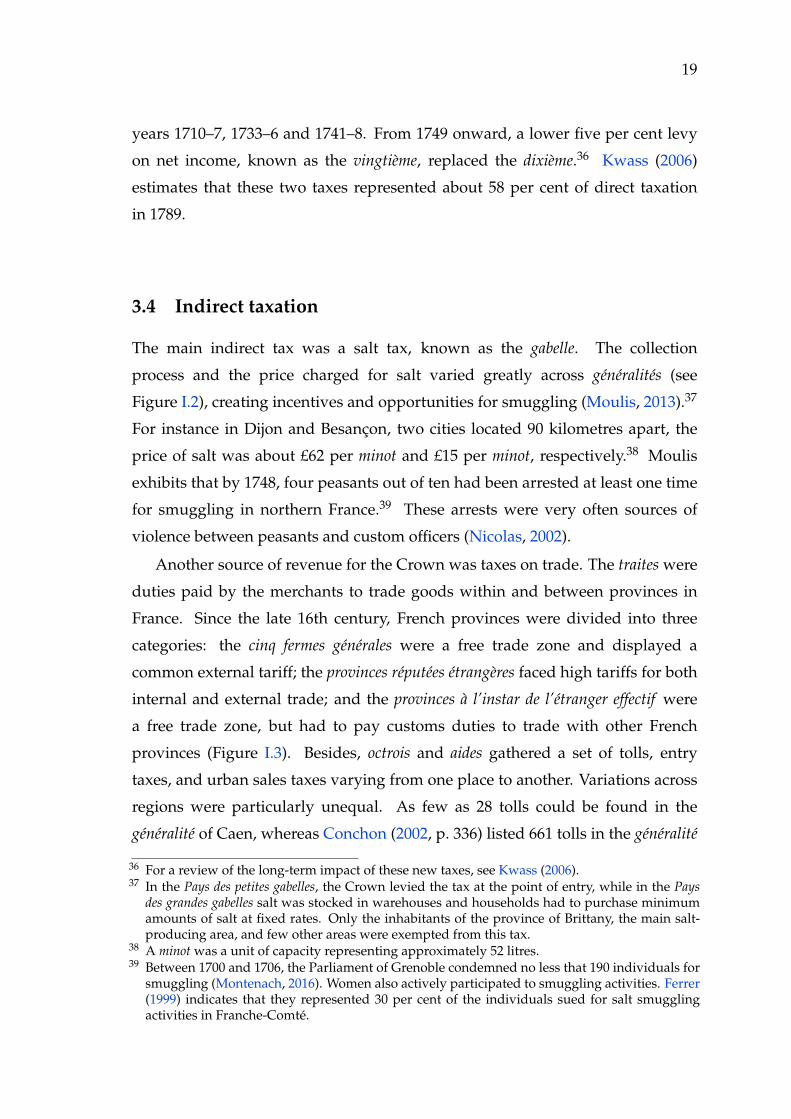
19
years 1710–7, 1733–6 and 1741–8. From 1749 onward, a lower five per cent levy
on net income, known as the vingtième, replaced the dixième.36 Kwass (2006)
estimates that these two taxes represented about 58 per cent of direct taxation
in 1789.
3.4 Indirect taxation
The main indirect tax was a salt tax, known as the gabelle. The collection
process and the price charged for salt varied greatly across généralités (see
Figure I.2), creating incentives and opportunities for smuggling (Moulis, 2013).37
For instance in Dijon and Besançon, two cities located 90 kilometres apart, the
price of salt was about £62 per minot and £15 per minot, respectively.38 Moulis
exhibits that by 1748, four peasants out of ten had been arrested at least one time
for smuggling in northern France.39 These arrests were very often sources of
violence between peasants and custom officers (Nicolas, 2002).
Another source of revenue for the Crown was taxes on trade. The traites were
duties paid by the merchants to trade goods within and between provinces in
France. Since the late 16th century, French provinces were divided into three
categories: the cinq fermes générales were a free trade zone and displayed a
common external tariff; the provinces réputées étrangères faced high tariffs for both
internal and external trade; and the provinces à l’instar de l’étranger effectif were
a free trade zone, but had to pay customs duties to trade with other French
provinces (Figure I.3). Besides, octrois and aides gathered a set of tolls, entry
taxes, and urban sales taxes varying from one place to another. Variations across
regions were particularly unequal. As few as 28 tolls could be found in the
généralité of Caen, whereas Conchon (2002, p. 336) listed 661 tolls in the généralité
36 For a review of the long-term impact of these new taxes, see Kwass (2006).37 In the Pays des petites gabelles, the Crown levied the tax at the point of entry, while in the Pays
des grandes gabelles salt was stocked in warehouses and households had to purchase minimumamounts of salt at fixed rates. Only the inhabitants of the province of Brittany, the main salt-producing area, and few other areas were exempted from this tax.
38 A minot was a unit of capacity representing approximately 52 litres.39 Between 1700 and 1706, the Parliament of Grenoble condemned no less that 190 individuals for
smuggling (Montenach, 2016). Women also actively participated to smuggling activities. Ferrer(1999) indicates that they represented 30 per cent of the individuals sued for salt smugglingactivities in Franche-Comté.

20 Chapter I. The French Economy before the Revolution
of Languedoc. Private individuals actually owned about two- third of these
péages, and sometimes drew considerable profits from them. From 1750 onward,
the Crown tried to regulate these tolls, and from 1770 to suppress them in order to
ease the circulation of goods between provinces. This reform was only partially
successful as 1,104 out of the 5,687 tolls subsisted until 1789. Tolls were also a
source of contentions, and in this regard, some professions, like butchers, were
particularly feared by authorities.40 These apprehensions were rooted in the
numerous episodes of violence in which butchers were implicated, such as in
Alençon in 1710, or in Lyon in 1714 (Nicolas, 2002).41
Legay (2001, pp. 231–4) reports the results of two fiscal investigations in 1772
and 1782. The fiscal burden per inhabitant ranged from £11 in the généralités
of Brittany, Limoges, and Nancy to about £30 in Lyon, Orléans, and Rouen. In
between, inhabitants paid on average £20 of taxes in the généralités of Montauban
and Lille, but only £15 in the généralités of Bordeaux, Grenoble, and Metz. These
high levels of taxation often precluded wealth accumulation among the lower
strata of the French population, contributing to the widening of inequalities and
the unsustainability of the social structure before 1789. Furthermore, Hoffman
(1988) contends that the tax system drew money away from peasants, thereby
impeding investments in agriculture and slowing down agricultural productivity
growth.
4 Social structure
4.1 Three Orders
In 1789, the French population amounted to 28.5 million individuals divided
into three Estates. The First Estate was the catholic clergy, and was different
from the other Estates in that it was more a profession rather than a true social
40 Entry taxes on cattle were among the highest. In Perpignan, taxes on meat-related productsconstituted 28 per cent of the municipal income in 1750-56, whereas those on grape and floursrepresented 16 per cent and 11 per cent respectively (Larguier, 2010, p. 83).
41 In Alençon, butchers not only threatened trade attendants, but also burned to the ground thecustom building. In June 1714 in Lyon, the crowd joined the butchers in their protest againstentry taxes. For two days, 20,000 people demonstrated and looted custom buildings and tobaccowarehouses.
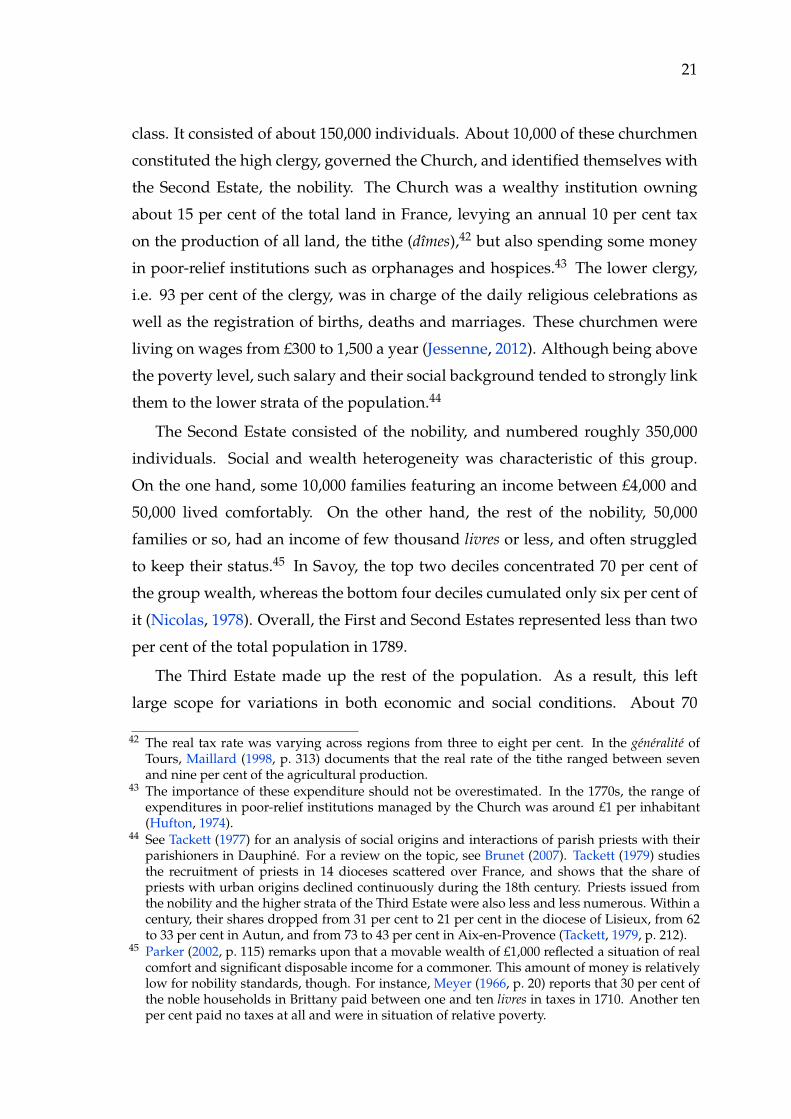
21
class. It consisted of about 150,000 individuals. About 10,000 of these churchmen
constituted the high clergy, governed the Church, and identified themselves with
the Second Estate, the nobility. The Church was a wealthy institution owning
about 15 per cent of the total land in France, levying an annual 10 per cent tax
on the production of all land, the tithe (dîmes),42 but also spending some money
in poor-relief institutions such as orphanages and hospices.43 The lower clergy,
i.e. 93 per cent of the clergy, was in charge of the daily religious celebrations as
well as the registration of births, deaths and marriages. These churchmen were
living on wages from £300 to 1,500 a year (Jessenne, 2012). Although being above
the poverty level, such salary and their social background tended to strongly link
them to the lower strata of the population.44
The Second Estate consisted of the nobility, and numbered roughly 350,000
individuals. Social and wealth heterogeneity was characteristic of this group.
On the one hand, some 10,000 families featuring an income between £4,000 and
50,000 lived comfortably. On the other hand, the rest of the nobility, 50,000
families or so, had an income of few thousand livres or less, and often struggled
to keep their status.45 In Savoy, the top two deciles concentrated 70 per cent of
the group wealth, whereas the bottom four deciles cumulated only six per cent of
it (Nicolas, 1978). Overall, the First and Second Estates represented less than two
per cent of the total population in 1789.
The Third Estate made up the rest of the population. As a result, this left
large scope for variations in both economic and social conditions. About 70
42 The real tax rate was varying across regions from three to eight per cent. In the généralité ofTours, Maillard (1998, p. 313) documents that the real rate of the tithe ranged between sevenand nine per cent of the agricultural production.
43 The importance of these expenditure should not be overestimated. In the 1770s, the range ofexpenditures in poor-relief institutions managed by the Church was around £1 per inhabitant(Hufton, 1974).
44 See Tackett (1977) for an analysis of social origins and interactions of parish priests with theirparishioners in Dauphiné. For a review on the topic, see Brunet (2007). Tackett (1979) studiesthe recruitment of priests in 14 dioceses scattered over France, and shows that the share ofpriests with urban origins declined continuously during the 18th century. Priests issued fromthe nobility and the higher strata of the Third Estate were also less and less numerous. Within acentury, their shares dropped from 31 per cent to 21 per cent in the diocese of Lisieux, from 62to 33 per cent in Autun, and from 73 to 43 per cent in Aix-en-Provence (Tackett, 1979, p. 212).
45 Parker (2002, p. 115) remarks upon that a movable wealth of £1,000 reflected a situation of realcomfort and significant disposable income for a commoner. This amount of money is relativelylow for nobility standards, though. For instance, Meyer (1966, p. 20) reports that 30 per cent ofthe noble households in Brittany paid between one and ten livres in taxes in 1710. Another tenper cent paid no taxes at all and were in situation of relative poverty.

22 Chapter I. The French Economy before the Revolution
per cent of the total population lived in villages of less than or equal to 2,000
inhabitants. About 500,000 individuals formed the urban bourgeoisie. Among
urban dwellers, craftsmen, city workers, servants, and the poor constituted the
most significant shares of the population within which many inequalities existed.
Kitchen gardening was a relatively common practice among urbanites. Yet, it
neither enabled auto-sufficiency nor prevented from food shortage in times of
economic crisis. Ruff (2001, p. 192) contends that even the most prosperous
artisans could be reduced to “penury and sometimes starvation” in case of
harvest failure. From 1661 to 1789, about 20 per cent of the food riots occurred in
towns larger than 2,000 inhabitants (Nicolas, 2002).
4.2 Society structure, occupations and inequalities
Beyond the differences between urban and rural dwellers, Jessenne (2012, pp. 27–
8) underlines dissimilarities among the rural Third Estate, and divides its
population into five social categories. At the top of the hierarchy lay members
of liberal professions, merchants, and tenants farmers, a group the author called
“rural bourgeoisie”.46 At the bottom of the scale, the needy represented from
10 to 20 per cent of the total rural population (Table I.1). Morrisson and Snyder
(2000) have used the estimates of the occupational structure of the society in 1788
and the design of the capitation tax to disentangle income disparities between
different social categories. Apart from the nobility and the bourgeoisie, the
large-scale cultivators lay at the top of the hierarchy earning an average annual
income of £880 per household. Among tax payers, domestic workers and daily
labourers constituted the last group earning no more than £160 annually. Overall,
in 1778, the top ten percent of the population earned about 50 per cent of the
total income, whereas the lower 70 per cent earned about 26 per cent.47 Such
level of inequalities was not particularly higher than in neighbouring countries
(Morrisson and Snyder, 2000, p. 70).
46 The largest fortunes among the large-scale cultivators in the Parisian Basin reached up to£30,000, making them richer than most of the nobility, but leaving them far behind the super-rich (Parker, 2002).
47 For a detailed description of differences between these categories, see Lagadec (2007) whoseresearch focuses on rural elites in Brittany.
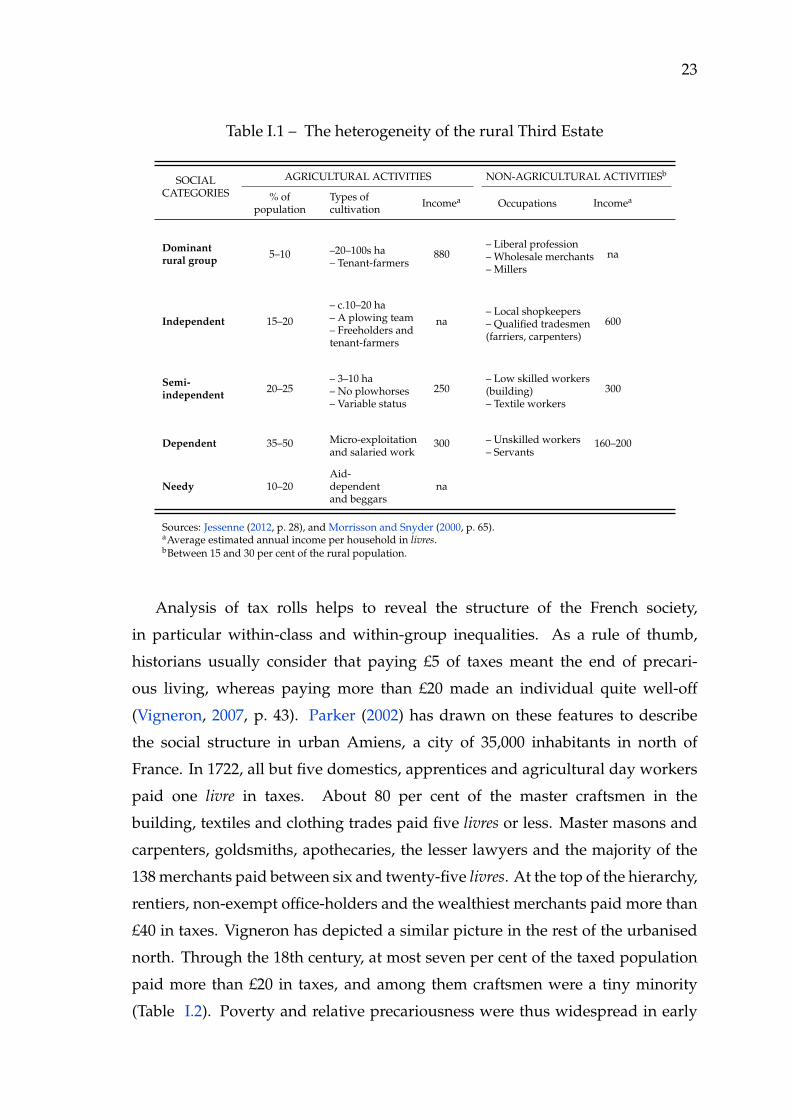
23
Table I.1 – The heterogeneity of the rural Third Estate
SOCIALCATEGORIES
AGRICULTURAL ACTIVITIES NON-AGRICULTURAL ACTIVITIESb
% ofpopulation
Types ofcultivation Incomea Occupations Incomea
Dominantrural group
5–10 –20–100s ha– Tenant-farmers
880– Liberal profession– Wholesale merchants– Millers
na
Independent 15–20
– c.10–20 ha– A plowing team– Freeholders andtenant-farmers
na– Local shopkeepers– Qualified tradesmen(farriers, carpenters)
600
Semi-independent
20–25– 3–10 ha– No plowhorses– Variable status
250– Low skilled workers(building)– Textile workers
300
Dependent 35–50 Micro-exploitationand salaried work
300 – Unskilled workers– Servants
160–200
Needy 10–20Aid-dependentand beggars
na
Sources: Jessenne (2012, p. 28), and Morrisson and Snyder (2000, p. 65).aAverage estimated annual income per household in livres.bBetween 15 and 30 per cent of the rural population.
Analysis of tax rolls helps to reveal the structure of the French society,
in particular within-class and within-group inequalities. As a rule of thumb,
historians usually consider that paying £5 of taxes meant the end of precari-
ous living, whereas paying more than £20 made an individual quite well-off
(Vigneron, 2007, p. 43). Parker (2002) has drawn on these features to describe
the social structure in urban Amiens, a city of 35,000 inhabitants in north of
France. In 1722, all but five domestics, apprentices and agricultural day workers
paid one livre in taxes. About 80 per cent of the master craftsmen in the
building, textiles and clothing trades paid five livres or less. Master masons and
carpenters, goldsmiths, apothecaries, the lesser lawyers and the majority of the
138 merchants paid between six and twenty-five livres. At the top of the hierarchy,
rentiers, non-exempt office-holders and the wealthiest merchants paid more than
£40 in taxes. Vigneron has depicted a similar picture in the rest of the urbanised
north. Through the 18th century, at most seven per cent of the taxed population
paid more than £20 in taxes, and among them craftsmen were a tiny minority
(Table I.2). Poverty and relative precariousness were thus widespread in early

24 Chapter I. The French Economy before the Revolution
modern urban France.48
Table I.2 – Inferred socio-economic structure in north of Francea
(distribution of the population paying the capitation)
Location Year Totalpopulation
# of taxedhouseholds < 5 [5–20] > 20
(1) Lille 1695 60,000b 12,305 69.3 25.1 5.6(2) Lille 1790 66,761c 11,884 70.6 22.8 6.6(3) Cambrai 1696 12,000b 1,801 72.9 22.8 4.3(4) Cambrai 1790 15,427c 4,037 80.5 15.3 4.2(5) Le Cateau 1714 4,000b 605 85 14.6 0.4(6) Comines 1786 4,704c 290 93.5 6.5 0(7) Armentières 1790 7,671c 339 81.4 15.9 2.7
aSources: Vigneron (2007, p. 44).bSources: Bairoch, Batou and Chèvre (1988). Interpolated number of inhabitants for Le Cateau.cSources: 1793 population census.
In the 1780s, 25 per cent of the population of Valenciennes were considered
as needy by the mayor, whereas in Dijon, about seven per cent of the population
were poor (Lamarre, 2014).49 Using municipal population censuses, Lamarre de-
scribes the social composition of the population in Dijon at the eve of the French
Revolution. Exempt from the taille, military constituted one fifth of the total
population, while clergy numbered 1,289 individuals out of the 22,800 inhabitants
(Table I.3).50 Servants represented a significant share of the population, 13 per
cent. This level was quite representative to the situation in urban France. In 1760,
Avignon had 14 per cent of domestic workers, Nancy 11.9 per cent, and Le Mans
10.8 per cent. In Brittany, domestic workers represented 19 per cent of the labour
force in Saint-Malo in 1780, and as much as 24 per cent in Saint-Brieuc (Nières,
48 For an in depth description of social composition, and income and tax inequalities in urbanBrittany throughout the 18th century, see Nières (2004, pp. 73–142). This was also true forthe countryside. In rural Brionnais, Dontenwill (2007) estimates that about 17 per cent of thepopulation were poor and relied on charity for surviving.
49 The figure rises to nine per cent of households if one considers instead individuals who did notpay the taille due to their very low income in 1780. In Lille, the situation was worse. About onethird of the population was considered as poor and did not pay the capitation. In bad year, suchas 1740, up to 45 per cent of the total population could be exempted from paying taxes becauseof indigence (Vigneron, 2007, p. 44). 36 per cent of the 9,000 inhabitants of the city of Morlaixdid not pay the capitation because of their misery. In Saint-Malo, 21 per cent of the individualswere unable to meet their tax obligations during the same year (Nières, 2004, p. 136).
50 The share of clergy was relatively comparable to cities of similar size and status: about threeper cent of the population of Nancy belonged to the clergy in 1766, three and half per cent inAngers, and nearly six per cent in Avignon, the former papal city.
25
2004, p. 111).51 In Dijon as in Moulins or Toulouse, craftsmen and shopkeepers
represented from one fourth to one third of the municipal population (Table I.3).
Most of the time, however, the economic power was concentrated in the hands
of a small group of individuals including thriving merchants and office holders,
whose considerable wealth contrasted with the misery of the 10 to 30 per cent of
living poor.
51 These levels are higher than the one observed in rural areas. Focusing on 86 villages locatedin the north of Burgundy, Hayhoe (2012, p. 551) estimates that about seven per cent of thepopulation living in villages worked as servants.
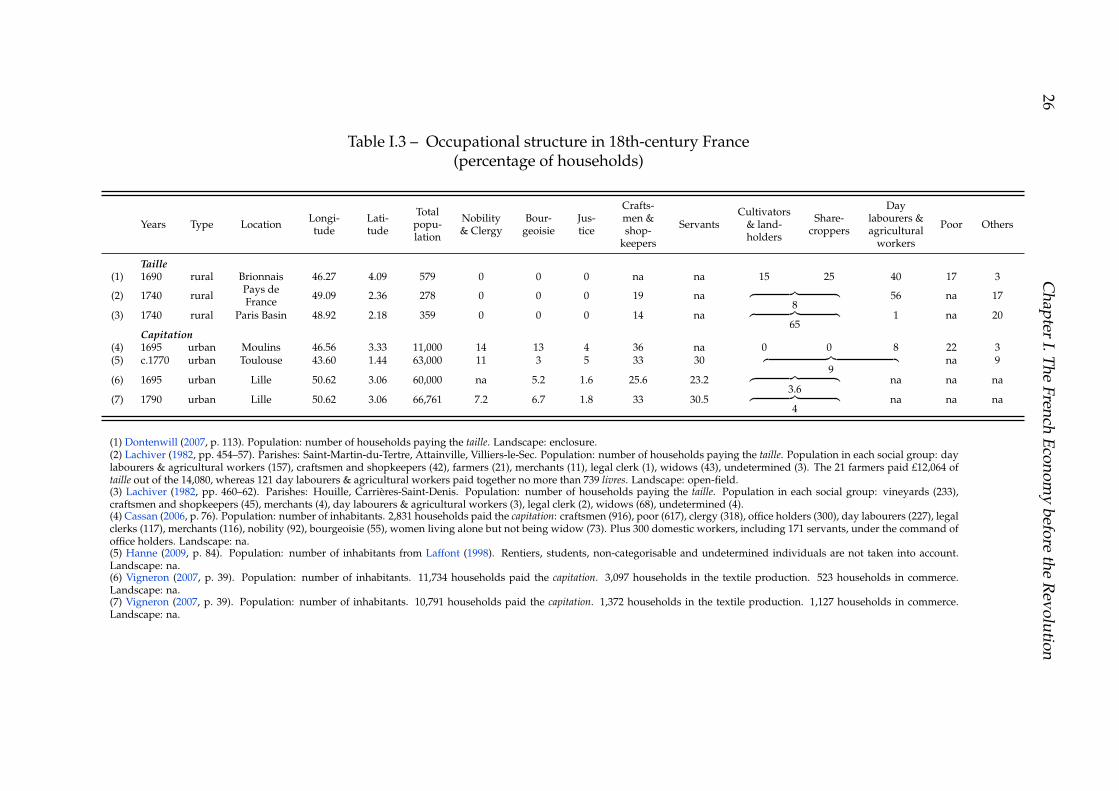
26C
hap
terI.T
he
Fren
chE
con
om
yb
efore
the
Rev
olu
tion
Table I.3 – Occupational structure in 18th-century France(percentage of households)
Years Type Location Longi-tude
Lati-tude
Totalpopu-lation
Nobility& Clergy
Bour-geoisie
Jus-tice
Crafts-men &shop-
keepers
ServantsCultivators
& land-holders
Share-croppers
Daylabourers &agricultural
workers
Poor Others
Taille(1) 1690 rural Brionnais 46.27 4.09 579 0 0 0 na na 15 25 40 17 3
(2) 1740 rural Pays deFrance 49.09 2.36 278 0 0 0 19 na ︷ ︸︸ ︷
856 na 17
(3) 1740 rural Paris Basin 48.92 2.18 359 0 0 0 14 na ︷ ︸︸ ︷
651 na 20
Capitation(4) 1695 urban Moulins 46.56 3.33 11,000 14 13 4 36 na 0 0 8 22 3(5) c.1770 urban Toulouse 43.60 1.44 63,000 11 3 5 33 30 ︷ ︸︸ ︷
9na 9
(6) 1695 urban Lille 50.62 3.06 60,000 na 5.2 1.6 25.6 23.2 ︷ ︸︸ ︷
3.6na na na
(7) 1790 urban Lille 50.62 3.06 66,761 7.2 6.7 1.8 33 30.5 ︷ ︸︸ ︷
4na na na
(1) Dontenwill (2007, p. 113). Population: number of households paying the taille. Landscape: enclosure.(2) Lachiver (1982, pp. 454–57). Parishes: Saint-Martin-du-Tertre, Attainville, Villiers-le-Sec. Population: number of households paying the taille. Population in each social group: daylabourers & agricultural workers (157), craftsmen and shopkeepers (42), farmers (21), merchants (11), legal clerk (1), widows (43), undetermined (3). The 21 farmers paid £12,064 oftaille out of the 14,080, whereas 121 day labourers & agricultural workers paid together no more than 739 livres. Landscape: open-field.(3) Lachiver (1982, pp. 460–62). Parishes: Houille, Carrières-Saint-Denis. Population: number of households paying the taille. Population in each social group: vineyards (233),craftsmen and shopkeepers (45), merchants (4), day labourers & agricultural workers (3), legal clerk (2), widows (68), undetermined (4).(4) Cassan (2006, p. 76). Population: number of inhabitants. 2,831 households paid the capitation: craftsmen (916), poor (617), clergy (318), office holders (300), day labourers (227), legalclerks (117), merchants (116), nobility (92), bourgeoisie (55), women living alone but not being widow (73). Plus 300 domestic workers, including 171 servants, under the command ofoffice holders. Landscape: na.(5) Hanne (2009, p. 84). Population: number of inhabitants from Laffont (1998). Rentiers, students, non-categorisable and undetermined individuals are not taken into account.Landscape: na.(6) Vigneron (2007, p. 39). Population: number of inhabitants. 11,734 households paid the capitation. 3,097 households in the textile production. 523 households in commerce.Landscape: na.(7) Vigneron (2007, p. 39). Population: number of inhabitants. 10,791 households paid the capitation. 1,372 households in the textile production. 1,127 households in commerce.Landscape: na.
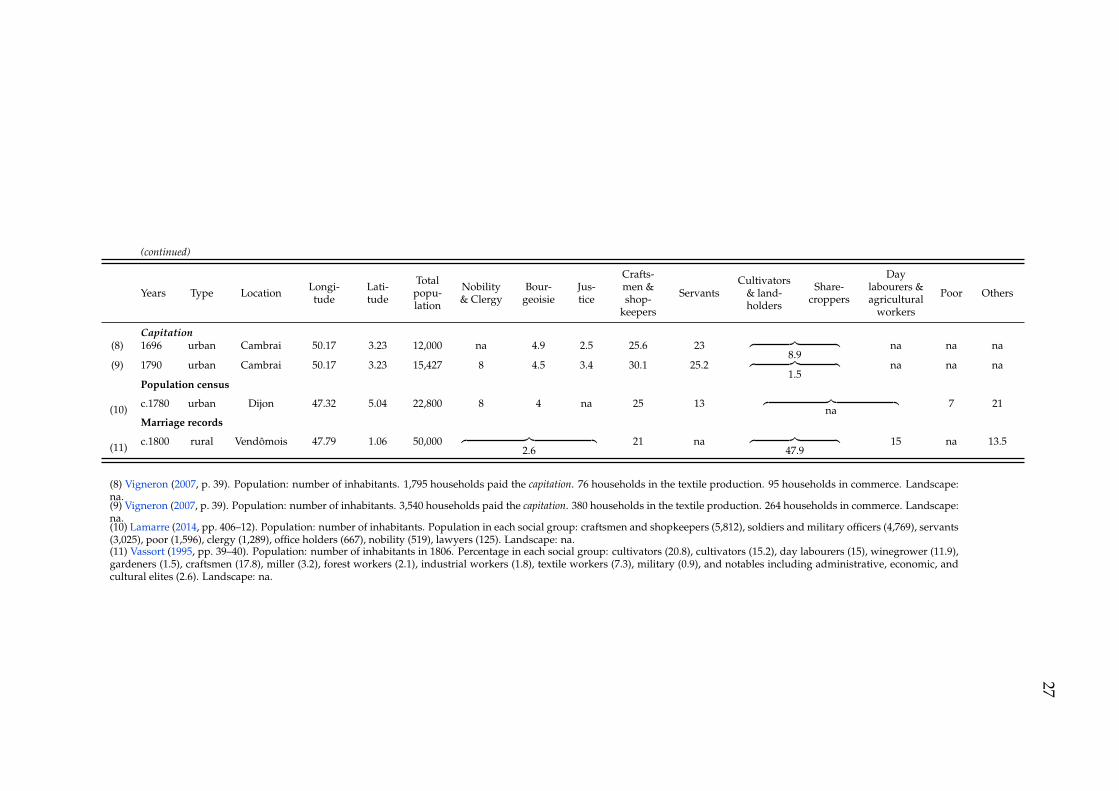
27
(continued)
Years Type Location Longi-tude
Lati-tude
Totalpopu-lation
Nobility& Clergy
Bour-geoisie
Jus-tice
Crafts-men &shop-
keepers
ServantsCultivators
& land-holders
Share-croppers
Daylabourers &agricultural
workers
Poor Others
Capitation(8) 1696 urban Cambrai 50.17 3.23 12,000 na 4.9 2.5 25.6 23 ︷ ︸︸ ︷
8.9na na na
(9) 1790 urban Cambrai 50.17 3.23 15,427 8 4.5 3.4 30.1 25.2 ︷ ︸︸ ︷
1.5na na na
Population census
(10) c.1780 urban Dijon 47.32 5.04 22,800 8 4 na 25 13 ︷ ︸︸ ︷
na7 21
Marriage records
(11) c.1800 rural Vendômois 47.79 1.06 50,000 ︷ ︸︸ ︷
2.621 na ︷ ︸︸ ︷
47.915 na 13.5
(8) Vigneron (2007, p. 39). Population: number of inhabitants. 1,795 households paid the capitation. 76 households in the textile production. 95 households in commerce. Landscape:na.(9) Vigneron (2007, p. 39). Population: number of inhabitants. 3,540 households paid the capitation. 380 households in the textile production. 264 households in commerce. Landscape:na.(10) Lamarre (2014, pp. 406–12). Population: number of inhabitants. Population in each social group: craftsmen and shopkeepers (5,812), soldiers and military officers (4,769), servants(3,025), poor (1,596), clergy (1,289), office holders (667), nobility (519), lawyers (125). Landscape: na.(11) Vassort (1995, pp. 39–40). Population: number of inhabitants in 1806. Percentage in each social group: cultivators (20.8), cultivators (15.2), day labourers (15), winegrower (11.9),gardeners (1.5), craftsmen (17.8), miller (3.2), forest workers (2.1), industrial workers (1.8), textile workers (7.3), military (0.9), and notables including administrative, economic, andcultural elites (2.6). Landscape: na.
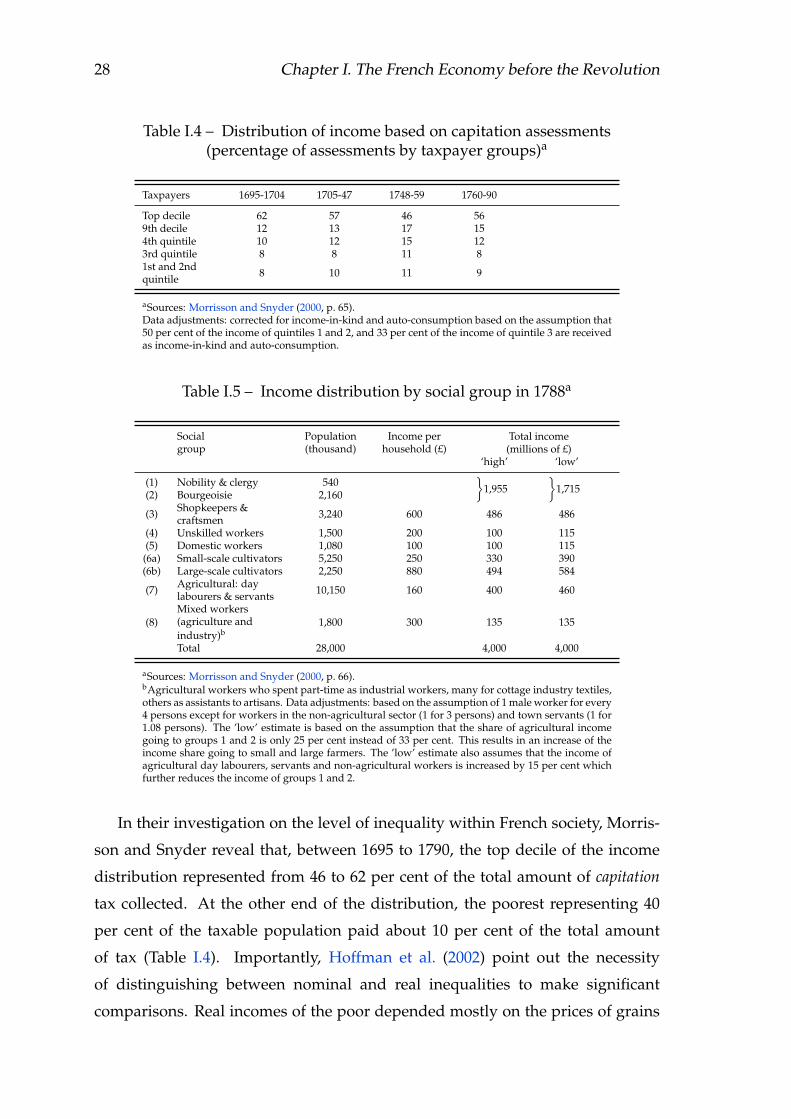
28 Chapter I. The French Economy before the Revolution
Table I.4 – Distribution of income based on capitation assessments(percentage of assessments by taxpayer groups)a
Taxpayers 1695-1704 1705-47 1748-59 1760-90
Top decile 62 57 46 569th decile 12 13 17 154th quintile 10 12 15 123rd quintile 8 8 11 81st and 2ndquintile 8 10 11 9
aSources: Morrisson and Snyder (2000, p. 65).Data adjustments: corrected for income-in-kind and auto-consumption based on the assumption that50 per cent of the income of quintiles 1 and 2, and 33 per cent of the income of quintile 3 are receivedas income-in-kind and auto-consumption.
Table I.5 – Income distribution by social group in 1788a
Social Population Income per Total incomegroup (thousand) household (£) (millions of £)
‘high’ ‘low’
(1) Nobility & clergy 540}
1,955}
1,715(2) Bourgeoisie 2,160
(3) Shopkeepers &craftsmen 3,240 600 486 486
(4) Unskilled workers 1,500 200 100 115(5) Domestic workers 1,080 100 100 115
(6a) Small-scale cultivators 5,250 250 330 390(6b) Large-scale cultivators 2,250 880 494 584
(7) Agricultural: daylabourers & servants 10,150 160 400 460
(8)Mixed workers(agriculture andindustry)b
1,800 300 135 135
Total 28,000 4,000 4,000
aSources: Morrisson and Snyder (2000, p. 66).bAgricultural workers who spent part-time as industrial workers, many for cottage industry textiles,others as assistants to artisans. Data adjustments: based on the assumption of 1 male worker for every4 persons except for workers in the non-agricultural sector (1 for 3 persons) and town servants (1 for1.08 persons). The ’low’ estimate is based on the assumption that the share of agricultural incomegoing to groups 1 and 2 is only 25 per cent instead of 33 per cent. This results in an increase of theincome share going to small and large farmers. The ’low’ estimate also assumes that the income ofagricultural day labourers, servants and non-agricultural workers is increased by 15 per cent whichfurther reduces the income of groups 1 and 2.
In their investigation on the level of inequality within French society, Morris-
son and Snyder reveal that, between 1695 to 1790, the top decile of the income
distribution represented from 46 to 62 per cent of the total amount of capitation
tax collected. At the other end of the distribution, the poorest representing 40
per cent of the taxable population paid about 10 per cent of the total amount
of tax (Table I.4). Importantly, Hoffman et al. (2002) point out the necessity
of distinguishing between nominal and real inequalities to make significant
comparisons. Real incomes of the poor depended mostly on the prices of grains

29
and fuels before 1800, whereas the expenditure pattern of the rich was also
determined by prices of luxury goods and domestic work. Overall, the French
society was getting more egalitarian from 1650 to 1700, whereas from 1750
onward, the relative prices of staple foods continuously increased sharpening
the level of real inequality between poor and rich. This phenomenon can be
explained by the population decline observed between 1640 and 1720, a period
during which food prices also declined before stabilising. However after 1720,
the rise of population was concomitant with an even faster rise in food prices,
thereby reducing real wages, which had fallen by about one third by the early
1770s (Goldstone, 2012).52 These trends did not affect all members of the Third
Estate in the same way. Hayhoe (2012, pp. 559–60) has shown that the cash
portion of servant wages was often relatively low. Out of a total salary of £100 to
160, annual cash wages larger than £50 were unusual. In northern Burgundy, the
annual median cash wages were £34 for men. Cash wages happened to be higher
in some areas of the Paris Basin, as high as £81 a year, but the region was wealthier
and more market oriented. In Savoy, Nicolas (1978) suggests that payment in
kind represented from 70 to 85 per cent of the total cost involved in hiring a
domestic worker.53 By contrast, agricultural daily labourers relied mostly on cash
wages for survival, and were more directly affected by food prices volatility. Ruff
(2001, p. 192) has argued that even most prosperous craftsmen, whose income
was higher, could be badly hit during severe food shortages. In his repertoire
of social movements in France between 1661 and 1789, Nicolas (2002) has listed
1,497 events related to subsistence issues. Within the 488 events in which the
social composition of the crowd is known, domestic workers are involved only
22 times. In comparison, agricultural day labourers are involved in 78 events,
while craftsmen are found to be active in 234 events including 96 during which
they were the sole protesters.
Although the direct lethality of subsistence crises diminished during the 18th
52 Van Zanden (1999) suggests that to face the decline in real wages, individuals often increasedtheir labour effort to maintain their standard of livings. Based on the observation that trendsin real wages and economic development did not parallel in the early modern period, VanZanden concludes that “large segments of the population of Europe did not profit much fromthe economic progress that has been documented”.
53 In Lyon, Gutton (1971) shows that cash wages of female servants averaged to £30 annually, butbecause they were provided with room and board, they suffered much less from food crisesthan the rest of the population.
30 Chapter I. The French Economy before the Revolution
century, their impacts on the demographic trends remained important. Food
shortages increased the exposure to disease and multiplied the lethality of large
epidemics. Sometimes negligible or limited to a small set of parishes, the
combination of malnutrition and epidemics could also lead to a six per cent drop
in the total French population within a single year (Le Roy Ladurie and Rousseau,
2009).
5 Demography
5.1 Population estimates
The French population grew from 21.5 million inhabitants in 1700 to 23.8 million
in 1730, and then from 26.9 million circa 1760 to 28.5 million in 1789 (Figure I.4;
Dupâquier, 1979, p. 34, 98). The population growth was, however, neither steady
nor equally distributed across the French généralités. For instance, over the 18th
century, population rose by 80 per cent in Lorraine, but only by 20 percent in
Limousin (Jessenne, 2012). It doubled in Alsace, but increased by 15 per cent
in Brittany and Normandy (Garnot, 1988). In Dauphiné, the population grew
by 38.2 per cent between 1698 and 1790 (Favier, 1992, p. 232). A similar trend
is observed in Languedoc with an approximate 40 per cent population growth
(Larguier, 1999, p. 716).54
The birth rate was high, but the mortality rate was also extremely high.55 In
the mountainous Jura in eastern France, on average 640 of every 1,000 died before
age ten between 1750 and 1790 (Merlin, 1994, p. 44). West from Jura in Burgundy,
about 56 per cent of the children survived to the age of 15 in the 1780s (Lamarre,
1983), a rate roughly similar to the 58.7 per cent of surviving children in yeoman
54 While fertile areas were able to absorb this population surplus, poorer soil regions relied onout-migrations. In the Paris Basin, the enlargement of small farms lead to a polarization ofthe society with growing shares of large landowners and landless individuals. By contrast, therelatively high productivity of the vineyard regions allowed peasant to split land in smallerplots (Goldstone, 2012). Demographic pressure contributed thus to shape the agriculturallandscape of France, and at the same time, the ability of the local population to cope with crises.
55 About half of the children died before their tenth birthday. For instance, in Burgundy, birthrate and mortality rate were 38.8 per mill and 37.4 per mill respectively (Lamarre, 1983, p. 91).In Figures I.5 and I.6, I present the average birth rate and death rate per 1,000 inhabitants pergénéralité in the early 1780s. The spatial variations shown are consistent with previous findingsin the historical demography literature.

31
families in the surroundings of Chartres (Garnot, 1988, p. 58). In comparison, in
Pays d’Auge in west of France where harvests produced more food than required
to feed its inhabitants, from 63 to 70 per cent of the children survived to the age
of 20 (Besnier, 1979). By contrast, in the marshy Dombes, east of Lyon, mortality
was very high (Bideau, 2017, pp. 223–8; Brunet, 2014). About 40 per cent of the
children reached the age of five, and in average marriages lasted for 11.4 years
before the decease of a spouse, to be compared with the national average of 24
years (Minvielle, 2010). In the 1780s, more than 40 per cent of the population was
under 20, and the life expectancy at birth was as low as 27.5 years for men and
28.1 years for women (Jessenne, 2012).56 These figures have to be read with care,
given that the extremely high infant mortality pulled the averages down. The
end of large epidemics after the 1720 plague in Marseille, and the reduction of
mortality spikes related to subsistence crises are the two main factors explaining
this population growth (Lebrun, 1980). Overall, significant reductions in fertility
rate began in the 1780s, few years before declines in crude death rates and infant
mortality rates, thereby triggering the first demographic transition in Europe
(Richards, 1983).57
5.2 Exogenous shocks and demographic crises
Arguing that previous studies suffered from several statistical biases, Chevet
(1993) uses the INED historical survey on the population of France to extend
the work of Dupâquier on demographic crises.58 Chevet shows that from 1670
to 1789, seven years stand out as outliers in terms of the number of deaths
and births.59 Using the criteria of a minimum of 100,000 excess mortality,
Le Roy Ladurie and Rousseau (2009) have also identified a demographic crisis
in seven sets of years between 1680 and 1789. The most severe crisis occurred
in 1694, a time during which excess mortality reached about 510,000 deaths,
56 Garnot (1988, p. 57) proposes a slightly more optimistic estimate with an average life expectancyat birth of 29.6 years between 1770 and 1790.
57 Interestingly, Diebolt and Perrin (2014) notice that the decline in fertility was concomitant withthe reduction of the median marriage age, thereby suggesting a shift from Malthusian behaviourto the adoption of within couple contraceptive behaviours.
58 The Institut national d’études démographiques (National institute for demographic studies) is aFrench research institute in charge of studying every aspect of demographic issues.
59 In comparison, Dupâquier identifies up to 61 years of crises in an interval of 110 years. Even itsmost conservative estimate suggests that a mortality crisis occurred in 24 per cent of the years.

32 Chapter I. The French Economy before the Revolution
representing a 60 per cent increase.60 The cumulated death toll over the years
1693–4 amounted to 1,300,000 individuals, a figure equivalent to 5.8 per cent
of the total French population. Le Roy Ladurie and Rousseau emphasise as a
plausible cause the bad weather conditions. In particular, excessive rainfalls led
to grain scarcity, malnourishment, and as a result higher exposure to epidemics
during the record-breaking cold winter of 1693.61 In Paris, the price of wheat had
skyrocketed by 70 per cent in 1694, a record only beaten by the year 1709, during
which the price of wheat more than doubled and the number of deaths soared
by 22 per cent. Chevet, however, shows that there is no correlation between
mortality crises and spikes in food prices over the period 1670–1789. Based
on data he had gathered during the different offices he held in the 1760s, La
Michodière suggested that there was a positive relationship between mortality
and the price of wheat (Chevet and Ó Gráda, 2006).62 Chevet and O’Gráda
re-use the same data to test for the robustness of the relationship. Regressing
rates of change in mortality on rates of change in wheat prices provides weak
evidences for such relationship. Between 1723 and 1762, a doubling in price of
wheat in Paris and Lyons would have implied mere 17 per cent and a 12.1 per
cent increases in mortality, respectively.
Another driver of excess mortality, Le Roy Ladurie and Rousseau (2009)
suggest, could be severe heat waves and droughts during spring and summer.
They put forward the example of the year 1719, also identified by Chevet. In
1719, heat waves reduced water quality and led to epidemic dysentery, thereby
fostering another mortality crisis.63 Studying mortality crises in Bordeaux at the
60 Larguier (1999, pp. 641–4) provides an account of the effect of these crises on local communitiesin the rural surroundings of Narbonne. In many villages, population dropped by 20 per cent ormore and did not recover before 1789. In Narbonne and Carcassonne, population declined byten per cent and five per cent, respectively.
61 For further details about the link between excessive rainfalls, flooding and malarial epidemicsin pre-industrial France, see Roucaute et al. (2014).
62 In his precursor work, Meuvret (1946) supports this view, in which demographic crises areexplained not by wars or epidemics, but high grain prices resulting from poor harvestsproduced by climatic shocks. Importantly, scarcity rather than the physical absence of food,of which circulation was limited due to trade barriers, was linked to high prices. Scarcity alsohad an impact on other demographic variables such as the number of marriages and the numberof births.
63 The lethality of dysentery was particularly high among the individual in a weakened condition,such as children and the elderly. Focusing on Sweden, Castenbrandt (2014) shows that themortality rate reached up to 37 per mill for children under the age of 10 in the early 19th century.At the parish level, dysentery could be responsible for as much as 90 per cent of all deaths inyears of crisis.

33
turn of the 18th century, Poussou (1980, p. 239) asserts that “it is difficult to argue
in favour of an analysis based on the direct influence of wheat prices”. Instead,
Poussou postulates that the mortality spike rather reflected an epidemiological
phenomenon, sometimes fostered by a surge in wheat prices. Food shortage
predisposed to diseases, and its effect was intertwined with that of undernutri-
tion and malnutrition. Analysing the crisis of the middle of the 18th century,
Poussou further contends that epidemics rather than wheat prices mattered, as
the mortality spike observed in 1748 was associated with a surge in the number
of hospital burials.64 Munno (2013) studies the city of Charleville in northern
France to understand the relationship between repeated weather anomalies that
affected all of northern Europe around the 1740s, and demographic crises. Taking
advantage of yearly municipal population censuses and various archival records,
Munno shows that the mortality rate tripled in the worst months of the crisis
leading to an overall 4.8 per cent decline of the city population. During the first
mortality wave, children under five suffered from a threefold to tenfold increase
in the mortality rate compared to previous periods.65 In 1742, 40 per cent of
households reported fewer under-16 individual than in 1739. The figure drops
to nine per cent for individuals older than 16. Munno contends that if food
scarcity had been the main cause of the mortality spike, then a larger range of
the population would have been affected. Instead, she suggests that nutritional
deficiency concomitantly with a higher exposure to infant epidemics explain this
trend.
Contemporaries were well aware of the risks related to epidemics. Thus, in
1698, a parish priest in the center of France observed that ‘the high frequency
of measles epidemics caused population decline, in particular in swamp areas’
(Dontenwill, 2000, p. 287). The repeated occurrence of dysentery is also identified
by the local administration as a hindrance to population growth. In the bailiwick
of Orgelet in Jura, an administrative clerk reported that “epidemic diseases,
themselves caused by the persistence of food shortages for the last three years”
64 Another example reaching similar conclusions on the origins of demographic crises in urbanFrench can be found in the work of Deyon (1967, pp. 10–8) about the city of Amiens.
65 Children were often the most exposed population during crises. Durand (1979) shows thatin Saint-Genis-Laval during the 1693 crisis, mortality rate of the newborns reached 100 percent, whereas it capped to 25 per cent in 1697–8. See Dresch (1990) on the role of maternalmalnutrition and infant mortality rate.
34 Chapter I. The French Economy before the Revolution
were responsible for the bulk of the death toll in 1771 (Merlin, 1994, p. 44).
Individuals, however, were not always equal before epidemics. Focusing on
the social background of families, Munno demonstrates that infant mortality
was higher in families composed of manual workers, and among families
registered on poor city records in which sanitary conditions were likely to be
lower. This result contrasts previous findings in the literature. Galloway (1986a)
has studied the mortality pattern in the city of Rouen between 1681 and 1687.
Analysing demographic response to an increase in grain prices, Galloway finds
no significant difference in the magnitude or timing of mortality between rich
and poor.
5.3 Urbanisation and population density
Dupâquier (1988, p. 245) has shown that between the 1740s and the 1780s, the
growth rate of towns and cities depended on their initial size. Large cities grew
by about 38 per cent, whereas small and middling towns grew by about 22 per
cent.66 In comparison, the estimated average population growth in rural areas
was much lower, reaching only eight per cent. Urban growth, nonetheless, varied
from place to place, and if population rose by 20 per cent in Paris, those of Lyon
and Toulouse rose by 55 and 49 per cent, respectively (Laffont, 1998). Some
cities were more dynamic. Both benefiting from the development of colonial
trade, Bordeaux and Nantes grew by 144 per cent and 100 per cent, respectively
(Table I.6).67
The expansion of trade and the textile industry stimulated urban development
in medium-sized cities such as Brest and Nîmes. More generally, smaller towns
and villages also underwent population growth during this period. In Dauphiné,
although the number of towns larger than 2,000 inhabitants increased from eight
to twenty one between 1698 and 1790, urbanisation remained unchanged at 24
per cent (Favier, 1992). In Brittany, the growth of rural population kept pace
with urban population growth leaving the urbanisation rate stable at around 14
66 The development of cities, large or small, could be, nonetheless, impeded by epidemic crises.For instance, Marseille lost half of its population during the plague in 1720.
67 Figure I.7 maps the distribution of cities larger than 10,000 in 1700.
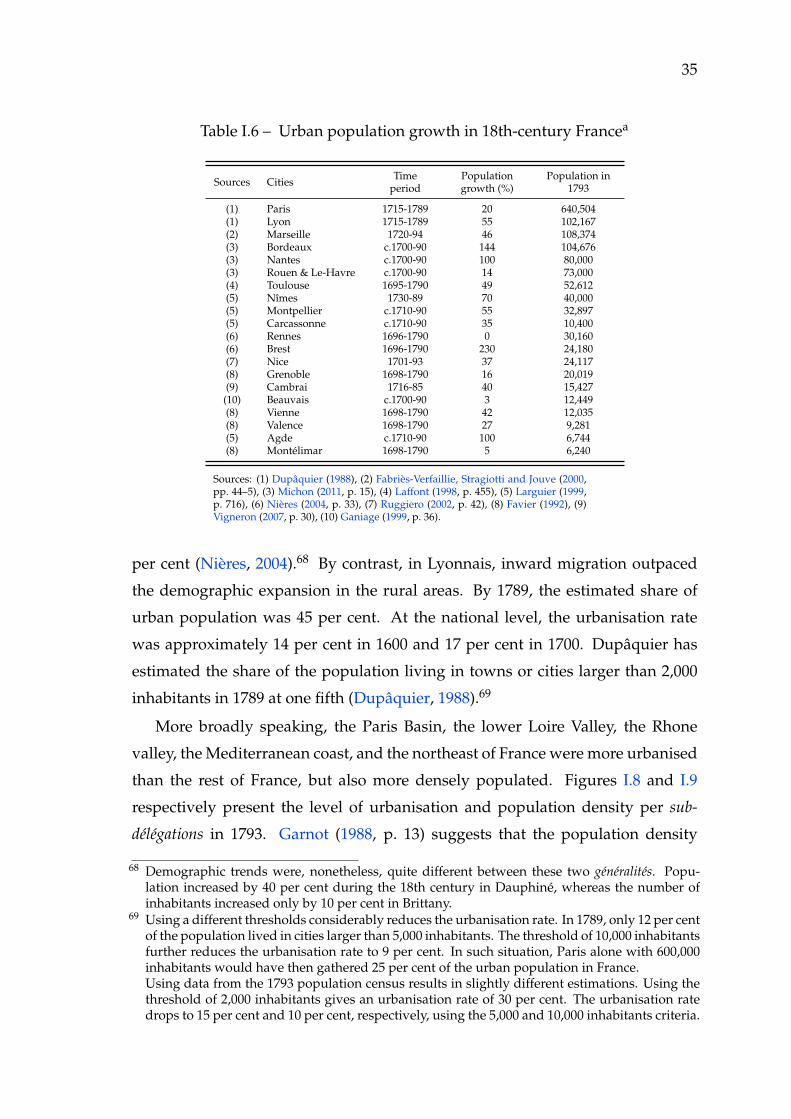
35
Table I.6 – Urban population growth in 18th-century Francea
Sources Cities Timeperiod
Populationgrowth (%)
Population in1793
(1) Paris 1715-1789 20 640,504(1) Lyon 1715-1789 55 102,167(2) Marseille 1720-94 46 108,374(3) Bordeaux c.1700-90 144 104,676(3) Nantes c.1700-90 100 80,000(3) Rouen & Le-Havre c.1700-90 14 73,000(4) Toulouse 1695-1790 49 52,612(5) Nîmes 1730-89 70 40,000(5) Montpellier c.1710-90 55 32,897(5) Carcassonne c.1710-90 35 10,400(6) Rennes 1696-1790 0 30,160(6) Brest 1696-1790 230 24,180(7) Nice 1701-93 37 24,117(8) Grenoble 1698-1790 16 20,019(9) Cambrai 1716-85 40 15,427(10) Beauvais c.1700-90 3 12,449(8) Vienne 1698-1790 42 12,035(8) Valence 1698-1790 27 9,281(5) Agde c.1710-90 100 6,744(8) Montélimar 1698-1790 5 6,240
Sources: (1) Dupâquier (1988), (2) Fabriès-Verfaillie, Stragiotti and Jouve (2000,pp. 44–5), (3) Michon (2011, p. 15), (4) Laffont (1998, p. 455), (5) Larguier (1999,p. 716), (6) Nières (2004, p. 33), (7) Ruggiero (2002, p. 42), (8) Favier (1992), (9)Vigneron (2007, p. 30), (10) Ganiage (1999, p. 36).
per cent (Nières, 2004).68 By contrast, in Lyonnais, inward migration outpaced
the demographic expansion in the rural areas. By 1789, the estimated share of
urban population was 45 per cent. At the national level, the urbanisation rate
was approximately 14 per cent in 1600 and 17 per cent in 1700. Dupâquier has
estimated the share of the population living in towns or cities larger than 2,000
inhabitants in 1789 at one fifth (Dupâquier, 1988).69
More broadly speaking, the Paris Basin, the lower Loire Valley, the Rhone
valley, the Mediterranean coast, and the northeast of France were more urbanised
than the rest of France, but also more densely populated. Figures I.8 and I.9
respectively present the level of urbanisation and population density per sub-
délégations in 1793. Garnot (1988, p. 13) suggests that the population density
68 Demographic trends were, nonetheless, quite different between these two généralités. Popu-lation increased by 40 per cent during the 18th century in Dauphiné, whereas the number ofinhabitants increased only by 10 per cent in Brittany.
69 Using a different thresholds considerably reduces the urbanisation rate. In 1789, only 12 per centof the population lived in cities larger than 5,000 inhabitants. The threshold of 10,000 inhabitantsfurther reduces the urbanisation rate to 9 per cent. In such situation, Paris alone with 600,000inhabitants would have then gathered 25 per cent of the urban population in France.Using data from the 1793 population census results in slightly different estimations. Using thethreshold of 2,000 inhabitants gives an urbanisation rate of 30 per cent. The urbanisation ratedrops to 15 per cent and 10 per cent, respectively, using the 5,000 and 10,000 inhabitants criteria.
36 Chapter I. The French Economy before the Revolution
exceed 80 inhabitants per km2 in the généralités of Alençon, Amiens, Caen, Lille,
Paris and Rouen. Population density in the généralités of Lyon, Rennes and Riom
ranged from 60 to 80 inhabitants per km2, whereas the Alps, Brittany, Provence,
southwest of France, south of Massif Central, and Poitou had population density
around or lower than 40 inhabitants per km2. Overall, the national average
population density was 53 inhabitants per km2 (Lamarre, 1983, p. 76). Once
again, however, these averages could hide significant disparities within both
fast-growing généralités and the ones lagging behind. For example, in Burgundy,
population density reached up to 74 inhabitants per km2 in the southern bailiwick
of Mâcon, whereas the most populated bailiwick in the north, Dijon, had a
density of 42 inhabitants per km2.
The development of towns and cities was driven by several factors. Increases
in colonial trade created new working opportunities in port cities (Goldstone,
2012). The improvements of the road networks eased trade and fostered the
growth of towns in which commerce and industry were expanding rapidly.
Administrative centers also developed quickly with the multiplication of pro-
fessional classes able to afford more and more crafted goods and imports. In
most areas, however, agriculture-related activities remained central and retained
large shares of the workforce. Indeed, before the era of large-scale foreign trade
in agricultural products, regional agriculture supported the growth of industrial
and urban populations detached from the land. Increasing the productivity of
the land and agricultural output was thus crucial. The introduction of New
World crops is essential in explaining the demographic expansion and the urban
rise. For instance, buckwheat was introduced as a subsistence crop in western
France as early as the 16th century and represented an essential component of
the consumption basket from the 17th century onward (Chaussat, 2018; Nassiet,
1998; Vouette, 2007).70 More broadly, Nunn and Qian (2011) estimate that
the introduction of the potato accounts for about 30 percent of the increase in
urbanisation in Europe between 1700 and 1900. In addition, potatoes have had
also a positive effect on individuals’ welfare. Analysing the size of the French
soldiers during the 18th century, they proclaim that the introduction of potatoes
70 Potato was not cultivated in Brittany and Normandy until the second half of the 18th century(Figure I.10). For more details on the timing of the introduction of the potato across France, seeAppendix I.
37
cultivation caused the average adults heights to increase by one-half inch. In
subsequent work, Cook (2014) has shown that the marginal effect of the potato
on urbanisation is even stronger if its consumption was coupled with milk intake.
In the literature, urbanisation rate and population density are often used as
proxies for economic development before the 19th century. It is assumed that the
development of a large population on a confined territory is only possible in areas
where the productivity of agriculture was high enough to allow sustaining such a
large population. High agricultural productivity was, however, not necessarily a
sign of a high standard of living among the population. As noted by Van Zanden
(1999), the distortion in the income distribution meant that living conditions
of most individuals could decline in the prosperous areas relative to the more
backward areas.
5.4 Standards of living
There is no perfect measure of standards of living in the early modern period.
Real wages and expenditure baskets are fair proxies for salaried individuals
and craftsmen, but are weakly relevant for a large share of the population
relying mainly on home farming for survival. While biological and economic
standards of living are of different nature, they are related, and biological
measures can be useful complements to conventional indicators of well-being.71
In this regard, Boix and Rosenbluth (2014, p. 4) suggest that “variance in the
heights of individuals within a given society may be used as a proxy for income
distribution”.72 Another possibility is to analyse inventories after death in order
to construct socio-economic indicators based the presence or the absence of a
71 For instance, Weir (1997) finds a positive relationship between real wages and heights in 19thcentury France.
72 Anthropometric analyses also face some limitations. Prior to the 19th century, high infantmortality rate might have resulted in selection bias, an effect possibly reinforced by thesole reliance on military conscription data. In addition, some researchers suggest that only20 per cent of the variation in individual height is due to environmental factors, such aschildhood nutrition and disease exposure (Silventoinen, 2003). Jelenkovic et al. (2011) presenta more pessimistic estimation. Using two sample of Finnish twin pairs, the authors reportthat environmental factors explained between five and twenty-three per cent of the observedvariation in height.
38 Chapter I. The French Economy before the Revolution
specific set of objects (Baulant, 1989).73
Morineau (1972) has shown that textile workers spent up to 85 per cent of their
income on food products during the second half of the 18th century in Rouen.
Half of it was devoted to bread, and the other half to complementary products
including vegetables, dairies and wine. Parker (2002, p. 71) underlines that,
though regional variations existed, population consumed mostly barley or rye
bread. Bread usually accounts for approximately 80 per cent of the total caloric
intake. For example, the Intendant General of Savoy estimated in 1771 that an
adult ate on average 1,600 grams of bread a day. Depending on the season, some
vegetables, eggs, cheese and fruits completed the diet. Introduced in the 1730s in
the Duchy, potatoes were more and more popular among peasants to an extent
that, in 1789, an administrative clerk reported that potatoes constituted “most
of the food of a large number of peasants, in particular in mountainous areas”
(Nicolas, 1979).74 In the poorest regions, chestnuts flour was used to bake bread
in good and bad years, and attracted many criticisms from contemporaries.75 In
coastal areas, fish was indeed available, but that did not make the population
forcibly better off, in particular because of the high death toll (Gouhier, 1962).
More generally, Parker (2002, p. 226) recalls that, although about one fifth of
the cultivated land was devoted to fruits and vegetables production in the late
17th century, diets were unbalanced and overwhelmingly dominated by bread.
73 Focusing on the town of Meaux, east of Paris, Baulant claims that standards of living increasedamong every category of the population between the beginning of the 17th century and theend of the 18th century. Inventories after death reveal the possession of more durable goods,such as furniture, and more superfluous objects, such as mirrors, books, and cooking utensils.Delleaux (2005) presents similar results for 18th century Hainaut. For instance, 14 per centof the inventories after death reported a mirror between 1695 and 1714. For the years 1775–95, the figure rises to 47 per cent of the inventories after death. Coal stoves and clocks werenon-existent at the turn of the 18th century, but are found in 42 and 57 per cent of inventories,respectively. Danet (2011, pp. 435–6) depicts a more contrasted picture after having analysed360 inventories after death for the city of Nantes. Between 1690 and 1790, beds represented thebulk of individuals’ wealth (nearly 39 per cent). Clothes represented about 18 per cent of thattotal, furniture 15 per cent, and linen about 10 per cent. The share of home decoration and fineryhad increased by the last decade before the French Revolution, but remained as low as one percent. Cooking tools represented five per cent of the total wealth, but their share was nearly 10per cent a century earlier.
74 In her thesis, Vouette (2007) discusses extensively the impact of the introduction from the 16thcentury onward of new grain crops, including buckwheat, maize, millet, and sorghum.
75 Bruneton-Governatori (1984, pp. 1163–9) provides an account of agronomists and state’s localagents complaining that the abundance chestnuts made people lazy, non-hard-working, andreluctant to agricultural changes or improvements. In Périgord, the shortage of chestnuts onmarkets resulted in increases of wheat prices (Beaudry, 1976, p. 44).

39
By contrast, nobility and wealthy households predominantly consumed white
bread and meat.76 For example, in 1766, the marquis de Roquefeuil in Languedoc
divided his food expenditure as follows: one third on purchases of meat,77
one fifth on poultry; one tenth on beverages; another tenth on vegetables; and
the remaining 25 per cent divided between pastries, fruits, fish, fat, and other
products (Smets, 2001). Luxury goods such as coffee, chocolate, and Malaga were
also already widely consumed among the wealthy by the end of the 17th century
in Bordeaux and in Savoy (Meyzie, 2007; Nicolas, 1979).
These differences between the wealthy and the rest of the population had
concrete impacts on the daily life. Fogel (1994) estimates that, by the end of
the 18th century, the bottom 10 per cent of the labor force lacked the energy for
regular work, while the next 10 per cent could only do three hours of daily light
work. With daily calorie intake amounting to 3,672 kcal, the top decile consumed
almost three times more calories than the bottom decile (1,310 kcal). These
differences are consistent with the findings of Komlos (2003) who has analysed
trends in stature among French soldiers during the 17th and 18th century. On
average, men with an upper-class background were 3.6 centimetres taller than
textile workers, and 3.1 centimetres taller than individuals with an agriculture
background. These differences rooted in differences of access to balanced diet,
and more generally to food, during childhood and adolescence.78 In the 1790s,
the difference in stature between the students attending the École Polytechnique,
an elite military school, and the rest of the population embodies the social
inequalities of French society. On average, the former were seven centimetres
taller than the latter (Komlos, 2003, p. 185). Fogel (1994, p. 40) has estimated the
daily caloric intake at 2,270 kcal, far below the 3,000 kcal required by Morineau
in his household expenditure estimates for a normal working man. Overall,
Fogel calculates that, given the low per capita food supply, the average Body
Mass Index of Frenchmen, whose average height was 161 centimetres would
have been 18, a figure that is low compared with twenty-first century standards.
Once again, however, large regional variations existed. At the national scale,
76 Weir (1997) also notices a large urban-rural gap in meat consumption.77 Veal and mutton represented both one fourth of the meat expenditure, whereas beef and hare
amounted to one sixth each. The remainder was divided between lamb, pork and horse meat.78 Because they were relying mostly on the consumption of bread, diets often presented a deficit in
many important nutrients. Protein- and calcium-rich foods are central for height development.

40 Chapter I. The French Economy before the Revolution
the low stature first observed reflects the crisis of the 17th century, whereas
the 4 cm increase in stature noticed during the first half of the 18th century is
anchored to an “improved weather [that] had a beneficial impact on agricultural
conditions as well as a direct effect on biological processes” (Komlos, 2003,
p. 159).79 Details about the place of birth in the military records allow Komlos to
estimate differences in biological living standards between various geographical
origins. All over the period, men were taller in the northeast of France and
Mediterranean areas, and shorter in the center and in the west of the country.
For instance, in 1745, military recruits originating from Hainault in the northeast
were on average 3.5 cm taller than the ones born in Auvergne or Poitou. No
regional catch-up nor divergence occurred, and no urban penalty existed except
in Paris where men were persistently two to three centimetres shorter.
Trends in stature thus mirror both the social inequalities depicted by anal-
yses of tax rolls or daily food consumption patterns, and the long-term living
standards as shown by the evolution of real wages. Local differences origi-
nated in different demographic contexts and distinct agricultural characteristics.
Proximity to large cities and trading ports, geographical features, customs and
inheritances from the past, and exogenous shocks are all factors that contributed
to the significant regional differences observed in the agricultural landscape of
France during the 17th and the 18th century (Lemarchand, 2008).
6 Economic situation
6.1 Agricultural progress
Early modern France offers a picture of a pre-industrial society characterised
by a rural economy, in which about 70 per cent of the population lived in
the countryside. The variety of French geography made rural society unequal.
Appleby (1979, p. 870) noted that “it is foolhardy to speak of ‘French agriculture’
79 For a detailed analysis of the relationship between climatic conditions, wheat prices andchanges in stature, see Ewert (2004). Yet, a decline in stature occurred during the second halfof the 18th. It was not specific to France, and similar trends are observed in Bavaria, Hungary,Northern Italy, and the United Kingdom (Heyberger, 2012, p. 261). Heyberger suggests thatthis phenomenon is explained by a general decline in nutritional quality, due to a mountingpopulation pressure and falling temperature, affecting agrarian economies all over Europe.
41
when in fact there were many regional agricultural systems”.80 For instance, the
relatively egalitarian pastoral uplands of Auvergne had few things in common
with the vast grain-growing plains surrounding Paris and Toulouse, in which
economies of scale led to the creation of a farmer elite and an army of landless
agricultural workers. In addition to the general trend in the agricultural sector,
these geographic differences had a long-term impact on the social structure of
the rural Third Estate, and on the expansion of market-oriented agriculture,
innovation, and wealth accumulation.
The debate on the retardation of French agriculture has crystallised the
research in rural history for a long time (Hoffman, 1988; O’Brien, 1996).81
Compared to English agriculture, French agriculture, apart from the Paris Basin,
is believed to lag behind because the shift to a more land and animal intensive
agriculture was slower, the financial means for investment in new equipment
and building were lacking, and total factor productivity was lower.82 Parker
(2002, p. 50) pessimistically summarises the situation by stating that “nowhere
did innovative practices or technical knowledge come together in a continuous
endeavour to transform agricultural activity, nowhere did they lead to systematic
experimentation with crop rotation cycles, the incorporation into them of artificial
meadows or an interest in cattle-rearing”. Hoffman (1986) has identified some
of the blockages slowing down agricultural progress. By allowing an easy
extraction of any newly created agricultural surplus, the tax system hindered
agricultural development. In subsequent work, Hoffman also demonstrates
how institutional failure prevented to discourage individuals strategic behavior,
80 One common characteristic of these system was the persisting difficulties to store grains overlong periods without spoiling them. Little progress had been achieved until the early 19thcentury (Bourde, 1967, pp. 934–45).
81 That no agricultural revolution occurred during the 18th century despite increasing yields hasbeen forcefully argued by Morineau (1971). Alternatively, Appleby (1979) has suggested thatEngland had a better equilibrium than France between spring and winter cereals providinga higher degree of protection against weather shocks. This diversification explains the earlydisappearance of subsistence crises in England, and their persistence in France until the mid18th century. For the most up to date literature review on the immobilism versus dynamism ofthe French agriculture, see Jones (2012).
82 For example, O’Brien (1996, p. 219) suggests that the growth rate of output per hectare weresimilar in both England and France between 1700 and 1850. France, however, relied on amore extensive used of the agricultural workforce to increase yields per hectare whereas inEngland, capital-intensive gains explain this trend. By contrast, Hoffman (1986) has arguedthat as response to the growing agricultural workforce, peasants often sought work in cities orshifted to labor-intensive cultivation, such as viticulture, increasing the value-added per hectareand permitting to make profit even on small plots of land.

42 Chapter I. The French Economy before the Revolution
thereby increasing the difficulty to overcome grazing rights so as to implement
enclosures (Hoffman, 1988).83 Similarly, Rosenthal (1990) claims that, before the
Revolution, profitable irrigation projects in Provence were not developed because
the cost of rearranging property rights was prohibitive due to the complexity
created by the division of authority over rights, and the fact that numerous
villages sought to extract rents from project promoters.
Over the 18th century, trends in stature and real wages indicate that living
conditions of the peasantry did not improve, or even deteriorated. Poussou (1999,
pp. 270–6) argues that natural conditions often prevented substantial improve-
ments in the agriculture system so that the comparison with England may not
be relevant. Even though few changes occurred in remote mountainous areas or
marshy areas, some regions took advantage of these geographic characteristics to
develop an original model of agriculture. In Nivernais, southeast of Paris, and in
Dombes, east of Lyon, peasants developed marshes into farm ponds to raise fish
that were sold in cities. In good years, a pond could yield as much as £4,000 of
income (Brunet, 2014; Thuillier, 1965).84
Analysing the evolution of the tithe across several regions, Goy and Ladurie
(1982) have suggested that wheat yields improved by 20 to 40 percent between
1650 and 1790. These rates were by no means lower than the estimates realised
by Moriceau and Postel-Vinay (1992) in the Paris Basin, leading Poussou (1999) to
challenge the assertion that labour-intensive agriculture was backward. Hoffman
(2000) also disclaims the argument of French backwardness, and argues that
French agriculture was not stagnant in all times and places prior to the Industrial
Revolution. Comparing total factor productivity across regions, Hoffman shows
that productivity at least grew in Beaujolais, in Normandy, in the surroundings of
Toulouse, and in the Paris Basin. Le Goff and Sutherland (2000) also investigate
the question of the evolution of total factor productivity in three different places:
Le Mans, Rouen, and Compiègne. After showing that each area heavily spe-
cialised in one type of production and responded to different market incentives,
83 In his analysis of sharecropping, Hoffman (1982) also notes that many historians have blamedrigid short-term share contracts for reducing incentives for investment and stifling technologicalchange. Hoffman disagrees with this statement, and considers that the development of share-cropping helped to reduce risks for both landlords and tenants promoting thus investments.
84 Poussou, nonetheless, acknowledges that historians traditionally emphasised that agriculturalprogress was slow, if not non-existent, in areas such as Sologne, Vivarais, and Briançonnais aswell as in the plains of south Burgundy, center Brittany, and in some parts of Languedoc.
43
Le Goff and Sutherland demonstrate that from the mid 18th century onward,
all regions in their data witnessed the beginnings of an agricultural revolution
as shown by the rise in total factor productivity. For instance, when prices in
Paris were high, total factor productivity increased significantly two years later in
Compiègne. Hoffman also stresses the role of Paris in creating incentives.85 Only
there, he claims, the spatial aggregation of demand was strong enough to create
an urban demand stimulus fostering agricultural investments and productivity
gains.86
Grantham (2007) has emphasised the importance of distance to large cities
in understanding the disparities in yields and labour productivity across French
regions. Innovations and high yields occurred mainly in areas exposed to
growing urban demand, including the north of France and the south coast of
Brittany, which often shipped grain to Bordeaux and its surroundings where
wine production predominated. For instance, Lower Normandy and Limousin
specialised in cattle breeding and dairy products to meet the ever-expanding
demand of the Parisian market. Such commerce required risk-taking behaviours
and larger roads that can invert things, such as rest stations, given that herds
of oxen needed to reach Paris on foot without losing too much weight on
the way (Garnier, 1999). In 1737, 58 per cent of the cattle entering the city
originated from Normandy, and 16 per cent from Limousin.87 Similarly, farmers
in Hainaut reacted to the profitable prospects created by the woollen and the
cloth-making industries by shifting to intensive sheep breeding (Delleaux, 2010;
Vanlandtschoote, 2008).88
By contrast, high transportation costs and substantial fixed costs involved in
storing grain surpluses and preparing them for the distant market limited the
interest in grain exportation from remote areas, which thus lacked incentives
85 On the link between market prices and the rise in agricultural productivity, see also Grantham(1989).
86 Hoffman further demonstrates that peasants, far from focusing on self auto-sufficiency, wereoften engaged in at least one market may not be grain, but labour, rental or credit markets.
87 Poussou (1999, pp. 288–92) provides a description of the development market-oriented produc-tion to answer the growing urban demand in a specific set of products.
88 Musset (2011) describes how consumer demand in urban centres prompted changes in thevineyards of Champagne at the end of the 17th century. Winegrowers began to invest heavilyin new equipment, and produced higher quality white wine. By 1789, 40 per cent of the totalproduction was bottled, whereas this practice was nearly non-existent before 1700.
44 Chapter I. The French Economy before the Revolution
to shift to intensive farming.89 In turn, they reduced available agricultural
surpluses, making unprofitable the establishment of permanent haulage facilities
and perpetuating high transportation costs in peripheral areas.90 In addition
to these elements, many obstacles, including seigneurial tolls, internal customs
duties, and restricting food laws, persisted until the French Revolution, thereby
impeding the full integration of the French grain market and creating long lasting
regional disparities in cereal prices.
6.2 Regional disparities
Jones reports that, at the national level, about 75 per cent of the land was
used for grain production, whereas grassland covered around 14 per cent of the
territory by the end of the 18th century.91 These aggregate figures hide large
differences in the agricultural landscape across regions (Jones, 2012).92 These
differences were interlinked with discrepancies social organisation, including
local customs, distribution of ownership, cultivation methods and types, and
the level of taxes. In the pays de grandes cultures in northern and northeastern
France, open-fields were overwhelmingly dominant, and enclosures reserved to
a set of fodder crops such as clover and alfalfa. Vast plains, nearly no wastelands
and forests, three-year crop rotation, near-absence of fallow, nucleated villages,
market-oriented large farms, sharecropping, a handful of wealthy cultivators,
and numerous landless agricultural labourers were the main features of these
89 This trend was, however, not completely unalterable. In the early 18th century, peasants in Juraand Franche-Comté began to develop large co-operatives, called fruitières, in order to mergetogether their milk production and storage facilities, and make marketable cheese then tradedin major French cities. Pressed cooked cheeses were not only easy to store but also to transport,and enabled peasants to draw additional income to buy other products on markets and meetstate tax obligations and seigneurial dues (Latouche, 1938; Mélo, 2015). See also Delleaux (2015)who studies the personal diary of a wealthy farmer in Genevois, an area characterised bypolyculture and small-scale farming. Delleaux describes how he responded to changing habitsin urban market, but also to new recommendations published in agronomic books.
90 For instance, the intendant of Auvergne observed in 1770 that “mountains make communica-tion so difficult that transportation costs are as high between Clermont and Aurillac as betweenClermont and Paris” (Leymarie, 1956, p. 301). The distance between Clermont-Ferrand andAurillac is 156 kilometres, whereas the distance between Clermont-Ferrand and Paris is 423kilometres.
91 In comparison, it is believed that 30 per cent were devoted to grain production. Meadowsrepresented 57 per cent of the English agricultural land, leaving thus much more space forintensive husbandry and its positive byproducts such as manure.
92 For a literature review, see Terrier and Muchembled (1998).
45
regions.93 In his study of rural servanthood, Hayhoe (2012) suggests that, on
average, regions characterised by market-oriented farming had a larger number
of rural domestic workers as opposed to small-scale subsistence farming areas,
wherein work could be accomplished by parents and a few relatives. O’Brien
(1996, pp. 232–3) notes that this structure of large agricultural estates resulted
in a slow disappearance of the majority peasants into the ranks of dependent
labour, increasing their exposure to food crises and surges in prices. In years
of bad harvest, the workforce needed to harvest the fields was smaller, leaving
numerous people with a meager income with which to survive.
By contrast, the pays de petites cultures from the south of the Loire valley to
the Mediterranean sea were composed of a variety of landscapes comprising
few areas of open-field, uplands and mountains mainly devoted to agro-pastoral
activities, some predominantly viticultural regions,94 and for a large part small
and irregularly shaped enclosed fields. Fragmentation of agricultural land,
mostly auto-consumed rather than market-oriented cultivation, polyculture,
biennial rotation, extensive use of fallow, near-absence of fodder crops, and large
peasant ownership of scattered pieces of land were general characteristics of the
southern regions (Terrier and Muchembled, 1998, pp. 57–8).95 In these regions,
agricultural diversification could lessen the impact of bad weather on agricultural
yields, and partially reduced the frequency of harvest failures. The focus on
local self-sufficiency minimised the risk related to market fluctuations and crop
scarcity. For instance, Goubert asserts that pastoral communities practicing
extensive agriculture in Massif Central were better able to cope with climatic
shocks and famine than intensive grain-growing areas such as the Beauvaisis
(Goubert, 1960). Yet, in these areas too, the standard of living of significant shares
of the population, such as producers of specialised commodities, depended on
the terms of trade between their products and cereals. Although better safety nets
93 For a detailed description of the agricultural development in the Paris Basin, see Moriceau(1994).
94 According to Arthur Young, who travelled across France between 1787 and 1789, up to six percent of the land in the south was devoted to viticulture (Jones, 2012). Grantham (1993, p. 494)has estimated that 2.3 millions individuals, which represented about eight per cent of the totalpopulation, were engaged in wine production.
95 In the pastoral northwest, there was a somewhat intermediary situation with market-orientedcattle breeding, family farms requiring few hired labourers, and modest income disparities.Brittany was famous for its enclosures.
46 Chapter I. The French Economy before the Revolution
against harvest failures, such as rural crafts, seasonal migration, and forest food
products (chestnuts, roots, berries, and the like), existed, vulnerability remained
high, in particular in remote areas in which seasonal accessibility was low and
circulation of grains difficult (Terrier and Muchembled, 1998).
In addition to these broad characteristics, local conditions sometimes shaped
very different agricultural practices from village to village. In the rural south
of Burgundy, Saint-Jacob (1935) reports the existence of at least three different
types of crop rotation system. An alternation of wheat and fallow was practised
around the village of Franxault. In the loamy lands along the Saône river, a
biennial rotation with wheat and spring crops was adopted, whereas a triennial
regime mixing wheat, spring crops and fallow was in use in the neighbouring
plains of Bresse. Differences also emerged between the types of agriculture
within local communities. Durand (1979) has documented the differences in land
occupation between vineyard villages in Beaujolais, north of Lyon. Some with
excellent sunlight exposure entirely specialised in grape growing, whereas others
chose a more balanced production comprising both crops and grapes. In eastern
Roussillon, about one fourth of the parishes devoted more than 40 per cent of
their arable land to vineyards in 1730. By contrast, one fourth of the parishes
devoted less than 10 per cent to grapes, but had on average four times more
livestock per household (Larguier, 2010, p. 174).
Proto-industrialisation also contributed to shape different landscapes at the
local level. In addition to disparities due to the differences in soil quality,96 the
expansion of viticulture and the textile industry affected the distribution of lands
as well as the social composition of communities in Vendômois (Vassort, 1995).
In Perche, hemp cloth production, which was quickly expanding with colonial
trade, attracted more and more individuals in Perche, in particular around the
district of Mortagne. To respond to the expanding demand in flax and hemp,
the southern districts specialised in their production, and by 1789, these products
amounted to 15 per cent of the total gross agricultural income (Cailly, 2000).97
96 Barley was the spring crop in the northern districts, but oat was sown in the sandy south.97 Comparable situations could be found almost everywhere. For example, in Limousin, grapes
were widely cultivated in the Brive basin, but nearly nonexistent in the entire Marche. Maizewas in use only in the south, whereas planted chestnut trees covered up to 30 per cent of theland in the east and the north (Delhoume, 2007, p. 247). Teisseyre-Sallmann (1995, p. 167) reportsthat 90 per cent of the 7,000 looms inventoried in Lower Languedoc in 1708 were located in theeastern Cévennes.
47
Thus, even within the same region, exposure and vulnerability to epizootic,
market volatility, national and international trade, and climatic risks could vary
greatly from one place to another.
6.3 Proto-industrialisation
Between 1720 and 1780, colonial trade multiplied by ten, while trade as a whole
increased by a factor of five. This expansion stimulated urban growth in colonial
trade port cities, such as Bordeaux and Nantes, as well as in their surroundings
wherein the production of tradable and consumption goods expanded (Cheney,
2014).98 Studying the role of urban demand through the lens of market size and
aggregate purchasing power, Daudin (2010) shows that textile and high value-to-
weight goods had access to several domestic markets at least as large as England
as a whole. Drawings on this result, Daudin argues that the size-innovation
relationship fails to explain the course of the Industrial Revolution. Gragnolati,
Moschella and Pugliese (2014) further investigate why the Industrial Revolution
happened first in England and not in France. The authors refine Daudin’s
analysis by taking into account the average income level and its distribution
across the population. Their results suggest that wealth concentration in France
prevented substantial shares of the population from affording non-subsistence
goods, thereby not creating sufficient economies of scale to justify the diffusion of
technological innovation, such as the spinning jenny. In line with this argument,
Sharp and Weisdorf (2012) have contended that the decline in real wages as
well as their volatility led individuals in Paris to work longer to make ends
meet. In contrast to England, the hardships faced by French workers, the authors
argued, reduced their consumption opportunities and precluded any demand-
side stimulus. By contrast, Allen (2009) focuses on the supply side and suggests
that spinning jennies more than paid for themselves in England wherein wages
for hand spinning were high. In France, low wages in the textile industry made
the development of jenny spinning economically not advantageous. Alterna-
98 Textile represented the bulk of this industrial production. By 1788, it is estimated that textileamounted to two third of the gross industrial product, whereas metallurgy amounted to 15per cent (Chaplain, 1984, p. 24). Within textile, woollens were the stellar products representingabout 26 per cent of the total gross industrial product, followed by silk (14 per cent), linen (13per cent), and cotton (12 per cent). For a review of the growth sector by sector, see Daudin (2001,pp. 17-38).
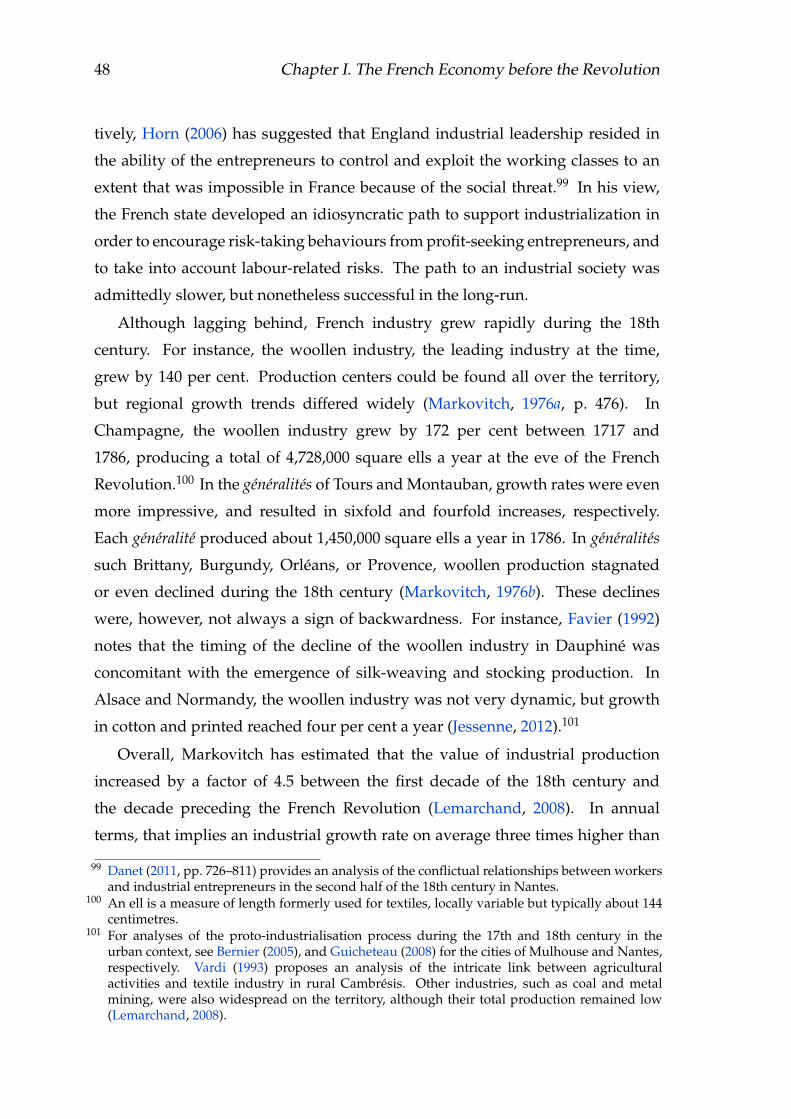
48 Chapter I. The French Economy before the Revolution
tively, Horn (2006) has suggested that England industrial leadership resided in
the ability of the entrepreneurs to control and exploit the working classes to an
extent that was impossible in France because of the social threat.99 In his view,
the French state developed an idiosyncratic path to support industrialization in
order to encourage risk-taking behaviours from profit-seeking entrepreneurs, and
to take into account labour-related risks. The path to an industrial society was
admittedly slower, but nonetheless successful in the long-run.
Although lagging behind, French industry grew rapidly during the 18th
century. For instance, the woollen industry, the leading industry at the time,
grew by 140 per cent. Production centers could be found all over the territory,
but regional growth trends differed widely (Markovitch, 1976a, p. 476). In
Champagne, the woollen industry grew by 172 per cent between 1717 and
1786, producing a total of 4,728,000 square ells a year at the eve of the French
Revolution.100 In the généralités of Tours and Montauban, growth rates were even
more impressive, and resulted in sixfold and fourfold increases, respectively.
Each généralité produced about 1,450,000 square ells a year in 1786. In généralités
such Brittany, Burgundy, Orléans, or Provence, woollen production stagnated
or even declined during the 18th century (Markovitch, 1976b). These declines
were, however, not always a sign of backwardness. For instance, Favier (1992)
notes that the timing of the decline of the woollen industry in Dauphiné was
concomitant with the emergence of silk-weaving and stocking production. In
Alsace and Normandy, the woollen industry was not very dynamic, but growth
in cotton and printed reached four per cent a year (Jessenne, 2012).101
Overall, Markovitch has estimated that the value of industrial production
increased by a factor of 4.5 between the first decade of the 18th century and
the decade preceding the French Revolution (Lemarchand, 2008). In annual
terms, that implies an industrial growth rate on average three times higher than
99 Danet (2011, pp. 726–811) provides an analysis of the conflictual relationships between workersand industrial entrepreneurs in the second half of the 18th century in Nantes.
100 An ell is a measure of length formerly used for textiles, locally variable but typically about 144centimetres.
101 For analyses of the proto-industrialisation process during the 17th and 18th century in theurban context, see Bernier (2005), and Guicheteau (2008) for the cities of Mulhouse and Nantes,respectively. Vardi (1993) proposes an analysis of the intricate link between agriculturalactivities and textile industry in rural Cambrésis. Other industries, such as coal and metalmining, were also widespread on the territory, although their total production remained low(Lemarchand, 2008).
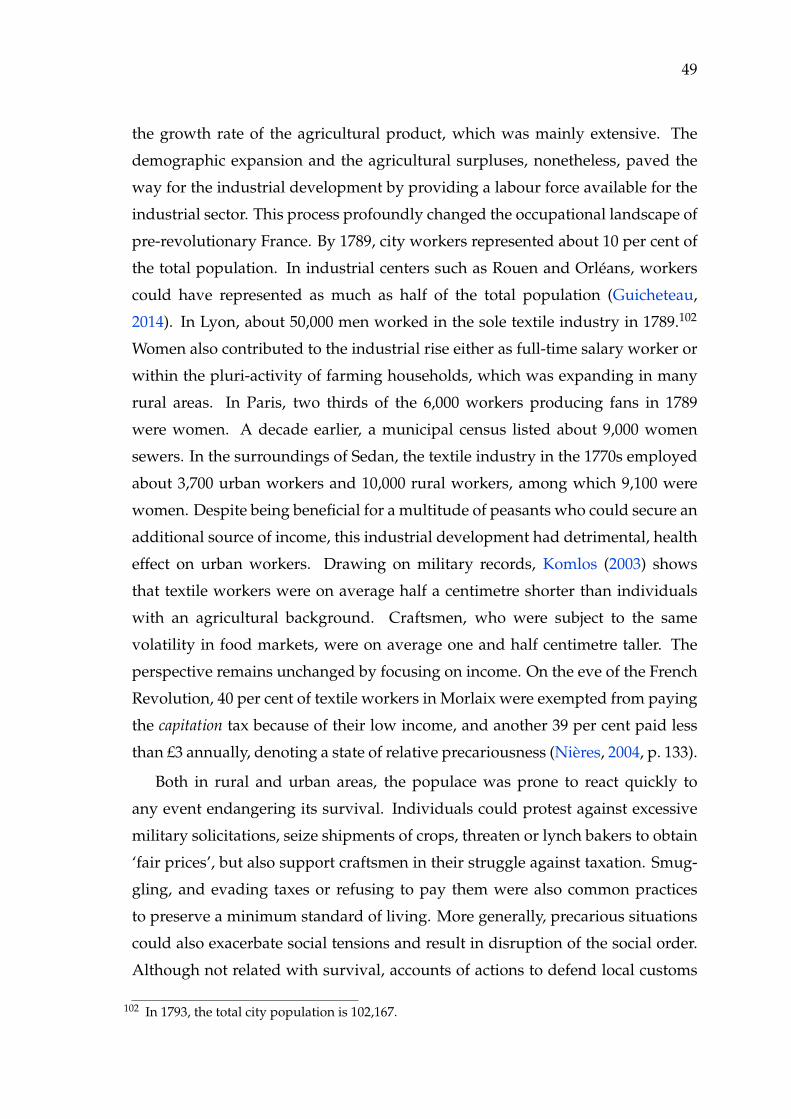
49
the growth rate of the agricultural product, which was mainly extensive. The
demographic expansion and the agricultural surpluses, nonetheless, paved the
way for the industrial development by providing a labour force available for the
industrial sector. This process profoundly changed the occupational landscape of
pre-revolutionary France. By 1789, city workers represented about 10 per cent of
the total population. In industrial centers such as Rouen and Orléans, workers
could have represented as much as half of the total population (Guicheteau,
2014). In Lyon, about 50,000 men worked in the sole textile industry in 1789.102
Women also contributed to the industrial rise either as full-time salary worker or
within the pluri-activity of farming households, which was expanding in many
rural areas. In Paris, two thirds of the 6,000 workers producing fans in 1789
were women. A decade earlier, a municipal census listed about 9,000 women
sewers. In the surroundings of Sedan, the textile industry in the 1770s employed
about 3,700 urban workers and 10,000 rural workers, among which 9,100 were
women. Despite being beneficial for a multitude of peasants who could secure an
additional source of income, this industrial development had detrimental, health
effect on urban workers. Drawing on military records, Komlos (2003) shows
that textile workers were on average half a centimetre shorter than individuals
with an agricultural background. Craftsmen, who were subject to the same
volatility in food markets, were on average one and half centimetre taller. The
perspective remains unchanged by focusing on income. On the eve of the French
Revolution, 40 per cent of textile workers in Morlaix were exempted from paying
the capitation tax because of their low income, and another 39 per cent paid less
than £3 annually, denoting a state of relative precariousness (Nières, 2004, p. 133).
Both in rural and urban areas, the populace was prone to react quickly to
any event endangering its survival. Individuals could protest against excessive
military solicitations, seize shipments of crops, threaten or lynch bakers to obtain
‘fair prices’, but also support craftsmen in their struggle against taxation. Smug-
gling, and evading taxes or refusing to pay them were also common practices
to preserve a minimum standard of living. More generally, precarious situations
could also exacerbate social tensions and result in disruption of the social order.
Although not related with survival, accounts of actions to defend local customs
102 In 1793, the total city population is 102,167.

50 Chapter I. The French Economy before the Revolution
and communal rights, to hinder the implementation of state reforms, and to
free prisoners are abundant in the judicial and administrative archives of early
modern France (Nicolas, 2002).
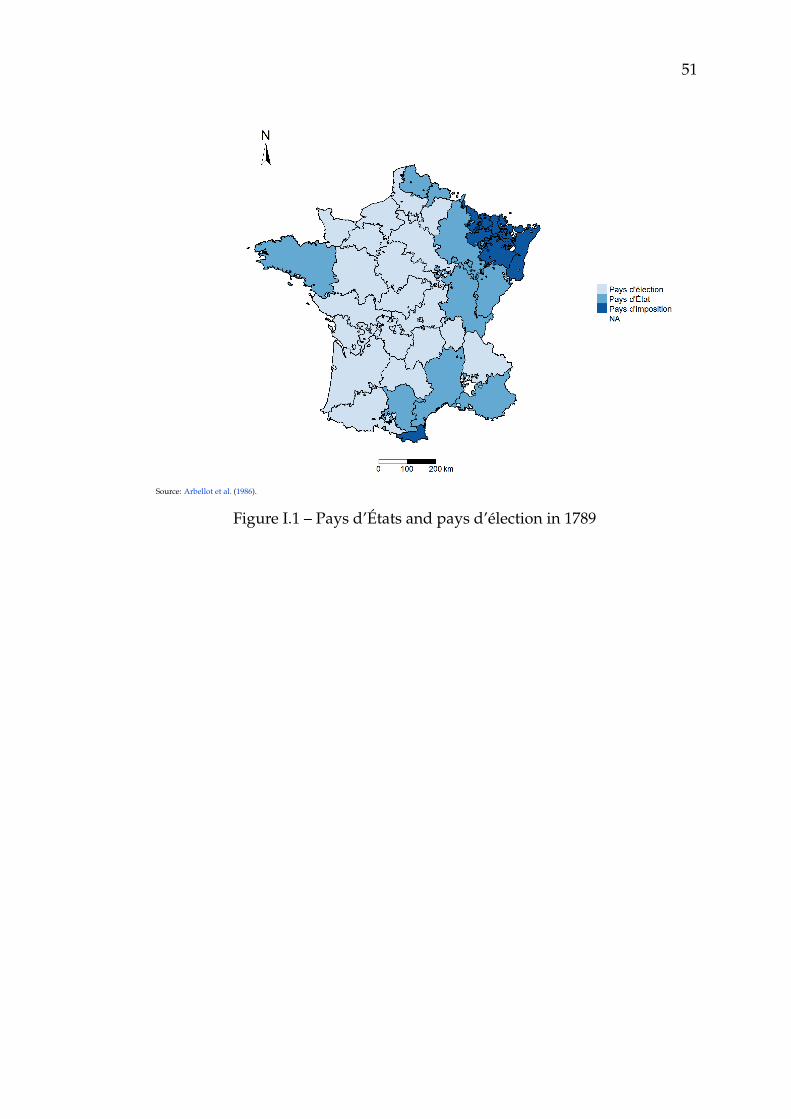
51
Source: Arbellot et al. (1986).
Figure I.1 – Pays d’États and pays d’élection in 1789

52 Chapter I. The French Economy before the Revolution
Source: BnF, département Cartes et plans, GED-6510, Cartes des gabelles (1781).
Figure I.2 – Salt tax (gabelle) in 1781
Source: BnF, département Cartes et plans, GED-16439, Cartes des Traites (1760).
Figure I.3 – French internal trade zones (traites), c. 1760
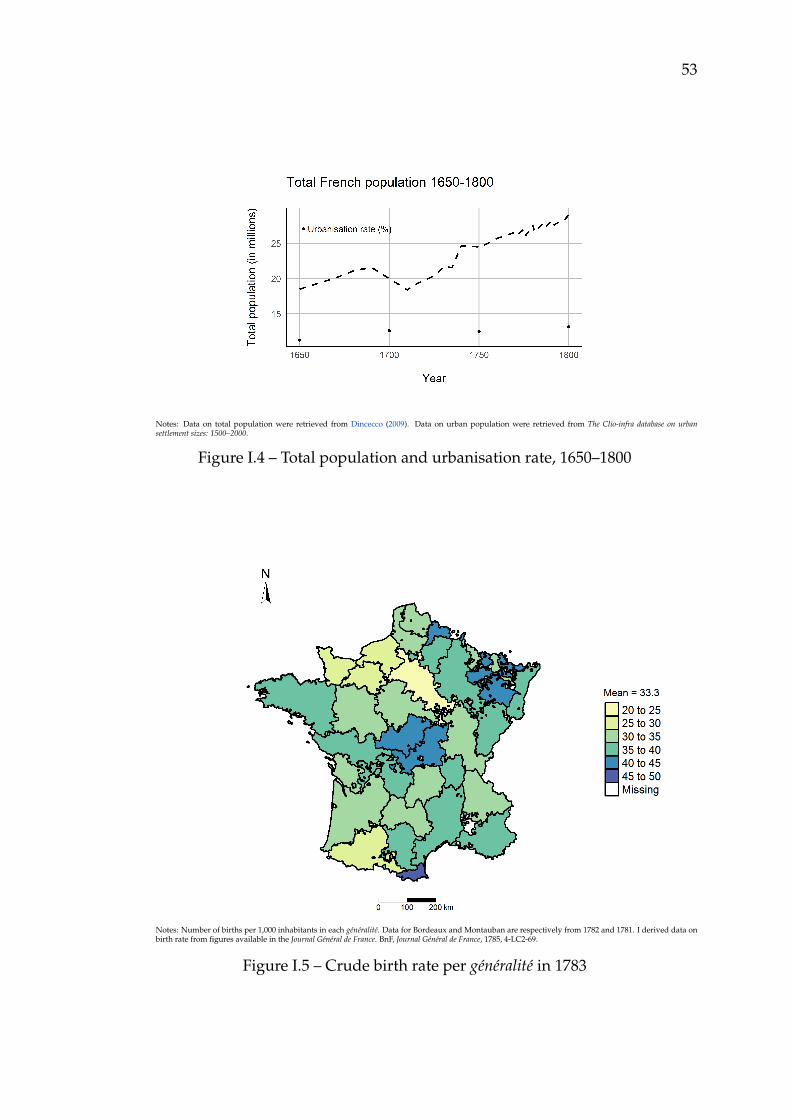
53
Notes: Data on total population were retrieved from Dincecco (2009). Data on urban population were retrieved from The Clio-infra database on urbansettlement sizes: 1500–2000.
Figure I.4 – Total population and urbanisation rate, 1650–1800
Notes: Number of births per 1,000 inhabitants in each généralité. Data for Bordeaux and Montauban are respectively from 1782 and 1781. I derived data onbirth rate from figures available in the Journal Général de France. BnF, Journal Général de France, 1785, 4-LC2-69.
Figure I.5 – Crude birth rate per généralité in 1783
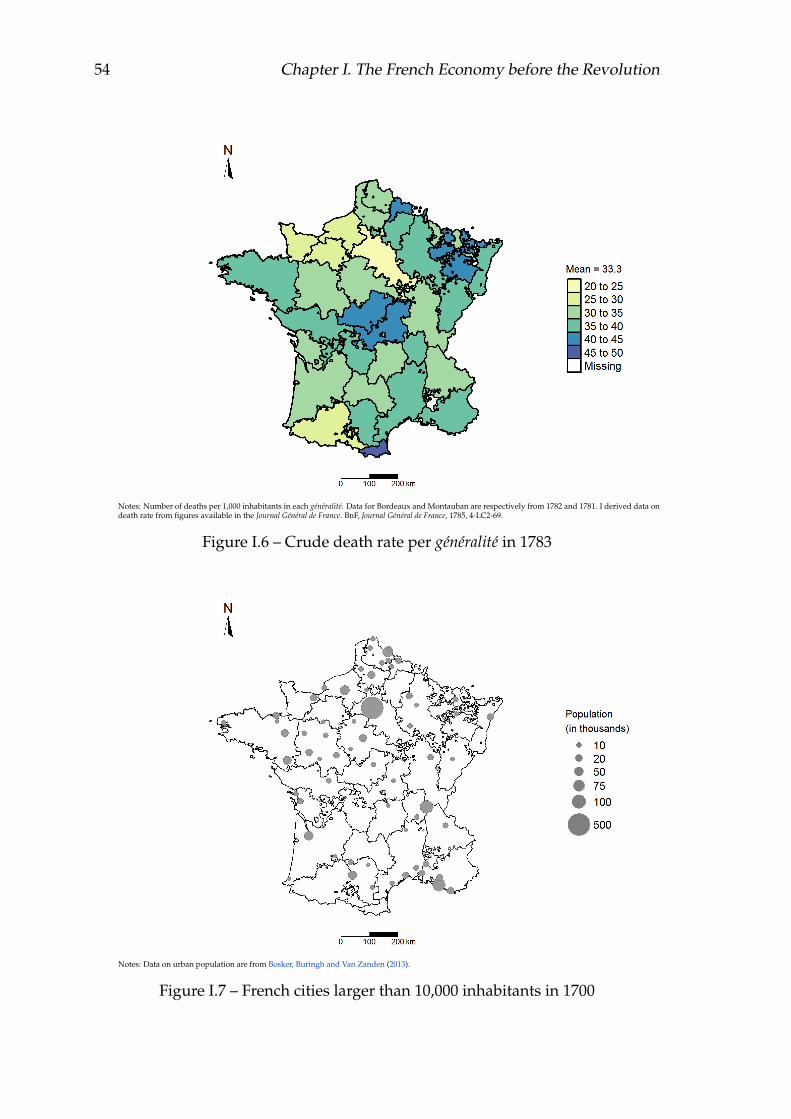
54 Chapter I. The French Economy before the Revolution
Notes: Number of deaths per 1,000 inhabitants in each généralité. Data for Bordeaux and Montauban are respectively from 1782 and 1781. I derived data ondeath rate from figures available in the Journal Général de France. BnF, Journal Général de France, 1785, 4-LC2-69.
Figure I.6 – Crude death rate per généralité in 1783
Notes: Data on urban population are from Bosker, Buringh and Van Zanden (2013).
Figure I.7 – French cities larger than 10,000 inhabitants in 1700

55
Notes: Urbanisation is calculated using a threshold of 2,000 inhabitants. Population data are from the Geopeuple project (http://geopeuple.ign.fr/).
Figure I.8 – Urbanisation rate (%) per subdélégation in 1793
Notes: Population data are from the Geopeuple project (http://geopeuple.ign.fr/).
Figure I.9 – Population density per subdélégation in 1793

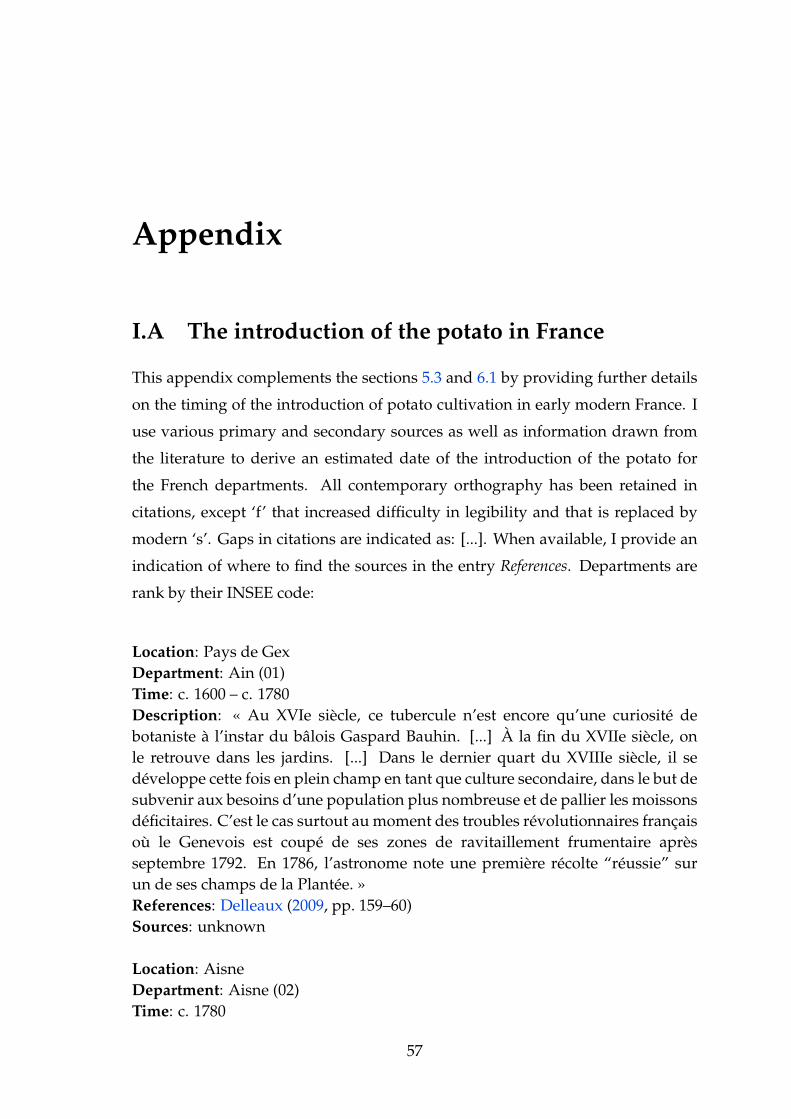
Appendix
I.A The introduction of the potato in France
This appendix complements the sections 5.3 and 6.1 by providing further details
on the timing of the introduction of potato cultivation in early modern France. I
use various primary and secondary sources as well as information drawn from
the literature to derive an estimated date of the introduction of the potato for
the French departments. All contemporary orthography has been retained in
citations, except ‘f’ that increased difficulty in legibility and that is replaced by
modern ‘s’. Gaps in citations are indicated as: [...]. When available, I provide an
indication of where to find the sources in the entry References. Departments are
rank by their INSEE code:
Location: Pays de GexDepartment: Ain (01)Time: c. 1600 – c. 1780Description: « Au XVIe siècle, ce tubercule n’est encore qu’une curiosité debotaniste à l’instar du bâlois Gaspard Bauhin. [...] À la fin du XVIIe siècle, onle retrouve dans les jardins. [...] Dans le dernier quart du XVIIIe siècle, il sedéveloppe cette fois en plein champ en tant que culture secondaire, dans le but desubvenir aux besoins d’une population plus nombreuse et de pallier les moissonsdéficitaires. C’est le cas surtout au moment des troubles révolutionnaires françaisoù le Genevois est coupé de ses zones de ravitaillement frumentaire aprèsseptembre 1792. En 1786, l’astronome note une première récolte “réussie” surun de ses champs de la Plantée. »References: Delleaux (2009, pp. 159–60)Sources: unknown
Location: AisneDepartment: Aisne (02)Time: c. 1780
57
58
Description: « Les racines cultiveés en grand sont la carotte, la pomme de terreet la betterave ; elles servent à la nourriture des bestiaux : la pomme de terre,sur-tout dans les années de disette, offre aussi à la classe indigente une ressourceprécieuse ; sa culture a beaucoup augmenté depuis vingt à trente ans. On sèmefort peu la rave ou navet plat. »References: Miroy-Destournelles (1814, p. 26)Sources: BnF, NUMP-16043
Location: LenaxDepartment: Allier (03)Time: c. 1770Description: « Il résulte d’un acte de société, reçu Bonnet notaire, que quatreans avant la mort de Louis XV, le 27 janvier 1771, dans un petit village situédans une partie retirée du Bourbonnois, la récolte de pommes de terre étoitabondante, puisque un nommé Jean Parrant, laboureur de la paroisse de Loddes,achetait de Pierre Gacon, demeurant à Lenax : “Cent poinçons de Pommes deterre dites communément Tartoufles à raison de six francs le poinçon de 200 litresenviron”. »References: Meilheurat (1868, p. 292)Sources: unknown
Location: diocèse d’EmbrunDepartment: Hautes-Alpes (05)Time: c. 1730Description: « Un des mets le plus oridnaire pour les gens de la cmapagne, &même pour ceux des villes qui n’ont pas de facultés pour s’en procurer d’autres,ce sont les pommes de terre, a qui dans le pays on donne le nom de truffes,quoi qu’elles soient bien différentes des truffes noires qui sont si estimées surles tables des riches. Ces pommes de terre font devenues communes depuis unecinquantaine d’années dans la plupart des endroits du diocese d’Embrun. On enplant & on en recueille beaucoup dans le Brainçonnois, dans l’Embrunois & dansla vallée de Seyne. [...] Il a paru ces dernières années plusieurs écrits impriméspar l’ordre de MM. les Intendans des provinces, pour prouver que ces pommes deterres peuvent être d’une grande utilité aux pauvres des paroisses de la campagnelorsqu’ils n’ont pas de bled pour faire du pain. »References: Albert (1783, Vol. I, p. 99)Sources: BnF, NUMM-9643168
Location: GapDepartment: Hautes-Alpes (05)Time: c. 1730Description: Paiement fait par l’hôpital de Gap, le 20 février 1730, pour 2
59
quintaux et 22 livres de pommes de terre payés 5 1. 17 s. 6. d. En septembre1773 le quintal valait 2 l. 13 sols.References:Sources: A.D. Hautes-Alpes, Inventaire série H suppl. n°619–582
Location: Hautes-AlpesDepartment: Hautes-Alpes (05)Time: 1789Description: « La pomme de terre est cultivée partout et considérée commeun moyen sûr d’éviter les disettes par les habitants dans leurs réponses auquestionnaire envoyé par la Commission intermédiaire. »References: Guillaume (1908)Sources: unknown
Location: Saint-Léger, La Croix-Roudoule, SauzeDepartment: Alpes-Maritimes (06)Time: c. 1760Description: « Le citoyen Jean Fournier déclare avoir seize quintaux et demybled froment ; six quintaux de méteil ; deux quintaux orge ; deux quintaux erses ;un quintal trente livre guaissons faisant en tout trois quintaux un rup dix livreslgéumes ; cinq quintaux pommes de terre. »References: Bodard (1987, pp. 121–5)Sources: Archives paroissiales de Saint-Léger, La Croix-Roudoule, et Sauze
Location: La VernéaDepartment: Alpes-Maritimes (06)Time: c. 1770Description: « Le premier qui en 1770 sema des patates à Vernea fut AntoineFrançois Camous, dit Conte, dans l’endroit dit Grabiel, propriété qui est encoreaujourd’hui en possession de son fils Joseph Camoux dit Conte. »References: Cauvin (1885, pp. 149–50)Sources: BnF, NUMM-104229
Location: VivaraisDepartment: Ardèche (07)Time: c. 1730Description: « En effet, si au mois d’Avril, nous nous appercevons que nosbleds ne vont pas bien, on peut réserver des pommes de terre pour semer surle chaume, ou encore mieux dans les terres préparées pour le chanvre, dont onpeut renvoyer la récolte, & se procure le comestible qui approche le plus du bled,puisque nous avons en Vivarais des cantons où le Paysan a pour toute nourritureces trufes rouges cuites dans l’eau avec un peu de sel, & se portent mieux que ceux
60
qui ont quatre services à leur table ; ceux qui sont moins misérables y ajoutent unpeu de pain de seigle. [...] On a vu dans six mois les patates se répandre danstout le Royaume ; la moindre mode a le même avantage ; par quelle fatalité faut-il des siècles pour multiplier les moyens de subsister d’une Province à l’autre ;il y a environ quarante ans qu’on cultive ici les topinembours, & nos voisinsviennent encore s’en pourvoir à nos marchés, tandis qu’ils croîtroient encoremieux chez eux, on commence seulement à les connoître dans le bas Dauphiné &dans le Comtat, tandis que les mouchoirs d’Aubenas, après avoir parcouru toutel’Europe, passent enfin les Mers, & nos pommes de terre ont peine à passer leRhone. »References: Gazette du commerce N°12, 9 février 1768, pp. 109Sources: BnF, NUMP-16146
Location: VivaraisDepartment: Ardèche (07)Time: c. 1760Description: « C’est du nord vers le sud que la truffe s’est répandue commele montre l’enquête faite en 1759-1762 auprès des curés. Ceux-ci, invités àrépondre à une question sur les récoltes, mentionnent assez souvent, en Haut-Vivarais et dans la montagne, l’existence du tubercule. A Saint-Alban-d’Aypar exemple, le curé Descours indique qu’on cultive “assez grande quantité detruffes ou pommes de terre”. Au Cros-de-Géorand, le curé Vinard, au mêmemoment, pour montrer la misère de ses paroissiens montagnards (“la plupartne portent point de chemise pour l’ordinaire”), écrit : “les truffes rouges fontpresque toute leur nourriture huit à neuf mois de l’année. Ils les font servir pourla soupe, pour le pain, pour le bouilli et le rôti [...]”. Arthur Young, à la mi-août 1789 voit partout des étendues de pommes de terre dans les champs de lamontagne entre Pradelles et Thueyts. Dès les années 1760-1770, la productionétait devenue assez importante pour que les bonnes récoltes aient permis unecertaine exportation : en 1768, on a vendu hors du diocèse pour 50 000 Lde pommes de terre ce qui représente en poids à peu près 16 000 quintaux.L’évolution des superficies ensemencées et des récoltes est la suivante : 1765au minimum 100 000 quintaux ; 1789 192 360 quintaux. [...] Le Bas-Vivarais,et spécialement le sud-est, mangeur de céréales, a plus longtemps résisté àl’invasion de la pomme de terre conquérante. Encore en 1777, l’essentiel dudéficit céréalier de Bourg-Saint-Andéol a été comblé par l’importation de blé deBourgogne. Mais en 1780, le médecin Madier écrit : “depuis quelque temps onmange en hiver beaucoup de pommes de terre”. »References: Molinier (1980, p. 313–5)Sources: unknown
Location: Cévennes
61
Department: Ardèche (07), Gard (30), Lozère (48)Time: c. 1770Description: « Dans les Cévennes, les Pommes de terre firent leur apparitionvers 1774, si l’on croit ce passage de Loiseleur-Deslongchamps de 1824 : Ce n’estque depuis une cinquantaine d’années qu’on les connait dans les montagnes desCévennes où elles sont aujourd’hui la base de la nourriture du peuple. »References: Roze (1898, p. 195)Sources: unknown
Location: ArdennesDepartment: Ardennes (08)Time: c. 1750Description: « Des pièces de procédure relatives à un certain nombre de villagesdes Ardennes, nous apprennent que la pomme de terre était cultivée à Pure en1749 ; à Raucennes, le tubercule était connu de 1750 à 1760 ; à Chemery, lesdécimateurs réclament la dîme des “crompires” en 1772 ; elle est payée, disent-ils, par les habitants depuis vingt ans. Plusieurs témoins qui déposent dans cesprocès, font remonter, pour certains villages, la culture de la Pomme de terre àdes dates plus anciennes : 1733, 1744, etc. Des documents analogues établissentl’ancienneté de la culture de la Pomme de terre en Lorraine, c’est-à-dire dans lesVosges, la Meuse et la Meurthe-et-Moselle. »References: Gibault (1912, p. 404)Sources: unknown
Location: Canton de BouillonDepartment: Ardennes (08)Time: c. 1760Description: « Dans le canton de Bouillon, département des Ardennes, M. Aubry,curé de Bellevaux dit que depuis 1760 la culture de la pomme de terre s’estsingulièrement augmentée ; il y a des cultivateurs qui en recueillent plus de milleboisseaux. Avant l’introduction de cette précieuse racine, les Hautes-Ardennesétoient souvent exposées à des espèces de famine, fléau qu’on y connoit plus,parce que la pomme de terre ne manque jamais. »References: sur le concours (1809, pp. 67–8)Sources: BnF, NUMP-7363
Location: Aigues-Juntes, GabreDepartment: Ariège (09)Time: c. 1740Description: « On la trouve (la pomme de terre) cultivée en 1744 à Gabre età Aigues-Juntes (diocèse de Rieux), c’est à dire sur les premières pentes desPyrénées. Il y en a beaucoup à Seix, diocèse de Rieux, en 1788, beaucoup dans les

62
montagnes du Mirepoix, et cela n’indique pas une culture à ses débuts. »References: Dutil (1911, p. 198)Sources: unknown
Location: Diocèse de NarbonneDepartment: Aude (11)Time: c. 1790Description: « Dans le diocèse de Narbonne, elle est peu en usage et “ne vientmême pas en bien en plusieurs endroits”. »References: Dutil (1911, p. 19)Sources: unknown
Location: CalvadosDepartment: Calvados (14)Time: c. 1770Description: « Dans la région qui deviendra, sous la Révolution, le départementdu Calvados, la pomme de terre a été introduite, entre 1772 et 1776, par leMaréchal d’Harecourt. [...]. Quant à la culture proprement dite elle n’en futfaite, d’après P.-A. Lair, que plus tard par MM. Cairon de Lavarende et Davidde Magneville. »References: Désert (1955, p. 262)Sources: unknown
Location: Angoulême, Brive-la-Gaillarde, LimogesDepartment: Charente (16), Corrèze (19)Time: c. 1760Description: « Le premier, le duc Amilthon, qui séjourna longtemps à Brive sousle nom de chevalier Binet, introduisit la pomme de terre dans cette ville. On lapropagea peu à peu, et, en 1768, un pain fait d’un mélange de cette racine et deseigle ou de froment fut expérimenté successivement à Limoges et à Brive, essaidont la Société d’Agriculture de Rouen avait déjà donné l’exemple en 1762. En1769, le Bureau d’Angoulême faisait part de ses expériences sur la racine nouvellequi ne doit pas être bouillie comme les autres mais bien coupée en rondelle, friteà l’huille, puis arrosée d’un filet de vinaigre. La première récolte importante dontil soit fait mention dans les procès-verbaux du Bas-Limousin fut faite par M. deSaint-Hilaire fils, qui en ramassa soixante quintaux [...]. »References: Taillebois (1858, pp. 578–9)Sources: unknown
Location: CherDepartment: Cher (18)Time: c. 1790
63
Description: « La pomme de terre a dû être introduite dans le Cher par Béthune-Charost, cet homme instruit, au courant de tous les progrès agricoles, de toutesles expériences utiles. Dans sa statistique du Cher [1827], Bulet fait remarquerque l’haut prix du blé et sa rareté aux différentes époques de notre révolution,ont forcé les habitants de la campagne à s’adonner à la culture des pommes deterre presque inconnue, dit-il il y a 30 ans dans ce département, ou du moins quifiguerait dans les jardins que comme légume»References: Menault (1890, p. 309–10)Sources: BnF, NUMM-6227993
Location: Juillac, Juillac UzercheDepartment: Corrèze (19)Time: c. 1780Description: « Il en a d’abord été plus touché comme d’un supplément aux ravespour ses beftiaux, que comme un aliment pour lui même. Mais les enfants ontbientôt prêché à merveille que les pommes de terre étaient fort bonnes à manger,& que par la pâte & le goût elles ne différaient pas beaucoup des châtaignes. Ellescommencent à être assez communes & très estimées dans la Province. »References: Dupont de Nemours (1782, Vol. I, pp. 118–9)Sources: BnF, NUMM-5598015
Location: CorseDepartment: Corse du Sud (20A), Haute-Corse (20B)Time: c. 1770Description: « Le gouvernement aide les agriculteurs inventifs : une circulairedu préfet de la Corse (mars 1817) met à la disposition de ceux qui défrichaientpour cultiver la pomme de terre (introduite en Corse vers 1777) des primes et desconcessions de terrains. »References: Caratini (2009)Sources: unknown
Location: TrégorroisDepartment: Côtes-d’Armor (22)Time: c. 1810Description: « La pomme de terre est arrivée en Bretagne par Belle-Isle vers 1790,et en Trégorrois par Bréhat aux environs de 1810. »References: Le Lannou (1931, p. 29)Sources: unknown
Location: PérigueuxDepartment: Dordogne (24)Time: c. 1770

64
Description: « Mlle Bertin écrivait de Paris, en 1771, à M. Gravier régisseur desdomaines qu’elle possédait aux environs de Périgueux : “Je recommande à votrefils les pommes de terres qui se travaillent comme le blé d’Espagne et dont onfait des rpovins, Petit-Jean en a vu travailler l’année dernipre. C’est le temps (5avril) de les semer, si elles ne le sont déjà.” [...] le 14 janvier [1774], à ce mêmerégisseur : “Peut-être que votre exemple pour les pommes de terre donnera envieaux métayers d’en avoir pour l’année prochaine. On en tire grand parti dans cepays”. »References: Bussière (1877, pp. 121–2)Sources: unknown
Location: DordogneDepartment: Dordogne (24)Time: c. 1780Description: « Dans le département de la Dordogne, M. de Fayolle, correspon-dant de la Société, observe que la culture des pommes de terres a produits unchangement avantageux dans la rotation des récoltes. Cette plante si précieuse,[...], étoit inconnue à la majorité des cultivateurs avant 1785. Maintenant, chaqueannée on voit augmenter la portion destinée à cette culture. »References: sur le concours (1809, p. 68)Sources: BnF, NUMP-7363
Location: DordogneDepartment: Dordogne (24)Time: c. 1790Description: « La culture de la pomme de terre est peu étendue, elle s’accroitcependant sensiblement depuis quelques années ; mais on n’apporte pas à cettebranche de récolte le soin qu’elle exige, et son produit est très borné. »References: Delfau (1803, p. 192)Sources: BnF, NUMM-85124
Location: Belvès, Bergerac, PérigueuxDepartment: Dordogne (24)Time: c. 1790Description: « Dans le tableau du Maximum pour les districts de Belvès,Périgueux et Bergerac en 1793, la pomme de terre est le légume le moins cheraprès la rave, puisqu’elle ne coûte que 9 deniers la livre contre deux souspour les carottes ou un sou pour les choux ; elle concerne donc prioritairementl’alimentation populaire. »References: Meyzie (2007, p. 219)Sources: unknown
65
Location: Bergerac, PérigordDepartment: Dordogne (24)Time: c. 1790Description: « Face aux nouveautés, la paysannerie reste d’une méfiance ex-trême. Les tentatives de la sœur de Bertin pour introduire la culture de la pommede terre dans la région de Brantôme sont un échec et les paysans du Bergeracoiset de la Double qui la connaissent refusent de la cultiver. »References: Beaudry (1976, p. 43)Sources: unknown
Location: région de Bâle, principauté de Montbéliard, comté de BourgogneDepartment: Doubs (25), Bas-Rhin (67), Haute-Saone (70)Time: c. 1600Description: « En effet, les travaux de botanique sont menés par les frères Bauhin,principalement dans le jardin du duc de Wurtemberg à Montbéliard. On peutdater les expériences de culture de la pomme de terre après 1578, et en tout casau plus tard avant 1596, date des premières publications. [...] Et il ajoute queles Bourguignons, c’est-à-dire les Comtois, pratiquent une méthode de culturedifférente [...]. Plusieurs lieux de culture sont possibles. D’abord, dans le jardindu palais Granvelle à Besançon. On sait que Jehan Bauhin y a puisé des boutures.Ensuite, dans le jardin du docteur Chifflet à Besançon, que Jehan Bauhin a visitéaussi. »References: Delsalle (2011, p. 22)Sources: unknown
Location: SalinsDepartment: Doubs (25)Time: c. 1630Description: « Un arrêt du Parlement de Besançon de 1630, en prohibe la culturedans le territoire de Salins, par crainte de la lèpre. »(M. Gourdon (1870). LaPomme de terre et sa culture. Toulouse)References: Clos (1874, p. 11)Sources: BnF, NUMM-855540
Location: région de ValenceDepartment: Drôme (26)Time: c. 1750Description: « En 1758 dans la région de Valence, disette, très peu de blé, lesvivres manquent.“Bien des familles se sont nourries avec des pommes de terre,des herbres”. »References: Brun-Durand (1879)Sources: unknown

66
Location: Eure-et-LoirDepartment: Eure-et-Loir (28)Time: c. 1790Description: « Cette culture des pommes de terre, qui, dans le commencementavait été regardée avec mépris, ensuite avec indifférence par ses voisins, com-mence cette année à faire queqlue impression. Ils commencent à sentir que,dans un moment de disette ou de pénurie, cette ressource serait d’un prix infini,indépendamment de l’excellente nourriture qu’elle doit offrire dans tous le tempsà leurs bêtes à cornes, cochons, etc., et il est très probable qu’avant deux ans sonexemple sera suivi par beaucoup de fermiers de son voisinage, et que, de procheen proche, cette culture pourra s’étendre avec lui. »References: Bourgin (1910, p. 341)Sources: unknown
Location: District de ChâteaulinDepartment: Finistère (29)Time: c. 1790Description: « Dans le district de Châteaulin, “les habitants commencent às’accoutumer à la culture de la pomme de terre”. »References: Sée (1906, p. 433)Sources: unknown
Location: Bretagne, QuimperDepartment: Finistère (29)Time: c. 1800Description: « Les pommes de terre sont, dans presque tous ces Départements,cultivées seulement pour la nourriture des bestiaux et pour l’usage de quelquesparticuliers riches qui, moins soumis aux préjugés, aiment à s’en nourrir ; dansles environs de Quimpercoretin, on trouve au contraire l’usage et la culturedes pommes de terre bien naturalisés, ce qui est dû aux efforts soutenus etsagement conduits de M. Ledéan, agronomet citoyen distingué, auque j’ai dû desrenseignements précieux sur l’agriculture du Finistère. Les pommes de terre sontintroduites dans les assolements du district de Quimper à la place du blé noir ; onles sème en lignes assez espacées, [...]. Le peu de pommes de terre qu’on cultivedans les environs de Nantes y est cultivé de la même manière. »References: de Candolle (1806, p. 274)Sources: BnF, NUMP-7363
Location: Lussan, Montaut, SeyssesDepartment: Gard (30), Haute-Garonne (31)Time: c. 1800
67
Description: « Le maïs et la pomme de terre semblent inconnus au XVIIIe dansles villages de la zone méditerranéenne que nous étudions. A Seysses, nousn’avons pas non plus trouvé mention de maïs ou de pommes de terre. Il n’estpas possible de dire que le maïs ou la pomme de terre ont fait leur apparitionà Lévignac au XVIIIe siècle. Il en est de même à Lussan où le maïs est à peineadopté au XVIIIe siècle et où les pommes de terre sont rares au début du sièclesuivant. A Montaut, nous constatons que l’introduction et la généralisation deplantes nouvelles s’instaure surtout au début du XIXe siècle. [...] Rabat, la culturedu maïs est précoce et ses progrès sont continus dès le début du XVIIIe siècle. Ausecond rang des cultures en 1747, il passe au premier rang dans la deuxièmemoitié du siècle. [...] La pomme de terre ne fait son apparition, à Rabat, qu’àl’extrême fin du XVIIIe siècle. D’un rendement assez fort dix à douze pour unet d’une culture moins exigeante que celle du maïs, la pomme de terre tend à leremplacer au cours du XIXe siècle. »References: Godechot and Moncassin (1964, pp. 57–9)Sources: unknown
Location: canton de MontastrucDepartment: Haute-Garonne (31)Time: c. 1770Description: « La pomme de terre (patanes) n’obtient pas dans les assolemensdu canton la faveur que ses éminentes qualités devroient lui mériter. Elle y étoitentièrement inconnue ; je l’avois vue dans les Pyrénées où on la cultive en granddepuis plus de cinquante ans , et où elle console ces industrieux montagnardsde l’ingratitude et de l’âpreté de leur sol. J’y en pris quelques hectolitres en1776 je les fis planter et bien soigner. A la seconde récolte j’en obtins 200hectolitres. J’en distribuai : j’en fis préparer de différentes manières, j’essayaid’en faire manger aux chefs de famille les plus accrédités. Tous les rebutèrentavec horreur et dédain. Les laboureurs, les bergers s’obstinèrent à n’en donner àaucune espèce de bétail. Mon obstination devoit vaincre la leur. A la quatrièmerécolte je m’aperçus qu’on avoit volé des pommes de terre dans mes champs.[...] Depuis lors cette culture s’est propagée dans tout le canton ; non qu’elleait acquis l’importance qu’elle doit avoir, mais presque chaque famille en 3 unepetite provision. [...] Cette année, qui à la vérité a été des plus favorables, nousen avons recueilli 1527 hectolitres sur une jachère de 6 hectares de contenance. »References: Picot de Lapeyrouse (1814, pp. 54–5)Sources: unknown
Location: ToulouseDepartment: Haute-Garonne (31)Time: c. 1770Description: « En certains endroits de France on les nomme patates, & il m’en

68
a coûté quelque chose pour en connoître un autre nom. Au commencement deJanvier 1772, les pommes de terre que j’avois fait venir d’Irlande étant en route,sous le nom de patates, de Bordeaux à Lyon, on les désignoit à Toulouse, dans lalettre de voiture pour Lyon, par celui de truffes [...]; dans les bureaux on supposeque c’étoit des truffes sèches, & on m’en fit payer des droits à proportion. Ils ontle même nom dans une petite province qui étoit de mon gouvernement; & lespalces où on les a plantées, celui de truffières. »References: Robinet (1777, p. 475)Sources: BnF, NUMM-50553
Location: ToulouseDepartment: Haute-Garonne (31)Time: c. 1780Description: « Ainsi, vers 1780, M. de Lapeyrouse travaille à l’acclimater dans lediocèse de Toulouse. L’intendant la verrait avec plaisir se substituer au maïs dansl’alimentation, pour éviter l’épuisement des sols. »References: Dutil (1911, p. 199)Sources: unknown
Location: BazadaisDepartment: Gironde (33)Time: c. 1770Description: « Les premiers essais de culture de la pomme parmentière, commeon appelait alors ce tubercule, datent de 1769. Bourriot s’appliqu énergitiquementà vulgariser en Bazadais la culture de la pomme de terre. Il en demandades semenceaux pour les 52 paroisses de sa subdélégation à l’automne 1768.Durant l’hiver, il fait répandre une brochure donnant sur cette cultures toutesles indications utiles. Il fit avce le plus grand soin préparer le terrain par lespropriétaires qui voulurent bien se prêter à cet essai. On lui en annonça 70barriques venant d’Irlande [...]. On jeta dédaigneusement les premières récoltesaux pourceaux. Cependant les résultats obtenus furent si démonstratifs, et lapomme de terre, à titre de culture nouvelle, se trouvant exempte de dîmes, peu àpeu les métayers eux-mêmes se décidèrent à la cultiver. »References: Séverin (1903, pp. 25-7)Sources: unknown
Location: généralité de BordeauxDepartment: Gironde (33)Time: c. 1770Description: Correspondance des intendants Fargès et Esmangart concernantles subsistances qu’il est nécessaire de réunir au plus vite. Envoi par legouvernement de graines de pin et de pommes de » terre pour planter dans les

69
landes. »« Cette denrée (la pomme de terre) a été reçue avec plaisir et comme ils’est trouvé dans quelques paroisses des subdélégations des curés originaires desprovinces où cette plante est culitvée. »References:Sources: A.D. Gironde, C 3578
Location: généralité de BordeauxDepartment: Gironde (33)Time: c. 1770Description: » Il vient de paroître ici un Mémoire instructif, composé par ordrede M. l’Intendant, sur la culture de la pomme de terre, & sur son usage pour lanourriture des hommes & des animaux. «References: Gazette du commerce N°14, 16 février 1771, p. 106Sources: BnF, NUMP-16146
Location: MontpellierDepartment: Hérault (34)Time: c. 1760Description: « Notons, enfin, que les pommes de terre ne figurent pas parmi leslégumes. »References: Smets (2001, p. 44)Sources: unknown
Location: région de RennesDepartment: Ille-et-Vilaine (35)Time: c. 1750Description: « Elle est mentionnée en 1757, période de disette, dans la région deRennes, cultivée par Louis René de Caradeuc de La Chalotais, bientôt suivi dansle Léon par monseigneur de la Marche, surnommé “l’évêque des patates” (eskobar patatez). »References: Faivre (2011, p. 117)Sources: unknown
Location: Rennes, BretagneDepartment: Ille-et-Vilaine (35)Time: c. 1770Description: « En 1774, l’intendant fait distribuer en Bretagne, pour y êtresemées, des pommes de terre, venues de Belle-Ile ; nous savons que, dans lasubdélégation de Rennes, on en a distribué 110 boisseaux : chaque paroisse enreçu 2 à 6 boisseaux. »References: Sée (1906, p. 419)Sources: unknown

70
Location: ToursDepartment: Indre-et-Loire (37)Time: c. 1770Description: « Nous comptons aussi faire essai, pendant l’hiver prochain, del’usage des batates (qu’on appelle communément patates) ou pommes de terre.J’ai consacré à cette plantation tout le jardin de la manufacture, et la récolte doits’en faire incessamment. Mais je craisn bien de trouver beaucoup de répugnancede la part de nos pauvres, qui sont accoutumés à la nouriture du pain. »References:Sources: A. D. Isère, 6J102, Lettre de M. Rattier, syndic-receveur de Tours etdirecteur de la manufacture des pauvres, à l’intendance de Bretagne (20 octobre1769)
Location: ToursDepartment: Indre-et-Loire (37)Time: c. 1780Description: « C’est la seule qui compose leur pain, il est bien cuit, peu ou passalé, cette denrée étant à un prix très haut dans le pays surtout depuis quelquesannées où l’on n’en reçoit plus la quantité de livres à la mesure fixée. Les farineuxde toute espèce, surtout les pois rouges, les pommes de terre des espèces variées,les navets, les racines de betteraves rouges, les carottes, les choux, les citrouilles,les fruits de toute espèce de chacune des saisons [...] leur servent de variété, ainsique les sardines sèches salées, les harengs, l’ail, les oignons, les cives. Ils mangenttrès rarement de la viande si ce n’est celle de mouton, de cochon, d’oison, dansles temps où elles sont à bas prix. Cette polyculture n’a pas d’équivalent dansle reste de la Touraine Le Chinonais est la première région dans cette provinceà avoir vraiment adopté les cultures nouvelles comme celle du maïs ou de lapomme de terre. »References: Maillard (2003, p. 100)Sources: unknown
Location: GrenobleDepartment: Isère (38)Time: c. 1530Description: « Il est résolu par le Conseil d’offrir à Mgr. Le lieutenant général deGrenoble (Bayard) 30 lb (14 kg) de tartifles. »References: Ferrand (1979, p. 33)Sources: unknown
Location: DauphinéDepartment: Isère (38), Drôme (26)

71
Time: 1650Description: « [...] les pommes de terre ont été introduite en Dauphinédepuis fort longtemps et sont maintenant considérées comme indispensable àla population. »References: Roze (1898, p. 192)Sources: unknown
Location: DauphinéDepartment: Isère (38)Time: 1746Description: « Lors de la location de leurs domaines, des frères exigent enpaiement en nature “4 baines de truffes livrables lors de leur maturité”. »References: Ferrand (1979, p. 33)Sources: unknown
Location: GrenobleDepartment: Isère (38)Time: c. 1760Description: « Dans les Archives de l’Isère (Dauphiné), quelques pièces mention-nent les Pommes de terre: année 1762, l’hôpital de Grenoble achète des Truffes à22 s. le quintal. »References: Gibault (1912, p. 266)Sources: A.D. Isère, E 141 et E 169
Location: DauphinéDepartment: Isère (38), Drôme (26)Time: c. 1780Description: « Villars écrit en 1787 : “On cultive la Pomme de terre depuis lesbasses plaines de la Province jusqu’aux derniers plateaux des Alpes, où la rigueurdu climat refuse l’accroissement à la plante, le développement aux fleurs, tandisque la température du globe fait végéter se racine, d’autant plus agréable qu’ellecroit dans une terre plus fine, dans un climat plus élevé”. »References: Roze (1898, p. 161)Sources: unknown
Location: JuraDepartment: Jura (39)Time: c. 1760Description: « Ce fut seulement au commencement du règne de Louis XVI quela culture de la pomme de terre fut introduite dans le département du Jura etdans le voisinage. Les vieillards actuels racontent avoir appris de leurs pèresque cette plante fut apportée dans le pays, Il y a environ 80 ans, et eux-mêmes
72
se souviennent très bien que, dans leur propre jeunesse, on ne la cultivait qu’autravers des champs ensemencés de maïs, au nombre de quelques pieds isolés etdisséminés. »References: Gaspard (1840-1841, p. 283)Sources: unknown
Location: JuraDepartment: Jura (39)Time: c. 1770Description: « En 1775, le sieur Monnoyeur distingue lui-même, “trois causesà la dépopulation”. La première c’est “la misère causée par la nourriture, demauvais légumes, choux, pommes, de terre et autres choses semblables sansautres aprests n’y assaisonnement que pour les plus vils animaux ce qui causedes maladies, gale, vers, épidémies et des sujets peu propres à la propagation del’espère humaine”. »References: Merlin (1994, p. 45)Sources: unknown
Location: ForezDepartment: Loire (42)Time: c. 1760Description: « Cette culturre qui s’est établie depuis peu dans le Forez y faitchaque jour des progrès étonnants. »References: Desmaret (1765, p. 191)Sources: unknown
Location: Forez, LimousinDepartment: Loire (42), Haute-vienne (87)Time: c. 1760Description: « L’assurance d’une récolte abondante et soutenue est fondée sur lessuccès de cette culture [la pomme de terre] dans le pays des Vosges, en Lorraine,et dans le Forest, deux provinces où l’on trouve et la même nature de terre et lamême température qu’en Limousin. Cette culture qui s’est établie depuis peudans le Forest, y fait journellement des progrès étonnans. On peut d’ailleursciter des essais faits en Limousin par quelques cultivateurs intelligens. Ces essaisexécutés en assez grand nombre, rassurent pleinement sur le succès et annoncentles plus grands avantages. [...] Cette nourriture est fort saine et il suffit pour s’enconvaincre de voir les Irlandois, les habitants des Vosges, de l’Alsace et du Forest,qui vivent de pommes de terre six mois dans l’année. »References: Expilly (1763–68, Vol. 4, p. 259)Sources: unknown

73
Location: VelayDepartment: Haute-Loire (43)Time: c. 1730Description: « On lit, dans les Mémoires du Puy de 1864-1865, qu’Aymard aprouvé par des actes de donation remontant à 1735, que les Pommes de terre ouTruffes étaient alors cultivées dans le Velay. »References: Roze (1898, p. 159)Sources: unknown
Location: LoiretDepartment: Loiret (45)Time: c. 1770Description: Mémoires et instruction sur la culture de la pomme de terre 1771–1789References:Sources: A.D. Loiret, Inventaire série C, C 47
Location: RouvilleDepartment: Loiret (45)Time: 1809Description: « Le domaine de Rouville, dont mon exploitation fait partie, estsitué dans le département du Loiret, [...]. Dans le canton que j’habite, personneavant moi navoit cultivé les pommes de terre en grand ; elles n’y étoient pasinconnues ; mais quelques carrées destinés à cette plante, choisis près deshabitations et labourés à la bêche, n’étoient pas des données pour une cultureétendue. »References: de Rouville (1809, p. 305, 365)Sources: BnF, NUMP-7363
Location: environs de Montargis et LorrisDepartment: Loiret (45)Time: 1809Description: « On y connoît quelques espèces de pommes de terre rouges, ainsique la jaune de New-Yorck, mais la grosse blanche tachée de rouge est la seulecultivée généralement ; sa culture est néanmoins circonscrite dans les jardins,c’est à dire qu’elle n’est pas assez commune pour être à bas prix, et qu’on en faitpeu d’usage pour la nourriture des bestiaux. »References: Sageret (1809, p. 7, 36)Sources: BnF, NUMM-9738556
Location: généralité de MontaubanDepartment: Lot (46)
74
Time: c. 1770Description: Introduction de la pomme de terre dans la généralité de Montaubanen 1771 par l’intendant de GourguesReferences:Sources: A.D. Lot, C 245
Location: LotDepartment: Lot (46)Time: c. 1780Description: « La pomme de terre n’a vaincu que depuis peu d’années lesobstacles qui s’opposaient à sa culture, quoique dès l’année 1789 M. Henri deRicheprey, [...] eût annoncé que ce tubercule était la seule production qui pût êtreune ressource contre la famine. Encore en 1812, où le quintal métrique de blé sevendit dans le département jusqu’à 80 francs, on connaissait à peine la pommede terre sur le sol calcaire ; et si quelques particuliers l’y cultivaient, ce n’était quecomme plante potagère. Mais après avoir reconnu qu’elle avait suppléé, sur lesol granitique, à toutes les autres récoltes qui avaient manqué par l’intempériedes saisons, et qu’elle seule avait préservé la population de cette contrée du plusredoutable des fléaux, on sentit combien il est avantageux de propager une plantequi n’est point attaquée par la grêle, par les brouillards, par les trop longuespluies, par les froids tardifs. »References: Delpon (1831, Vol. 2, p. 222–3)Sources: BnF, 4-LK4-539 (2)
Location: MontaubanDepartment: Lot (46)Time: 1789Description: « Cultivée dans les champs. Sa racine est nourrissante, son suémétique, ses feuiiles sont résolutives. »References: Gaterau (1789, p. 53)Sources: BnF, NUMM-97918
Location: CasteljallouxDepartment: Lot-et-Garonne (47)Time: c. 1770Description: Correspondance du subdélégué de Casteljaloux au sujet de ladistribution de sacs de pommes de terre (4 mai 1769)References:Sources: A.D. Lot-et-Garonne, Inventaire série C, C 3578
Location: GévaudanDepartment: Lozère (48)
75
Time: c. 1810Description: « Il convient d’indiquer que l’alimentation paysanne en Gévaudana été considérablement enrichie par l’introduction de la culture de la pomme deterre qui s’est faite peu à peu, non sans rencontrer de vives résistances, à partirde 1815. En Velay, c’est dès notre période ou un peu avant et dans ce type d’actesmême qu’elle apparaît. »References: Bernard (1969, p. 1452)Sources: unknown
Location: arrondissement de CoutancesDepartment: Manche (50)Time: 1803Description: « La culture de la pomme de terre s’est répandue dans presquetoutes les communes, et il n’en est pas où elle ne réussisse ; mais on ne la faitpoint en grand et l’on y sacrifie que peu de terrein. Il n’en est pas de même desautres plantes potagères. »References: Duhamel (1803, p. 303–4)Sources: BnF, NUMP-16043
Location: NancyDepartment: Meurthe-et-Moselle (54)Time: c. 1760Description: « On cultive cette plante dans les champs & jardins. »References: Buchoz (1763, p. 39)Sources: Bibliothèque Universitaire de Sciences et Techniques de Nancy, Fondsanciens, E 4852
Location: Meurthe-et-MoselleDepartment: Meurthe-et-Moselle (54)Time: c. 1770Description: Réponse des communautés de la subdélégation de Lurreville àl’enquête de l’intendant sur la récolte de 1771 (circulaire du 6 juillet 1771) :août 1771 (en général prévision plutôt qu’évaluations exactes). Housseras : 500réseaux. Seanménil : 550 réseaux. Haraucourt : environ 25 jours ensemencés.Pierre Percés : approximativement 12 réseaux de dîmes. Rambervillers : env.1200 réseaux. Sainte-Barbe : envirion 350 réseaux. Etc.References:Sources: A.D. Meurthe-et-Moselle, Inventaire Série C, C 432
Location: LorientDepartment: Morbihan (56)Time: c. 1760
76
Description: « [...] je me suis fixé près de l’Orient : & pour oeconomiser le plusquîl m’étoit possible sur les dépenses de ce pénible & dispendieux ourage, j’aicommencé par cultiver des Pommes de terre, afin de procurer à mes journalier,aux animaux qui m’étoient nécessaire, une bonne nourriture & à bon marché. Jeconviendrai que ce ne fut pas sans peine que j’y accoutumai les uns & les autres[...]. Suivant ma culture un arpent de terre qui produiroit douze quintaux defroment, en produit deux cens de Pommes de terr, à la vérité le froment est pluscher , & il faut moins de frais : cependant à le supposer à 7 liv. 10 sol le cent, &l’autre 4 liv. 10 sols seulement, le produit du premier fer 75 liv. & celui du secondfera 500 liv. quoique les frais nécessaire pour la culture de ce dernier n’excédentque de 45 liv. au plus, ainsi le profit est donc de 380 liv. par arpent [...]. »References: Moreau Kerlidu (1762, p. 57)Sources: BnF, S-19119
Location: Belle-Île-en-MerDepartment: Morbihan (56)Time: c. 1790Description: « La pomme de terre est arrivée en Bretagne par Belle-Isle vers 1790,et en Trégorrois par Bréhat aux environs de 1810. »References: Le Lannou (1931, p. 29)Sources: unknown
Location: LorraineDepartment: Moselle (57)Time: 1650Description: « [...] les pommes de terre ont été introduite en Lorraine en 1650. »References: Roze (1898, p. 196)Sources: unknown
Location: LorraineDepartment: Moselle (57)Time: c. 1740Description: Question IX : Quel a été communément et du fort au faible, depuis1730 jusqu’en 1740, le produit en anture d’un jou de terre semé d’orge ou demétail, ou de siegle, ou de pommes de terre, ou de tous autres gains ou légumes?References:Sources: A.N., KK 1159, Enquête sur l’état de l’agriculture et la populationagricole en Lorraine (1761)
Location: FrémonvilleDepartment: Moselle (57)

77
Time: c. 1740Description: Pomme de terre introduite vers 1740References: Morineau (1971, p. 186)Sources: A.N., KK 1159 à 1173, Enquête sur l’état de l’agriculture et la populationagricole en Lorraine (1761)
Location: ThimonvilleDepartment: Moselle (57)Time: c. 1740Description: « En 1740, un jour rapporte 18 à 9 quartes de pommes de terre, soit 8à 9 fois la semence. En 1761, la récolte est passable, mais les tubercules de qualitémédiocre à cause de la grande sécheresse. »References: Morineau (1971, p. 176)Sources: A.N., KK 1159 à 1173, Enquête sur l’état de l’agriculture et la populationagricole en Lorraine (1761)
Location: FlinDepartment: Moselle (57)Time: c. 1750Description: « Les laboureurs vendent leur blé dès le mois d’août... “ne viventplus aujourd’huy que de pain de seigle, d’avoir ou de pommes de terre qu’ilsmeslent ensemble et ils ne mangent que des pommes de terre les années un peustériles. »References: Morineau (1971, p. 182)Sources: A.N., KK 1159 à 1173, Enquête sur l’état de l’agriculture et la populationagricole en Lorraine (1761)
Location: HainautDepartment: Nord (59)Time: c. 1740Description: « La Flandre orientale aurait été gagné dès 1708, les cantonslimitrophes du Brabant vers 1720, le Luxembourg et le Namurois en 1730, leHainaut après 1740, dernière province touchée selon l’auteur.103 »References: Morineau (1970, p. 1767)Sources: unknown
Location: HainautDepartment: Nord (59)Time: c. 1760Description: « Productions naturelles de la province d’Artois d’après le Patriote
103 Charles Vandendbroeker (1969). Aardappelteet en aardappelverbruik in de 17e en 18e eeuw.Tijdschrift voor Geschiednis, pp. 49–68.

78
artésien, publié en 1761. Froment [...] Pommes de terre et autres légumes. »References: de Calonne (1883, pp. 303–4)Sources: NUMM-5829668
Location: CambrésisDepartment: Nord (59)Time: c. 1790Description: « Ce ne fut que vers 1789 que des fabricants de toile, allantvendre du lin en Hollande, en rapportèrent quelques-unes dans leur valise eten propagèrent peu à peu la culture. »References: Roze (1898, p. 193)Sources: unknown
Location: BeauvaisDepartment: Oise (60)Time: c. 1760Description: « L’année 1752 avait été une année de “vie chère”. Afin d’enatténuer les fâcheuses conséquences, P.D. Bourrée de Corberon, venu s’installeraux portes de Beauvais, obligeait les ouvriers de son domaine de Troissereux àrecevoir, en paiment de leurs travaux, la pomme de terre dont il avait appréciéles avantages en Franche-Comté. Il rencontra d’abord de la résistance. Il ne tardapas à reconnaître ses qualités ; lui-même le cultiva. »References: de Calonne (1920, p. 251)Sources: unknown
Location: Saint-Denis près d’AlençonDepartment: Orne (61)Time: c. 1760Description: « Le Bureau de Charité établie en 1767 en la paroisse de S. Denis,près d’Alençon, par M. Dumesnil, [...]. Depuis cinq semaine, le Bureau a distribuémille livres de pain économique, composé d’un tiers de pomme de ters, mêléesavec deux tiers de farien de mouture (c’est du ble mêlé avec de l’orge) ; lespommes ont été accommodées selon la méthode de M. le Chevalier Mustel. [...]Les déchets des pommes de terre a été donné aux porcs. »References: Gazette du commerce N°14, 17 février 1770, p. 128Sources: BnF, NUMP-16146
Location: Aire-sur-la-Lys, AmiensDepartment: Pas-de-Calais (62), Somme (80)Time: c. 1760Description: « Certain jour du mois de mars 1766, Dottin le maitre de posteagriculteur de Villers-Bretonneux, déjeunait au château de Fortmanoir, près
79
d’Amiens, C. M. Briet fit servir des pommes de terre à son invité qui ne lesconnaissait encore que de réputation. Émerveillé de la saveur du nouveaulégume et très désireux de se livrer à des essaies de cultures dans la partiefertile de son exploitation, Dottin en acceptat quelques boisseaux. Les résultatssurpassèrent ce qu’il pouvait imaginer, et dans l’enthousiasme de la réussite del’expérience, il s’empressa de la signaler à l’intendant Dupleix. [...] M. Dottinfaisait autorité. Ses essais engagèrent nombre de fermiers à tenter la culturede la pomme de terre, qui gagnant, vers le même temps les environs d’Aire,devint “d’un usage général pour les hommes et les animaux en Artois” ; quipratiquée dans le Boulonnais par M. Chantair et, dans le Beauvaisis, sous lesauspices du duc de la Rochefoucauld-Liancourt, ne tarda point à se développerprogressivement. [...] Voilà donc la pomme de terre officiellement recommandée,dans la généralité d’Amiens »References: de Calonne (1920, pp. 252–4)Sources: unknown
Location: Pas-de-CalaisDepartment: Pas-de-Calais (62)Time: c. 1780Description: « Lettre de M. Joly de Fleury permettant au comte d’Agay d’empêcher“la sortie pour l’étranger des pommes de terre, de la viande, du beurre et desoeufs” suivant la demande qui avait été adressé à l’intendant par les Officiersmunicipaux de la ville de Calais dans une lettre du 21 août 1782 et qui contientce qui suit : “Le triste état de la moisson, environ la moitié des grains secoués,une partie germée, et le reste dans le plus grand danger, nous donnent desinquiétudes sur les subsistances de ce pays. Elles sont d’autant plus fondées quela Flandre et l’Artois qui nous avoisinent et qui sont notre principale ressourcene souffrent pas moins que nous. Dans ces circonstances, nous regardons lespommes de terres comme une denrée précieuse, et qu’il est des plus intéressantde conserver. Les Anglais, aux paquebots desquels notre port est actuellementouvert, et qui vont éprouver les mêmes besoins que nous ne manqueroient pasde nous les enlever si la sortie en étoit permise”. »References:Sources: A.D. Pas-de-Calais, Inventaire série C, C 86
Location: Vollore-VilleDepartment: Puy-de-Dôme (63)Time: c. 1760Description: « Voici une note du curée de Vollore (Auvergne), relevée dans sesregistre de catholicité : “Depuis 1766 jusqu’en 1773, il y a eu la plus grande misère.Depuis 66, le blé a valu 3 livres le quarton ; en 67, 4 livres et 4 livres 10 sols ; en70 et 71, jusqu’à 5 et 6 livres. La famine a été grande : il n’est pourant mort

80
personne de faim. Les truffes ou pommes de terre ont été d’un grand secours ; onen metteait dans le pain moité à truffe et moitié blé, et le pain était passable. Ellesont valu 25 sols le quarton en 68 et 69. Le quarton (huitième de setier) équivalaità 16 litres environ”. »References: Avernus (1892, p. 131)Sources: BnF, NUMP-307
Location: Puy-de-DômeDepartment: Puy-de-Dôme (63)Time: c. 1770Description: « En 1771, le ministre Terry écrivait le 18 juin à M. de Montyon,intendant d’Auvergne pour l’inviter à vulgariser dans sa généralité la culture dela pomme de terre et le 17 juillet de la même année, le ministre Bertin écrivaitde nouveau dans le même but. L’intendant fit comme d’habitude appel à sessubdélégués pour le seconder. D’après les réponses de M. Tixier, subdéléguéde Clermont, Pagès de Vixouses, d’Aurillac, de Godivel, de Besse, le nouveautubrercule aurait été partout bien accueilli. La culture en était d’ailleurs déjàconnue et pratiquee dans quelques parties de la province voisines du Forez oùelle était déjà commune. »References: Salveton (1927, p. 216)Sources: unknown
Location: Puy-de-DômeDepartment: Puy-de-Dôme (63)Time: c. 1770Description: Lettre de l’intendant d’Auvergne de Montyon en 1770 à sessubdélégués indiquant qu’il est prêt à faire accorder un secours en riz ou enpommes de terre aux familles les plus pauvres References:Sources: A.D. Puy-de-Dôme, Inventaire série C, C 907
Location: LivradoisDepartment: Puy-de-Dôme (63)Time: c. 1770Description: « Les pommes de terre ne feront leur apparition - d’abord enLivradois, proche du Forez et du Velay qui l’avaient adoptée assez vite - qu’àl’occasion de la crise de 1771-1773, comme nourriture “des bestiaux et desmalheureux”. »References: Poitrineau (1962, p. 328)Sources: unknown
Location: CerdagneDepartment: Pyrénées-Orientales (66), Ariège (09)
81
Time: c. 1770Description: « Bien que la culture des patates fût metionnée dès 1744 danscertains villages du Sérou, tel Alzen, la précocité de ses succès orientaux appellequelques nuances : longtemps, en année ordinaire, la pomme de terre figurasurtout, comme dans la Cerdagne des années 1770, au menu des animaux et sonintroduction à la diète humaine ne fut pas sans engendrer des réticences, ainsichez les Aurois en 1778. Au cours de l’ultime tiers du XVIIIe siècle, l’usage dece tubercule devint plus massif en haute Ariège (la pomme de terre fut cotéesur le marchée de Foix à partir d’octobre 1778) et se diffusa vers l’ouest de lachaîne. À l’aube des années 1780, le médecin d’Avezac-en-Nébouzan, constataitle rôle que tenait cette plante d’une introduction récente dans l’alimentation decette communauté. [...] Selon un rapport, en 1792 elle aurait servi de principalenourriture aux trois quarts des habitants du district de Tarascon pendant les deuxtiers de l’année. »References: Faivre (2011, p. 117)Sources: unknown
Location: Hautes-PyrénéesDepartment: Hautes-Pyrénées (65)Time: c. 1790Description: « En 1795, un commissaire du gouvernement fut chargé de faireensemencer en pommes de terre une certaine étendue de terrain proportionnéeà l’importance. Dans les commencements, les habitants ne cessaient de seplaindre de cet ordre, et suppliaient l’autorité de les dispenser d’y obéir ; entreautres griefs, ils prétendaient qu’on leur faisait perdre une année de revenu, enchargeant leur terre d’une récolte inutile. On tint bon : peu à peu les préjugéstombèrent ; la pomme de terre devin une partir de la nourriture habituelle, etpassa de l’homme aux animaux. »References: française (1843, p. 259)Sources: unknown
Location: StrasbourgDepartment: Bas-Rhin (67)Time: c. 1700Description: « Vers 1709 sa culture était très répandue dans notre province etmêne au Ban-de-la-Roche d’après H. Oberlin. Lindern (Tournefortius Alsaticus,1728) la dit cultivée communément dans les champs des jardiniers-cultivateurs àStrasbourg (in den Gatrnerfledern). [...] J, J, Spielmann rapporte que, de son temps(1769), la Pomme de terre était universellement plantée en Alsace, en Lorraine,dans le pays de Bade et dans le Palatinat. »References: Kirschleger (1852, Vol. I, pp. 552–3)Sources: Bibliothèque de l’Université de Strasbourg, Bota-KIR1
82
Location: AlsaceDepartment: Bah-Rhin (67), Haut-Rhin (68)Time: c. 1720Description: “In the Dictionnaire des sciences naturelles (vol. 32, p. 524) it is statedthat potato cultivation was propagated in different parts of France at differenttimes, from the end of sixteenth century in Franche-Comté, Lorraine, Burgundy,and Lyonnais; in Alsace between 1714 and 1724.”References: Laufer (1938, p. 60)Sources: unknown
Location: AlsaceDepartment: Bah-Rhin (67), Haut-Rhin (68)Time: c. 1750Description: La généralisation de la pomme de terre en Alsace qui marque la findes disettes périodiques est le fait capital de la seconde moitié du XVIIIe siècleReferences: Juillard (1953, pp. 213–5)Sources: unknown
Location: AlsaceDepartment: Bas-Rhin (67), Haut-Rhin (68)Time: c. 1760Description: « Il y a cinquante ou soixante ans, dit encore M. [Louis] Ordinaire,que cette plante étoit presque inconnue dans le ci-devant Alsace. Quelquespersonnes la cultivoit comme une rareté, mais on vouloit pas en faire l’essaien grand. Le Gouvernement avoit tenté en vain d’en introduire la culture. Ilfallut presque employer des moyens coactifs. Un intendant d’Alsace ordonnaque chaque village auroit une certaine étendue de terrein ensemencée en pommesde terre. Plusieurs maires furent punis pour n’avoir pas exécuté les ordres del’intendant. [...] Aujourd’hui [...] chaque agriculteur en cultive ; elles font sanourriture la plus habituelle ; on en mage le matin, le soir, dans la soupe, avecdu lait ; elles remplacent le pain ; elles sont le trésor du pauvre ; on en nourrit lesbestiaux. »References: sur le concours (1809, pp. 75–6)Sources: BnF, NUMP-7363
Location: région du PilatDepartment: Rhône (69)Time: c. 1770Description: « Cette plante originaire du Pérou, se cultive à Pilat & dans tousle Lyonnois ; sa racine tubéreuse fournit un aliment abondant & sain. Le goûtest préférables à celles que l’on cultive dans les provinces septentrionales de la

83
France, & à la truffe d taupinambour des Anglois, qui est sans saveur. »References: Claret de La Tourette (1770, p. 130)Sources: unknown
Location: Igé, TournusDepartment: Saône-et-Loire (71)Time: c. 1670Description: « [...] une lettre de notre associé M. Grillet, d’Igé. [...] Poursuivantses investigations dans les registres municipaux, il a, pour la première fois,rencontré, le 21 juillet 1792 la mention de la pomme de terre, importé pourtantd’Amérique en 1534 ; mais ce légume est alors si nouveau qu’on ne le dîme pas.[...] J’ai constaté que pour la première fois, la Supérieur, soeur Simonot, a achetéle samedi 23 novembre 1674, jour de marché à Tournus, pour 2 sols de tertofles,puis, le vendredi 7 mars 1675, tant tertolfes que pois, pour 20 sols. [...] en 1683 le13 février, on en achète encore pour 2 sols [...]. Après 1770, je trouve plus d’achatau détail, l’hôpital dut alors en cultiver dans ses propriétés ou faire ses achat engros. Au début, ce sont des tertofles, tarlofles, tartoufles, quelquefois pommes deterre, vers 1763, ces anciens noms disparaissent insensiblement et ce ne sont plusque des pommes de terre. [...] Les prix de 1674 à 1770 ont peu varié ; 3 livres labenne, 12 à 16 sous la coupe, 6 à 8 sous la demi-coupe.104 Pendant cette périodede cent ans, l’Hôpital de Tournus n’en achetait, en moyenne, que pour 6 à 7 livrespar an, souvent moins. »References: Bernard (1926)Sources: A.D. Saône-et-Loire, HDEP 294 à 851
Location: CharolaisDepartment: Saône-et-Loire (71)Time: c. 1760Description: Plainte d’un manoeuvre contre les fermiers du prieuré de laMadelaine qui lui avaient promis entre autres choses, pour ses gages, de luydonner la moitié des pommes de terre qu’ils planteroient et seroient recueillies,cette année, proche le nouvel étange du prieuré plainte d’un justiciable contreceux qui ont enlevé le blé de turquie et les truffes (pommes de terre) qu’il avaitrécoltés dans une terre sise à l’Abergement.References:Sources: A.D. Saône-et-Loire, B 680 et B 777
Location: AuxyDepartment: Saône-et-Loire (71)Time: c. 1770Description: « “Les pommes de terre qui furent d’un très grand secours pour
104 « La coupe de Tournus jauge 17 litre, la benne 100 litres »(p.121).
84
le peuple se vendoit jusqu’à neuf livre le poinçon, n’en n’avoit pas qui vouloit.L’année 1771 nous menace d’une plus grande calamité au moins jusqu’à lesmoissons si dieu ne donne sa Bénédiction. Les Bleds ont bonne apparence pourla récolte prochaine. On enleva une quantité de pauvres par ordre du roy qu’ontransporta dans des maisons de force disposées dans différentes villes”. »References:Sources: A.D. Saône-et-Loire, Registre des Baptêmes et Mariages de la communed’Auxy (1758–1791), folio 94
Location: Le MansDepartment: Sarthe (72)Time: 1742Description: Introduction au sud de la ville du Mans (Pontlieue et Mulsanne)References: Communication personnelle Benoît Hubert (13 mai 2015)Sources: unknown
Location: SartheDepartment: Sarthe (72)Time: c. 1760Description: « Dans le département de la Sarthe, il y a 50 ans, suivant M.Deslandes, membre de la Société des Arts du Mans, que l’on connoissoit àpeine les pommes de terre, d’une si grande ressoure aujourd’hui ; elles furentrépandues par les soins et l’exemple des grands propriétaires, et sur-tout descurés. Leur culture fit des progrès rapides. Elles servent à commencer l’engraisdes boeufs et à compléter celui des porcs. Il n’y a point de fermier qui n’en planteannuellement un douzième de ses terres. »References: sur le concours (1809, pp. 68–9)Sources: BnF, NUMP-7363
Location: Environ de ParisDepartment: Paris (75)Time: c. 1780Description: « Dans ma jeunesse, il y a cinquante ans, on la méprisait encore, etpeu de personnes osaient en manger. »References: Poiteau (1931, p. 99)Sources: Bnf, S-16928
Location: RouenDepartment: Seine-Maritime (76)Time: c. 1760Description: « La culture des pommes de terres étant devenue encore plusprécieuse depuis la méthode indiqué d’en faire avec facilité de bon pain, on
85
a senti l’avantage de l’introduire dans cette Province, où ce nouveau moyende susbsistance ne peut être que d’une grande ressource, même des annéesd’abondance, puisque cettte manne si chérie dans tous les pays où on la cultive,fait non seulement une nourriture très saine pour les hommes, mais aussi pourles animaux en général. Les vues & les soins patriotiques de M. Mustel, aidés parla bienfaisance de MM. De la Michodière & de Croine, viennent de procurer unerécolte des meilleures espèces de pommes de terre, dont le succès reconnu parplusieurs Laboureurs des environs de la Ville, les a engagés à en demander pouren cultiver. Cette récolte abondante, eu égard au peu d’étendue du champ quiy a été employé, est cependant encore trop insuffisante pour pouvoir donner aupeuple cette anéée les secours que l’on désireroit. [...] Ces pommes ont coûté prèsde 50 sols le boisseau de Paris, rendues à Rouen ; on les distribuera à raison de20 sols, ce qui ne doit avoir lieu qu’en faveur des Cultivateurs qui désirent d’enplanter & qui manquent de correspondances & de moyen pour en faire venir &s’en procurer de bonne espèce. On avertit qu’il faut 12 boisseaux de Paris pourensemencer une vergée de terrain ; mais ce légume à la faculté de multiplier & dese repoduire si abondamment, qu’une vergée bien cultivée peut nourrir plus demonde que ne pourroit faire dix acres de bled. »References: Gazette du commerce N°89, 5 novembre 1768, pp. 882–3Sources: BnF, NUMP-16146
Location: Cany, Montivilliers, RouenDepartment: Seine-Maritime (76)Time: c. 1765Description: « La pomme de terre fut cultivée pour la première fois en Nor-mandie en 1765 ou 1766, par un rouennais, François-Georges Mustel, longtempsavant les expériences de Parmentier dans la plaine des Sablons, en 1788. [...]Bedigis, agent du ministre de l’Intérieur dans le district de Cany, écrit dans sonrapport de septembre 1793 : “la culture des pommes de terre, l’une des plusprécieuses, n’est point encore en usage dans ce département. Les cultivateursmême témoignent pour elle d’une sorte de répugnance, quoiqu’ils aient sous lesyeux des exemples bien propres à faire cesser leur prévention”. Dans cette régionde Monlivilliers, d’après ce rapport, les débuts de la culture de la pomme de terreremonteraient à 1785. »References: Dubuc (1953, pp. 52, 64–5)Sources: unknown
Location: RouenDepartment: Seine-Maritime (76)Time: 1770Description: « Cette plante d’Amérique, qui se cultive dans les jardins & dansles champs, donne aussi des tubercules bons à manger, qui sortent au nombre
86
d’environ quarante, des racines qui se répandent au loin : ils sont égalementestimés des riches & des pauvres. »References: Lieutaud (1770, Vol. 2, p. 420)Sources: BnF, NUMM-9766206
Location: BrieDepartment: Seine-et-Marne (77)Time: c. 1770Description: « Culitvée dans la Brie, dès les premières années du règne deLouis XVI, la pomme de terre servait seulement à la nourriture des bestiaux.[...] Il est de tradtion dans Seine-et-Marne, qu’en ce temps, la pomme de terreappairaissait seulement sur la table de quelques seigneurs qui s’étaient fait lesapôtres de sa propagation, et des classes pauvres, qui trouvaient en elles, unaliment substantiel et économique. [...] En 1785, dit M. Delettre, “la pomme deterre était cultivée dans les jardins du Montois pour la nourriture des bestiaux. En1790, on commença à la cultiver plus en grand pour la nourriture des habitants”. »References: Leroy (1868, p. 404)105
Sources: BnF, 8-LC20-23
Location: Deux-SèvresDepartment: Deux-Sèvres (79)Time: c. 1770Description: « Il y a cinquante ans que les Pommes de terre ont été introduitesdans la Gâtine par M. Bouteiller, médecin à Châtillon ; il en nourissoit ses chiensde chasse, sa volaille, ses cochon ; mais bientôt une foule de préjugés et depetits intérêts s’élevèrent contre cette révolution. [...] Aujourd’hui la culturede la pomme de terre est connue dans tous les villages de la Gâtine. [...] Ilparoît qu’elle commença é s’établir dans la partie sud-est du département desDeux-Sèvres, voisine de celui de la Charente, en 1775, par les soins du comte deBroglie ; et, de là, elle se répandit dans le pays Mellois, mais n’occupoit guèrequ’un ou deux mètres carrés dans les jardins, lorsqu’en 1785, le citoyen Jard-Panvilliers, aujourd’hui sous-préfet de cet arrondissement, y employa à-peu-prèsun hectare [...]. Ce fut surtout dans les années 2 et 3 de la République quela culture de la Pomme de terre s’étendit sensiblement ; le docteur Brisson, en1784, l’introduisit dans le canton de Coulange, arrondissement de Niort, où cetteplant était absolument inconnue ; il en fournit la semence à plusieurs métayers etbordiers [...]. Cependant cette culture ne s’y fait toujours qu’en petit et rest dansun étant languissant. »References: Dupin (1803, pp. 234–5)Sources: BnF, NUMM-84908
105 See also Delettre (1849, Vol. 1, p. 267).
87
Location: SommeDepartment: Somme (80)Time: c. 1760Description: « Un cultivateur attentif à tout ce qui peut être utile à son Pays, &convaincu de ce qu’il peut tirer de la culture des Pommes de terre, s’empresse dedonner au Public le résultat de deux expériences faites avec exactitude, & par luimême ; l’une au commencement d’Avril 1766, & l’autre en 1767. »References:Sources: A.D. Somne, 1C137, Extrait d’un mémoire adressé par le sieur Dottin,maître de poste à Villers-Bretonneux, à M. Dupleix, intendant de Picardie, sur laculture et l’usage de la pomme de terre (impr. 8 p. in-4°, Amiens, 1768)
Location: diocèse d’AlbiDepartment: Tarn (81)Time: c. 1750Description: « Un état des grains semés dans le diocèse d’Albi en 1759 portecomme quantités de pommes de terre semées, 6 setiers seulement ; mais l’état desrécoltes de 1788 pour le même diocèse indique 50 000 quintaux, ce qui, ajoute-t il,représente les trois quarts de l’année commune. La production moyenne auraitdonc été pour le diocèse d’Albi de 66 000 quintaux envrion. On voit par là lesprogrès de cette culturre dans ces trentes années. En 1776, à Saint-Pons, elles sevendaient 50 sols le quintal. »References: Dutil (1911, p. 199)Sources: unknown
Location: Haut-AlbigeoisDepartment: Tarn (81)Time: c. 1770Description: « Vers 1765, l’évêque de Castres, du Barral, faisait de très grandsefforts pour propager cette culture dans son diocèse ; en 1772, elle y est pratiquéedans les vallées des montagnes ; en 1777, Genssane dit que, dans la montagne,les pommes de terre forment presque avec le millet, la nourriture des habitants.L’intendant écrit, en 1788, que la pomme de terre a pris beaucoup d’extensiondans le Haut-Albigeois “depuis quelques années” et qu’elle y sert à la nourrituredes gens de la campagne. On la trouve encore cultivée, en 1776, dans le vallonSaint-Pons sous le nom de “tobinambours”. Avec les châtaignes, les raves etautres légumes, elle fait la principale subsistance des peuples des Cévennes (ainsique du Gévaudan et du Velay) pendant plus de la moitié de l’année. »References: Dutil (1911, p. 198)Sources: unknown
Location: environs de Sorrèze

88
Department: Tarn (81)Time: c. 1790Description: « C’est vers l’année 1790 qu’on essaya la culture de la Pomme deterre dans quelques métairies ; mais elle restait confinée dans les jardins ou autourdes maisons d’habitation. En 1814, elle n’avait pris encore aucun extension [...]. »References: Roze (1898, p. 196)Sources: unknown
Location: BarjolsDepartment: Var (83)Time: c. 1760Description: « Vers le 12 Mai mon Laboureur sema au lieu de plantes despommes de terre presqu’aussi petites que des noisettes, sur numéro 1. [...] Cetteexpérience a eu plus de succès qu j’en attendois. Rangs, 28 toises. Produit, 49livres à 6 deniers la livres. 1 livres 4 sols 6 deniers. »References: Gazette du commerce N°56, 12 juillet 1768, p. 550Sources: BnF, NUMP-16146
Location: VendéeDepartment: Vendée (85)Time: c. 1770Description: « Il y a un peu plus de trente ans que le docteur Loyau et moinous avons commencé à cultiver la pomme de terre dans les champs, pour lanourriture des bestiaux. Ce exemple, qu l’on a vu d’abord avec indifférence, acependant gagné insensiblement. Dans le commencement, les paysans se sontbornées à cultiver ce tubercule dans les jardins, comme légumes ; ensuite ils enont nourri leurs cochons, puis leurs vaches, et maintenant ils l’appliquent à tousles usages domestiques. La culture de cette plante commence à être très étenduedans le Bocage, où on l’associe aux choux et aux raves pour l’engraissement desboeufs- »References: Cavoleau (1818b, pp. 447–8)Sources: BnF, NUMP-7363
Location: VendéeDepartment: Vendée (85)Time: c. 1770Description: « Un bon curé du Bas-Poitou a servi d’encouragement dans toutson canton : depuis trois ou quatre années il consacre à la culture des pommesde terre un terrein dont ci-devant il ne tiroit aucun parti ; son but a été de venirau secours des malheureux dans les temps de cherté : il en consomme chez lui,tant pour sa table que pour ses gens & ses bestiaux ; tous y ont pris goût ; lespauvres viennent maintenant demander, à la porte, quelques pommes de terre,
89
comme autrefois ils lui demandoient un morceau de pain, et il assure que pources différens usages, il épargne plus de cent écus par année, ce qui lui permet defaire d’autres actes de charité. »References: Parmentier (1781, p. 451)Sources: BnF, NUMP-1050360
Location: VendéeDepartment: Vendée (85)Time: c. 1810Description: « La solanée parmentière, ou pomme de terre, longtemps reléguédans les jardins, commence à s erépandre dans les champs ; sa culture est assezétendue dans quelques parties des cantons de Rocheservières, de Montaigu et desHerbiers. Les services qu’elle a rendus pendant la disette qui a suivi la mauvaiserécolte de 1811, a provué qu’elle était beaucoup plus répandue qu’on le croyait ;et, depuis cette époque, elle a pris un grand accroissement ; mais cette culture estbien loin d’être assez étendue, pour être considérée comme un agent principalede l’agriculture de ce département. »References: Cavoleau (1818a, p. 182)Sources: BnF, NUMM-78755
Location: PoitiersDepartment: Vienne (86)Time: c. 1770Description: « Le peuple d’une partie du Haut-Poitou vit de châtaignes perdantplusieurs mois de l’année ; ailleurs il vivroit de pommes de terre ; les tiges,les racines de cette plante, la plante elle-même, sont aussi très bonnes pour lanouriture des animaux domestiques, tels que les chevaux, vaches, cochons &volailles. On vient de nous envoyer de Civray, un échantillon de pain, fait moitiéde farine de froment, & moitié de pommes de terre, selon le procédé indiquédans notre Feuille du 13 Juillet dernier. Nous savons que la culture des pommesde terre commence à se multiplier dans cette Province, & même aux environs dePoitiers ; il s’en trouve très souvent au marché. »References: Affiches du Poitou N°49, jeudi 8 décembre 1774, p. 207Sources: BnF, NUMP-12777
Location: PoitiersDepartment: Vienne (86)Time: c. 1770Description: « On y cultive aussi du chanvre & des pois, ainsi que des pommesde terre dont on tire bon parti, tant pour la table que pour engraisser les bestiaux.Un particulier en a recueilli environ quarante boisseaux dans une demi-boisseléede bonne terre à la vérité ; il les a vendus quinze sols. Cette production n’étoit
90
pas connue ici il y a 10 à 12 ans, & elle est un des moindres bienfaits de l’illustreSeigneur de cette paroisse. »References: Affiches du Poitou N°10, jeudi 7 mars 1776, p. 38Sources: BnF, NUMP-12777
Location: généralité de LimogesDepartment: Haute-vienne (87), Charente (16)Time: c. 1760Description: « On doit mettre au nombre des légumes les Pommes de terre dontla culture commence à s’étendre dans les élections de Limoges et d’Angoulêmeavec succès, et a été essayée dans celle de Tulle cette année [1765] seulement. »References: Schelle (1913a, p. 408)Sources: unknown
Location: généralité de LimogesDepartment: Haute-vienne (87), Charente (16)Time: c. 1760Description: Instruction de la société d’agriculture sur la culture de la pomme deterre et ses avantages dans le Limousin.References: Desmaret (1765, pp. 185–94)Sources: BnF, NUMP-16248
Location: LimogesDepartment: Haute-vienne (87)Time: 1768Description: « Limoges, 22 décembre 1768. Nous faisons ici du pain de pommesde terres, avec un tiers de farine de seigle qui est excellent et meilleur à mon goûtque celui de pur seigle. Nous en faisons aussi avec du froment. Cette économieserait prodigieuse et même excessive par la diminution qui en résulterait dans laconsommation des grains, vu la fécondité de cette production, soit par rapportà la semence qui rend 100 et quelques fois 200 pour un et vu le peu de terrainqu’il faut pour en produire une prodigieuse quantité. Mandez-moi, je vous prie,combien coûte la pomme de terre à Paris en marquant le poids et le volume de lamesure. Je sais qu’on en vend dans les marchés. »References: Schelle (1913b, p. 27–8)Sources: unknown
Location: généralité de LimogesDepartment: Haute-vienne (87), Charente (16)Time: c. 1790Description: « Malgré les efforts de l’intendant Turgot et de la Société d’agriculturede Limoges pour introduire la pomme de terre durant les années 1760, cette
91
culture ne s’est véritablement développée dans la province qu’au cours de ladécennie 1790. »References: Delhoume (2007, p. 255)Sources: unknown
Location: Saint-DiéDepartment: Vosges (88)Time: c. 1660Description: Arrest de la cour portant réglement pour la dixme des Pommes deterre qu’elle sera payée sur le pied de la grosse Dixme, lorsqu’elles seront plantéesou ensemmencées sur les terres sujettes à la grosses Dixme. Du 28 juin 1715. «[...] Quoi que cette contestation ne soit née qu’au sujet de la dixme d’un fruitvil et grossier, qui semble plutôt desitné à la nourriture des animaux qu’à celledes hommes ; cependant cette cause ne laisse pas d’être de quelque importantce,parce que ce fruit étant devenu for commun dans toute la Vosge, surtout dans letemps malheueux que l’on vient d’essuyer, elle intéresse d’un côté grand nombrede Communautez et de l’autre beaucoup de Décimateurs, pour lesquels l’Arrêtqui interviendra servivre de réglement. [...] Il est vrai que ce fruit, qui estconnu dans la Vosge depuis environ cinquante ans, se plante ou se seme versle mois de Mars ou d’Avril, tantôt deans des Potatges, ou Vergers, tantôt dans desChenevières, quelques fois dans des terres arrables au lieu de sgrains, commedans les terres de Mars ; mais bien plus ordinairement cependant dans les terresde repos [...]. »References: (1867, pp. 301–2)Sources: BnF, NUMP-6634
Location: La Broque, Saint-Dié, val de CellesDepartment: Vosges (88)Time: c. 1690Description: « Cette plante fut introduite dans les Vosges par les vallées deSchirmeck et de Celles au seizième siècle, [...]. Les Vosgiens font honneurs decette plante aux Suédois, parce qu’en effet sa culture ne se répandit dans lesVosges que vers le milieu du dix-huitième siècle, et que jusqu’alors elle était restéecirconscrite dans les jardins tout au plus dans quelques chenevières. [...] Ce futle curé de la Broque, Louis Piat, qui, le premier, exigea de ses paroissiens la dîmedes pommes de terre. Sur leur refus, une sentence du prévost de Badonvillers,du 19 octobre 1693, les condamna à livrer à leur curé le cinquantième du produitpour tenir lieu de dîme. Cette sentence déclarait les habitants de la vallée deCelles à la même servitude. [...] Le chapitre [du val de Saint-Dié], témoin de lamisère causée par les ravages de la guerre, fut plus généreux que le curé de LaBroque et n’exigea la dîme qu’après une culture libre de cinquante ans. »References: Gravier (1836, pp. 318–9)
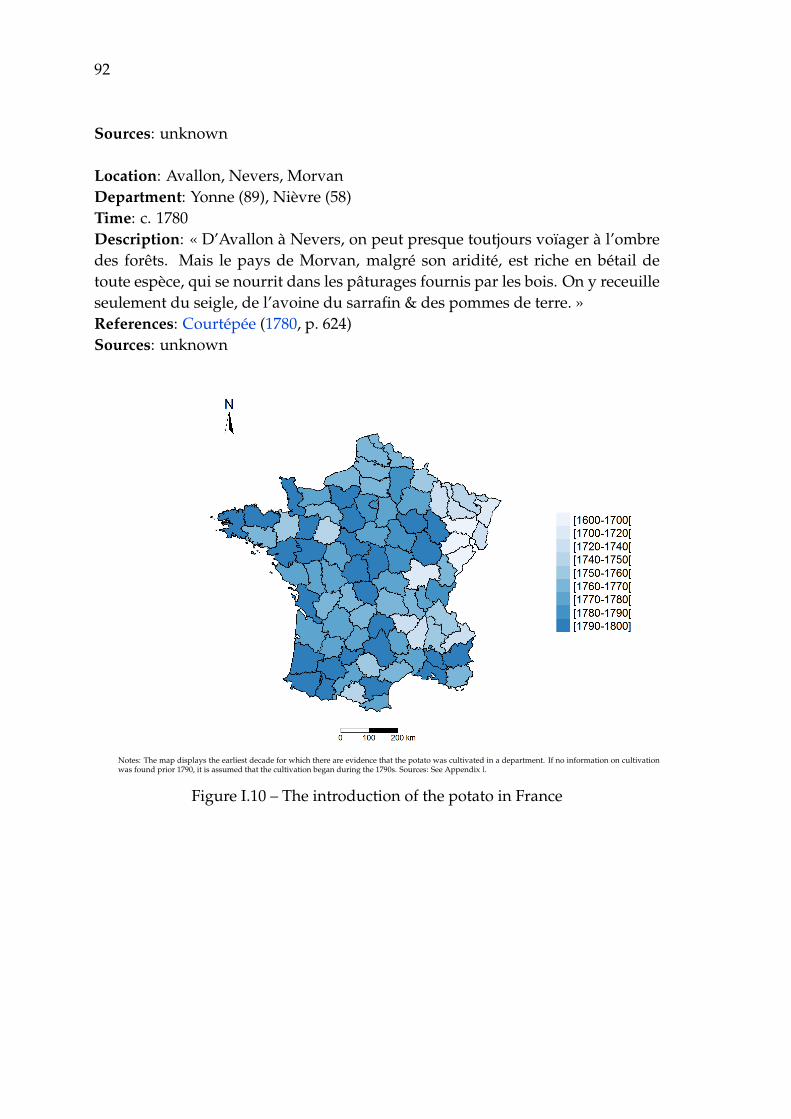
92
Sources: unknown
Location: Avallon, Nevers, MorvanDepartment: Yonne (89), Nièvre (58)Time: c. 1780Description: « D’Avallon à Nevers, on peut presque toutjours voïager à l’ombredes forêts. Mais le pays de Morvan, malgré son aridité, est riche en bétail detoute espèce, qui se nourrit dans les pâturages fournis par les bois. On y receuilleseulement du seigle, de l’avoine du sarrafin & des pommes de terre. »References: Courtépée (1780, p. 624)Sources: unknown
Notes: The map displays the earliest decade for which there are evidence that the potato was cultivated in a department. If no information on cultivationwas found prior 1790, it is assumed that the cultivation began during the 1790s. Sources: See Appendix I.
Figure I.10 – The introduction of the potato in France

Chapter II
Do the Right Thing! Leaders,Weather Shocks and Social Conflictsin Pre-Industrial France
“I can only rejoice at the motives, which make you think that itis indispensable to provide for the subsistence of the impoverishedinhabitants who lost everything, to supply them with seeds for thenext crops, and to postpone the recovery of taxes.”
Letter from Abbot Terray to Emmanuel de Guignard de Saint-Priest, intendant of Languedoc, July 23, 1773. A.D. Hérault, C5458.
Natural hazards and weather shocks lead populations to experience highly
unstable socio-ecological environments. With global warming, the revival of this
phenomenon reaches public debates in developed countries. For instance, in
October 2016, the French agricultural Minister was constrained to announce a
set of drastic temporary measures to cope with the expected decrease in farm-
ers’ revenue the following disastrous weather conditions during the preceding
summer and spring.1 In developing countries, where reliance on agriculture
and primary goods is substantial, “climate change can indirectly increase risks of
violent conflicts in the form of civil war and inter-group violence by amplifying
1 Heavy rains and the lack of sunshine around the crop flowering period inhibited the yieldpotential of the crops as a whole. Water deficit and dryness during summer further reducedpotential yields leading to a 30 per cent fall from the 2015 harvest, and a fifty-year high dropin French wheat production (Ben-Ari et al., 2016; Ben-Ari et al., 2018, pp. 2–4). The measuresincluded tax deferrals, the advancement of the payment of the Common Agricultural Policy aid,and the possibility of postponing loan repayments. See Pacte de consolidation et de refinancementdes exploitations agricoles. Ministry of Agriculture, Agrifood, and Forestry, October 4, 2016(http://agpb.fr/sites/default/files/pacte_consolidation_02.pdf).
93

94 Chapter II. Leaders, Weather Shocks and Social Conflicts
well-documented drivers of these conflicts such as poverty and economic shocks”
(Field et al., 2014, p. 19).
In fact, this phenomenon is not only relevant nowadays by affecting at
different scales both developed and developing economies. It is also and mainly
a historical phenomenon. Recent research documents the link between climatic
stress, and its impact on the economy, to political instability in pre-industrial
societies (Christian and Elbourne, 2018; Manning et al., 2017; McMichael, 2012).
Over time, it also shaped episodes of food shortages, famines, population
displacements and violence.2 For instance, two centuries ago the Southern region
of France, Languedoc, experienced repeated floods that damaged the harvest of
crops and resulted in an estimated loss of more than nine millions livres tournois
(hereafter £) leaving many peasant households on the brink of poverty.3 A
few months later, on 25 April 1773, a group of women gathered in front of the
palace of the intendant of Languedoc in the city of Montpellier, to protest against
the scarcity of grains. Emmanuel de Guignard de Saint-Priest, the intendant,
reassured them that there was no shortage, but failed to prevent the crowd from
searching for hoarded grains in merchant facilities.4 Soon after, the intendant
summoned every grain merchants of the city to gather information on their stocks
of grain, and to set a maximum price for wheat.5 He simultaneously wrote to the
Controller-General of Finances in Paris to inform him about the situation and
the necessity to provide for the subsistence of the poorest, to distribute grains to
peasants who would need it to crop their fields, and to postpone the recovery
of taxes. A few weeks later, the intendant received a letter from the Controller-
General congratulating him for his actions. By the end of 1773, there had been no
more uprising in the city of Montpellier and its surroundings.
2 Communities were adaptive in the face of these shocks, which contributed to shape humanbehaviour, political institutions, and culture in the long-run (Degroot, 2018). For instance,Buggle and Durante (2017) document that the exposure to higher climatic risk in pre-industrialtimes reinforced cooperation in exposed communities. This in turns favoured the emergence ofnorms of generalised trust and institutions that persisted until today.
3 In comparison, the average income of a farming household amounted to £200 a year during the18th century. A.D. Hérault, C 5458.
4 Prior to 1789, France was divided into 32 provinces at the head of which was place an intendantappointed by the King. Intendants had power in the sphere of finance, justice, and police, whichmeans that they collected taxes, regulated trade, controlled prices, managed the construction ofroads, and provided what relief existed (see Section 1.2).
5 A.D. Hérault, C 2875 and C 2914.
95
In this chapter I examine whether variations in the level of local experience
of provincial leaders is a plausible mechanism to explain spatial variations in
social conflicts triggered by weather-related economic shocks. The intendants
were a group of 32 individuals appointed by the Crown on a discretionary basis
to administer French provinces. Most of them came from wealthy aristocratic
families, had received a legal training, and worked as a high-ranking judicial
officer prior to their appointment. The position of intendant often represented an
important step in one’s career, but rarely the final one, as the average age at first
appointment was thirty five. They were usually not appointed in their province
of origin and it took them time to learn about the economic and agricultural
structure, custom practices, the functioning of local institutions, and the role of
local notables in their new province. That means they differed mainly in the level
of provincial experience they had, a factor of prime importance to run efficiently
the daily tasks associated with their positions. I provide evidence that the set
of tools at intendants’ disposal, such as tax breaks, grains distribution, and the
creation of temporary workhouses, allowed them to implement efficient policies
to reduce the negative effects of transitory economic shocks.
I use archival sources and secondary literature to gather detailed information
on the professional careers for the universe of French provincial intendants
between 1661 and 1789. I combine this new data set with district-level data
on the occurrence of social conflicts and fine-grained seasonal temperature
data. My estimation strategy is similar in spirit to a difference-in-differences
strategy, and compares the likelihood of social conflicts in districts exposed to
weather shocks versus those which were not, across provinces administrated by
intendants with various years of local experience. I find that provincial leaders
with more years of local experience were better able to reduce the onset of
weather-induced conflicts.6 A one standard deviation increase toward warmer
temperature increases the probability of social conflicts and food riots by 5.3%
(mean = 1.87) and 19% (mean = 0.28), respectively. I show that the effect of
temperature shocks was larger in provinces in which a new intendant was just
appointed. On average, it took intendants five years of local experience to
6 One concern is that the intendants stayed longer in more peaceful provinces. I address the issueof reverse causality in Section 3.2.

96 Chapter II. Leaders, Weather Shocks and Social Conflicts
completely mitigate the effect of temperature shocks. Through years of local
experience, the intendants accumulated human and social capital to administer
efficiently their province. I argue that this factor is key in explaining the speed
and effectiveness of institutional responses to weather-induced shock. This
interpretation is supported by historical evidence.
I supplement these findings by providing evidence on the mechanisms un-
derlying the relationship between temperature shocks and conflicts. I collect data
on grain prices at (i) the provincial level between 1756 and 1789; (ii) the district
level for 1767–8 to analyse the effect of temperature shocks on price volatility, and
thus real income. Before the French Revolution, markets were not sufficiently
integrated to smooth the effect of weather-induced crop shortages, and increases
in temperature shocks significantly raised wheat prices. Given the importance of
bread in the household consumption basket, this, in turn, translated into strong
negative transitory income shocks for most of the households. I estimate the
effect of grain prices on social conflicts via Two-Stage Least Squares (2SLS), where
I instrument wheat prices by summer temperature shocks. The level of wheat
prices has a positive and significant impact on the likelihood of subsistence-
related conflict, which included events like food riots, the looting of public
granary and the like.7
I further investigate the role of poor relief and its efficiency in pre-industrial
Europe by analysing the role of the tithes and monastic charities as a buffer
against negative transitory economic shocks. The tithe was a compulsory contri-
bution to religious institutions equal to one-tenth of the agricultural production.
The Catholic canon law states that one-third of the income derived from the
tithe had to be devoted to poor relief and charity. I collect data on more than
one thousand in commendam monasteries’ income at different points in time.8 I
provide evidence that the tithes often represented a significant– up to half– share
7 These results are in line with recent studies documenting the importance of temperature inexplaining winter wheat yield volatility (Albers, Gornott and Hüttel, 2017; Ben-Ari et al.,2016, 2018). They are also consistent with previous historical research emphasising the roleof weather-related disasters as drivers of some social upheavals in early modern France(Le Roy Ladurie, 1974, 2006; Lefebvre, 1972, pp. 339–74; Nicolas, 2002; Rudé, 1964).
8 Monasteries in commendam had abbots and abbesses, appointed by the king, who had noreligious activities and exercised no authority over the inner monastic discipline. However,they drew a significant share of abbeys’ income, which they used to cover their personalexpenditures.

97
of their total income, but that monasteries often failed to respect the canon law
regarding the use of the tithes. I then compare the effect of weather shocks
on the likelihood of social conflicts between districts where total monasteries’
income per capita was high to districts where total monasteries’ income per
capita was low. I find that districts in which monasteries’ income per capita
was higher were less resilient to temperature shocks and more prone to food
riots. This result suggests that while monasteries were extracting parts of the
agricultural output through the tithes, they might not have redistributed enough
of it in times of dire need, leaving the population worse off. I complement these
findings by using a unique historical experiment. In November 1694, the King
enforced a new temporary law to constraint abbeys without an abbot at their
head to spend one third of their income in poor relief, which is equivalent to the
customary amount devoted to poor relief in the religious canon. Cetiris paribus,
the likelihood of social conflicts was lower in districts in which there was at
least one abbey concerned by this law than in other districts. This set of results
suggests that religious poor relief could be an efficient insurance system against
negative transitory economic shocks induced by weather shocks. Religious
institutions (monasteries), however, often escaped their obligations, and left local
communities in worse off situations.
Related literature. My work relates to a large literature that studies the role of
political leaders on economic and non-economic outcomes (Besley, Montalvo and
Reynal-Querol, 2011; Hayo and Neumeier, 2014; Jones and Olken, 2005; Yao and
Zhang, 2015). Jones and Olken (2005) were among the first to provide causal
empirical evidence in favour of the hypothesis that leaders matter for economic
growth. They use unexpected deaths of leaders while in office as a source of
exogenous variation to show that these leadership transitions have a significant
impact on countries’ pattern of economic growth. Yao and Zhang (2015) use
the fact that a large number of Chinese local leaders are periodically shuffled
across cities to estimate their impact on local economic growth. They show that
local leaders also matter. Rochlitz et al. (2015) find that high economic growth
is associated with career advancement for regional leaders in China, but not in
Russia. Comparing the promotion system for regional bureaucracies between the

98 Chapter II. Leaders, Weather Shocks and Social Conflicts
two countries, the authors argue that performance-related incentive schemes are
important to achieve specific policy results.9 In a similar fashion, Jordan, Turban
and Wilse-Samson (2013) emphasise the importance of information transmission
to foster good (successful) practices among Chinese local leaders. Disseminating
knowledge to subsequent leaders is particularly important given that leaders
with higher levels of experience are found to perform better in terms of economic
outcomes than their peers with less experience (Feld and Schaltegger, 2010;
Moessinger, 2014). That is all the more important because evidence brought by
Geys (2017) suggests that informal social networks, such as family connections,
result in a misallocation of resources: dynastic individuals with lower education
levels relative to their non-dynastic peers have higher chances of being selected.
These could be detrimental for two reasons. First, higher levels of education
among political leaders is associated with better economic performances (Besley,
Montalvo and Reynal-Querol, 2011). Second, the moral hazard problem may
lead dynastic politicians to reduce their effort to implement good policies and/or
promote economic growth knowing that they have higher chance to stay in
power (Rossi, 2017). I contribute to this literature by documenting how French
provincial leaders– the intendants– could affect non-economic outcomes, such as
social conflicts. I show that the effect of weather shock on conflicts was smaller
in provinces administered by intendants with more years of local experience.
This result suggests that the human capital endowments of local leaders was an
important factor in the mitigation of weather shocks (Acemoglu, Gallego and
Robinson, 2014).
My findings also provide new empirical evidence on the links between
weather shocks and intergroup conflict in past societies. Jia (2014) links droughts
and floods to peasant revolts in historical China, via negative income shocks. She
shows that droughts raised wheat and rice prices by seven to ten per cent, which
could explain how drought contributed to trigger peasant revolts. Focusing on
Ancient Egypt, Chaney (2013) provides similar evidence that Nile floods led to
an increase in the number of references to high food prices and in the incidence
of popular unrest. These studies are complementary to recent scholarship
9 However, they underline that the combination of centralised personnel control with regionalpolicy autonomy is less effective in achieving multiple objectives simultaneously.
99
documenting the impact of weather shocks on the onset of intergroup conflicts:
in Africa (Boxell, 2017; Christian and Fenske, 2015; Papaioannou, 2016); in China
(Bai and Kung, 2011; Chen, 2015; Kung and Ma, 2014; Pei and Zhang, 2014); in
Europe (Anderson, Johnson and Koyama, 2017; Iyigun, Nunn and Qian, 2017); in
Japan (White, 1995); in Mexico (Dell, 2012).10 A growing body of this literature
attempts to identify factors mitigating the effects of weather shocks. For instance,
Jia (2014) and Iyigun, Nunn and Qian (2017) show that the introduction of sweet
and white potatoes, respectively in China and in Europe, reduced the incidence
of conflict. Chen (2015) points to the importance of government disaster relief as
an efficient mitigation strategy against negative weather shocks in pre-industrial
China.11 Similarly, Greif and Iyigun (2013b) show that the Old Poor Law was
an efficient mitigation mechanism in 17th and 18th-century England: the higher
amount of resources allocated to poor relief in a given county, the lower the
number food riots per year.12
In this regard, my work also relates to the literature on poor relief in pre-
industrial Europe. Van Bavel and Rijpma (2016) indicate that formal poor relief
could have represented up to three per cent of the GDP in England and the Low
Counties, and provided support to around ten per cent of the population. Levels
of formalised relief were nonetheless much lower in France, approximately half a
per cent of GDP, with the North much better provided for than the South.13 Tithes
may have provided additional poor relief to bring total social spending to one per
cent of GDP, but the paucity of data on this question renders precise estimates
10 Another stream of the literature focuses on the historical relationship between weather shocksand interpersonal conflict (Bignon, Caroli and Galbiati, 2017; Mehlum, Miguel and Torvik, 2006;Oster, 2004), and between various types of economic shocks and conflict (Dube and Vargas,2013; Fenske and Kala, 2017; Jedwab, Johnson and Koyama, 2017). For a complete overviewof the literature linking weather-induced and economic shocks to conflicts, see Blattman andMiguel (2010), Burke, Hsiang and Miguel (2015), Dell, Jones and Olken (2014), and Dixon (2009).
11 The importance of state’s actions is also highlighted by Hung (2009). During the Qing Dynasty,the evolution of the state capacity shaped protesters’ strategies. Moving from violent reactiveactions in the 17th century, protest became proactive and more peaceful during the 18th centurywhen the state capacity of the Qing reached its maximum.
12 They further show that the effect is limited to social conflicts driven by economic motives.Government relief policy had either no effect or statistically positive and significant effect onthe incidence of land and enclosure related social disruptions.
13 Van Bavel and Rijpma (2016, pp. 178–9).
100 Chapter II. Leaders, Weather Shocks and Social Conflicts
difficult.14 My contribution here is twofold. First, I provide additional evidence
that weather shocks were an important determinant of social conflicts in past
societies.15 I emphasise the importance of income as a transmission mechanism
between weather shocks and social conflicts.16 As such, the effect of weather
shocks on different types of social conflicts is heterogeneous, suggesting that
studies that focus on aggregate measures of conflicts actually underestimate the
effect of weather shocks. I also add to the stream of French historiography on
the sources of popular violence and disorders in early modern France. (Bercé,
1974; Bouton, 2000; Le Roy Ladurie, 2006; Nicolas, 2002; Pillorget, 1975; Porchnev,
1963; Tilly, 1972).17 Second, I provide empirical evidence that tithes may have
not constituted an efficient system of poverty relief, because religious institutions
escaped their obligations.
The chapter proceeds as follows: Section 1 depicts the socio-economic situa-
tion of France prior to the French Revolution, and emphasises various remedies
that could help to mitigate the effects of weather shocks and presents historical
evidence of how they could work. Section 2 describes the data sources and the
construction of the data. Section 3 presents the empirical model and the results.
Section 4 concludes.
1 Historical background
In this section, I present a historical overview of the French economy and its
vulnerabilities to weather shocks during the 17th and 18th centuries, before
detailing the institutional structure of the country and the role of intendants.
14 In the Middle Ages the introduction and formalisation of the tithe offered a new form of poorrelief. The tithe was intended to sustain parish priests, maintain church buildings and providealms for the poor (Arnoux, 2010, pp. 150–1). Theoretically, from one-fourth to one-third of thetithe was meant for the poor, which would have represented £20–45 millions per year in the18th century. See Brumont (2010) for a literature survey on tithe in early modern France.
15 Le Roy Ladurie (1960) warns that climate determinism makes little sense in historical studies oftraditional societies. In particular, Ladurie, Berchtold and Sermain (2007, p. 261) note that “theidea of a weather mono-causality of the French Revolution would be absurd. The challenge isto examine, so to speak, the ecological-climatic context, which is just one factor among manyothers: cultural, political, economic, demographic, etc.”.
16 For more details on the plausible mechanisms driving this relationship and a brief overview ofthe theoretical background, see Appendix II.A.
17 For a literature survey, see Le Roy Ladurie (1974), Lemarchand (1990), and Aubert (2015).
101
Finally, I discuss the organisation of state-led and religious poor relief in times
of dire need.
1.1 The French economy before 1789
By 1789, France offered a picture of a pre-industrial society characterised by a ru-
ral economy, in which small industries, such as textiles, had begun to mushroom
everywhere over its territory (Markovitch, 1976a, p. 476). The total economic
output remained nonetheless largely dependent on rain-fed agriculture, which
involved from seventy to eighty per cent of the population, most of which lived
in villages of less than or equal to 2,000 inhabitants.18
Agriculture was characterised by its regional heterogeneity in terms of organ-
isation and practises.19 Hoffman reports regional differences in the growth of
factor productivity of agriculture in the 17th and 18th centuries. The Paris Basin,
an open-field area where fertile land left almost no space for livestock breeding,
was the fastest growing region. While it was certainly an efficient organisation
to achieve high agricultural productivity, it also left many agricultural workers
landless. These workers were particularly vulnerable to the quality of the harvest,
on which their wages depended, and subsequent price volatility. In the south
and the west, the property of the land was more equally distributed, and en-
closure rather open-field dominated the agricultural landscape. The production
also tended to be less market-oriented allowing the farmers to organise their
production to minimise the risks of harvest shortfall (Jones, 2012).
From the early 17th century onward, the introduction of New World crops
offered new possibilities of agricultural diversification and helped to improve
the resilience of the local communities (Goldstone, 2012). For instance, as
early as 1603, maize was given to the needy in the hospice of Bourg-en-Bresse.
Introduced in the 1660s in the southwest of France, maize was quickly integrated
in the agricultural mix to reduce vulnerability to weather shocks (Frêche, 1974;
Ponsot, 2005). The spread of potatoes cultivation was, by contrast, much slower.
Until the early 19th century, potatoes were mostly used to feed livestock in
18 This section draws heavily on Doyle (2011), Hoffman (2000), Le Roy Ladurie (2015), and Parker(2002). For a more detailed description, see Chapter I.
19 Appleby (1979, p. 870) notes that “it is foolhardy to speak of ‘French agriculture’ when in factthere were many regional agricultural systems”. See also Hufton (1983, pp. 305–10).
102 Chapter II. Leaders, Weather Shocks and Social Conflicts
many regions, and occasionally as filler in recipes during years of poor harvest
(Morineau, 1970).20 Although the introduction of these new crops helped to
improve resilience against transitory economic shocks, it could not completely
prevent harvest failures engendered by weather shocks.21 In Vivarais, long-
lasting droughts during the spring and summer of 1754 impacted 176 parishes
and reduced agricultural output by an estimated £796,049. Seventeen years later,
the damaged amounted to £1,568,080, and official reports highlight that both
grains and “olives, potatoes, and grapes suffered a lot” (Molinier, 1985, 17–31).
Detrimental weather conditions were many, and sequences of good harvest
rarely lasted more than four or five consecutive years. These conditions are the
same as today, and include extended and extreme cold in winter, late spring frost
and hailstorms, as well as heat stress during the spring and summer (Béaur and
Chevet, 2017; Goldstone, 2012; Grenier, 1996; Le Roy Ladurie, 2006). For instance,
droughts impede wheat performance at all growth stages, but are even more
detrimental during grain-filling stages (May–June). Cold temperature during
spring delays the flowering stage of wheat and increases vulnerability to late
frost, which overall results in lower yields.22 Other sporadic events, as detri-
mental to agricultural production as temperature shocks, includes hailstorms,
landslides, and floods (Antoine, 2009; Lachiver, 1991; Pichard and Roucaute,
20 On the introduction of other New World crops in France, see Nassiet (1998) for buckwheat, andFrêche (1974) for maize. On the factors driving farmers to choose such-and-such new crops, seeVouette (2007, pp. 207–42).
21 Nunn and Qian (2011) show that, due to better nutritional qualities, higher resistance to weathervariations, and higher yields than any traditional crop, the introduction of potatoes cultivationhad a positive impact on population growth and urbanization in Europe. Cook (2014) contendsthat the impact was even stronger in regions where potatoes consumption was complementedwith milk consumption.
22 Very low temperatures during winter can reduce the number of tillers and thus lead to areduction in crop density (yield). On the contrary, important positive temperature anomaliescan result in fewer heads and reduce resistance to frost (vernalisation), which has a negativeimpact on yields (Ceglar et al., 2016, p. 64). Flowering time is key to adaptability and yieldpotential of wheat, and as such is one of the most important phenological stages in cropdevelopment (Langer, Longin and Würschum, 2014). To better control the flowering period,it is possible to adjust the sowing time in autumn. Adverse weather conditions for ploughingand planting are then linked to over-wet conditions. Rainfall plays an equally important roleduring the rest of the year, as heavy rains could cause nutrient leaching as well as wreak havocon standing crops. The effect of rainfall extremes on wheat yield is, however, lower than thoseof temperature (Mäkinen et al., 2018, pp. 212–15).

103
2014).23 While individuals can adapt to altered growing conditions in the
long-run, coping with year-on-year environmental uncertainties and weather
variations is much harder. Bad harvests drove up crops prices–to a greater or
lesser extent– and most of the time, the reduction in the volume of crops available
for market outweighed the gain in price, leaving farmers in precarious situations.
The effect of the shock could be accentuated by the fact that farm unemployment
increased due to smaller crops. In urban areas, high food prices represented a
direct negative income shock for most dwellers. The problem of feeding the
people loomed throughout the 17th and the 18th centuries and was a constant
concern of the royal administration because these recurrent episodes of weather-
induced crop failure increased poverty stress, and sometimes malnutrition, and
created the ideal ground for the onset of social disorder.24
In these conditions, that agricultural production rose strongly from the first
half of the 18th century onwards is crucially important. Surpluses could be
traded to foreign provinces and/or stored to be used for poor relief later on.
These improvements in agricultural productivity were widespread across French
regions, though unequally distributed (Goy and Ladurie, 1982; Hoffman, 2000;
Le Goff and Sutherland, 2000).25 Urban demand and market opportunities
were the main driver behind the raise in agricultural productivity.26 However,
23 Lachiver (1991, pp. 472–528) provides numerous narrative evidence depicting these events andtheir consequences on local communities. Goldstone (2012, p. 201) highlights that “lackingartificial fertiliser, the output of crops was limited by the fertility of the soil, the beneficence ofclimate, and the toil that could be drawn from human and animal labour”. See also Garnier andSurville (2010, pp. 272–528). Extreme cold during winter was also devastating in past societiesbecause in addition to leading seeds to freeze in the ground, it required higher calorific intaketo sustain the basal metabolic rate stable without loosing weight. It also often impeded thecirculation of grains.
24 For a theoretical overview the link between income shocks, grievances and conflicts, see Collierand Hoeffler (1998). For empirical evidence, see for instance Bazzi and Blattman (2014); Dubeand Vargas (2013); Miguel and Satyanath (2011).
25 Goy and Ladurie analyse the evolution of the tithe, a proxy for agricultural production, acrossseveral regions. They find that wheat yields improved by 20 to 40 percent between 1650 and1790.
26 On the supply side, cities provided large amount of fertilisers, which helped to increase thefertility of soil in the surrounding areas. On the demand side, the spatial aggregation of demandin these cities was strong enough to create an urban demand stimulus fostering agriculturalinvestments and productivity gains (Miller, 2009). In this regard, the example of Champagne isilluminative. During the 18th century, the increasing demand from consumers in urban centresprompted changes in the vineyards of Champagne, and led winegrowers to invest heavily innew equipment, and produce higher quality white wine. By 1789, 40 per cent of the totalproduction was bottled, whereas this practice was nearly non-existent before 1700 (Musset,2011).
104 Chapter II. Leaders, Weather Shocks and Social Conflicts
high transportation costs and substantial fixed costs involved in storing grain
surpluses and preparing them for the distant market limited the interest in grain
exportation from peripheral areas (Daudin, 2010; Grantham, 2007; Hoffman,
2000). In 1770, Auguste Auget de Montyon, the intendant of Riom in Massif
Central, complained that “mountains make communication so difficult that trans-
portation costs are as high between Clermont and Aurillac as between Clermont
and Paris”.27 These difficulties of transportation, as well as internal customs
barriers, seigneurial tolls and trade legislation, limited market integration both
at the regional and the national levels. It was, therefore, common that “within a
region, wheat prices could easily double from one place to another” (Labrousse,
1931, p. 131).28 Figures II.13 and II.15 visually demonstrate the weak market
integration in the second half of the 18th century. In Flanders (1765) and
Brittany (1771), two provinces with relatively low geographical barriers and short
distances between markets, variations in wheat prices were as high as 25 per
cent around the provincial mean.29 Grain prices were then very sensitive to
harvest, and harvest failures were a significant part of many subsistence crises
that happened in France during the 18th century.30
In a seminal book, Sen (1981) suggests that famines often originated in
distribution (market) failure rather than in the decline of food availability per
27 Cited in Leymarie (1956, p. 301). The distance between Clermont-Ferrand and Aurillac is 156km. The distance between Clermont-Ferrand and Paris is 423 km. Twenty years later, J.-M.Lequinio made similar statement during a speech at the National Assembly: “Sometimes wheatis abundant in the departments of the center of France while coastal departments are lackingit, in particular those of Midi. Land transportation would increase so much the prices of thiscommodity [wheat] that it is impossible to use it. Numerous departments remain exposed to thehorrors of dearth while some others remain unnecessarily endowed with abundant harvest”.Archives Parlementaires de 1787 à 1860, Tome LIV, p. 13.
28 Similarly, Labrousse (p. 139) notices that if “trend in prices more or less coincide [betweenregions], cyclical and annual variations, as well as the intensity of the long-term trends arevery different”. The situation persisted at least up to the 1830s when grain market was not yetintegrated in France (Franck and Galord, 2017, p. 19).
29 Other factors, such as seigneurial tolls and internal customs duties, impeded the integration ofgrain markets and contributed to create long lasting regional disparities in cereal prices.
30 The situation was not fundamentally different in England up to the beginning of the 19thcentury Campbell and Ó Gráda (2011). For a discussion on the causal link between weatherconditions and grain prices, see Grenier (1996).

105
head (entitlement).31 Ó Gráda and Chevet (2002) have studied the role of grain
markets during the 1693–94 and 1709 crises. They find that, despite an apparent
balkanisation of markets, there is no evidence that these famines got worse
because of the poor market integration. Until the early 18th century, population
pressure and major crop failures were the main drivers of famine. Only after
1710, the role of human political agency became important in some areas (Alfani
and Ó Gráda, 2018). These results, however, provide no insight on how market
integration could influence social conflicts, and more specifically subsistence-
related conflict. Nicolas (2002) provides many examples of food riots in which
those who needed food and those who commercialised it clashed over hoarded
supplies, over transports on highway and river, or over excessive prices.32 At the
same time, higher levels of market integration helped to stabilise prices and to
reduce the size of the income shock associated with crop failures.
1.2 Administrative organisation and the role of intendants
Since the early 17th century, France, along with other European states, was
getting more centralised, and many improvements had been made in terms
of provincial administration.33 By 1789, France was divided in 32 provinces,
named généralités, which were themselves divided into nearly 700 districts,
named subdélégations.34 France was further divided between Pays d’Élection,
Pays d’Imposition, and Pays d’État. In the latter, local Parliament persisted and
remained an important political authority competing with the intendants (Beik,
31 Defining entitlement as the “set of alternative commodity bundles, any one of which theperson can decide to have’ (p. 45), Sen argues that starvation occurs either through a fallin the endowment bundle, or through an unfavourable shift in the exchange entitlementmapping (that is to say “the set of alternative commodity bundles that the person cancommand respectively for each endowment bundle” (p. 46)). Market failure being one of thisunfavourable shift.
32 Tilly (1972) has argued that higher level of market integration led to new form of food riotsaround grain movements during the 18th century. I depart from her by focusing solely on theimportance of transitory deprivation, but I do not contend that these structural changes in thepolitical economy of France were not an important factor.
33 Johnson and Koyama (2017) provide a useful survey on the origins and the consequences of therise of state capacity. On the organisation and the evolution of French state and administration,see Collins (2009).
34 These subdélégations were composed of a various number of élections.
106 Chapter II. Leaders, Weather Shocks and Social Conflicts
2005; Bordes, 1960; Swann, 2001).35 For instance, local Parliaments continued
to annually consent to make a free gift to the Crown, and accordingly decided
by themselves the allocation of taxes (taille) between each élection. The role of
intendants was thus more limited in Pays d’État. They could only manage new
taxes, such as the capitation (head tax) implemented in 1695 (Swann, 2001). By
contrast, in Pays d’Élection, intendants allocated taxes on the behalf of the King
between each district, and then between each parish within each district.36
As royal commissioners and heads of généralité, intendants had power in
the spheres of finance, justice, and police, which means that they collected
taxes, regulated trade, controlled prices, managed the construction of roads, and
provided what relief existed.37 John Law, a Scottish economist who had been
Controller-General of Finances in 1720, once stated that “I never would have
believed what I saw when I was Controller General of Finances. The fact is
that the kingdom of France is ruled by thirty intendants. [...] They are thirty
Masters of Requests assigned to the provinces on whom depend the bad or good
fortune of these provinces, their abundance or their sterility”.38 There was neither
civil service regulations detailing the requirements for becoming intendants, nor
official examinations used to qualify them, or educational institutes to train
them. Though, about two third were high ranking judicial officers prior to
their first appointment, and 89 out 90 intendants studied by Gruder (1968)
35 In every military province, which were a different type of administrative subdivision, an officerusually chosen from the highest nobility monitored affairs related to military and diplomaticpolicy. There was also a fierce competition between these provincial governors and theintendants.
36 Pays d’Imposition represented an intermediary situation. Local institutions remained in use,but the intendant had power in every field. The status was only granted to provinces newlyconquered. For more details about the organisation of taxation in early modern France, seeSection 3.1.
37 In 1764, the Abbé Expilly (1763–68, Vol. 3, p. 830) defined the intendants as follow: ‘CesIntendants sont des Magistrats, pris pour l’ordinaire parmi les Maîtres des requêtes, & envoyépar le Roi dans les provinces pour y avoir l’inspection & la direction de la justice, de la police &des finances, & pour y donner ordre aux affaires extraordinaires. En un mot, dans une province,l’Intendant eft proprement l’homme du Roi, chargé de veiller à ses intérêts, & d’avoir soin deceux du peuple.’
38 Cited in D’Argenson (1869a, p. 43)
107
had been lawyers, suggesting they must have had a university degree in law.39
Many of them came from a wealthy aristocratic family that could afford paying
for a university degree and the purchase of the title of Master of Requests or
other high-ranking offices. In addition, Gruder (1968, pp. 48–9, 97–102) reports
that, throughout the 18th century, at least 70 per cent of the intendants were
born in Paris or had served in Paris, and had limited knowledge of provincial
affairs. Intendants constituted a relatively homogeneous group in terms of socio-
economic and professional background.
Intendants were appointed directly by the King, and the position was revo-
cable. Its holder was, therefore, completely the King’s servant. On average,
individuals were appointed at the age of 35, held the position two times, and each
nomination lasted about 40 months (Armstrong, 1972, p. 16; Biard, 2007; Gruder,
1968, pp. 17–96). Though, exceptions existed and some intendants refused
to be transferred to another position because they desired to serve tirelessly
their province. For instance, Louis-Urbain Aubert de Tourny, who was born in
Andelys in Normandy, held the position of intendant of Guyenne (Bordeaux)
from 1743 to 1757. When they served well, they often had the opportunity to
pursue their careers with appointment to high office in Paris. Thus, obtaining
a position of Councilor of state (Conseiller d’état) was certainly a sign of prestige
and promotion for intendants, in addition to be a more lucrative position.40 The
most famous example of promotion might be Anne Robert Jacques Turgot, who
after being intendant of Limoges for about a decade became Controller-General
39 Between 1771 and 1789, 43 per cent of the Master of Requests were members of the Parliamentof Paris and 28 per cent members of a provincial Parliament (Nicolas, 1998). During the reign ofLouis XIV, 120 out of the 150 appointed intendants were Master of Requests (Maître des Requêtes)in the Royal Council. The position of Master of Requests was a non-hereditary venal office soldat a price of £100,000. Wealthy members of the nobility and bourgeoisie were able to buy suchoffices and were willing to do so because serving the Crown offered opportunities for socialadvancement and helped to make themselves more acceptable in the highest ranks of the socialhierarchy. Kinship, family connections and social network also played an important role inone’s career advancement. For a detailed discussion of the family origins and social evolutionof intendants, see Gruder (1968, pp. 97-207). For more details on the creation and the evolutionof the position of intendants, see Biard (2007, pp. 72–82). On the powers of intendants, seeBoiron (2008, pp. 53–65).
40 In Franche-Comté, intendants’ income varied from £20,000 to £30,000, but they had to drawmoney from the total sum they received to pay for the administrative expenses of their province.That includes the expenses of his offices and the wages of all his subordinates, which couldrepresent up to half of their income (Brossault, 1999, pp. 369–99; Gruder, 1968, pp. 237–40).

108 Chapter II. Leaders, Weather Shocks and Social Conflicts
of Finances in 1774 (Burley, 1981, pp. 20–2).41
Gruder argues that the legal training, the pattern of recruitment and promo-
tion make certain that the majority of intendants were competent enough leaders
who ruled effectively their provinces. Though, no matter how adequate the
preparation of new intendants was, transfer of skills and adaptation from their
former position to the new one required some time. When they arrived in a new
province, intendants had to learn about its geography, its agricultural structure,
the functioning of its institutions, his network of subordinates in districts and
how to deal with the local notables.42 The learning curve of newly appointed
intendants included thus both human and social capital. In his famous De
l’Administration des finances de la France published in 1784, Jacques Necker, former
Controller-General of Finances (1777–81), emphasised the role of experience for
these men who were sent to govern provinces without “any other preparation
than their having launched out into the polite amusements of the metropolis
[Paris]”. He further insisted that:
“It were much to be wished that the magistrates who are appointed
to be Intendants were to remain much longer residents in the same
provinces : knowledge is in all things the work of time, and it is a
renunciation of a valuable advantage to forego that which is given
by experience. I own that an intendant, though translated from one
41 Before that, Turgot had been Master of Requests in 1753. In 1761, he became intendant ofthe province of Limoges until 1774. For a general overview on intendants under the rule ofLouis XIV, see Smedley-Weill (1995). Lebrun (1971) provides a useful analysis of the familybackground, the social network, and the careers of intendants in the province of Orléans andTours.
42 That was particularly important to avoid serious setback short after one’s arrival in a newprovince. Thus, François Richer d’Aube had been intendant of Caen between 1721 and 1727,before being appointed as intendant of Soissons. He was known for being inflexible, hardworking, rigorous, and performing his duties better than anyone else once a task was givento him. Both in Caen and Soissons, he had been willing to modify the repartition of the head taxto reduce arbitrariness. Something for which, he had to face the fierce opposition of local elite.That finally cost him his position, and he got dismissed in 1731 (D’Argenson, 1869a, pp. 81–2).Similarly, in 1710, Marc-Antoine Bosc du Bouchet was sent to Limoges to manage the shortageof grain. He took his tasks to heart, and sought to alleviate food shortages by asking wealthycitizens a financial contribution. Some of them refused, and he decided, among other things,to fined them. Many complaints about the behaviour of the intendant arrived on the desk ofthe Controller-General of Finances in Paris. In May 1710, the Controller-General of Financesreminded him that “the king pardons nothing less, in those to whom he has chosen to confidehis authority, than the abuse they do by excessive actions when they get carried away, givingin fully to their mood and their natural vivacity, excited by a misplaced zeal”. Bosc du Bouchetwas finally dismissed in December 1710 (Boiron, 2008, pp. 50–61).
109
province to another, does lose the knowledge that results from general
researches : but all the information that are peculiar to places, and
circumstance, are thereby lost, and the improvement that were begun,
are suspended either through the inexperience, or the pride of his
successor.”43
In this regard, the transmission of experience from former intendants and
the reliance on the network of subordinates in districts were very important
for newly appointed intendants.44 To facilitate such transmission, intendants
sometimes wrote detailed instructions about the history, the administrative
organisation, the state of the economy, and the current affairs in their province.
Direct transmission was also possible, and in 1683, the Secretary State of War
wrote to Michel Le Peletier de Souzy to enjoin him to “stay after the arrival of
M. de Breteuil [his successor as intendant of Flanders] to provide him with the
explanations, which he will need so that he know about the state of the affairs in
which you are involved”.45
Food supplies was at the top of intendants’ priority list, and they had to
continuously monitor the stock of available grains, evaluate the prospects of
the current harvest, built up emergency granary supplies, make price-fixing
arrangements, regulate the trade of grains, and sometimes develop international
links for grain supply (Frêche, 1974, pp. 805–13). Intendants and other officials
had to find a balance between public and private undertakings, as well as
between amassing supplies in advance and waiting for shortages to avoid
the troubling beliefs that the administration was hoarding grains to harm the
populace.46 Such actions required a deep knowledge of the local social actors,
and Miller (1999) argues that intendants gained increasing skill in organising
43 BnF, IFN-8613398, De l’Administration des finances de la France, Volume III, pages 383–4.The translation is from the English translation by Thomas Mortimer (1786), A Treatise on theAdministration of the Finances of France in Three Volumes.
44 Glineur (2013) provides a modern transcription of such instructions for the province ofFlanders in 1683. On the relationship between the intendants and the subdélégués, see Barbiche(2012, pp. 383–406), Brossault (1999, pp. 215–75), and Cerisier (1995). On the socio-economicbackground and careers of the subdélégués, see Brossault (1999, pp. 63–109).
45 Cited in (Glineur, 2013, p. 101)46 BnF, Ms. fr. 21812. Mémoire concernant Mrs les Intendans, départis dans les différentes
provinces et généralités du royaume fait par M. D’Aube, maître des requestes, en l’année 1738.See pages 493–521.

110 Chapter II. Leaders, Weather Shocks and Social Conflicts
emergency supplies and managing grain and bread markets over the course of
the 18th century.47 Additionally, intendants had broad power in fiscal-related
questions. They could grant tax breaks and exemptions, for instance to favour
the clearing of land for farming or to relieve population from the fiscal burden
after the occurrence of natural disasters. There was, nonetheless, no formal rule,
and exemption decisions as well as disaster indemnification were discretionary
(Antoine, 2009; Bordes, 1962; Favier, 2007).48 In times of dire need, the role
of intendants was thus fundamental. By implementing efficient policies in the
fiscal and grain supply-related spheres, they could help the local population to
better cope with transitory economic shocks, and reduce the likelihood that the
local population resorted to social conflicts.49 But the implementation of these
policies required a high level of province-specific human and social capital gained
through experience.
1.3 Assistance, poor relief and absorption of weather shocks
In September 1746, Louis Tourny, then intendant of Bordeaux, called upon the
Controller-General of Finances in Paris to initiate imports of large quantity of
grains to reduce the risks of scarcity from the winter onward. To support his
request, Tourny insisted on his past experience. He recalled in his letter that,
back in September 1738, he also forecasted that grains would miss. Repeated wet
summers had led to harvest failures all over western France, and prices of wheat
skyrocketed in autumn 1738 (Bricourt, Lachiver and Queruel, 1974, pp. 284–8).
In Périgeux, the price of wheat had increased by 36 per cent compared to the
1727–37 average. In Angoulême and Limoges, prices rose by 49 and 71 per cent,
respectively.50 Tourny rapidly understood the risks of the situation. He wrote
to the Controller-General of Finances to request for very large supplies of grains
47 For more details regarding intendant’s action in the field of legal enforcement, see Root (1992);in the field of justice, see Hamscher (2012). For a summary, see Chapter I, Section 2.1.
48 Boiron (2008, pp. 103–8) provides an overview of tax breaks granted to districts in the provinceof Limoges between 1684 and 1715. In 1693 and 1694, about £320,200 were granted in tax breaks,that is about 15 per cent of the initial total taxation (pp. 331–2).
49 Intendants could use tax funds set aside on the head tax (capitation) for charity purposes, andgranted taxes break or exemption depending on the circumstances. After the break out of largeevents, such as famine, plagues, fire, and floods, the central government also played a role inthe mitigation of crisis. McCloy (1946) shows that during the 18th century, small sums wereoften voted to support poor relief in affected areas.
50 Bussière (1877, pp. 184–90), Duffaud (1861, pp. 309–21) and Georges (1920, pp. 75–6).
111
to become available by using the King’s funds in order to mitigate the harvest
failures.51 In the end, the shortage was limited and only two food riots occurred
in his province in 1738–9.53
Back in summer 1773 in the province of Languedoc, the intendant de Guig-
nard de Saint-Priest also efficiently dealt with the lack of grains. After writing to
the Controller-General of Finances to inform him about the situation, Emmanuel
de Guignard de Saint-Priest requested his subdélégué in Montpellier to provide
him with a detailed overview of the amount of grains needed by impoverished
households to crop their fields and to survive until the next harvest. To illustrate
how such investigations were carried out by the second half the 18th century, I
provide a summary per parish of the document he received on 27 August 1773
(Table II.1).54 He forwarded the document to the Controller-General of Finances
who could then “ask for a financial arrangement to the King [...] to supply them
[the poor] with grains for both their subsistence and their seeds”.55 Despite the
initial shortage of grains, there was neither a food riot nor a spike in mortality
rates in theses parishes in 1773–4.
During the 18th century, intendants often sought and obtained support from
the central government to alleviate local disasters, be it in the form of a reduction
51 “In 1738, I was [intendant] in Limousin, and I forecasted, in the very same month [September],that the généralité would be exposed to an extreme scarcity of grains in the following winter,and up to the next harvest. As such, I asked M. Orry [Controller-General of Finances] to makevery large supplies of grains by using King’s funds. Without this precaution, many would havedied from starvation. In the end, people suffered a little, and the accounts suggest that revenuesexceeded expenses. [...] I am only telling you these facts so that you know what will happenunder my administration in such circumstances”.52 For more details on the management ofgrains supplies under the rule of Tourny, see pages 203–20.
53 In May 1739, a crowd gathered in Ruffec to protest the high price and scarcity of bread(D’Argenson, 1869b, p. 159). Few months later, on 22 July, a similar event happened inAngoulême but with no further aftershocks (Bujeaud, 1860, p. 320).
54 This kind of documents are not rare in the archives, and many more can be found for earlierperiods. See for instance, A.D. Eure, 13B/501 à 13B/502, Bailliage de Pont-Audemer : En-registrement des déclarations des grains et récoltes en 1709. A.D. Calvados, 2B527, Déclarationspassées devant le lieutenant général par les propriétaires et fermiers du produit de leurs récoltesen 1709.
55 In a companion letter, the subdélégué provided detailed information on the way he compiled theoverview:“We focus only the poor without any resources or assets. We exclude individuals that seemedable to find support by themselves through their possessions. We include all poor, but wediminish nonetheless the relief needed for their survival in proportion of what they would beable to get by the work of their hands. [...] The more we investigated the damaged caused by thehailstorm, the more we are convinced [...], that it is impossible to require in the first community[Gigean] the recovery of taxes, and in other communities it is only possible to recover taxesdiminished proportionally to the damages caused to their harvest”. A.D. Hérault, C 5458.
112 Chapter II. Leaders, Weather Shocks and Social Conflicts
in taxes, a dispatch of food supplies, or a monetary grant.56 When they failed
to forward information on the state of the harvest and wheat prices in their
province to the Controller-General of Finances, it was not rare they received
a remonstrance in the following weeks.57 The action of municipal authorities
could complement these efforts, but in many cases, towns and parishes had
either limited financial resources or none to do so (Hufton, 1974, pp. 137–76,
369–84; Miller, 1992).58 Van Bavel and Rijpma emphasise that the Clergy could
constitute a significant source of relief in times of dire need. Indeed, the Church
were not only tithe owner but also an important landowner, which means that
it controlled some of the largest stocks of grains in France. The resources of
parish priests were nonetheless limited and insufficient to assuage the needs of
the poor. Most of the religious charity was, therefore, dependent on abbeys and
monastic houses, whose wealth varied considerably across regions (Hufton, 1974,
pp. 197–201). As a centre of consumption and expenditure, monasteries could
have positive spillovers on the surroundings areas, be it through almsgiving, the
provision of employment and education, and/or medical services. For instance,
Mannix (2018) argues that ecclesiastical proprietors reinvested more of their
agricultural rents than secular landlords allowing their tenants to build up capital
and increase agricultural productivity of their lands.59
The tithe was a tax paid to the Church based on a proportion of the crops
farmers produced– usually around 10 per cent. In principle, it was supposed
to provide for parish priests, charity and the maintenance of Church buildings.
As such, it could be considered as a social insurance system to provide for the
needs of the impoverished in times of crises. Religious institutions supported the
cost of storing grains over long period and redistributed it under the forms of
alms when needed, in exchange of what they were allowed to take part of it to
56 For more details and examples of crises management, see Balso (1993), Boiron (2008, pp. 311-378), Cathelineau (1912, pp. IX–X), Chapalalain-Nougaret (1984, pp. 141–55), and Hufton (1974,pp. 177–93).
57 “Il est essentiel que je reçoive ces Etats au plus tard dix jours après chaque quinzaine, [...] ainsije vous prie de vouloir bien recommander aux Subdélégués de ne plus négliger de satisfaire àun envoy avec la plus grande exactitude.” A.D. Somme, 1C77.
58 For more details on the management of local hospitals and dépôts de mendicité, see Hickey (1997)and Legay (2013), respectively.
59 On the economic role of monasteries in 18th-century France, see McManners (1998, pp. 507–70), and Goudot (2006). For a general overview of the political, economic and social roles ofmonasteries, see Beales (2003, pp. 84–111).
113
provide for their own needs.60 On the other side, in many provinces, the tithe
equalled royal direct taxes and added to the fiscal burden on peasants shoulders,
which could be very detrimental if redistribution did not happen (Collins, 2009,
pp. 233–5; Lefebvre, 1972, pp. 104–17).
The historical literature provides many evidences of the sporadic nature of
monastic charity and the reluctance of these institutions to provide assistance to
the poor.61 Wealthiest abbeys had an annual income of several tens of thousands
of Livres, 30–45 per cent of which was derived from the tithe.62 In some cases,
the share of the tithe could be much higher, as high as 80 per cent of the total
income of religious institutions in the archdiocese of Auch (Rives, 1976, pp. 21–
8). A large share of this income, however, was spent on the mense of abbots and
bishops, and charity often represented 10 per cent or less of the total spendings.63
This is particularly true for abbeys in commendam in which commendatory abbots
and abbesses usually exercised no authority over the inner monastic discipline,
but filched a significant share of the monastic income. By late 18th-century, there
were about 1,000 abbeys in commendam, many of which were given an abbot from
a great aristocratic family who was living far away from the monastery (Hoffman,
2006, pp. 73–4).64
The cathedral chapter of Saint-Maurice in Angers had an annual income of
£140,000 by the end of the 18th century, of which £43,000 was derived from the
tithe. On average, the canons distributed to 35 parishes a total of £262 in the 1770s
60 Considering the tithe as an insurance mechanisms does not diminish its drawbacks: the taxbase was limited to agricultural production and excluded all income generated in urban areas(redistributive effect); it was collected from the fields and did not take into account the fact thatsome of the grains had to be kept for seeds; its collection cost was usually high (Marion, 1974,pp. 122–4).
61 See Hufton (1974, pp. 133–7) and Hufton (1983, p. 310).62 Apart for the most important abbeys, the tithe came from land owned in the surroundings of
the abbeys, usually a few dozen kilometres away at the most (El Kordi, 1970, pp. 42–6; Goudot,2006, p. 12–4; Lemarchand, 1965, pp. 532–3; Michel, 1979, pp. 586–7). For instance, in Normandy,the Abbey of Le Bec had an annual income of roughly £60,000 in 1780, half of which was derivedfrom the tithe (Davranches, 1897, p. 10). BnF, 8-LAG-75, Almanach Royal, année bissextile 1780,présenté à Sa Majesté pour la première fois en 1699.
63 The situation in England was the same. About 10 per cent of total expenditure went to monasticcharity and alms around the 16th century (Dyer, 2012, p. 47).
64 See also McManners (1960, pp. 74–102), and McManners (1998, pp. 492–504). Most of the incomeannexed by commendatory abbots was spent far away from parishes it was raised, which was asource of grievances among local population and blistering criticism from Young (1906, p. 92).This is also true for bishops and archbishops who also received a significant share of the tithes(Rives, 1976, pp. 63–114).
114 Chapter II. Leaders, Weather Shocks and Social Conflicts
and £1,004 in the 1780s (Michel, 1979, pp. 587–95).65 In Paris, charity amounted
to 1.3 per cent of the total expenditure of the cathedral chapter of Notre-Dame
between 1759 and 1789 (Mannix, 2018, p. 76). Rives (1976, pp. 115–9) reports that,
in 1783, charitable expenditure amounted to eight per cent of the income of the
archbishop of Auch, and to three per cent of the income of the cathedral chapter
of Sainte-Orens. By the end of the 17th century, several rulings of the Council
of State had reminded abbeys that Church revenue should be divided into three
parts, one of which is devoted to the poor, suggesting that it was not usually the
case.66 That made ordinary clergy and peasants extremely resentful of the tithe.67
For instance, the priest of Ecreteville-les-Baons reported in 1729 that “the abbot
of Fécamp provides very little relief to the poor”.68 Few decades later, a local
priest complained to the bishop of Rouen that “the abbot of Saint-Wandrille [in
Normandy] owns two thirds of the tithe, and yet he never comes to help the poor
in my parish”.69 To the best of my knowledge, no research has attempted to study
the relationship between the tithes, monastic charity and social conflicts in early
modern Europe.
65 In Anjou, parish priests received at most between 20 and 30 per cent of the tithe. Similar rateswere observed in Normandy (Lemarchand, 1989, pp. 333–6).
66 BnF, Département Droit, économie, politique, F-21049 (127). Arrêt du conseil d’état eninterprétation de ceux des 17 juillet et 20 novembre 1694 concernant les revenus des abbayesvacantes. Acte. 1695-04-04, Versailles. See also Bligny-Bondurand (1908, p. 519).
67 They often blamed some abbeys, as well as grain merchants and local seigniors, for hoardinggrains and speculating on prices. For more details on the famine plot syndrome, see Kaplan(1982).
68 A.D. Seine-et-Marne, G 5560 (cited in Lemarchand, 1989, p. 179).69 A.D. Seine-Maritime, G 841–846 (cited in Beaurepaire, 1889, p. 85). In Lempzours in the Périgord
region, peasants complained in the cahier de doléance written for the Estate General of 1789 that:« Les revenus de l’église, dans chaque paroisse, sont occupés en grande partie par des abbés,des prieurs commandataires et autres, qui dépensent tranquillement leurs revenus à Paris oudans des villes, sans penser aux pauvres des paroisses dton il retirent le revenu. Veut-on quedes congruiste, qui n’ont pas l’unique nécessaire pour vivre, et souvent pas assez, fournissentà l’indigent, sur son grabat, des secours qui souvent ne sont pas en leur pouvoir d’accorder ? »(Bussière, 1885, p. 122). For more examples, see Beaurepaire (1889, pp. 81–5), Bligny-Bondurand(1908, p. 176, 233, 247), Bricourt, Lachiver and Queruel (1974, p. 290), Cathelineau (1912, p. 182,249, 350), and Gricourt (1963, p. 483). For an overall review of the resent of peasants againsttaxation and tithe, see Markoff (1990). On the mismatch between the initial principle of the titheand its usage, see Marion (1974, pp. 160–72).
115
2 Data
My difference-in-difference empirical strategy compares the likelihood of social
conflicts in districts exposed to weather shocks versus those which were not,
across provinces with various years of local experience embedded in intendants.
I conduct my analysis at the level of districts, which corresponded to second-
level administrative division. By 1789, France was divided into 690 districts
(subdélégations) scattered across 32 provinces (généralités). These administrative
units were relatively stable over the 17th and the 18th century, but some changed
boundaries and were created and extinguished over time.70 To circumvent this
issue, I aggregate and/or crop all my data to districts boundaries in 1789 to obtain
a consistent data set from 1661 to 1789.71 To do so, I digitised and georeferenced
a map of French administrative limits at the district level (subdélégations) circa
1789 (Arbellot et al., 1986).72 I match this map with various historical maps to
gather information on the trade regime (Cinq Grosses Fermes), the level of taxation
(Gabelle), the date of annexation, and crop rotations at the district level. The
final sample is a balanced panel of 690 districts, from winter 1661 to winter
1789, with districts borders held constant at 1789 definitions. In Table II.2, I
provide descriptive statistics at the district level for the main dependent and
independent variables used in my empirical analysis. The respective data sources
are discussed in the following sections.
2.1 Conflict data
I build on the work of Nicolas (2002) to assemble a data set that encompasses
7,943 episodes of social conflict (émotions populaires) that happened within the
1789 French borders between January 1661 and March 1789.73 Each observation
70 Didier (2014) provides an in-depth analysis of the evolution of districts boundaries for theprovince of Brittany.
71 I exclude all areas that were not part of the French territory by 1789. So, for instance, the ComtatVenaissin, which nowadays constitutes the Vaucluse department, was a part of the Papal Statesuntil September 1791 and is excluded from all my regression. I further exclude Corsica, annexedin 1768, because of the low reliability of the existing data for the 18th century.
72 The map is composed of 12 sheets at a scale of 1:500,000, and based on various historical sources.For a discussion of the reliability of the map, see Lepetit (1988) and Vovelle (1986).
73 Joseph-Nicolas Guyot (pp. 438–443) provides a lengthy description on what constitutes anémotion populaire in legal terms. BnF, NUMM-426186. Répertoire universel et raisonné dejurisprudence civile, criminelle, canonique et bénéficiale. Tome 22. Paris : Panckoucke, 1778.
116 Chapter II. Leaders, Weather Shocks and Social Conflicts
in the data set corresponds to an event involving at least four individuals, from
more than one single family, and deploying a verbal or physical violence against
property, persons or authorities. Observation contains information on the type of
conflict, the date, the place, and sometimes on the duration, the actors involved,
and the level of repression used by authorities (Nicolas, 2002, pp. 835–42).74 The
definition used to assemble the data set is based on the French jurisprudence
regarding rebellion during the 18th century. An ordinance from 9 January 1673
forbade to any person to gather and outrage before and in the surrounding of
public places. Few decades later, déclarations from 30 January 1717 and 12 July
1723 stated that soldiers, vagabonds, and individuals gathered in groups of five
or more, bearing weapons and opposing violently to custom and justice officers
will be punished by a death sentence.75
I link each observation to its present-day location to add geographic coor-
dinates and to match it with its corresponding district.76 I construct a dummy
variable, denoted Social conflict, equal to one if at least one conflict occurred in
district i during season s of year t, and zero otherwise. Using the information
about the type of conflicts, classify each observation in four sub-categories: (i)
subsistence-related conflicts, (ii) protests against the fiscal regime, (iii) protests
against the judicial, military or police authority, and (iv) other types of conflicts.
For instance, subsistence-related conflicts include events related to protests
74 Information on the numbers of participants is sometimes reported in the chronicles and theadministrative correspondence, but the depiction is often qualitative. For a discussion of whatconstituted a popular revolt as opposed to actions to be taken isolated individuals or familiesagainst outsiders, see Cohn (2009, pp. 5–13). On the challenges raised by the typologies ofrevolt, see Cohn (2009, pp. 76–107).
75 BnF, NUMM-5834346. Encyclopédie méthodique. Jurisprudence. Tome 1. Paris : Panckoucke,1782. See page 548. See also Cameron (1981, p. 219).
76 Using automatic georeferencing procedure, such as the global gazetteer Geonames, accessibleat www.geonames.org, yields very unsatisfying (inaccurate) results. Indeed, many towns andcities have merged, amalgamated or split over the last two centuries, and many more had theirspelling changed. That make them hardly recognisable by automatic georeferencing procedure.In addition, some place names were pretty common and shared by tens of towns. For instance,there are 12 towns of Saint-Martin, and 222 more towns have their names beginning by Saint-Martin. Beaumont may refer to 11 different towns and is the root of 38 additional place names.Therefore, I rely on the following sources to link historical and present day names: the Cassiniwebsite (http://cassini.ehess.fr), Expilly (1763–68), and Saugrain (1726).
117
against food prices and scarcity, and the grabbing or the exports of grains.77 I
construct a set of dummy variables for each of the four sub-categories. Overall,
there is at least one social conflict in 6,601 district-season pairs, which represents
1.8 per cent of the total number of observations (Table II.2).
Most of these events were minor disturbances spatially limited to a set of
parishes or a town, and often lasted for less than half a day, making immediate
government repression impossible.78 Before 1789, any non-authorised assemblies
of four or more people were forbidden by the French central government
(Cameron, 1981). In time of crisis, this number could be even reduced to reduce
the risk of social disorder. For instance, the intendant of Picardy, Louis de
Bernage, published an ordinance on 16 April 1709 which forbade “peasants and
other individuals to gather in the countryside and village in groups larger than
two after the sunset”. The culprits will be sent to the galleys if the are armed,
and imprisoned otherwise.79 Each observation in the data set corresponds to an
event involving at least four individuals, from more than one single family, and
deploying a verbal or physical violence against property, persons or authorities.80
This definition implies that at least some part of the local community was
involved in the episode of popular disorder, and, de facto, excludes isolated acts
77 (ii) includes opposition to new taxes, refusals of paying tariffs, and events related to thesmuggling of tobacco and salt. (iii) refers to events such as protestation against public execution,opposition to the enlistment of recruits, attempt to free prisoners, and open hostility toMarchaussée and other military troops. (iv) encompasses conflict related to state reforms, nobleprivileges, seigniorial authority, municipal authorities, labour, and regional particularities.
78 The Maréchaussée was a corps of completely mounted constabulary. It should be noted thatits force never exceeded 3,000 men, and could hardly patrolled constantly a territory as big asFrance. In addition, there was no efficient way to quickly spread information, so by the timeintendants and the Maréchaussée learned about a riot, a day or two could have passed and thedisorder was already finished. Beik (2015, p. 47) reports that, for the entire 17th century, at most40 to 50 urban revolts lasted more than a day. Between 1661 and 1789, about 76 per cent of thedisorders lasted for less than half a day (sample of 4,140 conflicts). In the days following a riot,one of the main task of the Maréchaussée was to carry investigations, identify the leaders, andbring them to justice (Aubert, 2015, pp. 187–94). Only in large cities, the situation was differentas local police force could rapidly quell popular disorders. In smaller towns, local priests andconstables played an important role. Although it is hard to identify clearly their actions duringconflicts, they usually helped to calm the people.
79 A.D. Somme, 1C29.80 It is noteworthy that political uprisings were not referenced. Nicolas was interested in conflict
originating from the lower end of the social system, and, therefore, excluded political uprisings,which origins were more disputable.

118 Chapter II. Leaders, Weather Shocks and Social Conflicts
of robbery, theft and/or violence (interpersonal crime).81
Given the timespan and the geographical scope of the data set, it is plausible
that the data set suffers from a reporting bias. Social conflicts could have
been persistently under-reported in some districts, either because it was too
insignificant to be noticed or because the administration was unwilling to do so.
To address this concern, Nicolas (2002) gathers information from a wide range
of archives including judicial records, police archives, church and government
records, administrative correspondences, personal diaries, local history books,
and the like, reducing the likelihood that some events were consistently under-
reported. To further deal with this concern, I create a sub-sample of the data set in
which I only include events for which the crowd is reported to be larger than 50
individuals. Being larger, these disorders are less likely to be under-reported by
the administration or to remain unnoticed by contemporaries. In addition, recent
research on Normandy suggests that, although some social conflicts are missing
in the study carried by Nicolas, there is neither a spatial nor a time bias in the
data set (Maneuvrier-Hervieu, 2015a,b).82
Perceived shortages of food, be it staple crops, or bread led to many conflicts
aimed specifically at preventing the departure of grains to other markets, and
obtaining cheaper prices or sometimes at fixing a just price. The food riot that
occurred on 22 August 1763 in the town of Montesquieu in Languedoc is a typical
example. On market day, when the knight Desens overbid a local buyer by 5 sols
for acquiring two setiers of wheat, the crowd assaulted him and chased him out
of the market place. Desens was forced to take refuge in a neighbouring house
until the local constables could calm the crowd down. In the subsequent weeks,
the trade of grains plummeted as no merchants dared buying wheat to export
it.83 On 17 September, the intendant congratulated its subordinate for quickly
spreading the information to the Maréchaussée, which could quell the agitation,
81 Hence, this definition is close to the coding strategy adopted by Hendrix and Sale-hyan (2012) to develop the Armed Conflict Location & Event Data Project (ACLED).http://www.acleddata.com/.
82 Bouton (2000) also investigates the occurrence of food riots in early modern France. She lists1,265 food riots between 1661 and April 1789, and then 1,012 additional food riots until 30 June1793. In comparison, Nicolas identified 1,497 subsistence-related conflicts between 1661 and 14July 1789.
83 A.D. Hérault, C 5424, pièces 97–103.
119
discover the perpetrators of the riot and punish them severely.84 Beik (2015, p. 49)
describes these riots as “usually semi-spontaneous, loosely organised movements
with simple grievances”.
2.2 Independent variables
Temperature data. Recent research suggests that single climate variables, such
as temperature or precipitation, often do as well as more complex models in
predicting the effects of weather on crop growth.85 In addition, recent findings
in the literature suggest that the effect of year-on-year variations in temperature
on the frequency of conflicts is larger than those of precipitation (Carleton and
Hsiang, 2016; Hsiang, Burke and Miguel, 2013). Therefore, I restrict my attention
to temperature in all my empirical analyses.86
The European Seasonal Temperature and Precipitation Reconstruction (ESTPR)
data set gathers seasonal time resolution data for the last 500 years at a grid
resolution of 0.5°× 0.5°longitude/latitude (Luterbacher et al., 2004; Pauling et al.,
2006).87 Reconstructions are based on instrumental measure for later years, and
documentary historical evidence as well as several climates proxies, including
tree ring and ice core series, for earlier years.88 I use the map I digitised to
aggregate these weather data to the district-season-year level. To do so, I weight
each grid value that intersects a polygon (district) by its relative share in the
total area of the given polygon. I then calculate the weighted mean seasonal
temperature and precipitation for each set of district i, season s, and year t.
84 A.D. Hérault, C 5424, pièces 144–5.85 Although the effect of temperature conditions on inter-annual crop yield variability varies
across French regions, they kept overall a substantial influence on winter wheat yields (Ben-Ari et al., 2016).
86 Failing to include precipitation could lead to omitted variable bias in my empirical estimates(Dell, Jones and Olken, 2014, p. 742). In Section 3.1, I show results suggesting that my baselineestimate is unbiased.
87 Roughly 2,027 square kilometres at the latitude of Paris.88 There are plenty of documentary accounts of past weather conditions in European archives that
can shed light on both how climate changed over the past 500 years. These include scientificwritings, weather diaries, annals, and parish records. These provide information, for instance,on harvest dates, phenological phenomena, droughts, flooding and freezing of rivers, warmand cold spells, wind direction and the like. These data are calibrated against overlappingcontemporary instrumental records, and convert into quantitative climate data. For a discussionof climate reconstruction using documentary evidence, see Pfister, Brázdil and Glaser (1999).

120 Chapter II. Leaders, Weather Shocks and Social Conflicts
Finally, I calculate the seasonal standardised temperature deviation from the
long-term mean (1500–1600) for each of the 690 districts:
Temperatureist =Tist − Tis
SD(Tis)
where Tist is the value of the seasonal temperature in district i during season s
of year t. Tis is the long-term mean (1500–1600) of the seasonal temperature in
district i, and SD(Tis) is the standard deviation of the long-term mean of the
seasonal temperature in district i. I denote this variable Temperature. A positive
(negative) value indicates an abnormally warm (cold) temperature in district i
compared to the long-term seasonal mean.89 Figures II.1 and II.3 respectively
show the distribution of seasonal long-term temperature means (1500–1600), and
the distribution of the Temperature variable for each season.
One concern is that these reconstructed weather series present systematic dis-
tortions due to a spatial bias and/or measurement errors.90 To test the reliability
of temperature and precipitation reconstructions in France (paleoclimatological
sample), I use temperature and precipitation historical data compiled from
instrumental observations in various French cities between 1650 and 1800.91 In
total, I collect over 1,200 monthly observations on temperature and 7,000 monthly
observations on precipitation (instrumental sample). For each series, I calculate
the seasonal mean temperature (°C) and the seasonal total precipitation (mm) to
compare them with the paleoclimatological reconstructions. Figure II.5 and II.6
respectively show the correlation between the temperature and precipitation
series (r = 0.96 and r = 0.45, respectively). Overall, there is strong correlation
between the paleoclimatological and instrumental samples. I further compare
summer temperature reconstruction to grape harvest date (GHD). GHD are
tightly related to summer temperatures. On average, the variation of GHD is
89 In Section 3.1, I present results from alternative specifications using different measurementtemperature shocks, including deviation from the long-term median, deviation from the 25 yearmoving average, and temperature level.
90 For instance, temperature and precipitation reconstructions derived from tree rings can besubject to measurement errors if the age structure of the samples of trees varies over time (Daux,2013, pp. 14–5).
91 Jourdain et al. (2015) provide a discussion of the early instrumental records available in France. Ido not include series from Paris because they were used by Luterbacher et al. (2004) and Paulinget al. (2006) in their reconstructions.
121
approximately 10 days for 1°C variation of the temperature (Krieger, Lohmann
and Laepple, 2011; Labbé et al., 2019). Figure II.7 displays the correlation between
the paleoclimatological sample and several series of GHD derived from Daux
et al. (2012). Between 1600 and 1800 the Pearson correlation coefficient between
the two set of data is high (r = -0.53) and consistent with previous findings in
the literature. Overall, these analyses suggest that temperature and precipitation
reconstructions are reliable proxies for weather conditions in the past.
Intendants data. Measuring leaders’ performance in early modern Europe is
challenging, and to the best of my knowledge, there is no available data set at the
sub-national level to investigate this issue. To circumvent that issue, I draw upon
a variety of historical and secondary sources to create a comprehensive data set
of of French provincial intendants between 1661 and 1789.92 The data set include
316 individuals who have been appointed to 554 different positions. For each
intendant, I gather additional information about the duration and the location
of their past and current tenure. I construct two proxies of experience. First, I
calculate their local experience in province j as the number of years spent since
their appointment. Second, I calculate their total prior experience as the sum of
the number of years spent in all their previous tenures.
Table II.2 reports descriptive statistics for a set of intendant and province-
level characteristics. Half of the intendants had only one tenure, and 20 per cent
served for three tenures or more. Intendants served on average 6 years and 6
months, and half of them held the position for less than five years. In Section 1.2,
I contend that local experience was an important determinant of intendants’
ability to manage well their province, in particular in time of crisis. Figure II.8
to Figure II.11 motivate the analysis by providing descriptive evidence that the
level of local experience of intendants varied over time and space.
92 Sources for each province are: Aix-en-Provence: BnF, NUMM-5772450, Notice sur l’intendancede Provence (pp. 42–66); for Alençon: Bib. Lyon, SJ AD 251/97 T. 02, Mémoires historiquessur la ville d’Alençon et sur ses Seigneurs (pp. 449–59); Amiens: BnF, NUMM-5831631, Lesintendants de la généralité d’Amiens (Picardie et Artois) (pp. 90–216); for Bretagne: Ouellet(2014, p. 49); for Dauphiné: Esmonin (1964, pp. 71–112); for Franche-Comté: Brossault (1999);for Limoges: Boiron (2008, pp. 39–52); for Orléans: Lebrun (1971); for Tours: Ouellet (2014, p. 49)and Lebrun (1971). For all other provinces: Boyer de Sainte-Suzanne (1865, pp. 35–108); Viton deSaint-Allais (1813, pp. 129–212); A.D. Isère, 6 J 137 à 6 J 188, Collection Edmond Esmonin; BnF,NUMM-94415, Le personnel administratif sous l’ancien régime; BnF, NUMP-804, AlmanachRoyal, année MDCCX, année MDCCXX, année MDCCL, année MDCCLXXX.
122 Chapter II. Leaders, Weather Shocks and Social Conflicts
Abbeys data. In Section 1.3, I make the case that the tithes could be either
an efficient insurance mechanism against weather shocks or a mere resource
extraction process if religious institutions evaded their duties. The overall effect
of monastic taxation and charity in the mitigation of weather-induced poverty
shocks is therefore unclear. A few tithes series exist and have been published
(e.g. Goy and Ladurie, 1982), but are far from sufficient to cover the entire French
territory for two centuries. To circumvent this issue, I make use of total abbeys’
income which is more readily available. One flaw of using total income is that it
does not capture variations in tithes shares in total income across abbeys. Total
income remains nonetheless a good proxy of tithes income and potential charity
effort given the importance of the former in abbeys’ income.
To test if districts with higher level of resources taxation by religious institu-
tions are better or less able to cope with weather shocks, I use historical sources to
assemble data on total income of abbeys in commendam in 1750, 1780 and 1788.93
I aggregate abbeys annual income at the level of dioceses, of which there were
142. I combine these data with population data at the level of dioceses for 1793,
and calculate the average income per capita withdrawn by abbeys. Overall, I
collect income data for 966 abbeys, which had a total income of £9,481,970 in 1780.
By comparison, Expilly (1763–68, Vol. 1, pp. 2–3) reports that circa 1760 there
was about 900 abbeys, which total income amounted to £9,823,100. Figure II.22
shows that there is a high correlation between abbeys’ income in 1750 and 1788.94
Hence, I can cautiously extrapolate abbeys’ annual income for the 17th and the
18th centuries from my sample years 1750, 1780 and 1788.
Prices data. In his study of price movements during the 18th century, Labrousse
(1933, pp. 106–13) compiles series of wheat prices from 1756 to 1789 for each
French province. I collect these data (hereafter Labrousse’s sample) and convert
93 BnF, NUMP-804, Almanach royal année M. DCC. L., année M. DCC. LXXX., année M. DCC.LXXXVIII.
94 The correlation coefficient is equal to 0.92. Correlation between income in 1750 and income in1780 is equal to 0.89. Comparison with data from the late 17th century yields similar results. Inthe diocese of Rouen, the Abbey of Beaubec had an income of £14,000 c. 1698 and £20,000 in1788; Abbey of Bellozane: £4,000 and £3,500 respectively; Abbey of Fécamp: £80,000 and £80,000respectively; Abbey of Jumièges: £40,000 and £40,000 respectively; Abbey of Saint-Lô: £7,000and £8,000 respectively; Abbey of Saint-Wandrille: £40,000 and £60,000 respectively (Hurpin,1984).
123
wheat prices in grams of silver per litre before matching them with their
respective province. Figure II.16 to Figure II.18 show the level of wheat prices
at various dates. The price of wheat varied considerably across provinces. It
suggests that national market integration was still quite low by late 18th century,
leaving the poorest households more vulnerable to high food prices in years of
acute grain scarcity.
One of the caveat of the Labrousse’s sample is that Labrousse used only one
series of prices per province. Therefore, it is impossible to measure the level of
within-province price variations using this sample. Because market integration
was low, within-province price variations could be high. To circumvent this issue,
I collect another sample of wheat prices on 352 markets– about half the total
number of districts in France– for two consecutive years, 1767-68 (hereafter 1767–
8 sample).95 I convert prices in grams of silver per litre before matching them
with their respective district. In Figure II.19 and Figure II.20, I show the level
of wheat prices in 1768, as well as the dispersion of prices around the regional
(province) mean. As expected, the price of wheat varied considerably across
but also within provinces, providing additional evidence of the weak market
integration. Figure II.21 plots wheat prices from Labrousse’s sample against
wheat prices from the 1767–8 sample aggregated at the level of provinces. The
strong correlation (0.95) between the two data sets indicates that the risk of bias
due to sample selection in Labrousse’s data set is relatively low.
3 Empirical strategy and results
3.1 Temperature shocks and social conflicts
Before examining the effect of local leaders’ experience on the mitigation of
weather-induced social conflicts, I quantify the effect of temperature shocks on
the likelihood of social conflicts at the district level between 1661 and 1789.
I estimate for district i during season s in year t the reduced-form effect of
temperature shocks:
95 BnF, département Sciences et techniques, S-19751, Representations aux magistrats, contenantl’exposition raisonnée des faits relatifs à la liberté du commerce des grains, & les résultatsrespectifs des reglemens & de la liberté.
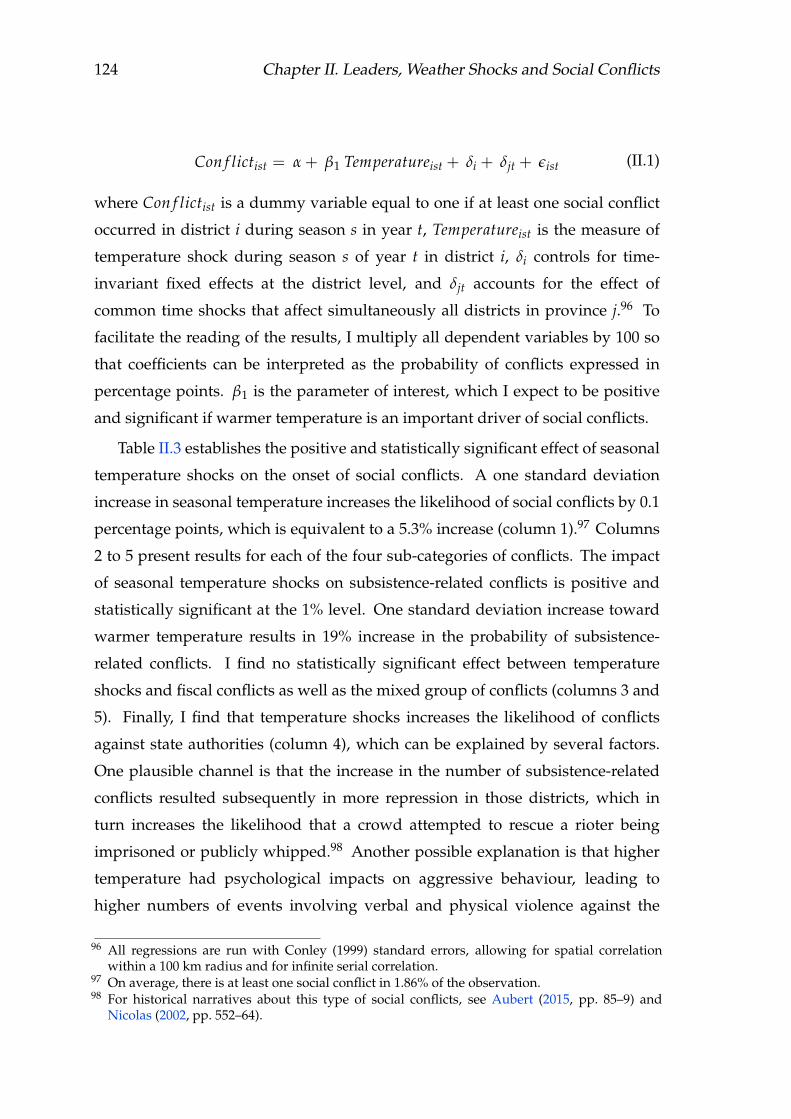
124 Chapter II. Leaders, Weather Shocks and Social Conflicts
Con f lictist = α + β1 Temperatureist + δi + δjt + ǫist (II.1)
where Con f lictist is a dummy variable equal to one if at least one social conflict
occurred in district i during season s in year t, Temperatureist is the measure of
temperature shock during season s of year t in district i, δi controls for time-
invariant fixed effects at the district level, and δjt accounts for the effect of
common time shocks that affect simultaneously all districts in province j.96 To
facilitate the reading of the results, I multiply all dependent variables by 100 so
that coefficients can be interpreted as the probability of conflicts expressed in
percentage points. β1 is the parameter of interest, which I expect to be positive
and significant if warmer temperature is an important driver of social conflicts.
Table II.3 establishes the positive and statistically significant effect of seasonal
temperature shocks on the onset of social conflicts. A one standard deviation
increase in seasonal temperature increases the likelihood of social conflicts by 0.1
percentage points, which is equivalent to a 5.3% increase (column 1).97 Columns
2 to 5 present results for each of the four sub-categories of conflicts. The impact
of seasonal temperature shocks on subsistence-related conflicts is positive and
statistically significant at the 1% level. One standard deviation increase toward
warmer temperature results in 19% increase in the probability of subsistence-
related conflicts. I find no statistically significant effect between temperature
shocks and fiscal conflicts as well as the mixed group of conflicts (columns 3 and
5). Finally, I find that temperature shocks increases the likelihood of conflicts
against state authorities (column 4), which can be explained by several factors.
One plausible channel is that the increase in the number of subsistence-related
conflicts resulted subsequently in more repression in those districts, which in
turn increases the likelihood that a crowd attempted to rescue a rioter being
imprisoned or publicly whipped.98 Another possible explanation is that higher
temperature had psychological impacts on aggressive behaviour, leading to
higher numbers of events involving verbal and physical violence against the
96 All regressions are run with Conley (1999) standard errors, allowing for spatial correlationwithin a 100 km radius and for infinite serial correlation.
97 On average, there is at least one social conflict in 1.86% of the observation.98 For historical narratives about this type of social conflicts, see Aubert (2015, pp. 85–9) and
Nicolas (2002, pp. 552–64).
125
police and the military.99 However, the low time-frequency of my weather data
conceals the possibility to draw any conclusion on the drivers of this type of
conflict. Therefore, in the remaining of the chapter, for the sake of brevity, I will
focus only on social conflicts broadly defined and subsistence-related conflicts.
Temperature shocks and subsistence-related conflicts. In Appendix II.B, I
document the transmission mechanism between weather shocks and the onset
of conflicts. I show that local transitory income shocks induced by bad harvest
and high food prices led to significantly more subsistence-related conflicts.
Temperature shocks had no or little impact on the likelihood of other types
of conflicts, through variations in grain prices. I provide further insights on
the theoretical mechanisms driving the relationship in Appendix II.A. I provide
further support to this interpretation by examining the effect of temperature
shocks in rural and urban districts. Results are reported in Table II.4. Estimated
coefficients in columns 1 to 3 indicate the effect of temperature shocks on the
onset of social conflicts is the same in rural and urban district. By contrast,
the effect of temperature shock on subsistence-related conflicts was lower in
more urbanised districts (columns 5 and 6). This effect could be driven by the
fact that seat of provinces, which were often the largest city in the province,
received particular attention from the intendants. In Table II.4, columns 6, I show
differences between districts that were seat of province and those which were
not. There is not a statistically significant difference between these two types
of districts. In other words, districts that were seat of a province, and often of
various royal authorities, did not receive any specific treatment in terms of relief
and/or repression.
Robustness checks. To address potential non-classical measurement errors
and reporting bias, I estimate the specifications below: (i) I focus only on
social conflicts that involved more than 50 individuals, (ii) I use additional and
alternative measure of weather shocks, (iii) I estimate a logit model, (iv) I include
99 That hypothesis is supported by results reported in column 4 of Table II.8: Only the largesttemperature deviations from long-term mean significantly increase the likelihood of conflictrelated to state authorities. Carleton, Hsiang and Burke (2016) provide a useful discussion ofthe different psychological pathways linking hot temperature and conflict.

126 Chapter II. Leaders, Weather Shocks and Social Conflicts
district × decade-level controls, (v) I exclude potential outliers, and (vi) I re-
estimate my baseline specification by aggregating data at the province level.
Large-scale conflicts. One potential concern with the definition of social
conflicts I used is that if small-scale conflicts are persistently under-reported
in some areas or during some years, then estimates presented in Table II.3 are
biased. In Table II.5, I focus only on social conflicts that involved more than
50 individuals, and that were less likely to be under-reported or unseen in the
archives given their importance (see Section 2.1). The estimated effects remain
qualitatively unchanged in all these specifications and are consistent with those
of Table II.3 (columns 1 to 5).
Alternative measures of weather. I show that my baseline estimates are neither
dependent from my definition of weather shocks, nor subject to an omitted
variables bias. In Table II.6, I repeat my baseline regressions (Equation II.1)
using (i) temperature deviations from the long-term median (1500–1600), (ii)
temperature deviation from the 50-year moving-average, and (iii) temperature
level. All estimated coefficient remained positive and statistically significant.
In their literature survey on the climate-economy literature, Dell, Jones and
Olken (2014) emphasise that failing to include precipitation and other climatic
variables could lead to omitted variable bias. In Table II.7, I address this issue by
adding a quadratic term to my baseline estimate (columns 1 and 4), a measure
of precipitation shocks– defined in a way similar to the Temperature variable–
(columns 2 and 5), and lag and lead values of the Temperature variable. All
specifications yields consistent results with those presented in Table II.3.
Adding control variables. Other factors may have influenced the onset of
social conflicts throughout the 17th and the 18th centuries. To address this, I
control for various geographical characteristics (latitude, topographic position
index, distance from Paris, distance from the coast) as well as socio-economic
characteristics (urbanisation rate, presence of Roman hubs, bishop, trade regime,
level of salt tax, active parliament). For the influences of these factors to vary
over time, I interact each of them with decade fixed effects. Results are reported
in Table II.9. I find that controlling for these observable characteristics has no
effect on the estimated effect of temperature shocks on social conflicts.
Logit estimates. Another concern may arise from the fact that there is an
127
important number of zeroes in my dependent variables, since using LPM models
may yield imprecise approximation of the marginal effects. Table II.10 presents
my logit results for social conflicts and subsistence-related conflicts. Columns 2
and 4 control for precipitation shocks. All coefficients on the Temperature variables
are statistically significant at the 1% level.
Potential outliers. A final concern is that my results are driven by outliers,
either peculiar districts or exceptional years. In the subsequent analysis, I focus
on Paris and the years 1788–9. Paris was the most populated city of France, as
well as the center of its economic and administrative activity. Finding the grain
necessary to insure the flow of food supplies was an extremely complex task.
The level of supplies did not depend on the weather conditions in Paris, but in
the neighbouring districts. In addition, food riots were also common among the
hungry poor even when the grain supply of Paris was not threatened (Kaplan,
1996). Thus, including the district of Paris in my estimates may downward bias
my results because the correlation between temperature shocks and the onset of
conflict could be weaker in this district.
In spring 1788, a drought struck France and threatened the prospect of the
coming harvest, which intensified the already existing social turmoil (Waldinger,
2014). Many revolts find their roots in the fight against seigneurial dues, whereas
a slump in the manufacturing activity left many households behind in textile
towns. One can observe a significant increase in the number of social conflicts in
those two years, many of which may mixed economic motives with socio-political
motives thus undermining the possible correlation between temperature shocks
and social conflicts.
In Table II.11, I re-estimate my baseline specifications, where I add an interac-
tion term to account for the fact Years 1788–9 and Paris may have a distinctive
pattern due to historical events and intrinsic characteristics. The estimated
coefficient for the interaction term are negative and statistically significant at 1%
(columns 5 to 6), underlying the fact that temperature shocks played a lesser role
all over France during the Years 1788–9, and in Paris during the entire 17th and
18th centuries.
Province level. Table II.12 reports results from re-estimating Equation II.1 at
the level of provinces. All coefficient are qualitatively similar to the baseline

128 Chapter II. Leaders, Weather Shocks and Social Conflicts
estimates. The magnitude of the effect of temperature shocks also remains the
same, albeit they are smaller. A one standard deviation increase toward warmer
temperatures increases the likelihood of social conflicts and subsistence-related
conflicts by 4.9% and 9.4%, respectively.
Overall, I find that the effect of temperature shocks is larger on subsistence-
related conflicts than in social conflicts broadly defined. This result is driven by
the fact that temperature shocks had little or no effect on other types of conflicts.
This result implies that previous research that focus on conflicts and/or revolts
broadly defined may have actually underestimated the true effect of weather
shocks (e.g. Jia, 2014). This difference in magnitude is consistent with the fact
that a plunge in income is one of the driving factors of food riots, but not
systematically of other types of conflicts.
3.2 The role of local leaders and social conflicts
I now turn to the investigation of the role of local leaders in the mitigation of
weather shocks. In Section 1, I provide historical evidence that intendants were a
corner stone in the government strategy of relief. I document that the intendants’
level of local experience was a key determinant of their ability to attenuate the
negative effect of weather shocks.100 To test this hypothesis, I add an interaction
term to Equation II.1 in order to capture differential effect of intendants’ local
experience. The specification is as follows:
Con f lictist = α + β1 Temperatureist + β2 Temperatureist
× Experiencejt + δi + δjt + ǫist
(II.2)
where Con f lictist is a dummy variable equal to one if at least one social conflict
occurred in district i during season s in year t, and Temperatureist is the measure of
temperature shock during season s of year t in district i. Experiencejt is a measure
of intendants’ local experience in province j in year t defined alternatively as:
(i) Local experience, a dummy variable equal to one if the intendant in province
j has some local experience, and zero otherwise; (ii) Years of experience, the log
100 Given that they share a relatively homogeneous socio-economic backgrounds, have pursue alegal training, and occupy similar position prior to their appointment as intendant, only naturaltalent and experience should be important determinant of their competences.
129
of the total number of years of experience of the intendant in province j in year
t; (iii) Exp. years, a categorical variable splitting the level of local experience in
province j in four categories: “No experience”, “1–5 years of experience”, “6–
10 years of experience”, and “more than 10 years of experience”. δi controls for
time-invariant fixed effects at the district level, and δjt accounts for the effect of
common time shocks that affect simultaneously all districts in province j. β2 is the
parameter of interest, which I expect to be negative and significant if intendants
with higher level of local experience were better able to mitigate the negative
effect of temperature shocks.
Table II.14 presents the regression analysis of the interaction of temperature
shocks with various measures of intendants’ local experience on social conflicts
at the district level. In columns 1 to 3, the estimated interaction effect between
intendants’ local experience and social conflicts are positive but not statistically
significant. This is not surprising given that sporadic conflicts about regional
particularities, fights over noble privileges and seigniorial authorities, uprisings
against the agents of tax farmers,101 and the like were not the main concern of
intendants who focused on their legal duties, raising direct taxes for the King
and maintaining social order by making sure that grains were not missing (see
Section 1.2). Columns 4 to 6 repeat the same analysis with subsistence-related
conflicts as dependent variable. All estimated interaction effect are negative and
statistically significant. These results show that in districts that had a provincial
intendant with higher levels of local experience the effect of temperature shock is
of lesser magnitude with respect to districts that had a provincial intendant with
less or no local experience. Miller (1999) has argued that French administration
successfully created effective methods of securing grain, influencing prices and
balancing tensions among those who produced grains, those who consumed
it, and those who commercialised it. Intendants with higher levels of local
experience were to some extent better able to do so, since crop failures resulted
less often in subsistence-related conflicts. In Table II.14, column 5, the estimated
coefficient β2 is equal to -0.015, suggesting that 5 years of local experience were
sufficient to mitigate the effect of one standard deviation increase in temperature.
101 The General Tax Farm (Ferme générale) was a private financial partnership that leased from theKing the right to collect indirect taxes for a profit. Its agents were often hatred by the population.
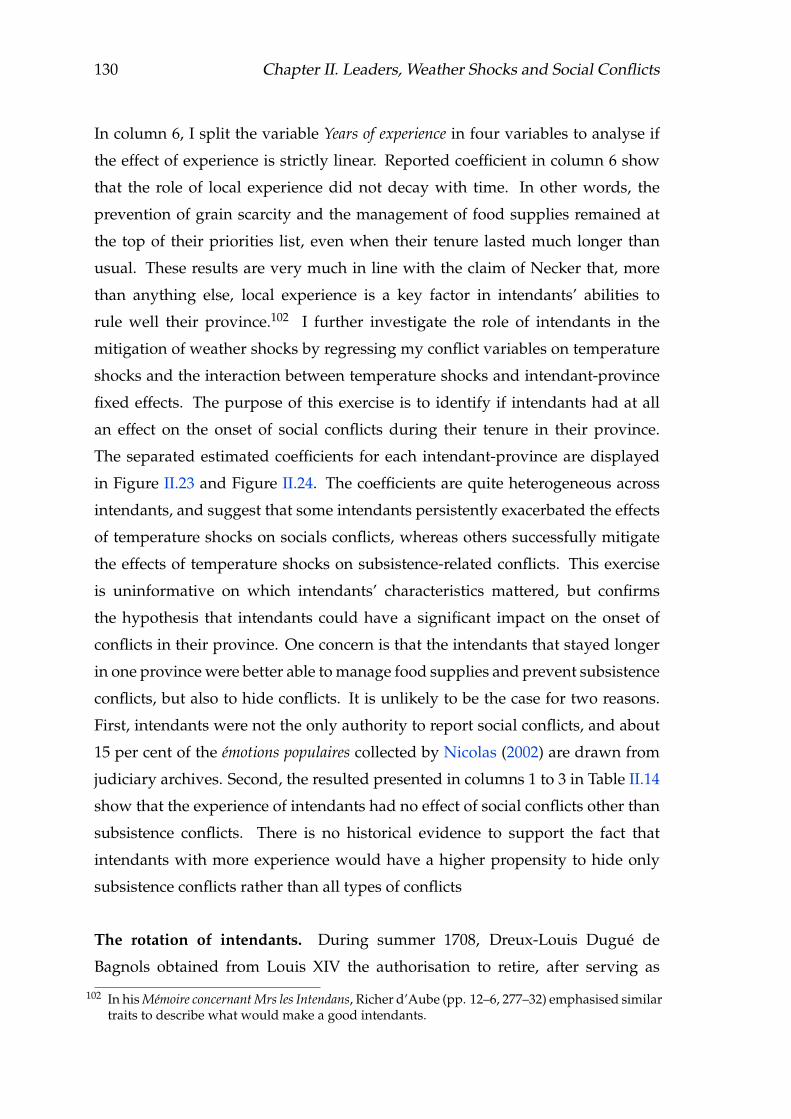
130 Chapter II. Leaders, Weather Shocks and Social Conflicts
In column 6, I split the variable Years of experience in four variables to analyse if
the effect of experience is strictly linear. Reported coefficient in column 6 show
that the role of local experience did not decay with time. In other words, the
prevention of grain scarcity and the management of food supplies remained at
the top of their priorities list, even when their tenure lasted much longer than
usual. These results are very much in line with the claim of Necker that, more
than anything else, local experience is a key factor in intendants’ abilities to
rule well their province.102 I further investigate the role of intendants in the
mitigation of weather shocks by regressing my conflict variables on temperature
shocks and the interaction between temperature shocks and intendant-province
fixed effects. The purpose of this exercise is to identify if intendants had at all
an effect on the onset of social conflicts during their tenure in their province.
The separated estimated coefficients for each intendant-province are displayed
in Figure II.23 and Figure II.24. The coefficients are quite heterogeneous across
intendants, and suggest that some intendants persistently exacerbated the effects
of temperature shocks on socials conflicts, whereas others successfully mitigate
the effects of temperature shocks on subsistence-related conflicts. This exercise
is uninformative on which intendants’ characteristics mattered, but confirms
the hypothesis that intendants could have a significant impact on the onset of
conflicts in their province. One concern is that the intendants that stayed longer
in one province were better able to manage food supplies and prevent subsistence
conflicts, but also to hide conflicts. It is unlikely to be the case for two reasons.
First, intendants were not the only authority to report social conflicts, and about
15 per cent of the émotions populaires collected by Nicolas (2002) are drawn from
judiciary archives. Second, the resulted presented in columns 1 to 3 in Table II.14
show that the experience of intendants had no effect of social conflicts other than
subsistence conflicts. There is no historical evidence to support the fact that
intendants with more experience would have a higher propensity to hide only
subsistence conflicts rather than all types of conflicts
The rotation of intendants. During summer 1708, Dreux-Louis Dugué de
Bagnols obtained from Louis XIV the authorisation to retire, after serving as
102 In his Mémoire concernant Mrs les Intendans, Richer d’Aube (pp. 12–6, 277–32) emphasised similartraits to describe what would make a good intendants.
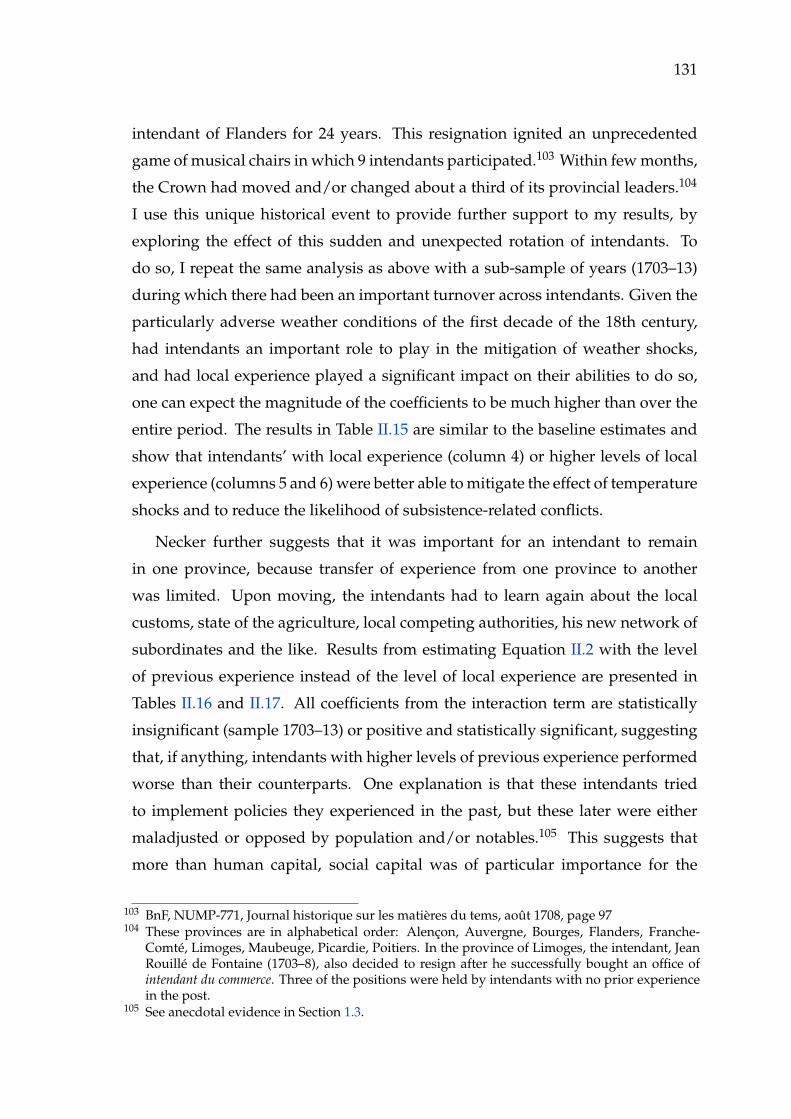
131
intendant of Flanders for 24 years. This resignation ignited an unprecedented
game of musical chairs in which 9 intendants participated.103 Within few months,
the Crown had moved and/or changed about a third of its provincial leaders.104
I use this unique historical event to provide further support to my results, by
exploring the effect of this sudden and unexpected rotation of intendants. To
do so, I repeat the same analysis as above with a sub-sample of years (1703–13)
during which there had been an important turnover across intendants. Given the
particularly adverse weather conditions of the first decade of the 18th century,
had intendants an important role to play in the mitigation of weather shocks,
and had local experience played a significant impact on their abilities to do so,
one can expect the magnitude of the coefficients to be much higher than over the
entire period. The results in Table II.15 are similar to the baseline estimates and
show that intendants’ with local experience (column 4) or higher levels of local
experience (columns 5 and 6) were better able to mitigate the effect of temperature
shocks and to reduce the likelihood of subsistence-related conflicts.
Necker further suggests that it was important for an intendant to remain
in one province, because transfer of experience from one province to another
was limited. Upon moving, the intendants had to learn again about the local
customs, state of the agriculture, local competing authorities, his new network of
subordinates and the like. Results from estimating Equation II.2 with the level
of previous experience instead of the level of local experience are presented in
Tables II.16 and II.17. All coefficients from the interaction term are statistically
insignificant (sample 1703–13) or positive and statistically significant, suggesting
that, if anything, intendants with higher levels of previous experience performed
worse than their counterparts. One explanation is that these intendants tried
to implement policies they experienced in the past, but these later were either
maladjusted or opposed by population and/or notables.105 This suggests that
more than human capital, social capital was of particular importance for the
103 BnF, NUMP-771, Journal historique sur les matières du tems, août 1708, page 97104 These provinces are in alphabetical order: Alençon, Auvergne, Bourges, Flanders, Franche-
Comté, Limoges, Maubeuge, Picardie, Poitiers. In the province of Limoges, the intendant, JeanRouillé de Fontaine (1703–8), also decided to resign after he successfully bought an office ofintendant du commerce. Three of the positions were held by intendants with no prior experiencein the post.
105 See anecdotal evidence in Section 1.3.
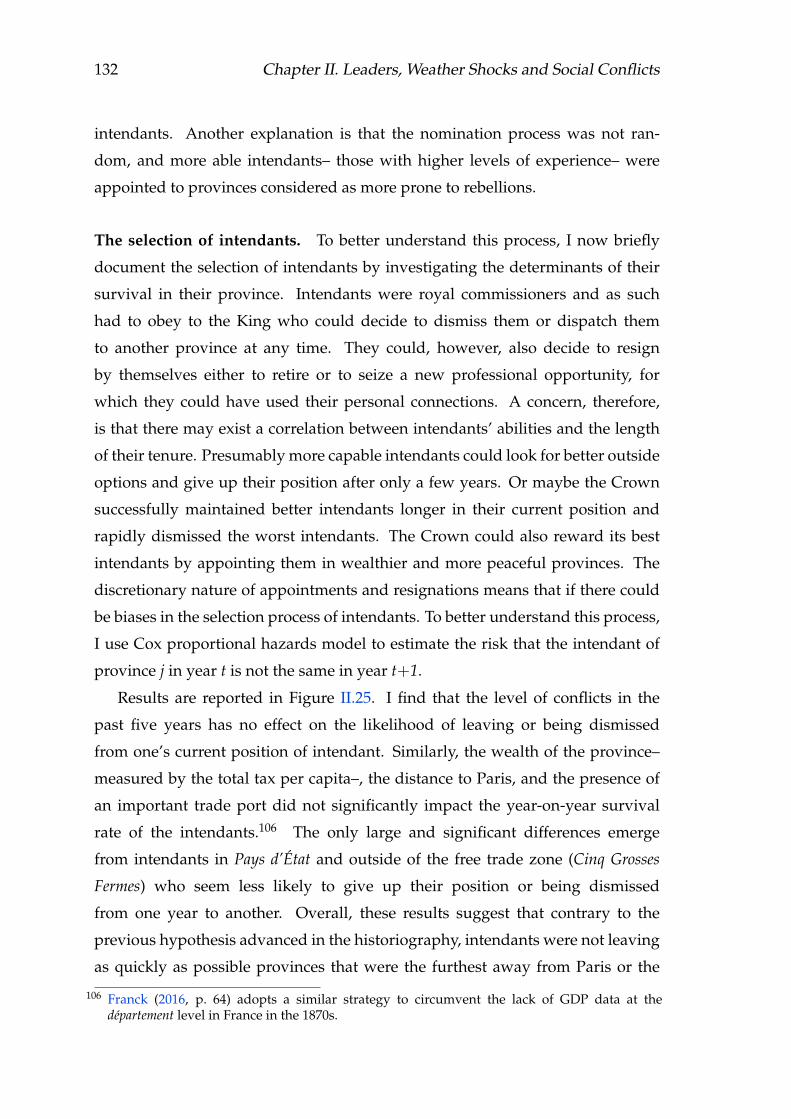
132 Chapter II. Leaders, Weather Shocks and Social Conflicts
intendants. Another explanation is that the nomination process was not ran-
dom, and more able intendants– those with higher levels of experience– were
appointed to provinces considered as more prone to rebellions.
The selection of intendants. To better understand this process, I now briefly
document the selection of intendants by investigating the determinants of their
survival in their province. Intendants were royal commissioners and as such
had to obey to the King who could decide to dismiss them or dispatch them
to another province at any time. They could, however, also decide to resign
by themselves either to retire or to seize a new professional opportunity, for
which they could have used their personal connections. A concern, therefore,
is that there may exist a correlation between intendants’ abilities and the length
of their tenure. Presumably more capable intendants could look for better outside
options and give up their position after only a few years. Or maybe the Crown
successfully maintained better intendants longer in their current position and
rapidly dismissed the worst intendants. The Crown could also reward its best
intendants by appointing them in wealthier and more peaceful provinces. The
discretionary nature of appointments and resignations means that if there could
be biases in the selection process of intendants. To better understand this process,
I use Cox proportional hazards model to estimate the risk that the intendant of
province j in year t is not the same in year t+1.
Results are reported in Figure II.25. I find that the level of conflicts in the
past five years has no effect on the likelihood of leaving or being dismissed
from one’s current position of intendant. Similarly, the wealth of the province–
measured by the total tax per capita–, the distance to Paris, and the presence of
an important trade port did not significantly impact the year-on-year survival
rate of the intendants.106 The only large and significant differences emerge
from intendants in Pays d’État and outside of the free trade zone (Cinq Grosses
Fermes) who seem less likely to give up their position or being dismissed
from one year to another. Overall, these results suggest that contrary to the
previous hypothesis advanced in the historiography, intendants were not leaving
as quickly as possible provinces that were the furthest away from Paris or the
106 Franck (2016, p. 64) adopts a similar strategy to circumvent the lack of GDP data at thedépartement level in France in the 1870s.
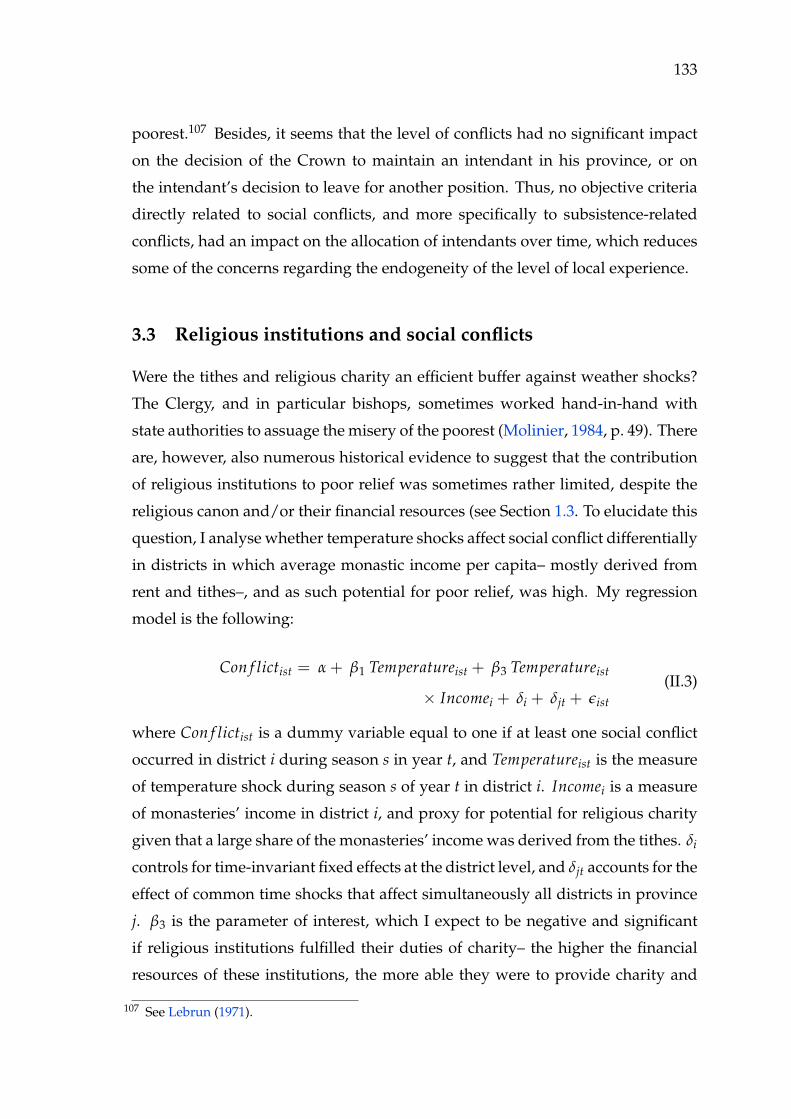
133
poorest.107 Besides, it seems that the level of conflicts had no significant impact
on the decision of the Crown to maintain an intendant in his province, or on
the intendant’s decision to leave for another position. Thus, no objective criteria
directly related to social conflicts, and more specifically to subsistence-related
conflicts, had an impact on the allocation of intendants over time, which reduces
some of the concerns regarding the endogeneity of the level of local experience.
3.3 Religious institutions and social conflicts
Were the tithes and religious charity an efficient buffer against weather shocks?
The Clergy, and in particular bishops, sometimes worked hand-in-hand with
state authorities to assuage the misery of the poorest (Molinier, 1984, p. 49). There
are, however, also numerous historical evidence to suggest that the contribution
of religious institutions to poor relief was sometimes rather limited, despite the
religious canon and/or their financial resources (see Section 1.3. To elucidate this
question, I analyse whether temperature shocks affect social conflict differentially
in districts in which average monastic income per capita– mostly derived from
rent and tithes–, and as such potential for poor relief, was high. My regression
model is the following:
Con f lictist = α + β1 Temperatureist + β3 Temperatureist
× Incomei + δi + δjt + ǫist
(II.3)
where Con f lictist is a dummy variable equal to one if at least one social conflict
occurred in district i during season s in year t, and Temperatureist is the measure
of temperature shock during season s of year t in district i. Incomei is a measure
of monasteries’ income in district i, and proxy for potential for religious charity
given that a large share of the monasteries’ income was derived from the tithes. δi
controls for time-invariant fixed effects at the district level, and δjt accounts for the
effect of common time shocks that affect simultaneously all districts in province
j. β3 is the parameter of interest, which I expect to be negative and significant
if religious institutions fulfilled their duties of charity– the higher the financial
resources of these institutions, the more able they were to provide charity and
107 See Lebrun (1971).

134 Chapter II. Leaders, Weather Shocks and Social Conflicts
help local communities to cope with temperature shocks– and positive and
significant if religious institutions evaded their duties– higher level of resource
extraction without redistribution left peasants with less resources to cope with
negative transitory income shocks.
Table II.18 reports the findings from my empirical examination of the afore-
mentioned mechanisms. In columns 1 and 4, I present results from estimating
Equation II.3. The interaction term is defined as the log of abbeys’ income per
capita in district i in 1780. In Figure II.22, I display the correlation between
total monastic income per capita per district in 1750 and 1780. The income of
religious institutions remained relatively stable and showed little variation over
the course of the 18th century. In column 4, the coefficient β3 equals 0.77 and
is statistically significant at 10%, indicating that districts in which monasteries’
income per capita was higher were more prone to food riots. One explanation
is that while abbeys were extracting parts of the agricultural output through the
tithes, they might not have redistributed it enough in times of dire need.108 This
interpretation is in line with anecdotal evidence presented in Section 1.3. Thus,
districts with higher resource extraction were then worse off and people resorted
more often to conflicts.
In November 1694, the King enforced a new temporary law to constraint
abbeys without an abbot at their head to spend one third of their income in poor
relief for a year, which is equivalent to the customary amount devoted to poor
relief in the religious canon.109 Few months later, a new edict was enforced to
remind these abbeys of their obligations, which were in line with the “spirit of
the sacred scriptures and apostolic constitution, which divided the income of
the benefices into three parts: one to support the necessary and ordinary costs,
another one to support the owner, and the third one for the poor”.110 These
two edicts suggest that, a priori, monasteries did not redistributed much of their
income. In columns 2 and 5, I trim my sample to year 1694–6 to explore the effect
108 It should be noted that the Church also extracted revenues from the rent of the land it owned.During the 18th century, the Church held about 6 per cent of the land in France, but withconsiderable regional variations. Its holdings raised to up to 40 per cent in the north, butdropped to below 2 per cent in the south (Hoffman, 2006, p. 73). For more details on thespread of Church ownership, see Guillot (1963, pp. 311-23), (Lefebvre, 1972, pp. 15–17, 892),and Lemarchand (1989, pp. 325-27).
109 BnF, IFN-8605561, Arrest du Conseil d’Etat du Roy, 20 November 1694.110 BnF, IFN-8605598, Arrest du Conseil d’Etat du Roy, 4 April 1695.

135
of this measure on the efficiency of religious poor relief. Thus, my analysis relies
on a differences-in-differences strategy and compares the likelihood of social
conflicts in districts that explicitly received charity in 1695 from monasteries
mentioned in the Edict with districts in which monasteries were not enforced
to distribute poor relief. As expected, the estimated coefficient is negative and
statistically significant for subsistence-related conflicts, suggesting the provision
of poor relief by these monasteries helped people in these districts to cope
significantly better with the temperature shocks. The effect of redistribution had
no significant impact on social conflicts broadly defined, which encompass many
types of conflicts that are not primarily driven by income shocks.
Finally, I further explore the question of resource extraction and redistribution
by analysing the effect of noble density on the onset of conflicts. Throughout the
17th and the 18th centuries, nobles were, relatively to their population share, the
largest landowners in France (e.g. Lefebvre, 1972, pp. 887–910) and appropriated
significant shares of the agricultural output. It should be noted that large wealth
inequalities existed within the nobility and across provinces. Documenting
precisely the effect of noble landownership and the underlying causal mechanism
driving this relationship would require extensive data collection and is beyond
the scope of this chapter. Results presented in columns 3 and 6 are, therefore, only
suggestive and complementary to results previously shown. To circumvent the
issue of data limitations, I follow Squicciarini and Voigtländer (2015) and gather
information on the density of noble families between 1650 and 1789. For each
province, I create a decennial index, named Nob. Index and calculated as the sum
of the number of noble families in province j during decade d. Columns 3 and
6 repeat the same analysis as columns 1 and 4, but substituting the log of the
monasteries’ income per capita by the index of noble density. The results are
qualitatively similar, though weaker. In column 6, the coefficient β3 equals 0.022
and is statistically significant at 1% level, suggesting that higher level of resource
extraction, either through rents or taxes paid to nobles, could have impeded
the resilience of peasant communities in the face of adverse weather conditions.
Although I can not formally test it, grievances are another channel through which
resource extraction may have influenced the likelihood of conflicts.

136 Chapter II. Leaders, Weather Shocks and Social Conflicts
4 Conclusion
This chapter studies the socio-economic consequences of weather shocks in early
modern France. I posit that temperature shocks had a significant impact on
living standards, through their effect on agricultural output and crop prices.
Temperature shocks increased household’s economic vulnerability by temporar-
ily reducing their disposable real income. I provide evidence that temperature
shocks significantly increased the likelihood of subsistence-related conflicts, such
as the interceptions of grains carts full and the loots of public granary. Local
communities implemented various strategies to build resilience against these
weather-induced transitory negative income shocks, which were also a central
concern for the administration willing to maintain social order and prevent
rebellions.
In this regard, the agents of the King in the provinces, namely the intendants,
had a very important role as depositaries for the collection of taxes, the regu-
lation of trade, and the monitoring of grains supply. Intendants were a quite
homogeneous group and most of the time shared a similar socio-economic and
professional background. Discussing the quality of a good intendant, Necker
emphasised the importance of the time spent in a province to acquire local
experience and accumulated human and social capital. Following Necker’s
argument, I build a new database on the universe of French intendants appointed
between 1661 and 1789 and investigate whether intendants with a higher level of
local experience were better able to mitigate the negative effect of temperature
shocks. I find that there were substantially less subsistence-related conflicts in
province managed by intendants with higher levels of local experience. The
likelihood of social conflict, however, remained unaffected by the intendant’s
local experience, suggesting that these former specifically and consistently took
actions to alleviate the stress of local communities and prevent food riots, but
did not intervene to avert other conflicts. This interpretation is supported by
historical evidence.
I further document the role religious institutions in the provision of poor
relief. The tithe was a compulsory contribution, equal to one-tenth of the
agricultural production, to religious institutions, which, according the Catholic
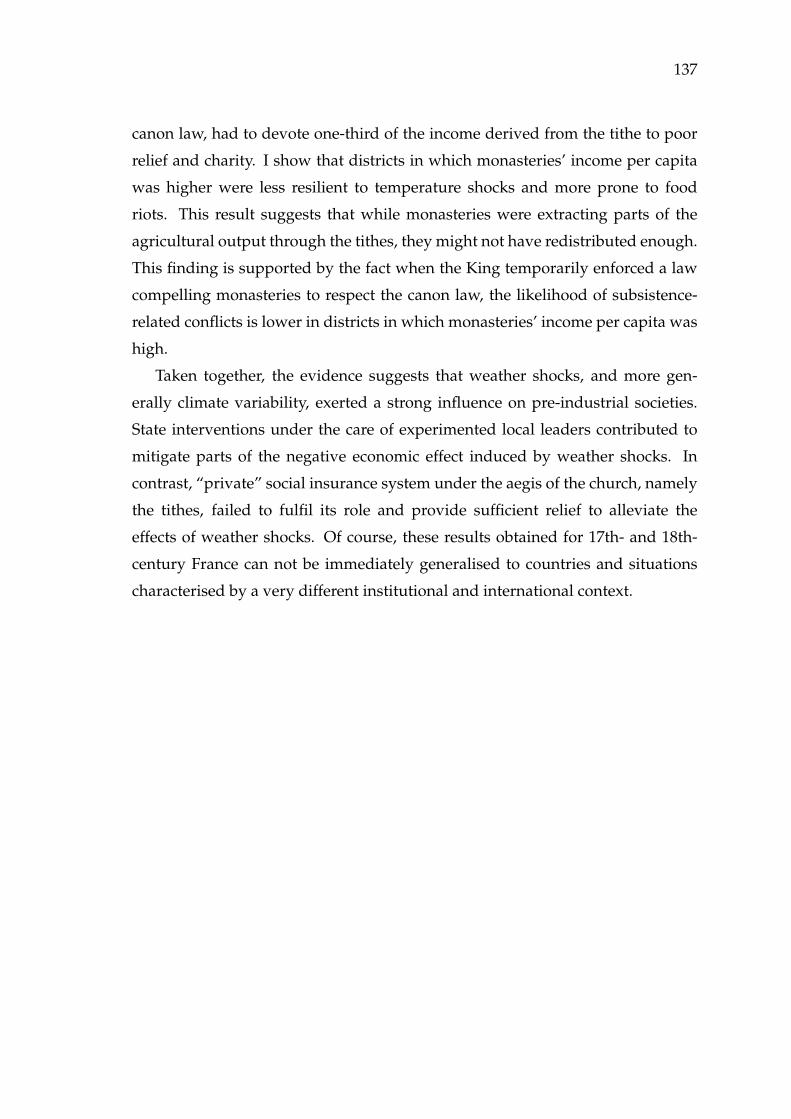
137
canon law, had to devote one-third of the income derived from the tithe to poor
relief and charity. I show that districts in which monasteries’ income per capita
was higher were less resilient to temperature shocks and more prone to food
riots. This result suggests that while monasteries were extracting parts of the
agricultural output through the tithes, they might not have redistributed enough.
This finding is supported by the fact when the King temporarily enforced a law
compelling monasteries to respect the canon law, the likelihood of subsistence-
related conflicts is lower in districts in which monasteries’ income per capita was
high.
Taken together, the evidence suggests that weather shocks, and more gen-
erally climate variability, exerted a strong influence on pre-industrial societies.
State interventions under the care of experimented local leaders contributed to
mitigate parts of the negative economic effect induced by weather shocks. In
contrast, “private” social insurance system under the aegis of the church, namely
the tithes, failed to fulfil its role and provide sufficient relief to alleviate the
effects of weather shocks. Of course, these results obtained for 17th- and 18th-
century France can not be immediately generalised to countries and situations
characterised by a very different institutional and international context.
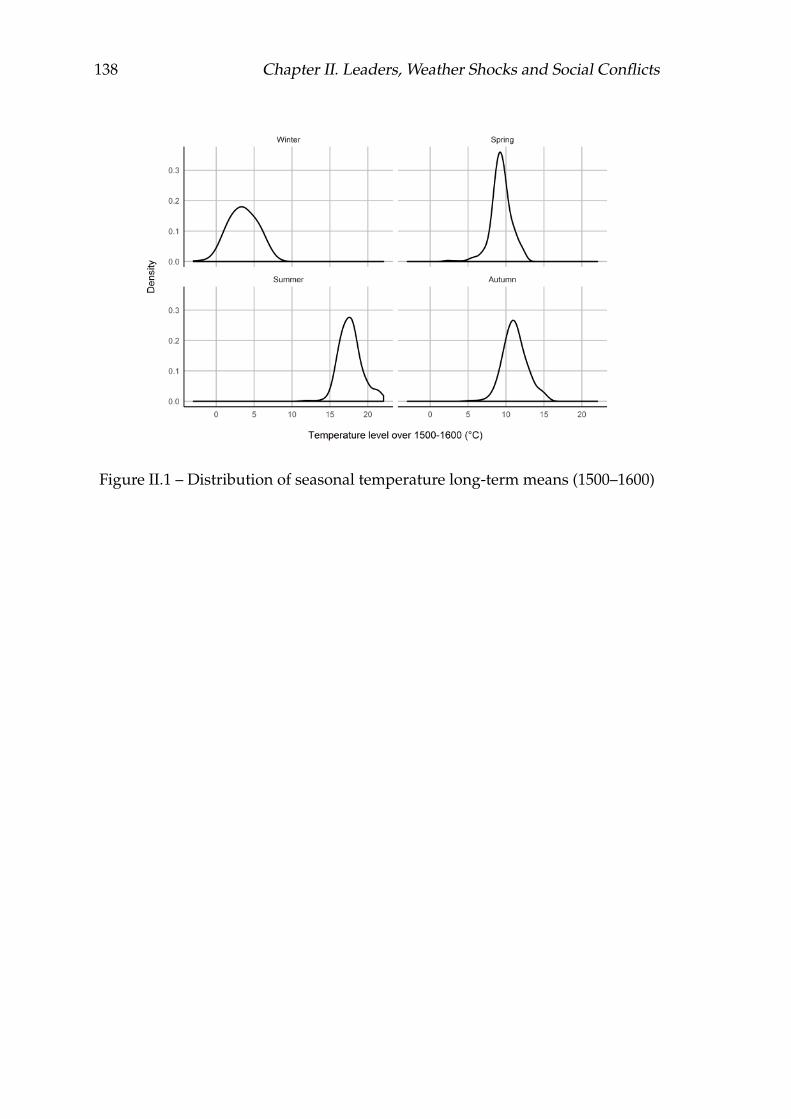
138 Chapter II. Leaders, Weather Shocks and Social Conflicts
Figure II.1 – Distribution of seasonal temperature long-term means (1500–1600)
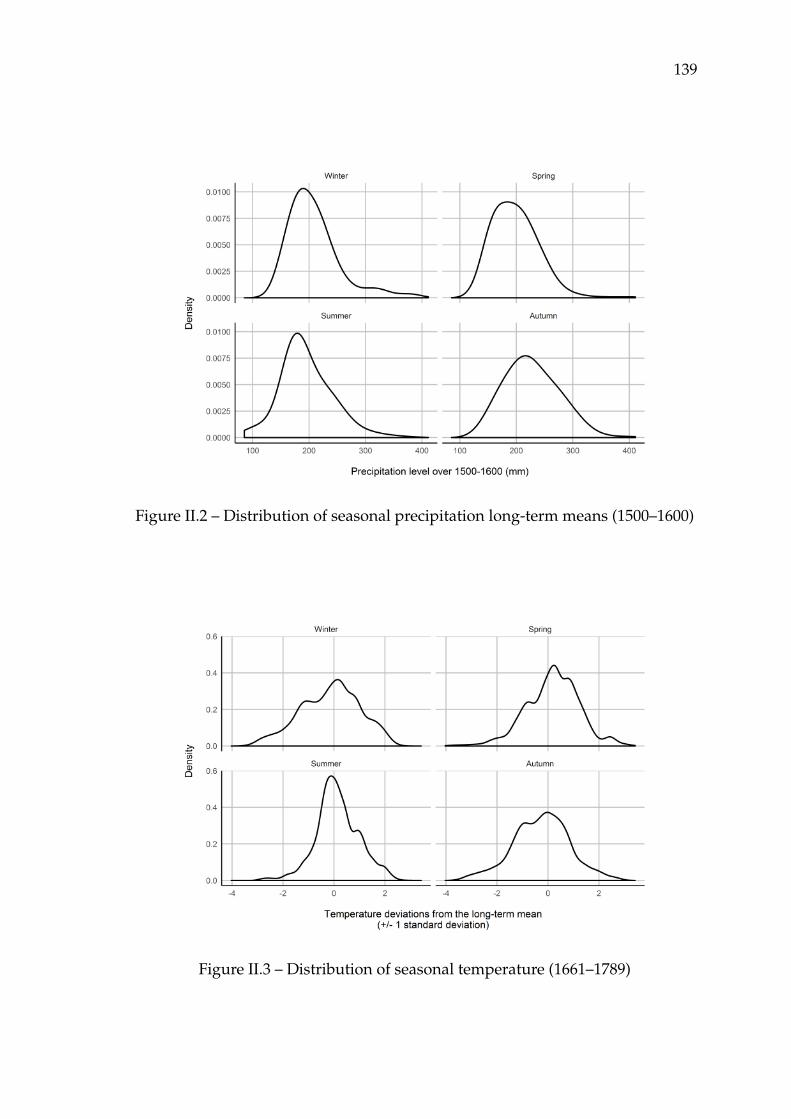
139
Figure II.2 – Distribution of seasonal precipitation long-term means (1500–1600)
Figure II.3 – Distribution of seasonal temperature (1661–1789)
140 Chapter II. Leaders, Weather Shocks and Social Conflicts
Figure II.4 – Distribution of seasonal precipitation (1661–1789)
Notes: Arras, 1783–8 (Jourdain et al., 2015); Lille, 1758–90 (Grenier, 1996, p. 85); Marseille, 1745–92 (Roucaute et al., 2014); Saint-Dié-des-Vosges, 1786–91(Jourdain et al., 2015); Saint-Malô, 1782–8 (Jourdain et al., 2015).
Figure II.5 – Correlation between paleoclimatological and instrumental tempera-ture series (1745–92)

141
Notes: Aix-en-Provence, 1728–30 and 1776–7 (Raulin, 1874, p. 877); Arles, 1782–6 (Raulin, 1874, p. 873); Béziers, 1725–32 and 1782–6 (Raulin, 1874, p. 157);Bordeaux, 1714–86 (Raulin, 1864, pp. 217–8); Cardon-Blanc, 1729–70 (Raulin, 1864, p. 270); Cavaillon, 1785–6 (Raulin, 1874, p. 863); La Rochelle, 1777–93(Raulin, 1864, p. 206); Lille, 1758–90 (Grenier, 1996, p. 87); Lyon, 1765–80 (Raulin, 1874, p. 80); Poitiers, 1778–1800 (Raulin, 1864, p. 188); Manosque, 1782–6(Raulin, 1874, p. 852); Marans, 1783–6 (Raulin, 1864, p. 204); Marseille, 1748–1800 (Roucaute et al., 2014); Montpellier, 1765–1800 (Raulin, 1864, p. 343);Nîmes, 1746–55 and 1784–85 (Raulin, 1874, p. 138); Rieux, 1783–6 (Raulin, 1864, p. 296); Saint-Sever, 1782–96 (Raulin, 1864, p. 256); Toulon, 1739 and 1742–7(Raulin, 1874, p. 890); Toulouse, 1750 and 1785–6 (Raulin, 1864, p. 292); Viviers, 1778–1800 (Raulin, 1874, p. 129).
Figure II.6 – Correlation between paleoclimatological and instrumental precipita-tion series (1714–92)
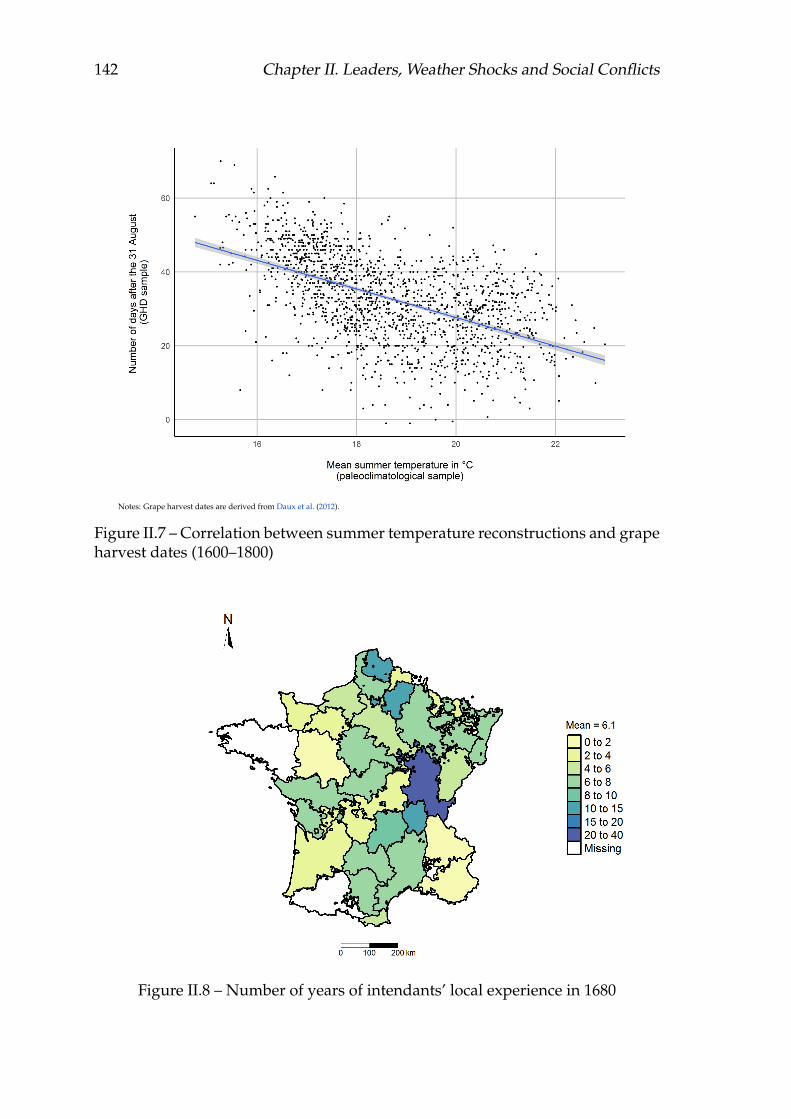
142 Chapter II. Leaders, Weather Shocks and Social Conflicts
Notes: Grape harvest dates are derived from Daux et al. (2012).
Figure II.7 – Correlation between summer temperature reconstructions and grapeharvest dates (1600–1800)
Figure II.8 – Number of years of intendants’ local experience in 1680
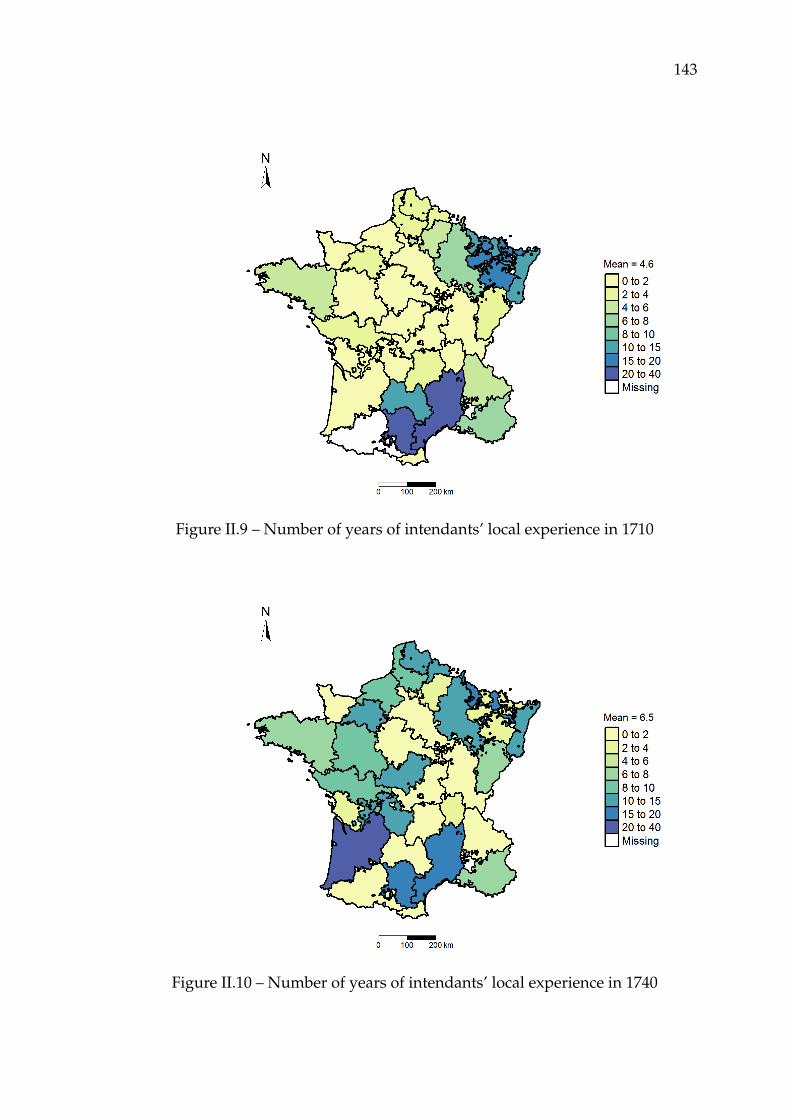
143
Figure II.9 – Number of years of intendants’ local experience in 1710
Figure II.10 – Number of years of intendants’ local experience in 1740
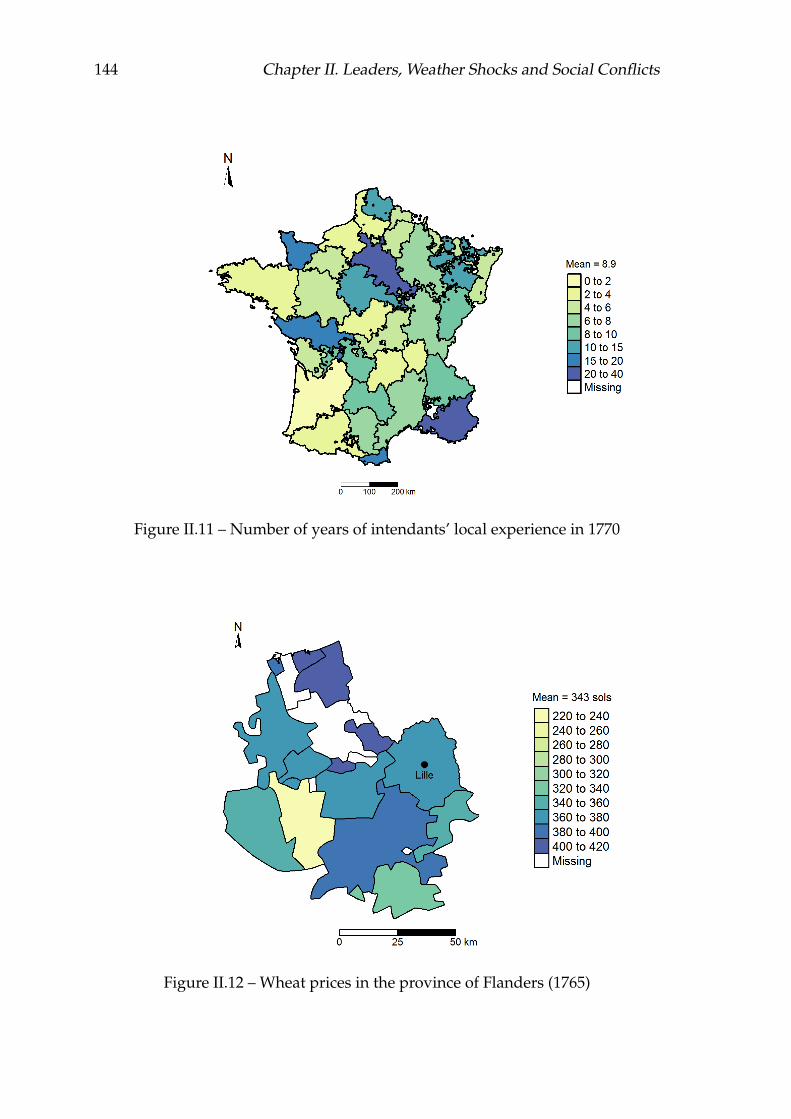
144 Chapter II. Leaders, Weather Shocks and Social Conflicts
Figure II.11 – Number of years of intendants’ local experience in 1770
Figure II.12 – Wheat prices in the province of Flanders (1765)
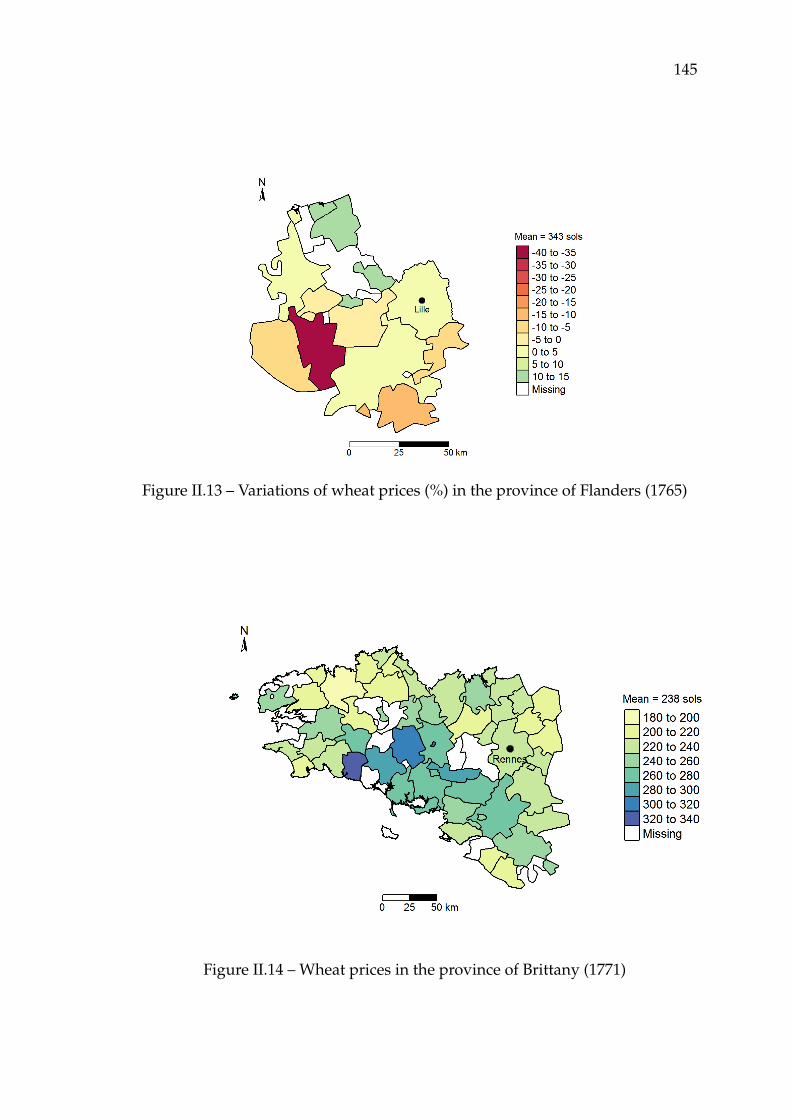
145
Figure II.13 – Variations of wheat prices (%) in the province of Flanders (1765)
Figure II.14 – Wheat prices in the province of Brittany (1771)
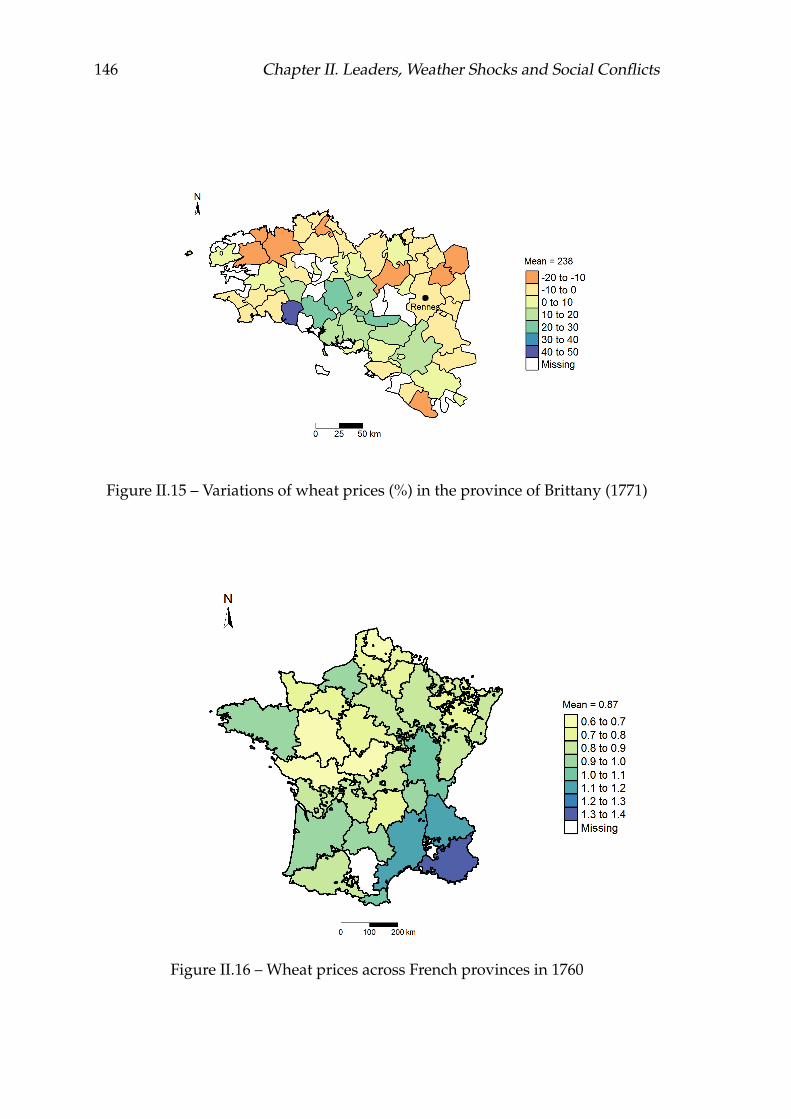
146 Chapter II. Leaders, Weather Shocks and Social Conflicts
Figure II.15 – Variations of wheat prices (%) in the province of Brittany (1771)
Figure II.16 – Wheat prices across French provinces in 1760

147
Figure II.17 – Wheat prices across French provinces in 1770
Figure II.18 – Wheat prices across French provinces in 1780
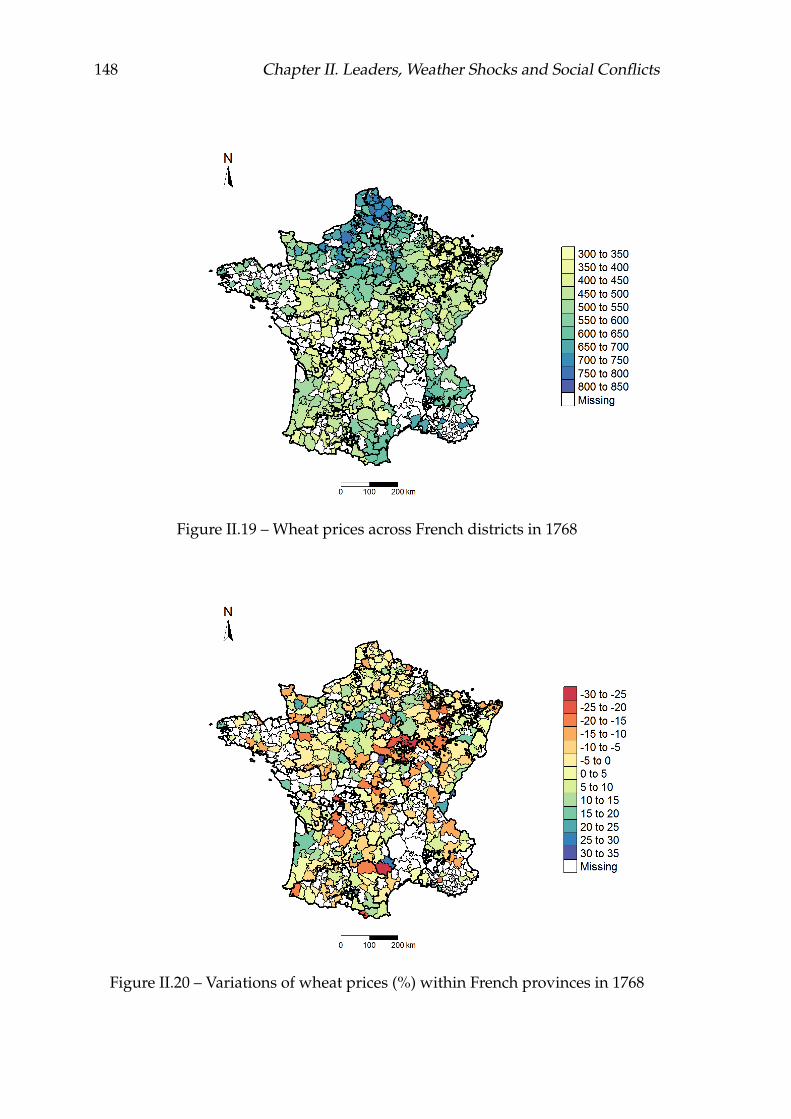
148 Chapter II. Leaders, Weather Shocks and Social Conflicts
Figure II.19 – Wheat prices across French districts in 1768
Figure II.20 – Variations of wheat prices (%) within French provinces in 1768

149
Figure II.21 – Correlation between prices samples at the level of provinces (1767–8)
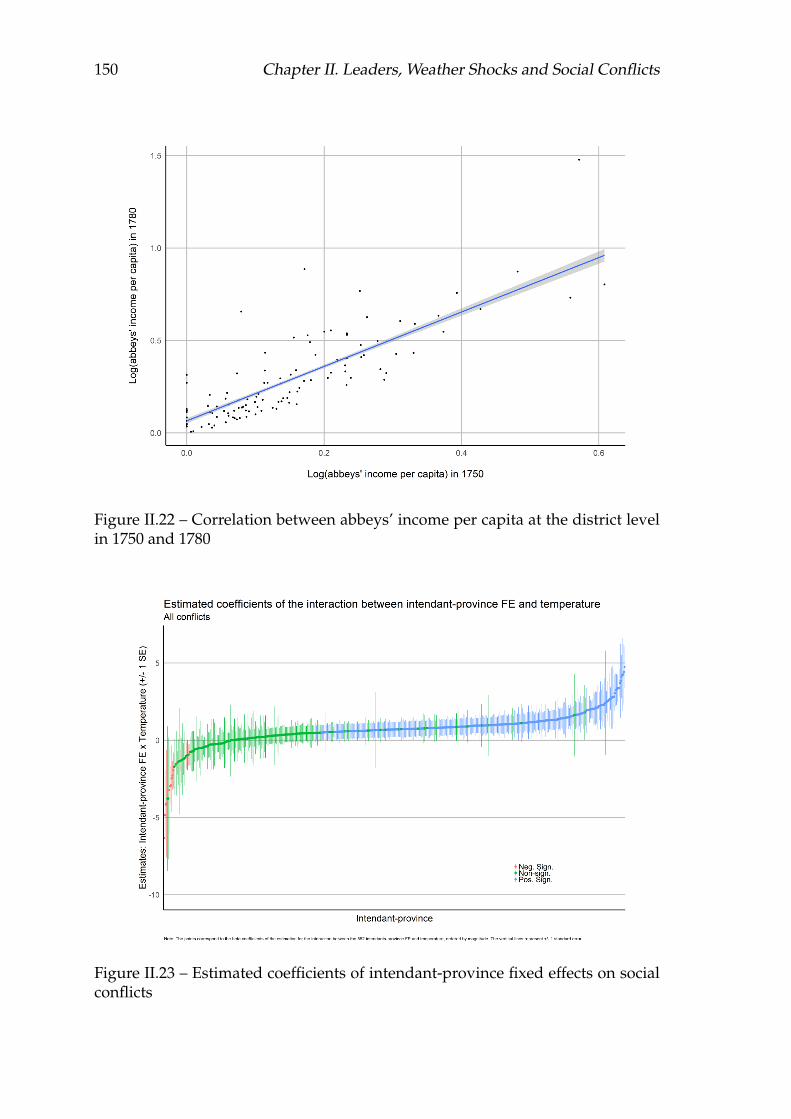
150 Chapter II. Leaders, Weather Shocks and Social Conflicts
Figure II.22 – Correlation between abbeys’ income per capita at the district levelin 1750 and 1780
Figure II.23 – Estimated coefficients of intendant-province fixed effects on socialconflicts
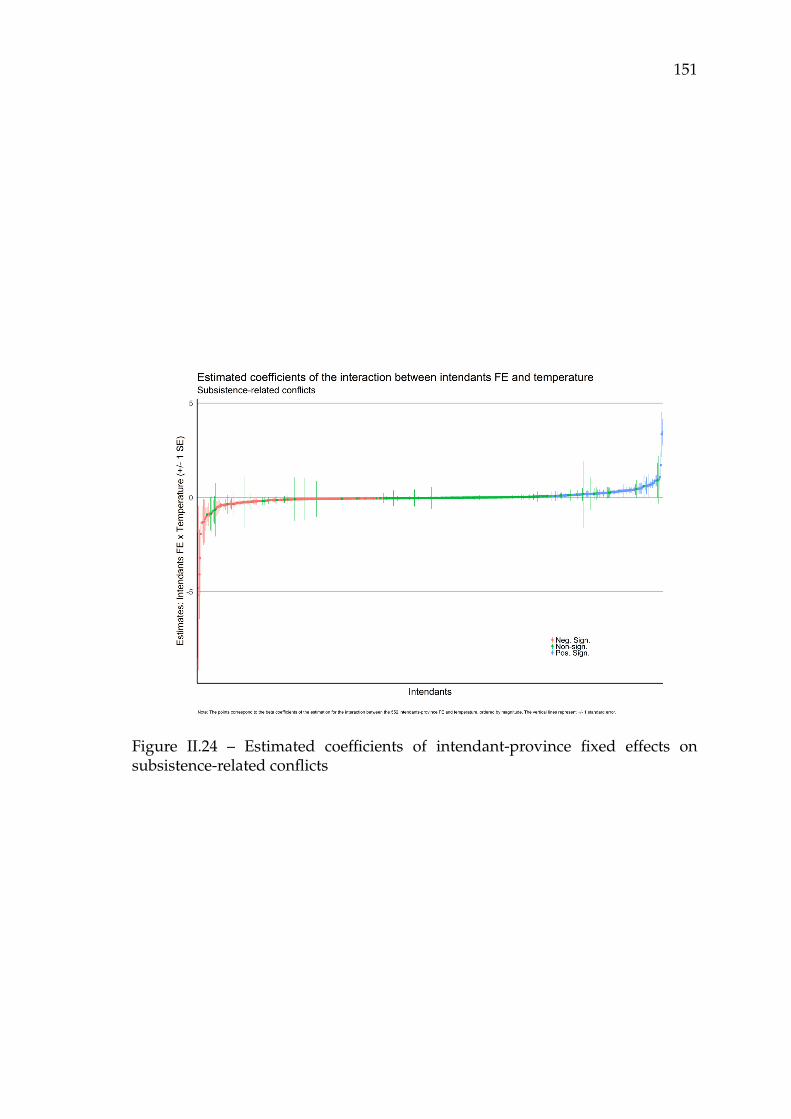
151
Figure II.24 – Estimated coefficients of intendant-province fixed effects onsubsistence-related conflicts
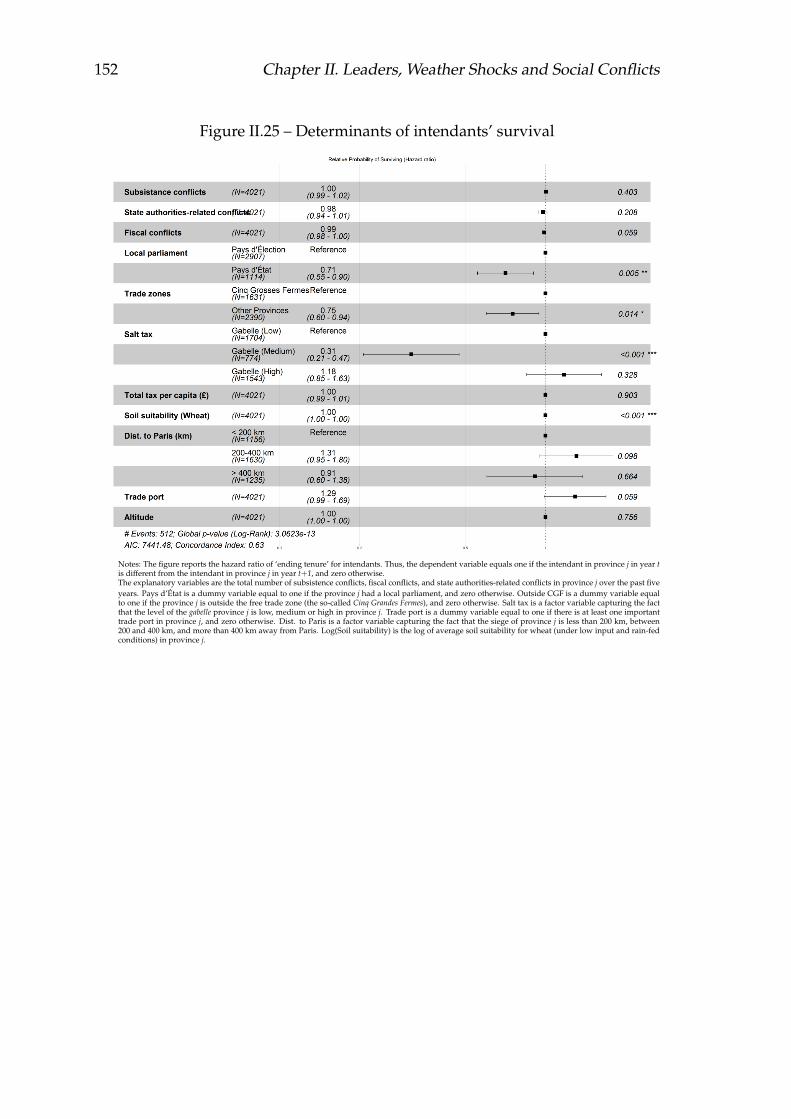
152 Chapter II. Leaders, Weather Shocks and Social Conflicts
Figure II.25 – Determinants of intendants’ survival
Notes: The figure reports the hazard ratio of ‘ending tenure’ for intendants. Thus, the dependent variable equals one if the intendant in province j in year tis different from the intendant in province j in year t+1, and zero otherwise.The explanatory variables are the total number of subsistence conflicts, fiscal conflicts, and state authorities-related conflicts in province j over the past fiveyears. Pays d’État is a dummy variable equal to one if the province j had a local parliament, and zero otherwise. Outside CGF is a dummy variable equalto one if the province j is outside the free trade zone (the so-called Cinq Grandes Fermes), and zero otherwise. Salt tax is a factor variable capturing the factthat the level of the gabelle province j is low, medium or high in province j. Trade port is a dummy variable equal to one if there is at least one importanttrade port in province j, and zero otherwise. Dist. to Paris is a factor variable capturing the fact that the siege of province j is less than 200 km, between200 and 400 km, and more than 400 km away from Paris. Log(Soil suitability) is the log of average soil suitability for wheat (under low input and rain-fedconditions) in province j.
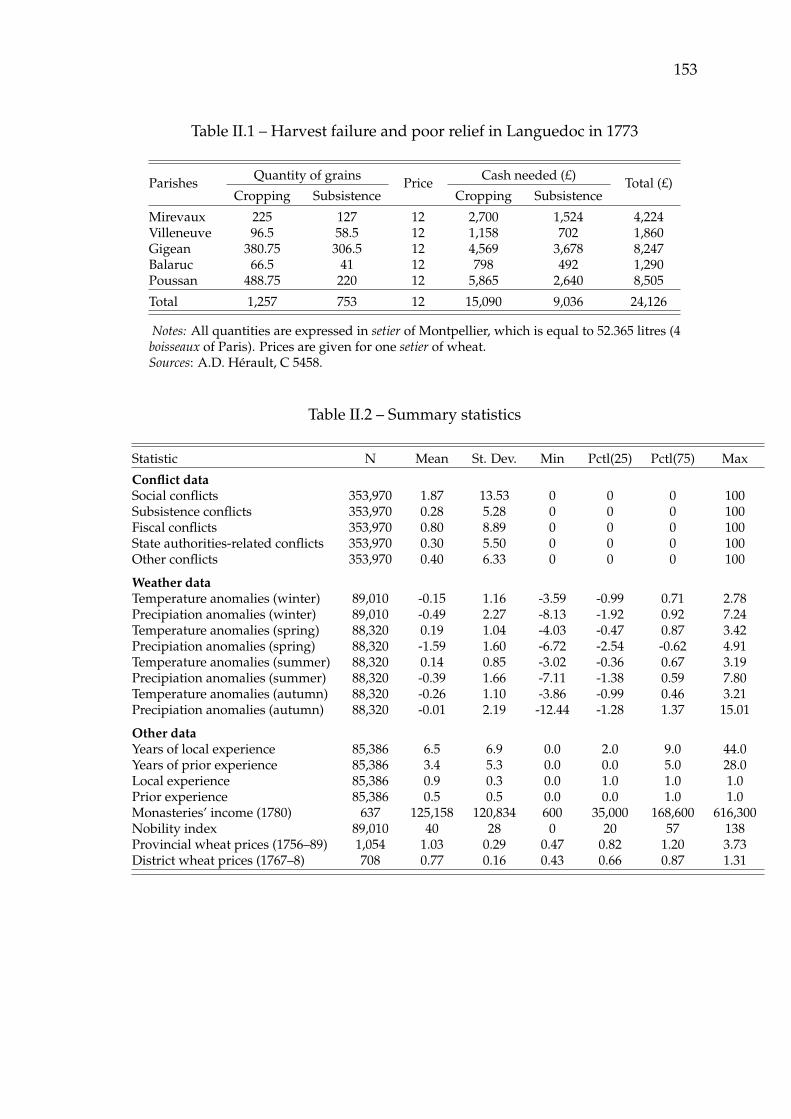
153
Table II.1 – Harvest failure and poor relief in Languedoc in 1773
ParishesQuantity of grains
PriceCash needed (£)
Total (£)Cropping Subsistence Cropping Subsistence
Mirevaux 225 127 12 2,700 1,524 4,224Villeneuve 96.5 58.5 12 1,158 702 1,860Gigean 380.75 306.5 12 4,569 3,678 8,247Balaruc 66.5 41 12 798 492 1,290Poussan 488.75 220 12 5,865 2,640 8,505
Total 1,257 753 12 15,090 9,036 24,126
Notes: All quantities are expressed in setier of Montpellier, which is equal to 52.365 litres (4boisseaux of Paris). Prices are given for one setier of wheat.Sources: A.D. Hérault, C 5458.
Table II.2 – Summary statistics
Statistic N Mean St. Dev. Min Pctl(25) Pctl(75) Max
Conflict dataSocial conflicts 353,970 1.87 13.53 0 0 0 100Subsistence conflicts 353,970 0.28 5.28 0 0 0 100Fiscal conflicts 353,970 0.80 8.89 0 0 0 100State authorities-related conflicts 353,970 0.30 5.50 0 0 0 100Other conflicts 353,970 0.40 6.33 0 0 0 100
Weather dataTemperature anomalies (winter) 89,010 -0.15 1.16 -3.59 -0.99 0.71 2.78Precipiation anomalies (winter) 89,010 -0.49 2.27 -8.13 -1.92 0.92 7.24Temperature anomalies (spring) 88,320 0.19 1.04 -4.03 -0.47 0.87 3.42Precipiation anomalies (spring) 88,320 -1.59 1.60 -6.72 -2.54 -0.62 4.91Temperature anomalies (summer) 88,320 0.14 0.85 -3.02 -0.36 0.67 3.19Precipiation anomalies (summer) 88,320 -0.39 1.66 -7.11 -1.38 0.59 7.80Temperature anomalies (autumn) 88,320 -0.26 1.10 -3.86 -0.99 0.46 3.21Precipiation anomalies (autumn) 88,320 -0.01 2.19 -12.44 -1.28 1.37 15.01
Other dataYears of local experience 85,386 6.5 6.9 0.0 2.0 9.0 44.0Years of prior experience 85,386 3.4 5.3 0.0 0.0 5.0 28.0Local experience 85,386 0.9 0.3 0.0 1.0 1.0 1.0Prior experience 85,386 0.5 0.5 0.0 0.0 1.0 1.0Monasteries’ income (1780) 637 125,158 120,834 600 35,000 168,600 616,300Nobility index 89,010 40 28 0 20 57 138Provincial wheat prices (1756–89) 1,054 1.03 0.29 0.47 0.82 1.20 3.73District wheat prices (1767–8) 708 0.77 0.16 0.43 0.66 0.87 1.31

Table II.3 – Temperature shocks and social conflicts in France (1661–1789)
Social Subsistence Fiscal State authorities- Otherconflicts conflicts conflicts -related conflicts conflicts
(1) (2) (3) (4) (5)
Temperature 0.108∗∗∗ 0.052∗∗∗ 0.005 0.033∗∗∗ 0.010(0.026) (0.013) (0.017) (0.010) (0.012)
District FE Yes Yes Yes Yes YesProvince × Year FE Yes Yes Yes Yes YesObservations 353,970 353,970 353,970 353,970 353,970
Mean DV 1.87 0.28 0.8 0.3 0.4
Notes: Significant at ***1%, **5%, *10%. LPM estimations. Conley (1999) standard errorsin parentheses allowing for spatial correlation within a 100 km radius and for infinite serialcorrelation.The dependent variable in column 1 equals 100 if at least one social conflict occurred in districti in season s in year t, and zero otherwise. In columns 2 to 5, the other dependent variablesare defined accordingly for subsistence-related conflict, fiscal conflict, conflict against stateauthorities, and other types of conflict. The independent variable Temperature is the seasonaltemperature deviation from the long-term seasonal mean (1500-1600) in district i, divided byits standard deviation. District FE is a full set of 690 district fixed effects. Province x Year FE isthe interaction of province dummies with the full set of year fixed effects.
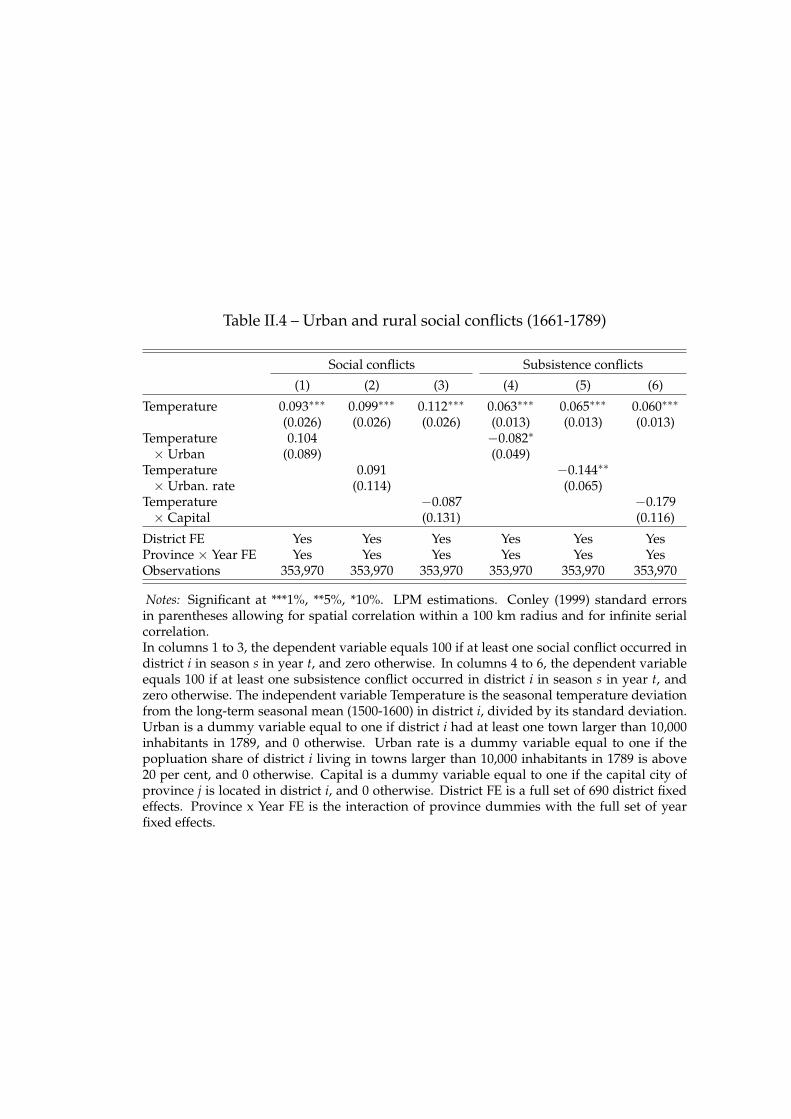
Table II.4 – Urban and rural social conflicts (1661-1789)
Social conflicts Subsistence conflicts
(1) (2) (3) (4) (5) (6)
Temperature 0.093∗∗∗ 0.099∗∗∗ 0.112∗∗∗ 0.063∗∗∗ 0.065∗∗∗ 0.060∗∗∗
(0.026) (0.026) (0.026) (0.013) (0.013) (0.013)Temperature 0.104 −0.082∗
× Urban (0.089) (0.049)Temperature 0.091 −0.144∗∗
× Urban. rate (0.114) (0.065)Temperature −0.087 −0.179× Capital (0.131) (0.116)
District FE Yes Yes Yes Yes Yes YesProvince × Year FE Yes Yes Yes Yes Yes YesObservations 353,970 353,970 353,970 353,970 353,970 353,970
Notes: Significant at ***1%, **5%, *10%. LPM estimations. Conley (1999) standard errorsin parentheses allowing for spatial correlation within a 100 km radius and for infinite serialcorrelation.In columns 1 to 3, the dependent variable equals 100 if at least one social conflict occurred indistrict i in season s in year t, and zero otherwise. In columns 4 to 6, the dependent variableequals 100 if at least one subsistence conflict occurred in district i in season s in year t, andzero otherwise. The independent variable Temperature is the seasonal temperature deviationfrom the long-term seasonal mean (1500-1600) in district i, divided by its standard deviation.Urban is a dummy variable equal to one if district i had at least one town larger than 10,000inhabitants in 1789, and 0 otherwise. Urban rate is a dummy variable equal to one if thepopluation share of district i living in towns larger than 10,000 inhabitants in 1789 is above20 per cent, and 0 otherwise. Capital is a dummy variable equal to one if the capital city ofprovince j is located in district i, and 0 otherwise. District FE is a full set of 690 district fixedeffects. Province x Year FE is the interaction of province dummies with the full set of yearfixed effects.
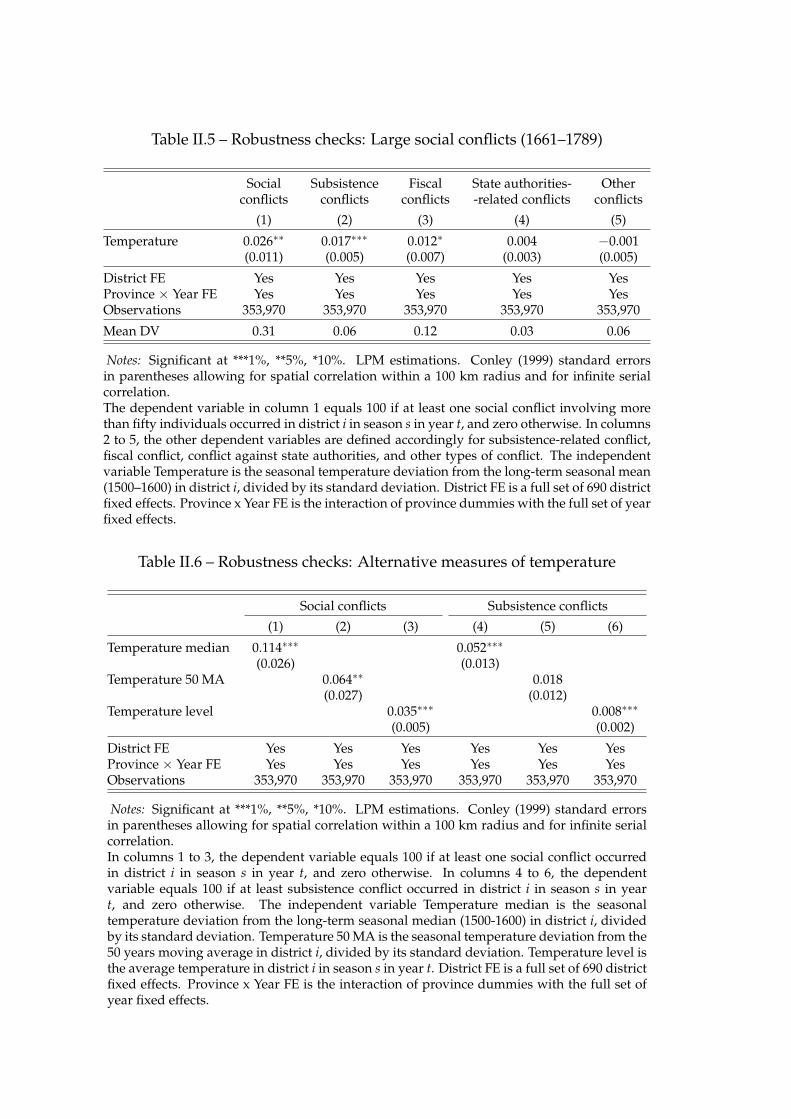
Table II.5 – Robustness checks: Large social conflicts (1661–1789)
Social Subsistence Fiscal State authorities- Otherconflicts conflicts conflicts -related conflicts conflicts
(1) (2) (3) (4) (5)
Temperature 0.026∗∗ 0.017∗∗∗ 0.012∗ 0.004 −0.001(0.011) (0.005) (0.007) (0.003) (0.005)
District FE Yes Yes Yes Yes YesProvince × Year FE Yes Yes Yes Yes YesObservations 353,970 353,970 353,970 353,970 353,970
Mean DV 0.31 0.06 0.12 0.03 0.06
Notes: Significant at ***1%, **5%, *10%. LPM estimations. Conley (1999) standard errorsin parentheses allowing for spatial correlation within a 100 km radius and for infinite serialcorrelation.The dependent variable in column 1 equals 100 if at least one social conflict involving morethan fifty individuals occurred in district i in season s in year t, and zero otherwise. In columns2 to 5, the other dependent variables are defined accordingly for subsistence-related conflict,fiscal conflict, conflict against state authorities, and other types of conflict. The independentvariable Temperature is the seasonal temperature deviation from the long-term seasonal mean(1500–1600) in district i, divided by its standard deviation. District FE is a full set of 690 districtfixed effects. Province x Year FE is the interaction of province dummies with the full set of yearfixed effects.
Table II.6 – Robustness checks: Alternative measures of temperature
Social conflicts Subsistence conflicts
(1) (2) (3) (4) (5) (6)
Temperature median 0.114∗∗∗ 0.052∗∗∗
(0.026) (0.013)Temperature 50 MA 0.064∗∗ 0.018
(0.027) (0.012)Temperature level 0.035∗∗∗ 0.008∗∗∗
(0.005) (0.002)
District FE Yes Yes Yes Yes Yes YesProvince × Year FE Yes Yes Yes Yes Yes YesObservations 353,970 353,970 353,970 353,970 353,970 353,970
Notes: Significant at ***1%, **5%, *10%. LPM estimations. Conley (1999) standard errorsin parentheses allowing for spatial correlation within a 100 km radius and for infinite serialcorrelation.In columns 1 to 3, the dependent variable equals 100 if at least one social conflict occurredin district i in season s in year t, and zero otherwise. In columns 4 to 6, the dependentvariable equals 100 if at least subsistence conflict occurred in district i in season s in yeart, and zero otherwise. The independent variable Temperature median is the seasonaltemperature deviation from the long-term seasonal median (1500-1600) in district i, dividedby its standard deviation. Temperature 50 MA is the seasonal temperature deviation from the50 years moving average in district i, divided by its standard deviation. Temperature level isthe average temperature in district i in season s in year t. District FE is a full set of 690 districtfixed effects. Province x Year FE is the interaction of province dummies with the full set ofyear fixed effects.
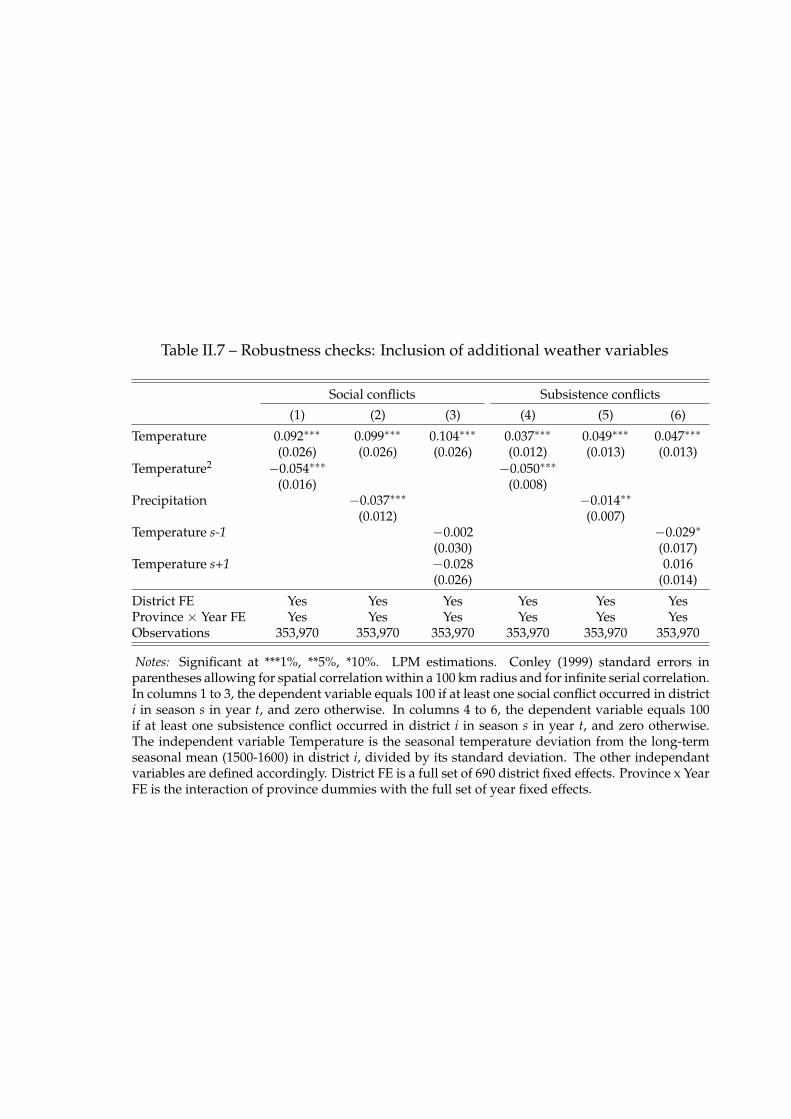
Table II.7 – Robustness checks: Inclusion of additional weather variables
Social conflicts Subsistence conflicts
(1) (2) (3) (4) (5) (6)
Temperature 0.092∗∗∗ 0.099∗∗∗ 0.104∗∗∗ 0.037∗∗∗ 0.049∗∗∗ 0.047∗∗∗
(0.026) (0.026) (0.026) (0.012) (0.013) (0.013)Temperature2 −0.054∗∗∗ −0.050∗∗∗
(0.016) (0.008)Precipitation −0.037∗∗∗ −0.014∗∗
(0.012) (0.007)Temperature s-1 −0.002 −0.029∗
(0.030) (0.017)Temperature s+1 −0.028 0.016
(0.026) (0.014)
District FE Yes Yes Yes Yes Yes YesProvince × Year FE Yes Yes Yes Yes Yes YesObservations 353,970 353,970 353,970 353,970 353,970 353,970
Notes: Significant at ***1%, **5%, *10%. LPM estimations. Conley (1999) standard errors inparentheses allowing for spatial correlation within a 100 km radius and for infinite serial correlation.In columns 1 to 3, the dependent variable equals 100 if at least one social conflict occurred in districti in season s in year t, and zero otherwise. In columns 4 to 6, the dependent variable equals 100if at least one subsistence conflict occurred in district i in season s in year t, and zero otherwise.The independent variable Temperature is the seasonal temperature deviation from the long-termseasonal mean (1500-1600) in district i, divided by its standard deviation. The other independantvariables are defined accordingly. District FE is a full set of 690 district fixed effects. Province x YearFE is the interaction of province dummies with the full set of year fixed effects.

Table II.8 – Robustness checks: Alternative measures of temperature
Social Subsistence Fiscal State authorities- OtherConflicts Conflicts Conflicts -related Conflicts Conflicts
(1) (2) (3) (4) (5)
Decile 2 0.022 0.140∗∗∗ −0.111∗ 0.047 −0.049(0.102) (0.048) (0.063) (0.050) (0.051)
Decile 3 0.225∗∗ 0.178∗∗∗ −0.001 0.032 −0.022(0.112) (0.050) (0.074) (0.042) (0.051)
Decile 4 0.382∗∗∗ 0.210∗∗∗ 0.028 0.074∗ 0.037(0.114) (0.060) (0.071) (0.045) (0.049)
Decile 5 0.180 0.103∗ −0.076 0.013 0.080(0.113) (0.056) (0.069) (0.046) (0.053)
Decile 6 0.341∗∗∗ 0.274∗∗∗ −0.045 0.061 0.046(0.113) (0.058) (0.072) (0.047) (0.058)
Decile 7 0.184 0.258∗∗∗ −0.091 0.002 −0.046(0.112) (0.056) (0.071) (0.046) (0.057)
Decile 8 0.249∗∗ 0.120∗∗ −0.086 0.117∗∗∗ 0.045(0.117) (0.053) (0.074) (0.045) (0.057)
Decile 9 0.421∗∗∗ 0.265∗∗∗ 0.015 0.132∗∗ 0.030(0.120) (0.062) (0.076) (0.052) (0.055)
Decile 10 0.324∗∗∗ 0.146∗∗∗ 0.015 0.113∗∗ −0.011(0.118) (0.047) (0.076) (0.047) (0.055)
District FE Yes Yes Yes Yes YesProvince × Year FE Yes Yes Yes Yes YesObservations 353,970 353,970 353,970 353,970 353,970
Notes: Significant at ***1%, **5%, *10%. LPM estimations. Conley (1999) standard errorsin parentheses allowing for spatial correlation within a 100 km radius and for infinite serialcorrelation.The dependent variable in column 1 equals 100 if at least one social conflict occurred in districti in season s in year t, and zero otherwise. In columns 2 to 5, the other dependent variablesare defined accordingly for subsistence-related conflict, fiscal conflict, conflict against stateauthorities, and other types of conflict, and zero otherwise. The independent variable Decileis an ordered categorical variable ranging from one to ten that indicates the decile that eachtemperature anomalies in district i is in. District FE is a full set of 690 district fixed effects.Province x Year FE is the interaction of province dummies with the full set of year fixed effects.
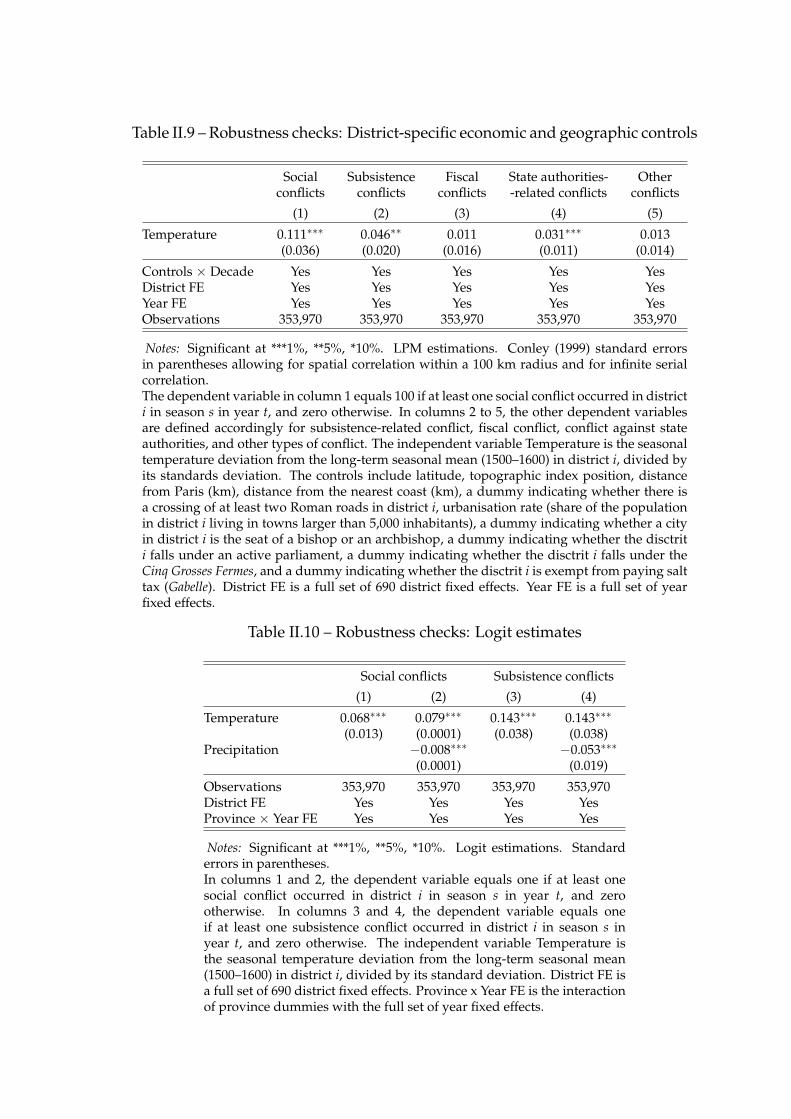
Table II.9 – Robustness checks: District-specific economic and geographic controls
Social Subsistence Fiscal State authorities- Otherconflicts conflicts conflicts -related conflicts conflicts
(1) (2) (3) (4) (5)
Temperature 0.111∗∗∗ 0.046∗∗ 0.011 0.031∗∗∗ 0.013(0.036) (0.020) (0.016) (0.011) (0.014)
Controls × Decade Yes Yes Yes Yes YesDistrict FE Yes Yes Yes Yes YesYear FE Yes Yes Yes Yes YesObservations 353,970 353,970 353,970 353,970 353,970
Notes: Significant at ***1%, **5%, *10%. LPM estimations. Conley (1999) standard errorsin parentheses allowing for spatial correlation within a 100 km radius and for infinite serialcorrelation.The dependent variable in column 1 equals 100 if at least one social conflict occurred in districti in season s in year t, and zero otherwise. In columns 2 to 5, the other dependent variablesare defined accordingly for subsistence-related conflict, fiscal conflict, conflict against stateauthorities, and other types of conflict. The independent variable Temperature is the seasonaltemperature deviation from the long-term seasonal mean (1500–1600) in district i, divided byits standards deviation. The controls include latitude, topographic index position, distancefrom Paris (km), distance from the nearest coast (km), a dummy indicating whether there isa crossing of at least two Roman roads in district i, urbanisation rate (share of the populationin district i living in towns larger than 5,000 inhabitants), a dummy indicating whether a cityin district i is the seat of a bishop or an archbishop, a dummy indicating whether the disctriti falls under an active parliament, a dummy indicating whether the disctrit i falls under theCinq Grosses Fermes, and a dummy indicating whether the disctrit i is exempt from paying salttax (Gabelle). District FE is a full set of 690 district fixed effects. Year FE is a full set of yearfixed effects.
Table II.10 – Robustness checks: Logit estimates
Social conflicts Subsistence conflicts
(1) (2) (3) (4)
Temperature 0.068∗∗∗ 0.079∗∗∗ 0.143∗∗∗ 0.143∗∗∗
(0.013) (0.0001) (0.038) (0.038)Precipitation −0.008∗∗∗ −0.053∗∗∗
(0.0001) (0.019)
Observations 353,970 353,970 353,970 353,970District FE Yes Yes Yes YesProvince × Year FE Yes Yes Yes Yes
Notes: Significant at ***1%, **5%, *10%. Logit estimations. Standarderrors in parentheses.In columns 1 and 2, the dependent variable equals one if at least onesocial conflict occurred in district i in season s in year t, and zerootherwise. In columns 3 and 4, the dependent variable equals oneif at least one subsistence conflict occurred in district i in season s inyear t, and zero otherwise. The independent variable Temperature isthe seasonal temperature deviation from the long-term seasonal mean(1500–1600) in district i, divided by its standard deviation. District FE isa full set of 690 district fixed effects. Province x Year FE is the interactionof province dummies with the full set of year fixed effects.
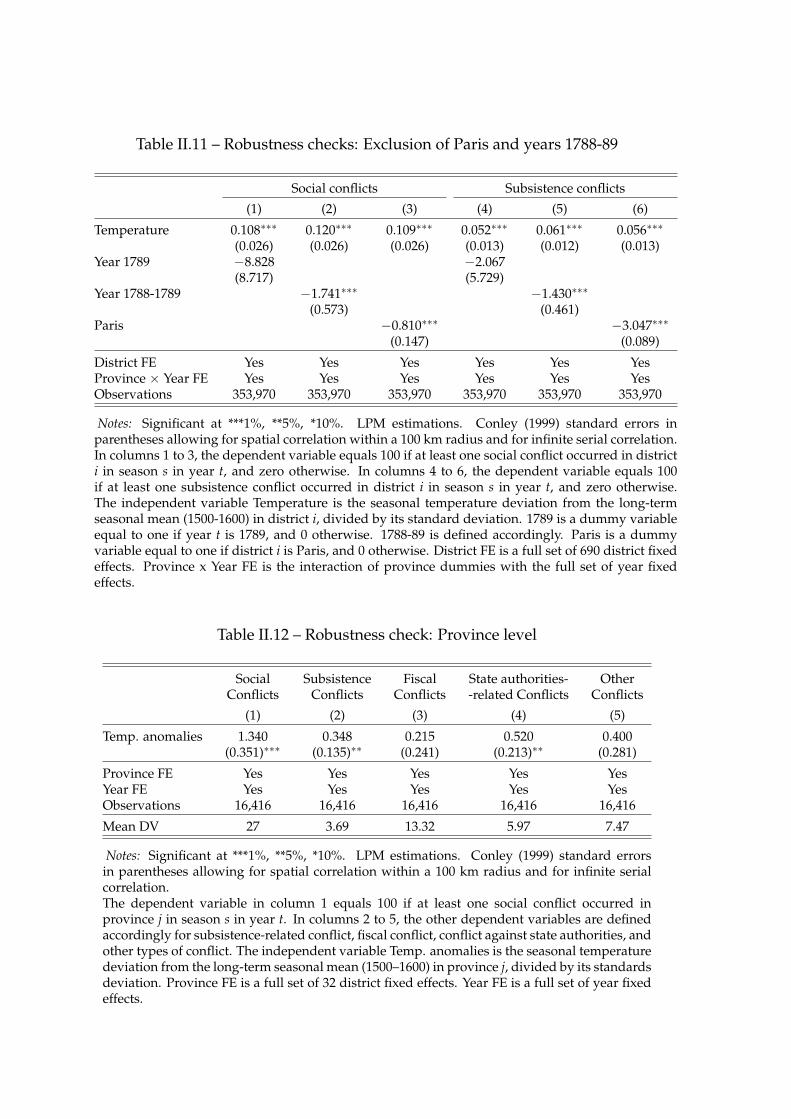
Table II.11 – Robustness checks: Exclusion of Paris and years 1788-89
Social conflicts Subsistence conflicts
(1) (2) (3) (4) (5) (6)
Temperature 0.108∗∗∗ 0.120∗∗∗ 0.109∗∗∗ 0.052∗∗∗ 0.061∗∗∗ 0.056∗∗∗
(0.026) (0.026) (0.026) (0.013) (0.012) (0.013)Year 1789 −8.828 −2.067
(8.717) (5.729)Year 1788-1789 −1.741∗∗∗ −1.430∗∗∗
(0.573) (0.461)Paris −0.810∗∗∗ −3.047∗∗∗
(0.147) (0.089)
District FE Yes Yes Yes Yes Yes YesProvince × Year FE Yes Yes Yes Yes Yes YesObservations 353,970 353,970 353,970 353,970 353,970 353,970
Notes: Significant at ***1%, **5%, *10%. LPM estimations. Conley (1999) standard errors inparentheses allowing for spatial correlation within a 100 km radius and for infinite serial correlation.In columns 1 to 3, the dependent variable equals 100 if at least one social conflict occurred in districti in season s in year t, and zero otherwise. In columns 4 to 6, the dependent variable equals 100if at least one subsistence conflict occurred in district i in season s in year t, and zero otherwise.The independent variable Temperature is the seasonal temperature deviation from the long-termseasonal mean (1500-1600) in district i, divided by its standard deviation. 1789 is a dummy variableequal to one if year t is 1789, and 0 otherwise. 1788-89 is defined accordingly. Paris is a dummyvariable equal to one if district i is Paris, and 0 otherwise. District FE is a full set of 690 district fixedeffects. Province x Year FE is the interaction of province dummies with the full set of year fixedeffects.
Table II.12 – Robustness check: Province level
Social Subsistence Fiscal State authorities- OtherConflicts Conflicts Conflicts -related Conflicts Conflicts
(1) (2) (3) (4) (5)
Temp. anomalies 1.340 0.348 0.215 0.520 0.400(0.351)∗∗∗ (0.135)∗∗ (0.241) (0.213)∗∗ (0.281)
Province FE Yes Yes Yes Yes YesYear FE Yes Yes Yes Yes YesObservations 16,416 16,416 16,416 16,416 16,416
Mean DV 27 3.69 13.32 5.97 7.47
Notes: Significant at ***1%, **5%, *10%. LPM estimations. Conley (1999) standard errorsin parentheses allowing for spatial correlation within a 100 km radius and for infinite serialcorrelation.The dependent variable in column 1 equals 100 if at least one social conflict occurred inprovince j in season s in year t. In columns 2 to 5, the other dependent variables are definedaccordingly for subsistence-related conflict, fiscal conflict, conflict against state authorities, andother types of conflict. The independent variable Temp. anomalies is the seasonal temperaturedeviation from the long-term seasonal mean (1500–1600) in province j, divided by its standardsdeviation. Province FE is a full set of 32 district fixed effects. Year FE is a full set of year fixedeffects.
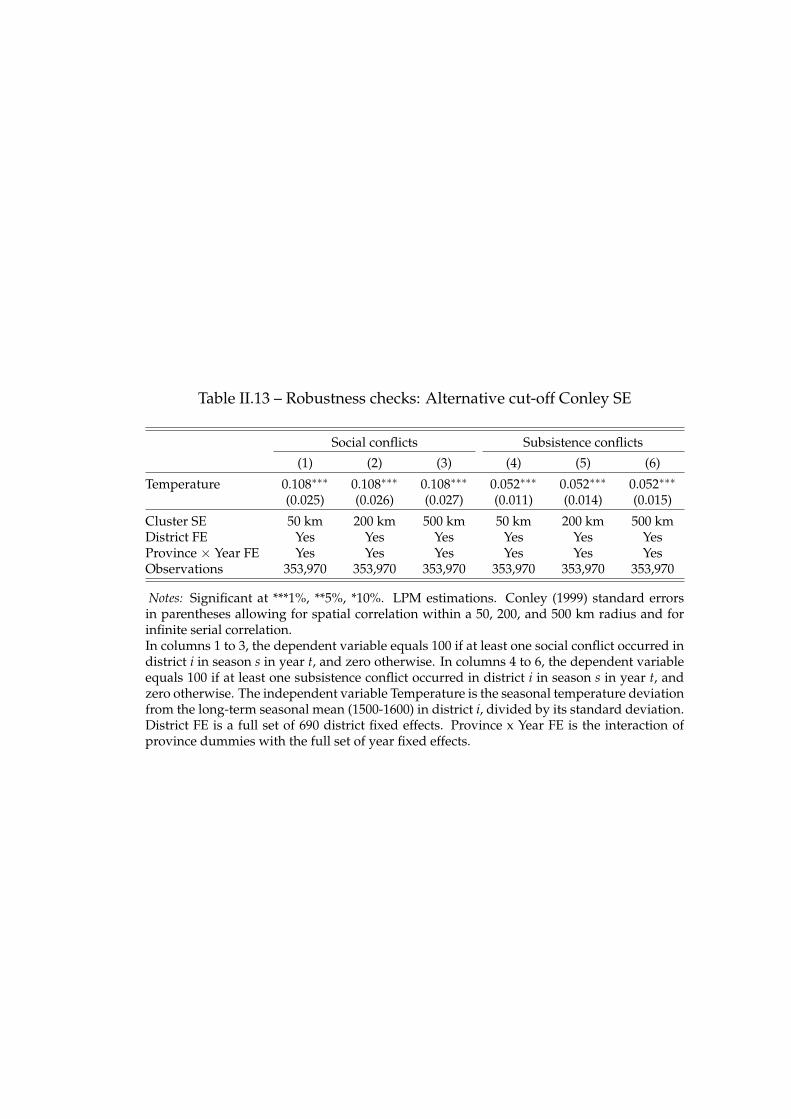
Table II.13 – Robustness checks: Alternative cut-off Conley SE
Social conflicts Subsistence conflicts
(1) (2) (3) (4) (5) (6)
Temperature 0.108∗∗∗ 0.108∗∗∗ 0.108∗∗∗ 0.052∗∗∗ 0.052∗∗∗ 0.052∗∗∗
(0.025) (0.026) (0.027) (0.011) (0.014) (0.015)
Cluster SE 50 km 200 km 500 km 50 km 200 km 500 kmDistrict FE Yes Yes Yes Yes Yes YesProvince × Year FE Yes Yes Yes Yes Yes YesObservations 353,970 353,970 353,970 353,970 353,970 353,970
Notes: Significant at ***1%, **5%, *10%. LPM estimations. Conley (1999) standard errorsin parentheses allowing for spatial correlation within a 50, 200, and 500 km radius and forinfinite serial correlation.In columns 1 to 3, the dependent variable equals 100 if at least one social conflict occurred indistrict i in season s in year t, and zero otherwise. In columns 4 to 6, the dependent variableequals 100 if at least one subsistence conflict occurred in district i in season s in year t, andzero otherwise. The independent variable Temperature is the seasonal temperature deviationfrom the long-term seasonal mean (1500-1600) in district i, divided by its standard deviation.District FE is a full set of 690 district fixed effects. Province x Year FE is the interaction ofprovince dummies with the full set of year fixed effects.
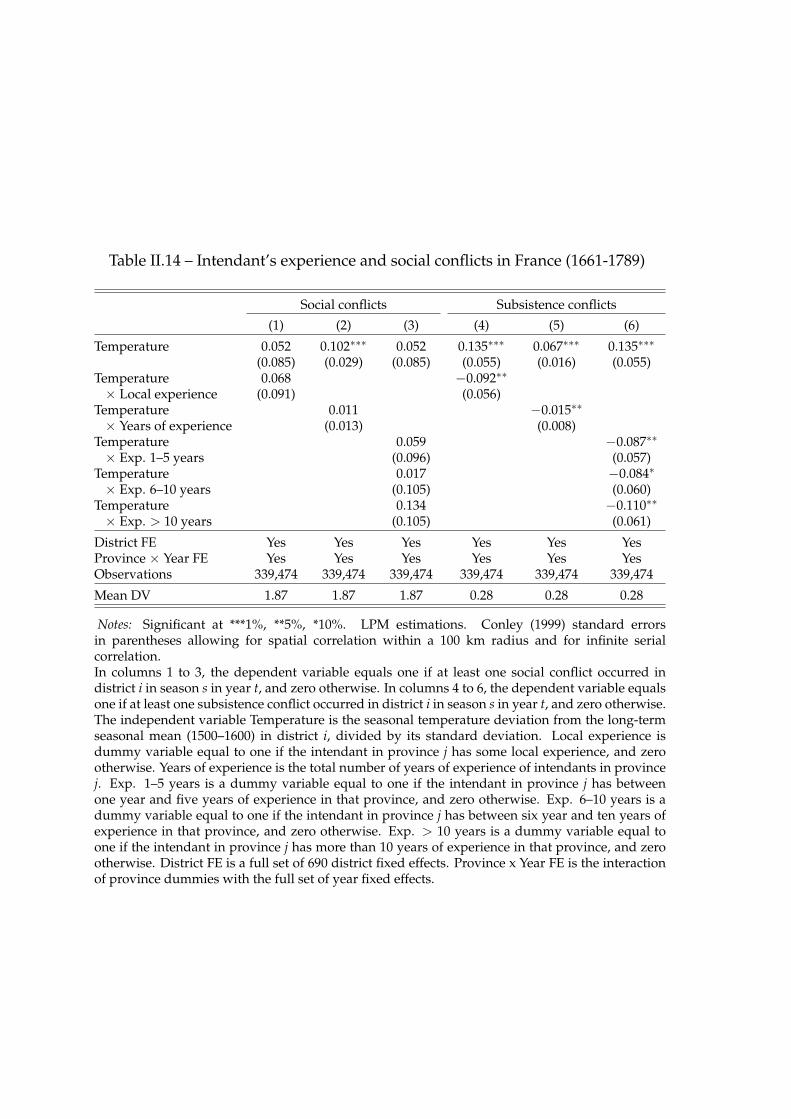
Table II.14 – Intendant’s experience and social conflicts in France (1661-1789)
Social conflicts Subsistence conflicts
(1) (2) (3) (4) (5) (6)
Temperature 0.052 0.102∗∗∗ 0.052 0.135∗∗∗ 0.067∗∗∗ 0.135∗∗∗
(0.085) (0.029) (0.085) (0.055) (0.016) (0.055)Temperature 0.068 −0.092∗∗
× Local experience (0.091) (0.056)Temperature 0.011 −0.015∗∗
× Years of experience (0.013) (0.008)Temperature 0.059 −0.087∗∗
× Exp. 1–5 years (0.096) (0.057)Temperature 0.017 −0.084∗
× Exp. 6–10 years (0.105) (0.060)Temperature 0.134 −0.110∗∗
× Exp. > 10 years (0.105) (0.061)
District FE Yes Yes Yes Yes Yes YesProvince × Year FE Yes Yes Yes Yes Yes YesObservations 339,474 339,474 339,474 339,474 339,474 339,474
Mean DV 1.87 1.87 1.87 0.28 0.28 0.28
Notes: Significant at ***1%, **5%, *10%. LPM estimations. Conley (1999) standard errorsin parentheses allowing for spatial correlation within a 100 km radius and for infinite serialcorrelation.In columns 1 to 3, the dependent variable equals one if at least one social conflict occurred indistrict i in season s in year t, and zero otherwise. In columns 4 to 6, the dependent variable equalsone if at least one subsistence conflict occurred in district i in season s in year t, and zero otherwise.The independent variable Temperature is the seasonal temperature deviation from the long-termseasonal mean (1500–1600) in district i, divided by its standard deviation. Local experience isdummy variable equal to one if the intendant in province j has some local experience, and zerootherwise. Years of experience is the total number of years of experience of intendants in provincej. Exp. 1–5 years is a dummy variable equal to one if the intendant in province j has betweenone year and five years of experience in that province, and zero otherwise. Exp. 6–10 years is adummy variable equal to one if the intendant in province j has between six year and ten years ofexperience in that province, and zero otherwise. Exp. > 10 years is a dummy variable equal toone if the intendant in province j has more than 10 years of experience in that province, and zerootherwise. District FE is a full set of 690 district fixed effects. Province x Year FE is the interactionof province dummies with the full set of year fixed effects.

Table II.15 – Intendant’s experience and social conflicts in France (1703–13)
Social conflicts Subsistence conflicts
(1) (2) (3) (4) (5) (6)
Temperature 0.075 0.200 0.075 1.116∗∗∗ 0.495∗∗∗ 1.116∗∗∗
(0.456) (0.168) (0.456) (0.332) (0.108) (0.332)Temperature 0.164 −0.816∗∗
× Local experience (0.483) (0.347)Temperature 0.024 −0.123∗∗
× Years of experience (0.074) (0.053)Temperature 0.228 −0.783∗∗
× Exp. 1–5 years (0.493) (0.353)Temperature −0.557 −1.001∗∗
× Exp. 6–10 years (0.659) (0.451)Temperature 0.422 −0.795∗∗
× Exp. > 10 years (0.562) (0.392)
District FE Yes Yes Yes Yes Yes YesProvince × Year FE Yes Yes Yes Yes Yes YesObservations 29,128 29,128 29,128 29,128 29,128 29,128
Mean DV 2.71 2.71 2.71 0.63 0.63 0.63
Notes: Significant at ***1%, **5%, *10%. LPM estimations. Conley (1999) standard errorsin parentheses allowing for spatial correlation within a 100 km radius and for infinite serialcorrelation.In columns 1 to 3, the dependent variable equals one if at least one social conflict occurred indistrict i in season s in year t, and zero otherwise. In columns 4 to 6, the dependent variableequals one if at least one subsistence conflict occurred in district i in season s in year t, andzero otherwise. The independent variable Temperature is the seasonal temperature deviationfrom the long-term seasonal mean (1500–1600) in district i, divided by its standard deviation.Local experience is dummy variable equal to one if the intendant in province j has some localexperience, and zero otherwise. Years of experience is the total number of years of experience ofintendants in province j. Exp. 1–5 years is a dummy variable equal to one if the intendantin province j has between one year and five years of experience in that province, and zerootherwise. Exp. 6–10 years is a dummy variable equal to one if the intendant in province jhas between six year and ten years of experience in that province, and zero otherwise. Exp. >10 years is a dummy variable equal to one if the intendant in province j has more than 10 yearsof experience in that province, and zero otherwise. District FE is a full set of 690 district fixedeffects. Province x Year FE is the interaction of province dummies with the full set of year fixedeffects.

Table II.16 – Intendant’s prior experience and social conflicts in France (1661-1789)
Social conflicts Subsistence conflicts
(1) (2) (3) (4) (5) (6)
Temperature 0.059 0.133∗∗∗ 0.059 0.034∗ 0.065∗∗∗ 0.034∗
(0.038) (0.030) (0.038) (0.018) (0.014) (0.018)Temperature 0.104∗ 0.043× Prior experience (0.053) (0.026)
Temperature × Years of 0.015∗ 0.007∗
prior experience (0.008) (0.004)Temperature × Prior 0.127∗∗ 0.041
exp. 1–5 years (0.063) (0.032)Temperature × Prior 0.132∗ 0.043
exp. 6–10 years (0.080) (0.036)Temperature × Prior 0.014 0.044
exp. > 10 years (0.093) (0.049)
District FE Yes Yes Yes Yes Yes YesProvince × Year FE Yes Yes Yes Yes Yes YesObservations 339,474 339,474 339,474 339,474 339,474 339,474
Mean DV 1.87 1.87 1.87 0.28 0.28 0.28
Notes: Significant at ***1%, **5%, *10%. LPM estimations. Conley (1999) standard errorsin parentheses allowing for spatial correlation within a 100 km radius and for infinite serialcorrelation.In columns 1 to 3, the dependent variable equals one if at least one social conflict occurred indistrict i in season s in year t, and zero otherwise. In columns 4 to 6, the dependent variableequals one if at least one subsistence conflict occurred in district i in season s in year t, andzero otherwise. The independent variable Temperature is the seasonal temperature deviationfrom the long-term seasonal mean (1500–1600) in district i, divided by its standard deviation.Prior experience is dummy variable equal to one if the intendant in province j has some priorexperience as intendant in another province, and zero otherwise. Years of prior experience isthe log of the total number of years of experience of intendants in the position before beingappointed in province j. Prior exp. 1–5 years is a dummy variable equal to one if the intendantin province j has between one year and five years of experience in another province prior tohis appointement in province j, and zero otherwise. Exp. 6–10 years is a dummy variableequal to one if the intendant in province j has between six years and ten years of experiencein another province prior to his appointement in province j, and zero otherwise. Exp. > 10years is a dummy variable equal to one if the intendant in province j has more than 10 yearsof experience in another province prior to his appointement in province j, and zero otherwise.District FE is a full set of 690 district fixed effects. Province x Year FE is the interaction ofprovinces dummies with the full set of year fixed effects.

Table II.17 – Intendant’s prior experience and social conflicts in France (1703–13)
Social conflicts Subsistence conflicts
(1) (2) (3) (4) (5) (6)
Temperature 0.221 0.209 0.221 0.466∗∗∗ 0.458∗∗∗ 0.466∗∗∗
(0.252) (0.168) (0.252) (0.164) (0.107) (0.164)No local exp. −0.024 −0.013
(0.329) (0.210)Years of local exp. 0.001 0.00005
(0.052) (0.034)Temperature × Prior −0.120 0.007
exp. 1–5 years (0.400) (0.247)Temperature × Prior −0.098 −0.120
exp. 6–10 years (0.360) (0.262)Temperature × Prior 0.755 0.270
exp. > 10 years (0.949) (0.500)
District FE Yes Yes Yes Yes Yes YesProvince × Year FE Yes Yes Yes Yes Yes YesObservations 29,128 29,128 29,128 29,128 29,128 29,128
Mean DV 2.71 2.71 2.71 0.63 0.63 0.63
Notes: Significant at ***1%, **5%, *10%. LPM estimations. Conley (1999) standard errors inparentheses allowing for spatial correlation within a 100 km radius and for infinite serialcorrelation.In columns 1 to 3, the dependent variable equals one if at least one social conflict occurredin district i in season s in year t, and zero otherwise. In columns 4 to 6, the dependentvariable equals one if at least one subsistence conflict occurred in district i in season sin year t, and zero otherwise. The independent variable Temperature is the seasonaltemperature deviation from the long-term seasonal mean (1500–1600) in district i, dividedby its standard deviation. Prior experience is dummy variable equal to one if the intendantin province j has some prior experience as intendant in another province, and zerootherwise. Years of prior experience is the log of the total number of years of experienceof intendants in the position before being appointed in province j. Prior exp. 1–5 years isa dummy variable equal to one if the intendant in province j has between one year andfive years of experience in another province prior to his appointement in province j, andzero otherwise. Exp. 6–10 years is a dummy variable equal to one if the intendant inprovince j has between six years and ten years of experience in another province prior tohis appointement in province j, and zero otherwise. Exp. > 10 years is a dummy variableequal to one if the intendant in province j has more than 10 years of experience in anotherprovince prior to his appointement in province j, and zero otherwise. District FE is a fullset of 690 district fixed effects. Province x Year FE is the interaction of provinces dummieswith the full set of year fixed effects.
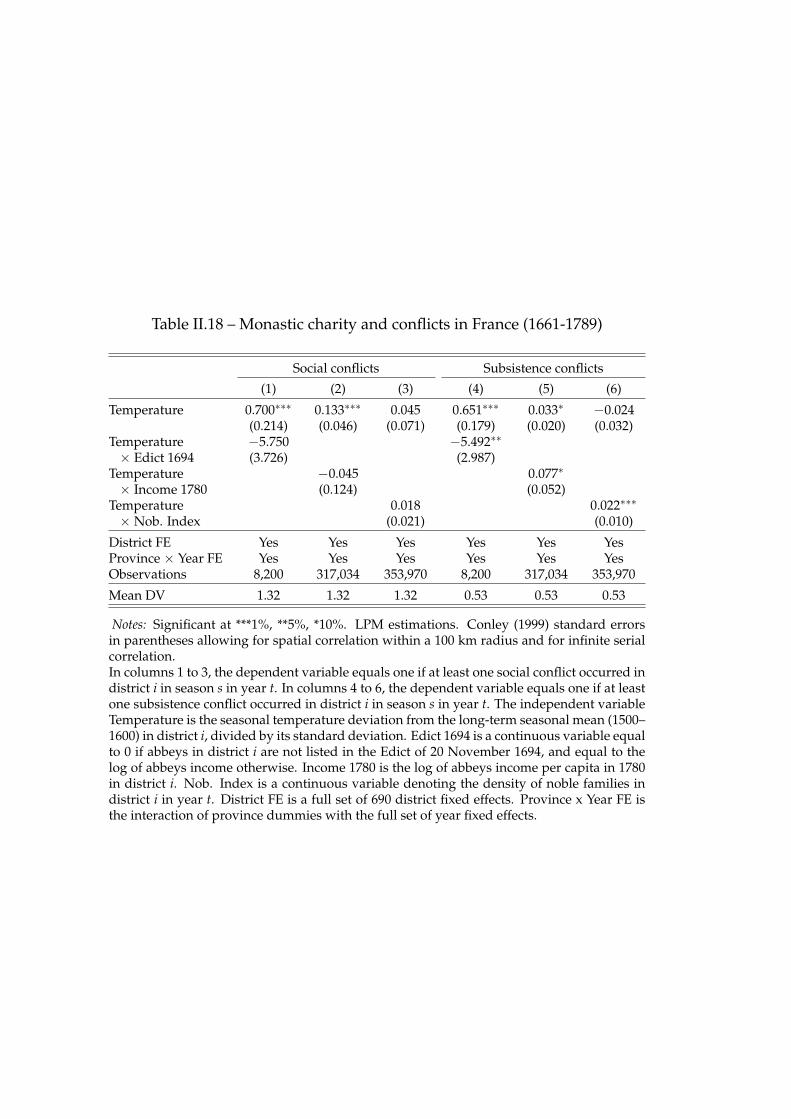
Table II.18 – Monastic charity and conflicts in France (1661-1789)
Social conflicts Subsistence conflicts
(1) (2) (3) (4) (5) (6)
Temperature 0.700∗∗∗ 0.133∗∗∗ 0.045 0.651∗∗∗ 0.033∗ −0.024(0.214) (0.046) (0.071) (0.179) (0.020) (0.032)
Temperature −5.750 −5.492∗∗
× Edict 1694 (3.726) (2.987)Temperature −0.045 0.077∗
× Income 1780 (0.124) (0.052)Temperature 0.018 0.022∗∗∗
× Nob. Index (0.021) (0.010)
District FE Yes Yes Yes Yes Yes YesProvince × Year FE Yes Yes Yes Yes Yes YesObservations 8,200 317,034 353,970 8,200 317,034 353,970
Mean DV 1.32 1.32 1.32 0.53 0.53 0.53
Notes: Significant at ***1%, **5%, *10%. LPM estimations. Conley (1999) standard errorsin parentheses allowing for spatial correlation within a 100 km radius and for infinite serialcorrelation.In columns 1 to 3, the dependent variable equals one if at least one social conflict occurred indistrict i in season s in year t. In columns 4 to 6, the dependent variable equals one if at leastone subsistence conflict occurred in district i in season s in year t. The independent variableTemperature is the seasonal temperature deviation from the long-term seasonal mean (1500–1600) in district i, divided by its standard deviation. Edict 1694 is a continuous variable equalto 0 if abbeys in district i are not listed in the Edict of 20 November 1694, and equal to thelog of abbeys income otherwise. Income 1780 is the log of abbeys income per capita in 1780in district i. Nob. Index is a continuous variable denoting the density of noble families indistrict i in year t. District FE is a full set of 690 district fixed effects. Province x Year FE isthe interaction of province dummies with the full set of year fixed effects.

Appendix
II.A The theoretical determinants of conflicts
This appendix complements the introduction of Chapter II by providing further
materials on the literature on the weather-conflict nexus. Section II.A.1 provides a
short overview of the main data sets used in the literature and discuss briefly the
various definitions used to build these data sets. Section II.A.2 describes different
theoretical models that can help to understand the underlying mechanisms
driving the relationship between weather shocks and the onset of conflicts.
II.A.1 Conflict: Plus quam civilia bella?
My research is part of a larger trend in the literature focusing on intrastate
conflict. This category of conflict excludes wars between two or more nations,
but includes events such as civil wars, communal violence, rebellions, violent
conflicts, and riots. However, determining the difference between civil wars and
other forms of civil conflict is also challenging. The lines between these events are
sometimes ambiguous, and the threshold of violence used to qualify an event as a
civil war is easily questionable (Andersen, Barten and Jensen, 2009; Blattman and
Miguel, 2010; Sambanis, 2004). Much of the quantitative researches on conflict is,
nonetheless, based on two data sets relying on clear but narrow definitions.111
Conflict resulting in more than 1000 fatalities is usually defined as war, while
armed conflict commonly refers to episodes involving more than 25 battle-related
deaths in a year. This distinction comes from the differences in approach of
111 Sambanis (2004) highlights the dilemma in the establishment of accurate definition and measureof civil war. For instance, distinguishing intrastate from extrastate war is not always obvious,and the threshold of violence used to differentiate civil war from other forms of conflict is easilyquestionable. Blattman and Miguel (2010, p. 31) also point out that “the lines between wars,conflicts, coups and communal violence are sometimes ambiguous, potentially leading to errorsof measurement”.
167

168
the Correlates of War (COW) project112 and the Uppsala Conflict Data Program
(UCDP/PRIO).113 These two definitions thus overlook conflicts of smaller inten-
sity, or in which no organised rebellion structure is identified, which represent
more than half of all political violence in Africa (Raleigh et al., 2010).
New databases including the Social Conflict Analysis Database (SCAD) and
the Armed Conflict Location and Event Dataset (ACLED) overcome these issues
by recording several types of events including communal violence, protests, riots,
state repression, strikes, and the like (Raleigh et al., 2010; Salehyan et al., 2012).
More importantly, these data sets allow for estimating the impact of weather
shocks at the subnational level. The systematic investigation of the climate-
conflict nexus in more consistent geographical and institutional environments is
the most promising avenue to better identify causal pathways between climate
and conflict (Blattman and Miguel, 2010; Buhaug, 2010; Dell, Jones and Olken,
2014). Subnational studies allow for ruling out some of the potential issues linked
to cross-country differences, and make easier the inclusion of several exogenous
variables.114
These four data sets share nevertheless two important features limiting the
scope of research. First, only intergroup conflicts are listed. Buhaug and Urdal
(2013, p. 9) underline that expanding the scope of research beyond the current
definition of social disorder, and focusing on others types of social insecurity such
as homicide rates, and organised crime would be pertinent for new empirical
research. The geographical and time scopes of these datasets, focusing on either
Latin America, Africa, or Southeast Asia, and the second-half of the twentieth
century, represent their second drawback. My dissertation attempts to overcome
this issue by expanding the scope of research to the 17th- and 18th-centuries
Europe. In addition, I investigate the relationship between weather and both
intergroup and interpersonal conflicts.
112 More precisely Sarkees and Wayman (2010, p. 43) define civil war as “any armed conflict thatinvolved (1) military action internal to the metropole of the state system member; (2) the activeparticipation of the national government; (3) effective resistance by both sides; and (4) a total ofat least 1,000 battle-deaths during each year of the war”.
113 Gleditsch et al. (2002, p. 619) define an armed conflict as a “contested incompatibility thatconcerns government or territory or both where the use of armed force between two partiesresults in at least 25 battle-related deaths. Of these two parties, at least one is the governmentof a state”.
114 See for example Iyer and Topalova (2014).
169
Several studies address the first issue by estimating the effect of weather
extremes on the risk of interpersonal conflict (e.g. assault, murder, robbery). For
instance, Iyer and Topalova (2014) are interested in the effect of rainfall shocks,
an instrument for negative income shocks, on violent crimes and property crimes
in India between 1971 and 2010. Ranson (2014) assesses the effect of weather
on monthly crime rate in the United States between 1980 and 2009, and uses his
results to predict the potential effect of climate change on criminal activity for the
next 90 years.
Recently a new strand of literature tackles the second issue by investigating
the relationship between climate shocks and conflict in a historical perspective.
Research focuses on both intergroup conflict (Chen, 2015; Christian and Fenske,
2015; Dell, 2012; Jia, 2014) and interpersonal conflict (Bignon, Caroli and Galbiati,
2017; Mehlum, Miguel and Torvik, 2006; Papaioannou, 2016), and demonstrates
the existence of a causal relationship between climate shocks and conflict.
However, drawing any comparisons between all these results is difficult because
these studies often rely on different definitions of conflict. For example, Mehlum,
Miguel and Torvik (2006) use the number of property crimes and violent crimes
per 100,000 inhabitants, while Papaioannou (2016) constructs an index of socio-
political conflict in colonial Nigeria based on the number of prisoners admitted
during the year, the number of court cases, and the number of homicides per
1,000 inhabitants. Oberschall (1978) defines social conflict as:
“(...) conflict in which the parties are an aggregate of individuals,
such as groups, organizations, communities, and crowds, rather than
single individuals, as in role conflicts. (...) social conflict refers in
common usage to interaction in which the means chosen by the parties
in the pursuit of their goals are likely to inflict damage, harm or injury,
but not necessarily in every case.”
In this chapter, I rely on data on popular disturbances in 17th- and 18th-
centuries France collected by Nicolas (2002). For his purposes, the minimum
criterion to qualify an event as a conflict is the participation of at least four
individuals, from at least two different families, deploying a verbal or physical
violence against property, persons or authorities (see Section 2.1 for more details).
170
Therefore, I follow Oberschall (1978) and use social conflict to qualify events
such as food riot, fiscal uprising, anti-nobiliary movement, and violence against
government authority.
II.A.2 Theoretical models
Researchers have proposed numerous mechanisms that explain the initiation
of conflict. Dixon (2009) lists a total of 203 variables used as explanatory
variables in 47 different studies. Because their characteristics are different, several
frameworks can be used to model the causes of large conflicts such as civil
wars, and smaller unorganised conflicts such as food riots or fiscal uprisings.
To take into account these differences, the following subsections outline four
simple theoretical models. The first model, proposed by Collier and Hoeffler
(1998), is important as it introduces three key concepts to understand the roots
of civil conflict.115 Besley and Persson (2010) build a model that helps to better
understand the interrelation between the state capacity and the onset of conflict
in a dynamic perspective. The third model, created by Kiser and Linton (2002), is
complementary to the previous one. Using game theory, the authors show how a
state can depart from a situation of weak state capacity to reach a stable high tax
equilibrium. The last model (Almer, Laurent-Lucchetti and Oechslin, 2011) fills a
gap left by the two aforementioned models by focusing on the level of individual
income. Neglecting the issue of state capacity, they underline the role of yearly
individual income in the level of maximum tolerated extraction (taxation), and
therefore of the onset of conflict.
Incentives, opportunity and grievance. In a pioneering work on the causes
of civil war,116 Collier and Hoeffler (1998) develop a theoretical framework
suggesting that a group will embark in rebellion if the benefits outweigh the costs.
The potential benefits depend on the probability of victory, which is inversely
proportional to the ability of the government to quell the rebellion. However,
if high tax rates mean better military capacity, it also increases the incentives
115 Incentive, opportunity, and grievance.116 For a complete review of the models on civil war causes, see Blattman and Miguel (2010, pp. 9–
22).
171
to rebel. On the other hand, costs are function of three factors. Costs are
increasing in the expected duration of the conflict, given that a longer rebellion
requires more resources. Costs are also positively linked to the average income
per capita. The richer the country, the more disruptive conflict will be for
economic activities and the larger the foregone income will be. Ethno-linguistic
fractionalization (EFL), a proxy for cultural differences and social cohesion, is the
third factor. Collier and Hoeffler hypothesise that higher level of EFL results in
higher cooperation costs among rebels.117 Overall, the assumption is that post-
conflict pay-off, i.e. incentive, is a key determinant in the onset of conflict.
In subsequent work, Collier and Hoeffler extend their model and focus
on grievance and opportunity, i.e. motive, as factors possibly inducing actors
to engage in civil war (Collier and Hoeffler, 2004). Inequality and relative
deprivation are typical examples of sources of discontent and grievance. Cheap
military material, weak government military capability, and social cohesion are
factors influencing the degree of opportunity and making easier the expression
of dissent. Their empirical evidence supports the fact that opportunity rather
grievance is a consistent explanation of conflict risk. This result is not incom-
patible with their previous findings underlying the role of greed as a motor of
conflict.118
State capacity and conflict. Analysing the persistence of weak state and its
impact on development, Besley and Persson (2010) show that violent conflict is
closely linked to the process of state building. Consistent with the opportunity
hypothesis developed by Collier and Hoeffler (2004), they demonstrate that
situations of weak state capacity reduce the cost of engaging in civil war. Indeed,
weak states often fail to protect property rights, to produce public goods or
117 Their empirical findings contradict this hypothesis. The effect of cultural difference is moreambiguous. Low and high levels of fractionalization reduce the risk of civil war, while specificintermediate level of fractionalization increases it. Janus and Riera-Crichton (2015) presentsimilar findings showing that in countries where ethnic dominance is large, but not sufficientlynot to be challenged, fractionalization encourages the onset of conflict. However, there ishardly a consensus in the literature on the effect of EFL: Dixon (2009, p. 710) references twostudies in which EFL helps to preempt conflict, thirteen studies in which EFL has no statisticallysignificant effect, and eleven studies in which EFL favours the onset of conflict.
118 By contrast, Murshed and Tadjoeddin (2009) suggest that both greed or grievance are insuf-ficient for the outbreak of violent conflict. Instead, they emphasise the failure of the socialcontract, a proxy for institutional breakdown, as a key element to explain the increase in therisk of conflict.
172
to set up effective redistributive policies, which all have a negative impact on
economic growth and income, thereby lowering the opportunity cost of engaging
in rebellious activities. In line with Tilly (1990, p. 75), who asserts that rulers
set the necessary infrastructure for taxation and administration as “a by-product
of preparations for war”, they establish that investments in fiscal capacity,
i.e. the ability to raise taxes, and in legal capacity, i.e. the ability to enforce
property-rights, are increasing with the risk of external conflict (proposition
2). Therefore, threats to states are a key variable to explain the development
of strong state capacity. However, situation of high fiscal pressure (e.g. high
fiscal capacity), or high natural resource rents, increase the likelihood of internal
conflict because consistently with the incentive hypothesis, the expected benefits
are larger (proposition 4). For economic development to be achieved, it is
essential that high legal capacity, which helps to increase the cost of conflict,
goes hand-in-hand with high fiscal capacity in order to reduce the frequency of
conflict.
Tax equilibrium and conflict. In a different perspective, Kiser and Linton
(2002) develop a dynamic model to map the interrelations between the state-
making process and conflict. They use a game decision tree to highlight various
aspects of state-building and rebellion, including the effectiveness of the central
administration and its ability to put an end to revolt. While state wants to
maximise its tax revenue, individuals want to minimise their tax burden and can
choose to pay taxes, to evade taxes, or to revolt.119 Similar to Besley and Persson
(2010), Kiser and Linton hypothesise that higher fiscal capacity leads to a greater
frequency of conflict. However after few sequences, if the state successfully
shows its strength by quelling previous revolts (i.e. displays high level of state
capacity), then agents will be better informed about the real costs of rebellion. The
frequency of fiscal conflicts should be much lower than before, while the high tax
equilibrium remains.120 Kiser and Linton (2002) argue that France in the years
following the Fronde (1648) is a historical example of this equilibrium.
119 A weakness of this model is that is does not take into account the current income of agents.Individuals may not react to a tax increase in the same way when the economy is blooming.
120 Christian and Fenske (2015) develop a fairly similar model to study what caused unrest incolonial French West Africa.

173
Maximum threshold of extraction. Low level of organisation, spontaneity, and
short duration are features often associated with riots. To uncover the mech-
anisms at stake in these events, Almer, Laurent-Lucchetti and Oechslin (2011)
build a model with an infinite-horizon economy in which the state controlled by
an elite is able to extract resources from the rest of the agents. When setting the
level of resource extraction, the elites do not know the level of output in the next
period. As in Kiser and Linton (2002), the citizens can choose to accept this level
of extraction (to pay taxes) or resort to unrest at an unknown cost. The maximum
level of resource extraction individuals accept is relative to the current observed
level of output. In case of negative economic shock, the cost of revolting is lower
because the foregone income will be lower (as in Collier and Hoeffler (1998)).
Within this framework, unrest is an option regardless of the level of the state
capacity if and only if the elites mis-anticipate the current level of output and
implement a level of extraction which is too high.121
The potential role of weather. In the previous four subsections, I outline
different models emphasising one or more aspects put forward by Collier and
Hoeffler (1998) to explain the outbreak of civil wars and conflicts. In this chapter,
I focus on the role of weather shocks on the onset of social conflicts in early
modern France. Within these frameworks, there are several channels through
which weather could indirectly influence the frequency of conflict. In a rain-
fed agrarian economy, a local rainfall shock might lead to a harvest failure,
thereby tightening food supplies and lowering real incomes of urban and rural
dwellers, reducing the opportunity cost of engaging in conflict (Homer-Dixon,
2010). A negative economic shock also reduces the level of tolerance of extraction
increasing the likelihood of unrest if the state fails to react promptly. Similarly,
a weather shock in a major crop-growing country could create tensions on the
international market of the given crop resulting in skyrocketing prices (e.g.
Russia in 2010). That would have an effect on the opportunity cost of engaging in
conflict by reducing real income, but also on the potential benefits by increasing
the natural resource rents in some countries. Christian and Fenske (2015) and
121 Chassang and Padró-i Miquel (2009, p. 225) reach the same conclusion after using a bargainingmodel enrich with income variation. They state that the opportunity cost can explain by itselfthe fact that civil wars occur in the aftermath of negative economic shocks.
174
Iyer and Topalova (2014) show how commodity price shocks could result in
higher level of conflicts.122 Another channel is the occurrence of major natural
disasters, including hydro-meteorological events (hurricanes, floods, droughts)
and geological events (earthquakes). These could have disruptive impacts on a
country’s economy by causing large loss of physical infrastructure, reducing state
capacity (Cavallo and Noy, 2009). Within the framework presented by Collier
and Hoeffler (2004), the failure of the state to cope with the crisis could reduce its
legitimacy and increase grievance if, for example, a portion of the population
is dissatisfied with the treatment it receives compared to another group. By
weakening the military capability of the state, the loss of infrastructure also has
an impact on the opportunity cost to engage in rebellion and promotes the onset
of conflict.123
122 For contradictory evidence, see Bazzi and Blattman (2014).123 For an attempt to link natural disaster and conflict, see Nel and Righarts (2008).
175
II.B Temperature shocks, grain prices and social con-
flicts
This section documents the transmission mechanism between weather shocks
and the onset of social conflicts. In line with previous studies, I show that
temperature shocks had a direct and significant impact on the level of wheat
prices (Galloway, 1986b, 1994). Since consumers have to spend more of their
income on bread, with stable or lower earnings, high grains prices translate
directly into a reduction of real wages. The level of social conflicts, and in
particular of subsistence-related conflicts, increases as a response to the transitory
negative income shocks (Nicolas, 2002, pp. 346–99; Molinier, 1985, 37–43).
Weather and crop prices. Weak market integration meant that wheat prices
were more likely to respond to local weather-induced variations in local agricul-
tural output. I first estimate the effect of temperature shocks on wheat prices
using panel regressions where I link the price of wheat in each province j to
summer temperature shocks in that province over the 1756–89 period. In doing
so, I follow Franck and Michalopoulos (2017) and estimate a model of the form:
Pricejt = α + β Temperaturejt + δj + δd + ǫjt (II.4)
where Pricejt is the log of the price of wheat in province j in year t, Temperaturejt
is the measure of temperature shock in the summer of year t in province j. The
fixed effects δj account for time-invariant province characteristics. δd are the
time (decade) fixed effects, and account for common time shocks that affect all
provinces.
I report the regression results in Table II.19. To account for the fact that the
relationship between summer temperature shocks and the price of wheat could
be non-linear, I include a quadratic term in all specifications. Columns 2 to 6
include summer precipitation shocks to reduce the risk of omitted variables bias.
Due to seeds scarcity, the effect of harvest shock might prevail from one year to
another, independently from the weather conditions. In columns 3 to 6, I add a
measure of previous harvest to take into account this possibility.
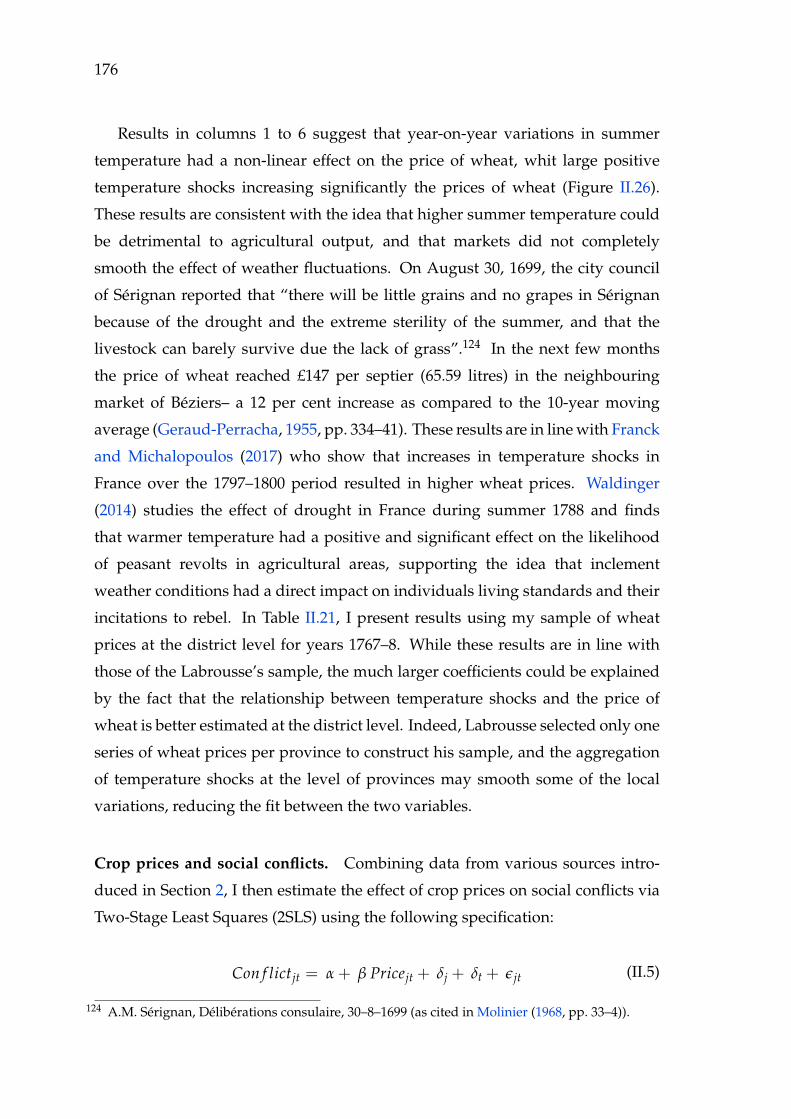
176
Results in columns 1 to 6 suggest that year-on-year variations in summer
temperature had a non-linear effect on the price of wheat, whit large positive
temperature shocks increasing significantly the prices of wheat (Figure II.26).
These results are consistent with the idea that higher summer temperature could
be detrimental to agricultural output, and that markets did not completely
smooth the effect of weather fluctuations. On August 30, 1699, the city council
of Sérignan reported that “there will be little grains and no grapes in Sérignan
because of the drought and the extreme sterility of the summer, and that the
livestock can barely survive due the lack of grass”.124 In the next few months
the price of wheat reached £147 per septier (65.59 litres) in the neighbouring
market of Béziers– a 12 per cent increase as compared to the 10-year moving
average (Geraud-Perracha, 1955, pp. 334–41). These results are in line with Franck
and Michalopoulos (2017) who show that increases in temperature shocks in
France over the 1797–1800 period resulted in higher wheat prices. Waldinger
(2014) studies the effect of drought in France during summer 1788 and finds
that warmer temperature had a positive and significant effect on the likelihood
of peasant revolts in agricultural areas, supporting the idea that inclement
weather conditions had a direct impact on individuals living standards and their
incitations to rebel. In Table II.21, I present results using my sample of wheat
prices at the district level for years 1767–8. While these results are in line with
those of the Labrousse’s sample, the much larger coefficients could be explained
by the fact that the relationship between temperature shocks and the price of
wheat is better estimated at the district level. Indeed, Labrousse selected only one
series of wheat prices per province to construct his sample, and the aggregation
of temperature shocks at the level of provinces may smooth some of the local
variations, reducing the fit between the two variables.
Crop prices and social conflicts. Combining data from various sources intro-
duced in Section 2, I then estimate the effect of crop prices on social conflicts via
Two-Stage Least Squares (2SLS) using the following specification:
Con f lictjt = α + β Pricejt + δj + δt + ǫjt (II.5)
124 A.M. Sérignan, Délibérations consulaire, 30–8–1699 (as cited in Molinier (1968, pp. 33–4)).

177
where Con f lictjt is a dummy variable equal to one if at least one social conflict
occurred in province j in year t, and Pricejt is the log of the price of wheat in
province j in year t. The fixed effects δj account for time-invariant province
characteristics. δd are the time (decade) fixed effects, and account for common
time shocks that affect all provinces. All estimations use robust standard errors
clustered at the province level.
In the first stage, Pricejt, the log of the price of wheat in province j in year t, is
instrumented by Temperaturejt– the measure of temperature shock in the summer
of year t in province j– and its quadratic value:125
Pricejt = α + γ1 Temperaturejt + γ2 (Temperaturejt)2 + δj + δt + ǫjt (II.6)
Table II.20 contains the results from estimating equations II.5 and II.6.126 In
columns 1 and 2, I report the estimated effect of wheat prices on the likelihood
of social conflicts broadly defined. I find no significant relationship between
the level of wheat prices and the onset of social conflict at the province level
between 1756 and 1789. As explained in Section 2.1, the variable Social conflict
encompasses many different types of conflict, many of which had plausibly
different drivers. In the parish register of Auxy in the south of Burgundy, the
125 Dieterle and Snell (2016) emphasise the importance of using a quadratic term in the instrumentin the first stage. Using only linear first stage may conceal information on the nature ofheterogeneous effects. For instance, the authors investigate the effect of including a quadraticterm in the first stage of Becker and Woessmann (2009)’s estimate. They show that effect ofthe instrument– the distance from Wittenberg– varies considerably in size and in sign acrossdifferent estimates once a quadratic term is included. Dieterle and Snell repeat the exercise for13 papers published between 2008 and 2013 in American Economic Association journals. Theyfind eight papers with significant non-linearities, including six that have a statistically differentsecond stage estimates.
126 The exclusion restriction requires that temperature shocks in the summer of year t in provincej have no effect on conflicts in year t in province j other than through its effects on economic(agricultural) output. There are two main concerns. First, temperature shocks could have aneffect on state capacity if it reduces the ability of the state to enforce the law or to move troopsaround the kingdom. While temperature shock could affected state finance through a dropin income tax revenue, the effect would materialise in year t+1 and is unlikely to affect theonset of social conflicts in year t. Similarly, there is no plausible reason for which summertemperature shock would reduce the mobility of the troops. Second, it is hypothesised thatextreme temperature (heat) can directly induce violent behaviour and conflict through its effecton the level serotonin. However, the empirical support for this channel is found at very shorttime scale, i.e. hours or day. It is therefore unlikely that seasonal temperature average couldaffect the onset of social conflicts through this channel (Carleton, Hsiang and Burke, 2016,p. 497).
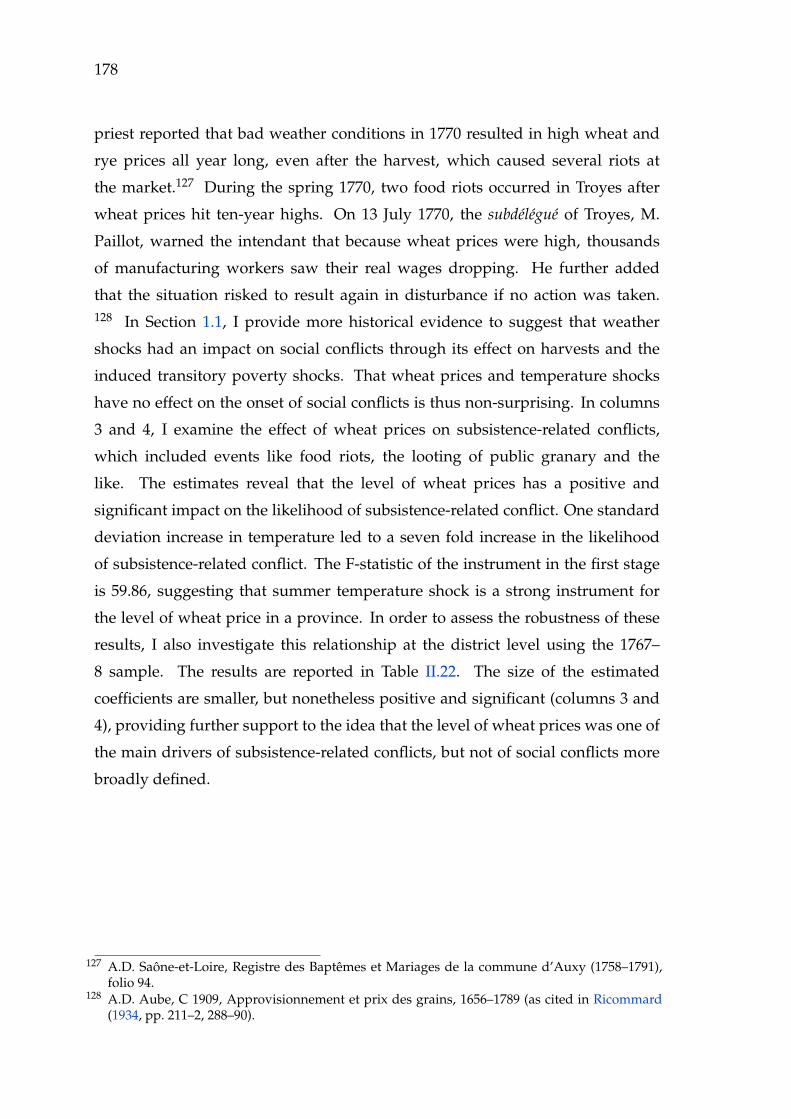
178
priest reported that bad weather conditions in 1770 resulted in high wheat and
rye prices all year long, even after the harvest, which caused several riots at
the market.127 During the spring 1770, two food riots occurred in Troyes after
wheat prices hit ten-year highs. On 13 July 1770, the subdélégué of Troyes, M.
Paillot, warned the intendant that because wheat prices were high, thousands
of manufacturing workers saw their real wages dropping. He further added
that the situation risked to result again in disturbance if no action was taken.128 In Section 1.1, I provide more historical evidence to suggest that weather
shocks had an impact on social conflicts through its effect on harvests and the
induced transitory poverty shocks. That wheat prices and temperature shocks
have no effect on the onset of social conflicts is thus non-surprising. In columns
3 and 4, I examine the effect of wheat prices on subsistence-related conflicts,
which included events like food riots, the looting of public granary and the
like. The estimates reveal that the level of wheat prices has a positive and
significant impact on the likelihood of subsistence-related conflict. One standard
deviation increase in temperature led to a seven fold increase in the likelihood
of subsistence-related conflict. The F-statistic of the instrument in the first stage
is 59.86, suggesting that summer temperature shock is a strong instrument for
the level of wheat price in a province. In order to assess the robustness of these
results, I also investigate this relationship at the district level using the 1767–
8 sample. The results are reported in Table II.22. The size of the estimated
coefficients are smaller, but nonetheless positive and significant (columns 3 and
4), providing further support to the idea that the level of wheat prices was one of
the main drivers of subsistence-related conflicts, but not of social conflicts more
broadly defined.
127 A.D. Saône-et-Loire, Registre des Baptêmes et Mariages de la commune d’Auxy (1758–1791),folio 94.
128 A.D. Aube, C 1909, Approvisionnement et prix des grains, 1656–1789 (as cited in Ricommard(1934, pp. 211–2, 288–90).
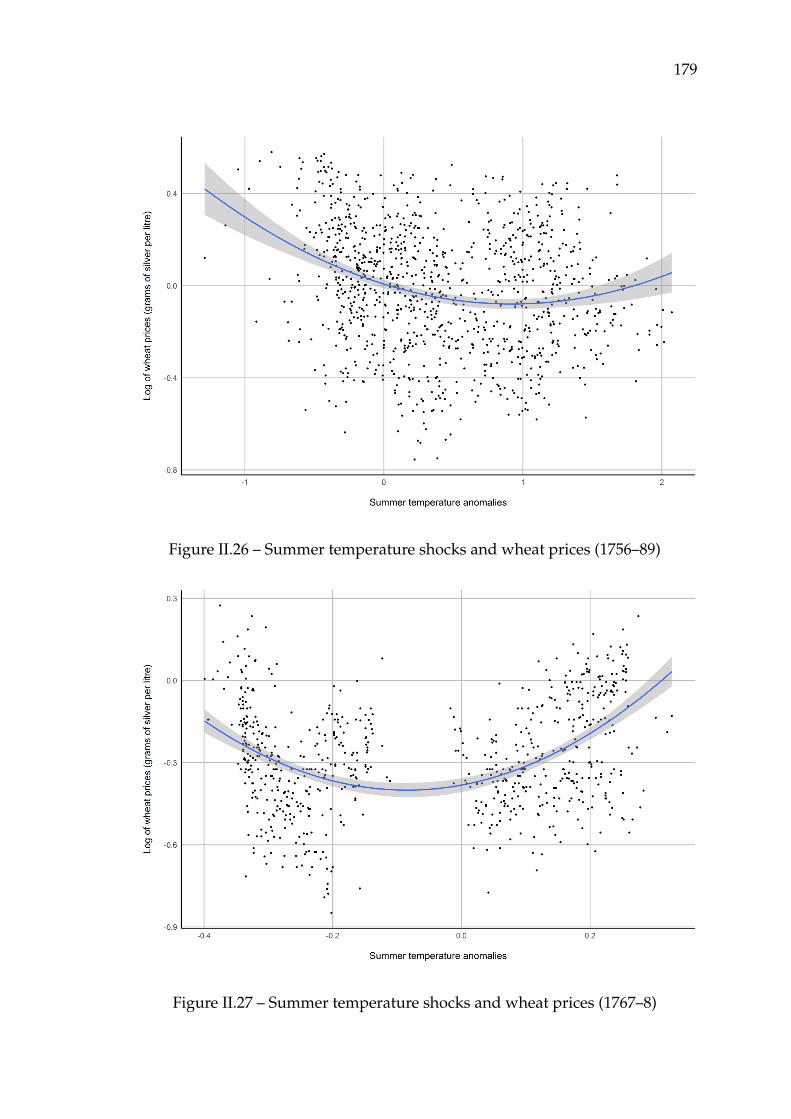
179
Figure II.26 – Summer temperature shocks and wheat prices (1756–89)
Figure II.27 – Summer temperature shocks and wheat prices (1767–8)

Table II.19 – Temperature shocks and wheat prices in France (1756–89)
Log of wheat prices (grams of silver per litre)
(1) (2) (3) (4) (5) (6)
Summer temperature −0.189∗∗∗ −0.206∗∗∗ −0.209∗∗∗ −0.162∗∗∗ −0.135∗∗∗ −0.103∗∗∗
(0.016) (0.016) (0.015) (0.019) (0.012) (0.011)Summer temperature2 0.103∗∗∗ 0.101∗∗∗ 0.115∗∗∗ 0.084∗∗∗ 0.061∗∗∗ 0.035∗∗∗
(0.014) (0.014) (0.015) (0.016) (0.010) (0.008)Log of wheat prices t-1 0.518∗∗∗
(0.024)
Province FE No No No Yes Yes YesProvince × Decade FE No No No No Yes YesObservations 1,054 1,054 1,054 1,054 1,054 1,023R2 0.067 0.074 0.091 0.291 0.601 0.659
Notes: Significant at ***1%, **5%, *10%. OLS estimations. Standard errors clustered at the provinces level inparentheses.The dependent variable is the log of the wheat price in grams of silver per litre in province j in year t.The independent variable summertemperature is the summer temperature deviation from the long-termseasonal mean (1500–1600) in province j, divided by its standard deviation. The other independant variablesare defined accordingly. Columns 2 to 6 include summerprecipiation in province j in year t. Columns 3 to6 include summertemperature in province j in year t-1. Column 6 includes the log of the wheat price ingrams of silver per litre in province j in year t-1. Province FE is a full set of province fixed effects. Provincex Decade FE is the interaction of provinces dummies with decade fixed effects.
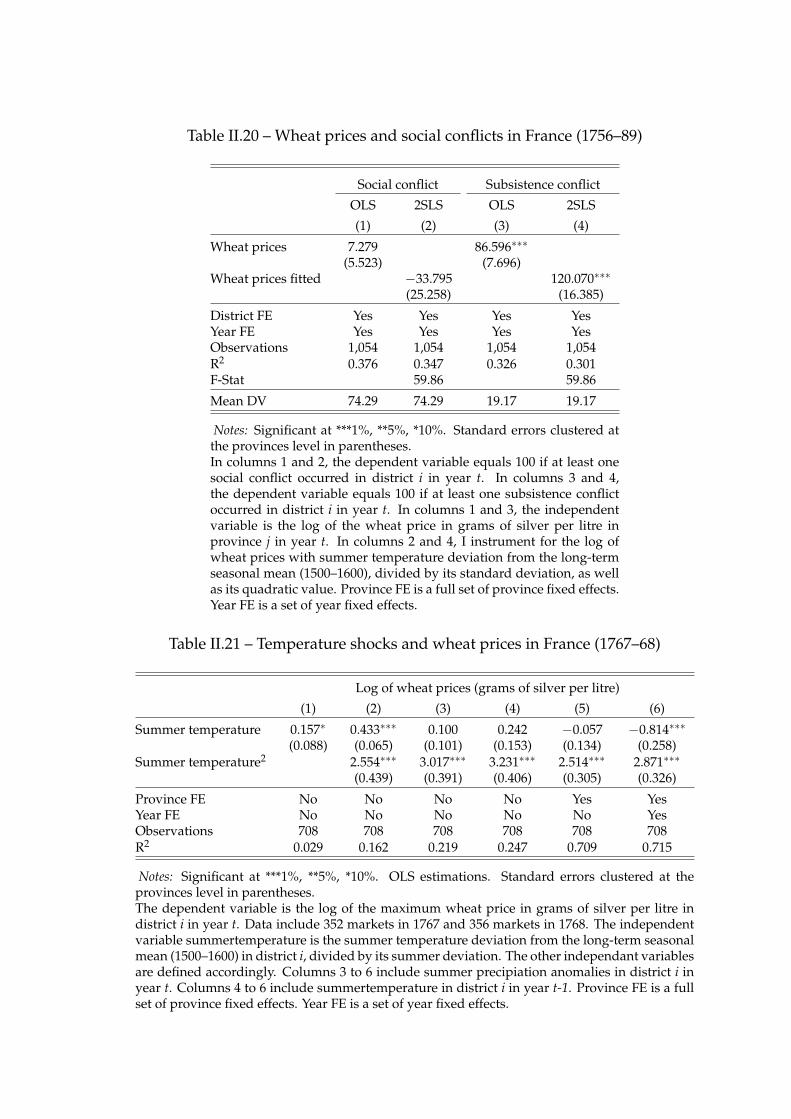
Table II.20 – Wheat prices and social conflicts in France (1756–89)
Social conflict Subsistence conflict
OLS 2SLS OLS 2SLS
(1) (2) (3) (4)
Wheat prices 7.279 86.596∗∗∗
(5.523) (7.696)Wheat prices fitted −33.795 120.070∗∗∗
(25.258) (16.385)
District FE Yes Yes Yes YesYear FE Yes Yes Yes YesObservations 1,054 1,054 1,054 1,054R2 0.376 0.347 0.326 0.301F-Stat 59.86 59.86
Mean DV 74.29 74.29 19.17 19.17
Notes: Significant at ***1%, **5%, *10%. Standard errors clustered atthe provinces level in parentheses.In columns 1 and 2, the dependent variable equals 100 if at least onesocial conflict occurred in district i in year t. In columns 3 and 4,the dependent variable equals 100 if at least one subsistence conflictoccurred in district i in year t. In columns 1 and 3, the independentvariable is the log of the wheat price in grams of silver per litre inprovince j in year t. In columns 2 and 4, I instrument for the log ofwheat prices with summer temperature deviation from the long-termseasonal mean (1500–1600), divided by its standard deviation, as wellas its quadratic value. Province FE is a full set of province fixed effects.Year FE is a set of year fixed effects.
Table II.21 – Temperature shocks and wheat prices in France (1767–68)
Log of wheat prices (grams of silver per litre)
(1) (2) (3) (4) (5) (6)
Summer temperature 0.157∗ 0.433∗∗∗ 0.100 0.242 −0.057 −0.814∗∗∗
(0.088) (0.065) (0.101) (0.153) (0.134) (0.258)Summer temperature2 2.554∗∗∗ 3.017∗∗∗ 3.231∗∗∗ 2.514∗∗∗ 2.871∗∗∗
(0.439) (0.391) (0.406) (0.305) (0.326)
Province FE No No No No Yes YesYear FE No No No No No YesObservations 708 708 708 708 708 708R2 0.029 0.162 0.219 0.247 0.709 0.715
Notes: Significant at ***1%, **5%, *10%. OLS estimations. Standard errors clustered at theprovinces level in parentheses.The dependent variable is the log of the maximum wheat price in grams of silver per litre indistrict i in year t. Data include 352 markets in 1767 and 356 markets in 1768. The independentvariable summertemperature is the summer temperature deviation from the long-term seasonalmean (1500–1600) in district i, divided by its summer deviation. The other independant variablesare defined accordingly. Columns 3 to 6 include summer precipiation anomalies in district i inyear t. Columns 4 to 6 include summertemperature in district i in year t-1. Province FE is a fullset of province fixed effects. Year FE is a set of year fixed effects.
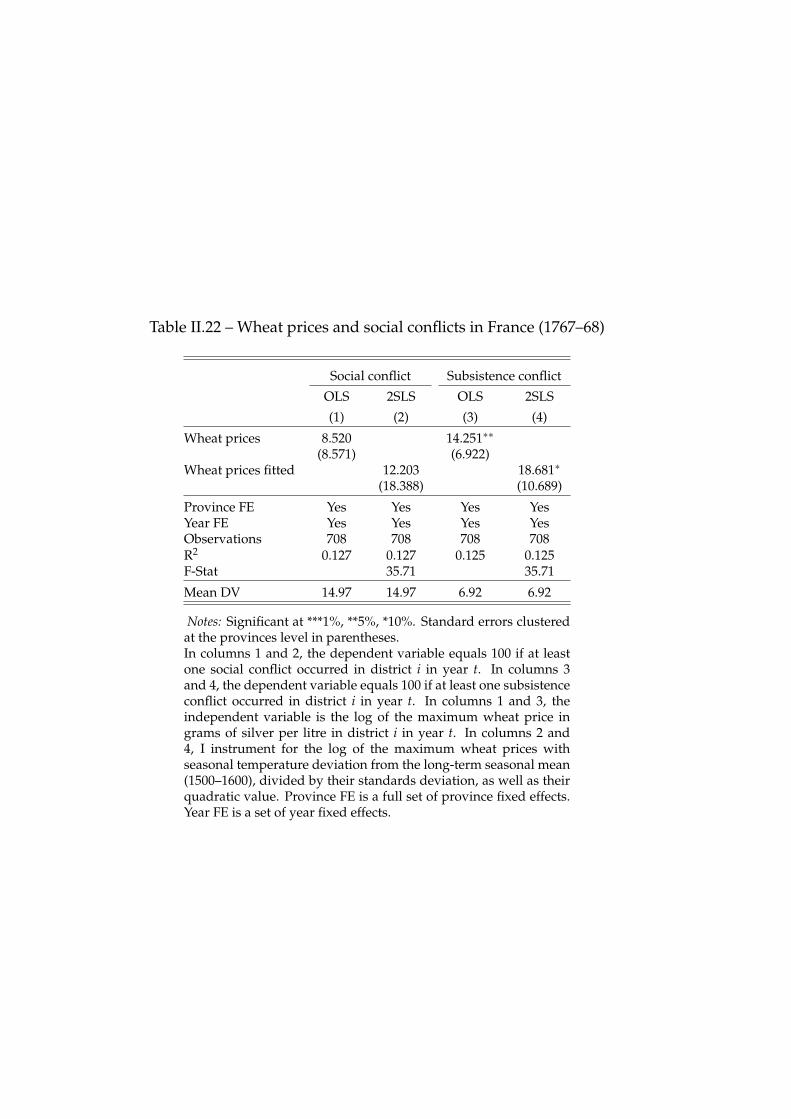
Table II.22 – Wheat prices and social conflicts in France (1767–68)
Social conflict Subsistence conflict
OLS 2SLS OLS 2SLS
(1) (2) (3) (4)
Wheat prices 8.520 14.251∗∗
(8.571) (6.922)Wheat prices fitted 12.203 18.681∗
(18.388) (10.689)
Province FE Yes Yes Yes YesYear FE Yes Yes Yes YesObservations 708 708 708 708R2 0.127 0.127 0.125 0.125F-Stat 35.71 35.71
Mean DV 14.97 14.97 6.92 6.92
Notes: Significant at ***1%, **5%, *10%. Standard errors clusteredat the provinces level in parentheses.In columns 1 and 2, the dependent variable equals 100 if at leastone social conflict occurred in district i in year t. In columns 3and 4, the dependent variable equals 100 if at least one subsistenceconflict occurred in district i in year t. In columns 1 and 3, theindependent variable is the log of the maximum wheat price ingrams of silver per litre in district i in year t. In columns 2 and4, I instrument for the log of the maximum wheat prices withseasonal temperature deviation from the long-term seasonal mean(1500–1600), divided by their standards deviation, as well as theirquadratic value. Province FE is a full set of province fixed effects.Year FE is a set of year fixed effects.

Chapter III
Weather Shocks, Poverty and Crimein 18th-Century Savoy
The effect of economic shocks on interpersonal and intergroup conflicts has been
the subject of a growing literature over the last decade (Burke, Hsiang and
Miguel, 2015). A large body of this literature provides evidence that negative
transitory income shocks are associated with higher risk of conflicts in both
historical and contemporary settings (Dell, Jones and Olken, 2014). However,
there is less evidence on the effect of adaptive strategies on the mitigation of
these shocks. Adaptive strategies are defined as those methods used to reduce
communities’ vulnerability to recurrent environmental shocks that challenge
their living standards. Adaptation to global warming and increased weather
variability will require policy interventions to be informed by resilience-relevant
scientific evidence to foster effectively the resilience of local communities around
the world.
This chapter sheds light on the effect of economic conditions on property
and violent crimes by exploiting within-province variations in weather-induced
negative income shocks in Savoy from 1749 to 1789.1 In particular, I use the
spatial heterogeneity in the migration pattern between lowland and upland
communities– due to the ecological variability of the land across the Duchy–
to identify how seasonal migration could constitute an efficient buffer against
1 During the 17th century and the first half of the 18th century, Savoy has been occupied on manyoccasions by foreign troops. In 1749, a seven-year rule of the Holy Roman Empire ended, andfor the next 40 years, Savoy was not involved in any military conflict. Political and judicialinstitutions remained very stable during this period.
183
184 Chapter III. Weather Shocks, Poverty and Crime
weather-induced income shocks.2 Migrant labour may, indeed, bring in re-
mittances to supplement communities’ resources as well as temporarily relieve
impoverished households of the burden of feeding them. I assemble a new
data set on the occurrence of property crimes and violent crimes 1749–89 at the
provincial level. I combine these data with reconstructed seasonal temperature
data, population census data, as well as data on annual wheat prices in two
different provinces, grape harvest dates and annual wine prices.3 I document
how weather shocks could translate into transitory negative income shocks for
local communities. I show that warmer temperatures were associated with
earlier grape harvest date (GHD) and lower wine prices. This is consistent with
previous findings in the literature (Daux et al., 2012; Meier et al., 2007), and can be
explained by the fact that temperatures and growing season length are a critical
aspect for the cultivation of winegrapes because of their major impact on grape
ripening and fruit quality: warmer temperatures fasten vegetative growth and
increase the ripening potential. Warmer temperature was also associated with
higher wheat prices.4 Bread made up the bulk of the Savoyard consumption bas-
ket in which vegetables, fruits, and livestock products marginally supplemented
the diet (Nicolas, 1979). This means that variations in grain prices had a larger
impact on household real income than variations in wine prices. In the face of
an economic downturn, joblessness, and/or a rise in food prices, the inability
to secure financial resources may lead individuals to turn to illegal income-
generating activities, because these individuals who lack economic resources
have greater incentives to commit crime (Becker, 1968). More specifically, Becker
suggests that individuals weigh the benefits and costs of committing a crime, so
that any changes in the relative gains and the level of crime deterrence might
have an impact on the incidence of crime.
I use panel estimates with province and time fixed effects to compare crime
2 In the remaining of the chapter, I use Savoy to refer to the duchy of Savoy, whereas I use Savoieto name the province constituting part of the duchy. Chambéry was the capital city of both theduchy of Savoy and the province of Savoie. See Section 1.1.
3 I derive temperature series from paleoclimatic reconstructions, and check them against varioushistorical records. Paleoclimatology is the study of past climates. Using a combinationof different types of proxy records, including ice cores, tree rings, and sediment cores,paleoclimatic studies are able to infer local fluctuations in temperature and precipitation fora given year (Bradley, 2015).
4 This results is also in line with previous findings in the literature (Franck and Galord, 2017; Jia,2014– see also Chapter II).
185
rates in provinces with high seasonal migration rates with provinces with low
seasonal migration rates. I find that transitory negative income shocks associated
with weather shocks significantly increased the occurrence of property crimes,
and significantly decreased the occurrence of violent crimes. A one standard
deviation increase in temperature increased property crime rate by 6.4 per cent,
and decreased violent crime rate by 6.2 per cent. I provide additional evidence
that the increase in property crimes were partially driven by the need to survive.
An increase in temperature affects property crimes involving the theft of edible
product. A fall in the opportunity cost of illegal activities due to shrinking
agricultural income could increase the pay-off of committing thefts and, in turn,
increase the probability of committing property crimes. On the contrary, the
drop in real income caused by temperature shocks may explain the negative
relationship between warmer temperature and violent crime rates. Despite lower
wine prices, alcohol consumption, a major criminogenic trigger, is likely to have
decreased as households’ income decreased.
In 1734, Pierre Lavin, an inhabitant of the province of Chablais, migrated and
was later arrested for begging by the French Maréchaussée in Lyon. During his
prosecution, he declared that “because all harvest failed last year in his homeland,
he had no choice but to leave to beg for food here and there”.5 Migration is
an efficient coping mechanism if one has the ability to secure a job and stable
earnings. Using a key institutional change put in place by new immigration
regulations in the United States, Freedman, Owens and Bohn (2018) show that,
among immigrants, the likelihood to commit income-generating crimes is higher
when they are prevented from participating in the local labour market. The
case of Pierre Lavin is certainly not representative of the migration outcome of
Savoyard migrants, and many contemporaries and historians highlight that sea-
sonal migration constituted a significant source of income for local communities
(Grillet, 1807; Guichonnet, 1945; Verneilh-Puiraseau, 1807). Seasonal migration,
therefore, could have offered a viable alternative to crime for generating income
and as such reduced the expected returns to crimes against property. This may,
in turn, reduce the incidence of property crimes during transitory economic
shocks. Drawing on data from Becchia et al. (2012), I exploit spatial variations
5 Cited in Gutton (1971). A.D. Rhône, Série B, Maréchaussée, dossier de P. Lavin.
186 Chapter III. Weather Shocks, Poverty and Crime
in seasonal migration rates to show that it reduced the need for stealing to
survive, and was an efficient strategy to mitigate the negative effect of weather
shocks. An additional percentage point in the seasonal migration rate reduced
the incidence of property crime by 1.3 per cent. Historical evidence suggests that
the cash inflow generated by seasonal migrants, as well as the temporary relief of
Malthusian constraints, contributed to the mitigation of adverse weather shocks.
Related literature. My work relates the literature that studies the linkages
between weather variability, agricultural risks, vulnerability, and migration
(Feng, Krueger and Oppenheimer, 2010; Jha et al., 2018; Marchiori, Maystadt and
Schumacher, 2012; McLeman and Smit, 2006). Ratha (2005, pp. 32–3) emphasises
on the positive effects of remittances. Remittances represent a net fiscal gain
for countries of origin, provide currency for importing scarce inputs, and can
serve as a buffer against negative income shocks in migrants’ home countries.
Yang and Choi (2007) show that, in Filipino households with overseas migrants,
remittance inflows from overseas replace up to 60 per cent of exogenous declines
in income. Focusing on internal migration in Tanzania, Kubik and Maurel (2016)
find that weather shocks are an important migration driver through their effect
on agricultural income. In particular, households specialised in farming are twice
as likely to migrate than households, which derived less than 75 per cent of their
income from agriculture.
My findings also contribute to a prior literature that examines the determi-
nants of interpersonal conflicts. For instance, Axbard (2016) studies how climate-
induced changes in income opportunities for Indonesian fishermen affect the
number of piracy attacks. An improvement of fishing conditions significantly
increases the income of fishermen and significantly reduces the level of sea
piracy. In particular, they show that the effect of negative income shocks is
smaller in areas with many alternative other legal income opportunities, which is
consistent with the fact that the opportunity costs drive, at least partially, the
relationship between transitory negative income shocks and crime. Focusing
on contemporary India, Blakeslee and Fishman (2018) find that a one standard
deviation increase in temperature increases crime rates by 3 per cent. Adverse
weather conditions during the growing (monsoon) season lead to substantial

187
declines in agricultural output and income, and a significant increase in property
crimes and violent crimes.6 In 19th-century Bavaria, negative transitory income
shocks associated with adverse weather conditions resulted in a strong increase
in property crimes and significantly fewer violent crimes (Mehlum, Miguel and
Torvik, 2006). In particular, Mehlum, Miguel and Torvik posit that the decline
in violent crime rates is driven by a reduction in alcohol consumption. Many
historians of crime have related alcohol consumption and drunkenness to violent
behaviour. Because alcohol lowers inhibitions, impairs a person’s judgement and
may exaggerate the offence taken, an increase in alcohol consumption could lead
to a surge in violent crimes (Brennan, 1988; Greenshields, 1994; Lecoutre, 2010;
Phillips, 2014). Further empirical evidence from 19th-century Prussia (Traxler
and Burhop, 2010) and 19th-century France (Bignon, Caroli and Galbiati, 2017)
supports this underlying mechanism. Traxler and Burhop assemble data on
beer production, rye prices, seasonal rainfall and crime in 19th century Prussia,
and show that beer consumption had a strong and highly significant impact on
violent crimes. In particular, they show that rainfall shocks, a proxy for negative
transitory income shocks, had no impact on violent crime once they account for
beer consumption. Bignon, Caroli and Galbiati use geographical variations in the
timing of the phylloxera crises to identify the effect of negative income shocks
on property and violent crime rates. In wine growing areas, the contagion by
phylloxera resulted in a significant decrease in wine production, and represented
a strong exogenous income shock. On average, property crime rates subsequently
increased by 18 per cent, and violent crime rates decreased by 12 per cent.
The remainder of the chapter is organised as follows. Section 1 provides
historical background and discusses how seasonal migration could possibly
mitigate the effects of weather shocks. Section 2 reports data sources and the
dataset construction, and provides descriptive statistics. Section 3 describes the
estimation strategy, quantifies the effect of weather shocks on the incidence of
crimes, and considers a number of robustness checks. Section 4 concludes.
6 Dix-Carneiro, Soares and Ulyssea (2017) also find that regions facing a decline in economicconditions experience relative increases in crime rates (homicide) in Brazil. They documentthat trade-induced shocks to regional economies based on changes in sector-specific tariffsdeteriorate local labour market earnings and employment rates, which in turns increasecriminal activity.
188 Chapter III. Weather Shocks, Poverty and Crime
1 Historical background
In this section, I present a historical overview of the Savoyard economy and its
vulnerabilities to weather shocks during the 18th century, before detailing how
seasonal migration could help local communities to mitigate adverse weather
conditions. The duchy of Savoy was land of contrast: in the north and the west,
areas with higher population densities and a rain-fed agrarian economy centred
on the production of grains; in the east, the mountainous mass precluded the
intensive cultivation of grains and pasture-based livestock production had a more
central position in the agricultural mix. If many institutional and tax reforms
that occurred during the first half of the 18th century, agriculture experienced
little innovations so that total agricultural output was stagnant and could barely
sustain population increases. Yields remained static during this period and close
to the subsistence level, leaving the local communities vulnerable to adverse
weather conditions. Harsh climate conditions and the lack of activity during
winter, in particular in hilly areas, pushed many inhabitants to seasonally migrate
and find work outside the duchy. Migration offered the opportunity to earn an
additional income and temporarily reduced population pressure. Overall, several
estimates suggest that migrants could have made up to 30,000 individuals, about
10 per cent of the total population, by the end of the 18th century.7
1.1 Administrative organisation
By the early 18th century, the duchy of Savoy had been an independent political
entity since the eleventh century.8 In 1720, the Treaty of The Hague ended the
War of the Quadruple Alliance, and attributed Sardinia to the dukes of Savoy,
to whom it brought the royal title. The newly-formed Kingdom of Sardinia
then encompassed Aosta Valley, Nice, Oneglia, Piedmont, Sardinia and Savoy
(Figure III.1). Savoy, itself composed of six provinces and two bailiwicks,9 was
7 For a general overview of the Alpine economy and migration movements during the earlymodern period, see Siddle (1997); Fontaine (1998); Fontaine and Siddle (2000).
8 The County of Savoy emerged in the early 11th century as a state of the Holy Roman Empire,but was granted imperial immediacy in 1331. After several phases of territorial expansion, itwas raised to a duchy in 1416.
9 These two bailiwicks were constituted as the province of Carouge by letters patent of 2nd May1780.
189
then an administrative division of the new political entity (Figure III.2).10
Savoy was a laboratory of enlightened despotism during the 18th century. It
experienced long before the rest of Europe efforts toward fiscal justice, state-led
education, significant growth of its social welfare system, and the opportunity
for peasants to free themselves from seigniorial rights (Devos and Grosperrin,
1985).11 Thus, Victor Amadeus II took advantage from the repeated French
invasions to re-assert his authority over the kingdom.12 In an attempt to unify
bureaucracy, he pressed on with reforms to purge some seigniorial institutions, to
standardise financial practices, and to institute local intendants in each province
(Devos and Grosperrin, 1985; McCluskey, 2009; Storrs, 2013; Symcox, 1983).
These changes contributed to the rise of the fiscal-military state during the 18th
century. Storrs calculate that, in 1747, the army totalled 56,000 men, so that one
man out of forty-five was in the military.13
The office of intendants were not venal, and only meritocratic individuals
were appointed. Although not compulsory, having a doctorate in Law was the
norm. In addition, individuals often had to have served as lawyer, and judge,
most of the time voluntarily, and later been as member of the Senate, before
having the opportunity to be appointed as intendant. Compensation was then
relatively low. Intendants received £1,800 a year to cover their life expenses and
the various costs related to their position (Bouverat, 2013b; Devos and Grosperrin,
1985).14 Nobles despised these positions that attracted individuals from the
bourgeoisie or individuals with a low-economic status who were willing to climb
the social ladder. Thus, in the 1770s, the French ambassador in Turin noticed
admiringly that:
10 Due of its strategic location, Savoy has been occupied several times by France and the HolyRoman Empire for short periods. In 1562, the capital city was transferred from Chambéry toTurin in Piedmont, which afforded better defences against repeated invasions. Institutionalisedin the mid-16th century, the Senate of Chambéry, a court of appeal, was then the main rulinginstitution in the duchy until the creation of intendants in the early 18th century. Within eachprovince, there was a court of first instance called judicature-mage, and responsible for judgingcriminal cases. For a detailed account of the evolution of the senate and its criminal policiesfrom the 16th century onward, see Laly (2010).
11 See Appendix III.A for more details about fiscal reforms and organisation.12 France invaded and occupied Savoy twice under the rule of Louis XIV, between 1690–6 and
1703–13, respectively. For a review of the French occupation policies, see McCluskey (2009).13 In comparison, on average, one man out one hundred was a military in France.14 The intendant general in Chambéry received a higher wage, £3,000, given that he was also
intendant of the province of Savoie. In comparison, the average income of a farming householdamounted to £200 a year during the 18th century.
190 Chapter III. Weather Shocks, Poverty and Crime
“[...] civil officers had a more studious and seclude life than
the clergymen themselves; one expects them to have austere morals
and behaviour. [...] Positions in the administration are filled mostly
by men born in the lower classes, whose studies only shaped their
superiority over the nobility, which is reluctantly ruled by them.”15
From the 1720s onward, every province had one intendant responsible for,
among other things, the collection of taxes and the maintenance of public
infrastructure, such as roads and dikes.16 Intendants also sent monthly reports
depicting the social and economic situation in their province to the intendant
general in Chambéry, who could then take measures to better cope with sources
of distress.17
Along these reforms, Victor Amadeus II enforced another edict in May 1717
enacting the suppression of begging (sbandimento della mendicità), and the creation
of charity hospitals and almshouses in every town across the kingdom. He
intended to establish a uniform system of poor relief, which would be able
to meet the needs of the poor at the local level. By 1726, 399 institutions
were nominally existing, though only one-fifth were well-functioning. Further
reforms took place in the 1740s, strengthening the network of charity institutions
across the kingdom, and changing the policy focus towards young able-bodied
adults to counter the effect of unemployment and proletarianisation (Cavallo,
1995).18 Previously ignored by the poor relief system, young able-bodied adults
represented the bulk of criminals in 18th-century Europe (Lecoutre, 2010). With
15 Cited in Bruchet (1908).16 Intendants’ tasks also encompassed the judgement of civil cases as well as appeals from
seigniorial courts, and the monitoring of weights and currency in use in their province. On dailybasis, intendants also collaborated with provincial governors, who were in charge to executethe daily military tasks. These included the defence of the Savoyard state, sending troop tooblige recalcitrant communities to fulfil their tax obligations, the supply of escorts for criminalscondemned to the royal galleys, and the fight against smuggling activities (Storrs, 2007). SeeEsmonin (1960) for a more detailed description of the role of intendants.
17 Because these reports were not systematically preserved, it is impossible to reconstruct consis-tent series over time. Figure III.3 displays the annual number of natural disasters (drought,epizootic, flood, hail, storm, and wildfire) mentioned in these reports between 1713 and 1792.A.D. Savoie, Administration générale du Duché de Savoie avant 1792 - Série SA 5420–5482.
18 For instance, the municipal workhouse in Thonon-les-Bains provided lodging to thirty six poorin 1789, in exchange for carding and weaving wool under the control of four weavers and threetraineeships. In Turin, the Ritiro di S. Gio’ di Dio, a weaving manufacture, had about 230 inmatesin the 1780s. On the functioning of workhouses during the second half of the 18th century, seeMoody (2001). On the functioning of hospital and people who had recourse to its assistance,see Allegra (2015) and Cavallo (1990).
191
63 charity institutions, half of which were hospitals, the duchy of Savoy was then
doing relatively well compared to the rest of the kingdom (Bouverat, 2013b).
1.2 Climate, weather variability and institutional relief
Located in the Western Alpine region, the duchy of Savoy is under the influence
of a continental climate with harsh winters (snow and prolonged frost), and
warm and dry summers. Topographic features, however, play a key role
in determining local climate patterns, in particular due to the slope, aspect,
and exposure of the surface to sunshine. Temperature level thus varies with
elevation. On average, the temperature lapse rate in the Alps ranges from -
0.54° to -0.58°C per 100 meters (Beniston, 2006; Gobiet et al., 2014; Rolland,
2003).19 As altitude increases, the growing season (number of degree-days) grows
shorter and reduces the potential agricultural output. Crops cultivation was still
possible for altitudes as high as 2,000 meters above sea level, but to reduce the
vulnerability to weather extremes, peasants substituted wheat with rye, which
had a better resistance to cold stress (Girel et al., 2010; Viallet, 1993).
Barriendos et al. (2003), Crook et al. (2004), and Schmocker-Fackel and Naef
(2010) have suggested that the decades 1740–90 were a period of high flood
frequency in the Alps. In general, wet summers were detrimental to the quality
of harvests, because the high moisture content of the grains made its storage
harder (Brunt, 2004). Wet and cold summers also meant that grapes did not
mature as they should, leaving yields to be down compared to normal years.20
By contrast, a warm and early spring fostered the development of grains and
meant an earlier harvest. Early harvests had the advantages of reducing the risk
of catastrophic damage to the crop from hailstorms, and preventing the mature
crops from drying and rewetting due to rainy spells (Le Roy Ladurie, 2006; Pfister
19 That means that, under similar climatic conditions, the rate of temperature decrease is about5.6°C per km. By contrast, the level of precipitation tends to increase with elevation. Indeed,atmospheric pressure drops as altitude increases, which fosters condensation and precipitation.Grass-growing is strongly influenced by these climatic factors and by altitude. (Mathieu, 2009,pp. 55-6) reports that annual grass production decreased by approximately 40 per cent for every1,000 metres of elevation increase.
20 Late spring frosts were also detrimental to vines, as cold temperatures damaged buds that havestarted to open and caused plants dehydration. Late frost delayed the development of grapesand reduced overall yields.

192 Chapter III. Weather Shocks, Poverty and Crime
and Brázdil, 2006).21 During the second half of the 18th century, much of the
annual variations in crop yields depended on the year-to-year fluctuations of the
weather. Other inputs, such as technology and capital stock evolved slowly and
showed little year-to-year variations (Brunt, 2015).
Several episodes of adverse weather conditions occurred between 1749 and
1789. Becchia et al. (2012) review the historiography on climatic conditions in
Savoy, and note that a series of dry summers occurred in 1754, 1762, 1766–7,
and repeated droughts hampered agricultural output in the 1770s and the 1780s
increasing the environmental pressure over a growing population. Similarly, wet
summers in 1749, 1751, 1756–9, and 1770 led to repeated bad harvest.22 For
instance, the intendant of Genevois revealed that, in 1770, the harvest fell short of
an average one-fifth or less for one-fourth of the parishes. In another two-thirds
of the 170 parishes, the level of harvest ranged from one-third to two-thirds of a
normal year. In 1789, the prolonged winter had detrimental effect on the harvest
all over the province. By October, the total wheat harvest in Genevois amounted
to 86,031 coupes of Annecy, to be compared with the 122,000 coupes in normal
years. In addition, the intendant emphasised the limited harvest of fruits and the
lower quality of milk products.23
Such failures pushed local population and authorities to use various strategies
to mitigate the effects of adverse weather conditions. In June 1759, the province
of Chablais experienced an episode of drought followed by continuous rains in
July and August. In September, the intendant noted that peasants reaped only
half of a normal grain harvest. Apple and pear trees gave no fruit, and there were
only few cherries and plums.24 Later in that year, the king granted a £90,000
tax exemption to reduce “the extreme misery of the peoples”, and an additional
£40,000 to support poor relief (Nicolas, 1978).25 The provision of poor relief was,
21 Postponement of harvest was also dangerous, as the risk of large dropouts of grains throughthe harvesting work increased substantially if the grain was getting overripe (Allen and Lueck,2004).
22 A series of long and cold winters also occurred between 1766 and 1774, 1778 and 1780, and 1788and 1789, and led to repeated marked fluctuations in grains prices.
23 The coupes of Annecy is a unit of capacity for grains equal to 88.56 litres. A.D. Haute-Savoie,Série 1 C, 4 178, pièces 6 et 8.
24 A.D. Haute-Savoie, Série 1 C, 2 72, pièce 13.25 In Andilly, the number of baptisms halved in 1759 compared to decadal average. Bouverat
(2013a) also reports decreasing trends in the early 1770s following years of adverse weatherconditions and bad harvests.

193
however, really strict. Every city council had to establish comprehensive lists
of all poor in its parishes by distinguishing those in absolute misery and those
having some very limited resources (Figure III.4). In 1769, the king granted 26
sols per head to households fallen victim to summer hailstorm, and recognised
as poor on such lists.26 Summer 1766 was hot and dry, and grains withered
in the fields, which caused crop failures. Local authorities failed to undertake
adequate actions, and in his correspondence, the abbot of Mellarède noticed that
“one meets vagrants in Chambéry and elsewhere, in particular in Mians, which is
one of their main meeting points. Burglaries, highway robberies, and stock thefts
are common events this year”.27
Beside tax exemption and poor relief, local communities also resorted to other
strategies, including occasional smuggling, thefts, and seasonal migration to
build resilience to weather shocks and maintain their living standards.28
1.3 Living standards
Table III.1 summarises the average food consumption (respectable) baskets for
the typical Savoyard inhabitant. The Savoyard diet was composed of bread,
vegetables and fruits.29 In 1771, the intendant general estimated that the average
daily portion of bread of an adult was 1,600 grams, representing about 80 per cent
of the total caloric intake (Nicolas, 1979; Vermale, 1911).30 Cheese, a high-protein
food source easily storable, and other livestock products supplemented the diet.
26 On average, each household received about £4, which was sufficient to afford enough grainsfor about ten days. For instance in Évian-les-Bains, a total of £669 were distributed to 162households totalling 515 individuals. Wheat cost about £15 per coupe. An adult neededapproximately 0.68 litres of wheat per day (250 litres annually). A.D. Haute-Savoie, Série 1C, 2 72, pièce 21.
27 Cited in Nicolas (1978). Archivio di Stato, Turin, Prima Sezione, M35, Lettre du 13 août 1766.28 In Appendix III.B.1, I provide a detailed account of the effect of weather shocks on poverty,
as well as the set of actions undertaken by public authorities and assistance institutions toattenuate the misery of the poor. Appendix III.B.2 also depicts how livestocks breeding couldimprove the ability to cope with adverse weather conditions. As an additional source ofincome and a consumption smoothing asset, livestock was a very efficient strategy to reducethe negative effect of weather shocks.
29 The intendant of Genevois reported that, in 1789, only one-fifth of the population ate wheat.A.D. Haute-Savoie, Série 1 C, 4 178, pièce 8.
30 In Nancy-sur-Cluses, the average daily portion of bread of an adult was 1,700 grams (Maistreand Maistre, 1986).

194 Chapter III. Weather Shocks, Poverty and Crime
Meat was not widely consumed.31 Livestock products were also used to provide
an income for paying taxes and buying other products, such as wine, which
“is the usual drink among city dwellers” in Chambéry (Daquin, 1787, p. 97).
Malanima (2013) estimates that per capita annual wine consumption averaged
150 litres in Northern Italy during the 18th century.32
Introduced in the 1730s, potatoes were already consumed in the 1740s, even
though their cultivation really expanded after the repeated episodes of food
distress in the early 1770s.33 By 1789, it represented almost one-fourth of total
agricultural production in the province of Faucigny. In the province of Chablais,
potatoes were so widespread among peasants that the intendant reported that
they constituted “most of the food of a large number of peasants, in particular in
mountainous areas” (Ferrand, 1979; Nicolas, 1979).34 In 1787, the doctor Daquin
(1787, pp. 33–8) also reported that harvests of potatoes were plentiful, and “so
precious for peoples in the countryside, that there is no peasant who does not
cultivate them, and that lower people in cities”. In Saint-Maxime-de-Beaufort,
a village of 2,907 inhabitants in the province of Savoie, the annual production
of potatoes amounted to 1,620 quintaux in 1793, that is 55 kg per capita (Borde-
Vibert-Guigue, 1973).35
Despite these improvements, the agricultural productivity of Savoyard farm-
ing remained relatively low by European standards from the mid-18th century.
31 Despite the importance of livestock in the local economy, meat was not widely consumed.Viallet (1993) indicates that, on average, only 37 per cent of the household were able to consumesalted pork or salted goat meat during celebration days. Becchia et al. (2012) has suggested that,on average, meat consumption amounted to 20 kg a year in Savoy. In the neighbouring city ofGeneva, the annual consumption of meat average to 80 kg.
32 Higher levels of alcohol consumption were not unusual in early modern Europe, given thatwine and beer often replaced water in daily consumption. Junot (2009, 124) estimates that acity dweller in Valenciennes consumed on average 500 litres of beer per year during the 17thcentury. In Lyon, the average daily consumption of wine was approximately one litre per capitain the 18th century (Durand, 1979).
33 Lansard (1988) reports that nuns from the Bernadines Order in Conflans consumed annually10.6 coupes of potatoes (approximatively 240 litres) between 1746 and 1750.
34 A.D. Haute-Savoie, Série 1 C 99, pièce 99, lettre du 26 janvier 1789.35 Although cultivated since the early 17th century in the neighbouring regions of Bresse and
Piedmont, maize appeared late in Savoy. Arthur Young’s travelling account is the firstdocument to mention the cultivation of maize in 1785. In 1787, Daquin mentioned that peasantsonly began to cultivate maize few years ago in the surroundings of Chambéry. In 1791, theintendant of Genevois reported that the “harvest of maize is negligible because people sownvery few of it”. A.D. Haute-Savoie, Série 1 C, 4 178, pièce 12.
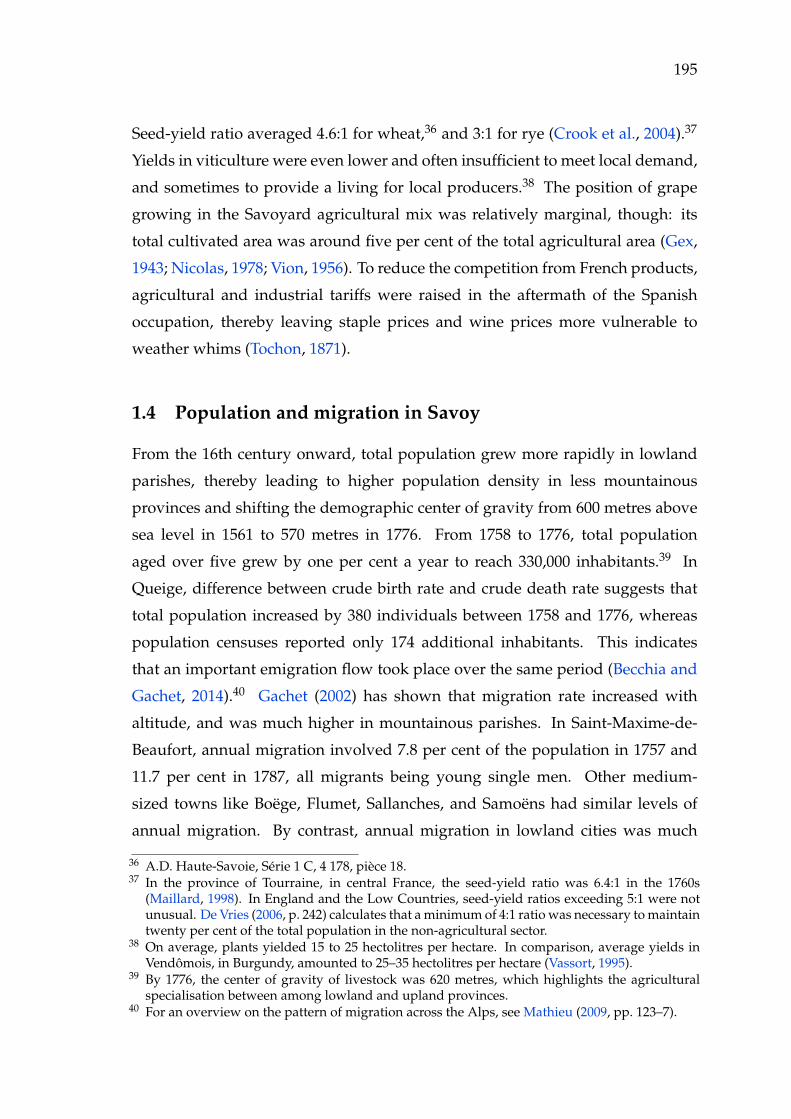
195
Seed-yield ratio averaged 4.6:1 for wheat,36 and 3:1 for rye (Crook et al., 2004).37
Yields in viticulture were even lower and often insufficient to meet local demand,
and sometimes to provide a living for local producers.38 The position of grape
growing in the Savoyard agricultural mix was relatively marginal, though: its
total cultivated area was around five per cent of the total agricultural area (Gex,
1943; Nicolas, 1978; Vion, 1956). To reduce the competition from French products,
agricultural and industrial tariffs were raised in the aftermath of the Spanish
occupation, thereby leaving staple prices and wine prices more vulnerable to
weather whims (Tochon, 1871).
1.4 Population and migration in Savoy
From the 16th century onward, total population grew more rapidly in lowland
parishes, thereby leading to higher population density in less mountainous
provinces and shifting the demographic center of gravity from 600 metres above
sea level in 1561 to 570 metres in 1776. From 1758 to 1776, total population
aged over five grew by one per cent a year to reach 330,000 inhabitants.39 In
Queige, difference between crude birth rate and crude death rate suggests that
total population increased by 380 individuals between 1758 and 1776, whereas
population censuses reported only 174 additional inhabitants. This indicates
that an important emigration flow took place over the same period (Becchia and
Gachet, 2014).40 Gachet (2002) has shown that migration rate increased with
altitude, and was much higher in mountainous parishes. In Saint-Maxime-de-
Beaufort, annual migration involved 7.8 per cent of the population in 1757 and
11.7 per cent in 1787, all migrants being young single men. Other medium-
sized towns like Boëge, Flumet, Sallanches, and Samoëns had similar levels of
annual migration. By contrast, annual migration in lowland cities was much
36 A.D. Haute-Savoie, Série 1 C, 4 178, pièce 18.37 In the province of Tourraine, in central France, the seed-yield ratio was 6.4:1 in the 1760s
(Maillard, 1998). In England and the Low Countries, seed-yield ratios exceeding 5:1 were notunusual. De Vries (2006, p. 242) calculates that a minimum of 4:1 ratio was necessary to maintaintwenty per cent of the total population in the non-agricultural sector.
38 On average, plants yielded 15 to 25 hectolitres per hectare. In comparison, average yields inVendômois, in Burgundy, amounted to 25–35 hectolitres per hectare (Vassort, 1995).
39 By 1776, the center of gravity of livestock was 620 metres, which highlights the agriculturalspecialisation between among lowland and upland provinces.
40 For an overview on the pattern of migration across the Alps, see Mathieu (2009, pp. 123–7).

196 Chapter III. Weather Shocks, Poverty and Crime
lower. About five per cent of the population of Aix-les-Bains migrated every
year, three per cent in Annecy, and one per cent in Thonon-les-Bains (Bouverat,
2013b; Viallet, 1993).41 Workers from upland valleys continuously streamed
below to the plains to find seasonal employment, whereas urban dwellers more
rarely migrated, so that these structural differences in migration rates remained
relatively stable over the pre-industrial period.42
Public houses were a common location for alcohol consumption, and con-
tributed to the structuring of individual social relations. Heavy drinking by the
poor was, nonetheless, perceived as a social threat by the authorities (Brennan,
1988; Lecoutre, 2010; Phillips, 2014). Ill treatment of women (wife-beating) by
drunken men and/or the murder of a rival or an acquaintance in a fight were not
unusual events. Lecoutre describes the usual drunkards as a peasant or craftsman
aged between 20 and 34, and drinking in public houses every evening and on
Sunday.43 Thus, the seasonal migration of young men may contribute, de facto, to
a reduction of violent and/or deviant behaviour in provinces of emigration.
Another plausible mechanism through which migration may influence crime
propensity is the inflow of remittances and the reduction of the Malthusian
constraint. In his early work, Braudel (1966) has characterised mountains as a
factory producing migrant labour for other people’s usage, thus suggesting that
local population used migration to escape the Malthusian positive checks. Recent
scholarships, however, have discarded this view by showing that migratory
movements varied widely in both size and form. If poverty and need drove
some of the migration flow (push factor), temporary and commercial emigration
responded to different dynamics. In such cases, emigrants often belonged to
wealthier social groups, were well integrated in their local communities, and
provided remittances to pay family taxes and local debts (Fontaine, 2003; Maistre,
Maistre and Heitz, 1992; Siddle, 1997; Viazzo, 1989). Thus, in Magland in the
province of Faucigny, each of the three hundred seasonal migrants usually came
41 Immigration was also significant in early modern Savoy. In Carouge, only 84 heads ofhousehold out of 1,086 originated from the city in 1790. Men were coming from France,Switzerland, and surroundings regions of Savoy. In Annecy and Montmélian, about two-thirdof the married men were born outside these cities (Bouverat, 2013b).
42 For a general overview of push and pull factors and their impacts on migration patterns in earlymodern Europe, see Lucassen (1987).
43 Women represented less than four per cent of the hundreds of judicial cases for drunkenness.
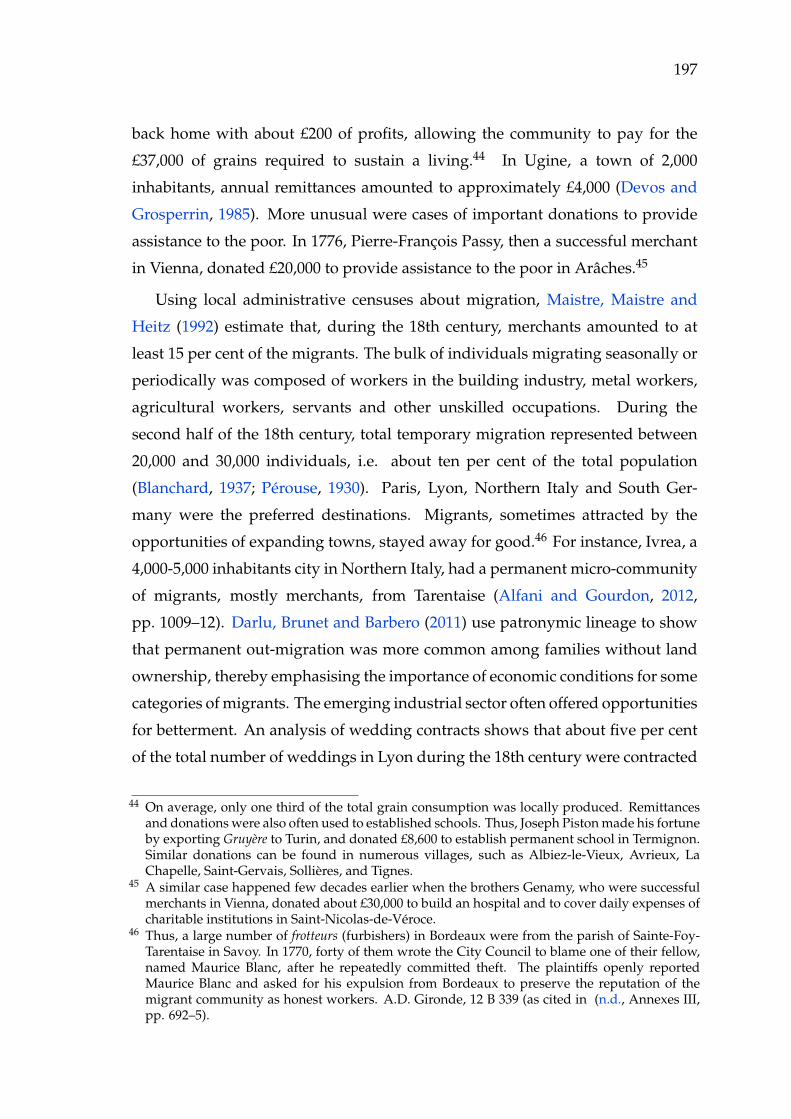
197
back home with about £200 of profits, allowing the community to pay for the
£37,000 of grains required to sustain a living.44 In Ugine, a town of 2,000
inhabitants, annual remittances amounted to approximately £4,000 (Devos and
Grosperrin, 1985). More unusual were cases of important donations to provide
assistance to the poor. In 1776, Pierre-François Passy, then a successful merchant
in Vienna, donated £20,000 to provide assistance to the poor in Arâches.45
Using local administrative censuses about migration, Maistre, Maistre and
Heitz (1992) estimate that, during the 18th century, merchants amounted to at
least 15 per cent of the migrants. The bulk of individuals migrating seasonally or
periodically was composed of workers in the building industry, metal workers,
agricultural workers, servants and other unskilled occupations. During the
second half of the 18th century, total temporary migration represented between
20,000 and 30,000 individuals, i.e. about ten per cent of the total population
(Blanchard, 1937; Pérouse, 1930). Paris, Lyon, Northern Italy and South Ger-
many were the preferred destinations. Migrants, sometimes attracted by the
opportunities of expanding towns, stayed away for good.46 For instance, Ivrea, a
4,000-5,000 inhabitants city in Northern Italy, had a permanent micro-community
of migrants, mostly merchants, from Tarentaise (Alfani and Gourdon, 2012,
pp. 1009–12). Darlu, Brunet and Barbero (2011) use patronymic lineage to show
that permanent out-migration was more common among families without land
ownership, thereby emphasising the importance of economic conditions for some
categories of migrants. The emerging industrial sector often offered opportunities
for betterment. An analysis of wedding contracts shows that about five per cent
of the total number of weddings in Lyon during the 18th century were contracted
44 On average, only one third of the total grain consumption was locally produced. Remittancesand donations were also often used to established schools. Thus, Joseph Piston made his fortuneby exporting Gruyère to Turin, and donated £8,600 to establish permanent school in Termignon.Similar donations can be found in numerous villages, such as Albiez-le-Vieux, Avrieux, LaChapelle, Saint-Gervais, Sollières, and Tignes.
45 A similar case happened few decades earlier when the brothers Genamy, who were successfulmerchants in Vienna, donated about £30,000 to build an hospital and to cover daily expenses ofcharitable institutions in Saint-Nicolas-de-Véroce.
46 Thus, a large number of frotteurs (furbishers) in Bordeaux were from the parish of Sainte-Foy-Tarentaise in Savoy. In 1770, forty of them wrote the City Council to blame one of their fellow,named Maurice Blanc, after he repeatedly committed theft. The plaintiffs openly reportedMaurice Blanc and asked for his expulsion from Bordeaux to preserve the reputation of themigrant community as honest workers. A.D. Gironde, 12 B 339 (as cited in (n.d., Annexes III,pp. 692–5).

198 Chapter III. Weather Shocks, Poverty and Crime
by individuals from Savoy (Garden, 1970).47 In her research about migration
in Turin, Zucca Micheletto (2006) reveals that, among migrant bribes in Turin
between 1760 and 1791, nearly six per cent originated from the sole village of
Bessan in the province of Maurienne. Worsening economic conditions often
increased the number of individuals joining the flow of migrants. Thus, during
the crises of the 1770s, an administrative clerk reported that
“the inhabitants of Orcien in Chablais [were] in a miserable situ-
ation, after five consecutive years of poor harvest. Having no more
access to credit to buy food, most of families [were] willing to out-
migrate”.48
In Le Biot, the community secretary reported that “five families emigrated due
to the dearth” that year.49 More generally, migratory movements and agricultural
economies were complementary in Savoy as absences were mostly concentrated
during the winter. Even year-long emigration was not too detrimental to
agricultural output, given that pastoral agriculture in the uplands was relatively
less labour intensive than arable farming. By providing additional income
and releasing the Malthusian constraint, migration enhanced the resilience of
mountain communities to negative transitory economic (weather) shocks.
2 Data
By 1749, there were six provinces in the duchy of Savoy, each corresponding
to an independent judicial division, named the judicature-mage. My sample
consists of offenders who committed at least one property crime and/or violent
crime between from spring 1749 to spring 1789 in one of these six provinces.
I use year-on-year seasonal temperature variations at the level of provinces to
identify the effect of adverse weather conditions on the likelihood of committing
crimes. I digitised and georeferenced the map drawn by Cary (1808, p. 17) to
create a shapefile reproducing the administrative borders of Savoy during the
47 In 1756 and 1783, Savoyard also represented about twelve per cent of the deceased at theHôtel-Dieu (hospital). Besides, about six per cent of the apprentices in silk manufactures alsooriginated from the duchy of Savoy.
48 A.D. Haute-Savoie, Série C 53, pièce 131.49 A.D. Haute-Savoie, Série C 2 72, pièce 23.
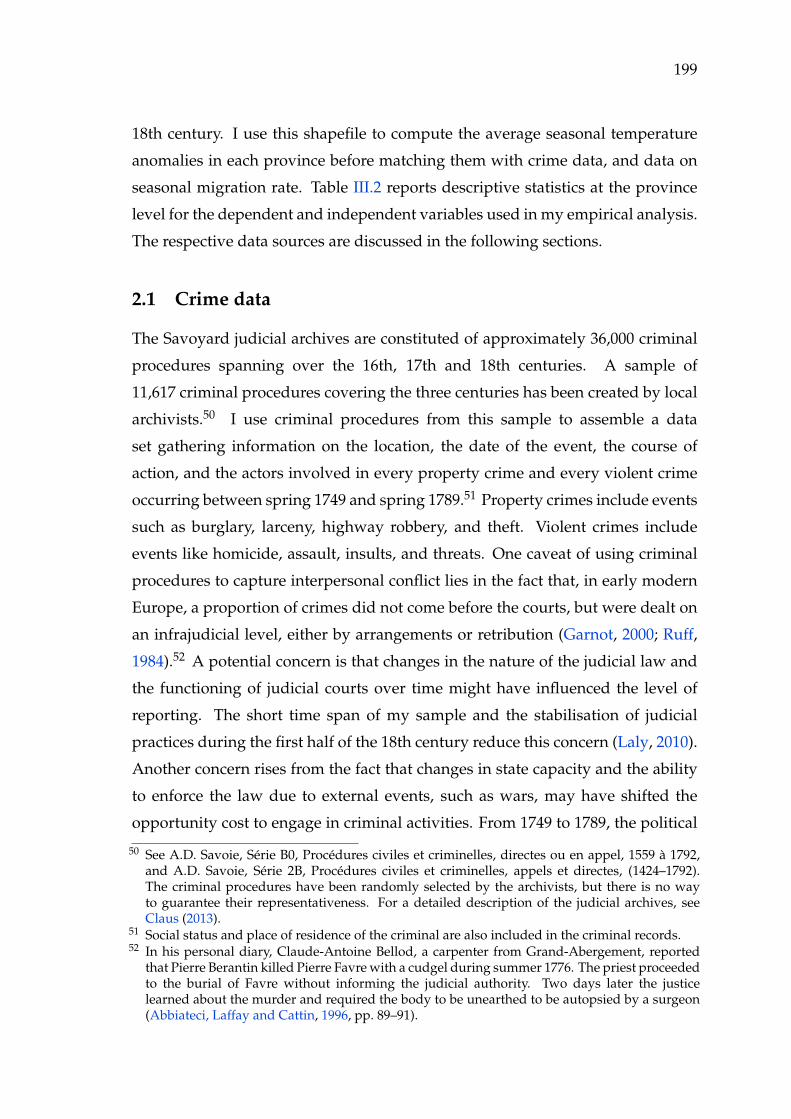
199
18th century. I use this shapefile to compute the average seasonal temperature
anomalies in each province before matching them with crime data, and data on
seasonal migration rate. Table III.2 reports descriptive statistics at the province
level for the dependent and independent variables used in my empirical analysis.
The respective data sources are discussed in the following sections.
2.1 Crime data
The Savoyard judicial archives are constituted of approximately 36,000 criminal
procedures spanning over the 16th, 17th and 18th centuries. A sample of
11,617 criminal procedures covering the three centuries has been created by local
archivists.50 I use criminal procedures from this sample to assemble a data
set gathering information on the location, the date of the event, the course of
action, and the actors involved in every property crime and every violent crime
occurring between spring 1749 and spring 1789.51 Property crimes include events
such as burglary, larceny, highway robbery, and theft. Violent crimes include
events like homicide, assault, insults, and threats. One caveat of using criminal
procedures to capture interpersonal conflict lies in the fact that, in early modern
Europe, a proportion of crimes did not come before the courts, but were dealt on
an infrajudicial level, either by arrangements or retribution (Garnot, 2000; Ruff,
1984).52 A potential concern is that changes in the nature of the judicial law and
the functioning of judicial courts over time might have influenced the level of
reporting. The short time span of my sample and the stabilisation of judicial
practices during the first half of the 18th century reduce this concern (Laly, 2010).
Another concern rises from the fact that changes in state capacity and the ability
to enforce the law due to external events, such as wars, may have shifted the
opportunity cost to engage in criminal activities. From 1749 to 1789, the political
50 See A.D. Savoie, Série B0, Procédures civiles et criminelles, directes ou en appel, 1559 à 1792,and A.D. Savoie, Série 2B, Procédures civiles et criminelles, appels et directes, (1424–1792).The criminal procedures have been randomly selected by the archivists, but there is no wayto guarantee their representativeness. For a detailed description of the judicial archives, seeClaus (2013).
51 Social status and place of residence of the criminal are also included in the criminal records.52 In his personal diary, Claude-Antoine Bellod, a carpenter from Grand-Abergement, reported
that Pierre Berantin killed Pierre Favre with a cudgel during summer 1776. The priest proceededto the burial of Favre without informing the judicial authority. Two days later the justicelearned about the murder and required the body to be unearthed to be autopsied by a surgeon(Abbiateci, Laffay and Cattin, 1996, pp. 89–91).
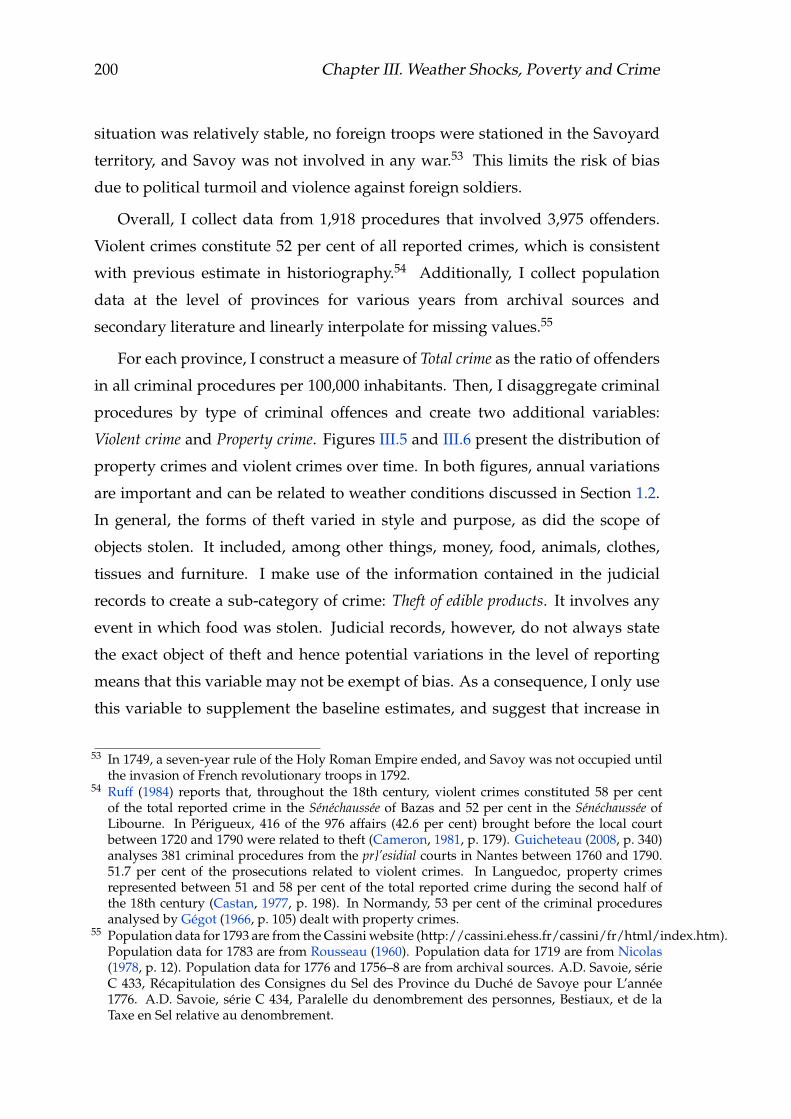
200 Chapter III. Weather Shocks, Poverty and Crime
situation was relatively stable, no foreign troops were stationed in the Savoyard
territory, and Savoy was not involved in any war.53 This limits the risk of bias
due to political turmoil and violence against foreign soldiers.
Overall, I collect data from 1,918 procedures that involved 3,975 offenders.
Violent crimes constitute 52 per cent of all reported crimes, which is consistent
with previous estimate in historiography.54 Additionally, I collect population
data at the level of provinces for various years from archival sources and
secondary literature and linearly interpolate for missing values.55
For each province, I construct a measure of Total crime as the ratio of offenders
in all criminal procedures per 100,000 inhabitants. Then, I disaggregate criminal
procedures by type of criminal offences and create two additional variables:
Violent crime and Property crime. Figures III.5 and III.6 present the distribution of
property crimes and violent crimes over time. In both figures, annual variations
are important and can be related to weather conditions discussed in Section 1.2.
In general, the forms of theft varied in style and purpose, as did the scope of
objects stolen. It included, among other things, money, food, animals, clothes,
tissues and furniture. I make use of the information contained in the judicial
records to create a sub-category of crime: Theft of edible products. It involves any
event in which food was stolen. Judicial records, however, do not always state
the exact object of theft and hence potential variations in the level of reporting
means that this variable may not be exempt of bias. As a consequence, I only use
this variable to supplement the baseline estimates, and suggest that increase in
53 In 1749, a seven-year rule of the Holy Roman Empire ended, and Savoy was not occupied untilthe invasion of French revolutionary troops in 1792.
54 Ruff (1984) reports that, throughout the 18th century, violent crimes constituted 58 per centof the total reported crime in the Sénéchaussée of Bazas and 52 per cent in the Sénéchaussée ofLibourne. In Périgueux, 416 of the 976 affairs (42.6 per cent) brought before the local courtbetween 1720 and 1790 were related to theft (Cameron, 1981, p. 179). Guicheteau (2008, p. 340)analyses 381 criminal procedures from the pr}’esidial courts in Nantes between 1760 and 1790.51.7 per cent of the prosecutions related to violent crimes. In Languedoc, property crimesrepresented between 51 and 58 per cent of the total reported crime during the second half ofthe 18th century (Castan, 1977, p. 198). In Normandy, 53 per cent of the criminal proceduresanalysed by Gégot (1966, p. 105) dealt with property crimes.
55 Population data for 1793 are from the Cassini website (http://cassini.ehess.fr/cassini/fr/html/index.htm).Population data for 1783 are from Rousseau (1960). Population data for 1719 are from Nicolas(1978, p. 12). Population data for 1776 and 1756–8 are from archival sources. A.D. Savoie, sérieC 433, Récapitulation des Consignes du Sel des Province du Duché de Savoye pour L’année1776. A.D. Savoie, série C 434, Paralelle du denombrement des personnes, Bestiaux, et de laTaxe en Sel relative au denombrement.
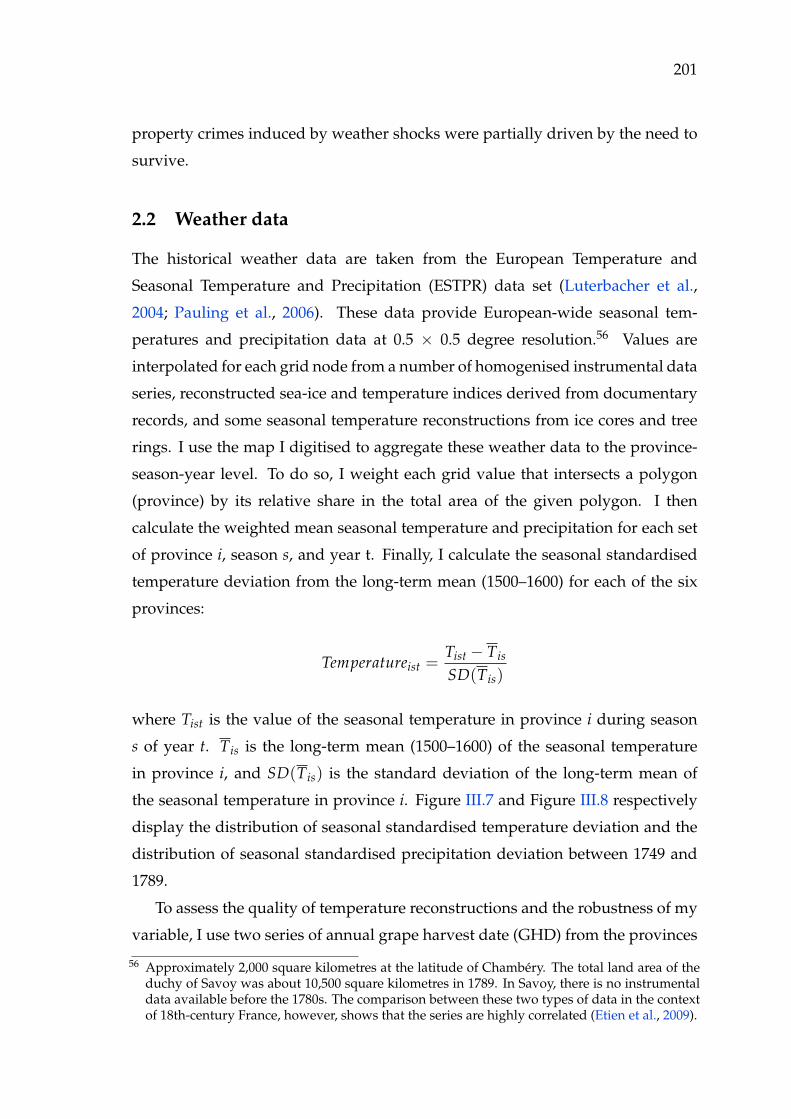
201
property crimes induced by weather shocks were partially driven by the need to
survive.
2.2 Weather data
The historical weather data are taken from the European Temperature and
Seasonal Temperature and Precipitation (ESTPR) data set (Luterbacher et al.,
2004; Pauling et al., 2006). These data provide European-wide seasonal tem-
peratures and precipitation data at 0.5 × 0.5 degree resolution.56 Values are
interpolated for each grid node from a number of homogenised instrumental data
series, reconstructed sea-ice and temperature indices derived from documentary
records, and some seasonal temperature reconstructions from ice cores and tree
rings. I use the map I digitised to aggregate these weather data to the province-
season-year level. To do so, I weight each grid value that intersects a polygon
(province) by its relative share in the total area of the given polygon. I then
calculate the weighted mean seasonal temperature and precipitation for each set
of province i, season s, and year t. Finally, I calculate the seasonal standardised
temperature deviation from the long-term mean (1500–1600) for each of the six
provinces:
Temperatureist =Tist − Tis
SD(Tis)
where Tist is the value of the seasonal temperature in province i during season
s of year t. Tis is the long-term mean (1500–1600) of the seasonal temperature
in province i, and SD(Tis) is the standard deviation of the long-term mean of
the seasonal temperature in province i. Figure III.7 and Figure III.8 respectively
display the distribution of seasonal standardised temperature deviation and the
distribution of seasonal standardised precipitation deviation between 1749 and
1789.
To assess the quality of temperature reconstructions and the robustness of my
variable, I use two series of annual grape harvest date (GHD) from the provinces
56 Approximately 2,000 square kilometres at the latitude of Chambéry. The total land area of theduchy of Savoy was about 10,500 square kilometres in 1789. In Savoy, there is no instrumentaldata available before the 1780s. The comparison between these two types of data in the contextof 18th-century France, however, shows that the series are highly correlated (Etien et al., 2009).

202 Chapter III. Weather Shocks, Poverty and Crime
of Chablais and Maurienne (Nicolas, 1978; Tissot, 1887).57 GHD are tightly related
to spring and summer temperatures, and therefore provide a reliable proxy for
reconstructing weather conditions in the past. On average, the variation of GHD
is about 10 days for 1°C variation of the growing season temperature (Chuine
et al., 2004; Etien et al., 2009; Le Roy Ladurie and Rousseau, 2011; Meier et al.,
2007). More generally, hot summers tend to be favourable to the development
of grape, whereas cold and wet summers are detrimental to both the quantity
and the quality of grapes. I compare Savoyard GHD with series from French
Jura (Daux et al., 2012) and neighbouring Switzerland (Meier et al., 2007). These
two regions are close to Savoy and subjected to similar weather patterns, so that
GHD are expected to move together on an annual basis. Figure III.11 reports
the correlation matrix of these series and indicates that GHD series for Savoy are
strongly correlated with series from Switzerland and French Jura. Savoyard GHD
are thus reliable indicators of the summer temperature conditions during the 18th
century. In Figures III.9 and III.10, I show the scatter plot of my temperature
variable against the GHD : the higher the temperature anomalies, the warmer the
temperature during the summer, and the earlier the harvest of grapes. Overall,
these results suggest that temperature variables derived from paleoclimatological
data are a reliable estimate of past weather conditions.
I also construct two additional measures of weather shocks to capture only
extreme events. I create a dummy variable, Droughts, equal one if the seasonal
temperature deviation is at least one standard deviation larger than the long-term
mean, and zero otherwise. Similarly, to capture extremely wet seasons during
which floods were more likely, I create a dummy variable, Floods, equal one if the
seasonal precipitation deviation is at least one standard deviation larger than the
long-term mean, and zero otherwise.
2.3 Socio-economic data
Prices data. Baud (2010) and Viallet (1993) suggest that the impact of crop
prices on real income was more important for urban dwellers and landless rural
57 Nicolas uses vintage bans in Montmélian and its surroundings to build a series spanning 1713–90. Montmélian is a town located 15 kilometres south of Chambéry. Its average elevation is285 metres above sea level. Tissot reports GHD from 1688 to 1794 in Thonon-les-Bains in theprovince of Chablais.

203
labourers than for farmers. Large unexpected variations in prices, however, also
affected farmers who needed to buy livestock fodder, in particular after a bad
harvest. I collect data on wheat prices in early October, right after the harvests,
on the markets of Annecy and Chambéry to approximate annual changes in
living standards (Figure III.12).58 In Table III.12, I show the correlation between
wheat prices and the standardised temperature deviation during summer in the
province of Genevois and Savoie. Warmer temperature are positively correlated
with higher wheat prices, supporting the idea that temperature shocks often
resulted in negative transitory economic shocks that could, in turn, influence the
incidence of crime.
Mehlum, Miguel and Torvik (2006) argue that higher rye prices were concomi-
tant with higher beer prices, leading to less alcohol consumption, and reducing
the incidence of violent conflicts. Every year, in early December, the city council
of Annecy would set the price of a jug of locally produced wine, based on infor-
mation it gathered about the outcome of the grape harvest.59 I collect these prices
from the registers of deliberations of the city council of Annecy to investigate
the effect of temperature shocks on the price of wine. Table III.13 reports the
correlation between summer temperature shocks in the province of Genevois and
the price of red wine in Annecy, and shows that warmer temperatures had a
negative effect on the level of wine prices. This result is consistent with the fact
that warmer temperatures foster the development of grape and positively affect
wine grape harvests, as reflected by earlier GHD. However, the share of wine in
the consumption basket is relatively small compared to crops, so that the overall
effect of temperature shocks on living standards was likely negative.
Migration data. I collect data on the average rate of seasonal migration at the
province level from Becchia et al. (2012). During the 18th century, the adminis-
tration also carried out, for military purposes, enquiries regarding the number
of males aged over 13 in every parish. A few of these documents (consigne des
mâles) survived for the years 1726, 1758 and 1776. For each individual, they
58 For Annecy, monthly average of wheat prices on the four markets of October. A.M. Annecy,série HH2, Mercuriales 1629–1789. For Chambéry, wheat prices on 29 September (Saint-Michel).A.M. Chambéry, 189E Dépôt 1265 à 1294, Registre de la Grenette.
59 A.M. Annecy, Série BB 45 à 55, Registre des délibérations de la ville d’Annecy.
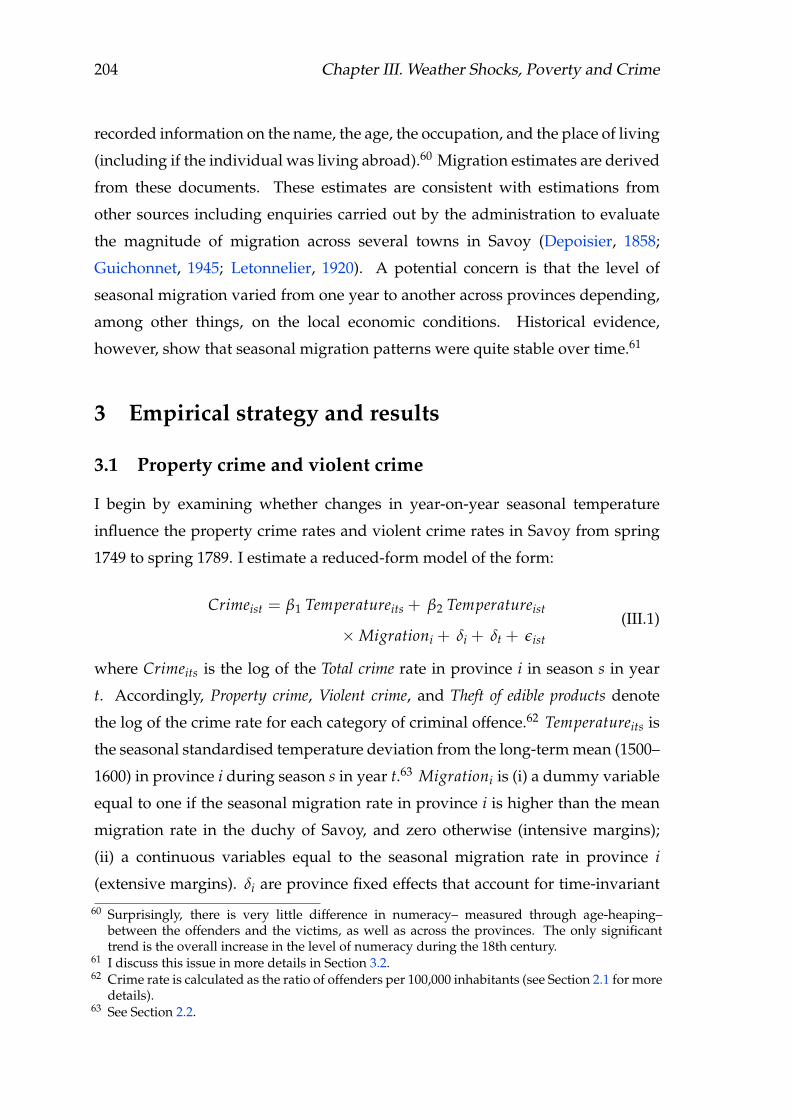
204 Chapter III. Weather Shocks, Poverty and Crime
recorded information on the name, the age, the occupation, and the place of living
(including if the individual was living abroad).60 Migration estimates are derived
from these documents. These estimates are consistent with estimations from
other sources including enquiries carried out by the administration to evaluate
the magnitude of migration across several towns in Savoy (Depoisier, 1858;
Guichonnet, 1945; Letonnelier, 1920). A potential concern is that the level of
seasonal migration varied from one year to another across provinces depending,
among other things, on the local economic conditions. Historical evidence,
however, show that seasonal migration patterns were quite stable over time.61
3 Empirical strategy and results
3.1 Property crime and violent crime
I begin by examining whether changes in year-on-year seasonal temperature
influence the property crime rates and violent crime rates in Savoy from spring
1749 to spring 1789. I estimate a reduced-form model of the form:
Crimeist = β1 Temperatureits + β2 Temperatureist
× Migrationi + δi + δt + ǫist
(III.1)
where Crimeits is the log of the Total crime rate in province i in season s in year
t. Accordingly, Property crime, Violent crime, and Theft of edible products denote
the log of the crime rate for each category of criminal offence.62 Temperatureits is
the seasonal standardised temperature deviation from the long-term mean (1500–
1600) in province i during season s in year t.63 Migrationi is (i) a dummy variable
equal to one if the seasonal migration rate in province i is higher than the mean
migration rate in the duchy of Savoy, and zero otherwise (intensive margins);
(ii) a continuous variables equal to the seasonal migration rate in province i
(extensive margins). δi are province fixed effects that account for time-invariant
60 Surprisingly, there is very little difference in numeracy– measured through age-heaping–between the offenders and the victims, as well as across the provinces. The only significanttrend is the overall increase in the level of numeracy during the 18th century.
61 I discuss this issue in more details in Section 3.2.62 Crime rate is calculated as the ratio of offenders per 100,000 inhabitants (see Section 2.1 for more
details).63 See Section 2.2.
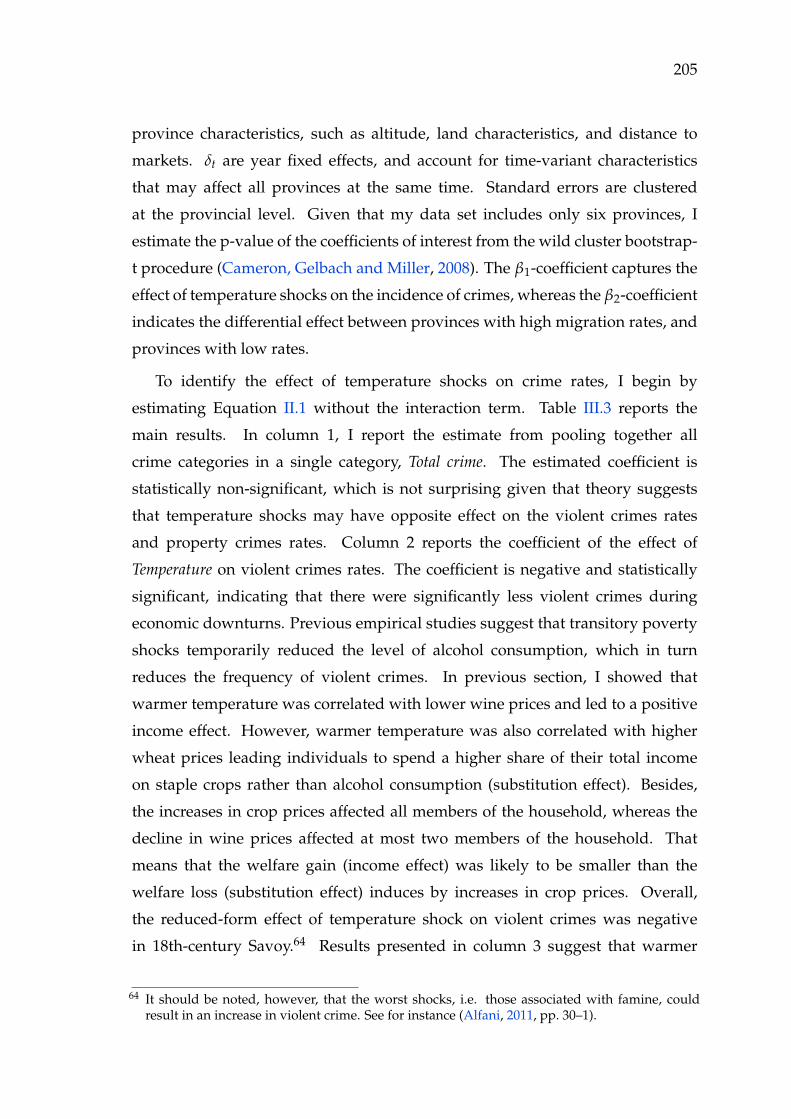
205
province characteristics, such as altitude, land characteristics, and distance to
markets. δt are year fixed effects, and account for time-variant characteristics
that may affect all provinces at the same time. Standard errors are clustered
at the provincial level. Given that my data set includes only six provinces, I
estimate the p-value of the coefficients of interest from the wild cluster bootstrap-
t procedure (Cameron, Gelbach and Miller, 2008). The β1-coefficient captures the
effect of temperature shocks on the incidence of crimes, whereas the β2-coefficient
indicates the differential effect between provinces with high migration rates, and
provinces with low rates.
To identify the effect of temperature shocks on crime rates, I begin by
estimating Equation II.1 without the interaction term. Table III.3 reports the
main results. In column 1, I report the estimate from pooling together all
crime categories in a single category, Total crime. The estimated coefficient is
statistically non-significant, which is not surprising given that theory suggests
that temperature shocks may have opposite effect on the violent crimes rates
and property crimes rates. Column 2 reports the coefficient of the effect of
Temperature on violent crimes rates. The coefficient is negative and statistically
significant, indicating that there were significantly less violent crimes during
economic downturns. Previous empirical studies suggest that transitory poverty
shocks temporarily reduced the level of alcohol consumption, which in turn
reduces the frequency of violent crimes. In previous section, I showed that
warmer temperature was correlated with lower wine prices and led to a positive
income effect. However, warmer temperature was also correlated with higher
wheat prices leading individuals to spend a higher share of their total income
on staple crops rather than alcohol consumption (substitution effect). Besides,
the increases in crop prices affected all members of the household, whereas the
decline in wine prices affected at most two members of the household. That
means that the welfare gain (income effect) was likely to be smaller than the
welfare loss (substitution effect) induces by increases in crop prices. Overall,
the reduced-form effect of temperature shock on violent crimes was negative
in 18th-century Savoy.64 Results presented in column 3 suggest that warmer
64 It should be noted, however, that the worst shocks, i.e. those associated with famine, couldresult in an increase in violent crime. See for instance (Alfani, 2011, pp. 30–1).

206 Chapter III. Weather Shocks, Poverty and Crime
temperature had a positive and statistically significant effect on property crimes
rates. A one standard deviation increases in temperature increased the incidence
of property crimes by 3.5%.65 Adverse weather conditions reduced prospects of
the next harvest and increased pressure on current prices. This in turn created
situation of economic stress for more vulnerable individuals.66 This is consistent
with the fact that weather-induced economic shocks were a source of economic
deprivation that led some individuals to commit crimes to survive (Bignon,
Caroli and Galbiati, 2017; Mehlum, Miguel and Torvik, 2006).
Robustness checks. In this subsection, I present a variety of robustness exer-
cises that support the interpretation of my findings. I show that my baseline
estimates are neither subjected to an omitted variables bias (Table III.4) nor
dependent on my definition of temperature shocks (Table III.5). Table III.6 reports
the estimates from Equation III.1 when seasonal lags are added as independent
variables. Past climatic conditions have no significant impact on violent crime
rates and property crime rates.67 Finally, I restrict my attention to most extreme
events– Drougths and Floods. Table III.7 reports the estimated effects of seasonal
Droughts and seasonal Floods on violent crime and property crime rates. The
signs of the coefficient estimates are in line with my baseline estimates. How-
ever, magnitudes are larger suggesting that more extreme weather shocks had
stronger negative impact on local economic conditions leaving more households
in situation of economic stress.
65 Blakeslee and Fishman (2018) find an effect of similar magnitude in contemporary India.66 For more details about this mechanism, see Labrousse (1933), Goubert (1960), and Nicolas
(1978).67 In column 6, the coefficient for the Temperature is positive but non-significant at the conventional
level. Interestingly, the coefficient of Temperature s-2 is negative, though not statisticallysignificant, suggesting that temperature shocks that occurred half a year earlier had a negativeimpact on the current level of property crimes. One plausible explanation is that if provinceexperience successively adverse weather conditions, local and state authorities were able tointervene and provide sufficient relief to mitigate the negative effect of temperature shock,reducing the expected benefit derived from perpetrating crime against property and thusmaking it unnecessary. In Appendix III.B.1, I provide detailed information on the system ofpoor relief and document how authorities successfully prevented dearth after the occurrenceof bad harvests. The development of bureaucratisation under the aegis of intendants duringthe first half of the 18th century, and the implementation of a stable monitoring system of localsocio-economic conditions make it possible to grant adequate tax exemption and to distributeseeds and grains when it was required. That in turn significantly improves the resilience of localcommunities against negative transitory economic shocks.

207
3.2 The role of seasonal migration
Was seasonal migration an efficient buffer against weather shocks? In Section 1.4,
I provide historical evidence to argue that seasonal migration could contribute
to the mitigation of weather shocks through two channels: remittances and
reduction of the Malthusian constraints. To investigate this question, I analyse
whether temperature shocks affect crime rates differentially in provinces in which
average seasonal migration rate was high (Equation III.1).
Coefficient estimates for the intensive margins are presented in Table III.8.
In Section 1.4, I provide narrative evidence to show that remittances derived
from migrant labour made the former provinces relatively better-off. In column
3, the positive coefficient on Temperature indicates that warmer temperature
significantly increases the level of property crimes. The negative coefficient
on Temperature × Migration (β2) is negative and statistically significant. Hence,
when adverse weather conditions occurred, province that had structurally higher
level of seasonal migration witnessed less crimes against property than other
provinces. It is, however, impossible to identify the exact underlying mechanism.
Migrant labour also meant that a significant share of the young able-bodied
men, the bulk of criminals in the 18th-century Europe (Lecoutre, 2010), was
temporarily out of the province. Thus, the effect may also be driven by the
fact that provinces with higher seasonal migration rate faced temporarily lower
population pressure and/or were temporarily discharged from some of its most
criminogenic population.68 That would be consistent with the fact that seasonal
migration did not mitigate the effect of temperature shocks on violent crimes. If
as suggested in previous empirical studies, the decline in violent crimes is driven
by a relative decline in purchasing power, then I should expect the coefficient
Temperature × Migration to be positive in column 2. That it is negative indicates
that the effect of welfare gains linked to seasonal migration was smaller than the
effect of a temporary reduction in the criminogenic population. Focusing on the
extensive effect of seasonal migration leaves the results unchanged (Table III.8,
columns 2 and 3). Table III.10 reports the effect of temperature shocks and
migration on a subset of violent crimes: physical violences committed against
68 Castan (1977) finds that women represented about 20 per cent of the offenders behind propertycrimes in 18th century Provence.
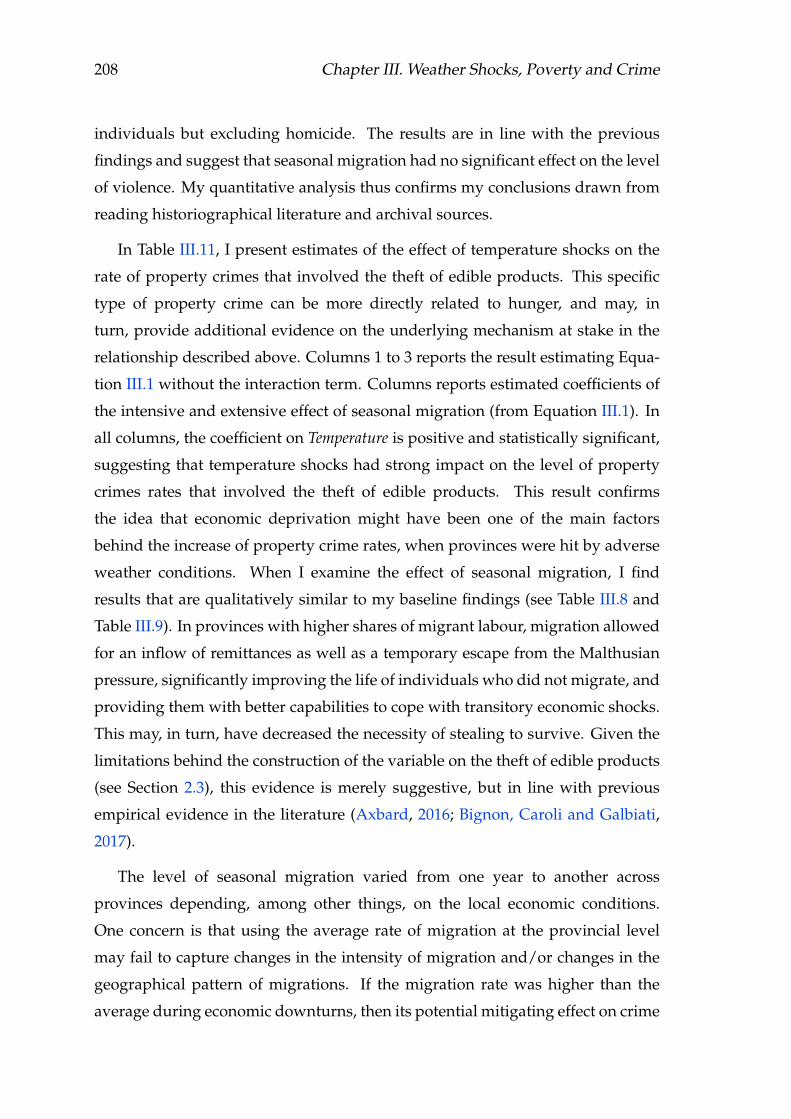
208 Chapter III. Weather Shocks, Poverty and Crime
individuals but excluding homicide. The results are in line with the previous
findings and suggest that seasonal migration had no significant effect on the level
of violence. My quantitative analysis thus confirms my conclusions drawn from
reading historiographical literature and archival sources.
In Table III.11, I present estimates of the effect of temperature shocks on the
rate of property crimes that involved the theft of edible products. This specific
type of property crime can be more directly related to hunger, and may, in
turn, provide additional evidence on the underlying mechanism at stake in the
relationship described above. Columns 1 to 3 reports the result estimating Equa-
tion III.1 without the interaction term. Columns reports estimated coefficients of
the intensive and extensive effect of seasonal migration (from Equation III.1). In
all columns, the coefficient on Temperature is positive and statistically significant,
suggesting that temperature shocks had strong impact on the level of property
crimes rates that involved the theft of edible products. This result confirms
the idea that economic deprivation might have been one of the main factors
behind the increase of property crime rates, when provinces were hit by adverse
weather conditions. When I examine the effect of seasonal migration, I find
results that are qualitatively similar to my baseline findings (see Table III.8 and
Table III.9). In provinces with higher shares of migrant labour, migration allowed
for an inflow of remittances as well as a temporary escape from the Malthusian
pressure, significantly improving the life of individuals who did not migrate, and
providing them with better capabilities to cope with transitory economic shocks.
This may, in turn, have decreased the necessity of stealing to survive. Given the
limitations behind the construction of the variable on the theft of edible products
(see Section 2.3), this evidence is merely suggestive, but in line with previous
empirical evidence in the literature (Axbard, 2016; Bignon, Caroli and Galbiati,
2017).
The level of seasonal migration varied from one year to another across
provinces depending, among other things, on the local economic conditions.
One concern is that using the average rate of migration at the provincial level
may fail to capture changes in the intensity of migration and/or changes in the
geographical pattern of migrations. If the migration rate was higher than the
average during economic downturns, then its potential mitigating effect on crime
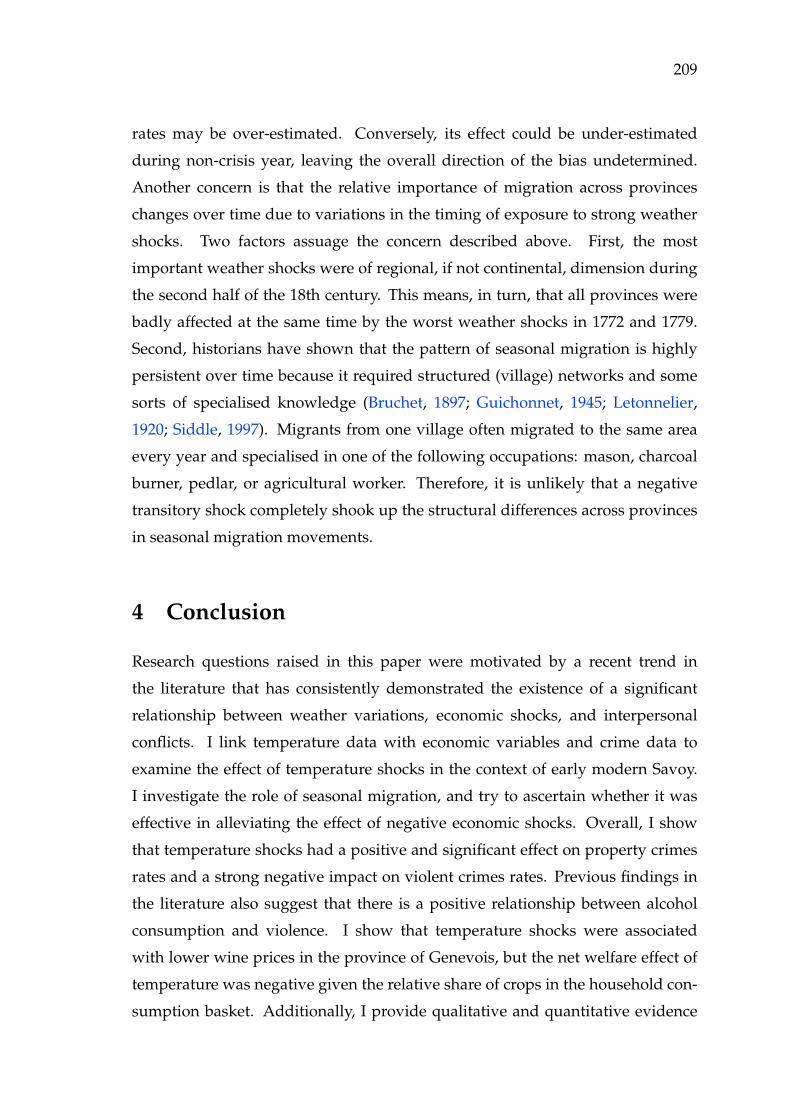
209
rates may be over-estimated. Conversely, its effect could be under-estimated
during non-crisis year, leaving the overall direction of the bias undetermined.
Another concern is that the relative importance of migration across provinces
changes over time due to variations in the timing of exposure to strong weather
shocks. Two factors assuage the concern described above. First, the most
important weather shocks were of regional, if not continental, dimension during
the second half of the 18th century. This means, in turn, that all provinces were
badly affected at the same time by the worst weather shocks in 1772 and 1779.
Second, historians have shown that the pattern of seasonal migration is highly
persistent over time because it required structured (village) networks and some
sorts of specialised knowledge (Bruchet, 1897; Guichonnet, 1945; Letonnelier,
1920; Siddle, 1997). Migrants from one village often migrated to the same area
every year and specialised in one of the following occupations: mason, charcoal
burner, pedlar, or agricultural worker. Therefore, it is unlikely that a negative
transitory shock completely shook up the structural differences across provinces
in seasonal migration movements.
4 Conclusion
Research questions raised in this paper were motivated by a recent trend in
the literature that has consistently demonstrated the existence of a significant
relationship between weather variations, economic shocks, and interpersonal
conflicts. I link temperature data with economic variables and crime data to
examine the effect of temperature shocks in the context of early modern Savoy.
I investigate the role of seasonal migration, and try to ascertain whether it was
effective in alleviating the effect of negative economic shocks. Overall, I show
that temperature shocks had a positive and significant effect on property crimes
rates and a strong negative impact on violent crimes rates. Previous findings in
the literature also suggest that there is a positive relationship between alcohol
consumption and violence. I show that temperature shocks were associated
with lower wine prices in the province of Genevois, but the net welfare effect of
temperature was negative given the relative share of crops in the household con-
sumption basket. Additionally, I provide qualitative and quantitative evidence
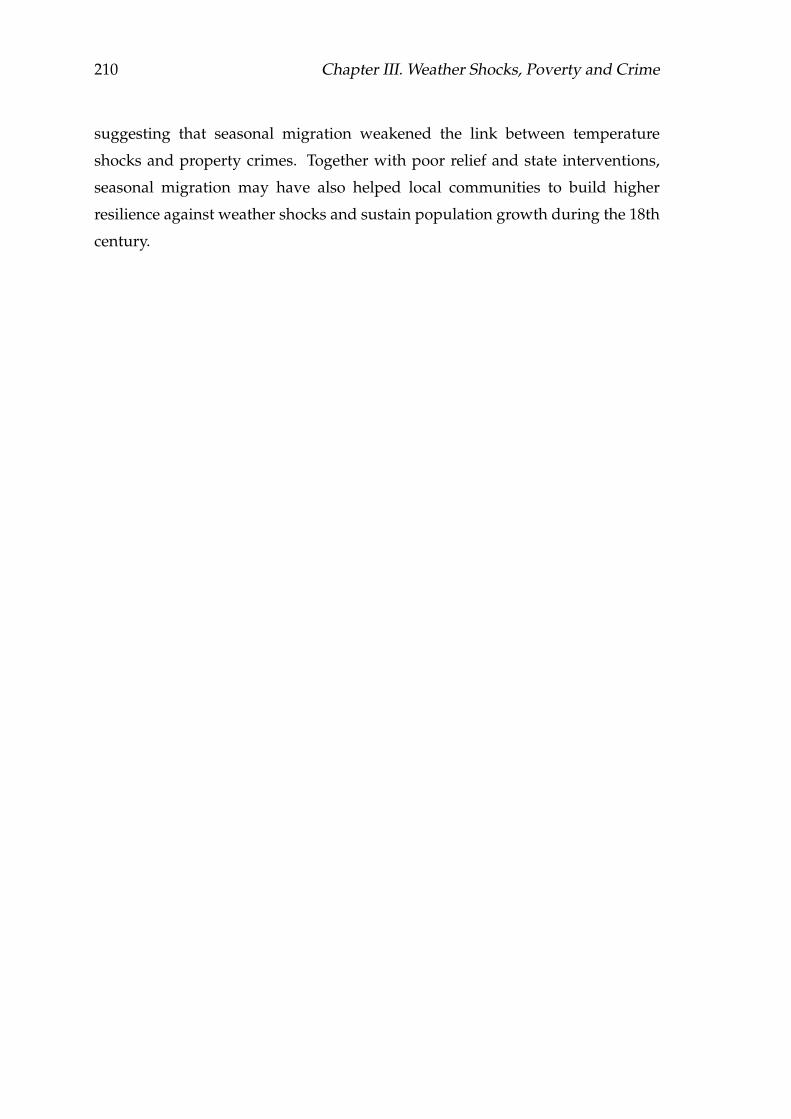
210 Chapter III. Weather Shocks, Poverty and Crime
suggesting that seasonal migration weakened the link between temperature
shocks and property crimes. Together with poor relief and state interventions,
seasonal migration may have also helped local communities to build higher
resilience against weather shocks and sustain population growth during the 18th
century.
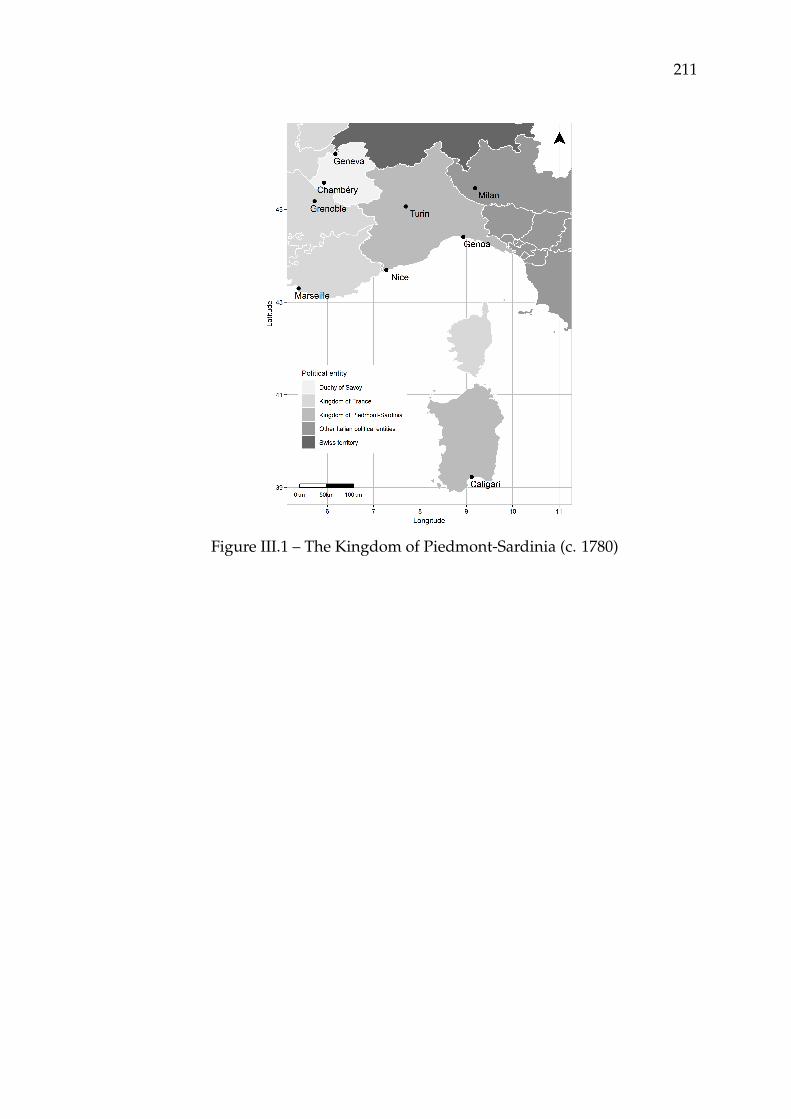
211
Figure III.1 – The Kingdom of Piedmont-Sardinia (c. 1780)

212 Chapter III. Weather Shocks, Poverty and Crime
Figure III.2 – The Duchy of Savoy (c. 1750)
Sources: A.D. Savoie, SA 5420 à SA 5482.
Figure III.3 – Annual number of disasters reported in the Duchy of Savoy (1713–92)
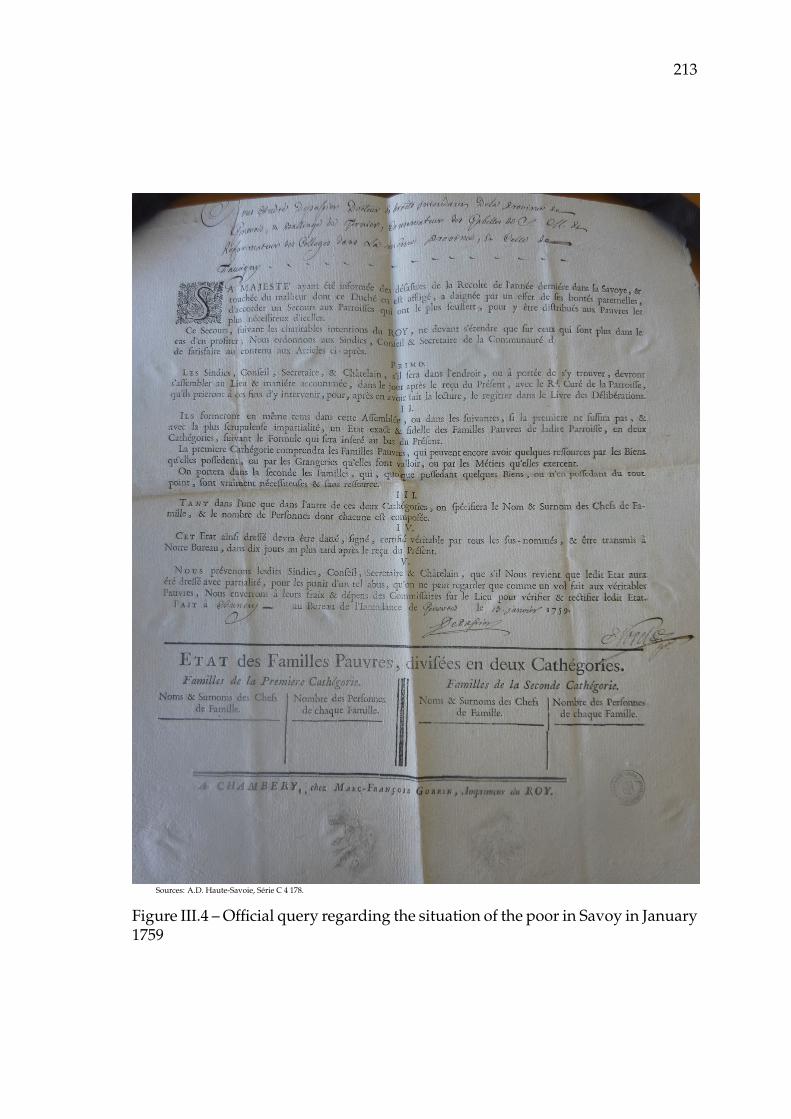
213
Sources: A.D. Haute-Savoie, Série C 4 178.
Figure III.4 – Official query regarding the situation of the poor in Savoy in January1759

214 Chapter III. Weather Shocks, Poverty and Crime
Notes: The dashed lined represented the sum of the seasonal temperature anomalies in Savoyard provinces in any given year. A value close to zero meansthat weather conditions were closed to the long-term mean. To improve readability, I translate all annual values by adding 60. The higher the dashed line,the warmer the year.
Figure III.5 – Total number of property crimes in Savoy (1749–89)
Notes: The dashed lined represented the sum of the seasonal temperature anomalies in Savoyard provinces in any given year. A value close to zero meansthat weather conditions were closed to the long-term mean. To improve readability, I translate all annual values by adding 80. The higher the dashed line,the warmer the year.
Figure III.6 – Total number of property crimes in Savoy (1749–89)
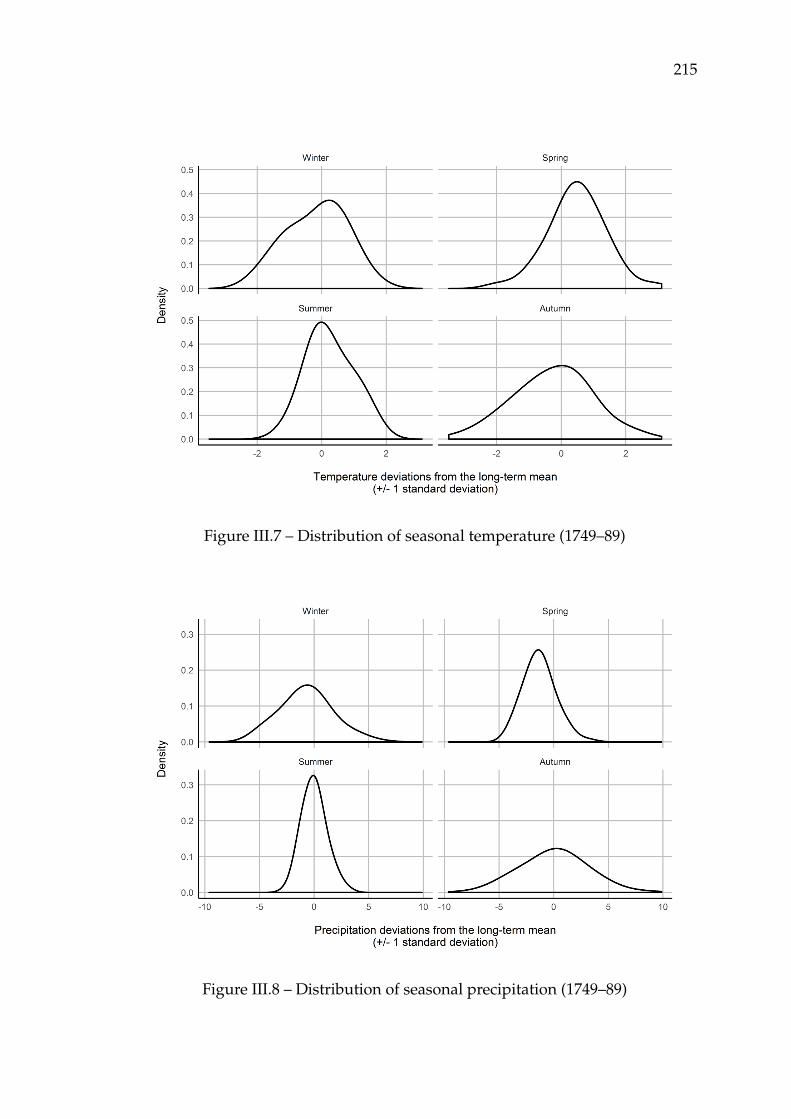
215
Figure III.7 – Distribution of seasonal temperature (1749–89)
Figure III.8 – Distribution of seasonal precipitation (1749–89)

216 Chapter III. Weather Shocks, Poverty and Crime
Figure III.9 – Grape harvest date and summer temperature in Chablais (1688–1794)
Figure III.10 – Grape harvest date and summer temperature in Maurienne (1713–90)
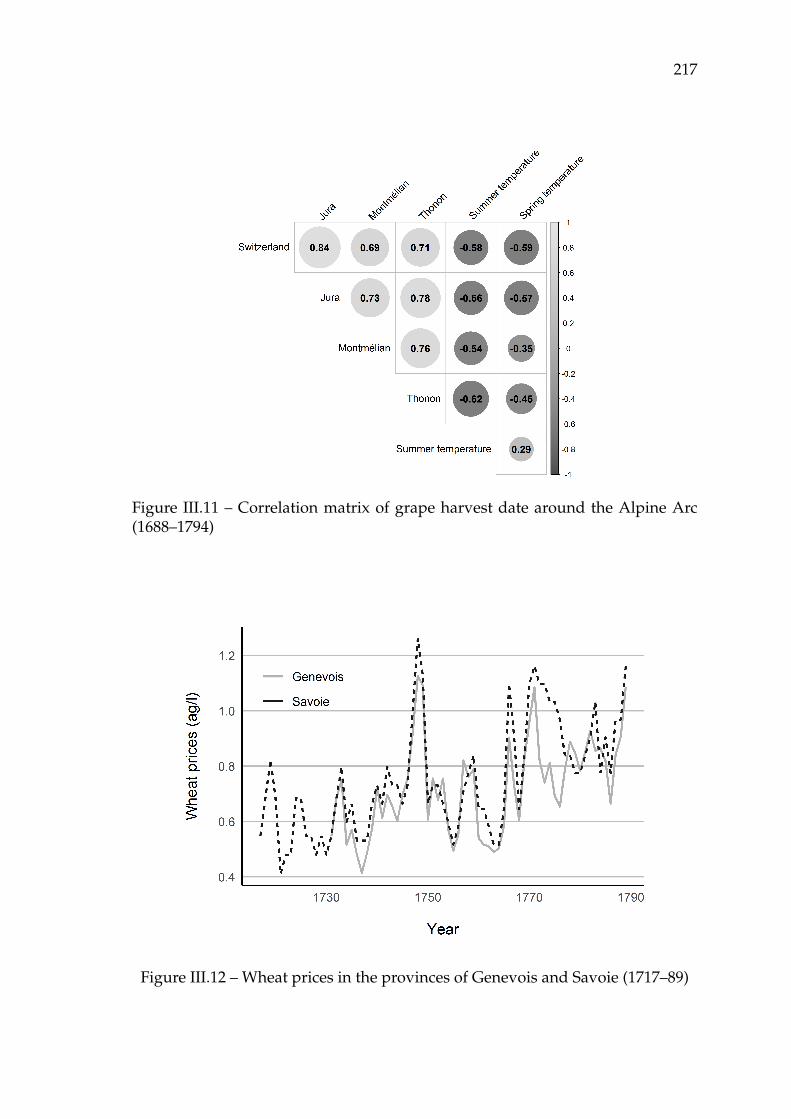
217
Figure III.11 – Correlation matrix of grape harvest date around the Alpine Arc(1688–1794)
Figure III.12 – Wheat prices in the provinces of Genevois and Savoie (1717–89)


219
Table III.1 – Subsistence lifestyle: Baskets of goods in Savoy (c.1780)
QuantityUnit Kcal/unit
Nutriments per dayper year Kcal/day Grams of Protein
Bread 580 kg 2,000 3,200 80Bean 20 kg 1,100 60 4Meat 20 kg 2000 110 11Butter 6 kg 7,500 123 0Cheese 10 kg 3,700 106 6Wine 150 l 700 288 0
Total 3,887 101
Sources: Allen et al. (2011); Becchia et al. (2012); Malanima (2013); Nicolas(1979); Vermale (1911).
Table III.2 – Summary statistics
Statistic N Mean St. Dev. Min Pctl(25) Pctl(75) Max
Crime dataCrime rate per 100,000 966 7.07 8.39 0 1.2 10.0 84Violent crime rate per 100,000 966 3.81 6.00 0 0 5.6 72Property crime rate per 100,000 966 3.27 4.85 -1 0 5.0 70
Weather dataTemperarature anomalies 966 0.08 0.97 -3.49 -0.53 0.72 3.11Precipitation anomalies 966 -0.49 2.19 -9.61 -1.72 0.67 9.88Temperarature (°C) 966 5.80 5.97 -5.70 1.13 9.73 17.30Precipitation (mm) 966 313.15 112.39 32 238.2 392 614Grape harvest date 174 43 8 19 37.2 49 59
Socio-economic dataSeasonal migration rate 6 0.090 0.046 0.036 0.059 0.121 0.155Number of cattle per head 6 0.628 0.095 0.539 0.571 0.660 0.797
Prices dataAnnecy wheat prices (ag/l) 59 0.73 0.17 0.41 0.58 0.83 1.13Chambéry wheat prices (ag/l) 73 0.75 0.20 0.41 0.60 0.84 1.26Annecy red wine prices (ag/l) 49 1.26 0.39 0.69 1.06 1.37 2.39
Population dataPopulation in 1758 6 48,421 25,318 26,999 31,008 57,990.5 92,868Population in 1776 6 57,636 33,052 31,687 34,695.2 67,837.8 117,263Population in 1793 6 66,582 38,287 37,863 41,386 76,471 136,988
Notes: Grape harvest date is expressed as the number of days after the 31 August.
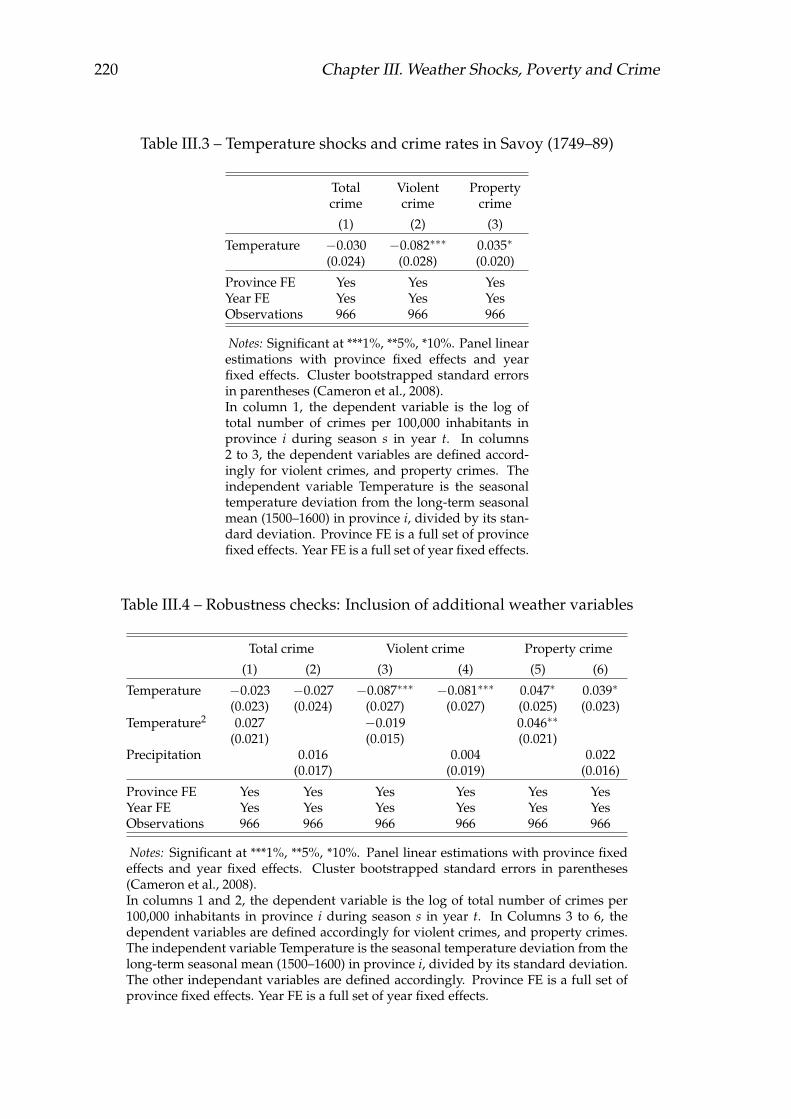
220 Chapter III. Weather Shocks, Poverty and Crime
Table III.3 – Temperature shocks and crime rates in Savoy (1749–89)
Total Violent Propertycrime crime crime
(1) (2) (3)
Temperature −0.030 −0.082∗∗∗ 0.035∗
(0.024) (0.028) (0.020)
Province FE Yes Yes YesYear FE Yes Yes YesObservations 966 966 966
Notes: Significant at ***1%, **5%, *10%. Panel linearestimations with province fixed effects and yearfixed effects. Cluster bootstrapped standard errorsin parentheses (Cameron et al., 2008).In column 1, the dependent variable is the log oftotal number of crimes per 100,000 inhabitants inprovince i during season s in year t. In columns2 to 3, the dependent variables are defined accord-ingly for violent crimes, and property crimes. Theindependent variable Temperature is the seasonaltemperature deviation from the long-term seasonalmean (1500–1600) in province i, divided by its stan-dard deviation. Province FE is a full set of provincefixed effects. Year FE is a full set of year fixed effects.
Table III.4 – Robustness checks: Inclusion of additional weather variables
Total crime Violent crime Property crime
(1) (2) (3) (4) (5) (6)
Temperature −0.023 −0.027 −0.087∗∗∗ −0.081∗∗∗ 0.047∗ 0.039∗
(0.023) (0.024) (0.027) (0.027) (0.025) (0.023)Temperature2 0.027 −0.019 0.046∗∗
(0.021) (0.015) (0.021)Precipitation 0.016 0.004 0.022
(0.017) (0.019) (0.016)
Province FE Yes Yes Yes Yes Yes YesYear FE Yes Yes Yes Yes Yes YesObservations 966 966 966 966 966 966
Notes: Significant at ***1%, **5%, *10%. Panel linear estimations with province fixedeffects and year fixed effects. Cluster bootstrapped standard errors in parentheses(Cameron et al., 2008).In columns 1 and 2, the dependent variable is the log of total number of crimes per100,000 inhabitants in province i during season s in year t. In Columns 3 to 6, thedependent variables are defined accordingly for violent crimes, and property crimes.The independent variable Temperature is the seasonal temperature deviation from thelong-term seasonal mean (1500–1600) in province i, divided by its standard deviation.The other independant variables are defined accordingly. Province FE is a full set ofprovince fixed effects. Year FE is a full set of year fixed effects.
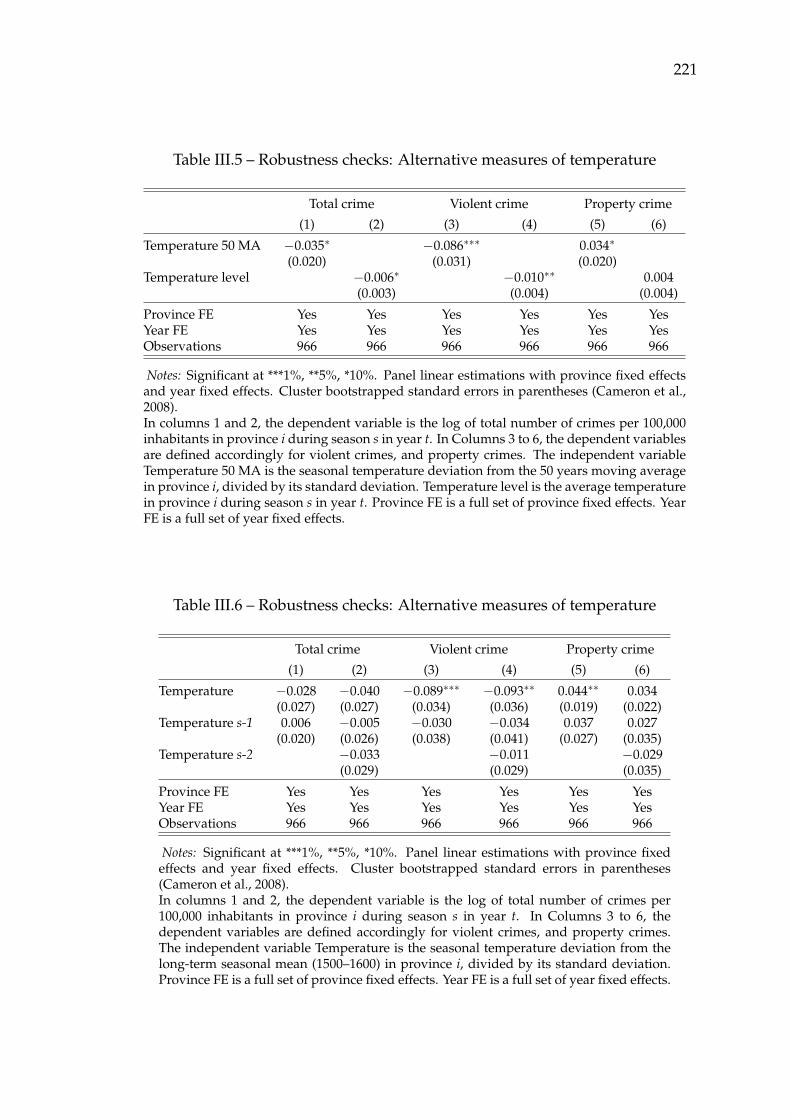
221
Table III.5 – Robustness checks: Alternative measures of temperature
Total crime Violent crime Property crime
(1) (2) (3) (4) (5) (6)
Temperature 50 MA −0.035∗ −0.086∗∗∗ 0.034∗
(0.020) (0.031) (0.020)Temperature level −0.006∗ −0.010∗∗ 0.004
(0.003) (0.004) (0.004)
Province FE Yes Yes Yes Yes Yes YesYear FE Yes Yes Yes Yes Yes YesObservations 966 966 966 966 966 966
Notes: Significant at ***1%, **5%, *10%. Panel linear estimations with province fixed effectsand year fixed effects. Cluster bootstrapped standard errors in parentheses (Cameron et al.,2008).In columns 1 and 2, the dependent variable is the log of total number of crimes per 100,000inhabitants in province i during season s in year t. In Columns 3 to 6, the dependent variablesare defined accordingly for violent crimes, and property crimes. The independent variableTemperature 50 MA is the seasonal temperature deviation from the 50 years moving averagein province i, divided by its standard deviation. Temperature level is the average temperaturein province i during season s in year t. Province FE is a full set of province fixed effects. YearFE is a full set of year fixed effects.
Table III.6 – Robustness checks: Alternative measures of temperature
Total crime Violent crime Property crime
(1) (2) (3) (4) (5) (6)
Temperature −0.028 −0.040 −0.089∗∗∗ −0.093∗∗ 0.044∗∗ 0.034(0.027) (0.027) (0.034) (0.036) (0.019) (0.022)
Temperature s-1 0.006 −0.005 −0.030 −0.034 0.037 0.027(0.020) (0.026) (0.038) (0.041) (0.027) (0.035)
Temperature s-2 −0.033 −0.011 −0.029(0.029) (0.029) (0.035)
Province FE Yes Yes Yes Yes Yes YesYear FE Yes Yes Yes Yes Yes YesObservations 966 966 966 966 966 966
Notes: Significant at ***1%, **5%, *10%. Panel linear estimations with province fixedeffects and year fixed effects. Cluster bootstrapped standard errors in parentheses(Cameron et al., 2008).In columns 1 and 2, the dependent variable is the log of total number of crimes per100,000 inhabitants in province i during season s in year t. In Columns 3 to 6, thedependent variables are defined accordingly for violent crimes, and property crimes.The independent variable Temperature is the seasonal temperature deviation from thelong-term seasonal mean (1500–1600) in province i, divided by its standard deviation.Province FE is a full set of province fixed effects. Year FE is a full set of year fixed effects.

Table III.7 – Robustness checks: Droughts, floods and crime rate in Savoy (1749–89)
Total Violent Propertycrime crime crime
(1) (2) (3)
Droughts 0.088∗∗∗ −0.138∗∗∗ 0.246∗∗∗
(0.032) (0.046) (0.061)Floods 0.021 −0.001 0.078∗∗
(0.066) (0.078) (0.037)
Province FE Yes Yes YesYear FE Yes Yes YesObservations 966 966 966
Notes: Significant at ***1%, **5%, *10%. Panel lin-ear estimations with province fixed effects and yearfixed effects. Cluster bootstrapped standard errors inparentheses (Cameron et al., 2008).In column 1, the dependent variable is the log of totalnumber of crimes per 100,000 inhabitants in provincei during season s in year t. In columns 2 to 3, thedependent variables are defined accordingly for vio-lent crimes, and property crimes. The independentvariable Droughts is a dummy variable equal to oneif seasonal temperature in province i is one standarddeviation or more above the long-term seasonal mean(1500–1600), and zero otherwise. The independentvariable Floods is a dummy variable equal to one ifseasonal precipitation in province i is one standarddeviation or more above the long-term seasonal mean(1500–1600), and zero otherwise. Province FE is a fullset of province fixed effects. Year FE is a full set ofyear fixed effects.
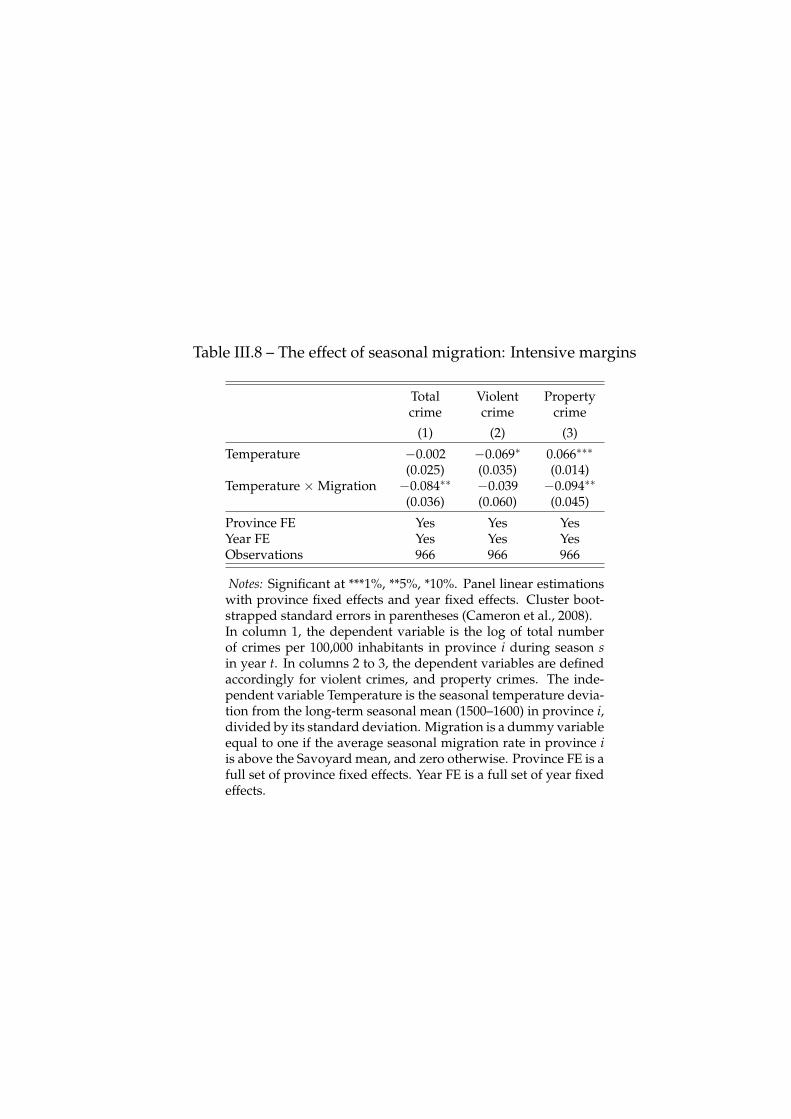
Table III.8 – The effect of seasonal migration: Intensive margins
Total Violent Propertycrime crime crime
(1) (2) (3)
Temperature −0.002 −0.069∗ 0.066∗∗∗
(0.025) (0.035) (0.014)Temperature × Migration −0.084∗∗ −0.039 −0.094∗∗
(0.036) (0.060) (0.045)
Province FE Yes Yes YesYear FE Yes Yes YesObservations 966 966 966
Notes: Significant at ***1%, **5%, *10%. Panel linear estimationswith province fixed effects and year fixed effects. Cluster boot-strapped standard errors in parentheses (Cameron et al., 2008).In column 1, the dependent variable is the log of total numberof crimes per 100,000 inhabitants in province i during season sin year t. In columns 2 to 3, the dependent variables are definedaccordingly for violent crimes, and property crimes. The inde-pendent variable Temperature is the seasonal temperature devia-tion from the long-term seasonal mean (1500–1600) in province i,divided by its standard deviation. Migration is a dummy variableequal to one if the average seasonal migration rate in province iis above the Savoyard mean, and zero otherwise. Province FE is afull set of province fixed effects. Year FE is a full set of year fixedeffects.
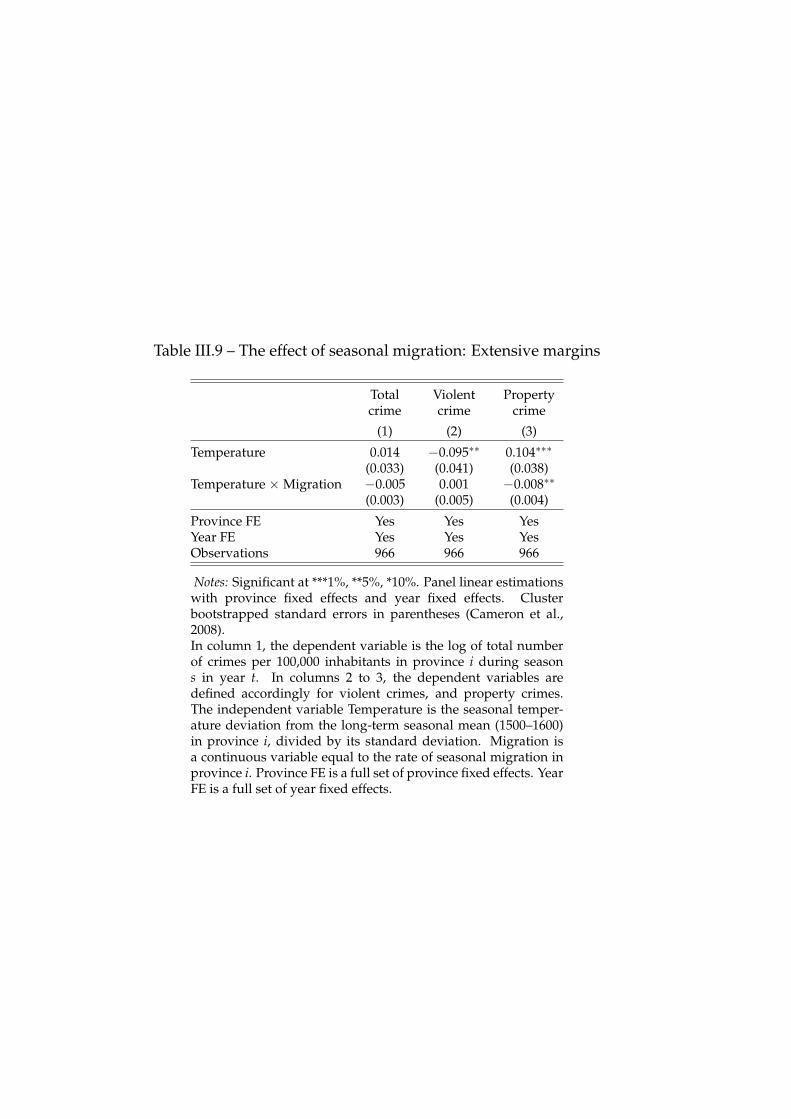
Table III.9 – The effect of seasonal migration: Extensive margins
Total Violent Propertycrime crime crime
(1) (2) (3)
Temperature 0.014 −0.095∗∗ 0.104∗∗∗
(0.033) (0.041) (0.038)Temperature × Migration −0.005 0.001 −0.008∗∗
(0.003) (0.005) (0.004)
Province FE Yes Yes YesYear FE Yes Yes YesObservations 966 966 966
Notes: Significant at ***1%, **5%, *10%. Panel linear estimationswith province fixed effects and year fixed effects. Clusterbootstrapped standard errors in parentheses (Cameron et al.,2008).In column 1, the dependent variable is the log of total numberof crimes per 100,000 inhabitants in province i during seasons in year t. In columns 2 to 3, the dependent variables aredefined accordingly for violent crimes, and property crimes.The independent variable Temperature is the seasonal temper-ature deviation from the long-term seasonal mean (1500–1600)in province i, divided by its standard deviation. Migration isa continuous variable equal to the rate of seasonal migration inprovince i. Province FE is a full set of province fixed effects. YearFE is a full set of year fixed effects.
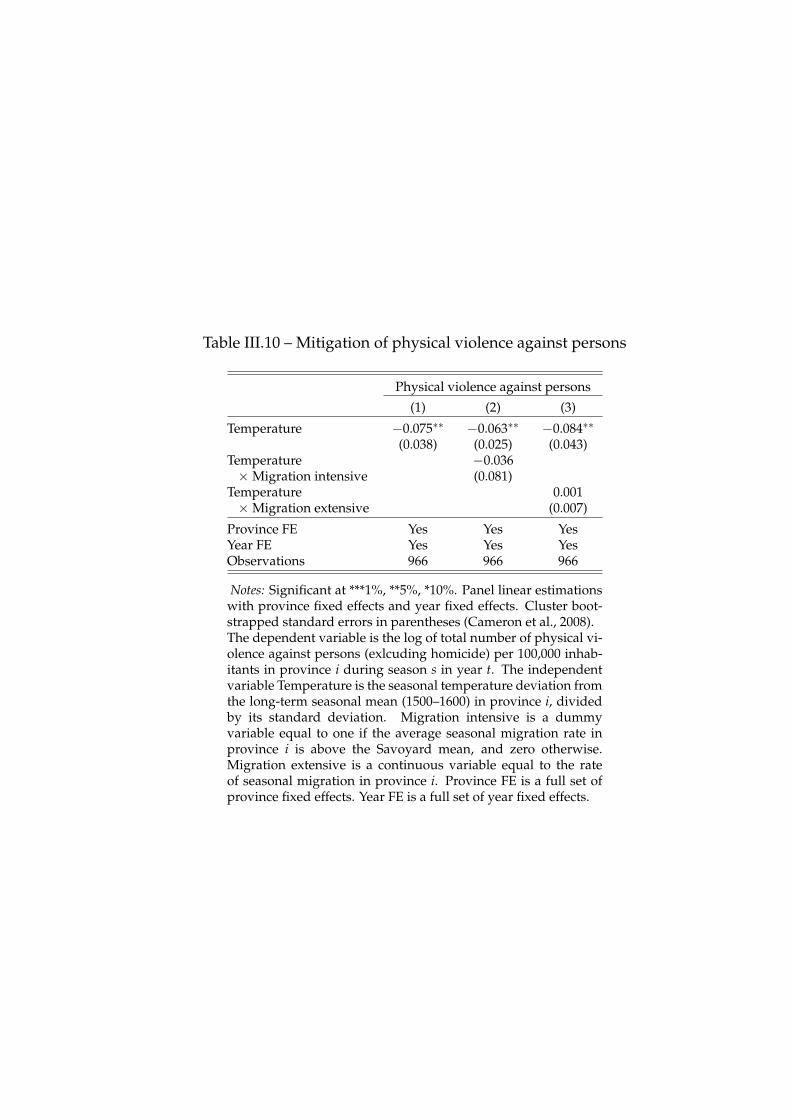
Table III.10 – Mitigation of physical violence against persons
Physical violence against persons
(1) (2) (3)
Temperature −0.075∗∗ −0.063∗∗ −0.084∗∗
(0.038) (0.025) (0.043)Temperature −0.036× Migration intensive (0.081)
Temperature 0.001× Migration extensive (0.007)
Province FE Yes Yes YesYear FE Yes Yes YesObservations 966 966 966
Notes: Significant at ***1%, **5%, *10%. Panel linear estimationswith province fixed effects and year fixed effects. Cluster boot-strapped standard errors in parentheses (Cameron et al., 2008).The dependent variable is the log of total number of physical vi-olence against persons (exlcuding homicide) per 100,000 inhab-itants in province i during season s in year t. The independentvariable Temperature is the seasonal temperature deviation fromthe long-term seasonal mean (1500–1600) in province i, dividedby its standard deviation. Migration intensive is a dummyvariable equal to one if the average seasonal migration rate inprovince i is above the Savoyard mean, and zero otherwise.Migration extensive is a continuous variable equal to the rateof seasonal migration in province i. Province FE is a full set ofprovince fixed effects. Year FE is a full set of year fixed effects.
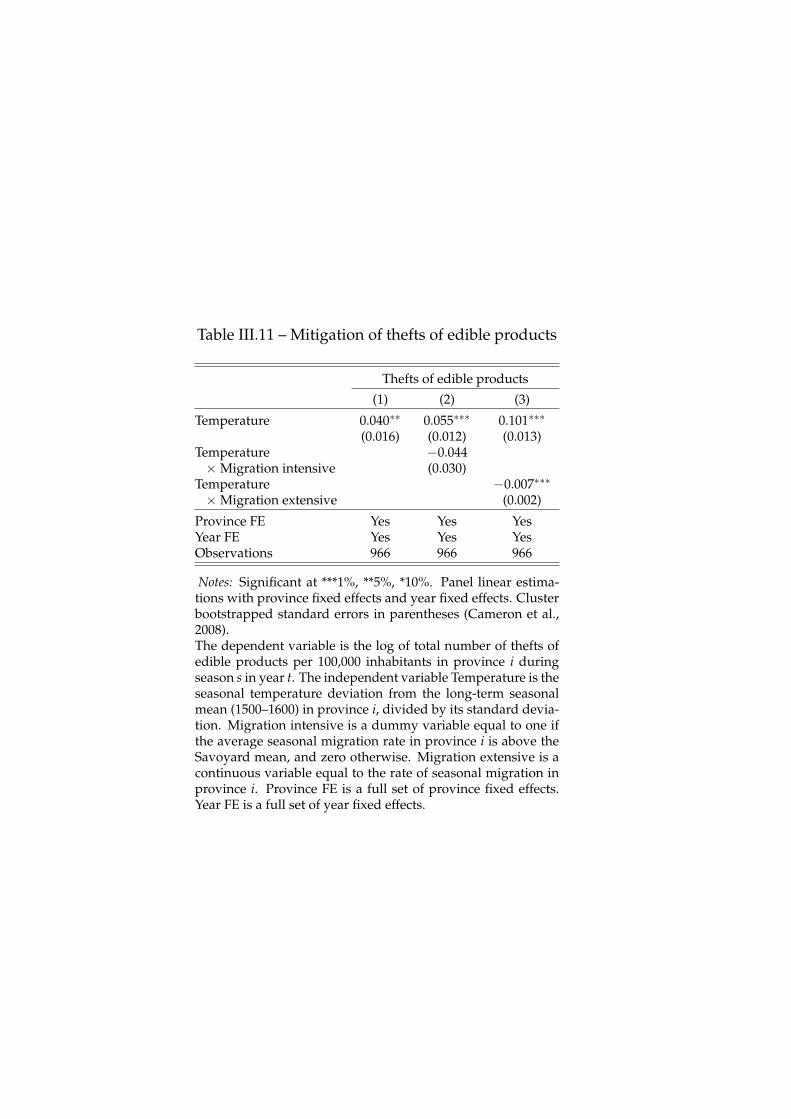
Table III.11 – Mitigation of thefts of edible products
Thefts of edible products
(1) (2) (3)
Temperature 0.040∗∗ 0.055∗∗∗ 0.101∗∗∗
(0.016) (0.012) (0.013)Temperature −0.044× Migration intensive (0.030)
Temperature −0.007∗∗∗
× Migration extensive (0.002)
Province FE Yes Yes YesYear FE Yes Yes YesObservations 966 966 966
Notes: Significant at ***1%, **5%, *10%. Panel linear estima-tions with province fixed effects and year fixed effects. Clusterbootstrapped standard errors in parentheses (Cameron et al.,2008).The dependent variable is the log of total number of thefts ofedible products per 100,000 inhabitants in province i duringseason s in year t. The independent variable Temperature is theseasonal temperature deviation from the long-term seasonalmean (1500–1600) in province i, divided by its standard devia-tion. Migration intensive is a dummy variable equal to one ifthe average seasonal migration rate in province i is above theSavoyard mean, and zero otherwise. Migration extensive is acontinuous variable equal to the rate of seasonal migration inprovince i. Province FE is a full set of province fixed effects.Year FE is a full set of year fixed effects.
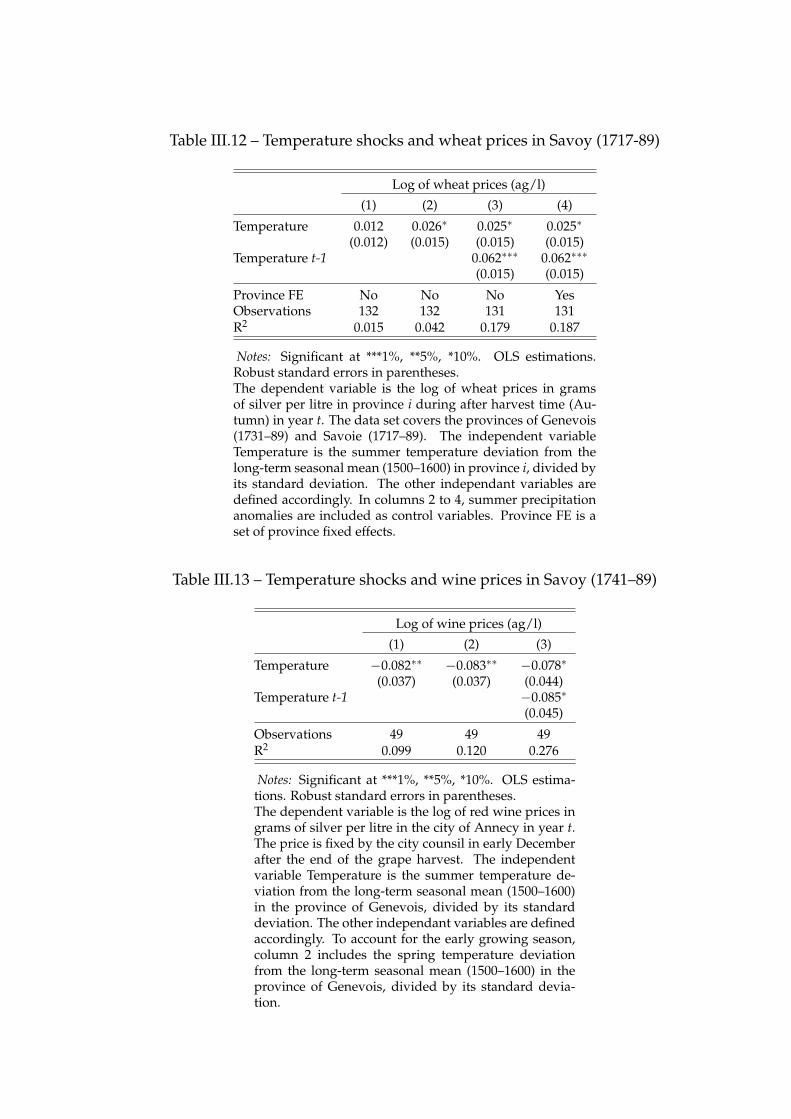
Table III.12 – Temperature shocks and wheat prices in Savoy (1717-89)
Log of wheat prices (ag/l)
(1) (2) (3) (4)
Temperature 0.012 0.026∗ 0.025∗ 0.025∗
(0.012) (0.015) (0.015) (0.015)Temperature t-1 0.062∗∗∗ 0.062∗∗∗
(0.015) (0.015)
Province FE No No No YesObservations 132 132 131 131R2 0.015 0.042 0.179 0.187
Notes: Significant at ***1%, **5%, *10%. OLS estimations.Robust standard errors in parentheses.The dependent variable is the log of wheat prices in gramsof silver per litre in province i during after harvest time (Au-tumn) in year t. The data set covers the provinces of Genevois(1731–89) and Savoie (1717–89). The independent variableTemperature is the summer temperature deviation from thelong-term seasonal mean (1500–1600) in province i, divided byits standard deviation. The other independant variables aredefined accordingly. In columns 2 to 4, summer precipitationanomalies are included as control variables. Province FE is aset of province fixed effects.
Table III.13 – Temperature shocks and wine prices in Savoy (1741–89)
Log of wine prices (ag/l)
(1) (2) (3)
Temperature −0.082∗∗ −0.083∗∗ −0.078∗
(0.037) (0.037) (0.044)Temperature t-1 −0.085∗
(0.045)
Observations 49 49 49R2 0.099 0.120 0.276
Notes: Significant at ***1%, **5%, *10%. OLS estima-tions. Robust standard errors in parentheses.The dependent variable is the log of red wine prices ingrams of silver per litre in the city of Annecy in year t.The price is fixed by the city counsil in early Decemberafter the end of the grape harvest. The independentvariable Temperature is the summer temperature de-viation from the long-term seasonal mean (1500–1600)in the province of Genevois, divided by its standarddeviation. The other independant variables are definedaccordingly. To account for the early growing season,column 2 includes the spring temperature deviationfrom the long-term seasonal mean (1500–1600) in theprovince of Genevois, divided by its standard devia-tion.


Appendix
III.A Fiscal organisation and reforms
Several fiscal reforms contributed to the reduction of the level of inequality within
the society (Nicolas, 1978). The main direct tax was the taille. It was levied
on people and their real estate, whereas the main indirect tax, known as the
gabelle, was an excise tax levied on various goods, including salt, meat, tobacco,
and saltpetre.69 Realised in the 1730s under the supervision of intendants,
the cadastral survey (mappe sarde) provided an opportunity to readjust taxation
level to individual ownership, and to distribute the taxation burden more fairly
between different social groups. Thus, the nobility and the clergy were not
exempted any more from paying taxes, but in a few cases. However, peasant
ownership was relatively widespread in Savoy, and the new tax allocation
led to a significant increase in taxation levels for most of peasant households
(Guichonnet, 1955; Siddle, 1997; Verdo, 2012). The new taxation rate was set
at one-fifth of the harvest minus one seventy-sixth (18.7 per cent). Siddle has
suggested that direct and indirect taxation could have absorbed up to 44 per
cent of the total annual agricultural income in the 1740s. In the following
decades, the progressive abolition of serfdom contributed to the reduction of
that fiscal burden. Serfdom prevailed until the 1760s, and local seigniors used
to levy taxes in cash, kind, and/or labour upon communes. In 1762, the king
69 In November 1560, the provision of salt became a ducal monopoly. On August 19, 1561, an edictfurther stipulated that every adult had to buy 11.4 kg of salt per year from ducal warehouses.Many tax reforms then modified the salt tax until Victor Amadeus II issued the edict of January14, 1720. The edict imposed the obligation to consume a fixed quantity of salt on every personaged over five and their livestocks. One adult had to buy the equivalent of £8 of salt. The taxamounted to £4 for an ox, £8 for a cow, £1 for sheep, and £10 for pigs. Gachet (2002) estimatesthat the salt tax represented about eight per cent of a household’s annual income. From the1720s onward, list of those affected in each parish (consigne) were updated regularly by theadministration to prevent evasion and fraud.
229
230
Charles-Emmanuel III abolished serfdom within his domains, and a decade later
provided an opportunity for peasant communities to emancipate from manorial
rights.70 These reforms alleviated the fiscal burden, and increased the adaptive
capacity of local communities, and reduced their vulnerability to environmental
stress.
70 The edict of 19th December 1771, stipulated that communities had to manifest signs ofwillingness to emancipate, and then to pay negotiated indemnities to local seigniors. By 1792and the invasions of French troops, most of the communities were partially emancipated, so thatthe application of the abolition of feudal rights only benefited few communes (Bruchet, 1908).
231
III.B Other coping mechanisms
III.B.1 Poverty shocks and public assistance
Throughout the 18th century, no comprehensive system of relieving those in
need, like the poor law in England, existed in the duchy Savoy. The Savoyard
system relied on state and municipal interventions as well as permanent institu-
tions run thanks to patronage and religious orders. Figure III.12 displays price
variations of wheat on the markets of Annecy and Chambéry. Because of the
importance of staple crops in the average diet, any increase in prices resulted
in a quasi-immediate decline in living standards, and increase pressure on relief
institutions.
Ruff (1984) shows that deprivation was a major cause of thefts in early modern
France. In particular, wheat price movements deeply affected the poorest, and
correlates with the rate of theft. Elevated food prices made it more difficult for
many households to meet their minimum subsistence needs, leaving thievery
as the only solution for survival.71 Using various population censuses, Nicolas
(1978) finds that between 8 and 13 per cent of the households were recorded
as poor during normal years, but numbers significantly inflated in times of
food shortage. Apart from emigration, another relief was to be found in public
assistance. At the individual level, motivations for charity ranged from spiritual
movements to conflict over family wealth and search for prestige among elite
groups, whereas states authorities’ concerns were twofold: the reduction of
insecurity, and the education of its people (Cavallo, 1995; Fouquet, 1986).72
Municipal authorities ran most of the hospitals and other charity institutions
with the help of various religious orders.73 In 1717, an edict required every
city and town to create either a hospital or an almshouse, and some flourished
after receiving several donations. To make it easier for hospitals and charity
institutions to raise funds, state authorities granted them tax exemptions and
71 The desire for revenge, the willingness to settle property disputes without appealing the law,and professional thievery constituted other motivations to commit thefts.
72 Particularly important at that time was the distinction between the ‘good’ poor who deservedhelp, and the unworthy poor, such as able-bodied beggars, lazy and immoral adults, andsometimes foreigners (Jones, 1989).
73 For a detailed description of public assistance in Savoy, see Bouverat (2013b, 266-310). For acomparison with the system of public assistance in Turin, see Cavallo (1995).
232
made it compulsory for notaries to suggest to testators to make a donation to
such institutions (Fouquet, 1986).74
Only the wealthiest could afford such donations, though, and about one-fifth
of testators actually donated to charity. In Chambéry, the hospitals of Saint-
François et Maché and Charité had an annual income of nearly ten thousand florins
and fifty thousand florins respectively in the early 18th century. They drew
the bulk of their income from private donations, property income, and profits
derived from their workhouses. From the mid-1730s onward, the Hôpital Général
provided outdoor relief to the poor through weekly distributions of bread taking
place every Sunday morning after the Mass (Fouquet, 1986).75 Beside hospitals,
which were mostly dedicated to the assistance of the poor and needy, two other
types of institutions were providing public assistance. Hostel of God (Hôtel-Dieu)
and leprosarium focused on the recovery of the ill, while various religious and
mendicant orders provided alms to the indigent in times of dire need (Palluel-
Guillard, 1963). In 1748, the village of Rumilly experienced a harvest failure.
After visiting the village, the Visitandines noticed that “because of the exorbitant
price of food, numerous poor are suffering”. In the following weeks, the Sisters
provided “potage made of vegetables, dry plums, and flour and distributed it
once or twice a week to a large number of poor looking pitiable, be they were
starving”.76 Similarly, in Moûtiers in 1768, the archbishop set an annual donation
to the hospital amounting to 344 hectolitres of grains, to be distributed to poor
and individuals affected by frost and fires.
In case of emergency caused by famine and epidemics, municipal and state
authorities supplemented the actions of these institutions in the provision of aid
to the poor with additional specific actions. The expansion of bureaucratisation
in the first mid of the 18th century made it easier for them to monitor socio-
economic conditions, and adopt a more interventionist attitude by using anti-
74 The ambition of such scheme was to discourage face-to-face charity, and to direct citizen’scharitable acts towards the municipal system of poor relief. Individuals sometimes bequeathedsubstantial sums of money to charity in their wills. Through the late 1680s, the widow of Mr.Zamondy, a rich merchant from Chambéry, bequeathed the equivalent of 12,300 florins to thehospital of Saint-François et Maché and Charité. In 1775, François Vespre bequeathed £22,000 tothe different hospitals in Chambéry (Palluel-Guillard, 1963).
75 Poor often had to comply with requirements such as attendance at the Mass, participationat funerals, saying prayers at fixed time, and remaining silent during meals, as parts of theeducational effort to redeem themselves.
76 Cited in Bouverat (2013b).

233
dearth measures.
In 1734, misery was so widespread in the province of Savoie after three years
of shortage, that several thousands of poor needed to be provided for. Between
the 25th of April and the 20th June 1734, the city council of Chambéry spent
£6,885 to organise daily distribution of bread and soup at the Hôpital Général.77
A decade later, the king allowed the city council to sell 4,000 bags of wheat
from the military stockpile at reduced prices to mitigate the effect of harvest
failure. In 1771, the city council of Chambéry decided to borrow £22,000 to be
able to import 4,000 bags of wheat from Piedmont. Overall, the sales of wheat to
needy inhabitants amounted to £34,605 that year. In 1778, imports from Geneva
provided enough grains to feed 3,000 individuals in Chambéry and twenty six
surrounding parishes for several weeks (Palluel-Guillard, 1963). In June 1783,
the Laki Craters eruption began and led to the hottest summer in a century, and
caused severe thunderstorms and acid rains damaging crops all over Europe,
leaving the local population under stress. That year, Sébastien Ribbaz bought
on the behalf of the province of Carouges the equivalent of £30,000 of wheat to
provide subsistence for the poor.78
In the province of Chablais, the community secretary of Évian, the notary
Cottet, had to buy 266 bags of wheat from Sardinia to relieve 20 communities.
Abundant snow had delayed the harvest by a month, before a hailstorm caused
serious damage to the crops, and left several of these communities in absolute
misery. On March 30, Cottet further requested the king to loan him £5,000 to
6,000 to buy more grain.79 One month and half later, the minister De Mouroux
wrote to the intendant general in Chambéry to gather information on how
Cottet was using the £4,000 loan he received from the king. In addition, De
Mouroux reminded the intendant the necessity to send grain to Onnion and the
77 A.M. Chambéry, IR 106, carton 1022.78 Cities and towns were generally very active in the provision of assistance. On March 7, 1783,
the city council of Chambéry decided to create a commission to identify families in need in thedifferent neighbourhoods and to distribute them the relief they needed. Since the beginning ofthe 18th century, the city council was also offering annually free apprenticeship to six orphansoriginating from the city, and provided six poor young women with dowries. In Saint-Jean-de-Maurienne, the city council decided in 1758 to offer four hundred livres a year to attract anew physician in town. In following years, several cities, including Carouge, Moûtiers, andTermignon, used similar design to attract new physicians.
79 A.D. Haute-Savoie, Série 1 C, 2 73, pièce 19.
234
surrounding parishes, which needed it to crop their fields.80 In late August 1771,
the city council of Le Biot informed the local intendant that, thanks to the crops
provided in May, they were able to harvest thirty-eight hectolitres of barley and
about ten hectolitres of oat, thus eliminating the risk of famine.81
Municipal and state authorities worked together to cope with the challenges
raised by transitory poverty shocks, and improve the provision of poor relief in
time of distress. Between 1750 and 1789, about fifty episodes of riots occurred
in Savoy, but only five of which were related to the question of subsistence
riots (Nicolas, 1973, 1974). This evidence suggests that the system of relief was
successful in absorbing most of the negative effect of weather-induced poverty
shocks. To document this, I match data on social conflicts from Nicolas (1973,
1974) with measure of temperature shocks by season by year by province. I run
panel regressions with province fixed effects and time fixed effects to estimate
the reduced-form effect of temperature shocks on the onset of social conflicts.82
Table III.14 reports results and suggests that there was no clear statistically
significant relationship between temperature shocks and social conflicts in 18th-
century Savoy. This, in turn, means that either local communities were very
resilient at the aggregate level and did not mean to resort to riots in times of
dire need or Savoyard authorities were able to provide sufficient relief to prevent
the occurrence of popular disorders.
III.B.2 A mixed agro-pastoral system
By the mid-18th century, Savoy was a rural rain-fed agrarian economy with
two distinctive characteristics.83 First, the collective ownership and use of
commons was particularly developed. On average, about 48 per cent of the
total land area was common land, a rate reaching 72 per cent in the mountainous
80 A.D. Haute-Savoie, Série 1 C, 2 73, pièce 29.81 48 coupes and 2 quarts of Thonon, and 12 coupes of Thonon, respectively. A.D. Haute-Savoie,
Série 1 C, 2 73, pièce 229.82 The model estimated is similar to the model estimated in Section 3 of Chapter II.83 Until the early 19th century, the development of industries was very limited in Savoy, but
in Cluses and Faverges, which specialised in watchmaking and paper industry respectively(Armand, 1974, pp. 97-108).
235
provinces of Tarentaise and Maurienne (Guichonnet, 1955, 1969; Nicolas, 1978).84
Common land often constituted a safety net for small landholders and the poor
by providing them with valuable income in the form of pasture, in particular in
time of dire need (Baud, 2010; Bloch, 2015; Scuiller, 2008).85 Second, pastures,
and therefore livestock, occupied a predominant position in the agricultural
landscape. Arable land represented only a third of the agricultural land area,
and pastures about half. The remaining land was occupied by forests, orchards
and vineyards.86
Disparities in agricultural practices, however, existed between lowlands and
uplands where extensive grazing was more readily available (Charbonnier,
2002). In addition, although grass growth diminished with increasing elevation,
the higher exposure to sunshine resulted in higher protein and fat contents.
Milk from upland-grazing animals was thus creamier, and products derived
from it, such as cheese and butter, fatter (Orland, 2004). The composition of
highland pastures also had an impact on both the chemical and the rheological
characteristics of the cheese. Overall, cheese was better in quality parameters
for human nutrition than that produced from milk of indoor fed animals. More
importantly, cheeses produced on mountain pastures were less elastic and less
deformable than those produced with milk from valley pastures. The harder
a cheese was, the longer it could be stored and transported, and therefore, the
higher was its price (Bugaud et al., 2001; Galina et al., 2007).
Lowland farmers could also benefit from these advantages through leasing or
renting out land, but large differences persisted across provinces. On average,
73 per cent of the cattle were herded up to Alpine pastures in summer in the
province of Tarentaise, but only 29 per cent in the province of Savoie (Becchia
84 These figures are extremely high for pre-modern Europe, but not unusual in the Alps. In theneighbouring Briançonnais, collectively-owned pastures represented 70 per cent of the totalland area (Vivier, 1990). In the mid-18th century, between one-tenth and one-sixth of total landarea was commons in France, and about 20 per cent in England (Béaur, 2006; Plack, 2013; Vivierand Corbin, 1998).
85 Every household, however, were not wealthy enough to have livestock. In the area of Beaufort,21 per cent of the 540 households owned no cattle at all in 1763. In Saint-Pierre d’Albigny, one-third of households owned no cattle in 1786 (Becchia et al., 2012; Viallet, 1993). Orland (2004)suggests that the ownership of six to eight cows was already a sign of prosperity. With fourcows, a family usually managed to generate food surplus and to feed one or two pigs (Devosand Grosperrin, 1985).
86 Wheat was cultivated on a third of the arable lands, whereas fallows and other crops and fodderoccupied the remaining two thirds.
236
et al., 2012). However, keeping cattle in stalls also had advantages, such as
easier milk and manure collection, and available fields to plant fodder plants,
like sainfoin. Cattle were usually herded up to highest pastures from late spring
to early fall, after what they were brought to lower altitudinal meadows for a
month before either returning to the barn for winter, or being sold or slaughtered.
Animals were fed through the winter with the hay harvested in lower farming
stages in spring and late fall. Harsh winter, however, reduced the number
of degree days and the amount of available hay, whereas the need for fodder
was higher.87 Upland farmers could then either sell parts of their herd or
buy additional fodder from lowland farmers.88 Thus, in 1770, the intendant of
Chablais reported that, due to the scarcity of fodder, the inhabitants of Belleveaux
were “forced to sell lots of their livestock, which were their unique resources,
leaving them in a regrettable situation [...], as it already happened after the frost of
1740 and 1758”.89 Income derived from the sale of livestock in the neighbouring
cities, mostly Geneva and Turin, was significant. Grillet (1807) indicates that
about 25,000 heads of livestock were sold annually in Turin. That represented
an annual capital inflow of approximately one million livres. Additionally, about
210 tons of butter were also exported to Piedmont every year, and about 25,000
cheese wheels were sold in France and Switzerland.90
More generally, there was on average 0.62 cattle per inhabitant, but up to two
87 During normal years, a cow needed between 25 and 30 trousses of hay, whereas a heifer neededonly 15 trousses. Sheep and goats needed about 5 trousses of hay. A trousse is a unit of weightequal to 85 kg (Tracq, 2000).
88 Another recurrent problem in upland areas was overgrazing. During the 18th and 19thcenturies, the expansion of livestock breeding led to tree loss and deforestation, which fosteredthe occurrence of flooding in lowlands (Crook et al., 2002, 2004). Demographic expansionand the development of mining and metal manufacturing industries in the late 18th centuryincreased local demand for firewood and charcoal, thereby also increasing the pressure onforestry resources (Marston, Bravard and Green, 2003). Interestingly, Crook et al. also suggestthat changes in dietary habits had an impact on woodlands. The spread of potatoes cultivationin the 1770s reduced reliance on chestnuts, a central staple in mountains diets, leading to adecline in the importance of chestnut trees. In 1729, 1766, and 1770, the state enforced newforest regulations, such as the ban of wood exports, in an attempt to reduce the destructionof forests. The possibility of selling wood to sustain a livelihood, absentee landlords, and thedifficulty to exert controls on backward areas, however, rendered these regulations relativelyineffective.
89 A.D. Haute-Savoie, Série 1 C, 2 72, pièces 138.90 On average, one head of cattle cost between £41 and 45 (Becchia et al., 2012). According to
Grillet, in 1792, the total amount of butter exported to Piedmont amounted to 25,000 rups ofPiedmont. The rup of Piedmont is unit of weight equal to 8.544 kg. For a general discussion onthe importance of livestock trading in the Alpine region, see Mathieu (2009, pp. 121–2).
237
times more in places like Saint-Jean-de-Sixt and Grand-Bornan (Becchia et al.,
2012).91 In comparison, England and France had much lower livestock portfolios
in 1750, be there were about 0.14 and 0.32 cattle per capita respectively.92 Even
in the neighbouring province of Dauphiné in France, cattle breeding was not so
central. In the district of Grenoble, there was 0.43 cattle per person in 1748, and,
in the mountainous districts of Queyras and Briançonnais, the rate dropped to
0.28 and 0.27. By offering meat, hides, and dairy products, and the possibility
to quickly adjust one’s wealth portfolio, livestock is a particularly interesting
asset to smooth consumption level over time. In addition, manure, as a natural
fertiliser, helps to replenish nutrients in the soil and to maintain agricultural
yields. Goubert (1960) argues that this set of elements helped individuals to better
cope with climate vicissitudes in mountain pastures areas than in grain-growing
plains.93
To investigate this question, I compare the effect of year-to-year variations in
temperature, a proxy for transitory income shock, in provinces with high level of
livestock breeding to the effect of year-to-year variations in temperature in areas
with little livestock breeding. My regression model is the following:
Crimeist = β1 Temperatureits + β2 Temperatureist
× Livestocki + δi + δt + ǫist
(III.2)
where Crimeits denotes the log of the number of Total crime per 100,000 inhabitants–
respectively Violent crime and Property crime– in province i in season s in year
t. Temperatureits is the seasonal standardised temperature deviation from the
long-term mean (1500–1600) in province i during season s in year t. Livestocki
is (i) a dummy variable equal to one if the average number of livestock heads
per inhabitant in province i is above the Savoyard mean, and zero otherwise
(intensive margins); (ii) a continuous variables equal to the average number of
livestock heads per inhabitant in province i (Extensive margins). δi are province
fixed effects and account for time-invariant province characteristics. δt are year
91 In few villages, like Abondance and Bellevaux, the situation was even more exceptional with810 cattle for 164 inhabitants and 836 cattle for 185 inhabitants, respectively.
92 Clio Infra database: https://www.clio-infra.eu.93 Besides, Nicolas (1978) contends that the least presence of overlordship in uplands also
reduced fiscal pressure and the hindering for agricultural improvements, leaving communitiestheoretically better off than their lowland counterparts.
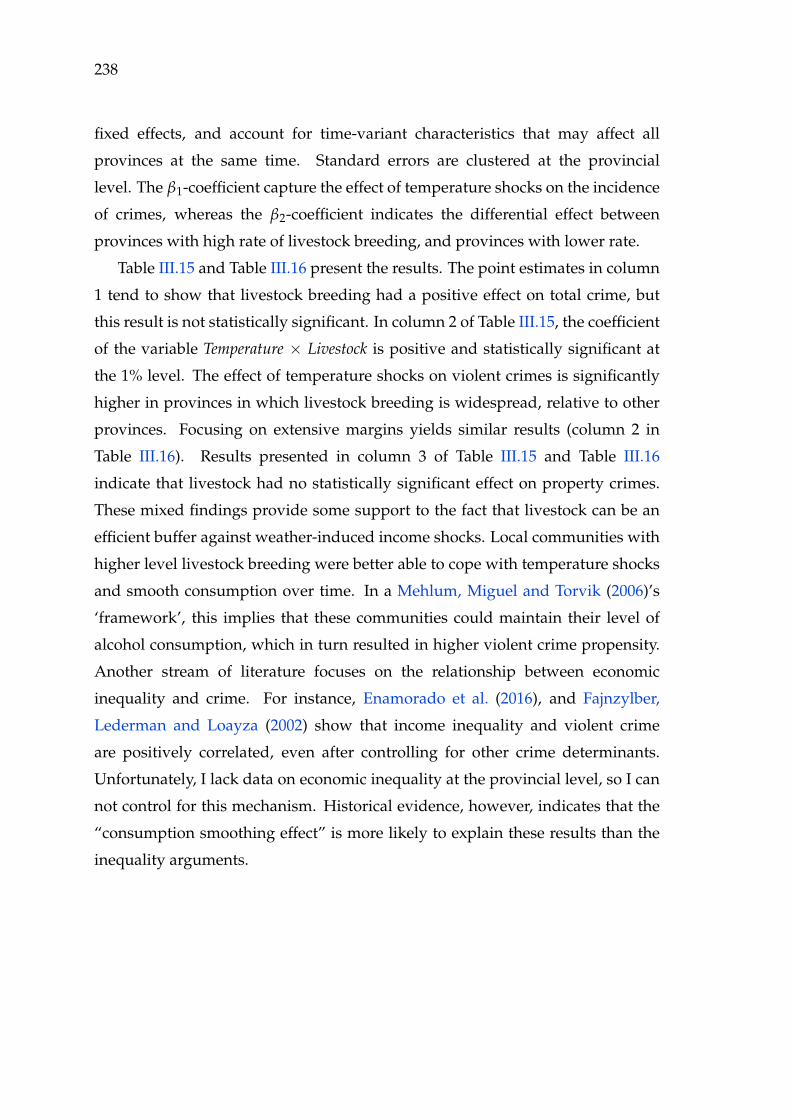
238
fixed effects, and account for time-variant characteristics that may affect all
provinces at the same time. Standard errors are clustered at the provincial
level. The β1-coefficient capture the effect of temperature shocks on the incidence
of crimes, whereas the β2-coefficient indicates the differential effect between
provinces with high rate of livestock breeding, and provinces with lower rate.
Table III.15 and Table III.16 present the results. The point estimates in column
1 tend to show that livestock breeding had a positive effect on total crime, but
this result is not statistically significant. In column 2 of Table III.15, the coefficient
of the variable Temperature × Livestock is positive and statistically significant at
the 1% level. The effect of temperature shocks on violent crimes is significantly
higher in provinces in which livestock breeding is widespread, relative to other
provinces. Focusing on extensive margins yields similar results (column 2 in
Table III.16). Results presented in column 3 of Table III.15 and Table III.16
indicate that livestock had no statistically significant effect on property crimes.
These mixed findings provide some support to the fact that livestock can be an
efficient buffer against weather-induced income shocks. Local communities with
higher level livestock breeding were better able to cope with temperature shocks
and smooth consumption over time. In a Mehlum, Miguel and Torvik (2006)’s
‘framework’, this implies that these communities could maintain their level of
alcohol consumption, which in turn resulted in higher violent crime propensity.
Another stream of literature focuses on the relationship between economic
inequality and crime. For instance, Enamorado et al. (2016), and Fajnzylber,
Lederman and Loayza (2002) show that income inequality and violent crime
are positively correlated, even after controlling for other crime determinants.
Unfortunately, I lack data on economic inequality at the provincial level, so I can
not control for this mechanism. Historical evidence, however, indicates that the
“consumption smoothing effect” is more likely to explain these results than the
inequality arguments.

Table III.14 – Temperature shocks and social conflicts in Savoy (1650–1789)
Full sample Sample 1749–89
Social Subsistence Social Subsistenceconflicts conflicts conflicts conflicts
(1) (2) (3) (4)
Temperature 0.195 −0.142 0.195 −0.142(0.227) (0.134) (0.234) (0.128)
Province FE Yes Yes Yes YesYear FE Yes Yes Yes YesObservations 3,348 3,348 3,348 3,348
Mean DV 4.87 0.36 7.66 0.62
Notes: Significant at ***1%, **5%, *10%. Panel linear estimations withprovince fixed effects and year fixed effects. Cluster bootstrappedstandard errors in parentheses (Cameron et al., 2008).In column 1, the dependent variable equals 100 if at least one socialconflict occurred in province i during season s in year t, and zerootherwise. In columns 2 to 5, the other dependent variables aredefined accordingly for subsistence-related conflict, fiscal conflict,conflict against state authorities, and other types of conflict. In PanelB, dependent variables are defined accordingly, but are restricted toconflicts involving more than fifty individuals. The independentvariable Temperature is the seasonal temperature deviation from thelong-term seasonal mean (1500–1600) in province i, divided by itsstandards deviation. Province FE is a full set of province fixed effects.Year FE is a full set of year fixed effects.
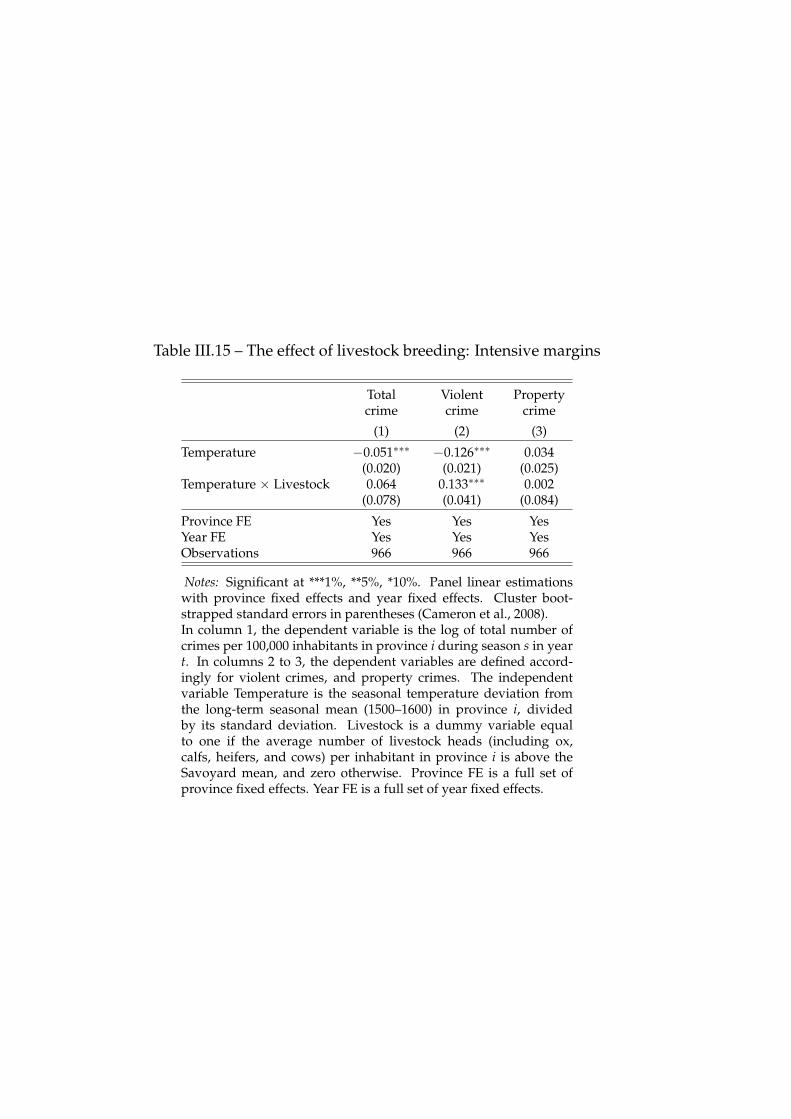
Table III.15 – The effect of livestock breeding: Intensive margins
Total Violent Propertycrime crime crime
(1) (2) (3)
Temperature −0.051∗∗∗ −0.126∗∗∗ 0.034(0.020) (0.021) (0.025)
Temperature × Livestock 0.064 0.133∗∗∗ 0.002(0.078) (0.041) (0.084)
Province FE Yes Yes YesYear FE Yes Yes YesObservations 966 966 966
Notes: Significant at ***1%, **5%, *10%. Panel linear estimationswith province fixed effects and year fixed effects. Cluster boot-strapped standard errors in parentheses (Cameron et al., 2008).In column 1, the dependent variable is the log of total number ofcrimes per 100,000 inhabitants in province i during season s in yeart. In columns 2 to 3, the dependent variables are defined accord-ingly for violent crimes, and property crimes. The independentvariable Temperature is the seasonal temperature deviation fromthe long-term seasonal mean (1500–1600) in province i, dividedby its standard deviation. Livestock is a dummy variable equalto one if the average number of livestock heads (including ox,calfs, heifers, and cows) per inhabitant in province i is above theSavoyard mean, and zero otherwise. Province FE is a full set ofprovince fixed effects. Year FE is a full set of year fixed effects.
Table III.16 – The effect of livestock breeding: Extensive margins
Total Violent Propertycrime crime crime
(1) (2) (3)
Temperature −0.057 −0.425∗∗∗ 0.224(0.200) (0.139) (0.180)
Temperature × Livestock 0.043 0.547∗∗ −0.300(0.336) (0.249) (0.293)
Province FE Yes Yes YesYear FE Yes Yes YesObservations 966 966 966
Notes: Significant at ***1%, **5%, *10%. Panel linear estimationswith province fixed effects and year fixed effects. Clusterbootstrapped standard errors in parentheses (Cameron et al.,2008).In column 1, the dependent variable is the log of total numberof crimes per 100,000 inhabitants in province i during seasons in year t. In columns 2 to 3, the dependent variables aredefined accordingly for violent crimes, and property crimes. Theindependent variable Temperature is the seasonal temperaturedeviation from the long-term seasonal mean (1500–1600) inprovince i, divided by its standard deviation. Livestock is a con-tinuous variable equal to the rate livestock heads (including ox,calfs, heifers, and cows) per inhabitant in province i. ProvinceFE is a full set of province fixed effects. Year FE is a full set ofyear fixed effects.

Chapter IV
Was Louis XIV Wrong?Socio-Economic Consequences ofProtestantism in Early ModernFrance
In recent years, the effect of religion, and more broadly of cultural values, on
economic performance has attracted much attention in the public debate and
the scientific literature.1 Relatedly, a growing literature has sought to identify
the causes of the adoption of the Reformation and to revisit Max Weber’s
theory linking Protestant ethic and economic growth. These studies use the
social, economic, and institutional disruptions brought by the Reformation in
the Holy Roman Empire (HRE) to connect the spread of Protestantism to the
evolution of human capital, the reallocation of economic resources, innovation,
political mobilisation and governance, intrapersonal violence (suicide), and the
persistence of cultural values (see Becker, Pfaff and Rubin (2016) for a literature
survey).2 Becker, Pfaff and Rubin (2016, p. 3) point out that “the HRE is just
one case”, which questions whether these empirical findings can be generalised
1 See Iyer (2016) and Spolaore and Wacziarg (2013) for literature surveys.2 In October 1517, Luther published his Ninety-five theses to criticise the selling of plenary
indulgences– a payment to the Catholic Church that purchased an exemption from punishmentfor some types of sins. Reformers hoped to change the civic constitution of society anddemanded profound transformations in liturgy and religious teaching. To most historians,this event symbolises the beginning of the Protestant Reformation and emerges as an epoch-marking moment in European history. Dixon (2017) provides some useful explanations ofwhy the publication of the Ninety-five theses remains as the defining moment in early modernReformation history.
243
244 Chapter IV. Was Louis XIV Wrong?
to other settings.3 To my knowledge, no research examines the causes and
consequences of Protestantism in early modern France. I address these questions
as follows.
First, I document the effect of demand- and supply-side factors on the
diffusion of Protestantism from the 1550s onward.4 Ekelund, Hébert and Tollison
(2006) argue that, prior to the Reformation, the Catholic church can be considered
as a monopolistic firm providing religious services. In towns where the level of
spiritual services was high, individuals had lower incitations to chose another
firm to supply those services. Funded by legacies from wealthy testators,
collegiate churches were churches where canons would maintain a daily office of
worship and masses, and sometimes offered charity for the local population.5 I
collect data on the location of collegiate churches in 1520, and other demand- and
supply-side factors that could affect the diffusion of Protestantism.6 I match this
data set with information on strength of Protestantism at the city-level in 1567.
I geocode all Protestant temples listed in Mours (1958) and I calculate for every
town the number of Protestant temples within 20 km of the city centre in 1567.7
My analysis focuses on a set of 99 French towns derived from Bosker, Buringh
and Van Zanden (2013). I show that towns with more collegiate churches, a proxy
for the provision of religious services, in 1520 were less likely to host a Protestant
3 Becker, Pfaff and Rubin (2016, p. 22) further note that “We suspect that more research isfeasible using micro-regional data from England and Scotland, the Netherlands, Poland,and the Austro-Hungarian Empire, all of which ended up, during or after the Reformationperiod, with sizeable populations of different confessional groups. Some of these regions hadnatural experiments imposed upon them by border changes, forced population movements, orCommunist governments, any of which might be useful for causal identification of outcomes”.
4 Treasure (2013) notes that French Protestantism was mainly Calvinist and responded to timeand spatial dynamics distinct from the Lutheran movement. In particular, Protestantism reallygained strength from the 1550s onward and reached its peak before the start of the second Warof Religion. By 1567, there were about 1,000 Reformed churches scattered across the kingdom.French Protestants (Huguenots) then amounted to approximately 10 per cent of the population.Various factors would attract members of different social groups to the ideas of the Reformation:grievances against the clergy’s tax exemption, martyrdom, patronage, the actions of pastorsfrom Geneva, adverse economic conditions, printing presses, and the power of the evangelicalmessage.
5 Collegiate churches were thus very similar in spirit to the English chantry foundations, whichprovided an endowment for the purpose of employing priests to sing masses to benefit the soulsof deceased persons.
6 The COLÉMON database aims at establishing the corpus of monasteries and collegiate churchesof France between 816 and 1563.
7 In 1562, the Edict of Saint-Germain recognised the existence of Huguenots and granted them toright to worship publicly outside of towns. Many temples were thus located in the suburb or ina neighbouring village. See Section 2.1 for more details.
245
temple in 1567. On average, every additional collegiate church resulted in 0.3 less
Protestant temple.
Additionally, I show that printing presses tend to be negative associated,
albeit not systematically, with the likelihood to house a Protestant temple. This
result contradicts previous evidence on the role of printing presses (Rubin, 2014),
but is consistent with historical evidence. During the first half of the 16th century,
many laws and edicts limited the diffusion of Protestants materials, so that
most of the production of Protestant books and pamphlets came from Geneva.
The repressive framework against heretical books and their printers meant that
Catholics could benefit more easily from printing presses to defend and diffuse
their ideas. This interpretation is in line with Dittmar and Seabold (2015) who
show that printing press played an important role in the diffusion of ideas and
the spread of Protestantism in cities with competitive media markets, but not in
cities with media monopolies.
Second, I examine the socio-economic consequences of Protestantism in the
short- and medium-run. In the wake of Weber’s thesis, many scholars have
associated Protestantism to the rise of modern capitalism in Western Europe
and seek to establish if the relationship between the characteristics attributed to
Protestantism– e.g. hard work, increased saving, human capital– and economic
growth is robust (Iyer, 2016).8 Following Becker and Woessmann (2009), I
investigate the association between Protestantism and the literacy rate in the
late 17th century (1686–90) and the late 18th century (1786–90). During the 17th
century, many Protestant schools were created as a mean of spreading literate
and religious education, a central principal of Protestant beliefs.9 I collect data
on Huguenots population estimates circa 1670 at the department level (Benedict,
1991; Mours, 1958). By ending toleration, the revocation of the Edict of Nantes
in 1685 triggered an unprecedented exodus in French history: approximately
150,000 to 200,000 Huguenots decided to flee persecutions and forced conversions
8 Delacroix and Nielsen (2001) provide a critical view on the relationship between Protestantismand the rise of modern capitalism in Western Europe. Using cross-country analysis, they showthat Protestantism is not positively associated with societal indicators of industrial capitalistdevelopment in the 19th century. These indicators include the total wealth per capita in 1890,the year of founding of principal stock exchange, the extension of railroads network in 1870 and1890, and the percentage of male labour force in industry circa 1870. See also (Andersen et al.,2017; Hoffman, 2006, pp. 82–4).
9 See, for instance, Astoul (1996, 1999).
246 Chapter IV. Was Louis XIV Wrong?
and sought refuge in neighbouring Protestant countries, including Switzerland,
Prussia, the Netherlands and England.10 To document the magnitude of the
population loss occurring after 1685, I complement these data with a new data
set on the estimated share of Huguenots who sought refuge abroad at the
department level.11 I construct this data set from the Refuge Huguenots database
assembled by Magdelaine (2014). I collect information on the place of origin
of all Huguenot refugees when it was available (about 60,000 observations) and
match it with modern day location to associate each refugee with a department.
I merged these data with information on the share of grooms who signed their
marriage certificates in 1686–90 and 1786–90 (Statistique Générale de France).
Using cross-sectional and panel data analyses, I find a positive and significant
relationship between Protestantism and the literacy rate of males. Increasing the
share of Huguenots in a department by one percentage point increased the male
literacy rate by 1.8 per cent in 1686–90. The result is consistent with the fact
that Protestantism had a strong effect on literacy because it explicitly favoured
schooling and the reading of Bible. The relationship is driven by departments
where the share of Huguenots in total population was high (i.e. larger than 10
per cent). The revocation of the Edict of Nantes ended tolerance and prevented
Huguenots from maintaining schools. Public worship was forbidden. Yet, many
Huguenots remained faithful to their religion and continued to pray and read the
Bible at home (Cabanel, 2012). I find that the effect of Protestantism on the male
literacy persisted throughout the 18th century, although its magnitude is lower. I
document that this relationship is partially driven by the effect of the population
loss associated with the exodus of Huguenots refugees after 1685. The effect of
Protestantism on literacy is lower in departments in which the share of Huguenot
refugees was above the national mean.
10 In 1598, the Edict of Nantes put an end to religious wars and granted the Huguenots freedom ofworship in approximately 150 towns and on the estates of Protestant landowners. Huguenotswere permitted to inherit property, engage in trade, attend all schools and universities. Addi-tional secret articles contained in the edict constrained the government to pay the Protestantpastors and the school teachers, and subsidise the garrisons in Protestant towns.
11 Within a few years, France lost about one per cent of its population, but the population lossdrastically varied across regions. For instance, Huguenots were nearly absent in the province ofBrittany, but represented, sometimes, more than half of the population in towns and villageslocated within a crescent stretching from Lyon to La Rochelle (Cabanel, 2012). After theRevocation, many communities in this area faced population losses of thousands of inhabitants,amounting to roughly 5 to 15 per cent of their pre-1685 population.
247
Many contemporaries and historians of the Reform attributed the French
economic slowdown at the turn of the 18th century to the persecutions and the
exodus of Protestants. The flight of Huguenots merchants would have disorgan-
ised the French economy and disrupted the trade networks. However, there is
little empirical evidence to support this claim (Scoville, 1953, 1960).12 I study
the short-term economic effect of Huguenots out migration by investigating its
impact on the level of crop prices and the likelihood social conflicts between 1670
and 1700. I compare relative changes in prices for department with a high share of
Huguenot refugees, controlling for geographic characteristics and the initial share
of Huguenots. I find no statistically significant difference in wheat prices between
departments with a high share of Huguenot refugees and those with a low share
of Huguenot refugees. Scoville (1960) reports historical evidence suggesting
that the departure of Huguenots could have a disruptive impact on agricultural
output because large portions of land remained temporarily uncultivated. My
results indicate that the shock created by the exile of Huguenots was not large
enough to have any effect at the departmental level on the supply of grains.13
In addition, a fading economy would reduce the opportunity cost of engaging
in conflict by diminishing real wages. I show, on the contrary, that there were
relatively less subsistence-related conflicts, such as food riots, in departments
with a high share of Huguenots refugees. This evidence suggest that, ceteris
paribus, local communities were better able to cope with harvest failure and
weather shocks in these departments, possibly because output per capita was,
at least temporarily, higher.14
Related literature. My work contributes to the growing literature in Economics
on the historical determinants of the spread of Protestantism. Wurpts, Corcoran
and Pfaff (2018) use network analysis to show that strong social ties between
12 For instance, in 1677, Paul Hay du Chastelet wrote that “I do not think that we should compelProtestants to leave France, as Spain did with Moriscos and whose decision was then sodetrimental to the whole country” (cited in Yardeni, 1993, p. 80).
13 I use data on wheat prices after the end of the harvest to reflect as much as possible the level ofharvest fluctuations. Market integration was rather limited during the 17th century and, in theshort-run, hardly smoothed the effect of harvest failure on prices.
14 If agricultural output remained quite stable after the departure of Huguenots or at least declinedless rapidly than the local population, then individuals who decided to stay were relativelybetter off than their counterparts in departments in which no out-migration took place.
248 Chapter IV. Was Louis XIV Wrong?
Hansa towns, measured by the frequency of their participation to Hansa Diets,
eased the diffusion of evangelical ideas and increased the odds to adopt the
Reform. Rubin (2014) investigates the role the printing press, which was a power
source of information transmission, and shows that cities with a printing press
by 1500 were more likely to be Protestant by 1600.15 Cantoni (2012) shows
that the likelihood a ruler adopted the Reformation was positively correlated
with the fraction of neighbouring princes who already adopted the Reformation
because it reduces the risk of introducing the new faith. In particular, the distance
from Wittenberg, the city where Martin Luther taught but also the siege of the
Electorate of Saxony– a powerful state and early adopter of the Reformation–
influences rulers’ denominational choice: increasing a territory’s distance to
Wittenberg significantly reduced its likelihood to embrace the Reformation.
Focusing on the role of cultural factors, Pfaff (2013) studies how the number of
saints shrines in a city could influence the likelihood of adopting the Reformation.
Pfaff posits that a greater presence of local saints shines in a city was associated
with a greater integration of population into the Catholic order, which in turns
reduced the demand for religious changes. Empirical evidence suggests that the
likelihood to abolish the Catholic mass in a city, an indicator for the spread of
the Reformation, was lower in cities with higher number of saint shrines per
capita. Similarly, Barro and McCleary (2016) suggest that the Catholic Church
used saint-making as a strategic device to inspire more intense religiosity and to
compete with Protestantism prior to the ending of the European religious warfare
in 1648. I contribute to this literature by documenting the role of socio-economic
and cultural factors in the spread of Protestantism in France. I show that the odds
of adopting Protestantism was lower in cities housing more collegiate churches.
This result provides additional empirical ground to the idea that cultural factors
may have been of equal importance to political-economic factors in the spread of
the Reformation.
This chapter also contributes to a prior literature that examines the socio-
economic consequences of the Reformation. For instance, Boppart, Falkinger
and Grossmann (2014) find that, in the late 19th century, Swiss Protestants
15 Pre-printing literacy rates could be correlated with the acceptance of both the press andReformation. To address omitted variable biases, Rubin follows Dittmar (2011) and exploitdistance from Mainz, the birthplace of printing, as an instrument for adoption.

249
were more likely to invest and perform better in reading skills, but also in all
other educational fields, than Swiss Catholics. Similarly, Becker and Woessmann
(2009, 2010) show that Protestantism had a strong effect on the literacy rate
in 19th-century Prussia. Becker and Woessmann (2010) further document that
Protestantism had a positive and significant effect on economic performance in
the long-run. Per capita income taxes and service-sector share were significantly
higher in Protestant counties than in Catholic counties. Rubin (2017) argues that
Protestantism influenced long run economic development through the shift of the
balance of institutional power rather the tenets of Protestantism. In particular,
Reformation reduced the power of religious elites and increased the power of
secular and economic elites, which facilitated the set up of institutions favourable
to economic growth. Similarly, Cantoni, Dittmar and Yuchtman (2018) document
how the introduction of religious competition during the Reformation led to
the reallocation of economic resources from religious uses to secular purposes.
Religious competition shifted the allocation of upper-tail human capital toward
more secular human capital and increased the likelihood of Protestant university
graduates sorting into administrative positions across sectors of employment and
capital investment, and contributed to secularisation.16 Dittmar and Meisenzahl
(2016) document how Protestantism was associated with higher economic devel-
opment in the long-run in cities where it contributed to political and institutional
changes, but not in other cities. These changes drove the expansion in the
provision of public goods, such as social welfare and public education. They
further show that the adoption of these public goods institutions had a positive
and significant effect on the level upper tail human capital and city growth
in the long-run.17 These findings relate to recent research by Squicciarini and
Voigtländer (2015) who show that upper-tail knowledge increased productivity
in innovative industrial technology, which in turn fostered city growth in 18th-
and 19th-century France. To my knowledge, there is little empirical evidence on
the effect of Protestantism in France. This chapter contributes to this stream of
literature by examining the effect of Protestantism on the literacy rate of males
16 After the Reformation, there were also less construction of churches and more construction ofsecular buildings in Protestant territories than Catholic territories.
17 These results are consistent with Cantoni’s 2015 findings. Using a sample of 272 cities spanningover 1300–1900, Cantoni shows that, on average, Protestantism had no effect on city growth.
250 Chapter IV. Was Louis XIV Wrong?
at the end of the 17th and 18th centuries. A higher share of Huguenots in the
department’s population in 1670 is associated with higher literacy rate in 1686–
90 and 1786–90.18
My work is also related to the literature on the economic consequences of
historical episodes of forced migration. Hornung (2014) examines the effect of
the revocation of the Edict of Nantes in 1685, and the resulting flights of French
Huguenots, on the productivity of the Prussian textile manufacturing sectors.
A higher share of Huguenots in the town’s population in 1700 led to higher
productivity and higher output in textile manufacturing in 1802.19 In a subse-
quent paper, Hornung (Forthcoming) shows that, within Berlin, complementaries
emerged from the reception of several waves of refugees, including Huguenots
and Bohemians. Changes in ethnic diversity in a district are associated with
an increase in the employment of looms in textile production. Focusing on the
economic consequences in sending country, Arbatli and Gokmen (2016) study
the long-term economic consequences of the expulsion of Armenian and Greek
communities– two high-skilled minorities– from the Ottoman Empire in the early
20th century. Districts with initial higher share of Armenian and Greek minorities
have higher population density, higher urbanisation rate and higher light density
today. Arbatli and Gokmen show that this result is driven by the persistent
influence of the higher rates of human and physical capital accumulation among
the non-Muslim subjects prior to their expulsion. In 1609, the Spanish Crown
decided to expel its Muslim minority, the Moriscos. Within few months 300,000
Moriscos left Spain. Chaney and Hornbeck (2016) investigate the economic con-
sequences of the expulsion of Moriscos by focusing on the Kingdom of Valencia,
which lost 130,000 Moriscos, or about one-third of its pre-expulsion population.
The expulsion of Moriscos had long-lasting effects on population and output per
capita. After 1609, former-Morisco districts experienced substantial decline in
population, but relative increases in output per capita until convergence occurred
with former-Christian districts in late 18th century. I add to this literature by
investigating the effects of the revocation of the Edict of Nantes in 1685. After
18 For an overview of the recent French historiography on the relationship between Protestantismand eduction, see Krumenacker (2014).
19 In a similar fashion, Fourie and von Fintel (2014) shows that the arrival of Huguenots at theCape Colony in 1688–9 constituted a positive and persistent shock in the wine-productionindustry.
251
Louis XIV issued the Edict of Fontainebleau, about 200,000 Huguenots sought
refuges in neighbouring countries. I take advantage of the heterogeneity of the
population loss across departments to analyse the socio-economic consequences
of the Revocation. I show that the effect of Protestantism on the male literacy rate
was lower in departments that experienced a larger population shock. I find no
evidence that the exodus of Huguenots had an impact on agricultural output.
The chapter proceeds as follows: Section 1 provide some information about
the spread of Reformation in France and the consequences of its demise after
the revocation of the Edict of Nantes. Section 2 describes the data sources and
the data set construction. Section 3 presents the empirical model and the results.
Finally, Section 4 concludes.
1 Historical background
1.1 The spread of Protestantism in France
In October 1517, Martin Luther issued his Ninety-five theses criticising Church
practices, in particular the role of ecclesiastical authority in granting papal
indulgences. This event is often considered the beginning of the Protestant
Reformation, and in the following decades, Luther and in his supporters all
around Europe would call for moral renewal and challenge the psychological
control exercised by the church as a monopolistic source and interpreter of
Scripture. In France, Calvin emerged as the spiritual leader of the Reformation.20
Born in 1509 of a bourgeois family at Noyon in northern France, Calvin
moved to Paris in 1523 to study liberal arts before enrolling at the University
of Orléans in 1528 where he studied law. During the 1530s, he experienced
the inflexible conduct of clergy and the war of attrition led by the University of
Paris (Sorbonne) against the humanist reform. Influenced by Erasmus, Guilaume
Briçonnet, bishop of Meaux, and Jacques Lefèvre d’Étaples had created in 1521 a
center of academic study, known as Cenacle of Meaux, which attracted reform-
minded scholars. The persecutions began in 1524 following the publication
20 This section draws heavily on Boisson and Daussy (2006, pp. 7–82), (Cabanel, 2012, pp. 15–64),Holt (2017), Manetsch (2012, pp. 18–37), McKim (2004, pp. 3–40), and Treasure (2013, pp. 51–106).
252 Chapter IV. Was Louis XIV Wrong?
of the vernacular translation of the Bible by Lefèvre d’Étaples. They resulted
in the following years in the condemnation or the escape of many reformists,
including William Farel who was forced to flee to Switzerland. In October 1534,
handbills endorsing reform and decrying the mass were posted throughout many
cities.21 They triggered a new wave of persecutions, with imprisonments and
executions.22
Calvin and other reformers found themselves forced to leave France. Calvin
successively settled in Strasbourg and Basel. In 1536, Farel convinced Calvin to
remain in Geneva and help him to lead the reform in the city.23 After few years
of exile in Strasbourg between 1538 and 1541, he returned to Geneva, resumed
his preaching, and drafted regulations for Geneva’s church. To organise the
academic instruction and theological training of future pastors, he established
several academies, including the Company of Pastors (Compagnie des pasteurs).24
These academies attracted hundreds of students from all over Europe who
eventually returned to their home countries and spread the ideology of Calvin.
Between 1555 and 1562, up to two hundred properly educated missionaries
who could preach the gospel and administer the sacraments could have left
Geneva (Kingdon, 2007). Most of them were Frenchmen coming from every
corner of the kingdom and they returned to France to establish a structured
network of alternative churches, found new congregations and/or minister
already established gatherings. Geneva was also a centre of prime importance
for printing and disseminating evangelical propaganda over France, in particular
after repeated Edicts forbade and punished the sale, importation or printing of
any book related to the Protestant heresy. Benedict (2007, pp. 542–54) reports
that, in the 1550s, 244 out 257 evangelical books in French and published outside
France originated from Geneva.
21 This event is known as the Affair of the Placards. For more details on this particular event, seeKirby (2009).
22 Few years later, in 1540, the Edict of Fontainebleau ended any form of tolerance and declared theLutheran heresy “high treason against God and mankind, popular sedition, and the disturbanceof our state and public tranquillity”. The crime of heresy was punishable by torture, forfeitureof good, public humiliation and/or death (Monter, 1999, pp. 85–115).
23 The General Council of the city had officially adopted the Reform on May 21, 1536. Archivesd’État de Genève, Registres du Conseil 29, fol. 112-112v°.
24 Manetsch (2012, pp. 38–67) provides a detailed description of the pattern of development of theCompany of Pastors, as well as its geographic and social pattern of recruitment.

253
Prior to 1550, there were no organised church and French Protestantism
existed only as underground and scattered organisation. Persecution still focused
mostly on deviant clergy members.25 Only in the 1550s, the number of adherents
to Calvinism and Reformation grew remarkably fast. In 1559, the first national
Synod of French Reformed churches was organised in Paris.26 French pastors
gathered to discuss ecclesiastical discipline and organisation. By the end of the
decade, there were more than one thousand Reformed churches in France and
two million Huguenots. French Protestants then represented about 10 per cent of
the total population (Fornerod and Benedict, 2009; Mours, 1958). The outbreak of
the First War of Religion in 1562, however, halt the expansion of Protestantism in
France. In 1598, the Edict of Nantes ended the Wars of Religion. Huguenots
had then 759 temples scattered across France and their number amounted to
approximately one million.
Among the converts were all classes, though urban craftsmen represented
the largest social group in proportion to their relative share in population. In
Nîmes, they represented 43 per cent of the population but 58 per cent of the
Protestants in 1560. In comparison, agricultural workers amounted 34 per cent
of the population of Nîmes but only 15 per cent of the Protestants (Tulchin,
2010, p. 201).27 Many different factors would attract members of different social
groups to the ideas of the Reformation: grievances against clergy’s tax exemption,
martyrdom, patronage, the actions of the new wave of pastors from Geneva,
adverse economic conditions, printing presses, and the power of the evangelic
message. Heller (1986) and Treasure (2013) emphasise the difficulty to discern
25 For an overview of prosecution and persecution during the early 1550s, see Mentzer (1984), andMonter (1999, pp. 116–45).
26 The fundamental structure in French Protestantism was the local church and its consistory, anadministrative and judicial boy composed of the pastors and the council of elders. Every churchdrawn income from their worshippers to pay the pastor, the regent (school teacher) and thecaretaker who rang the bell. Church also committed to help the poor. One member of thecouncil of elders had to pay monthly visit to every family to check whether they still neededassistance. At the local level, Reformed churches gathered in colloquies, which met once a yearduring Provincial Synods. At the national level, the General Synod gathered every few years(Garrisson, 1995, pp. 281–4).
27 For similar statistics for other French towns, see Garrisson (1980, pp. 18–9). Hauser (1899) andHeller (1986) argue that, until the phase of expansion during the 1550s, popular and elitistforms of Protestantism co-existed and should be differentiated because different factors drovethem into the new religion. In particular, socio-economic distress fostered the adherence toProtestantism among lower classes. For a detailed overview of the social composition of theProtestant movement, see Garrisson (1995, pp. 284–91).
254 Chapter IV. Was Louis XIV Wrong?
a unique explanation to the surge of evangelical faith across France because it
reflected characteristics specific to each social group and location.28 The situation
was not much different in the Holy Roman Empire. Recent empirical studies
suggest printing presses, printing competition, ideological influence, political
autonomy, aristocratic patronage, agricultural potential, and monasteries are all
correlated with the diffusion of the Reformation (Becker, Pfaff and Rubin, 2016).
1.2 The revocation of the Edict of Nantes
In April 1598, the Edict of Nantes marked the end of military hostility between
Catholics and Protestants and recognised, under certain conditions, the existence
of the Protestant minority within the kingdom of France.29 To avoid further
violence, the edict specified the rights and the obligations of the Protestants. For
instance, the Huguenots could retain their worship only wherever it had been
established prior to August 1597, but they had to respect all Catholic feast days.
In return, they were granted about 150 towns and villages as safe havens (place
de sûreté). The Crown also committed to maintain and cover the expenses of
Huguenots schools and colleges (Garrisson, 1995, pp. 391–8). The preamble of
the edict, however, clearly affirmed the ideal of religious unity and made it clear
that Henry IV wished that all Huguenots should return to the Catholic faith.
Throughout the first half of the 17th century, a regime of relative coexistence
perdured between Catholics and Huguenots over most of the realm.30 However,
a string of edicts and declarations slowly restricted the rights and liberties of
28 Treasure (2013, p. 122) contends that “there were as many different experiences as there wereProtestant communities”.
29 For an English translation of the Edict of Nantes, see Golden (1988, pp. 86–134).30 Violence and wars erupted again in southwest during the 1620s. On October 1620, the army
entered the city of Pau and Louis XIII reinstituted Catholicism as the official religion of Béarn.Protestants resented the king for his decision and decided, under the leader of the Duke ofRohan, to organise an armed rebellion. In the following years, Louis XIII would besiegedrepeatedly La Rochelle and other Protestants towns until they submitted in June 1629 after thecity of Alès was burnt to the ground.
255
Huguenots and eroded their political power.31 The situation, however, changed
abruptly with the onset of Louis XIV’s rule in 1661. Long before 1685, he
attempted to persuade Protestants to convert to Catholicism and deployed a vast
repertoire of strategies, which prefigured the revocation of the Edict of Nantes.32
That includes measures removing the equal access to civil employment, the close
down of many local Reformed churches, and in 1669, the suppression of the
bipartisan chambers of justice in Paris and Rouen.33 From 1681 onward, the
dragonnades represented another part of Louis XIV’s strategic plan of conversion:
the use of troop lodgements to increase pressure on Huguenots. The strategy
was to threaten them with the financial burden of troop lodgements and to offer
tax relief to those who converted. This policy was an attempt to apply economic
coercion to the Protestant notables and create a trickle-down effect of conversions
among the lower classes. This policy was quite successful in many places. In
Béarn, estimates suggest that nearly 20,000 Protestants converted to Catholicism
between 1683 and 1685. One month before the revocation of the Edict of Nantes,
on September 17, 1685, the secretary of state for war Louvois reported that 130,000
conversions had been obtained using this strategy in the provinces of Bordeaux,
Montauban, Limoges, and Poitiers. Many Huguenots had also begun to seek
refuge in other European countries.34
When Louis XIV issued the Edict of Fontainebleau in October 17, 1685,
there were about 800,000 Huguenots in France. They were scant in Brittany,
in the northern and in Massif Central. Huguenots were more numerous in
Normandy, Orléanais, and Paris but remained nonetheless a small minority. Vi-
varais, Dauphiné, lower Languedoc, Guyenne, Aunis and Béarn were Protestant
31 In 1676, John Locke noted during his passage in Montpellier that “they and the papist laity livetogeather firefly enough in these parts. They sometimes get and sometimes loose proselytes”(cited in Benedict, 2001, p. 34). Hanlon et al. (1993, pp. 91–117) also provides a good exampleof such coexistence and interdependence between the two communities. Hanlon identifies atleast 279 cases of mixed marriage in Layrac, southwest of France, between 1598 and 1700. Onaverage, 50 per cent of the marriage contracts were signed by witnesses of both confessions.Hanlon also lists numerous cases of Huguenots employing Catholics as servants, and/orCatholic masters recruiting Protestants apprentices. In addition, notarial archives indicate thatfinancial loans between the two confessional groups were common.
32 For instance, on the action of the Council of State, see Blet (1972).33 These institutions created by Henry IV were in charge of adjudicating disputes between
Catholics and Protestants.34 For more details on the persecution of Huguenots, and in particular the dragonnades, under
Louis XIV’s rule, see McCullough (2007, pp. 125–79) and Scoville (1960, pp. 28-63). For anoverview of Protestantism throughout the 17th century, see Cabanel (2012, pp. 507–608).
256 Chapter IV. Was Louis XIV Wrong?
strongholds. In Montauban and Nîmes, they represented about 60 per cent of
the population; in Sedan, 40 per cent; in Montpellier and La Rochelle, 30 per
cent; in Metz, 20 per cent; in Dieppe, 10 per cent; in Rouen, 5 per cent (Benedict,
2001, pp. 34–120).35 By prohibiting “any further public exercise of the Pretended
Reformed Religion (P.R.R.) in his kingdom”, the Edict of Fontainebleau revoked
the Edict of Nantes and marked the culmination of years of effort to end
the toleration and persecute Huguenots.36 All Protestant temples had to be
demolished and Protestant noblemen were forbidden to hold religious services in
their fiefs. Pastors had the choice between leaving France within fifteen days or
converting and benefiting from tax exemption and easier access to the profession
of lawyer. All Protestant schools for the instruction of children were suppressed,
and Huguenots attempting to leave the kingdom or send out their goods faced
the penalty of being sent to the galleys.
Louis XIV hoped that the revocation of the Edict of Nantes could ensure the
conversion of the remaining Protestants, but it was overall a failure. Between
150,000 and 200,000 Huguenots, a number far larger than anticipated, fled abroad
within few years. In many towns and villages, the demographic shock was
important. In Metz, 70 per cent of the Huguenots– about 15 per cent of the
population– left for Prussia. About 1,500 Huguenots left Sedan and sought
refuge in Palatinat (Jurbert, 2015, p. 187) At least 2,000 individuals departed from
Nîmes. In Annonay, Huguenots represented half of the population in 1685, but
“new converts” (N.C.) amounted to only 10 per cent of the population at the
beginning of the 18th century.37 Overall estimates suggest that at least 5,000
individuals, 5 per cent of the total population, could have left Vivarais during
this period (Molinier, 1976). In the neighbouring province of Dauphiné, a more
substantial number of peasants fled and left land uncultivated creating concerns
about the agricultural output (Scoville, 1960, pp. 307–10). Many other provinces
were less affected by out migration because Huguenots amounted to a small
35 For the period, population estimates are: Montauban, 16,700; Nîmes, 18,000; Sedan, 7,500;Montpellier, 21,400; La Rochelle, 22,500; Metz, 21,000; Dieppe, 40,000; Rouen, 80,000. See Mours(1947) and Scoville (1960, pp. 11–2) for more population estimates.
36 For an English translation of the Edict of Fontainebleau, see Golden (1988, pp. 135–9).37 After the Revocation, the administration attempted to evaluate the rate of conversion and exile.
Local administrators had to carry out repeated survey tracking down Huguenots who decidedto stay and covert to Catholicism (the new converts) and those who fled.
257
share of their population. Thus, the Huguenot population share in Berry and
Normandy represented 1.5-2 per cent and 2-2.5 per cent, respectively. After
the Revocation, about 15 per cent of the Huguenots left Berry and Normandy
(Boisson and Lippold, 2002, pp. 95–6, p. 295; Daireaux, 2010, p. 744; Daireaux,
2012, p. 125).38
Overall, about one per cent of the French population migrated after the
Revocation. In 1688, Vauban wrote a memorial to Louvois to deplore that
the exile of thousands of Huguenots weakened France because they took with
them millions of livres tournois of capital and accelerated the ruin of French
trade and industries.39 Scoville (1960), however, questions the point of view of
Vauban. He shows that there is little evidence that the departure of Huguenots
seriously affected industrial production in France in the long run. For instance,
in La Rochelle, a form Protestant stronghold, trade remained organised and
dominated by a Protestant elite, with the support of the monarchy, during the
entire 18th century (Martinetti, 2015).40 Similarly, Concato and Largesse (1992)
document that, within two years, the dynamism of Catholic drapers in Elbeuf,
Normandy, had completely offset the negative economic shocks associated with
the departure of Huguenots drapers. During the 18th century, many “new
converts” only acted like Catholics and returned to their old religion, although
Protestantism remained illegal until 1787. Some of them became school teachers
in Catholics schools as soon as 1700, before Protestant schools began to flourish
again in the 1750s (Boisson, 2000, pp. 241–5, pp. 421–7; Van Deursen, 1960, pp. 37–
83).
38 From the 16th century onward, Protestants decided to emigrate based on their situations as wellas their religious fervour. Artisans, whose skills were readily portable, were more prone to seekrefuge abroad than noblemen, whose assets (land) were harder to sell. The cost of migration wasalso smaller for Huguenots living close to ports and/or to external borders than those who livedin the interior of the kingdom (Boisson and Daussy, 2006, pp. 232–5; Treasure, 2013, pp. 359–60).
39 Bert (1908, pp. 96–101) also attributes a part of the economic decline of the late 17th century tothe emigration of Huguenots. For an overview of how this idea persisted over time, see Yardeni(1993).
40 Analysing notarial acts in Bordeaux, Poussou and Loupès (1986, pp. 159–66) also finds thatProtestant merchants continued to be very active in trade networks after the Revocation. Veryfew actually out-migrated after 1686.
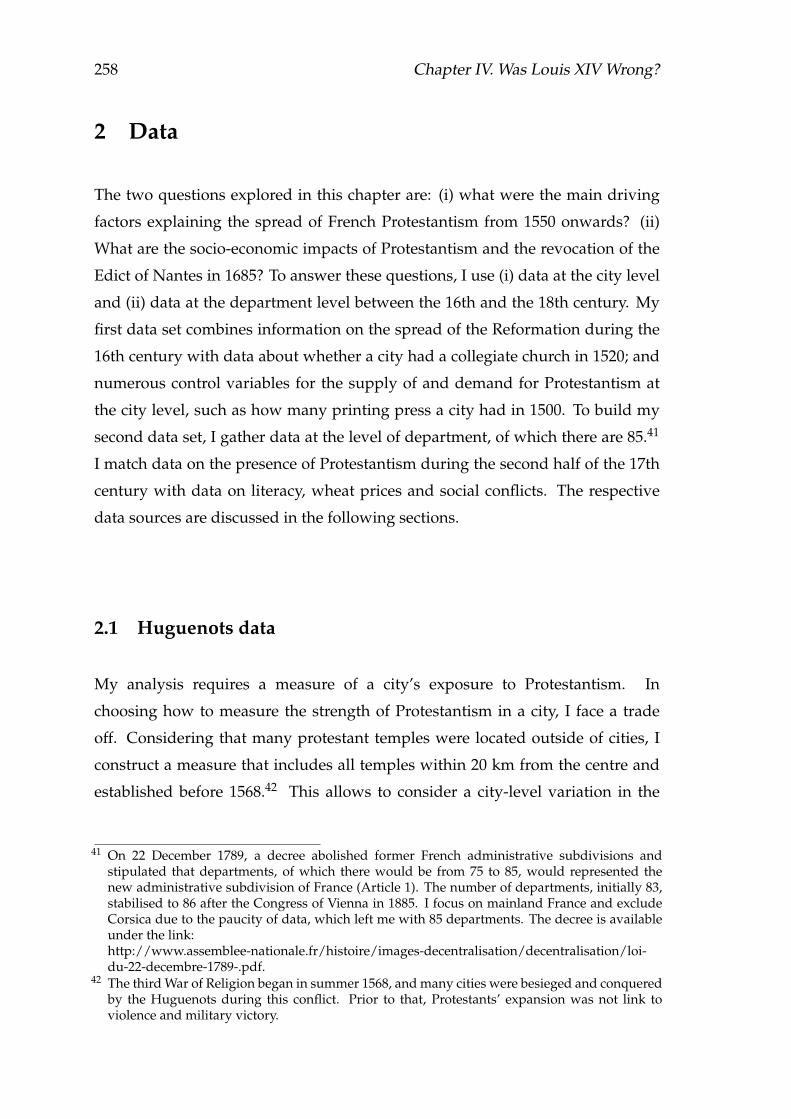
258 Chapter IV. Was Louis XIV Wrong?
2 Data
The two questions explored in this chapter are: (i) what were the main driving
factors explaining the spread of French Protestantism from 1550 onwards? (ii)
What are the socio-economic impacts of Protestantism and the revocation of the
Edict of Nantes in 1685? To answer these questions, I use (i) data at the city level
and (ii) data at the department level between the 16th and the 18th century. My
first data set combines information on the spread of the Reformation during the
16th century with data about whether a city had a collegiate church in 1520; and
numerous control variables for the supply of and demand for Protestantism at
the city level, such as how many printing press a city had in 1500. To build my
second data set, I gather data at the level of department, of which there are 85.41
I match data on the presence of Protestantism during the second half of the 17th
century with data on literacy, wheat prices and social conflicts. The respective
data sources are discussed in the following sections.
2.1 Huguenots data
My analysis requires a measure of a city’s exposure to Protestantism. In
choosing how to measure the strength of Protestantism in a city, I face a trade
off. Considering that many protestant temples were located outside of cities, I
construct a measure that includes all temples within 20 km from the centre and
established before 1568.42 This allows to consider a city-level variation in the
41 On 22 December 1789, a decree abolished former French administrative subdivisions andstipulated that departments, of which there would be from 75 to 85, would represented thenew administrative subdivision of France (Article 1). The number of departments, initially 83,stabilised to 86 after the Congress of Vienna in 1885. I focus on mainland France and excludeCorsica due to the paucity of data, which left me with 85 departments. The decree is availableunder the link:http://www.assemblee-nationale.fr/histoire/images-decentralisation/decentralisation/loi-du-22-decembre-1789-.pdf.
42 The third War of Religion began in summer 1568, and many cities were besieged and conqueredby the Huguenots during this conflict. Prior to that, Protestants’ expansion was not link toviolence and military victory.
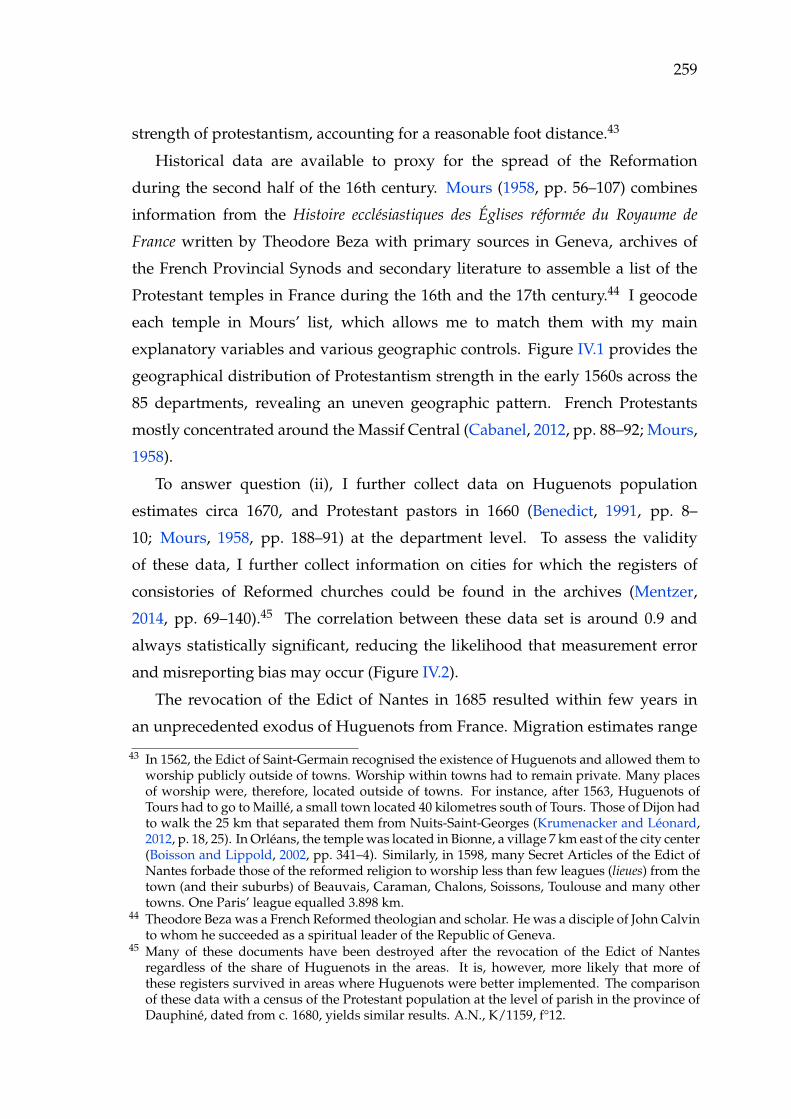
259
strength of protestantism, accounting for a reasonable foot distance.43
Historical data are available to proxy for the spread of the Reformation
during the second half of the 16th century. Mours (1958, pp. 56–107) combines
information from the Histoire ecclésiastiques des Églises réformée du Royaume de
France written by Theodore Beza with primary sources in Geneva, archives of
the French Provincial Synods and secondary literature to assemble a list of the
Protestant temples in France during the 16th and the 17th century.44 I geocode
each temple in Mours’ list, which allows me to match them with my main
explanatory variables and various geographic controls. Figure IV.1 provides the
geographical distribution of Protestantism strength in the early 1560s across the
85 departments, revealing an uneven geographic pattern. French Protestants
mostly concentrated around the Massif Central (Cabanel, 2012, pp. 88–92; Mours,
1958).
To answer question (ii), I further collect data on Huguenots population
estimates circa 1670, and Protestant pastors in 1660 (Benedict, 1991, pp. 8–
10; Mours, 1958, pp. 188–91) at the department level. To assess the validity
of these data, I further collect information on cities for which the registers of
consistories of Reformed churches could be found in the archives (Mentzer,
2014, pp. 69–140).45 The correlation between these data set is around 0.9 and
always statistically significant, reducing the likelihood that measurement error
and misreporting bias may occur (Figure IV.2).
The revocation of the Edict of Nantes in 1685 resulted within few years in
an unprecedented exodus of Huguenots from France. Migration estimates range
43 In 1562, the Edict of Saint-Germain recognised the existence of Huguenots and allowed them toworship publicly outside of towns. Worship within towns had to remain private. Many placesof worship were, therefore, located outside of towns. For instance, after 1563, Huguenots ofTours had to go to Maillé, a small town located 40 kilometres south of Tours. Those of Dijon hadto walk the 25 km that separated them from Nuits-Saint-Georges (Krumenacker and Léonard,2012, p. 18, 25). In Orléans, the temple was located in Bionne, a village 7 km east of the city center(Boisson and Lippold, 2002, pp. 341–4). Similarly, in 1598, many Secret Articles of the Edict ofNantes forbade those of the reformed religion to worship less than few leagues (lieues) from thetown (and their suburbs) of Beauvais, Caraman, Chalons, Soissons, Toulouse and many othertowns. One Paris’ league equalled 3.898 km.
44 Theodore Beza was a French Reformed theologian and scholar. He was a disciple of John Calvinto whom he succeeded as a spiritual leader of the Republic of Geneva.
45 Many of these documents have been destroyed after the revocation of the Edict of Nantesregardless of the share of Huguenots in the areas. It is, however, more likely that more ofthese registers survived in areas where Huguenots were better implemented. The comparisonof these data with a census of the Protestant population at the level of parish in the province ofDauphiné, dated from c. 1680, yields similar results. A.N., K/1159, f°12.
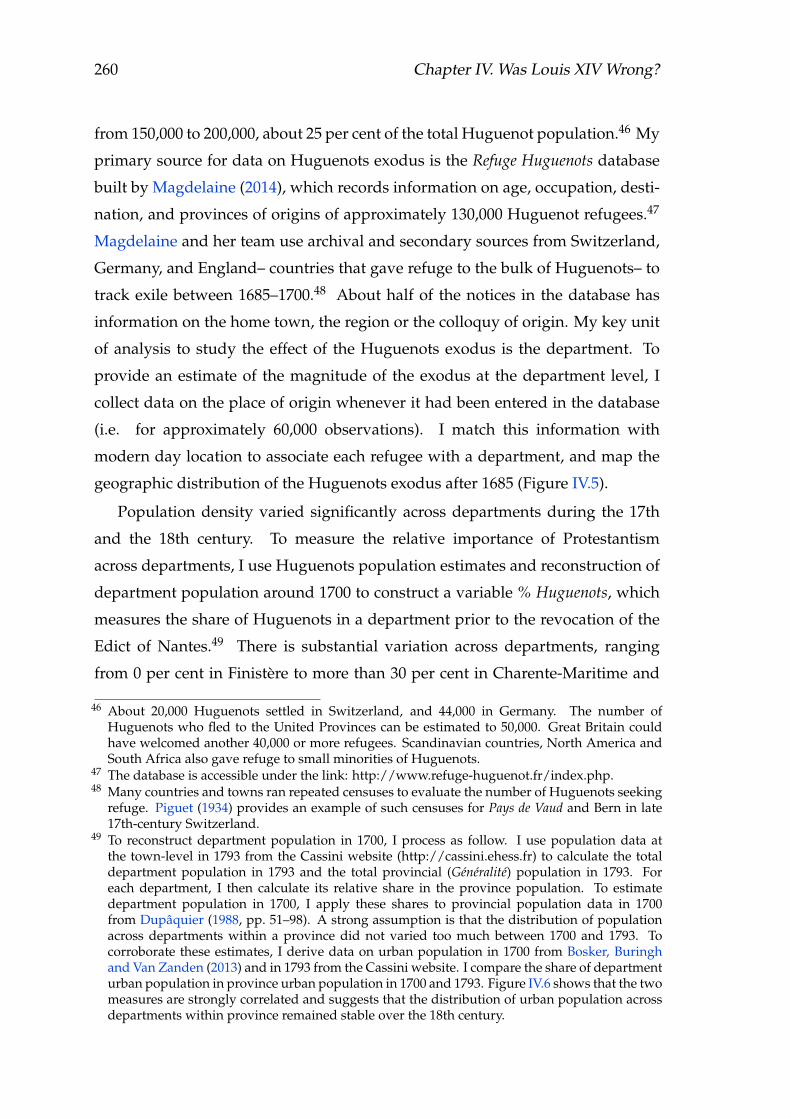
260 Chapter IV. Was Louis XIV Wrong?
from 150,000 to 200,000, about 25 per cent of the total Huguenot population.46 My
primary source for data on Huguenots exodus is the Refuge Huguenots database
built by Magdelaine (2014), which records information on age, occupation, desti-
nation, and provinces of origins of approximately 130,000 Huguenot refugees.47
Magdelaine and her team use archival and secondary sources from Switzerland,
Germany, and England– countries that gave refuge to the bulk of Huguenots– to
track exile between 1685–1700.48 About half of the notices in the database has
information on the home town, the region or the colloquy of origin. My key unit
of analysis to study the effect of the Huguenots exodus is the department. To
provide an estimate of the magnitude of the exodus at the department level, I
collect data on the place of origin whenever it had been entered in the database
(i.e. for approximately 60,000 observations). I match this information with
modern day location to associate each refugee with a department, and map the
geographic distribution of the Huguenots exodus after 1685 (Figure IV.5).
Population density varied significantly across departments during the 17th
and the 18th century. To measure the relative importance of Protestantism
across departments, I use Huguenots population estimates and reconstruction of
department population around 1700 to construct a variable % Huguenots, which
measures the share of Huguenots in a department prior to the revocation of the
Edict of Nantes.49 There is substantial variation across departments, ranging
from 0 per cent in Finistère to more than 30 per cent in Charente-Maritime and
46 About 20,000 Huguenots settled in Switzerland, and 44,000 in Germany. The number ofHuguenots who fled to the United Provinces can be estimated to 50,000. Great Britain couldhave welcomed another 40,000 or more refugees. Scandinavian countries, North America andSouth Africa also gave refuge to small minorities of Huguenots.
47 The database is accessible under the link: http://www.refuge-huguenot.fr/index.php.48 Many countries and towns ran repeated censuses to evaluate the number of Huguenots seeking
refuge. Piguet (1934) provides an example of such censuses for Pays de Vaud and Bern in late17th-century Switzerland.
49 To reconstruct department population in 1700, I process as follow. I use population data atthe town-level in 1793 from the Cassini website (http://cassini.ehess.fr) to calculate the totaldepartment population in 1793 and the total provincial (Généralité) population in 1793. Foreach department, I then calculate its relative share in the province population. To estimatedepartment population in 1700, I apply these shares to provincial population data in 1700from Dupâquier (1988, pp. 51–98). A strong assumption is that the distribution of populationacross departments within a province did not varied too much between 1700 and 1793. Tocorroborate these estimates, I derive data on urban population in 1700 from Bosker, Buringhand Van Zanden (2013) and in 1793 from the Cassini website. I compare the share of departmenturban population in province urban population in 1700 and 1793. Figure IV.6 shows that the twomeasures are strongly correlated and suggests that the distribution of urban population acrossdepartments within province remained stable over the 18th century.

261
Gard (Figure IV.4).
2.2 Collegiate churches data
One of the drivers of the Reformation was the need of spiritual and moral
reform to countervail the moral and financial abuses prompted by the sale of
indulgences. I use information on the presence of collegiate church as a measure
of spiritual services in a city. Canons in collegiate churches maintained a daily
office of worship and masses on the behalf of testators who funded them. In cities
where these specified spiritual services were more widespread, the quality of the
benefits offered by the Church was higher and common citizenry was less likely
to choose other dispensers of religious services (Ekelund, Hébert and Tollison,
2006, pp. 106–7).50
I construct data on collegiate churches in 1520 from the COLÉMON database,
which aims at establishing the corpus of monasteries and collegiate churches
of France between 816 and 1563.51 For each institution, the notices provided
information on the location, the historical evolutions, people, and other aspects
such as architecture. I collect information on the location of all collegiate churches
that were established prior 1520 and calculate for each city the total number of
collegiate churches that lies within 20 km of the city centre.52
2.3 Literacy data
Direct measures of human capital are lacking for Ancien Régime France. Sig-
nature rate on marriage certificates is a conventional measure of literacy rate
50 Ekelund, Hébert and Tollison (2006, pp. 55–8) argue that religion can be characterised as a Zgood. Becker (1965) defines Z goods as the basic commodities that directly enter households’utility functions. Households produce Z goods by combining time and market goods. As suchhouseholds are “small factories” using capital goods, raw materials and labour to clean, feed,procreate and otherwise produce useful commodities. Ekelund, Hébert and Tollison definereligion as a Z good because religious services are produced by combining capital goods, labour,and market goods, and their output is consumed in a utility-maximizing manner. Therefore,households’ demand for religious services is a function of their price, which equals to resources(money and time) sacrificed to participate in religious activity. When the price of religiousservices increases but quality remains constant, a negative substitution effect arises encouragingthe search for lower-priced substitutes.
51 The database is available under the link: https://colemon.huma-num.fr/.52 I collect information on cities that housed collegiate churches in 1520 instead of later because it
is possible that the diffusion of Protestant ideas during the first half of the 16th century couldhave changed the behaviour of testators, causing issue of reverse causality.
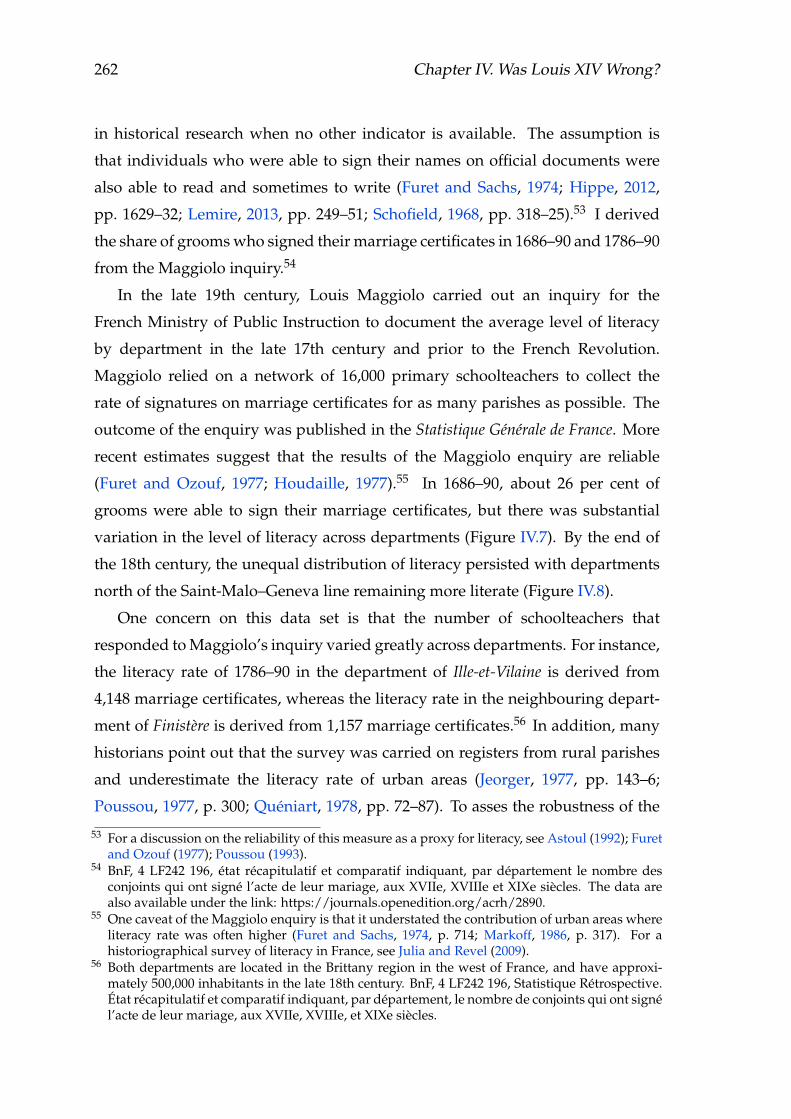
262 Chapter IV. Was Louis XIV Wrong?
in historical research when no other indicator is available. The assumption is
that individuals who were able to sign their names on official documents were
also able to read and sometimes to write (Furet and Sachs, 1974; Hippe, 2012,
pp. 1629–32; Lemire, 2013, pp. 249–51; Schofield, 1968, pp. 318–25).53 I derived
the share of grooms who signed their marriage certificates in 1686–90 and 1786–90
from the Maggiolo inquiry.54
In the late 19th century, Louis Maggiolo carried out an inquiry for the
French Ministry of Public Instruction to document the average level of literacy
by department in the late 17th century and prior to the French Revolution.
Maggiolo relied on a network of 16,000 primary schoolteachers to collect the
rate of signatures on marriage certificates for as many parishes as possible. The
outcome of the enquiry was published in the Statistique Générale de France. More
recent estimates suggest that the results of the Maggiolo enquiry are reliable
(Furet and Ozouf, 1977; Houdaille, 1977).55 In 1686–90, about 26 per cent of
grooms were able to sign their marriage certificates, but there was substantial
variation in the level of literacy across departments (Figure IV.7). By the end of
the 18th century, the unequal distribution of literacy persisted with departments
north of the Saint-Malo–Geneva line remaining more literate (Figure IV.8).
One concern on this data set is that the number of schoolteachers that
responded to Maggiolo’s inquiry varied greatly across departments. For instance,
the literacy rate of 1786–90 in the department of Ille-et-Vilaine is derived from
4,148 marriage certificates, whereas the literacy rate in the neighbouring depart-
ment of Finistère is derived from 1,157 marriage certificates.56 In addition, many
historians point out that the survey was carried on registers from rural parishes
and underestimate the literacy rate of urban areas (Jeorger, 1977, pp. 143–6;
Poussou, 1977, p. 300; Quéniart, 1978, pp. 72–87). To asses the robustness of the
53 For a discussion on the reliability of this measure as a proxy for literacy, see Astoul (1992); Furetand Ozouf (1977); Poussou (1993).
54 BnF, 4 LF242 196, état récapitulatif et comparatif indiquant, par département le nombre desconjoints qui ont signé l’acte de leur mariage, aux XVIIe, XVIIIe et XIXe siècles. The data arealso available under the link: https://journals.openedition.org/acrh/2890.
55 One caveat of the Maggiolo enquiry is that it understated the contribution of urban areas whereliteracy rate was often higher (Furet and Sachs, 1974, p. 714; Markoff, 1986, p. 317). For ahistoriographical survey of literacy in France, see Julia and Revel (2009).
56 Both departments are located in the Brittany region in the west of France, and have approxi-mately 500,000 inhabitants in the late 18th century. BnF, 4 LF242 196, Statistique Rétrospective.État récapitulatif et comparatif indiquant, par département, le nombre de conjoints qui ont signél’acte de leur mariage, aux XVIIe, XVIIIe, et XIXe siècles.
263
data set, I gather information on the literacy rate from the French historiography
on education and primary sources. Overall, I collect 1,689 estimates of literacy
rate for different towns, 994 of which are related to late 18th century.57 Fig-
ures IV.9 shows the correlation between the two samples. Despite large within
department variations, the correlation between the two samples is high, which
suggest that Maggiolo’s estimates are reliable proxy for the average literacy rate
at the department level.58
2.4 Crop prices and social conflicts data
To answer question (ii), I further examine how the revocation of the Edict of
Nantes, which led to the exclusion of Protestants from some occupations and
public office, and to the migration of a significant share of the population,
affected the economy and the living conditions of Frenchmen. Among the 200,000
Huguenots who fled to Switzerland, Prussia, and England, there were peasants,
craftsmen, merchants and nobles. Historical evidence suggests that it resulted in
significant economic losses because it disrupted agricultural production, trade
networks and/or industrial (textile) production (Concato and Largesse, 1992;
Scoville, 1960). The aggregate effect of these disruption may materialise in higher
crop prices, higher level of industrial unemployment and overall lower real
wages, leaving the local population worse off.
I make use of data on crop prices and social conflicts at the department level
to investigate the broader socio-economic consequences of Protestantism and
Huguenots’ exodus. The insurrection of the Camisards broke out in Languedoc
in 1702 and continued until 1710, and had strong religious foundations (McCul-
lough, 2007, pp. 181–242). Conflicts occurring during this period may thus reflect
more religious resentment than economic stress. Therefore, I focus on the period
1670–1700. I construct my data on social conflicts from Nicolas (2002). Nicolas
(2002) records information on the location, the date of the event, the course of
57 I rely on both archival source and secondary literature to assemble this data set. See forinstance, Deyon (1967, p. 342), Jeorger (1977, pp. 141–2), Poussou (1993, pp. 214–220), Vassort(1995, pp. 351–66), Vovelle (1975, pp. 102–3). A.N., 71AJ/14, Enquêtes de mai 1877, Académiede Nancy, arrondissement de Toul. A.N. 71AJ/15, Enquêtes prescrites par les circulairesministérielles des 14 décembre 1872, 6 août 1873, 30 mai 1879.
58 The correlation coefficient is equal to 0.738.
264 Chapter IV. Was Louis XIV Wrong?
action, and the actors involved in any social conflict in Ancien Régime France.59
I create a dummy variable, denoted Social conflict, equal to one if at least one
social conflict occurred in department j in year t, and zero otherwise. To capture
more precisely the effect of the revocation on living conditions, I further restraint
my focus to subsistence-related conflicts such as looting stores and warehouses,
sacking grain storage facilities, and popular price-fixing (taxation populaire). I
create a dummy variable, denoted Subsistence-related conflict, equal to one if at
least one subsistence-related conflict occurred in department j in year t, and zero
otherwise.
My principal sources on crop prices are published compilations reporting
yearly or monthly wheat prices in historical volume units and currencies. Prior
to the creation of the metric system, there was a great variation in these units
over space and time, which makes raw series hardly comparable. I use studies
on historical metrology (e.g. Charbonnier, 1990, 2005, 2012) to convert all series in
grams of silver per litre. Whenever possible, I collect information on wheat prices
after the end of the harvest to reflect as much as possible the level of harvest
fluctuations. The French grain market was weakly integrated during the 17th
century, and shipment of grains took time. Therefore, in the months following
the harvest, the local supply was the most important determinant of prices.
Overall, I collect data between 1670 and 1700 from 83 different markets located
in 48 departments.60 For department with more than one market, I calculate the
mean of all prices in order to get one observation per department per year.
2.5 Control variables
Many factors may have contributed to the rise of Protestantism during the
second half of the 16th century, and to the level of literacy and crop prices later
59 For more details, see Chapter II, Section 2.1.60 For additional information, see for instance: Aix-en-Provence (Baehrel, 1961); Allasac
(Soulingeas, 1971, pp. 194–7); Amiens (Curtis and Dijkman, 2017); Arles (Baehrel, 1961); Beau-vais (Goubert, 1960, pp. 401–5); Breteuil, A.D. Eure, 6/B204 et 6B/205; Brioude (Frêche, 1979,pp. 46–8); Charleville (Morineau, 1985, annexes); Draguignan (Baehrel, 1961); Eu (Lemarchand,1989, p. 552); Laval (Morineau, 1971, pp. 367–70); Mamers (Gautier, 2011, pp. 14–7); Melun,A.N., S/411; Saint-Brieuc (Meyer, 1966, pp. 848-851); Saint-Malo (Nassiet, 1993, p. 466); Tréguier(Minois, 1981, p. 93).
265
on. Therefore, the empirical analysis accounts for confounding geographical,
economic and institutional characteristics.
To control for supply-side factors influencing ideological diffusion, I include
dummies for whether the city had a printing press in 1500 (Mellot and Queval,
2004), whether the city was located on a Roman hub, as well as the log of
population in 1500 (Bosker, Buringh and Van Zanden, 2013). To account for the
fact that being more exposed to cultural values promulgated by the Reformation,
i.e. the virtues of hard work and thrift, might increase the demand for religious
changes, I include the number of Cistercian abbeys located within 20 km of
the city centre in 1500 (Andersen et al., 2017; Peugniez, 2001). To account for
the fact that cities nearby Geneva– where many French Protestant pastors were
trained– were more likely to be exposed to Protestant ideas, I also include the
log of the areal distance to Geneva. Similarly, I include the log of the caloric
suitability of the land (Galor and Özak, 2016) because it could have affected
natural land productivity and therefore, the profitability of the conversion to
the Protestantism (Curuk and Smulders, 2016). Demand-side controls include a
dummy for whether a city had a university by 1450 (Doisy, 1753), whether a city
housed a bishop or archbishop by 1500 (Bosker, Buringh and Van Zanden, 2013),
whether a city was located within the historical borders of a province having a
Parliament, and whether a city was located within the historical borders of France
in 1500. Finally, I also account for the latitude and the ruggedness (Topographic
Index Position).
3 Empirical strategy and results
3.1 The spread of the Reformation
This section presents the first set of results. In their literature survey, Becker,
Pfaff and Rubin (2016) list several supply- and demand-side channels to explain
the diffusion of Protestant ideas in early modern Europe. I use cross-sectional
analysis at the city level to examine the determinants of the spread of the
Reformation in the context of 16th-century France. In total, there are 99 cities
in my sample. I estimate the following specification:

266 Chapter IV. Was Louis XIV Wrong?
Protestanti = β1 Collegiate Churchesi + β2 Distance to Genevai
+ β3 Pressi + γ Xi + ǫi
(IV.1)
where Protestanti denotes the number of Protestant temples within a 20 km range
from city i in the early 1560s. Collegiate Churchesi is a continuous variable equal
to the total number of collegiate Church established within a 20 km range from
city i in 1520. Distance to Genevai is the log of the aerial distance in kilometres
from city i to Geneva. Pressi is a continuous variable equal to the total number of
printers and booksellers who operated within a 20 km range from city i in 1500. Xi
is a vector of other supply-and-demand control variables as well as geographic
control variables. It includes dummy variables for: university, bishop, Roman
hub, local parliament, being within the French 1500 borders; and continuous
variables for: caloric index, urban population, ruggedness, and latitude. ǫi is
the error term. Robust standard errors are clustered at the department level.
Table IV.1 presents the results. Column 1 reports the association between the
number of collegiate churches in 1520 and the number of Protestant temples in
the early 1560s. The coefficient on Collegiate churches is negative and statistically
significant. On average, every additional collegiate church in 1520 results in
0.3 less Protestant temple during the rapid spread of Protestantism in France
around 1560. Columns 2 to 4 report the results when additional demand and
supply controls are included. Column 5 includes a set of additional controls.
In all specifications, the coefficient on Collegiate churches remains negative and
significantly different from zero.
The collegiate churches were often funded by legacies from wealthy testators
who requested that masses were sung for the repose of their souls. Canons would
maintain a daily office of worship and masses, and sometimes offered charity
for the local population. Ekelund, Hébert and Tollison (2002), and Ekelund,
Hébert and Tollison (2006) suggest that, in the early 16th century, the Catholic
church can be treated as a monopolistic firm providing religious (spiritual)
services. Individuals unhappy with the quality of its services and/or its prices
(indulgences) could opt for another firm dispensing of religious services. In line
with this approach, results from Table IV.1 suggest that the odds of adopting
267
Protestantism were lower in cities where the Catholic church provided higher
level of spiritual services in the forms of daily worship in collegiate churches.
Taylor (1992, pp. 190–5) points out that sermons and preaching, many of which
were delivered in churches, played an essential role in recruitment during the
first phase of Reform. These sermons were less likely to reached many persons
in towns where dwellers were satisfied by Catholics’ preaching.61 Another
plausible explanation is that more collegiate churches were funded during the
Middle Age in areas where the Catholic church had a stronger grasp on the
spiritual life of the population. Then, the variable Collegiate churches would be
a proxy for the historical strength of the Catholic church, and the negative and
statistically significant coefficient would mean that the Reformation was less
likely to be successful in Catholic strongholds. Rubin (2014) uses bishoprics as a
proxy for depth of Church influence and finds that cities where Church influence
was strong were less likely to adopt Protestantism. In columns 4 and 5, the
estimated coefficient for Bishop is always statistically insignificant. This reinforces
the hypothesis that spiritual services rather than Church influence are driving this
relationship.
Kim and Pfaff (2012) show that higher exposure to heterodox ideology
through city-to-university ties increased the likelihood of instituting the Refor-
mation, because students enrolled in Protestant universities acted as agents of
diffusion and spread the new theology to their home towns. In France, there
was no Protestant university before the late 16th century, and most of the French-
speaking pastors were trained in the city of Geneva– Calvin’s intellectual home
from 1541 onward (Wilcox and Roussel, 1993).62 Results presented in Table IV.1
indicate that the distance to Geneva had no statistically significant effect on the
diffusion of Protestantism in France.63 Other supply side variables, such as the
61 For more details on the receptivity of evangelical ideas and the role of preaching, see Thayer(2017).
62 Given that there was not one Reformation as a European wide event, distance to Wittenbergmay not be a useful proxy for the spread of Protestantism in countries that were not Lutheran.In particular, French Protestants were Calvinist so controlling for the spread of the Reformationwith the distance to Geneva makes more sense. See Cabanel (2012, pp. 70–7) for more details.
63 While Benedict (2007) acknowledges the influence of Geneva over the French Reformation,he also notes that “only a fraction of French Reformed churches was founded by Genevan‘missionaries’ or those they subsequently ordained” (p. 536). In addition, Taylor (1992, pp. 190–1) notes that many villages would sent a young man to Geneva with the expectation that uponcompleting his study, he would come back to be pastor of the community. In such case, distanceto Geneva may not matter much to explain the pattern of diffusion of Protestant missionaries.
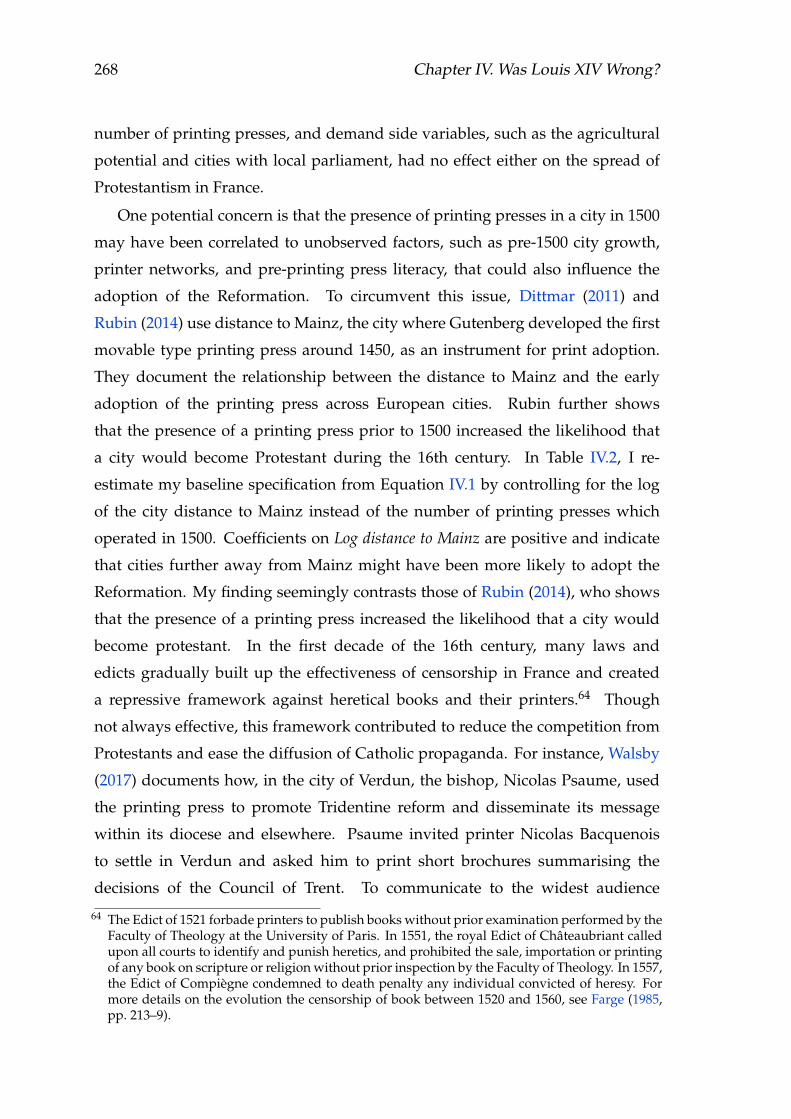
268 Chapter IV. Was Louis XIV Wrong?
number of printing presses, and demand side variables, such as the agricultural
potential and cities with local parliament, had no effect either on the spread of
Protestantism in France.
One potential concern is that the presence of printing presses in a city in 1500
may have been correlated to unobserved factors, such as pre-1500 city growth,
printer networks, and pre-printing press literacy, that could also influence the
adoption of the Reformation. To circumvent this issue, Dittmar (2011) and
Rubin (2014) use distance to Mainz, the city where Gutenberg developed the first
movable type printing press around 1450, as an instrument for print adoption.
They document the relationship between the distance to Mainz and the early
adoption of the printing press across European cities. Rubin further shows
that the presence of a printing press prior to 1500 increased the likelihood that
a city would become Protestant during the 16th century. In Table IV.2, I re-
estimate my baseline specification from Equation IV.1 by controlling for the log
of the city distance to Mainz instead of the number of printing presses which
operated in 1500. Coefficients on Log distance to Mainz are positive and indicate
that cities further away from Mainz might have been more likely to adopt the
Reformation. My finding seemingly contrasts those of Rubin (2014), who shows
that the presence of a printing press increased the likelihood that a city would
become protestant. In the first decade of the 16th century, many laws and
edicts gradually built up the effectiveness of censorship in France and created
a repressive framework against heretical books and their printers.64 Though
not always effective, this framework contributed to reduce the competition from
Protestants and ease the diffusion of Catholic propaganda. For instance, Walsby
(2017) documents how, in the city of Verdun, the bishop, Nicolas Psaume, used
the printing press to promote Tridentine reform and disseminate its message
within its diocese and elsewhere. Psaume invited printer Nicolas Bacquenois
to settle in Verdun and asked him to print short brochures summarising the
decisions of the Council of Trent. To communicate to the widest audience
64 The Edict of 1521 forbade printers to publish books without prior examination performed by theFaculty of Theology at the University of Paris. In 1551, the royal Edict of Châteaubriant calledupon all courts to identify and punish heretics, and prohibited the sale, importation or printingof any book on scripture or religion without prior inspection by the Faculty of Theology. In 1557,the Edict of Compiègne condemned to death penalty any individual convicted of heresy. Formore details on the evolution the censorship of book between 1520 and 1560, see Farge (1985,pp. 213–9).
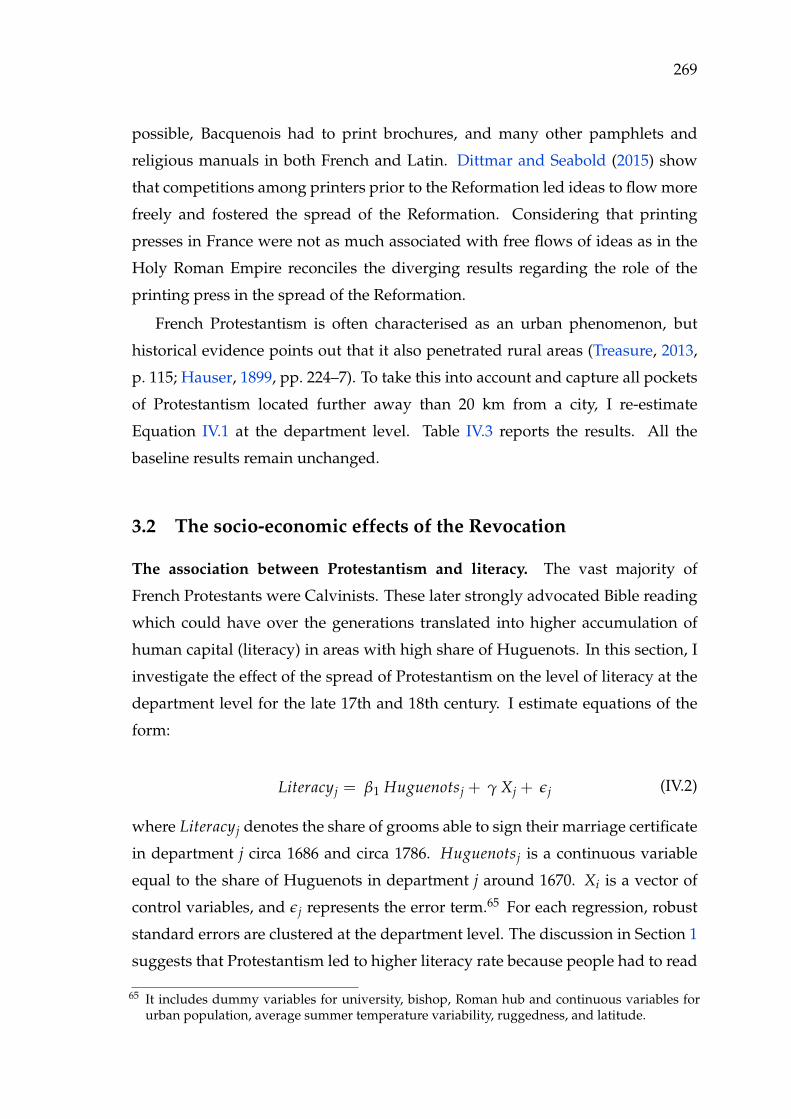
269
possible, Bacquenois had to print brochures, and many other pamphlets and
religious manuals in both French and Latin. Dittmar and Seabold (2015) show
that competitions among printers prior to the Reformation led ideas to flow more
freely and fostered the spread of the Reformation. Considering that printing
presses in France were not as much associated with free flows of ideas as in the
Holy Roman Empire reconciles the diverging results regarding the role of the
printing press in the spread of the Reformation.
French Protestantism is often characterised as an urban phenomenon, but
historical evidence points out that it also penetrated rural areas (Treasure, 2013,
p. 115; Hauser, 1899, pp. 224–7). To take this into account and capture all pockets
of Protestantism located further away than 20 km from a city, I re-estimate
Equation IV.1 at the department level. Table IV.3 reports the results. All the
baseline results remain unchanged.
3.2 The socio-economic effects of the Revocation
The association between Protestantism and literacy. The vast majority of
French Protestants were Calvinists. These later strongly advocated Bible reading
which could have over the generations translated into higher accumulation of
human capital (literacy) in areas with high share of Huguenots. In this section, I
investigate the effect of the spread of Protestantism on the level of literacy at the
department level for the late 17th and 18th century. I estimate equations of the
form:
Literacyj = β1 Huguenotsj + γ Xj + ǫj (IV.2)
where Literacyj denotes the share of grooms able to sign their marriage certificate
in department j circa 1686 and circa 1786. Huguenotsj is a continuous variable
equal to the share of Huguenots in department j around 1670. Xi is a vector of
control variables, and ǫj represents the error term.65 For each regression, robust
standard errors are clustered at the department level. The discussion in Section 1
suggests that Protestantism led to higher literacy rate because people had to read
65 It includes dummy variables for university, bishop, Roman hub and continuous variables forurban population, average summer temperature variability, ruggedness, and latitude.
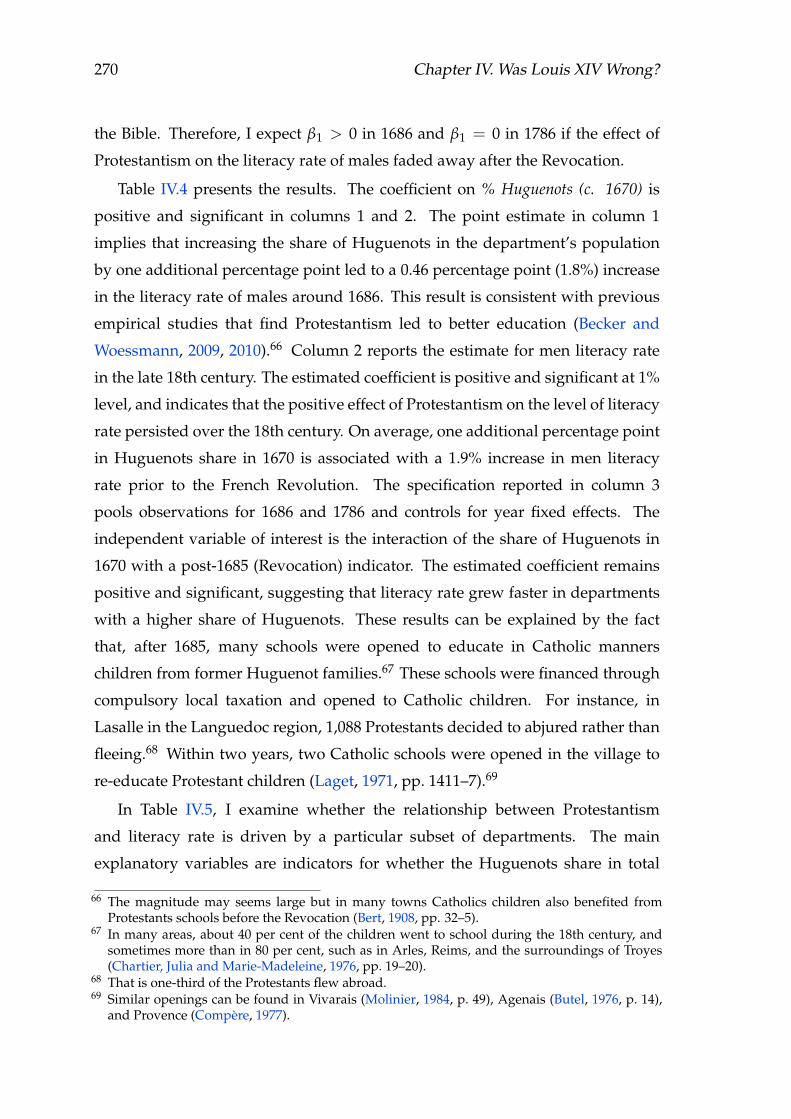
270 Chapter IV. Was Louis XIV Wrong?
the Bible. Therefore, I expect β1 > 0 in 1686 and β1 = 0 in 1786 if the effect of
Protestantism on the literacy rate of males faded away after the Revocation.
Table IV.4 presents the results. The coefficient on % Huguenots (c. 1670) is
positive and significant in columns 1 and 2. The point estimate in column 1
implies that increasing the share of Huguenots in the department’s population
by one additional percentage point led to a 0.46 percentage point (1.8%) increase
in the literacy rate of males around 1686. This result is consistent with previous
empirical studies that find Protestantism led to better education (Becker and
Woessmann, 2009, 2010).66 Column 2 reports the estimate for men literacy rate
in the late 18th century. The estimated coefficient is positive and significant at 1%
level, and indicates that the positive effect of Protestantism on the level of literacy
rate persisted over the 18th century. On average, one additional percentage point
in Huguenots share in 1670 is associated with a 1.9% increase in men literacy
rate prior to the French Revolution. The specification reported in column 3
pools observations for 1686 and 1786 and controls for year fixed effects. The
independent variable of interest is the interaction of the share of Huguenots in
1670 with a post-1685 (Revocation) indicator. The estimated coefficient remains
positive and significant, suggesting that literacy rate grew faster in departments
with a higher share of Huguenots. These results can be explained by the fact
that, after 1685, many schools were opened to educate in Catholic manners
children from former Huguenot families.67 These schools were financed through
compulsory local taxation and opened to Catholic children. For instance, in
Lasalle in the Languedoc region, 1,088 Protestants decided to abjured rather than
fleeing.68 Within two years, two Catholic schools were opened in the village to
re-educate Protestant children (Laget, 1971, pp. 1411–7).69
In Table IV.5, I examine whether the relationship between Protestantism
and literacy rate is driven by a particular subset of departments. The main
explanatory variables are indicators for whether the Huguenots share in total
66 The magnitude may seems large but in many towns Catholics children also benefited fromProtestants schools before the Revocation (Bert, 1908, pp. 32–5).
67 In many areas, about 40 per cent of the children went to school during the 18th century, andsometimes more than in 80 per cent, such as in Arles, Reims, and the surroundings of Troyes(Chartier, Julia and Marie-Madeleine, 1976, pp. 19–20).
68 That is one-third of the Protestants flew abroad.69 Similar openings can be found in Vivarais (Molinier, 1984, p. 49), Agenais (Butel, 1976, p. 14),
and Provence (Compère, 1977).

271
population of department j amounted to: less than 1 per cent; between 1 and 5
per cent; between 5 and 10 per cent; more than 10 per cent. The results indicate
that literacy rate is significantly higher in both 1686 and 1786 in departments
in which at least 10 per cent of the total population was Protestant around
1670. In areas where it represented a very small minority, Protestantism could
not have any effect on the average level of literacy because its spillovers were
restrained to a tiny share of the population. On the contrary, the magnitude of
the coefficients in columns 1 to 3 indicates that Protestantism increased literacy
rate more than proportionally to its population share in departments where it
was well implemented (0.10 ≤ % Huguenots).
Robustness. One potential concern is that results are bias due to measurement
errors if Protestant population estimates and department total population recon-
structions are incorrect. To address this caveat, I collect other proxies of Protestant
implantation in the late 17th century and re-estimate Equation IV.2. Table IV.6,
Table IV.7, and Table IV.8 report the estimated coefficient for β1 using respectively
the total number of Protestant temples in department j, the total number of
Protestant pastors in department j, and the total number of registers of consistory
in department j as the main explanatory variable. The results hold in all the
specifications. Taken together, this evidence suggests that the positive effect of
Protestantism on literacy rate lasted long after the end of the revocation of the
Edict of Nantes in 1685. Another concern is that the effect on literacy rate is driven
by Counter-Reformation policies such as the creation of educational institutions
to spread Catholic education. In this regard, the Jesuits played an important role
in the Counter-Reformation in France and had created more than 100 colleges
before the mid-16th century (Péronnet, 1987). However, results presented in
Table IV.9 suggest that the Jesuit colleges had no direct effect on the literacy rate
of males in the late 17th and late 18th century. Even though instruction was free,
the students came primarily from the local bourgeoisie and the total number of
student enrolled in these colleges was limited. Therefore, their reach was likely
too limited to have a global effect on the level of literacy, in particular in non-
urban areas.
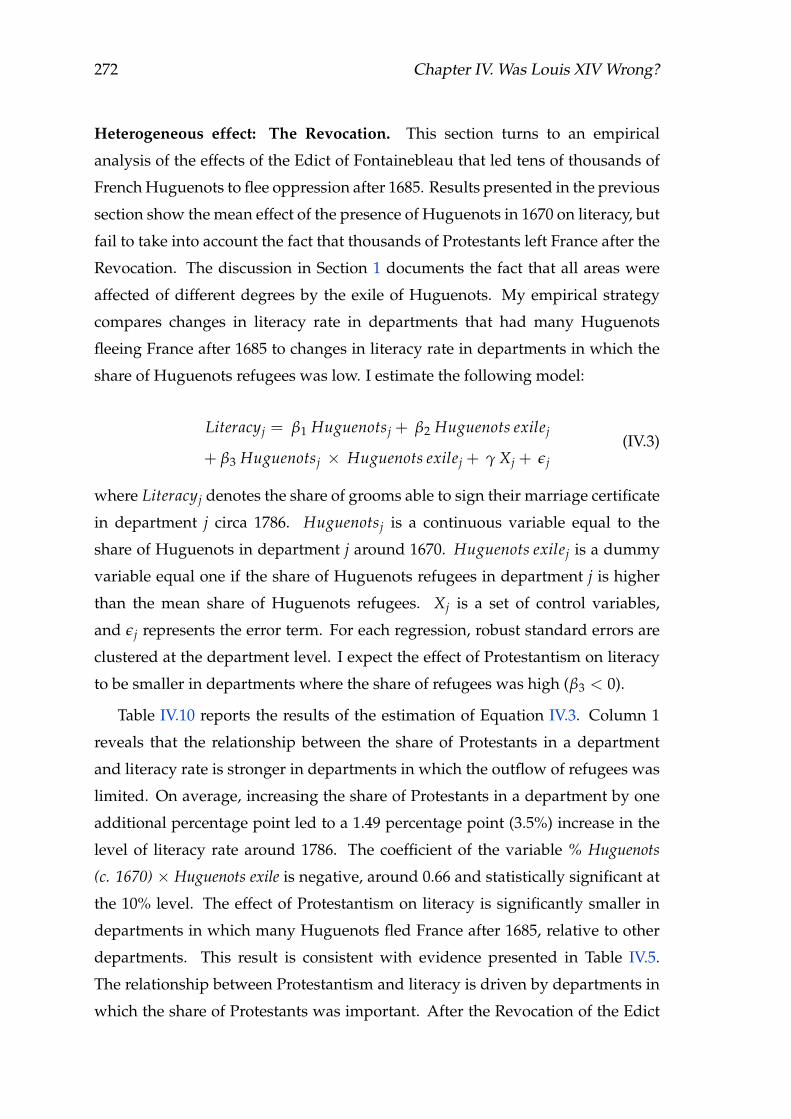
272 Chapter IV. Was Louis XIV Wrong?
Heterogeneous effect: The Revocation. This section turns to an empirical
analysis of the effects of the Edict of Fontainebleau that led tens of thousands of
French Huguenots to flee oppression after 1685. Results presented in the previous
section show the mean effect of the presence of Huguenots in 1670 on literacy, but
fail to take into account the fact that thousands of Protestants left France after the
Revocation. The discussion in Section 1 documents the fact that all areas were
affected of different degrees by the exile of Huguenots. My empirical strategy
compares changes in literacy rate in departments that had many Huguenots
fleeing France after 1685 to changes in literacy rate in departments in which the
share of Huguenots refugees was low. I estimate the following model:
Literacyj = β1 Huguenotsj + β2 Huguenots exilej
+ β3 Huguenotsj × Huguenots exilej + γ Xj + ǫj
(IV.3)
where Literacyj denotes the share of grooms able to sign their marriage certificate
in department j circa 1786. Huguenotsj is a continuous variable equal to the
share of Huguenots in department j around 1670. Huguenots exilej is a dummy
variable equal one if the share of Huguenots refugees in department j is higher
than the mean share of Huguenots refugees. Xj is a set of control variables,
and ǫj represents the error term. For each regression, robust standard errors are
clustered at the department level. I expect the effect of Protestantism on literacy
to be smaller in departments where the share of refugees was high (β3 < 0).
Table IV.10 reports the results of the estimation of Equation IV.3. Column 1
reveals that the relationship between the share of Protestants in a department
and literacy rate is stronger in departments in which the outflow of refugees was
limited. On average, increasing the share of Protestants in a department by one
additional percentage point led to a 1.49 percentage point (3.5%) increase in the
level of literacy rate around 1786. The coefficient of the variable % Huguenots
(c. 1670) × Huguenots exile is negative, around 0.66 and statistically significant at
the 10% level. The effect of Protestantism on literacy is significantly smaller in
departments in which many Huguenots fled France after 1685, relative to other
departments. This result is consistent with evidence presented in Table IV.5.
The relationship between Protestantism and literacy is driven by departments in
which the share of Protestants was important. After the Revocation of the Edict
273
of Nantes, thousands of Protestants left France within few years. The largest part,
however, stayed in France and converted to Catholicism while remaining faithful
to their religion and the reading of the Bible. Thus, that the effect of Protestantism
on literacy is smaller in departments that experienced a larger migration shock is
not surprising.70
Other socio-economic effects of the Revocation. To quantify the socio-economic
effects of Huguenots’ exile in the aftermath of the revocation of the Edict of
Nantes, I compare the changes in yearly wheat prices and the occurrence of food
riots after 1685 in departments that had many Huguenots fleeing to changes in
departments in which the share of Protestant refugees was low. I estimate the
following differences-in-differences specification:
Outcomejt = β1 Huguenotsj × Post1685t + β2 Temperaturejt
+ Departmentj + Yeart + ǫjt
(IV.4)
where Outcomejt is: (i) a dummy variable equal to one if at least one conflict
occurred in department j in year t, and zero otherwise; (ii) the log of the mean
wheat prices in department j. Huguenotsj is a continuous variable equal to the
share of Huguenots in department j around 1670. Post 1685t is a dummy variable
equal one if year t is higher than 1685– the year of the revocation of the Edict of
Nantes–, and zero otherwise. Temperaturejt is a measure of summer temperature
shock in department j in year t. Departmentj controls for time-invariant fixed
effects at the department level, and Yeart accounts for the effect of common time
shocks that affect simultaneously all departments. ǫjt represents the error term.
Table IV.11 reports the results. In columns 1 to 4, the dependent variable is
multiplied by 100, and the coefficient can be read as the likelihood of conflict
expressed in percentage points. Columns 1 and 2 report the mean effect of the
share of Huguenots in a department on the likelihood of conflicts after 1685.
Departments that had a larger share of Huguenots prior to the Revocation ex-
70 An empirical concern is that the share of Huguenot refugees might vary by department, perhapsdue to changes in migration (transportation) costs or changes in the level of persecution.Distance to border or distance to the main ports are nonetheless not valid instrument for theexile of Huguenots. That means that I can not rule out the potential endogeneity of the exile ofHuguenots.
274 Chapter IV. Was Louis XIV Wrong?
perienced less social conflicts after 1685. They also experienced less subsistence-
related conflicts, such as food riots and looting of public granary, even though
there was no difference in the level of wheat prices (column 5). Although
the mechanism remains unclear, these results suggest that departments with
higher share of Huguenots were doing better in economic terms, as measured
by the level of social unrest. In columns 3 and 4, I add an interaction term
Huguenotsj × Post1685t × Huguenots exilej to Equation IV.4 to take into account
the impact of Huguenots’ exile after 1685. The coefficients on % Huguenots (c.
1670) become statistically insignificant. In columns 3 and 4, the coefficients on
the interaction term are negative and statistically significant. The point estimate
implies that departments in which the share of Huguenot refugees was above
the mean share of Huguenot refugees experienced on average 5.2% less social
conflicts and 6.7% less subsistence-related conflicts after the Revocation in 1685.
That means that the mean effect observed in columns 1 and 2 is driven by
departments with high share of Huguenot refugees.
Scoville (1960) emphasises that as many Huguenots fled to Switzerland
and Germany, land laid uncultivated and quickly reverted to wilderness. In
particular, he points out that these temporarily dislocations in agriculture could
have made worse the standards of living of Frenchmen– which was already very
close to the subsistence level in normal year. However, the absence of figures
on yield and agricultural production makes it hard to draw conclusions about
the extent to which farming was affected by the departure of Huguenots.71 I
examine this question by investigating whether changes in wheat prices after
1685 were different between departments with a high share of Protestants (high
share of Huguenot refugees) and the rest of departments. Results are reported in
columns 5 and 6 of Table IV.11. All coefficients are not significantly different from
zero, which implies that, after 1685, wheat prices were not higher in departments
that had a larger share of Huguenots in 1670 or that experienced a population
drop due to migration after 1685, net the annual weather conditions, and other
controls. Although, these former departments experienced significantly less
71 One could imagine that the exodus had a negative effect on total agricultural outcome ifa significant share of the Protestants’ land remained uncultivated after 1685 or if Catholicsconsistently farmed the land less effectively than their counterparts. There is, however, nohistorical evidence to support this claim. See Section 1 for more details.

275
subsistence-related conflicts, which suggests that the relative standards of living
of their inhabitants might have been higher, at least temporarily. To the extent
that wheat prices represented local conditions of agricultural output, these results
indicate that agricultural production remained quite stable after the departure of
Huguenots or at least declined less rapidly than the local population (demand)
leaving peasants better off in areas with higher share of migration. For in-
stance, during the summer 1686, the intendants of Burgundy and Franche-Comté
reported that the unexpected exodus of Huguenots left more grains available
than the population could consume (Scoville, 1960, pp. 308–9). In addition if
the Revocation created labour shortages in these departments, wages may have
increased whereas the level of crop prices remained unchanged, leading to higher
real wages. Huguenots who decided to stay in these departments may also have
benefited from favourable economic conditions: tax breaks granted by Louis XIV,
properties and economic capital left behind by the family members who fled,
increased opportunities in craftsmanship induced by lower competition, and the
like.72
4 Conclusion
In this chapter, I used a new data set on the spread of Protestantism in early
modern France to study the causes and the socio-economic consequences of the
Reformation. I show that the presence of collegiate churches pre-empted the
implementation of Protestantism at the city level. This result provides further
support to the idea that cultural factors are as much important as economic
determinants in explaining the diffusion of Protestantism. I also provide tentative
evidence that printing presses reduced the likelihood a town housed Protestant
temples by 1567. Due to legal constraints, presses fostered the diffusion of
72 For instance, Villard (1978, pp. 64–6) reports the case of the Pastor Morand who abjuredduring the spring 1685 and wrote to the intendant to claim an annual pension of £400.In his correspondence with Versailles, the intendant, Thomas-Alexandre Morant, wrote thatproviding new “gratification could result in the in new conversion in this place where most ofthe inhabitants are Protestant”.
276 Chapter IV. Was Louis XIV Wrong?
Catholic propaganda rather than evangelical ideas.73
In the second part of the chapter, I turn to the analysis of the effect of Protes-
tantism on the literacy rate. I find support for the hypothesis that Protestantism
led to better education. Increasing the share of Huguenots in the department’s
population by one additional percentage point led to a 0.46 percentage point
(1.8%) increase in the level of men literacy rate around 1686. The effect persisted
until the late 18th century.
Finally, I explore the economic consequences of the exodus of Huguenots after
the revocation of the Edict of Nantes. I find that the departure of Huguenots for
countries of refuge had no effect on agricultural productivity, as measured by
annual changes in wheat prices. Departments with a higher share of refugees,
nonetheless, experienced less subsistence-related conflicts after 1685, which could
suggest that remaining population of these departments could have benefited in
the short run from higher living standards, than those of departments not affected
by the exodus of Huguenots.
So, was Louis XIV wrong? Or, more precisely, was the revocation of the Edict
of Nantes so dreadful for the French economy? Although analysing precisely
the evolution of the economy in the late 17th century is a difficult task, evidence
presented in this chapter suggest that the fled of the Huguenot refugees might
have not been as detrimental as suggested by many contemporaries and the
historiography.
73 By no means, I suggest that only these two factors drove all individuals’ decision to shiftfrom Catholicism to Protestantism. Treasure (2013, p. 106) reminds that, at the local level,“experiences of conversion varied between social groups and towns, provinces and even pays”,so that it is futile to look for a single cause to explain the remarkable surge of evangelical faith.
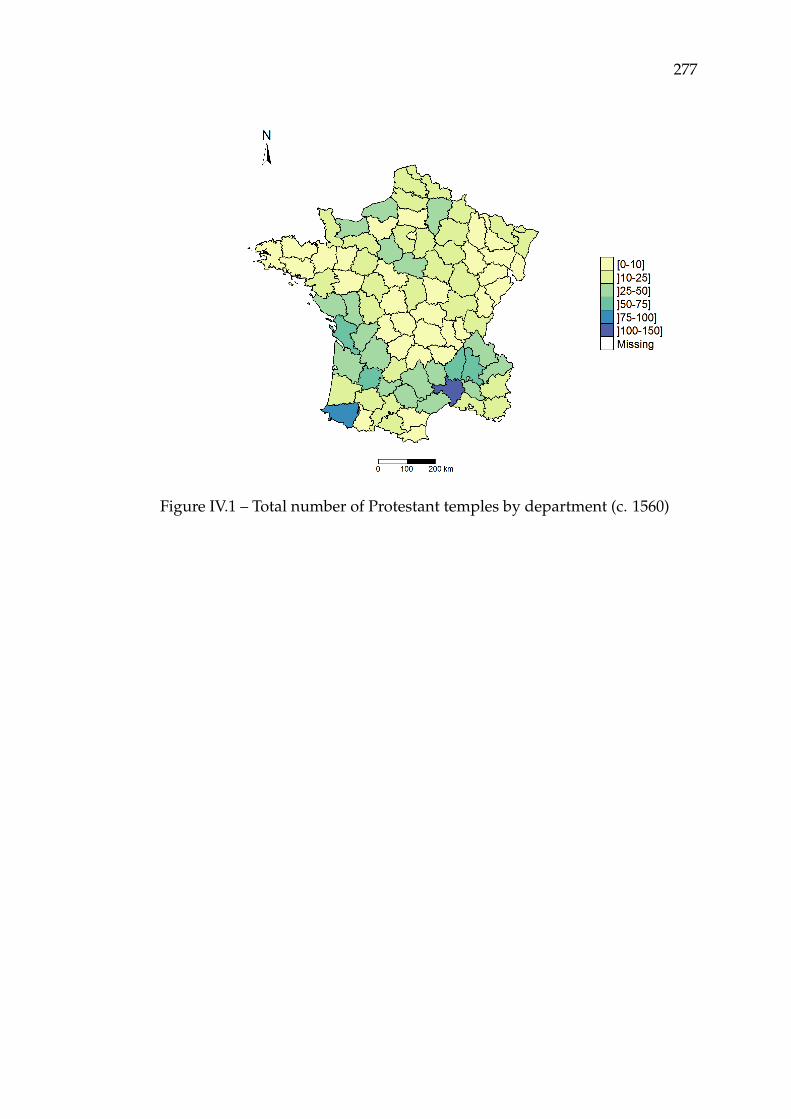
277
Figure IV.1 – Total number of Protestant temples by department (c. 1560)
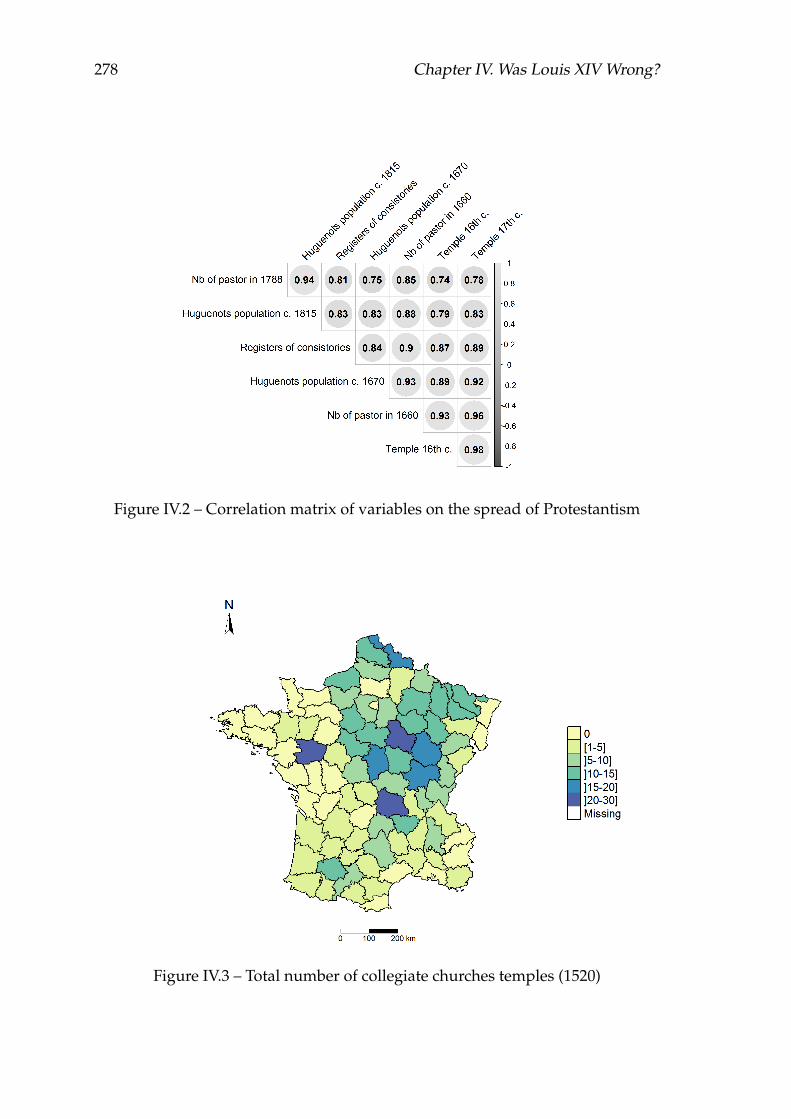
278 Chapter IV. Was Louis XIV Wrong?
Figure IV.2 – Correlation matrix of variables on the spread of Protestantism
Figure IV.3 – Total number of collegiate churches temples (1520)

279
Figure IV.4 – Share of Huguenots in total department population (c. 1670)
Figure IV.5 – Share of Huguenot refugees in total department population (1686–1700)
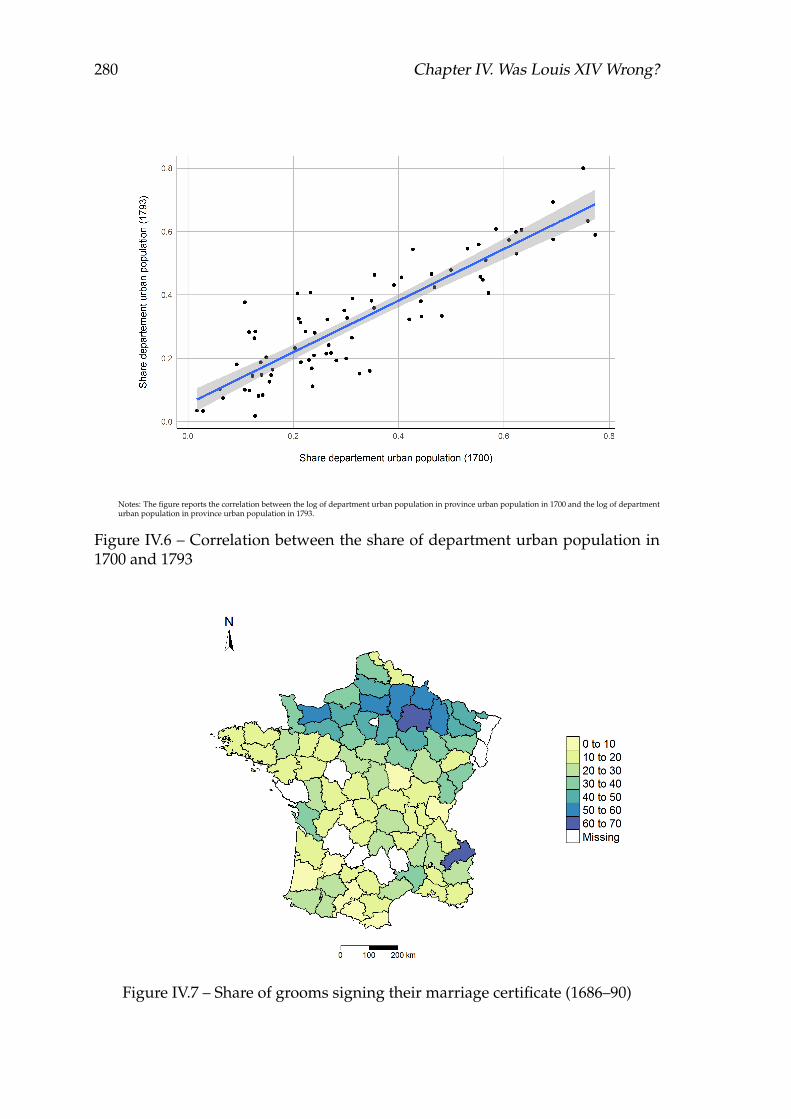
280 Chapter IV. Was Louis XIV Wrong?
Notes: The figure reports the correlation between the log of department urban population in province urban population in 1700 and the log of departmenturban population in province urban population in 1793.
Figure IV.6 – Correlation between the share of department urban population in1700 and 1793
Figure IV.7 – Share of grooms signing their marriage certificate (1686–90)
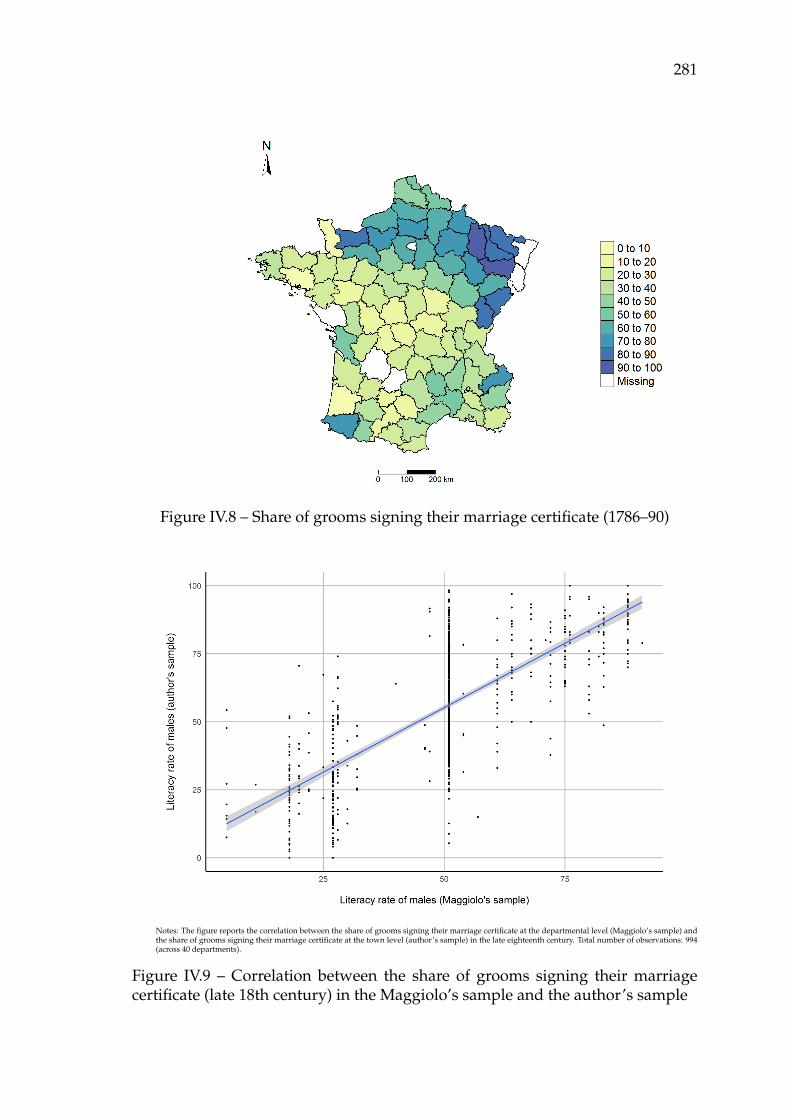
281
Figure IV.8 – Share of grooms signing their marriage certificate (1786–90)
Notes: The figure reports the correlation between the share of grooms signing their marriage certificate at the departmental level (Maggiolo’s sample) andthe share of grooms signing their marriage certificate at the town level (author’s sample) in the late eighteenth century. Total number of observations: 994(across 40 departments).
Figure IV.9 – Correlation between the share of grooms signing their marriagecertificate (late 18th century) in the Maggiolo’s sample and the author’s sample

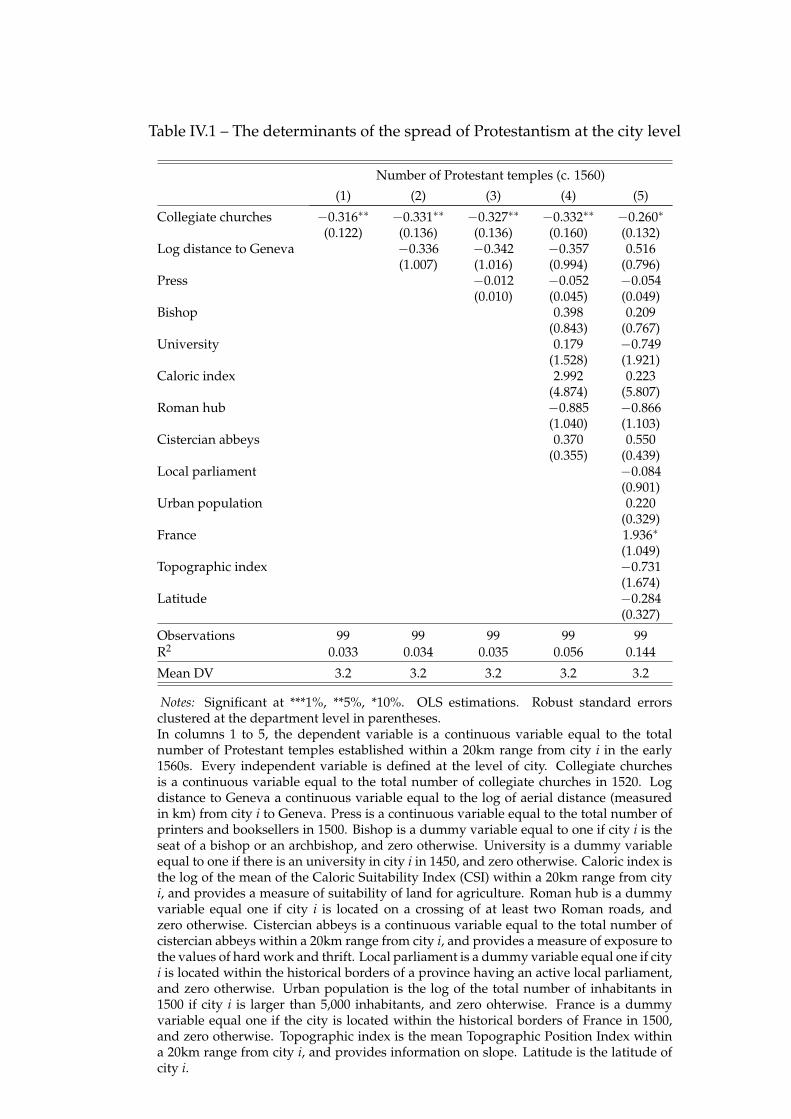
Table IV.1 – The determinants of the spread of Protestantism at the city level
Number of Protestant temples (c. 1560)
(1) (2) (3) (4) (5)
Collegiate churches −0.316∗∗ −0.331∗∗ −0.327∗∗ −0.332∗∗ −0.260∗
(0.122) (0.136) (0.136) (0.160) (0.132)Log distance to Geneva −0.336 −0.342 −0.357 0.516
(1.007) (1.016) (0.994) (0.796)Press −0.012 −0.052 −0.054
(0.010) (0.045) (0.049)Bishop 0.398 0.209
(0.843) (0.767)University 0.179 −0.749
(1.528) (1.921)Caloric index 2.992 0.223
(4.874) (5.807)Roman hub −0.885 −0.866
(1.040) (1.103)Cistercian abbeys 0.370 0.550
(0.355) (0.439)Local parliament −0.084
(0.901)Urban population 0.220
(0.329)France 1.936∗
(1.049)Topographic index −0.731
(1.674)Latitude −0.284
(0.327)
Observations 99 99 99 99 99R2 0.033 0.034 0.035 0.056 0.144
Mean DV 3.2 3.2 3.2 3.2 3.2
Notes: Significant at ***1%, **5%, *10%. OLS estimations. Robust standard errorsclustered at the department level in parentheses.In columns 1 to 5, the dependent variable is a continuous variable equal to the totalnumber of Protestant temples established within a 20km range from city i in the early1560s. Every independent variable is defined at the level of city. Collegiate churchesis a continuous variable equal to the total number of collegiate churches in 1520. Logdistance to Geneva a continuous variable equal to the log of aerial distance (measuredin km) from city i to Geneva. Press is a continuous variable equal to the total number ofprinters and booksellers in 1500. Bishop is a dummy variable equal to one if city i is theseat of a bishop or an archbishop, and zero otherwise. University is a dummy variableequal to one if there is an university in city i in 1450, and zero otherwise. Caloric index isthe log of the mean of the Caloric Suitability Index (CSI) within a 20km range from cityi, and provides a measure of suitability of land for agriculture. Roman hub is a dummyvariable equal one if city i is located on a crossing of at least two Roman roads, andzero otherwise. Cistercian abbeys is a continuous variable equal to the total number ofcistercian abbeys within a 20km range from city i, and provides a measure of exposure tothe values of hard work and thrift. Local parliament is a dummy variable equal one if cityi is located within the historical borders of a province having an active local parliament,and zero otherwise. Urban population is the log of the total number of inhabitants in1500 if city i is larger than 5,000 inhabitants, and zero ohterwise. France is a dummyvariable equal one if the city is located within the historical borders of France in 1500,and zero otherwise. Topographic index is the mean Topographic Position Index withina 20km range from city i, and provides information on slope. Latitude is the latitude ofcity i.
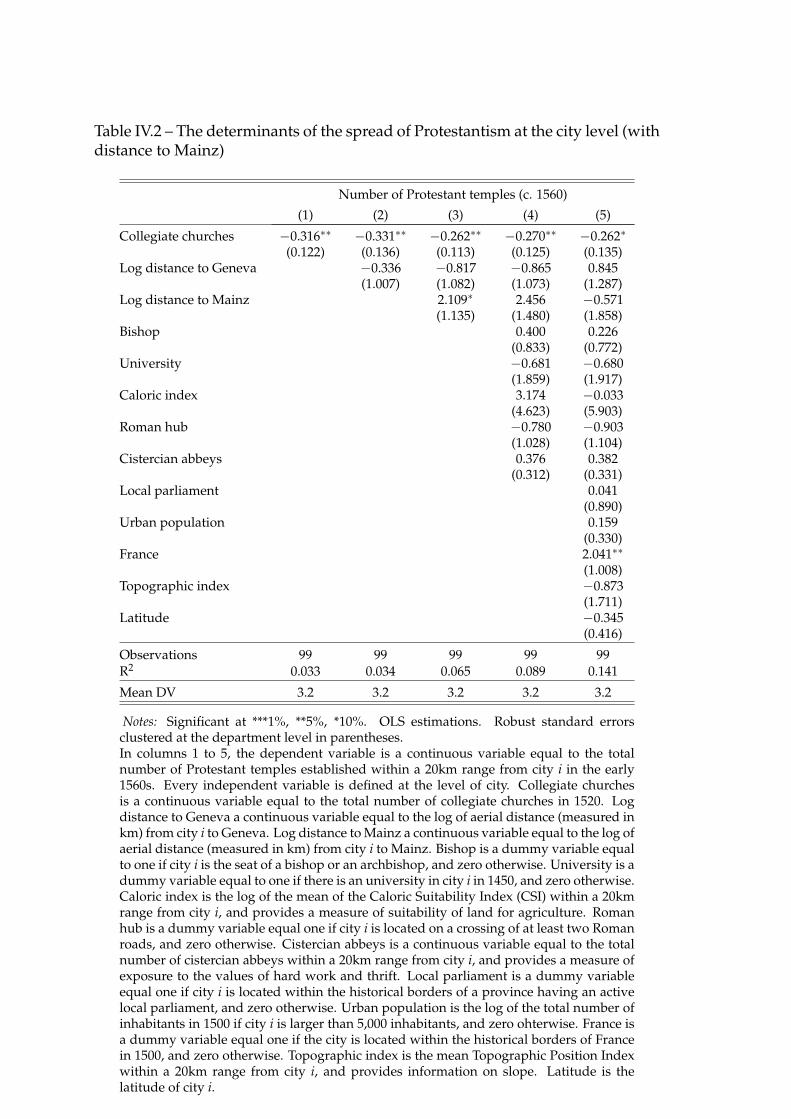
Table IV.2 – The determinants of the spread of Protestantism at the city level (withdistance to Mainz)
Number of Protestant temples (c. 1560)
(1) (2) (3) (4) (5)
Collegiate churches −0.316∗∗ −0.331∗∗ −0.262∗∗ −0.270∗∗ −0.262∗
(0.122) (0.136) (0.113) (0.125) (0.135)Log distance to Geneva −0.336 −0.817 −0.865 0.845
(1.007) (1.082) (1.073) (1.287)Log distance to Mainz 2.109∗ 2.456 −0.571
(1.135) (1.480) (1.858)Bishop 0.400 0.226
(0.833) (0.772)University −0.681 −0.680
(1.859) (1.917)Caloric index 3.174 −0.033
(4.623) (5.903)Roman hub −0.780 −0.903
(1.028) (1.104)Cistercian abbeys 0.376 0.382
(0.312) (0.331)Local parliament 0.041
(0.890)Urban population 0.159
(0.330)France 2.041∗∗
(1.008)Topographic index −0.873
(1.711)Latitude −0.345
(0.416)
Observations 99 99 99 99 99R2 0.033 0.034 0.065 0.089 0.141
Mean DV 3.2 3.2 3.2 3.2 3.2
Notes: Significant at ***1%, **5%, *10%. OLS estimations. Robust standard errorsclustered at the department level in parentheses.In columns 1 to 5, the dependent variable is a continuous variable equal to the totalnumber of Protestant temples established within a 20km range from city i in the early1560s. Every independent variable is defined at the level of city. Collegiate churchesis a continuous variable equal to the total number of collegiate churches in 1520. Logdistance to Geneva a continuous variable equal to the log of aerial distance (measured inkm) from city i to Geneva. Log distance to Mainz a continuous variable equal to the log ofaerial distance (measured in km) from city i to Mainz. Bishop is a dummy variable equalto one if city i is the seat of a bishop or an archbishop, and zero otherwise. University is adummy variable equal to one if there is an university in city i in 1450, and zero otherwise.Caloric index is the log of the mean of the Caloric Suitability Index (CSI) within a 20kmrange from city i, and provides a measure of suitability of land for agriculture. Romanhub is a dummy variable equal one if city i is located on a crossing of at least two Romanroads, and zero otherwise. Cistercian abbeys is a continuous variable equal to the totalnumber of cistercian abbeys within a 20km range from city i, and provides a measure ofexposure to the values of hard work and thrift. Local parliament is a dummy variableequal one if city i is located within the historical borders of a province having an activelocal parliament, and zero otherwise. Urban population is the log of the total number ofinhabitants in 1500 if city i is larger than 5,000 inhabitants, and zero ohterwise. France isa dummy variable equal one if the city is located within the historical borders of Francein 1500, and zero otherwise. Topographic index is the mean Topographic Position Indexwithin a 20km range from city i, and provides information on slope. Latitude is thelatitude of city i.
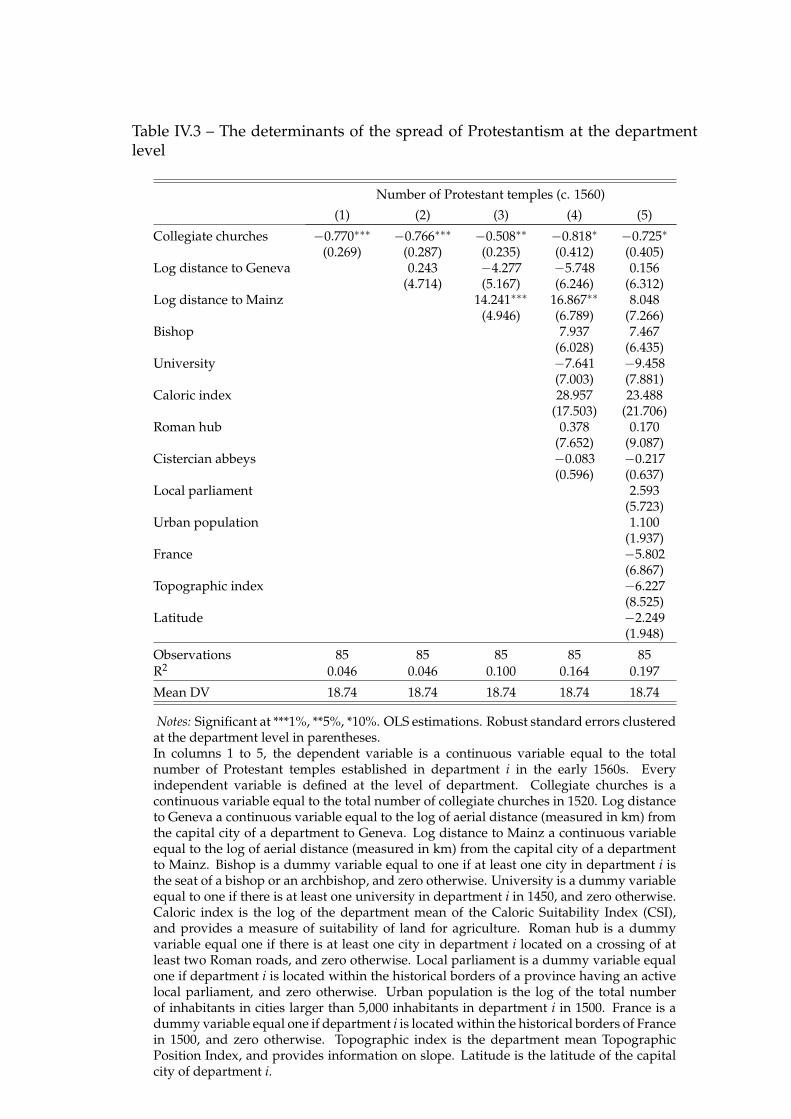
Table IV.3 – The determinants of the spread of Protestantism at the departmentlevel
Number of Protestant temples (c. 1560)
(1) (2) (3) (4) (5)
Collegiate churches −0.770∗∗∗ −0.766∗∗∗ −0.508∗∗ −0.818∗ −0.725∗
(0.269) (0.287) (0.235) (0.412) (0.405)Log distance to Geneva 0.243 −4.277 −5.748 0.156
(4.714) (5.167) (6.246) (6.312)Log distance to Mainz 14.241∗∗∗ 16.867∗∗ 8.048
(4.946) (6.789) (7.266)Bishop 7.937 7.467
(6.028) (6.435)University −7.641 −9.458
(7.003) (7.881)Caloric index 28.957 23.488
(17.503) (21.706)Roman hub 0.378 0.170
(7.652) (9.087)Cistercian abbeys −0.083 −0.217
(0.596) (0.637)Local parliament 2.593
(5.723)Urban population 1.100
(1.937)France −5.802
(6.867)Topographic index −6.227
(8.525)Latitude −2.249
(1.948)
Observations 85 85 85 85 85R2 0.046 0.046 0.100 0.164 0.197
Mean DV 18.74 18.74 18.74 18.74 18.74
Notes: Significant at ***1%, **5%, *10%. OLS estimations. Robust standard errors clusteredat the department level in parentheses.In columns 1 to 5, the dependent variable is a continuous variable equal to the totalnumber of Protestant temples established in department i in the early 1560s. Everyindependent variable is defined at the level of department. Collegiate churches is acontinuous variable equal to the total number of collegiate churches in 1520. Log distanceto Geneva a continuous variable equal to the log of aerial distance (measured in km) fromthe capital city of a department to Geneva. Log distance to Mainz a continuous variableequal to the log of aerial distance (measured in km) from the capital city of a departmentto Mainz. Bishop is a dummy variable equal to one if at least one city in department i isthe seat of a bishop or an archbishop, and zero otherwise. University is a dummy variableequal to one if there is at least one university in department i in 1450, and zero otherwise.Caloric index is the log of the department mean of the Caloric Suitability Index (CSI),and provides a measure of suitability of land for agriculture. Roman hub is a dummyvariable equal one if there is at least one city in department i located on a crossing of atleast two Roman roads, and zero otherwise. Local parliament is a dummy variable equalone if department i is located within the historical borders of a province having an activelocal parliament, and zero otherwise. Urban population is the log of the total numberof inhabitants in cities larger than 5,000 inhabitants in department i in 1500. France is adummy variable equal one if department i is located within the historical borders of Francein 1500, and zero otherwise. Topographic index is the department mean TopographicPosition Index, and provides information on slope. Latitude is the latitude of the capitalcity of department i.
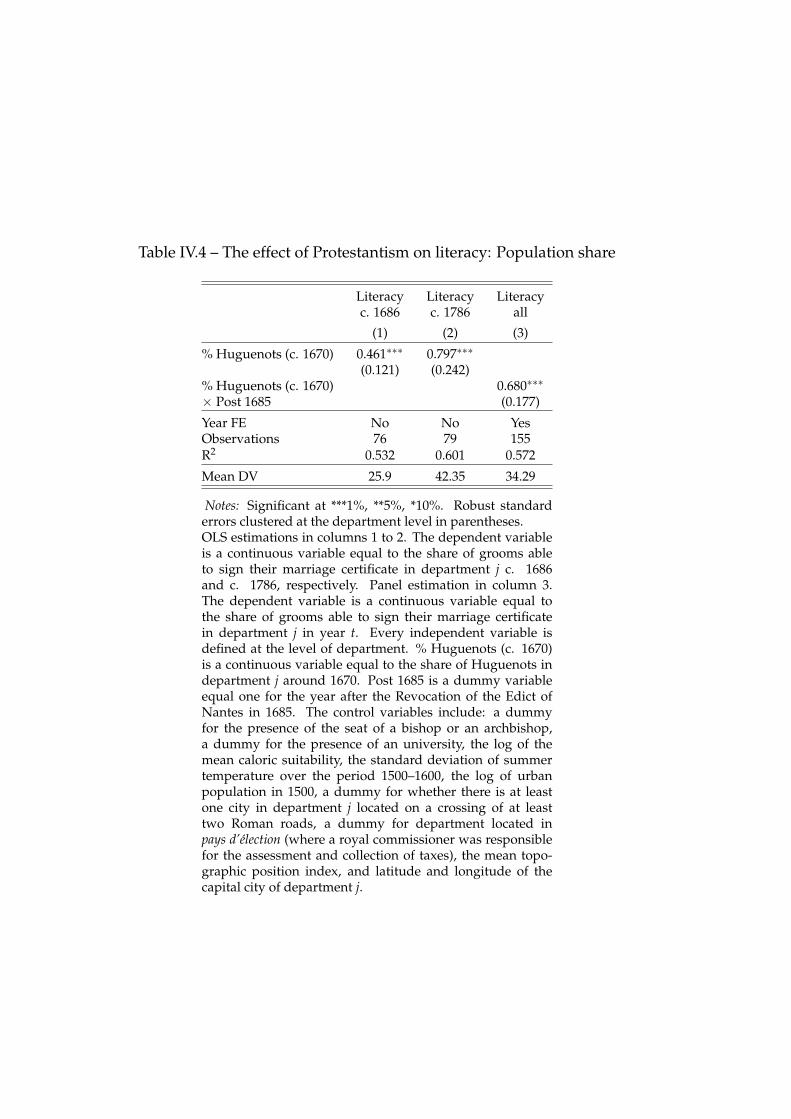
Table IV.4 – The effect of Protestantism on literacy: Population share
Literacy Literacy Literacyc. 1686 c. 1786 all
(1) (2) (3)
% Huguenots (c. 1670) 0.461∗∗∗ 0.797∗∗∗
(0.121) (0.242)% Huguenots (c. 1670) 0.680∗∗∗
× Post 1685 (0.177)
Year FE No No YesObservations 76 79 155R2 0.532 0.601 0.572
Mean DV 25.9 42.35 34.29
Notes: Significant at ***1%, **5%, *10%. Robust standarderrors clustered at the department level in parentheses.OLS estimations in columns 1 to 2. The dependent variableis a continuous variable equal to the share of grooms ableto sign their marriage certificate in department j c. 1686and c. 1786, respectively. Panel estimation in column 3.The dependent variable is a continuous variable equal tothe share of grooms able to sign their marriage certificatein department j in year t. Every independent variable isdefined at the level of department. % Huguenots (c. 1670)is a continuous variable equal to the share of Huguenots indepartment j around 1670. Post 1685 is a dummy variableequal one for the year after the Revocation of the Edict ofNantes in 1685. The control variables include: a dummyfor the presence of the seat of a bishop or an archbishop,a dummy for the presence of an university, the log of themean caloric suitability, the standard deviation of summertemperature over the period 1500–1600, the log of urbanpopulation in 1500, a dummy for whether there is at leastone city in department j located on a crossing of at leasttwo Roman roads, a dummy for department located inpays d’élection (where a royal commissioner was responsiblefor the assessment and collection of taxes), the mean topo-graphic position index, and latitude and longitude of thecapital city of department j.
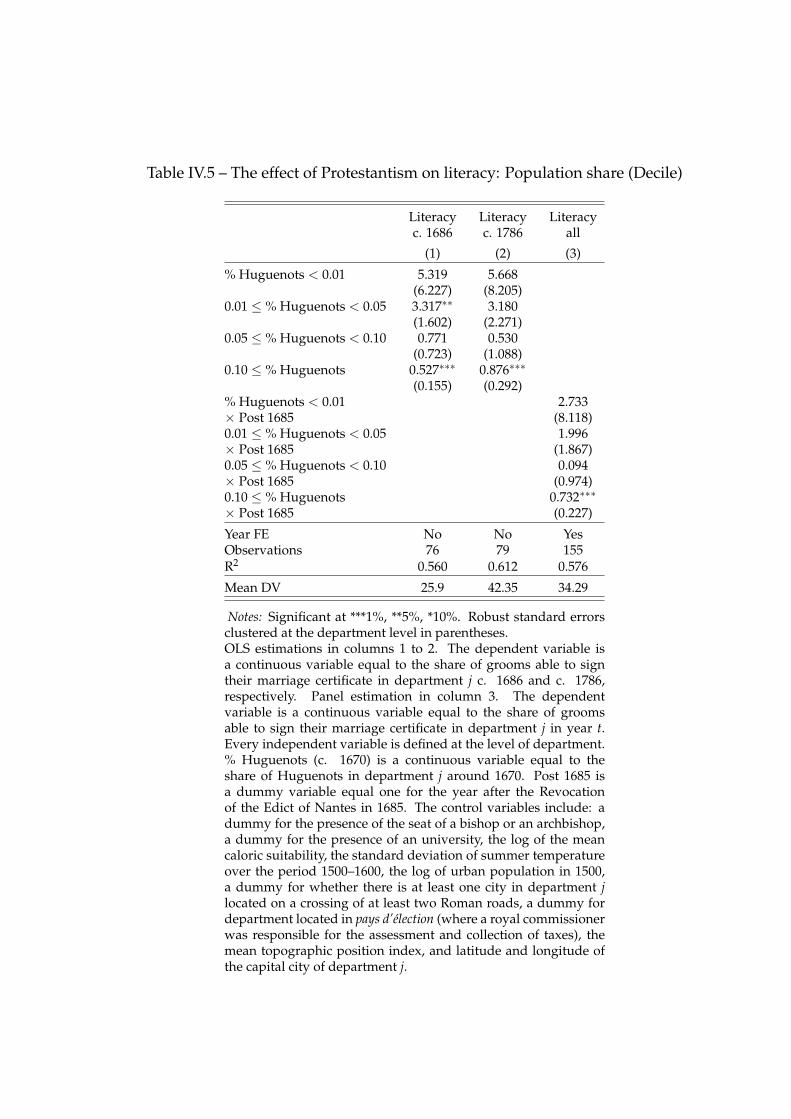
Table IV.5 – The effect of Protestantism on literacy: Population share (Decile)
Literacy Literacy Literacyc. 1686 c. 1786 all
(1) (2) (3)
% Huguenots < 0.01 5.319 5.668(6.227) (8.205)
0.01 ≤ % Huguenots < 0.05 3.317∗∗ 3.180(1.602) (2.271)
0.05 ≤ % Huguenots < 0.10 0.771 0.530(0.723) (1.088)
0.10 ≤ % Huguenots 0.527∗∗∗ 0.876∗∗∗
(0.155) (0.292)% Huguenots < 0.01 2.733× Post 1685 (8.118)0.01 ≤ % Huguenots < 0.05 1.996× Post 1685 (1.867)0.05 ≤ % Huguenots < 0.10 0.094× Post 1685 (0.974)0.10 ≤ % Huguenots 0.732∗∗∗
× Post 1685 (0.227)
Year FE No No YesObservations 76 79 155R2 0.560 0.612 0.576
Mean DV 25.9 42.35 34.29
Notes: Significant at ***1%, **5%, *10%. Robust standard errorsclustered at the department level in parentheses.OLS estimations in columns 1 to 2. The dependent variable isa continuous variable equal to the share of grooms able to signtheir marriage certificate in department j c. 1686 and c. 1786,respectively. Panel estimation in column 3. The dependentvariable is a continuous variable equal to the share of groomsable to sign their marriage certificate in department j in year t.Every independent variable is defined at the level of department.% Huguenots (c. 1670) is a continuous variable equal to theshare of Huguenots in department j around 1670. Post 1685 isa dummy variable equal one for the year after the Revocationof the Edict of Nantes in 1685. The control variables include: adummy for the presence of the seat of a bishop or an archbishop,a dummy for the presence of an university, the log of the meancaloric suitability, the standard deviation of summer temperatureover the period 1500–1600, the log of urban population in 1500,a dummy for whether there is at least one city in department jlocated on a crossing of at least two Roman roads, a dummy fordepartment located in pays d’élection (where a royal commissionerwas responsible for the assessment and collection of taxes), themean topographic position index, and latitude and longitude ofthe capital city of department j.
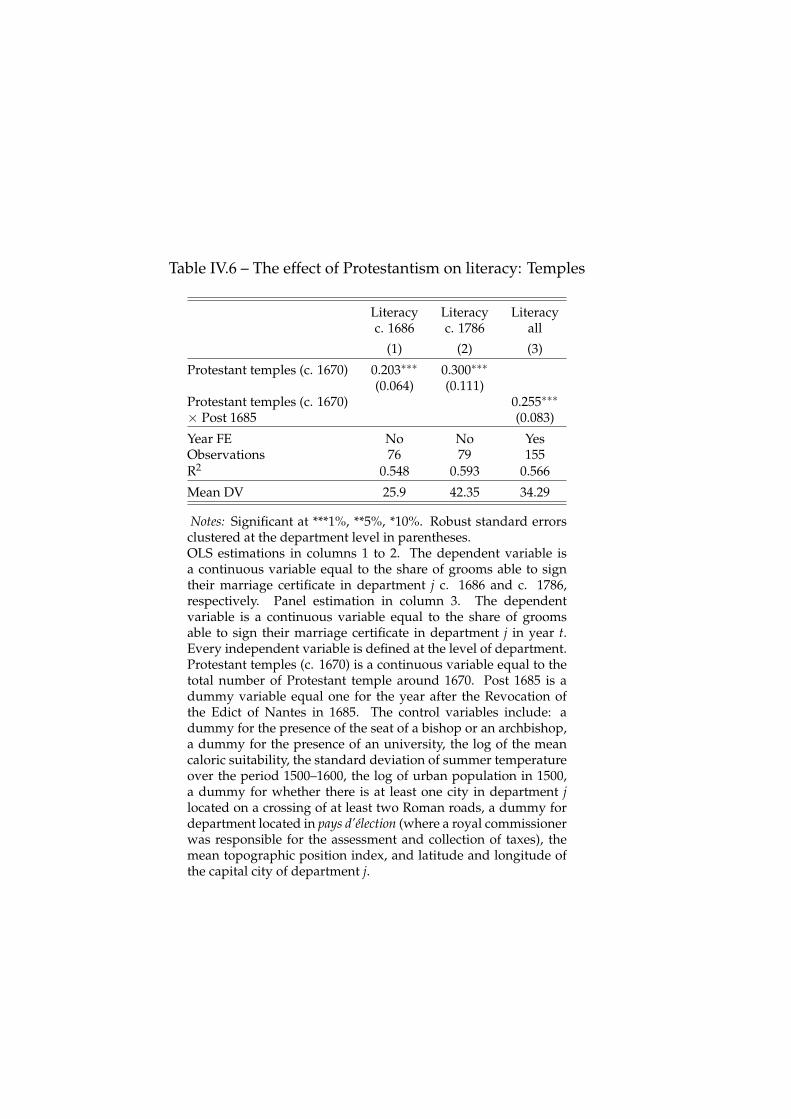
Table IV.6 – The effect of Protestantism on literacy: Temples
Literacy Literacy Literacyc. 1686 c. 1786 all
(1) (2) (3)
Protestant temples (c. 1670) 0.203∗∗∗ 0.300∗∗∗
(0.064) (0.111)Protestant temples (c. 1670) 0.255∗∗∗
× Post 1685 (0.083)
Year FE No No YesObservations 76 79 155R2 0.548 0.593 0.566
Mean DV 25.9 42.35 34.29
Notes: Significant at ***1%, **5%, *10%. Robust standard errorsclustered at the department level in parentheses.OLS estimations in columns 1 to 2. The dependent variable isa continuous variable equal to the share of grooms able to signtheir marriage certificate in department j c. 1686 and c. 1786,respectively. Panel estimation in column 3. The dependentvariable is a continuous variable equal to the share of groomsable to sign their marriage certificate in department j in year t.Every independent variable is defined at the level of department.Protestant temples (c. 1670) is a continuous variable equal to thetotal number of Protestant temple around 1670. Post 1685 is adummy variable equal one for the year after the Revocation ofthe Edict of Nantes in 1685. The control variables include: adummy for the presence of the seat of a bishop or an archbishop,a dummy for the presence of an university, the log of the meancaloric suitability, the standard deviation of summer temperatureover the period 1500–1600, the log of urban population in 1500,a dummy for whether there is at least one city in department jlocated on a crossing of at least two Roman roads, a dummy fordepartment located in pays d’élection (where a royal commissionerwas responsible for the assessment and collection of taxes), themean topographic position index, and latitude and longitude ofthe capital city of department j.

Table IV.7 – The effect of Protestantism on literacy: Pastors
Literacy Literacy Literacyc. 1686 c. 1786 all
(1) (2) (3)
Protestant pastors (1660) 0.275∗∗ 0.460∗∗
(0.107) (0.182)Protestant pastors (1660) 0.432∗∗∗
× Post 1685 (0.142)
Year FE No No YesObservations 66 69 135R2 0.621 0.546 0.573
Mean DV 26.35 39.72 33.18
Notes: Significant at ***1%, **5%, *10%. Robust standard errorsclustered at the department level in parentheses.OLS estimations in columns 1 to 2. The dependent variableis a continuous variable equal to the share of grooms able tosign their marriage certificate in department j c. 1686 andc. 1786, respectively. Panel estimation in column 3. Thedependent variable is a continuous variable equal to the shareof grooms able to sign their marriage certificate in departmentj in year t. Every independent variable is defined at thelevel of department. Protestant pastors (1660) is a continuousvariable equal to the total number of Protestant pastors in 1660.Post 1685 is a dummy variable equal one for the year afterthe Revocation of the Edict of Nantes in 1685. The controlvariables include: a dummy for the presence of the seat ofa bishop or an archbishop, a dummy for the presence of anuniversity, the log of the mean caloric suitability, the standarddeviation of summer temperature over the period 1500–1600,the log of urban population in 1500, a dummy for whetherthere is at least one city in department j located on a crossing ofat least two Roman roads, a dummy for department located inpays d’élection (where a royal commissioner was responsible forthe assessment and collection of taxes), the mean topographicposition index, and latitude and longitude of the capital city ofdepartment j.
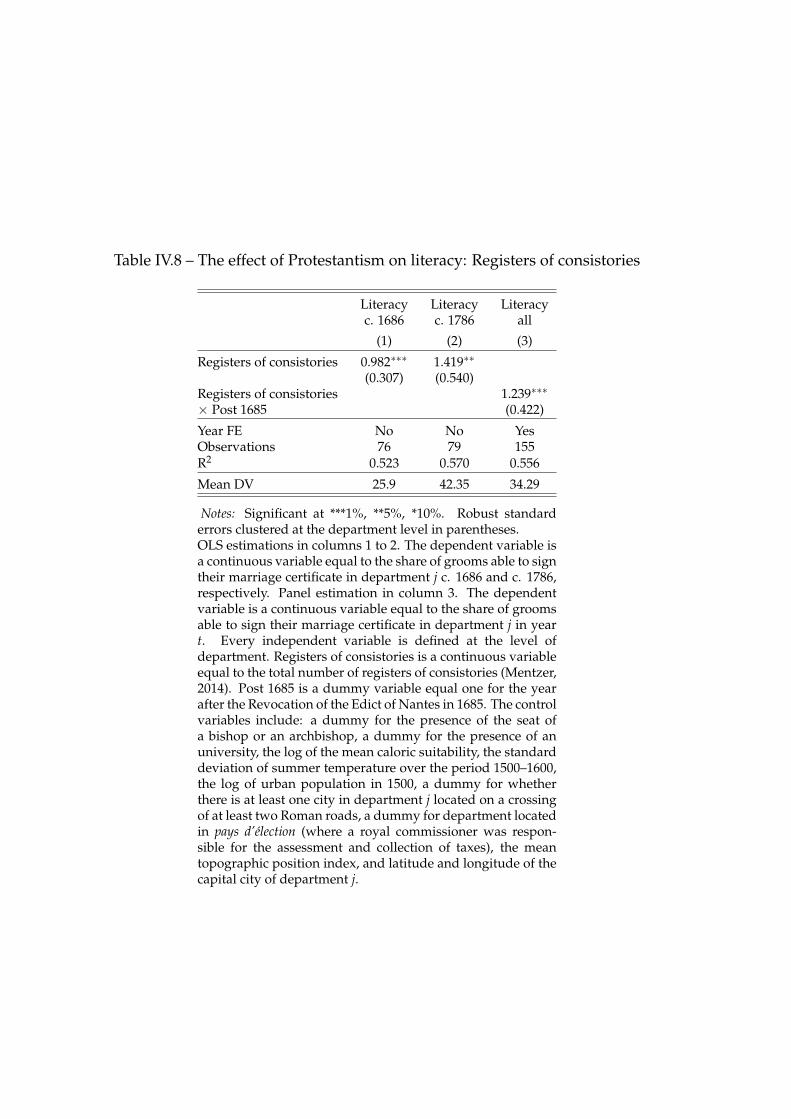
Table IV.8 – The effect of Protestantism on literacy: Registers of consistories
Literacy Literacy Literacyc. 1686 c. 1786 all
(1) (2) (3)
Registers of consistories 0.982∗∗∗ 1.419∗∗
(0.307) (0.540)Registers of consistories 1.239∗∗∗
× Post 1685 (0.422)
Year FE No No YesObservations 76 79 155R2 0.523 0.570 0.556
Mean DV 25.9 42.35 34.29
Notes: Significant at ***1%, **5%, *10%. Robust standarderrors clustered at the department level in parentheses.OLS estimations in columns 1 to 2. The dependent variable isa continuous variable equal to the share of grooms able to signtheir marriage certificate in department j c. 1686 and c. 1786,respectively. Panel estimation in column 3. The dependentvariable is a continuous variable equal to the share of groomsable to sign their marriage certificate in department j in yeart. Every independent variable is defined at the level ofdepartment. Registers of consistories is a continuous variableequal to the total number of registers of consistories (Mentzer,2014). Post 1685 is a dummy variable equal one for the yearafter the Revocation of the Edict of Nantes in 1685. The controlvariables include: a dummy for the presence of the seat ofa bishop or an archbishop, a dummy for the presence of anuniversity, the log of the mean caloric suitability, the standarddeviation of summer temperature over the period 1500–1600,the log of urban population in 1500, a dummy for whetherthere is at least one city in department j located on a crossingof at least two Roman roads, a dummy for department locatedin pays d’élection (where a royal commissioner was respon-sible for the assessment and collection of taxes), the meantopographic position index, and latitude and longitude of thecapital city of department j.
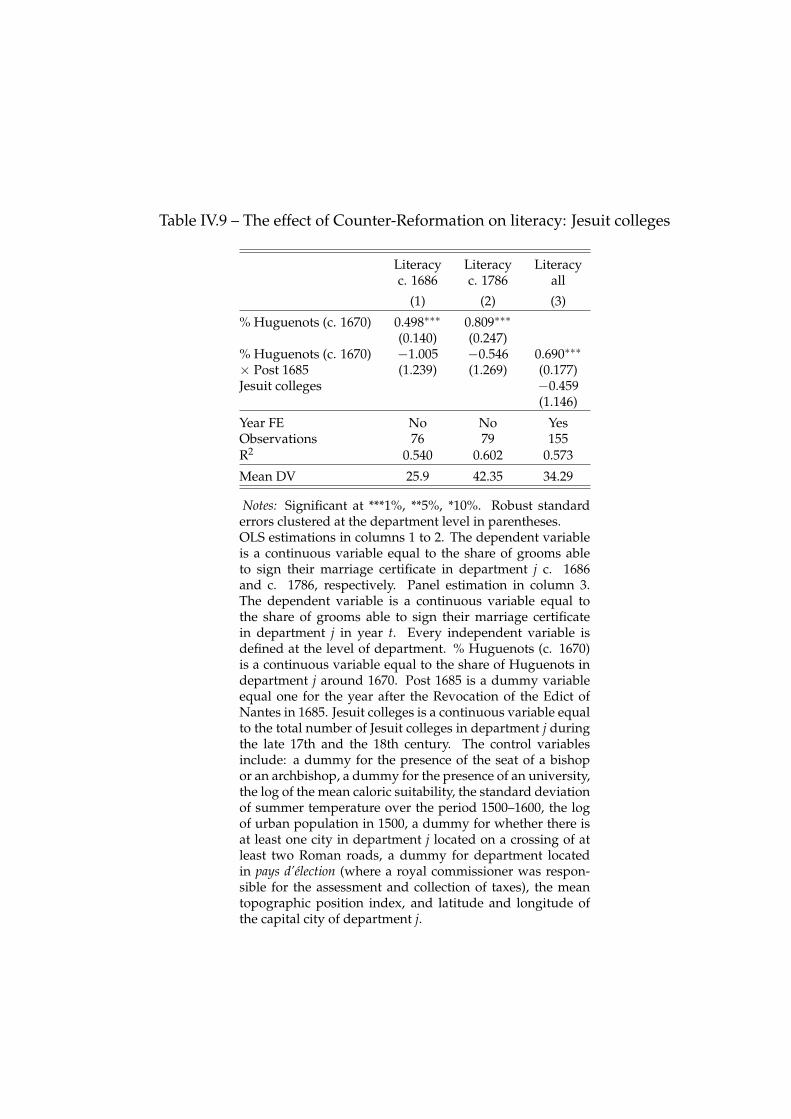
Table IV.9 – The effect of Counter-Reformation on literacy: Jesuit colleges
Literacy Literacy Literacyc. 1686 c. 1786 all
(1) (2) (3)
% Huguenots (c. 1670) 0.498∗∗∗ 0.809∗∗∗
(0.140) (0.247)% Huguenots (c. 1670) −1.005 −0.546 0.690∗∗∗
× Post 1685 (1.239) (1.269) (0.177)Jesuit colleges −0.459
(1.146)
Year FE No No YesObservations 76 79 155R2 0.540 0.602 0.573
Mean DV 25.9 42.35 34.29
Notes: Significant at ***1%, **5%, *10%. Robust standarderrors clustered at the department level in parentheses.OLS estimations in columns 1 to 2. The dependent variableis a continuous variable equal to the share of grooms ableto sign their marriage certificate in department j c. 1686and c. 1786, respectively. Panel estimation in column 3.The dependent variable is a continuous variable equal tothe share of grooms able to sign their marriage certificatein department j in year t. Every independent variable isdefined at the level of department. % Huguenots (c. 1670)is a continuous variable equal to the share of Huguenots indepartment j around 1670. Post 1685 is a dummy variableequal one for the year after the Revocation of the Edict ofNantes in 1685. Jesuit colleges is a continuous variable equalto the total number of Jesuit colleges in department j duringthe late 17th and the 18th century. The control variablesinclude: a dummy for the presence of the seat of a bishopor an archbishop, a dummy for the presence of an university,the log of the mean caloric suitability, the standard deviationof summer temperature over the period 1500–1600, the logof urban population in 1500, a dummy for whether there isat least one city in department j located on a crossing of atleast two Roman roads, a dummy for department locatedin pays d’élection (where a royal commissioner was respon-sible for the assessment and collection of taxes), the meantopographic position index, and latitude and longitude ofthe capital city of department j.

Table IV.10 – The effect of Protestantism on literacy: Heterogneous effect
Literacy c. 1786
(1) (2) (3) (4)
% Huguenots (c. 1670) 1.487∗∗∗
(0.231)Protestant temples (c. 1670) 0.802∗∗∗
(0.126)Protestant pastors (1660) 1.449∗∗∗
(0.272)Consistory registers 4.878∗∗∗
(1.410)Huguenots exil −11.398∗ −5.328 0.963 −6.729
(6.062) (6.117) (6.482) (7.093)% Huguenots (c. 1670) −0.662∗
× Huguenots exil (0.353)Protestant temples (c. 1670) −0.568∗∗∗
× Huguenots exile (0.146)Protestant pastors (1660) −1.169∗∗∗
× Huguenots exile (0.308)Consistory registers −3.563∗∗
× Huguenots exile (1.546)
Observations 79 79 69 79R2 0.655 0.663 0.626 0.636
Mean DV 42.35 42.35 42.35 42.35
Notes: Significant at ***1%, **5%, *10%. Robust standard errors clustered at thedepartment level in parentheses.OLS estimations in columns 1 to 4. The dependent variable is a continuous variableequal to the share of grooms able to sign their marriage certificate in departmentj c. 1786. Every independent variable is defined at the level of department. %Huguenots (c. 1670) is a continuous variable equal to the share of Huguenots indepartment j around 1670. Protestant temples (c. 1670) is a continuous variableequal to the total number of Protestant temple around 1670. Protestant pastors(1660) is a continuous variable equal to the total number of Protestant pastors in1660. Consistory registers is a continuous variable equal to the total number ofconsistory registers (Metzer, 2014). Huguenots exile is a dummy variable equalone if the share of Huguenots refugees in department j is higher that the meanshare of Huguenots refugees, and zero otherwise. The control variables include:a dummy for the presence of the seat of a bishop or an archbishop, a dummy forthe presence of an university, the log of the mean caloric suitability, the standarddeviation of summer temperature over the period 1500–1600, the log of urbanpopulation in 1500, a dummy for whether there is at least one city in department jlocated on a crossing of at least two Roman roads, a dummy for department locatedin pays d’élection (where a royal commissioner was responsible for the assessmentand collection of taxes), the mean topographic position index, and latitude andlongitude of the capital city of department j.
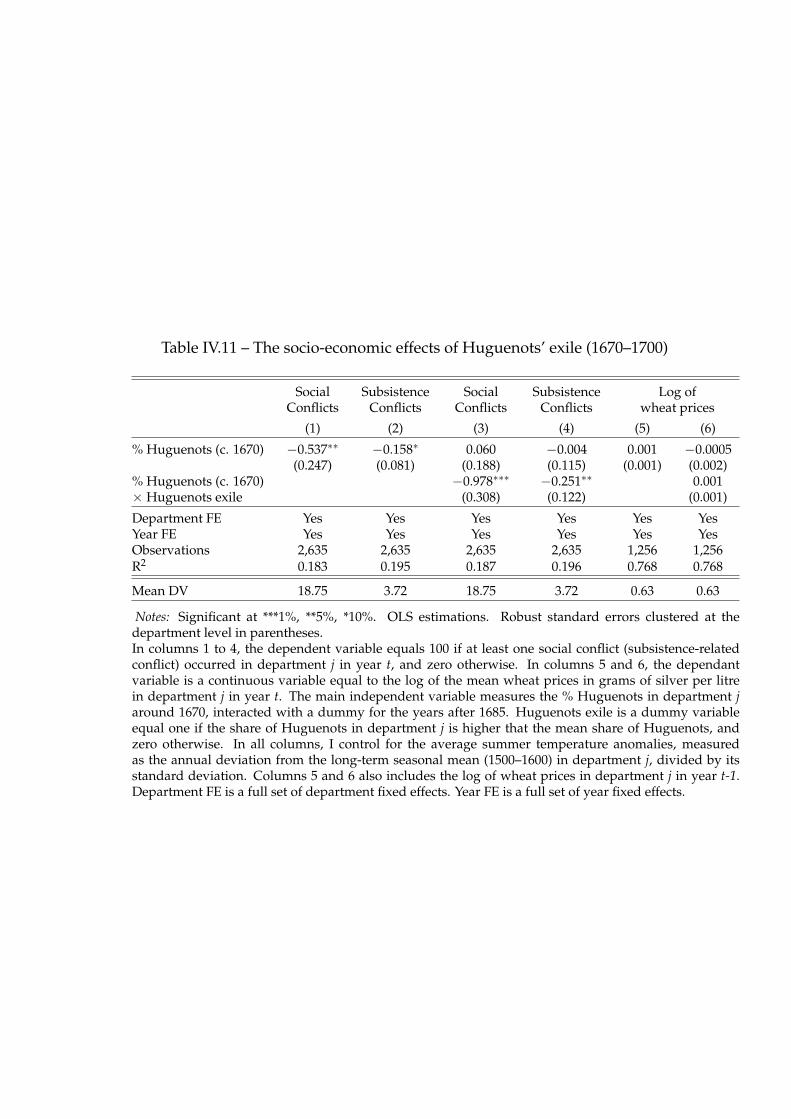
Table IV.11 – The socio-economic effects of Huguenots’ exile (1670–1700)
Social Subsistence Social Subsistence Log ofConflicts Conflicts Conflicts Conflicts wheat prices
(1) (2) (3) (4) (5) (6)
% Huguenots (c. 1670) −0.537∗∗ −0.158∗ 0.060 −0.004 0.001 −0.0005(0.247) (0.081) (0.188) (0.115) (0.001) (0.002)
% Huguenots (c. 1670) −0.978∗∗∗ −0.251∗∗ 0.001× Huguenots exile (0.308) (0.122) (0.001)
Department FE Yes Yes Yes Yes Yes YesYear FE Yes Yes Yes Yes Yes YesObservations 2,635 2,635 2,635 2,635 1,256 1,256R2 0.183 0.195 0.187 0.196 0.768 0.768
Mean DV 18.75 3.72 18.75 3.72 0.63 0.63
Notes: Significant at ***1%, **5%, *10%. OLS estimations. Robust standard errors clustered at thedepartment level in parentheses.In columns 1 to 4, the dependent variable equals 100 if at least one social conflict (subsistence-relatedconflict) occurred in department j in year t, and zero otherwise. In columns 5 and 6, the dependantvariable is a continuous variable equal to the log of the mean wheat prices in grams of silver per litrein department j in year t. The main independent variable measures the % Huguenots in department jaround 1670, interacted with a dummy for the years after 1685. Huguenots exile is a dummy variableequal one if the share of Huguenots in department j is higher that the mean share of Huguenots, andzero otherwise. In all columns, I control for the average summer temperature anomalies, measuredas the annual deviation from the long-term seasonal mean (1500–1600) in department j, divided by itsstandard deviation. Columns 5 and 6 also includes the log of wheat prices in department j in year t-1.Department FE is a full set of department fixed effects. Year FE is a full set of year fixed effects.

Conclusion
In a recent report, the Food and Agriculture Organization of the United Nations
(FAO) highlights that climate variability and extremes were a key force behind
the recent rise in global hunger and one of the leading causes of severe food
crises. Climate variability and extremes raise critical challenges to agriculture
and food production all over the world, and lead to diminished coping capacity,
loss of livelihoods, as well as migration flows (p. 38, 79).1 Collet and Schuh
(2018, p. 3) point out that studying the way past societies dealt with similar
challenges may improve the basis for future decision making. In particular,
climate shocks and hunger have led to numerous outbreaks of interpersonal
violence and civil conflicts. The purpose of this dissertation is to inform on the
consequences of weather shocks and out-migration on violence in early modern
Europe. More specifically, it documents the role of institutions and migration
in reducing the vulnerability to climate shocks and hence violence. It further
studies both the effect of seasonal migration as a resilience strategy against
adverse economic conditions, and the socio-economic consequences of large and
unexpected episode of migration.
This dissertation focuses on France and Savoy in the 17th and the 18th
centuries. At the time, more than 70 per cent of the population depended on
rain-fed agriculture for survival (Chapter 1). Both were Catholic monarchies in
which Protestantism was forbidden by the late 17th century.
I address these questions by applying quantitative methods to a wide range
of geo-coded data derived from the literature and archival sources. This required
the creation of a set of historical geographic information systems (GIS) shapefiles
of French and Savoyard administrative, tax, trade and political boundaries for
1 FAO, The State of Food Security and Nutrition in the World (2018). Retrieved on 2 April 2019,from: http://www.fao.org/3/I9553EN/i9553en.pdf.
295
296 Conclusion
the late 18th century. I believe these GIS data will be helpful for further research
in French economic history, and will, therefore, provide them for the research
community.2
Chapter 2 analyses the relationship between weather shocks, grain prices,
and social conflicts in France between 1661 and 1789. It further highlights the
importance of the human and social capital embedded in years of local experience
of the intendant in the mitigation of weather shocks. It also documents the role
religious institutions in the provision of poverty relief. In this chapter, I link
existing temperature and precipitation data to new data sets on social conflicts,
grain prices, individual characteristics of the provincial leaders (intendants), and
monasteries’ income. I show that weather-induced income shocks significantly
increased the likelihood of subsistence-related conflicts, and more broadly of
social conflicts. I also show that intendants’ years of local experience– a proxy for
province-specific social and human capital– were a key factor in his ability to cope
with weather shocks. Finally, I suggest that the social insurance system under the
aegis of the church, namely the tithes, failed to fulfil its role and provide sufficient
relief to alleviate the effects of weather shocks. This chapter thus contributes to
the literature on the determinants of historical and contemporary social conflicts
in rain-fed agrarian economies. It also contributes to the empirical literature
studying the role of institutions, and more specifically the agency of individuals
within these institutions, in the mitigation of weather-induced income shocks.
In Chapter 3, I study how weather shocks influenced the occurrence of
property crimes and violent crimes in the Duchy of Savoy between 1749 and 1789.
I further analyse the role of seasonal migration as a coping mechanism through
which local communities enhanced their resilience to shocks and stresses. Ex-
ploiting a new data set on crime matched with temperature data, migration data,
and newly collected grain and wine prices data, I show that temperature shocks
were positively associated with property crimes rates and negatively associated
with violent crimes rates. I further exploit spatial variations in seasonal migration
rates to show that it reduced the need for stealing to survive, and was an efficient
strategy to mitigate the negative effect of weather shocks. I provide historical
2 A first map of the boundaries of the subdélégations c. 1789 can be downloaded on the GEO-LARHRA platform: http://geo-larhra.ish-lyon.cnrs.fr/?q=geocatalogue/vector-record/6208.
297
evidence to suggest that the main underlying mechanisms driving this effect
were the cash inflow generated by seasonal migrants, as well as the temporary
relief of Malthusian constraints. This chapter thus relates to two main strands
of the literature, in addition to the Savoyard historiography. The first studies
the linkages between weather variability, agricultural risks, vulnerability, and
migration. The second examines the determinants of interpersonal conflicts.
Chapter 4 focuses on the diffusion of Protestantism in France as well as on
the socio-economic effects of the Revocation that led to the exodus of several
hundreds of thousands of Protestants in the 1680s. To address these two ques-
tions, I first combine new geo-coded data on the location of collegiate churches
and printing presses with information on the presence of Protestant temples at
the city level. I show that the presence of collegiate churches pre-empted the
implementation of Protestantism. This result provides further support to the
idea that cultural factors are as much important as economic determinants in
explaining the diffusion of Protestantism. I also provide tentative evidence that
printing presses reduced the likelihood that a town housed Protestant temples
by 1567, because, coupled with the censorship of Protestant books, it eased the
diffusion of Catholic ideas. Second, I match data on the presence of Protestants
in the 1670s with data on the male literacy rate at the department level. I find
support for the hypothesis that Protestantism led to better education. Using new
data on the place of origin of Huguenot refugees after the Revocation of the Edict
of Nantes in 1685, I show that the effect of Protestantism on the male literacy rate
was smaller in departments where the share of Huguenot refugees was above
the national mean. Finally, I find that the departure of Huguenots had no effect
on agricultural productivity, as measured by annual changes in wheat prices. In
addition, I show that departments with a higher share of refugees, nonetheless,
experienced less subsistence-related conflicts after 1685, which could suggest that
remaining population of these departments could have benefited in the short
run from higher living standards, than those of departments not affected by the
exodus of Huguenots. This chapter contributes to the literature that examines the
historical determinants of the spread of Protestantism in early modern Europe.
It also relates to a prior literature that studies the socio-economic consequences
of the Reformation. Additionally, it provides new empirical evidence on the

298 Conclusion
economic consequences of historical episodes of forced migration.
The three essays in this dissertation are at the crossroad of economic history
and applied microeconomics. They contribute to the literature on the climate-
conflict nexus, the role of local leaders, and the emerging stream of literature
that revisits the causes and consequences of the Reformation. They are also a
hopeful addition to the field of historical climatology and to the decades-long
historiography on the origins of social disturbances in early modern France
and Savoy. Finally, I believe these essays are also part of a growing trend
of scholarship that uses economic theory and quantitative techniques to study
history.3
This thesis thus brings new reliable quantitative data on French early modern
economic history and provides case studies to inform the ongoing debate on the
challenges raised by climate change adaptation and migration. In the process
of collecting data for this thesis, I also collected information on regional wages
and prices of consumption goods for more than 300 towns in the 1770s. These
data will be useful in studying the standard of living and regional inequalities
on the eve of the French Revolution. Along with summarising the most recent
development of the aforementioned literature, this research will help to provide
an updated picture of the French economy in the 18th and 19th centuries.
3 Twenty years ago, Grantham (1997, p. 396) wrote the first survey of cliometric research onthe development of the French economy and contented that France is an ideal “laboratoryfor uncovering and testing hypotheses about economic evolution”. In recent years, numerousresearchers have been using the “richness of French quantitative data” to compile new detailedhistorical data set and provide new insights on old questions. Scholars have also usedFrench history as a laboratory from which exogenous shocks and instruments for statisticalidentification of causality could be generated. See for instance, Bignon, Caroli and Galbiati(2017); De La Croix and Perrin (2018); Franck (2016); Franck and Michalopoulos (2017); Franckand Galor (2018); Juhász (2018); Squicciarini and Voigtländer (2015).
Glossary1
aides: excise or sales taxes, primarily on sales and manufactures. Good destinedfor local consumption, inland trade and export were all liable to the charge. Theincome from the aides came mostly from taxes on wine, fish, and wood.
arrêts: decrees of the sovereign courts and the royal Council.
baillage (bailiwick): local royal court head by a baillis and/or its jurisdiction.It formed the first layer of the royal judiciary throughout French. In southernFrance and Brittany, they were called sénéchaussées. The baillis and sénéchaux hadalso authority over trade fairs and markets.
boisseau: a variable measure of grain. In Paris, a boisseau was equal to 16 litronsor approximately 13 litres. The setier consisted of 12 boisseau.
cahier de doléances: for the Estate General, each parish drew up a list ofgrievances, to be presented either to the king or to the bailiwick assembly chargedwith selecting the deputies to the Estates. These bailiwick assemblies also drewup cahiers, which they presented to the king. Provincial estates redacted similardocuments at each session.
capitation: direct tax introduced in 1696. The original capitation levied moneyon all French lay people based on a series of 22 classes, ranging from Dauphin(who paid 2,000 livres to the lowliest shepherd (who paid one). It was abolishedin 1698 before being permanently re-established in 1701. It often became a simpleadjunct to the taille for peasants.
champarts: seigneurial due paid in kind as a proportion of the harvests.
1 Most of the definitions in this glossary are drawn from existing glossaries on Ancien RégimeFrance (Cameron, 1981, pp. xiv–xvi; Collins, 2009, pp. xxxvii–lii; Cullen, 2002, pp. xiii–xvii;Hickey, 1997, pp. xiii–xix; Le Roy Ladurie, 1996, pp. 552–6; Mousnier, 1979, pp. 745–64; Parker,2002, pp. xiv–xvii; Treasure, 2013, pp. 392–5).
299
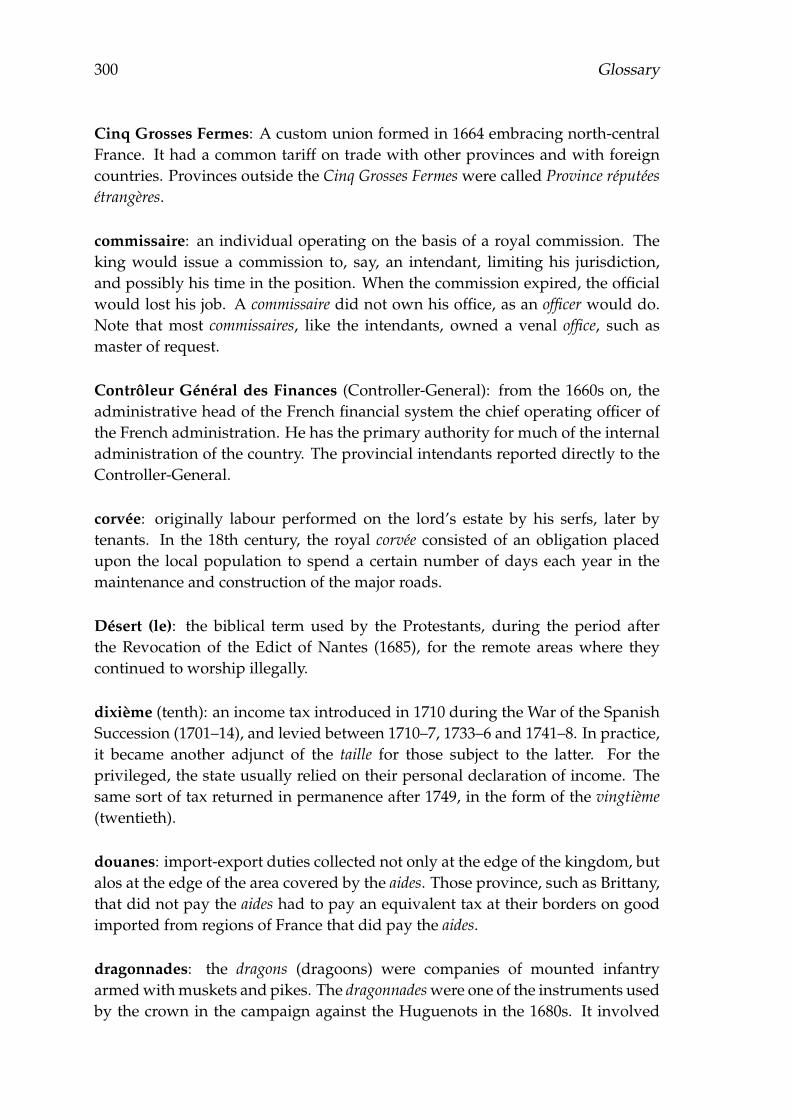
300 Glossary
Cinq Grosses Fermes: A custom union formed in 1664 embracing north-centralFrance. It had a common tariff on trade with other provinces and with foreigncountries. Provinces outside the Cinq Grosses Fermes were called Province réputéesétrangères.
commissaire: an individual operating on the basis of a royal commission. Theking would issue a commission to, say, an intendant, limiting his jurisdiction,and possibly his time in the position. When the commission expired, the officialwould lost his job. A commissaire did not own his office, as an officer would do.Note that most commissaires, like the intendants, owned a venal office, such asmaster of request.
Contrôleur Général des Finances (Controller-General): from the 1660s on, theadministrative head of the French financial system the chief operating officer ofthe French administration. He has the primary authority for much of the internaladministration of the country. The provincial intendants reported directly to theController-General.
corvée: originally labour performed on the lord’s estate by his serfs, later bytenants. In the 18th century, the royal corvée consisted of an obligation placedupon the local population to spend a certain number of days each year in themaintenance and construction of the major roads.
Désert (le): the biblical term used by the Protestants, during the period afterthe Revocation of the Edict of Nantes (1685), for the remote areas where theycontinued to worship illegally.
dixième (tenth): an income tax introduced in 1710 during the War of the SpanishSuccession (1701–14), and levied between 1710–7, 1733–6 and 1741–8. In practice,it became another adjunct of the taille for those subject to the latter. For theprivileged, the state usually relied on their personal declaration of income. Thesame sort of tax returned in permanence after 1749, in the form of the vingtième(twentieth).
douanes: import-export duties collected not only at the edge of the kingdom, butalos at the edge of the area covered by the aides. Those province, such as Brittany,that did not pay the aides had to pay an equivalent tax at their borders on goodimported from regions of France that did pay the aides.
dragonnades: the dragons (dragoons) were companies of mounted infantryarmed with muskets and pikes. The dragonnades were one of the instruments usedby the crown in the campaign against the Huguenots in the 1680s. It involved
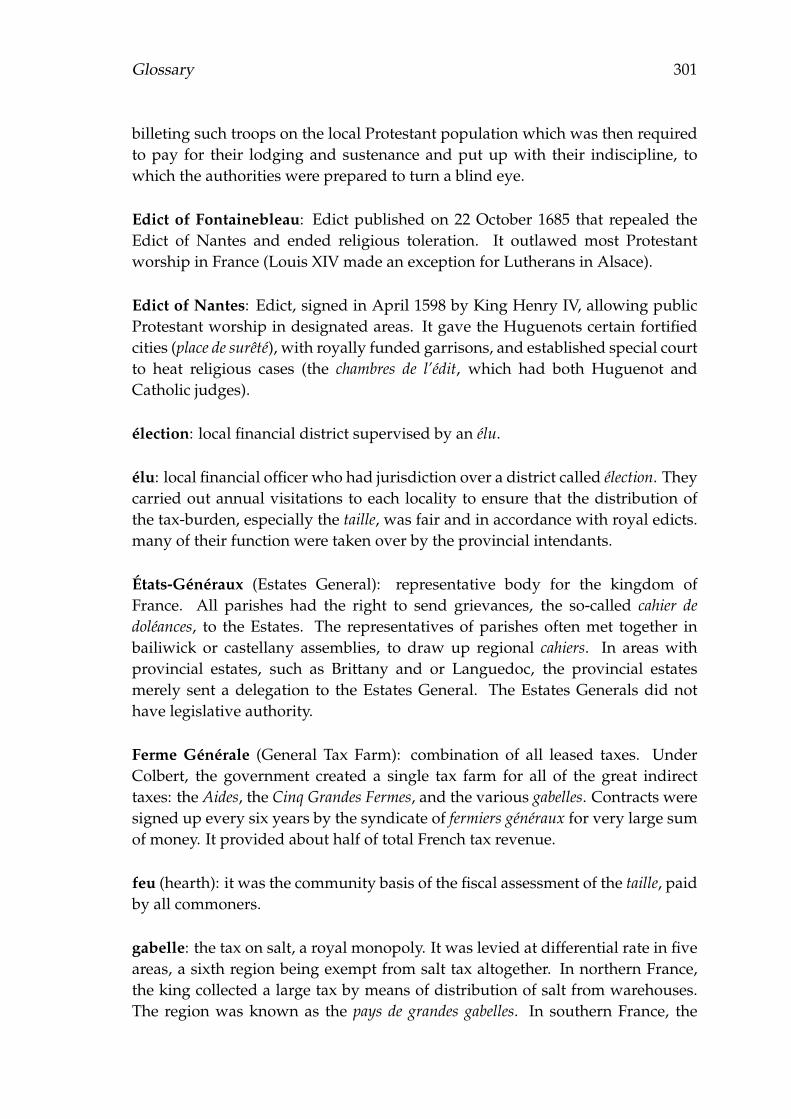
Glossary 301
billeting such troops on the local Protestant population which was then requiredto pay for their lodging and sustenance and put up with their indiscipline, towhich the authorities were prepared to turn a blind eye.
Edict of Fontainebleau: Edict published on 22 October 1685 that repealed theEdict of Nantes and ended religious toleration. It outlawed most Protestantworship in France (Louis XIV made an exception for Lutherans in Alsace).
Edict of Nantes: Edict, signed in April 1598 by King Henry IV, allowing publicProtestant worship in designated areas. It gave the Huguenots certain fortifiedcities (place de surêté), with royally funded garrisons, and established special courtto heat religious cases (the chambres de l’édit, which had both Huguenot andCatholic judges).
élection: local financial district supervised by an élu.
élu: local financial officer who had jurisdiction over a district called élection. Theycarried out annual visitations to each locality to ensure that the distribution ofthe tax-burden, especially the taille, was fair and in accordance with royal edicts.many of their function were taken over by the provincial intendants.
États-Généraux (Estates General): representative body for the kingdom ofFrance. All parishes had the right to send grievances, the so-called cahier dedoléances, to the Estates. The representatives of parishes often met together inbailiwick or castellany assemblies, to draw up regional cahiers. In areas withprovincial estates, such as Brittany and or Languedoc, the provincial estatesmerely sent a delegation to the Estates General. The Estates Generals did nothave legislative authority.
Ferme Générale (General Tax Farm): combination of all leased taxes. UnderColbert, the government created a single tax farm for all of the great indirecttaxes: the Aides, the Cinq Grandes Fermes, and the various gabelles. Contracts weresigned up every six years by the syndicate of fermiers généraux for very large sumof money. It provided about half of total French tax revenue.
feu (hearth): it was the community basis of the fiscal assessment of the taille, paidby all commoners.
gabelle: the tax on salt, a royal monopoly. It was levied at differential rate in fiveareas, a sixth region being exempt from salt tax altogether. In northern France,the king collected a large tax by means of distribution of salt from warehouses.The region was known as the pays de grandes gabelles. In southern France, the

302 Glossary
king collected tax when the salt left the areas of salt production. The regionwas known as the pays de petites gabelles. Some regions, such as Brittany, theSouthwest, and the Contentin peninsula in Lower Normandy, either escapedsuch taxes altogether or levied special, low salt taxes.
généralité: Administrative district supervised by an intendant. By the endof the 17th century, most of the intendants had divided their généralité intosubdéléguations head by subdélégués. It served as the basis for allocating the taille.It was also the basic unit for the compilation of many statistics, such the balancedu commerce.
greniers: royal salt warehouses. In most of France, the king held a wholesalemonopoly on the sale of salt. The salt tax monopolist (independent contractors,i.e. tax farmers) had to bring their salt to a royal warehouse, where a royal official,the grenetier (a venal office), registered it and oversaw its later distribution tomerchants. The tax farmers collected, on the behalf of the king, a fixed amounton every muid of salt registered by te grenetier
intendants: royal commissaires sent on mission to act on the behalf of the king.Within his généralité the intendant’s scope was very wide. He superintendedrecruiting for the army, he dispensed justice, he apportioned the taille andwas responsible for collecting direct taxes. He regulated trade, industry andagriculture, and could sometimes drafted legislation. The position of intendantwas not a venal office, even though the majority of intendants bought thethemselves the post of maître des requêtes during the 18th century. If they weredismissed from their intendancy, they could return to their practice of the law.
livres tournois: French pounds (abbreviated £ throughout the dissertation).France used the livres tournois as its official money of account. The livre consistedof 20 sous (shilling). Each sou contained 12 deniers (pence). The livre did notexist as a literal coin, so its value could be adjusted up or down without actuallychanging the coinage.
maréchaussée (mounted constabulary): originally, the mounted constabularyexisted to oversee the behaviour of royal troops within France. It was supposedto prevent conflict between such troop, then quartered in private house, and thecivil population. In time, it became the national police force. In the 18th century,it had approximately 3,000 men to police the whole of rural France.
maître des requêtes (master of requests): subordinate official of the king’scouncil. The master of requests prepared the documentation of all cases broughtbefore the king’s council. The king drew the vast majority of intendants from this
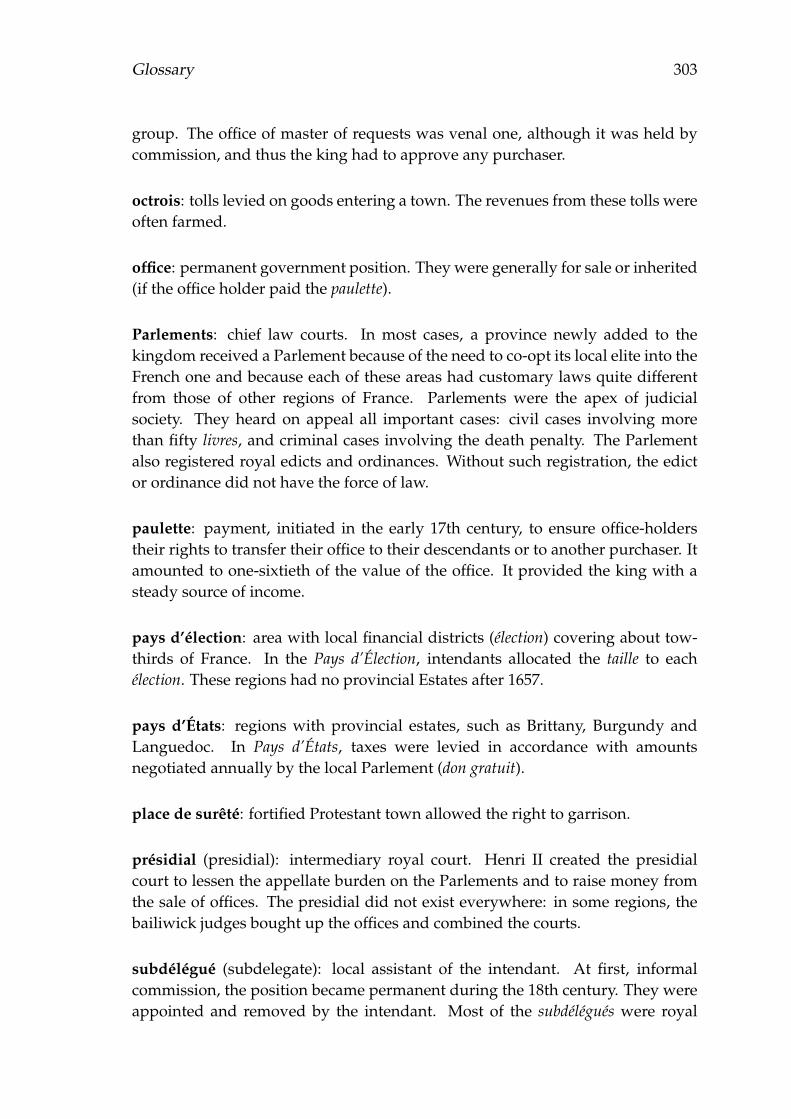
Glossary 303
group. The office of master of requests was venal one, although it was held bycommission, and thus the king had to approve any purchaser.
octrois: tolls levied on goods entering a town. The revenues from these tolls wereoften farmed.
office: permanent government position. They were generally for sale or inherited(if the office holder paid the paulette).
Parlements: chief law courts. In most cases, a province newly added to thekingdom received a Parlement because of the need to co-opt its local elite into theFrench one and because each of these areas had customary laws quite differentfrom those of other regions of France. Parlements were the apex of judicialsociety. They heard on appeal all important cases: civil cases involving morethan fifty livres, and criminal cases involving the death penalty. The Parlementalso registered royal edicts and ordinances. Without such registration, the edictor ordinance did not have the force of law.
paulette: payment, initiated in the early 17th century, to ensure office-holderstheir rights to transfer their office to their descendants or to another purchaser. Itamounted to one-sixtieth of the value of the office. It provided the king with asteady source of income.
pays d’élection: area with local financial districts (élection) covering about tow-thirds of France. In the Pays d’Élection, intendants allocated the taille to eachélection. These regions had no provincial Estates after 1657.
pays d’États: regions with provincial estates, such as Brittany, Burgundy andLanguedoc. In Pays d’États, taxes were levied in accordance with amountsnegotiated annually by the local Parlement (don gratuit).
place de surêté: fortified Protestant town allowed the right to garrison.
présidial (presidial): intermediary royal court. Henri II created the presidialcourt to lessen the appellate burden on the Parlements and to raise money fromthe sale of offices. The presidial did not exist everywhere: in some regions, thebailiwick judges bought up the offices and combined the courts.
subdélégué (subdelegate): local assistant of the intendant. At first, informalcommission, the position became permanent during the 18th century. They wereappointed and removed by the intendant. Most of the subdélégués were royal
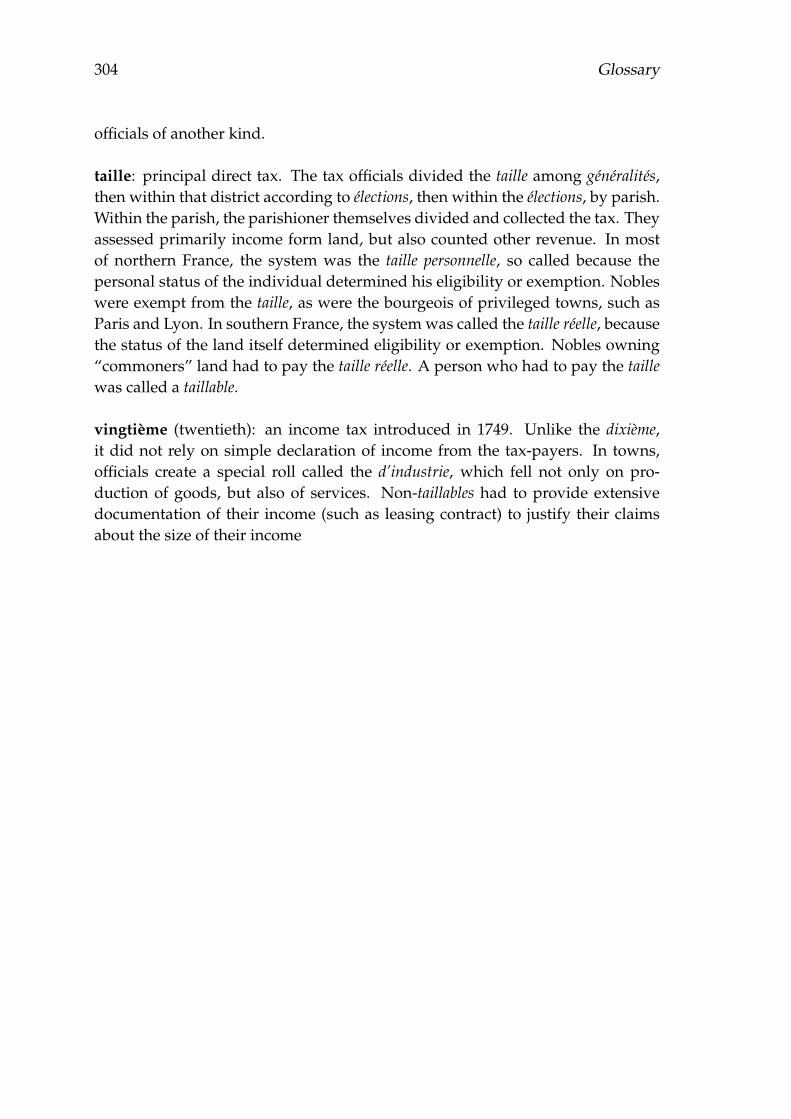
304 Glossary
officials of another kind.
taille: principal direct tax. The tax officials divided the taille among généralités,then within that district according to élections, then within the élections, by parish.Within the parish, the parishioner themselves divided and collected the tax. Theyassessed primarily income form land, but also counted other revenue. In mostof northern France, the system was the taille personnelle, so called because thepersonal status of the individual determined his eligibility or exemption. Nobleswere exempt from the taille, as were the bourgeois of privileged towns, such asParis and Lyon. In southern France, the system was called the taille réelle, becausethe status of the land itself determined eligibility or exemption. Nobles owning“commoners” land had to pay the taille réelle. A person who had to pay the taillewas called a taillable.
vingtième (twentieth): an income tax introduced in 1749. Unlike the dixième,it did not rely on simple declaration of income from the tax-payers. In towns,officials create a special roll called the d’industrie, which fell not only on pro-duction of goods, but also of services. Non-taillables had to provide extensivedocumentation of their income (such as leasing contract) to justify their claimsabout the size of their income

Bibliography
Abbiateci, André, Andrée Laffay, and Paul Cattin. 1996. La plume et le rabot.Journal écrit de 1733 à 1828 par Claude-Anotine Bellod, menuisier et maître d’écoleau Grand-Abergement (Ain). Les Amis des Archives de l’Ain. 199
Acemoglu, Daron, Francisco A. Gallego, and James A. Robinson. 2014. “In-stitutions, Human Capital, and Development.” Annual Review of Economics,6(1): 875–912. 98
Albers, Hakon, Christoph Gornott, and Silke Hüttel. 2017. “How Do Inputs andWeather Drive Wheat Yield Volatility? The Example of Germany.” Food Policy,70: 50–61. 96
Albert, Antoine. 1783. Histoire géographique, naturelle, ecclésiastique et civile dudiocèse d’Embrun. Vol. 1. 58
Alfani, Guido. 2010. “Climate, Population and Famine in Northern Italy: GeneralTendencies and Malthusian Crisis, ca. 1450–1800.” Annales de démographiehistorique, 120(2): 23–53. 2
Alfani, Guido. 2011. “The Famine of the 1590s in Northern Italy. An Analysis ofthe Greatest “System Shock” of Sixteenth Century.” Histoire & Mesure, 36(1): 17–50. 205
Alfani, Guido, and Cormac Ó Gráda. 2018. “The Timing and Causes of Faminesin Europe.” Nature Sustainability, 1(6): 283–288. 105
Alfani, Guido, and Vincent Gourdon. 2012. “Entrepreneurs, Formalization ofSocial Ties, and Trustbuilding in Europe (Fourteenth to Twentieth Centuries).”Economic History Review, 65(3): 1005–1028. 197
Allegra, Luciano. 2015. “Becoming Poor in Eighteenth-Century Turin.” Journal ofInterdisciplinary History, 46(2): 153–183. 190
Allen, Douglas W, and Dean Lueck. 2004. The Nature of the Farm: Contracts, Risk,and Organization in Agriculture. MIT press. 192
Allen, Robert C. 2009. “The Industrial Revolution in Miniature: The SpinningJenny in Britain, France, and India.” Journal of Economic History, 69(4): 901–927.47
Allen, Robert C, Jean-Pascal Bassino, Debin Ma, Christine Moll-Murata, andJan Luiten Van Zanden. 2011. “Wages, Prices, and Living Standards in China,1738–1925: in Comparison with Europe, Japan, and India.” Economic HistoryReview, 64(s1): 8–38. 219
305
306 Bibliography
Almer, Christian, Jeremy Laurent-Lucchetti, and Manuel Oechslin. 2011. “In-come Shocks and Social Unrest: Theory and Evidence.” SSRN Working PaperSeries. 170, 173
Andersen, Dorte, Ulrike Barten, and Peter S. Jensen. 2009. “Challenges to CivilWar Research-Introduction to the Special Issue on Civil War and Conflicts.”JEMIE, 8: 1–9. 167
Andersen, Thomas Barnebeck, Jeanet Bentzen, Carl-Johan Dalgaard, and PaulSharp. 2017. “Pre-reformation Roots of the Protestant Ethic.” The EconomicJournal, 127(604): 1756–1793. 245, 265
Anderson, Robert Warren, Noel D. Johnson, and Mark Koyama. 2017. “Jew-ish Persecutions and Weather Shocks: 1100–1800.” The Economic Journal,127(602): 924–958. 99
Antoine, Jean-Marc. 2009. “L’histoire du climat par ses extrêmes. Sources géo-historiques et inondations dans les Pyrénées depuis le Petit Âge Glaciaire.”Archéologie du Midi médiéval, 27: 143–155. 13, 102, 110
Antoine, Michel. 1974. “La notion de subdélégation dans la monarchie d’AncienRégime.” Bibliothèque de l’École des Chartes, 132(2): 267–287. 14
Appleby, Andrew B. 1979. “Grain Prices and Subsistence Crises in England andFrance, 1590–1740.” Journal of Economic History, 39(4): 865–887. 40, 41, 101
Arbatli, Cemal Eren, and Gunes Gokmen. 2016. “Minorities, Human Capitaland Long-Run Development: Persistence of Armenian and Greek Influence inTurkey.” CESifo Working Papers 6268. 250
Arbellot, Guy. 1973. “La grande mutation des routes de France au XVIIIème
siècle.” Annales. Économies, Sociétés, Civilisations, 28(3): 765–791. 11
Arbellot, Guy, Jean-Pierre Goubert, Jacques Mallet, and Palazot Yvette. 1986.Carte des Généralités, Subdélégations et Élections en France à la veille de la Révolutionde 1789. Éditions du C.N.R.S. 51, 115
Armand, Gilbert. 1974. Villes, centres et organisation urbaine des Alpes du Nord, lePassé et le Présent. Imprimerie Allier. 234
Armstrong, John A. 1972. “Old-Regime Governors: Bureaucratic and PatrimonialAttributes.” Comparative Studies in Society and History, 14(1): 2–29. 107
Arnoux, Mathieu. 2010. “Pour une économie historique de la dîme.” La dîme dansl’Europe médiévale et moderne, ed. Roland Viader, 145–160. Presses Universitairesdu Mirail. 100
Astoul, Guy. 1992. “L’alphabétisation en Haut-Languedoc au XVIIIe siècle : lesaléas de la méthode Maggiolo dans le diocèse de Montauban.” Annales du Midi,104(198): 175–194. 262
Astoul, Guy. 1996. “L’instruction des enfants protestants et catholiques en paysaquitains du milieu du XVIe siècle à la révocation de l’Édit de Nantes.” Histoirede l’éducation, 69: 37–61. 245
Bibliography 307
Astoul, Guy. 1999. Les chemins du savoir en Quercy et Rouergue à l’époque moderne.Alphabétisation et apprentissages culturels. Presses Universitaires du Mirail. 245
Aubert, Gauthier. 2014. Les révoltes du papier timbré, 1675. Essai d’histoire événe-mentielle. Presses Universitaires de Rennes. 3
Aubert, Gauthier. 2015. Révoltes et répressions dans la France moderne. ArmandCollin. 2, 100, 117, 124
Avernus. 1892. “Parmentier a-t-il, le premier, découvert les vertus de la pommede terre ?” L’Intermédiaire des chercheurs et curieux, 26(590): 131. 80
Axbard, Sebastian. 2016. “Income Opportunities and Sea Piracy in Indonesia:Evidence from Satellite Data.” American Economic Journal: Applied Economics,8(2): 154–94. 186, 208
Baehrel, René. 1961. Une croissance : la Basse-Provence rurale (fin XVIe siècle-1789).Essai d’économie historique statistique. S.E.V.P.E.N. 264
Bairoch, Paul, Jean Batou, and Pierre Chèvre. 1988. La population des villeseuropéennes : banque de données et analyse sommaire des résultats, 800–1850.Librairie Droz. 24
Bai, Ying, and James Kai-Sing Kung. 2011. “Climate shocks and Sino-nomadicConflict.” Review of Economics and Statistics, 93(3): 970–981. 99
Balso, Raoul. 1993. “Les catastrophes naturelles dans le Biterrois au traversdes Secours royauy de 1750 à 1790.” Météorologie et catastrophes naturelles dansla France méridionale à l’époque moderne. Actes du colloque de 1992, ed. AnneBlanchard, Henri Michel and Élie Pélaquier, 77–89. Montpellier, UniversitéPaul-Valéry. 112
Barbiche, Bernard. 2012. Les institutions de la monarchie française à l’époque moderne,XVIe–XVIIIe siècle. Presses Universitaires de France. 8, 10, 14, 109
Barriendos, Mariano, D. Coeur, M. Lang, Maria del Carmen Llasat Botija, R.Naulet, F. Lemaitre, and Antonio Barrera Escoda. 2003. “Stationarity Analysisof Historical Flood Series in France and Spain (14th–20th Centuries).” NaturalHazards and Earth System Sciences, 3(6): 583–592. 191
Barro, Robert J., and Rachel M. McCleary. 2016. “Saints Marching In, 1590–2012.” Economica, 83(331): 385–415. 248
Baud, Dominique. 2010. “Dynamiques paysagères d’un finage savoyard :L’apport des archives cadastrales (début XVIIIe–fin XIXe s.).” Géocarrefour,85(1): 81–93. 202, 235
Baulant, Micheline. 1989. “L’appréciation du niveau de vie. Un problème, unesolution.” Histoire & Mesure, 4(3): 267–302. 38
Bazzi, Samuel, and Christopher Blattman. 2014. “Economic Shocks and Conflict:Evidence from Commodity Prices.” American Economic Journal: Macroeconomics,6(4): 1–38. 103, 174

308 Bibliography
Beales, Derek. 2003. Prosperity and Pplunder: European Catholic Monasteries in theAge of Revolution, 1650–1815. Cambridge University Press. 112
Beaudry, Richard. 1976. “Alimentation et population rurale en Périgord au XVIIIe
siècle.” Annales de démographie historique, (1): 41–59. 38, 65
Beaurepaire, Charles de. 1889. Renseignements statistiques sur l’état de l’agriculturevers 1789. Rouen : Imprimerie Espérance Cagniard. 114
Béaur, Gérard. 2006. “En un débat douteux. Les communaux, quels enjeux dansla France des XVIIIe–XIXe siècles ?” Revue d’histoire moderne et contemporaine,53(1): 89–114. 235
Béaur, Gérard, and Jean-Michel Chevet. 2017. “France.” Famine in EuropeanHistory, ed. Guido Alfani and Cormac Ó Gráda, 73–100. Cambridge UniversityPress. 102
Becchia, Alain, and Bruno Gachet. 2014. “Entre montagnes et vallées : essai delocalisation du centre de gravité démographique des populations savoyardesaux XVIe–XVIIIe siècles.” 4e Colloque international des Sabaudian studies, ed.Stéphane Gal and Laurent Perrillat, 371–390. Université de Savoie. 195
Becchia, Alain, Fabrice Delrieux, Émilie-Anne Pépy, Hervé Laly, FrédéricMeyer, and Bruno Gachet. 2012. Atlas historique et statistique de la Savoie auXVIIIe siècle. Université de Savoie. 185, 192, 194, 203, 219, 235, 236, 237
Becker, Gary S. 1965. “A Theory of the Allocation of Time.” The Economic Journal,75(299): 493–517. 261
Becker, Gary S. 1968. “Crime and Punishment: An Economic Approach.” Journalof Political Economy, 76(2): 169–217. 184
Becker, Sascha O., and Ludger Woessmann. 2009. “Was Weber Wrong? AHuman Capital Theory of Protestant Economic History.” Quarterly Journal ofEconomics, 124(2): 531–596. 177, 245, 249, 270
Becker, Sascha O., and Ludger Woessmann. 2010. “The Effect of Protestantismon Education Before the Industrialization: Evidence from 1816 Prussia.”Economics Letters, 107(2): 224–228. 249, 270
Becker, Sascha O., Steven Pfaff, and Jared Rubin. 2016. “Causes and Conse-quences of the Protestant Reformation.” Explorations in Economic History, 62: 1–25. 3, 243, 244, 254, 265
Beik, William. 2005. “The Absolutism of Louis XIV as Social Collaboration.” Past& Present, 188(1): 195–224. 7, 12, 17, 105
Beik, William. 2015. Protest and Rebellion in Seventeenth-Century France. PalgraveMacmillan. 117, 119
Beine, Michel, and Christopher Parsons. 2015. “Climatic Factors as Deter-minants of International Migration.” The Scandinavian Journal of Economics,117(2): 723–767. 1
Bibliography 309
Ben-Ari, Tamara, Julien Boé, Philippe Ciais, Remi Lecerf, Marijn Van derVelde, and David Makowski. 2018. “Causes and Implications of the Unfore-seen 2016 Extreme Yield loss in the Breadbasket of France.” Nature communica-tions, 9(1): 1627. 93, 96
Ben-Ari, Tamara, Juliette Adrian, Tommy Klein, Pierluigi Calanca, MarijnVan der Velde, and David Makowski. 2016. “Identifying Indicators for Ex-treme Wheat and Maize Yield Losses.” Agricultural and Forest Meteorology,220: 130–140. 93, 96, 119
Benedict, Philip. 1991. “The Huguenot Population of France, 1600–1685: TheDemographic Fate and Customs of a Religious Minority.” Transactions of theAmerican Philosophical Society, 81(5): 1–164. 245, 259
Benedict, Philip. 2001. The Faith and Fortunes of France’s Huguenots, 1600–85.Ashgate. 255, 256
Benedict, Philip. 2007. “Refugee Churches and Exile Centers in the FrenchReformation.” La Réforme en France et en Italie : contacts, comparaisons etcontrastes, ed. Philip Benedict, Silvana Seidel Menchi and Alain Tallon, 535–552. École française de Rome. 252, 267
Beniston, Martin. 2006. “Mountain Weather and Climate: A General Overviewand a Focus on Climatic Change in the Alps.” Hydrobiologia, 562(1): 3–16. 191
Bercé, Yves Marie. 1974. Histoire des croquants : Étude des soulèvements populairesau XVIIe siècle dans le sud-ouest de la France. Vol. 2, Librairie Droz. 2, 100
Bernard, Albert. 1926. “La pomme de terre en Bourgogne avant Parmentier.”Annales de l’Académie de Mâcon, 25: 119–122. 83
Bernard, René-Jean. 1969. “L’alimentation paysanne en Gévaudan XVIIIe siècle.”Annales. Économies, Sociétés, Civilisations, 24(6): 1449–1467. 75
Bernier, Isabelle. 2005. “Négoce et industrie à Mulhouse au XVIIIème siècle(1696–1798).” PhD diss. Université de Franche-Comté. 48
Bert, Paul. 1908. Histoire de la Révocation de l’Édit de Nantes à Bordeaux et dansle Bordelais : diocèse de Bordeaux (1653–1715). Bordeaux : Marcel Mounastre-Picamilh. 257, 270
Besley, Timothy, and Torsten Persson. 2010. “State Capacity, Conflict, andDevelopment.” Econometrica, 78(1): 1–34. 170, 171, 172
Besley, Timothy, Jose G. Montalvo, and Marta Reynal-Querol. 2011. “DoEducated Leaders Matter?” The Economic Journal, 121(554): F205–F227. 97, 98
Besnier, Éric. 1979. “Manneville-la-Pipard et Le Mesnil-sur-Blangy. Étude démo-graphique, XVIIe–XVIIIe siècles.” Annales de Normandie, 29(2): 179–191. 31
Biard, Michel. 2007. Les lilliputiens de la centralisation : des intendants aux préfets,les hésitations d’un modèle français. Editions Champ Vallon. 11, 107
Bideau, Alain. 2017. La châtellenie de Thoissey. Étude d’une population de la Dombesdu XVIe au XIXe siècle. Ined Éditions. 31
310 Bibliography
Bignon, Vincent, Eve Caroli, and Roberto Galbiati. 2017. “Stealing to Survive?Crime and Income Shocks in Nineteenth Century France.” The Economic Journal,127(599): 19–49. 99, 169, 187, 206, 208, 298
Blakeslee, David S., and Ram Fishman. 2018. “Weather Shocks, Agriculture, andCrime Evidence from India.” Journal of Human Resources, 53(3): 750–782. 186,206
Blanchard, Marcel. 1937. “Textes relatifs à l’économie savoyarde (XVIIe–XVIIIe
siècles).” Revue de géographie alpine, 25(1): 211–223. 197
Blattman, Christopher, and Edward Miguel. 2010. “Civil war.” Journal of Eco-nomic Literature, 48(1): 3–57. 99, 167, 168, 170
Blet, Pierre. 1972. “Le Conseil d’État et les protestants de 1680 à 1685.” Biblio-thèque de l’École des chartes, 130(1): 131–162. 255
Bligny-Bondurand, E. 1908. Cahiers de doléances des sénéchaussées de Nimes pour lesÉtats généraux de 1789. Nimes : Imprimerie A. Chastanier. 114
Bloch, Marc. 2015. French Rural History (Routledge Revivals): An Essay on Its BasicCharacteristics. Routledge. 235
Bodard, Pierre. 1987. “L’introduction de la culture de la pomme de terre dansl’ancien Comté de Nice. Quelques points de repère.” Le Monde alpin et rhodanien.Revue régionale d’ethnologie, 15(1/2): 117–133. 59
Boiron, Michel. 2008. L’action des intendants de la généralité de Limoges de 1683 à1715. Presses Universitaires de Limoges. 107, 108, 110, 112, 121
Boisson, Didier. 2000. Les protestants de l’ancien colloque du Berry de la Révocationde l’Édit de Nantes à la fin de l’Ancien régime (1679–1789), ou l’inégale résistance deminorités religieuses. Honoré Champion. 257
Boisson, Didier, and Christian Lippold. 2002. “La survie religieuse des commu-nautés protestantes du centre de la France et du Bassin parisien de la révocationde l’édit de Nantes à l’Édit de tolérance (1685–1787).” Histoire, Économie etSociété, 21(2): 227–256. 257, 259
Boisson, Didier, and Hugues Daussy. 2006. Les protestants dans la France moderne.Belin. 251, 257
Boix, Carles, and Frances Rosenbluth. 2014. “Bones of Contention: The PoliticalEconomy of Height Inequality.” American Political Science Review, 108(1): 1–22.37
Bonney, Richard. 1999. The Rise of Fiscal State in Europe c. 1200–1815. OxfordUniversity Press. 15, 16
Bonney, Richard. 2012. “The rise of the iscal state in France, 1500–1914.” The Riseof Fiscal States: A Global History 1500–1914, ed. Bartolomé Yun-Casalilla andPatrick K. O’Brien, 93–110. Cambridge University Press. 16
Boppart, Timo, Josef Falkinger, and Volker Grossmann. 2014. “Protestantismand Education: Reading (the Bible) and Other Skills.” Economic Inquiry,52(2): 874–895. 248
Bibliography 311
Bordes, Maurice. 1960. “Les intendants de Louis XV.” Revue historique, 223(1): 45–62. 12, 106
Bordes, Maurice. 1962. “Un intendant éclairé de la fin de l’Ancien Régime.Claude-François Bertrand de Boucheporn.” Annales du Midi : revuearchéologique, historique et philologique de la France méridionale, 74(58): 177–194.13, 110
Borde-Vibert-Guigue, André. 1973. “La vie rurale à Saint-Maxime-de-Beaufort.”Master’s diss. Université de Savoie. 194
Bosker, Maarten, Eltjo Buringh, and Jan Luiten Van Zanden. 2013. “From Bagh-dad to London: Unraveling Urban Development in Europe, the Middle East,and North Africa, 800–1800.” Review of Economics and Statistics, 95(4): 1418–1437. 54, 244, 260, 265
Bourde, André J. 1967. Agronomie et agronomes en France au XVIIIe siècle.S.E.V.P.E.N. 11, 41
Bourgin, Georges. 1910. “Statistiques Révolutionnaires : Descriptions du dé-partement d’Eure-et-Loir (an II).” Revue d’histoire des doctrines économiques etsociales, 3: 333–346. 66
Bourguignat, Nicolas. 2002. Les Grains du désordre. L’État face aux violencesfrumentaires dans la première moitié du XIXe siècle. Éditions de l’École des HautesÉtudes en Sciences Sociales. 3
Bouton, Cynthia A. 2000. “Les mouvements de subsistance et le problème del’économie morale sous l’Ancien Régime et la Révolution française.” Annaleshistoriques de la Révolution française, 319(1): 71–100. 100, 118
Bouverat, Dominique. 2013a. Andilly, Charly, Jussy et Saint-Symphorien. Pagesd’histoire. Editions La Salévienne. 192
Bouverat, Dominique. 2013b. “Villes et bourgs en Savoie de la Réforme à laRévolution.” PhD diss. Université Lyon 2. 189, 191, 196, 231, 232
Boxell, Levi. 2017. “Droughts, Conflict, and the African Slave Trade.” https://
mpra.ub.uni-muenchen.de/81924/ Working Papers. 99
Boyer de Sainte-Suzanne, Émile-Victor-Charles de. 1865. Les intendants de lagénéralité d’Amiens (Picardie et Artois). Paris : Librairie Administrative de PaulDupont. 121
Bradley, Raymond S., ed. 2015. Paleoclimatology, Reconstructing Climates of theQuaternary. Academic Press. 184
Braudel, Fernand. 1966. La Méditerranée et le monde méditeranéen à l’époque dePhilippe II. Vol. 1, A. Colin. 196
Brázdil, Rudolf, Andrea Kiss, Jürg Luterbacher, David J. Nash, and LadislavaReznícková. 2018. “Documentary Data and the Study of the Past Droughts: AnOverview of the State of the Art Worldwide.” Climate of the Past, 118: 1–67. 2
312 Bibliography
Brennan, Thomas Edward. 1988. Public Drinking and Popular Culture inEighteenth-Century Paris. Princeton University Press. 187, 196
Bricourt, Michel, Marcel Lachiver, and Denis Queruel. 1974. “La crise desubsistance des années 1740 dans le ressort du Parlement de Paris.” Annalesde démographie historique, (1): 281–333. 110, 114
Brossault, Colette. 1999. Les intendants de Franche-Comté 1674–1790. La Boutiquede l’histoire éditions. 107, 109, 121
Bruchet, Max. 1897. “L’émigration des Savoyards originaires du Faucigny auXVIIIe siècle.” Bulletin historique et philologique du Comité des Travaux Historiqueset Scientifiques, Année 1896: 815–832. 209
Bruchet, Max. 1908. L’abolition des droits seigneuriaux en Savoie (1761–1793).Imprimerie Herisson Frères. 190, 230
Brumont, Stéphane. 2010. “La question de la dîme dans la France moderne.”La dîme dans l’Europe médiévale et moderne, ed. Roland Viader, 161–189. PressesUniversitaires du Mirail. 100
Brun-Durand, Justin. 1879. Annales de Michel Forest sur ce qui s’est passé de plusremarquable à Valence de 1736 jusqu’à 1784. Valence : Imprimerie de Chenevier etPessieux. 65
Brunet, Guy. 2014. “Environnement, structures sociales et régime démo-graphique. La Dombes du XVIIIème au début du XXème siècle.” Espace popu-lations sociétés, (1): 2–15. 31, 42
Bruneton-Governatori, Ariane. 1984. “Alimentation et idéologie : le cas de lachâtaigne.” Annales. Économies, Sociétés, Civilisations, 39(6): 1161–1189. 38
Brunet, Serge. 2007. “Les prêtres des campagnes de la France du XVIIe siècle : lagrande mutation.” Dix-septième siècle, 234(1): 49–82. 21
Brunt, Liam. 2004. “Nature or Nurture? Explaining English Wheat Yields in theIndustrial Revolution, c. 1770.” Journal of Economic History, 64(1): 193–225. 191
Brunt, Liam. 2015. “Weather Shocks and English Wheat Yields, 1690–1871.”Explorations in Economic History, 57: 50–58. 192
Buchoz, Piere-Joseph. 1763. Tournefortius lotharingiae ou Catalogue des plantes quicroissent dans la Lorraine et les Trois Evêchés. Nancy : chez Babin. 75
Bugaud, Christophe, Solange Buchin, Yolande Noël, Laurent Tessier, SylviePochet, Bruno Martin, and Jean François Chamba. 2001. “Relationships be-tween Abondance Cheese Texture, its Composition and that of Milk Producedby Cows Grazing Different Types of Pastures.” Le Lait, 81(5): 593–607. 235
Buggle, Johannes, and Ruben Durante. 2017. “Climate Risk, Cooperation andthe Co-Evolution of Culture and Institutions.” London, Centre for EconomicPolicy Research Working Paper DP12380. 94
Buhaug, Halvard. 2010. “Climate not to Blame for African Civil Wars.” Proceed-ings of the National Academy of Sciences, 107(38): 16477–16482. 168
Bibliography 313
Buhaug, Halvard, and Henrik Urdal. 2013. “An Urbanization Bomb? PopulationGrowth and Social Disorder in Cities.” Global Environmental Change, 23(1): 1–10.168
Bujeaud, Victor. 1860. Chronique protestante de l’Angoumois XVIe, XVIIe, XVIIIe
siècles. Meyrueis : Goumard. 111
Burke, Marshall, Solomon M. Hsiang, and Edward Miguel. 2015. “Climate andConflict.” Annual Review of Economics, 7(1): 577–617. 99, 183
Burley, Peter. 1981. “Louis XVI and a New Monarchy: An Institutional andPolitical Study of France l768-l778.” PhD diss. University of London. 108
Burrows, Kate, and Patrick Kinney. 2016. “Exploring the Climate Change,Migration and Conflict Nexus.” International journal of environmental research andpublic health, 13(4): 443. 1
Bussière, Georges. 1877. Études historiques sur la Révolution en Périgord. 1èrepartie : La Bourgeoisie périgourdine au XVIIIe siècle. Bordeaux : Charles LefebvreÉditions. 64, 110
Bussière, Georges. 1885. Études historiques sur la Révolution en Périgord. 2èmepartie : Le mouvement életoral de 1789. Vol. 2, Bordeaux : Charles LefebvreÉditions. 114
Butel, Paul. 1976. “L’instruction populaire en Aquitaine au XVIIIe siècle :l’exemple de l’Agenais.” Revue d’Histoire économique et sociale, 54(1): 5–28. 270
Cabanel, Patrick. 2012. Histoire des protestants en France (XVIe–XXIe siècle). Fayard.246, 251, 255, 259, 267
Cailly, Claude. 2000. “Proto-industrialisation textile et développement régionalrural, XVIIIe–XIXe siècles. L’exemple de l’industrie toilière du Perche.” Annalesde Bretagne et des pays de l’Ouest, 107(2): 135–150. 46
Camenisch, Chantal, and Ch. Rohr. 2018. “When the Weather Turned Bad. TheResearch of Climate Impacts on Society and Economy during the Little Ice Agein Europe. An Overview.” Cuadernos de investigación geográfica, 44(1): 99–114. 2
Cameron, A. Colin, Jonah B. Gelbach, and Douglas L. Miller. 2008. “Bootstrap-Based Improvements for Inference with Clustered Errors.” The Review ofEconomics and Statistics, 90(3): 414–427. 205
Cameron, Iain A. 1981. Crime and Repression in the Auvergne and the Guyenne,1720–1790. Cambridge University Press. 116, 117, 200, 299
Campbell, Bruce M. S. 2016. The Great Transition. Climate, Disease and Society inthe Late-Medieval World. Cambridge University Press. 2
Campbell, Bruce M. S., and Cormac Ó Gráda. 2011. “Harvest Shortfalls, GrainPrices, and Famines in Preindustrial England.” Journal of Economic History,71(4): 859–886. 104
Campbell, Peter R. 2012. “Absolute Monarchy.” The Oxford Handbook of the AncienRégime, ed. William Doyle, 11–38. Oxford University Press. 8
314 Bibliography
Cantoni, Davide. 2012. “Adopting a New Religion: the Case of Protestantism in16th Century Germany.” The Economic Journal, 122(560): 502–531. 248
Cantoni, Davide. 2015. “The Economic Effects of the Protestant Reformation:Testing the Weber Hypothesis in the German Lands.” Journal of the EuropeanEconomic Association, 13(4): 561–598. 249
Cantoni, Davide, Jeremiah Dittmar, and Noam Yuchtman. 2018. “ReligiousCompetition and Reallocation: the Political Economy of Secularization in theProtestant Reformation.” Quarterly Journal of Economics, 133(4): 2037–2096. 249
Caratini, Roger. 2009. La Corse. Archipel. 63
Carleton, Tamma A., and Solomon M. Hsiang. 2016. “Social and EconomicImpacts of Climate.” Science, 353(6304): aad9837. 1, 119
Carleton, T., Solomon M. Hsiang, and Marshall Burke. 2016. “Conflict in aChanging Climate.” The European Physical Journal Special Topics, 225(3): 489–511.1, 125, 177
Cary, John. 1808. Cary’s new universal atlas: containing distinct maps of all the prin-cipal states and kingdoms throughout the World, from the latest and best authoritiesextant. London: Printed for J. Cary. 198
Cassan, Michel. 2006. “La capitation. Une source valable pour la pesée des officeset des officiers?” Les Cahiers du Centre de Recherches Historiques, 38: 73–84. 26
Castan, Nicole. 1977. “Délinquance traditionnelle et répression critique à la finde l’Ancien Régime dans les pays de Languedoc.” Annales historiques de laRévolution française, 16(2): 182–203. 200, 207
Castenbrandt, Helene. 2014. “A Forgotten Plague: Dysentery in Sweden, 1750–1900.” Scandinavian Journal of History, 39(5): 612–639. 32
Cathelineau, Léonce. 1912. Cahiers de doléances des sénéchaussées de Niort et deSaint-Maixent et des communautés et corporations de Niort et Saint-Maixent pourles États généraux de 1789. Niort : Imprimerie Nouvelle G. Clouzot. 112, 114
Cauvin, Antoine. 1885. Mémoires pour servir à l’histoire naturelle, statistique,industrielle, agraire, politique, morale et religieuse de la commune de Contes et duhameau de Sclos. Nice : Imprimerie du Patronnage Saint-Pierre. 59
Cavallo, Eduardo A., and Ilan Noy. 2009. “The Economics of Natural Disasters:a Survey.” IDB working paper. 174
Cavallo, Sandra. 1990. “Patterns of Poor-Relief and Patterns of Poverty inEighteenth-Century Italy: the Evidence of the Turin Ospedale di Carità.”Continuity and Change, 5(1): 65–98. 190
Cavallo, Sandra. 1995. Charity and Power in Early Modern Italy: Benefactors andTheir Motives in Turin, 1541–1789. Cambridge University Press. 190, 231
Cavoleau, Jean-Alexandre. 1818a. Description du département de la Vendée, etconsidérations générales sur la guerre civile de 1793, 1794, et 1795. Nantes : chezVeuve Mangin. 89
Bibliography 315
Cavoleau, Jean-Alexandre. 1818b. “Notice sur l’agriculture du département dela Vendée, avec l’indication des améliorations qu’elle a éprouvées depuiscinquante ans.” Mémoires d’agriculture, d’économie rurale et domestique, 381–505.88
Ceglar, Andrej, Andrea Toreti, Rémi Lecerf, Marijn Van der Velde, and FrankDentener. 2016. “Impact of Meteorological Drivers on Regional Inter-annualCrop Yield Variability in France.” Agricultural and Forest Meteorology, 216: 58–67. 102
Cénat, Jean-Philippe. 2011. “La genèse et l’élaboration de la capitation de 1695 :le rôle décisif de Chamlay, conseiller militaire de Louis XIV.” Histoire, économie& société, 30(3): 29–48. 18
Cerisier, Patrick. 1995. “Les subdélégués de l’intendant Taboureau et le com-merce des grains en Hainaut à l’époque de Terray (1769–1774).” Revue du Nord,77(309): 29–58. 109
Champier, Laurent. 1948. “L’ouverture de la Bresse par les voies de communica-tion modernes.” Les Études rhodaniennes, 23(3): 167–172. 12
Chaney, Eric. 2013. “Revolt on the Nile: Economic shocks, Religion, and PoliticalPower.” Econometrica, 81(5): 2033–2053. 98
Chaney, Eric, and Richard Hornbeck. 2016. “Economic Dynamics in the Malthu-sian Era: Evidence from the 1609 Spanish Eexpulsion of the Moriscos.” TheEconomic Journal, 126(594): 1404–1440. 250
Chapalalain-Nougaret, Christine. 1984. “Les secours en temps de disette auXVIIIe siècle : L’exemple du diocèse de Rennes.” Annales de Bretagne et des paysde l’Ouest, 91(2): 135–155. 112
Chaplain, Jean-Michel. 1984. La chambre des tisseurs : Louviers, cité drapière, 1680–1840. Editions Champ Vallon. 47
Charbonnier, Pierre. 1990. Les anciennes mesures locales du Massif central, d’aprèsles tables de conversion. Presses universitaires Blaise Pascal. 264
Charbonnier, Pierre. 2005. Les anciennes mesures locales du Centre-Est, d’après lestables de conversion. Presses universitaires Blaise Pascal. 264
Charbonnier, Pierre. 2012. Les anciennes mesures du Centre historique de la France,d’après les tables de conversion. Éditions du CTHS. 264
Charbonnier, Sophie. 2002. “Les alpages en Haute-Tarentaise au XVIIIe siècle.”Master’s diss. Université de Savoie. 235
Chartier, Roger, Dominique Julia, and Compère Marie-Madeleine. 1976.L’éducation en France du XVIe au XVIIIe siècle. Société d’Édition d’EnseignementSupérieur. 270
Chassang, Sylvain, and Gerard Padró-i Miquel. 2009. “Economic Shocks andCivil War.” Quarterly Journal of Political Science, 4(3): 211–228. 173
316 Bibliography
Chaussat, Alain-Gilles. 2018. “Les population du Massif Armoricain au cribledu sarrasin : Étude d’un marqueur culturel du bocage normand (XVIe–XXe
siècle).” PhD diss. Université de Caen-Normadie. 36
Cheney, Paul. 2014. “Commerce.” The Cambridge Companion to the French Enlight-enment, ed. Daniel Brewer, 44–59. Cambridge University Press. 47
Chen, Qiang. 2015. “Climate Shocks, State Capacity and Peasant Uprisings inNorth China during 25–1911 ce.” Economica, 82(326): 295–318. 99, 169
Chevet, Jean-Michel. 1993. “Les crises démographiques en France à la fin duXVIIe et au XVIIIe siècle : un essai de mesure.” Histoire & Mesure, 8(1): 117–144.31
Chevet, Jean-Michel, and Cormac Ó Gráda. 2006. “Grain Prices and Mortality: ANote on ‘La Michodière’s Law’.” The European Journal of the History of EconomicThought, 13(2): 183–194. 32
Christian, Cornelius, and James Fenske. 2015. “Economic Shocks and Unrest inFrench West Africa.” Centre for the Study of African Economies, University ofOxford. 99, 169, 172, 173
Christian, Cornelius, and Liam Elbourne. 2018. “Shocks to Military Support andSubsequent Assassinations in Ancient Rome.” Economics Letters, 171: 79–82. 94
Chuine, Isabelle, Pascal Yiou, Nicolas Viovy, Bernard Seguin, Valérie Daux,and Emmanuel Le Roy Ladurie. 2004. “Historical Phenology: Grape Ripeningas a Past Climate Indicator.” Nature, 432(7015): 289–290. 202
Claret de La Tourette, Marc Antoine Louis. 1770. Voyage au Mont-Pilat dansla province du Lyonnois contenant des observations sur l’histoire naturelle de cettemontagne, & des lieux circonvoisins. Lyon : Regnault, Imprimeur-Libraire. 83
Claus, Sylvie. 2013. “Le Sénat : une histoire d’archives.” Le Sénat de Savoie :archives, historiographies, perspectives (XVIe–XIXe siècles), ed. Françoise Briegeland Sylvain Milbach, 11–48. Université de Savoie. 199
Clos, Dominique. 1874. Quelques documents pour l’histoire de la pomme de terre.Toulousej : Imprimerie de Douladoure. 65
Cohen, Alain. 2009. “Les procès des anciens intendants durant la Révolution.”Annales historiques de la Révolution française, 356(2): 29–56. 8
Cohn, Samuel Kline. 2009. Lust for Liberty: The Politics of Social Revolt in MedievalEurope, 1200–1425. Harvard University Press. 2, 116
Collet, Dominik, and Maximilian Schuh. 2018. “Famines: At the Interface ofNature and Society.” Famines During the ‘Little Ice Age’ (1300–1800), ed. DominikCollet and Maximilian Schuh, 3–16. Springer. 295
Collier, Paul, and Anke Hoeffler. 1998. “On Economic Causes of Civil War.”Oxford economic papers, 50(4): 563–573. 103, 170, 173
Collier, Paul, and Anke Hoeffler. 2004. “Greed and Grievance in Civil War.”Oxford economic papers, 56(4): 563–595. 171, 174
Bibliography 317
Collins, James B. 2009. The State in Early Modern France. Cambridge UniversityPress. 105, 113, 299
Compère, Marie-Madeleine. 1977. “École et alphabétisation en Languedoc auxXVIIe et XVIIIe siècles.” Lire et écrire : l’alphabétisation des Français de Calvin àJules Ferry, ed. François Furet and Jacques Ozouf Vol. 2, 43–99. Les Éditions deMinuit. 270
Concato, Francis, and Pierre Largesse. 1992. “La manufacture de draps d’Elbeufavant et après la révocation de l’Édit de Nantes.” Bulletin de la Société del’Histoire du Protestantisme Français, 138(3): 407–418. 257, 263
Conchon, Anne. 2002. Le péage en France au XVIIIe siècle : les privilèges à l’épreuvede la réforme. Comité pour l’histoire économique et financière de la France. 17,19
Cook, C. Justin. 2014. “Potatoes, Milk, and the Old World Population Boom.”Journal of Development Economics, 110: 123–138. 37, 102
Courtépée, Claude. 1780. Description générale et particulière du duché de Bourgogne,précédée de l’abrégé historique de cette province. Dijon : Causse. 92
Crook, D. S., D. J. Siddle, J. A. Dearing, and R. Thompson. 2004. “HumanImpact on the Environment in the Annecy Petit Lac Catchment, Haute-Savoie:a Documentary Approach.” Environment and History, 10: 247–284. 191, 195, 236
Crook, D. S., D. J. Siddle, R. T. Jones, J. A. Dearing, G. C. Foster, and R.Thompson. 2002. “Forestry and Flooding in the Annecy Petit Lac Catchment,Haute-Savoie 1730–2000.” Environment and History, 8: 403–428. 236
Cullen, Louis M. 2002. The Brandy Trade under the Ancien Régime: RegionalSpecialisation in the Charente. Cambridge University Press. 299
Curtis, Daniel R., and Jessica Dijkman. 2017. “The Escape from Famine in theNorthern Netherlands: a Reconsideration Using the 1690s Harvest Failures anda Broader Northwest European Perspective.” The Seventeenth Century, 1–30. 264
Curuk, Malik, and Sjak Smulders. 2016. “Malthus Meets Luther: The EconomicsBehind the German Reformation.” CESifo Working Papers 6010. 265
Daireaux, Luc. 2010. Réduire les Huguenots. Protestants et pouvoirs en Normandie auXVIIe siècle. Honoré Champion. 257
Daireaux, Luc. 2012. “Louis XIV et les protestants normands : autour de la révo-cation de l’édit de Nantes.” Bulletin de la Société de l’Histoire du ProtestantismeFrançais, 158(1): 123–132. 257
Danet, Vincent. 2011. “Le second peuple de Nantes au XVIIIe siècle : environ-nements du quotidien et interactions sociales.” PhD diss. Université de Nantes.38, 48
Daquin, Joseph. 1787. Topographie médicale de la ville de Chambéry et de ses environs.Imprimerie M. F. Gorrin. 194
318 Bibliography
D’Argenson, René-Louis de Voyer. 1869a. Journal et mémoires du marquisd’Argenson. Vol. I, Librairie Jules Renouard. 106, 108
D’Argenson, René-Louis de Voyer. 1869b. Journal et mémoires du marquisd’Argenson. Vol. II, Librairie Jules Renouard. 111
Darlu, Pierre, Guy Brunet, and Dominique Barbero. 2011. “Spatial and Tem-poral Analyses of Surname Distributions to Estimate Mobility and Changes inHistorical Demography: the Example of Savoy (France) from the Eighteenthto the Twentieth Century.” Navigating time and space in population studies, ed.Myron P. Gutmann, G. D. Deane, Kenneth M. S. Sylvester and E. R. Merchant,99–113. Springer. 197
Daudin, Guillaume. 2001. “Le rôle du commerce dans la croissance : Uneréflexion à partir de la France du XVIIIe siècle.” PhD diss. Université Panthéon-Sorbonne-Paris I. 47
Daudin, Guillaume. 2010. “Domestic Trade and Market Size in Late Eighteenth-Century France.” Journal of Economic History, 70(3): 716–743. 47, 104
Daux, Valérie. 2013. “Reconstruction du climat à partir de la compositionisotopique de l’oxygène et du carbone des cernes d’arbres.” La Météorologie,80: 14–22. 120
Daux, V., I. Garcia de Cortazar-Atauri, P. Yiou, I. Chuine, E. Garnier, E.Le Roy Ladurie, O. Mestre, and J. Tardaguila. 2012. “An Open-access Databaseof Grape Harvest Dates for Climate Research: Data Description and QualityAssessment.” Climate of the Past, 8(5): 1403–1418. 121, 142, 184, 202
Davranches, Louis. 1897. Le revenu de l’abbaye du Bec à la fin du XVIIIe siècle.Sotteville-lès-Rouen : Imprimerie de E. Lecourt. 113
de Calonne, Albéric. 1883. La vie agricole sous l’Ancien Régime dans le nord de laFrance. Paris : Guillaumin et Cie. 78
de Calonne, Albéric. 1920. La vie agricole sous l’Ancien Régime dans le nord de laFrance. Paris : Auguste Picard. 78, 79
de Candolle, Augustin Pyrame. 1806. “Rapport sur un Voyage botaniqueet agronomique dans les Départements de l’Ouest.” Mémoires d’agriculture,d’économie rurale et domestique, 10: 228–291. 66
Degroot, Dagomar. 2018. “Climate Change and Society in the 15th to 18thCenturies.” Wiley Interdisciplinary Reviews: Climate Change, 9(3): e518. 94
De La Croix, David, and Faustine Perrin. 2018. “How Far Can EconomicIncentives Explain the French Fertility and Education Transition?” EuropeanEconomic Review, 108: 221–245. 298
Delacroix, Jacques, and François Nielsen. 2001. “The Beloved Myth: Protes-tantism and the Rise of Industrial Capitalism in Nineteenth-century Europe.”Social Forces, 80(2): 509–553. 245
Bibliography 319
De l’ancienne dîme établie sur les Pommes de terre. 1867. “De l’ancienne dîmeétablie sur les Pommes de terre.” Bulletin de la Société zoologique d’acclimatation,14: 301–304. 91
Delettre, François-Antoine. 1849. Histoire de la province du Montois, comprise dansles cantons de Bray, Donnemarie, Provins et Nangis, arrondissement de Provins.Vol. 2, Nogent-sur-Seine : Imprimerie de Garreau et Raveau. 86
Delfau, Guillaume. 1803. Annuaire statistique du département de la Dordogne pourl’an XII de la République. Périgueux : Imprimerie F. Dupont. 64
Delhoume, Jean-Pierre. 2007. “Une spécialisation en pays de petite culture :l’élevage bovin en Limousin au XVIIIe siècle.” PhD diss. Université de Limo-ges. 46, 91
Delleaux, Fulgence. 2005. “Progrès agricoles et modernisation culturelle auXVIIIe siècle. Les campagnes du Hainaut au miroir des inventaires de censiers.”Revue du Nord, 362(4): 835–859. 38
Delleaux, Fulgence. 2009. “L’astronome aux champs. Le journal de Jacques-André Mallet sur le domaine d’Avully en Genevois (1773–1789).” HistoireSocietes Rurales, 31(1): 141–194. 57
Delleaux, Fulgence. 2010. “Le censier et la laine. Codicille à une étude surl’élevage ovin en Hainaut au XVIIIe siècle.” Revue du Nord, 384(1): 53–58. 43
Delleaux, Fulgence. 2015. “La grande exploitation, la ville et les agronomes :Dynamiques et stratégies de production au domaine d’Avully en Genevois à lafin du XVIIIe siècle.” Histoire, économie & sociétés, 34(4): 5–26. 44
Dell, Melissa. 2012. “Insurgency and Long-run Development: Lessons from theMexican Revolution.” Unpublished manuscript, Harvard Univ., Cambridge, MA.99, 169
Dell, Melissa, Benjamin F. Jones, and Benjamin A. Olken. 2014. “What Do WeLearn from the Weather? The New Climate-Economy Literature.” Journal ofEconomic Literature, 52(3): 740–98. 99, 119, 126, 168, 183
Delpon, Jacques-Antoine. 1831. Statistique du département du Lot. Vol. 2, Pairs :Bachelier père et fils. 74
Delsalle, Paul. 2011. “Les frères Bauhin et la pomme de terre aux XVIe et XVIIe
siècles.” La Pomme de terre de la Renaissance au XXIe siècle, ed. Marc de Ferrière leVaquer and Jean Pierre Williot, 19–28. Presses Universitaires de Rennes. 65
Depoisier, J. 1858. “Étude statistique sur les émigrations de la Savoie depuis 1783jusqu’en 1847.” L’Investigateur : Journal de l’Institut historique, 8: 33–64. 204
de Rouville, Féra. 1809. “Compte-rendu à la Société d’une culture sans jachère ésur une exploitation de cent hectares.” Mémoires d’agriculture, d’économie ruraleet domestique, 12: 302–369. 73
Désert, Gabriel. 1955. “La culture de la pomme de terre dans le Calvados au XIXe
siècle.” Annales de Normandie, 5(3-4): 261–270. 62
320 Bibliography
Desmaret, Nicolas. 1765. Éphémérides de la généralité de Limoges pour l’année 1765.Limoges : chez Martial Barbou. 72, 90
Devos, Roger, and Bernard Grosperrin. 1985. Histoire de la Savoie. La Savoie de laRéforme à la Révolution française. Vol. 3, Ouest France. 189, 197, 235
De Vries, Jan. 2006. European Urbanization, 1500–1800. Routledge. 195
Deyon, Pierre. 1967. Amiens, capitale provinciale : Étude sur la société urbaine auXVIIe siècle. Mouton & Co. 33, 263
Didier, Sébastien. 2014. “Du réseau au maillage administratif, la constructionterritoriale des subdélégations bretonnes de 1689 à 1789.” Annales de Bretagne etdes pays de l’Ouest, 121(4): 81–106. 9, 10, 14, 115
Diebolt, Claude, and Faustine Perrin. 2014. “The Foundations of Female Em-powerment Revisited.” Revue d’économie politique, 124(4): 587–597. 31
Dieterle, Steven G., and Andy Snell. 2016. “A Simple Diagnostic to InvestigateInstrument Validity and Heterogeneous Effects When Using a Single Instru-ment.” Labour Economics, 42: 76–86. 177
Dincecco, Mark. 2009. “Fiscal Centralization, Limited Government, and PublicRevenues in Europe, 1650–1913.” Journal of Economic History, 69(1): 48–103. 15,53
Dincecco, Mark. 2015. “The Rise of Effective States in Europe.” Journal of EconomicHistory, 75(3): 901–918. 17
Dincecco, Mark, and Gabriel Katz. 2016. “State Capacity and Long-run Eco-nomic Performance.” The Economic Journal, 126(590): 189–218. 17
Dincecco, Mark, and Mauricio Prado. 2012. “Warfare, Fiscal Capacity, andPerformance.” Journal of Economic Growth, 17(3): 171–203. 16
Dittmar, Jeremiah E. 2011. “Information Technology and Economic Change: TheImpact of the Printing Press.” Quarterly Journal of Economics, 126(3): 1133–1172.248, 268
Dittmar, Jeremiah E., and Ralf R. Meisenzahl. 2016. “State Capacity and PublicGoods: Institutional Change, Human Capital and Growth in Early ModernGermany.” Centre for Economic Performance Working Paper No 1418. 249
Dittmar, Jeremiah E., and Skipper Seabold. 2015. “Media, Markets and In-stitutional Change: Evidence from the Protestant Reformation.” Centre forEconomic Performance Working Paper No 1367. 245, 269
Dix-Carneiro, Rafael, Rodrigo R. Soares, and Gabriel Ulyssea. 2017. “EconomicShocks and Crime: Evidence from the Brazilian Trade Liberalization.” NationalBureau of Economic Research Working Paper 23400. 187
Dixon, C. Scott. 2017. “Luther’s Ninety-Five Theses and the Origins of theReformation Narrative.” The English Historical Review, 132(556): 533–569. 243
Dixon, Jeffrey. 2009. “What Causes Civil Wars? Integrating Quantitative Re-search Findings.” International Studies Review, 11(4): 707–735. 99, 170, 171
Bibliography 321
Doisy, M. 1753. Le Royaume de France et les États de Lorraine disposés en forme dedictionnaire. Paris : N. Tilliard. 265
Dontenwill, Serge. 2000. “Espaces démographiques dans les campagnes duCentre-Est de la France au XVIIIe siècle : Le cas du Roannais.” 279–291. Ined.33
Dontenwill, Serge. 2007. “Aspects de la vie quotidienne et de l’organisationsociale des communautés paysannes du centre sud-est de la France au tempsde Louis XIV (1638–1715).” Dix-septième siècle, 234(1): 97–134. 13, 24, 26
Doyle, William. 2011. The Oxford Handbook of the Ancien Régime. Oxford Univer-sity Press. 101
Dresch, Catherine. 1990. “Maternal Nutrition and Infant Mortality Rates: AnEvaluation of the Bourgeoisie of 18th-century Montbéliard.” Food and Foodways,4(1): 1–38. 33
Dube, Oeindrila, and Juan F. Vargas. 2013. “Commodity Price Shocks and CivilConflict: Evidence from Colombia.” The Review of Economic Studies, 80(4): 1384–1421. 99, 103
Dubuc, André. 1953. “La culture de la pomme de terre en Normandie avant etdepuis Parmentier.” Annales de Normandie, 3(1): 50–68. 85
Duffaud, M. 1861. “Notes sur les prix des grains à Poitiers, depuis trois siècles.”Mémoires de l’Académie des Sciences de l’Institut Impérial de France, 17: 221–337.110
Duhamel, L. M. 1803. “Mémoire sur le sol de l’Arondissement de Coutances, dé-partement de la Manche, et ses principales productions.” Annales de l’agriculturefrançaise, XV: 289–336. 75
Duma, Jean. 2013. “Hommage à Pierre Goubert.” Cahiers d’histoire. Revue d’histoirecritique, 121: 191–203. 7
Dupâquier, Jacques. 1979. La population française aux XVIIe et XVIIIe siècles.Presses Universitaires de France. 30
Dupâquier, Jacques. 1988. Histoire de la population française. De la Renaissance à1789. Presses Universitaires de France. 34, 35, 260
Dupin, Étienne. 1803. Mémoire statistique du département des Deux-Sèvres. Pairs :Imprimerie. de la République. 86
Dupont de Nemours, Pierre-Samuel. 1782. Mémoires sur la vie et les ouvrages deM. Turgot, ministre d’état. Vol. 2, Philadelphie. 63
Durand, Georges. 1979. Vin, vigne et vignerons en Lyonnais et Beaujolais (XVIe–XVIIIe siècles). Presses Universitaires de Lyon. 33, 46, 194
Dutil, Léon. 1911. L’état économique du Languedoc à la fin de l’Ancien Régime (1750–1789). Paris : Hachette. 62, 68, 87
Dyer, Christopher. 2012. “Poverty and its Relief in Late Medieval England.” Past& Present, 216(1): 41–78. 113
322 Bibliography
Ekelund, Robert B., Robert F. Hébert, and Robert D. Tollison. 2002. “AnEconomic Analysis of the Protestant Reformation.” Journal of Political Economy,110(3): 646–671. 266
Ekelund, Robert B., Robert F. Hébert, and Robert D. Tollison. 2006. TheMarketplace of Christianity. MIT Press. 244, 261, 266
El Kordi, Mohamed. 1970. Bayeux aux XVIIe et XVIIIe siècles. Contribution àl’histoire urbaine de la France. E.P.H.E., VIe section Sciences Économiques etSociales. 113
Enamorado, Ted, Luis F. López-Calva, Carlos Rodríguez-Castelán, and HernánWinkler. 2016. “Income Inequality and Violent Crime: Evidence from Mexico’sDrug War.” Journal of Development Economics, 120: 128–143. 238
Esmonin, Edmond. 1960. “Les intendants de Savoie au XVIIIe siècle.” 7–34,Comité des Travaux Historiques et Scientifiques. Paris : Imprimerie Nationale.190
Esmonin, Edmond. 1964. Étude sur la France des XVIIe et XVIIIe siècles. PressesUniversitaires de France. 121
Etien, N., V. Daux, V. Masson-Delmotte, O. Mestre, M. Stievenard, M. T.Guillemin, T. Boettger, N. Breda, M. Haupt, and P. P. Perraud. 2009. “SummerMaximum Temperature in Northern France over the past Century: Instrumen-tal Data versus Multiple Proxies (Tree-ring Isotopes, Grape Harvest Dates andForest Fires).” Climatic Change, 94(3-4): 429–456. 201, 202
Ewert, Ulf Christian. 2004. “The Biological Standard of Living in a Cold Century.Long-term Effects of Climate and the Economy on Average Height in AncienRégime France.” Francia, 31(2): 25–53. 40
Expilly, Jean-Joseph. 1763–68. Dictionnaire géographique, historique et politique desGaules et de la France. Vol. 6, Amsterdam. 72, 106, 116, 122
Fabriès-Verfaillie, Maryse, Pierre Stragiotti, and Annie Jouve. 2000. La Francedes villes : le temps des métropoles ? Editions Bréal. 35
Faivre, Carole. 2011. “La pomme de terre dans les noms de préparationsculinaires en France (du XVIIIe siècle à nos jours).” La Pomme de terre de laRenaissance au XXIe siècle, ed. Marc Ferrière le Vaquer and Jean Pierre Williot,115–134. Presses Universitaires de Rennes. 69, 81
Fajnzylber, Pablo, Daniel Lederman, and Norman Loayza. 2002. “Inequalityand Violent Crime.” The Journal of Law and Economics, 45(1): 1–39. 238
Farge, James K. 1985. Orthodoxy and Reform in Early Reformation France. The Facultyof Theology of Paris, 1500–1543. Brill. 268
Favier, René. 1992. “Economic Change, Demographic Growth and the Fate ofDauphineé’s Small Towns, 1698–1790.” Cities and social change in early modernFrance, ed. Philip Benedict, 224–241. Routledge. 11, 30, 34, 35, 48
Bibliography 323
Favier, René. 2007. “Une aide instrumentalisée : l’impôt et l’indemnisationdes catastrophes naturelles dans la France du XVIIIe siècle.” Les modalités depaiement de l’Etat moderne : adaptation et blocage d’un système comptable, ed. Marie-Laure Legay, 107–132. Comité d’Histoire économique et financière. 13, 110
Favier, René. 2011. “La Chambre des comptes de Dauphiné et le contrôle desaides publiques au milieu du XVIIIe siècle en Dauphiné.” Contrôler les financessous l’Ancien Régime : regards d’aujourd’hui sur les Chambres des comptes, ed.Dominique Le Page, 277–288. Comité d’Histoire économique et financière. 13
Feld, Lars P., and Christoph A. Schaltegger. 2010. “Political Stability and FiscalPolicy: Time Series Evidence for the Swiss Federal Level since 1849.” PublicChoice, 144(3-4): 505–534. 98
Feng, Shuaizhang, Alan B. Krueger, and Michael Oppenheimer. 2010. “Link-ages among Climate Change, Crop Yields and Mexico–US Cross-Border Mi-gration.” Proceedings of the National Academy of Sciences, 107(32): 14257–14262.186
Fenske, James, and Namrata Kala. 2017. “1807: Economic Shocks, Conflict andthe Slave Trade.” Journal of Development Economics, 126: 66–76. 99
Ferrand, Félix. 1979. “Les débuts de la pomme de terre en Savoie-Propre et sur sesconfins dauphinois.” 33–45, Congrès de sociétés savantes de Savoie. SociétésSavantes de Savoie. 70, 71, 194
Ferrer, André. 1999. “Les contrebandiers sur la frontière franco-suisse au XVIIIe
siècle.” Revue d’Histoire Suisse, 49: 35–46. 19
Field, Christopher B., Vicente R. Barros, M. D. Mastrandrea, Katharine J. Mach,M. A.-K. Abdrabo, N. Adger, Y. A. Anokhin, O. A. Anisimov, D. J. Arent, J.Barnett, et al. 2014. “Summary for Policymakers.” Climate Change 2014: Impacts,Adaptation, and Vulnerability. Part A: Global and Sectoral Aspects. Contribution ofWorking Group II to the Fifth Assessment Report of the Intergovernmental Panel onClimate Change, 1–32. Cambridge University Press. 94
Fogel, Robert W. 1994. “Economic Growth, Population Theory, and Physiology:the Bearing of Long-term Processes on the Making of Economic Policy.”National Bureau of Economic Research Working Paper 4638. 39
Fontaine, Laurence. 1998. “Migration and Work in the Alps (17th-18th Centuries):Family Strategies, Kinship, and Clientelism.” The history of the Family, 3(3): 351–369. 188
Fontaine, Laurence. 2003. Pouvoir, identités et migrations dans les hautes vallées desAlpes Occidentales (XVIIe–XVIIIe siècle). Presses Universitaires de Grenoble. 196
Fontaine, Laurence, and David Siddle. 2000. “Mobility, Kinship and Commercein the Alps, 1500–1800.” Migration, Mobility and Modernization, ed. DavidSiddle, 47–69. Liverpool University Press. 188
Fornerod, Nicolas, and Philip Benedict. 2009. “Les 2 150 « églises »réformées deFrance de 1561–1562.” Revue historique, (3): 529–560. 253

324 Bibliography
Fouquet, Yannick. 1986. “Pauvreté et assistance au XVIIe siècle : le cas exemplairede Chambéry.” Mémoires et Documents de la Société Savoisienne d’Histoire etd’Archéologie, 89: 1–152. 231, 232
Fourie, Johan, and Dieter von Fintel. 2014. “Settler Skills and Colonial Develop-ment: The Huguenot Wine-makers in Eighteenth-century Dutch South Africa.”Economic History Review, 67(4): 932–963. 250
française, Agriculture. 1843. Agriculture française par MM. les inspecteurs del’agriculture. Département des Hautes-Pyrénées. Paris : Imprimerie Royale. 81
Franck, Raphaël, and Oded Galor. 2018. “Flowers of Evil? Industrialization andLong Run Development.” IZA Working Paper 11681. 298
Franck, Raphaël, and Stelios Michalopoulos. 2017. “Emigration during theFrench Revolution: Consequences in the Short and Longue Durée.” NationalBureau of Economic Research Working Paper 23936. 175, 176, 298
Franck, Raphël. 2016. “The Political Consequences of Income Shocks: Explainingthe Consolidation of Democracy in France.” Review of Economics and Statistics,98(1): 57–82. 132, 298
Franck, Raphël, and Oded Galord. 2017. “Technology-Skill Complementarityin Early Phases of Industrialization.” National Bureau of Economic ResearchWorking Paper 23197. 104, 184
Franklin, Julian H. 1973. “Jean Bodin and the End of Medieval Constitutional-ism.” 151–166. Beck. 7
Frêche, Georges. 1974. Toulouse et la région Midi-Pyrénées au siècle des Lumières (vers1670–1789). Éditions Cujas. 101, 102, 109
Frêche, Georges. 1979. “Cinquante et une mercuriales du Massif Central (XVIe–XIXe siècles).” Annales du Midi : revue archéologique, historique et philologique dela France méridionale, 91(141): 29–52. 264
Freedman, Matthew, Emily Owens, and Sarah Bohn. 2018. “Immigration, Em-ployment Opportunities, and Criminal Behavior.” American Economic Journal:Economic Policy, 10(2): 117–51. 185
Furet, François. 1983. “Beyond the Annales.” The Journal of Modern History,55(3): 389–410. 4
Furet, François, and Jacques Ozouf. 1977. Lire et écrire : l’alphabétisation desFrançais de Calvin à Jules Ferry. Les Éditions de Minuit. 262
Furet, François, and Wladimir Sachs. 1974. “La croissance de l’alphabétisationen France: XVIIIe–XIXe siècle.” Annales. Économies, Sociétés, Civilisations,29(3): 714–737. 262
Gachet, Bruno. 2002. “La gabelle du sel au XVIIIe siècle en Savoie.” Master’s diss.Université de Savoie. 195, 229
Galina, MA, F. Osnaya, H .M. Cuchillo, and G. F. W. Haenlein. 2007. “CheeseQuality From Milk of Grazing or Indoor Fed Zebu Cows and Alpine CrossbredGoats.” Small Ruminant Research, 71(1): 264–272. 235
Bibliography 325
Galloway, Patrick R. 1986a. “Differentials in Demographic Responses to AnnualPrice Variations in pre-Revolutionary France.” European Journal of Population,2(3-4): 269–305. 34
Galloway, Patrick R. 1986b. “Long-Term Fluctuations in Climate and Populationin the Preindustrial Era.” Population and Development Review, 12(1): 1–24. 175
Galloway, Patrick R. 1994. “Secular Changes in the Short-term Preventive,Positive, and Temperature Checks to Population Growth in Europe, 1460 to1909.” Climatic Change, 26(1): 3–63. 175
Galor, Oded, and Ömer Özak. 2016. “The Agricultural Origins of Time Prefer-ence.” American Economic Review, 106(10): 3064–3103. 265
Ganiage, Jean. 1999. Beauvais au XVIIIe siècle : Population et cadre urbain. CNRSÉditions. 35
Garden, Maurice. 1970. Lyon et les Lyonnais au XVIIIe siècle. Les Belles lettres. 198
Garnier, Bernard. 1999. “Des boeufs pour Paris : Commercialisation et élevageen Basse-Normandie (1700–1900).” Annales de Bretagne et des pays de l’Ouest,106(1): 101–120. 43
Garnier, Emmanuel, and Frédéric Surville. 2010. Climat et révolutions : Autour duJournal du négociant rochelais Jacob Lambertz (1733–1813). Saintes : Le Croît Vif.103
Garnot, Benoît. 1988. La population française aux XVIe, XVIIe et XVIIIe siècles.Editions Ophrys. 30, 31, 35
Garnot, Benoît. 1989. “Une illusion historiographique : justice et criminalité auXVIIIe siècle.” Revue Historique, 281(2): 361–379. 3
Garnot, Benoît. 2000. “Justice, infrajustice, parajustice et extrajustice dans laFrance d’Ancien Régime.” Crime, Histoire & Sociétés / Crime, History & Societies,4(1): 103–120. 199
Garrisson, Janine. 1980. Protestants du Midi : 1559–1598. Privat. 253
Garrisson, Janine. 1995. A History of Sixteenth Century France, 1483–1598: Renais-sance, Reformation and Rebellion. Macmillan. 253, 254
Gaspard. 1840-1841. “Mémoire sur l’introduction de la culture du maïs, dusarrazin et de la pomme de terre dans le département du Jura.” Annales de lasociété d’émulation du département du Jura, 280–322. 72
Gaterau, M. 1789. Description des plantes qui croissent aux environs de Montauban,ou qu’on cultive dans les jardins. Montauban : chez Charles Crosilhes. 74
Gautier, Michel. 2011. Mercuriales des grains de la Sarthe (XVIIe, XVIIIe, et XIXe
siècles). L’Harmattan. 264
Gégot, Jean-Claude. 1966. “Étude par sondage de la criminalité dans le bailliagede Falaise (XVIIe–XVIIIe siècle)[Criminalité diffuse ou société criminelle ?].”Annales de Normandie, 16(16): 103–164. 200

326 Bibliography
Gennaioli, Nicola, and Hans-Joachim Voth. 2015. “State Capacity and MilitaryConflict.” The Review of Economic Studies, 82(4): 1409–1448. 16
Georges, Jean. 1920. “Mercuriales d’Angoulême, de Cognac et de Jarnac.”Mémoires de la Société Archéologique et d’Historique de la Charente, XI: 3–93. 110
Geraud-Perracha, Guillaume. 1955. “Le commerce des vins et des eaux-de-vieen Languedoc sous l’Ancien régime.” PhD diss. Université de Montpellier. 176
Gex, François. 1943. “La vigne dans la Combe de Savoie.” Revue de géographiealpine, 31(4): 443–512. 195
Geys, Benny. 2017. “Political Dynasties, Electoral Institutions and Politicians’Human Capital.” The Economic Journal, 127(605): F474–F494. 98
Gibault, Georges. 1912. Histoire des légumes. Paris : Librairie Horticole. 61, 71
Girel, J., F. Qutier, A. Bignon, and S. Aubert. 2010. Histoire de l’agricultureen Oisans, Haute Romanche et pays faranchin, Villard d’Arène, Hautes-Alpes. LesCahiers illustrés du Lautaret. 191
Gleditsch, Nils Petter, Peter Wallensteen, Mikael Eriksson, Margareta Sollen-berg, and Håvard Strand. 2002. “Armed Conflict 1946-2001: A New Dataset.”Journal of peace research, 39(5): 615–637. 168
Glineur, Cédric. 2013. La transition administrative au XVIIe siècle. Les instructions del’intendant Le Peletier de Souzy à son successeur en Flandre wallonne (1683). Éditionsdu CTHS. 109
Gobiet, Andreas, Sven Kotlarski, Martin Beniston, Georg Heinrich, JanRajczak, and Markus Stoffel. 2014. “21st Century Climate Change in theEuropean Alps–A review.” Science of the Total Environment, 493: 1138–1151. 191
Godechot, J., and Suzanne Moncassin. 1964. “Démographie et subsistance enLanguedoc (XVIIIe au début du XVIIIe siècle.” Bulletin d’histoire économique etsociale de la Révolution française, 20–60. 67
Golden, Richard M. 1988. The Huguenot Connection: The Edict of Nantes, itsRevocation, and Early French Migration to South Carolina. Kluwer AcademicPublishers. 254, 256
Goldhammer, Arthur, and Jon Elster. 2011. Tocqueville: The Ancien Régime and theFrench Revolution. Cambridge University Press. 13
Goldsmith, James L. 1976. “The Peasants of Languedoc by Emmanuel Le RoyLadurie.” The Canadian Historical Review, 52(2): 229–230. 2
Goldstone, Jack A. 2012. “Demography.” The Oxford Handbook of the AncienRégime, ed. William Doyle, 201–218. Oxford University Press. 29, 30, 36, 101,102, 103
Goubert, Pierre. 1960. Beauvais et le Beauvaisis de 1600 à 1730 : Contribution àl’histoire sociale de la France du XVIIe siècle. S.E.V.P.E.N. 45, 206, 237, 264
Goudot, Grégory. 2006. “Monachisme clunisien et vie rurale sous l’AncienRégime.” Histoire & Sociétés Rurales, 25(1): 9–35. 112, 113

Bibliography 327
Gouhier, Pierre. 1962. “Port-en-Bessin (1597–1792). Étude d’histoire démo-graphique.” Cahier des Annales de Normandie, 1(1): 5–117. 38
Goy, Joseph, and Emmanuel Le Roy Ladurie. 1982. Prestations paysannes, dîmes,rente foncière et mouvement de la production agricole à l’époque préindustrielle.Éditions de l’École des Hautes Études en Sciences Sociales. 42, 103, 122
Gragnolati, Ugo M., Daniele Moschella, and Emanuele Pugliese. 2014. “TheSpinning Jenny and the Guillotine: Technology Diffusion at the Time ofRevolutions.” Cliometrica, 8(1): 5–26. 47
Grantham, George. 1997. “The French Cliometric Revolution: A Survey ofCliometric Contributions to French Economic History.” European Review ofEconomic History, 1(3): 353–405. 298
Grantham, George W. 1989. “Agricultural Supply during the Industrial Revolu-tion: French Evidence and European Implications.” Journal of Economic History,49(1): 43–72. 43
Grantham, George W. 1993. “Divisions of Labour: Agricultural Productivity andOccupational Specialization in Pre-Industrial France.” Economic History Review,46(3): 478–502. 45
Grantham, George W. 2007. “What’s Space Got to Do with it. Distance andAgricultural Productivity Before the Railway Age.” Paper prepared for the 67thAnnual Meetings of the Economic History Society, September 7–9, 2007. 43, 104
Gravier, N.-F. 1836. Histoire de la ville épiscopale et de l’arrondissement de Saint-Dié,deépartement des Vosges. Épinal : Imprimerie de Gérard. 91
Greenshields, Malcolm R. 1994. An Economy of Violence in Early Modern France:Crime and Justice in the Haute Auvergne, 1587–1664. Pennsylvania State Univer-sity Press. 187
Greif, Avner, and Murat Iyigun. 2013a. “Social Organizations, Violence, andModern Growth.” The American Economic Review, 103(3): 534–538. 14
Greif, Avner, and Murat Iyigun. 2013b. “What Did the Old Poor Law ReallyAccomplish? A Redux.” Working Papers 7398. 99
Grenier, Jean Yves. 1996. “Vaches maigres, vaches grasses. Une reconstitution desdonnèes agroclimatiques en France du Nord (1758–1789).” Histoire & SociétésRurales, 6(2): 77–94. 102, 104, 140, 141
Grevet, René. 2003. “D’actifs relais administratifs du pouvoir exécutif. Les32 bureaux d’intendance à la fin du XVIIIe siècle.” Annales historiques de laRévolution française, 332(2): 7–24. 8, 10
Gricourt, Mary-Claude. 1963. “Étude d’Histoire démographique, sociale et re-ligieuse de 5 paroisses de l’archidiaconé du Petit Caux : Doudeville, Canville,Bacqueville, Brachy et Luneray (du milieu du XVIIe siècle à la fin de l’AncienRégime).” Cahier des Annales de Normandie, (3): 445–553. 114
Grillet, Jean-Louis. 1807. Dictionnaire historique, littéraire et statistique des départe-ments du Mont-Blanc et du Léman. J. F. Puthod. 185, 236

328 Bibliography
Gruder, Vivian R. 1968. The Royal Provincial Intendants: A Governing Elite inEighteenth-Century France. Cornell University Press. 106, 107, 108
Guéry, Alain. 1978. “Les finances de la monarchie française sous l’AncienRégime.” Annales. Économies, Sociétés, Civilisations, 33(2): 216–239. 15
Guéry, Alain. 1986. “État, classification sociale et compromis sous Louis XIV : lacapitation de 1695.” Annales. Économies, Sociétés, Civilisations, 41(5): 1041–1060.18
Guicheteau, Samuel. 2008. La Révolution des ouvriers nantais : mutation économique,identité sociale et dynamique révolutionnaire (1740–1815). Presses Universitaires deRennes. 48, 200
Guicheteau, Samuel. 2014. Les ouvriers en France 1700–1835. Armand Colin. 49
Guichonnet, Paul. 1945. “L’émigration saisonnière en Faucigny pendant la pre-mière moitié du XIXe siècle (1783–1860).” Revue de géographie alpine, 33(3): 465–534. 185, 204, 209
Guichonnet, Paul. 1955. “Le cadastre savoyard de 1738 et son utilisation pourles recherches d’histoire et de géographie sociales.” Revue de géographie alpine,43(2): 255–298. 229, 235
Guichonnet, Paul. 1969. “Biens communaux et partages révolutionnaires dansl’ancien département du Léman.” Études rurales, (36): 7–36. 235
Guillaume, Paul. 1908. Recueil des réponses faites par les communautés de l’élection deGap au questionnaire envoyé par la Commission intermédiaire des états du Dauphiné.Imprimerie Nationale. 59
Guillot, Philippe. 1963. “Étude économique et sociale du front de côte entre Orneet Seulles.” Cahier des Annales de Normandie, (3): 275–441. 134
Gutton, Jean-Pierre. 1971. La société et les pauvres : L’exemple de la généralité de Lyon,1534–1789. Les Belles Lettres. 29, 185
Hamon, Philippe. 1994. L’argent du roi. Les finances sous François Ier. Comité pourl’histoire économique et financière de la France. 16
Hamscher, Albert N. 2012. The Royal Financial Administration and the Prosecutionof Crime in France, 1670–1789. University of Delaware Press. 9, 12, 110
Hanlon, Gregory, et al. 1993. Confession and Community in Seventeenth-CenturyFrance: Catholic and Protestant Coexistence in Aquitaine. University of Pennsylva-nia Press. 255
Hanne, Georges. 2009. “Saragosse et Toulouse à la fin de l’époque corporative:une approche comparative.” Obradoiro de Historia Moderna, 18: 71–99. 26
Hauser, Henri. 1899. “The French Reformation and the French People in theSixteenth Century.” The American Historical Review, 4(2): 217–227. 253, 269
Hayhoe, Jeremy. 2012. “Rural Domestic Servants in Eighteenth-Century Bur-gundy: Demography, Economy, and Mobility.” Journal of Social History,46(2): 549–571. 25, 29, 45

Bibliography 329
Hayo, Bernd, and Florian Neumeier. 2014. “Political Leaders’ SocioeconomicBackground and Fiscal Performance in Germany.” European Journal of PoliticalEconomy, 34: 184–205. 97
Heller, Henry. 1986. The Conquest of poverty: The Calvinist Revolt in SixteenthCentury France. Brill. 253
Hendrix, Cullen S., and Idean Salehyan. 2012. “Climate Change, Rainfall, andSocial Conflict in Africa.” Journal of Peace Research, 49(1): 35–50. 118
Heyberger, Laurent. 2012. “New Anthropometric History: An Analysis of theSecular Trend in Height.” In Handbook of Anthropometry. 253–270. Springer. 40
Hickey, Daniel. 1997. Local Hospitals in Ancien Régime France: Rationalization,Resistance, Renewal, 1530–1789. McGill-Queen’s Press-MQUP. 112, 299
Hippe, Ralph. 2012. “How to Measure Human Capital? The RelationshipBetween Numeracy and Literacy.” Économies et sociétés, 46(8): 1627–1654. 262
Hlavac, Marek. 2018. “stargazer: Well-Formatted Regression and SummaryStatistics Tables.” Bratislava, Slovakia, Central European Labour Studies In-stitute (CELSI), R package version 5.2.2. xviii
Hoffman, Philip T. 1982. “Sharecropping and Investment in Agriculture in EarlyModern France.” Journal of Economic History, 42(1): 155–159. 42
Hoffman, Philip T. 1984. “The Economic Theory of Sharecropping in EarlyModern France.” Journal of Economic History, 44(2): 309–319. 18
Hoffman, Philip T. 1986. “Taxes and Agrarian Life in Early Modern France: LandSales, 1550–1730.” Journal of Economic History, 46(1): 37–55. 18, 41
Hoffman, Philip T. 1988. “Institutions and Agriculture in Old Regime France.”Politics & Society, 16(2-3): 241–264. 20, 41, 42
Hoffman, Philip T. 2000. Growth in a Traditional Society: The French Countryside,1450–1815. Princeton University Press. 42, 101, 103, 104
Hoffman, Philip T. 2006. “The Church in Economy and Society.” The CambridgeHistory of Christianity: Enlightment, Reawakening and Revolution 1660–1815,ed. Stewart J. Brown and Thimothy Tackett, Chapter 4, 72–88. CambridgeUniversity Press. 113, 134, 245
Hoffman, Philip T., David S. Jacks, Patricia A. Levin, and Peter H. Lindert. 2002.“Real Inequality in Europe since 1500.” Journal of Economic History, 62(2): 322–355. 28
Holt, Mack P. 2017. “Calvin and Reformed Protestantism.” The Oxford Handbook ofthe Protestant Reformations, ed. Ulinka Rublack, Chapter 11. Oxford UniversityPress. 251
Homer-Dixon, Thomas F. 2010. Environment, Scarcity, and Violence. PrincetonUniversity Press. 173
Horn, Jeff. 2006. The Path not Taken: French Industrialization in the Age of Revolution,1750–1830. MIT Press. 48

330 Bibliography
Hornung, Erik. 2014. “Immigration and the Diffusion of Technology: TheHuguenot Diaspora in Prussia.” American Economic Review, 104(1): 84–122. 250
Hornung, Erik. Forthcoming. “Diasporas, Diversity, and Economic Activity: Evi-dence from 18th-century Berlin.” Explorations in Economic History, Forthcoming.250
Houdaille, Jacques. 1977. “Les signatures au mariage de 1740 à 1829.” Population,32(1): 65–90. 262
Hsiang, Solomon M., and Robert E. Kopp. 2018. “An Economist’s Guide toClimate Change Science.” Journal of Economic Perspective, 32(4): 3–32. 1
Hsiang, Solomon M., Marshall Burke, and Edward Miguel. 2013. “Quantifyingthe Influence of Climate on Human Conflict.” Science, 341(6151): 1235367. 119
Hufton, Olwen H. 1974. The Poor of Eighteenth-Century France 1750–1789. OxfordUniversity Press. 14, 21, 112, 113
Hufton, Olwen H. 1983. “Social Conflict and the Grain Supply in Eighteenth-Century France.” The Journal of Interdisciplinary History, 14(2): 303–331. 101, 113
Huhtamaa, Heli. 2018. “Combining Written and Tree-Ring Evidence to Trace PastFood Crises: A Case Study from Finland.” Famines During the ‘Little Ice Age’(1300–1800), ed. Dominik Collet and Maximilian Schuh, 43–66. Springer. 2
Hung, Ho-fung. 2009. “Cultural Strategies and the Political Economy of Protestin Mid-Qing China.” Social Science History, 33(1): 75–115. 99
Hurpin, Gérard. 1984. L’intendance de Rouen en 1698. C.T.H.S. 122
Hurt, John J. 2004. Louis XIV and the Parlements: The Assertion of Royal Authority.Manchester University Press. 8
Iyer, Lakshmi, and Petia B Topalova. 2014. “Poverty and Crime: Evidence fromRainfall and Trade Shocks in India.” Harvard Business School BGIE Unit WorkingPaper, (14-067). 168, 169, 174
Iyer, Sriya. 2016. “The New Economics of Religion.” Journal of Economic Literature,54(2): 395–441. 243, 245
Iyigun, Murat, Nathan Nunn, and Nancy Qian. 2017. “The Long-run Effectsof Agricultural Productivity on Conflict, 1400–1900.” National Bureau ofEconomic Research Working Papers 24066. 99
Janus, Thorsten, and Daniel Riera-Crichton. 2015. “Economic Shocks, Civil Warand Ethnicity.” Journal of Development Economics, 115: 32–44. 171
Jedwab, Remi, Noel D. Johnson, and Mark Koyama. 2017. “Negative Shocksand Mass Persecutions: Evidence from the Black Death.” The George Wash-ington University, Institute for International Economic Policy Working Papers2017-4. 99
Bibliography 331
Jelenkovic, Aline, Alfredo Ortega-Alonso, Richard J. Rose, Jaakko Kaprio,Esther Rebato, and Karri Silventoinen. 2011. “Genetic and environmentalinfluences on growth from late childhood to adulthood: a longitudinal studyof two Finnish twin cohorts.” American Journal of Human Biology, 23(6): 764–773.37
Jeorger, Muriel. 1977. “L’alphabétisation dans l’ancien diocèse de Rouen auxXVIIe et XVIIIe siècles.” Lire et écrire : l’alphabétisation des Français de Calvin àJules Ferry, ed. François Furet and Jacques Ozouf Vol. 2, 101–151. Les Éditionsde Minuit. 262, 263
Jessenne, Jean-Pierre. 2012. “The Social and Economic Crisis in France at the Endof the Ancien Régime.” A Companion to the French Revolution, ed. Peter McPhee,24–41. John Wiley & Sons. 21, 22, 23, 30, 31, 48
Jha, Chandan Kumar, Vijaya Gupta, Utpal Chattopadhyay, and BinilkumarAmarayil Sreeraman. 2018. “Migration as Adaptation Strategy to Cope withClimate Change: A Study of Farmers’ Migration in Rural India.” InternationalJournal of Climate Change Strategies and Management, 10(1): 121–141. 186
Jia, Ruixue. 2014. “Weather Shocks, Sweet Potatoes and Peasant Revolts inHistorical China.” The Economic Journal, 124(575): 92–118. 98, 99, 128, 169, 184
Johnson, Noel D. 2006. “Banking on the King: The Evolution of the RoyalRevenue Farms in Old Regime France.” Journal of Economic History, 66(4): 963–991. 15
Johnson, Noel D., and Mark Koyama. 2014. “Tax Farming and the Origins ofState Capacity in England and France.” Explorations in Economic History, 51: 1–20. 16
Johnson, Noel D., and Mark Koyama. 2017. “States and Economic Growth:Capacity and Constraints.” Explorations in Economic History, 64: 1–20. 105
Jones, Benjamin F., and Benjamin A. Olken. 2005. “Do Leaders Matter? NationalLeadership and Growth since World War II.” Quarterly Journal of Economics,120(3): 835–864. 97
Jones, Colin. 1989. The Charitable Imperative: Hospitals and Nursing in AncienRegime and Revolutionary France. Routledge. 231
Jones, Peter M. 2012. “Agriculture.” The Oxford Handbook of the Ancien Régime, ed.William Doyle, 236–251. Oxford University Press. 41, 44, 45, 101
Jordan, Luke, Sébastien Turban, and Laurence Wilse-Samson. 2013. “LearningWithin the State: a Research Agenda.” Columbia Universtiy. 98
Jourdain, Sylvie, Émeline Roucaute, Philippe Dandin, Jean-Pierre Javelle,Isabelle Donet, Sylvia Ménassère, and Nadine Cénac. 2015. “Le sauvetagede données climatologiques anciennes à Météo-France. De la conservation desdocuments à la mise à disposition des données.” La Météorologie, 89: 47–55. 120,140
332 Bibliography
Juhász, Réka. 2018. “Temporary Protection and Technology Adoption: Evidencefrom the Napoleonic Blockade.” American Economic Review, 108(11): 3339–76.298
Juillard, Etienne. 1953. La vie rurale dans la plaine de Basse-Alsace. Essai de géographiesociale. Editions F.-X. Le Roux. 82
Julia, Dominique, and Jacques Revel. 2009. “Lire et écrire. Une enquête, unmoment historiographique.” Les Cahiers du Centre de Recherches Historiques,43: 35–56. 262
Junot, Yves. 2009. Les bourgeois de Valenciennes : anatomie d’une élite dans la ville(1500–1630). Presses Universitaires du Septentrion. 194
Jurbert, Odile. 2015. “Les Sedanais de Mannheim (1652–1688) : De l’émigrationéconomique au refuge religieux.” Bulletin de la Société de l’Histoire du Protes-tantisme Français, 161(2): 173–212. 256
Kaplan, Steven L. 1982. “The Famine Plot Persuasion in Eighteenth-CenturyFrance.” Transactions of the American Philosophical Society, 72(3): 1–79. 114
Kaplan, Steven L. 1996. The Bakers of Paris and the Bread Question, 1700–1775. DukeUniversity Press. 127
Kaplan, Steven L. 2015. The Stakes of Regulation: Perspectives on Bread, Politics andPolitical Economy Forty Years Later. Anthem Press. 3
Kim, Hyojoung, and Steven Pfaff. 2012. “Structure and Dynamics of ReligiousInsurgency. Students and the Spread of the Reformation.” American SociologicalReview, 77(2): 188–215. 267
Kingdon, Robert M. 2007. Geneva and the Coming of the Wars of Religion in France(1559–1563). Librairie Droz. 252
Kirby, Torrance. 2009. “Emerging Publics of Religious Reform in the 1530s: TheAffair of the Placards and the Publication of Antoine de Marcourt’s Livredes marchans.” Making Publics in Early Modern Europe. People, Things, Formsof Knowledge, ed. Bronwen Wilson and Paul Yachnin, 37–52. Routledge. 252
Kirschleger, Frédéric R. 1852. Flore d’Alsace et des contrées limitrophes. Paris : VictorMasson. 81
Kiser, Edgar, and April Linton. 2001. “Determinants of the Growth of theState: War and Taxation in Early Modern France and England.” Social Forces,80(2): 411–448. 17
Kiser, Edgar, and April Linton. 2002. “The Hinges of History: State-making andRevolt in Early Modern France.” American sociological review, 67(6): 889–910.170, 172, 173
Komlos, John. 2003. “An Anthropometric History of Early-modern France.”European Review of Economic History, 7(2): 159–189. 39, 40, 49
Krautberger, Nicolas. 2013. “Malheurs des temps et malheureux du temps.Apprécier et dédommager les accidents saisonniers et les sinistres agricolesdans les Alpes (XVIIIe–XIXe siècles).” Histoire & Mesure, 28(1): 107–144. 14

Bibliography 333
Krieger, Moritz, Gerrit Lohmann, and Thomas Laepple. 2011. “Seasonal ClimateImpacts on the Grape Harvest Date in Burgundy (France).” Climate of the Past,7(2): 425–435. 121
Krumenacker, Yves. 2014. Protestantisme et éducation dans la France moderne.Chrétiens et Sociétés, Lyon : LARHRA RESEA. 250
Krumenacker, Yves, and Julien Léonard. 2012. “La nouveauté de la prédicationprotestante dans les villes francophones XVIe–XVIIe siècles.” Histoire urbaine,(2): 17–31. 259
Kubik, Zaneta, and Mathilde Maurel. 2016. “Weather Shocks, Agricultural Pro-duction and Migration: Evidence from Tanzania.” The Journal of DevelopmentStudies, 52(5): 665–680. 186
Kung, James Kai-Sing, and Chicheng Ma. 2014. “Can Cultural Norms ReduceConflicts? Confucianism and Peasant Rebellions in Qing China.” Journal ofDevelopment Economics, 111: 132–149. 99
Kwass, Michael. 2006. Privilege and the Politics of Taxation in Eighteenth-CenturyFrance: liberté,égalité, fiscalité. Cambridge University Press. 19
Labbé, Thomas, Christian Pfister, Stefan Brönnimann, Daniel Rousseau, JörgFranke, and Benjamin Bois. 2019. “The Longest Homogeneous Series of GrapeHarvest Dates, Beaune 1354–2018, and its Significance for the Understandingof Past and Present Climate Discussions.” Climate of the Past, 1–33. 121
Labrousse, Ernest. 1931. “Le prix du blé en France dans la seconde moitié duXVIIIe siècle d’après les états statistique du contrôle général.” Revue d’histoireéconomique et sociale, 19(2): 133–211. 104
Labrousse, Ernest. 1933. Esquisse du mouvement des prix et des revenus en France auXVIIIe siècle. Dalloz. 122, 206
Lachiver, Marcel. 1982. Vin, vigne et vignerons en région parisienne du XVIIe auXIXe siècle. Société historique et archéologique de Pontoise, du Val-d’Oise etdu Vexin. 26
Lachiver, Marcel. 1991. Les années de misère: La famine au temps du Grand Roi, 1680–1720. Fayard. 102, 103
Ladurie, Emmanuel Le Roy, Jacques Berchtold, and Jean-Paul Sermain. 2007.L’événement climatique et ses représentations, XVIIe–XIXe siècle : Histoire, littéra-ture, musique et peinture. Desjonquères. 100
Laffont, Jean-Luc. 1998. “Relecture critique de l’évolution de la populationtoulousaine sous l’Ancien Régime.” Histoire, Économie et Société, 17(3): 455–478.26, 34, 35
Lagadec, Yann. 2007. “Les élites rurales bretonnes du XVIe au XVIIIe siècle :des spécificités.” Lesélites rurales dans l’Europe médiévale et moderne, Actes desXXVIIe journées internationales d’histoire de l’abbaye de Flaran, 70–90. PressesUniversitaires du Mirail. 22
334 Bibliography
Laget, Mireille. 1971. “Petites écoles en Languedoc au XVIIIe siècle.” Annales.Histoire, Sciences Sociales, 26(6): 1398–1418. 270
Laly, Hervé. 2010. “De la conciliation à la répression : la politique criminelle duSénat de Savoie aux XVIe et XVIIe siècles.” Revue historique, 312(4): 909–932.189, 199
Lamarre, Christine. 1983. “La population de la Bourgogne à la fin du XVIIIe siècleà travers le dénombrement Amelot (1786).” Annales de Bourgogne, 55(2): 65–99.30, 36
Lamarre, Christine. 2014. “Population et société à Dijon dans les années 1780–1790.” Revue du Nord, 400(2): 401–414. 24, 27
Langer, Simon M., C. Friedrich H. Longin, and Tobias Würschum. 2014.“Flowering Time Control in European Winter Wheat.” Frontiers in Plant Science,5: 537. 102
Lansard, Monique. 1988. “Les débuts de la pomme de terre en Savoie-Propre etsur ses confins dauphinois.” 277–287, Congrès des sociétés savantes de Savoie.Sociétés Savantes de Savoie. 194
Larguier, Gilbert. 1999. Le drap et le grain en Languedoc : Narbonne et Narbonnais,1300–1789. Vol. 2, Presses Universitaires de Perpignan. 30, 32, 35
Larguier, Gilbert. 2010. Découvrir l’histoire du Roussillon XIIe–XXe siècle: Parcourshistorien. Presses Universitaires de Perpignan. 20, 46
Latouche, Robert. 1938. “La fruitière jurassienne au XVIIIe siècle.” Revue degéographie alpine, 26(4): 773–791. 44
Laufer, Berthold. 1938. The American Plant Migration. The Potato. Publications ofthe Field Museum of Natural History. Anthropological Series. 82
Lebrun, François. 1967. “Les soulèvements populaires à Angers aux XVIIe etXVIIIe siècles.” 119–40, Comité des Travaux Historiques et Scientifiques. Paris :Imprimerie Nationale. 2
Lebrun, François. 1971. “Les intendants de Tours et d’Orléans aux XVIIe et XVIIIe
siècles.” Annales de Bretagne et des pays de l’Ouest, 78(2): 287–305. 108, 121, 133
Lebrun, François. 1980. “Les crises démographiques en France aux XVIIe etXVIIIe siècles.” Annales. Économies, Sociétés, Civilisations, 35(2): 205–234. 31
Lecoutre, Matthieu. 2010. “Ivresse et ivrognerie dans la France moderne(XVIème–XVIIIème siècles).” PhD diss. Université de Bourgogne. 187, 190, 196,207
Lefebvre, Georges. 1972. Les paysans du Nord pendant la Révolution française.Armand Colin. 96, 113, 134, 135
Legay, Marie-Laure. 2001. Les états provinciaux dans la construction de l’état moderne,aux XVIIe et XVIIIe siècles. Librairie Droz. 8, 12, 20

Bibliography 335
Legay, Marie-Laure. 2013. “Le financement et la gestion des dépôts de mendicité,France, 1764–1790.” Assistenza e solidarietà in Europa, secc. XIII-XVIII, ed.Francesco Ammannati, 333–345. Firenze University Press. 112
Le Goff, Tim J. A., and Donald M. G. Sutherland. 2000. “What Can we Learnfrom Leases? A Preliminary View.” Histoire & Mesure, 15(3-4): 289–320. 42, 103
Le Lannou, Maurice. 1931. “Le Trégorrois, étude de géographie agricole.”40(223): 24–38. 63, 76
Lemarchand, Guy. 1965. “Le temporel et les revenus de l’abbaye de Fécamppendant le XVIIe et le XVIIIe siècles.” Annales de Normandie, 15(15): 525–549.113
Lemarchand, Guy. 1989. La fin du féodalisme dans le pays de Caux. Conjonctureéconomique et démographique et structure sociale dans une région de grande culture :de la crise du XVIIe siècle à la stabilisation de la Révolution (1640–1795). Éditionsdu CTHS. 114, 134, 264
Lemarchand, Guy. 1990. “Troubles populaires au XVIIIe siècle et consciencede classe : une préface à la Révolution française.” Annales historiques de laRévolution française, 279(1): 32–48. 100
Lemarchand, Guy. 2000. “Troubles et révoltes populaires en France au XVIe etXVIIe siècles. Essai de mise au point.” Annales de Normandie, 30: 131–158. 2
Lemarchand, Guy. 2008. L’économie en France de 1770 à 1830, De la crise de l’AncienRégime à la révolution industrielle. Armand Colin. 40, 48
Lemarchand, Yannick. 2010. “Accounting, the State and Democracy: a Long-termPerspective on the French Experiment, 1716–1967.” 17
Lemire, Devon. 2013. “A Historiographical Survey of Literacy in Britain between1780 and 1830.” Constellations, 4(1). 262
Lepetit, Bernard. 1988. “Carte des Généralités, Subdélégations et Élections enFrance à la veille de la Révolution de 1789 par Guy Arbellot, Jean-Pierre Gou-bert, Jacques Mallet, Yvette Palazot.” Annales. Économies, Sociétés, Civilisations,43(1): 120–121. 115
Leroy, G. 1868. “Recherches historiques sur l’Agriculture de Seine-et-Marne auxXVIIe et XVIIIe siècles.” Bulletin de la Société d’archéologie, sciences, lettres et artsdu département de Seine-et-Marne, 5: 361–453. 86
Le Roy Ladurie, Emmanuel. 1959. “Histoire et climat.” Annales. Histoire, SciencesSociales, 14(1): 3–34. 2
Le Roy Ladurie, Emmanuel. 1960. “Climat et récoltes : Aux XVIIe et XVIIIe
siècles.” Annales. Histoire, Sciences Sociales, 15(3): 434–465. 2, 100
Le Roy Ladurie, Emmanuel. 1966. Les paysans de Languedoc. S.E.V.P.E.N. 2, 3
Le Roy Ladurie, Emmanuel. 1967. Histoire du climat depuis l’an mil. Flammarion.2

336 Bibliography
Le Roy Ladurie, Emmanuel. 1974. “Rèvoltes et contestations rurales en Francede 1675 à 1788.” Annales. Économies, Sociétés, Civilisations, 29(1): 6–22. 2, 96, 100
Le Roy Ladurie, Emmanuel. 1996. The Ancien Regime: A History of France, 1610–1774. Wiley-Blackwell. 299
Le Roy Ladurie, Emmanuel. 2006. Histoire humaine et comparée du climat. Disetteset révolutions (1740–1860). Fayard. 96, 100, 102, 191
Le Roy Ladurie, Emmanuel. 2015. Les Paysans français d’Ancien Régime. Le Seuil.101
Le Roy Ladurie, Emmanuel, and Daniel Rousseau. 2009. “Impact du climat surla mortalité en France, de 1680 à l’époque actuelle.” La Météorologie, 64: 43–53.30, 31, 32
Le Roy Ladurie, Emmanuel, and Daniel Rousseau. 2011. “Histoire vendémi-ologique et climatologie historique.” Revue historique, 156(1): 53–60. 202
Letonnelier, Gaston. 1920. “L’émigration des Savoyards.” Revue de géographiealpine, 8(4): 541–584. 204, 209
Le Yaouanc, Moise. 1978. “Un agent du pouvoir central soucieux du sort deses administrés, le subdélégué de l’Intendance à Brest (1690–1790).” Annalesde Bretagne et des pays de l’Ouest, 85(4): 543–572. 14, 15
Leymarie, Michel. 1956. “Émigration et structure sociale en Haute-Auvergne à lafin du XVIIIe siècle.” Revue de la Haute-Auvergne, 35: 296–323. 44, 104
L’Héritier, Michel. 1920. “Tourny. Intendant de Bordeaux.” PhD diss. Universitéde Paris.
Lieutaud, Joseph. 1770. Précis de la matière médicale. Vol. 2, Paris : Chez P. Fr.Didot. 86
L’immigration bordelaise, 1737–1791 : essai sur la mobilité géographique etl’attraction urbaine dans le Sud-Ouest de la France au XVIIIe siècle. n.d..“L’immigration bordelaise, 1737–1791 : essai sur la mobilité géographique etl’attraction urbaine dans le Sud-Ouest de la France au XVIIIe siècle.” PhD diss.197
Lucassen, Jan. 1987. Migrant Labour in Europe, 1600–1900: The Drift to the NorthSea. Routledge. 196
Luterbacher, Jürg, Daniel Dietrich, Elena Xoplaki, Martin Grosjean, andHeinz Wanner. 2004. “European Seasonal and Annual Temperature Variability,Trends, and Extremes since 1500.” Science, 303(5663): 1499–1503. 119, 120, 201
Lynn, John. 2006. Giant ofthe Grand Siècle: The French Army, 1610–1715. CambridgeUniversity Press. 18
Magdelaine, Michelle. 2014. “Le refuge huguenot, exil et accueil.” Annales deBretagne et des Pays de l’Ouest, 121(3): 131–143. 246, 260
Maillard, Brigitte. 1998. Les campagnes de Touraine au XVIIIe siècle. Structuresagraires et économie rurale. Presses Universitaires de Rennes. 21, 195
Bibliography 337
Maillard, Brigitte. 2003. Vivre en Touraine au XVIIIe siècle. Presses Universitairesde Rennes. 70
Maistre, Chantal, and Gilbert Maistre. 1986. L’émigration marchande savoyarde auxXVIIe et XVIIIe siècles : l’exemple de Nancy-sur-Cluses. Mémoires et Documentspubliés par l’Académie Salésienne. 193
Maistre, Chantal, Gilbert Maistre, and Georges Heitz. 1992. Colporteurs etmarchands savoyards dans l’Europe des XVIIe et XVIIIe siècle. Mémoires et Doc-uments publiés par l’Académie Salésienne. 196, 197
Mäkinen, H., J. Kaseva, M. Trnka, J. Balek, K.C. Kersebaum, C. Nendel, A.Gobin, Jorgen Eivind Olesen, M. Bindi, R. Ferrise, et al. 2018. “Sensitivity ofEuropean wheat to extreme weather.” Field Crops Research, 222: 209–217. 102
Malanima, Paolo. 2013. “When did England Overtake Italy? Medieval and EarlyModern Divergence in Prices and Wages.” European Review of Economic History,17(1): 45–70. 194, 219
Manetsch, Scott M. 2012. Calvin’s Company of Pastors: Pastoral Care and theEmerging Reformed Church, 1536–1609. Oxford University Press. 251, 252
Maneuvrier-Hervieu, Paul. 2015a. “Les grains de la colère. Le Pays de Cauxdans la « guerre du blé » : approche sociologique et politique.” Master’s diss.Université de Caen–Normandie. 118
Maneuvrier-Hervieu, Paul. 2015b. “Les Normands dans la « Guerre du blé »auXVIIIe siècle.” 175–183. FSHAN. 118
Manning, Joseph G., Francis Ludlow, Alexander R. Stine, William R. Boos,Michael Sigl, and Jennifer R. Marlon. 2017. “Volcanic Suppression of NileSummer Flooding Triggers Revolt and Constrains Interstate Conflict in AncientEgypt.” Nature communications, 8(1): 900. 94
Mannix, Liam. 2018. “The Catholic Agricultural Enlightment in France.” PhDdiss. University of Chicago. 112, 114
Marchiori, Luca, Jean-François Maystadt, and Ingmar Schumacher. 2012. “TheImpact of Weather Anomalies on Migration in Sub-Saharan Africa.” Journal ofEnvironmental Economics and Management, 63(3): 355–374. 186
Marion, Henri. 1974. La dîme ecclésiastique en France au XVIIIe siècle et sa suppres-sion. Slatkine-Megariotis Reprints. 113, 114
Markoff, John. 1986. “Literacy and Revolt: Some Empirical Notes on 1789 inFrance.” American Journal of Sociology, 92(2): 323–349. 262
Markoff, John. 1990. “Peasants Protest: The Claims of Lord, Church, and Statein the Cahiers de Doleances of 1789.” Comparative studies in society and history,32(3): 413–454. 114
Markovitch, Tihomir J. 1976a. Histoire des Industries françaises : Les industrieslainières de Colbert à la Révolution. Librairie Droz. 48, 101
338 Bibliography
Markovitch, Tihomir J. 1976b. “La croissance industrielle sous l’Ancien Régime.”Annales. Économies, Sociétés, Civilisations, 31(3): 644–655. 48
Marston, Richard A., Jean-Paul Bravard, and Tim Green. 2003. “Impacts ofReforestation and Gravel Mining on the Malnant River, Haute-Savoie, FrenchAlps.” Geomorphology, 55(1): 65–74. 236
Martinetti, Brice. 2015. “La prépondérance socio-économique des négociantsprotestants à La Rochelle au XVIIIe siècle.” Annales de Bretagne et des Pays del’Ouest, 122(2): 85–98. 257
Masson, Rémi. 2013. Les Mousquetaires ou la violence d’État. Vendémiaire. 13
Mathieu, Jon. 2009. History of the Alps, 1500–1900: Environment, Development, andSociety. West Virginia University Press. 191, 195, 236
McCloy, Shelby Thomas. 1946. Government Assistance in Eighteenth-CenturyFrance. Duke University Press. 110
McCluskey, Phil. 2009. “French Military Occupations of Lorraine and Savoie,1670–1714.” PhD diss. University of St Andrews. 189
McCullough, Roy L. 2007. Coercion, Conversion and Counterinsurgency in LouisXIV’s France. Brill. 255, 263
McKim, Donald K. 2004. The Cambridge Companion to John Calvin. CambridgeUniversity Press. 251
McLeman, Robert, and Barry Smit. 2006. “Migration as an Adaptation to ClimateChange.” Climatic change, 76(1-2): 31–53. 186
McManners, John. 1960. French Ecclesiastical Society Under the Ancien Régime: AStudy of Angers in the Eighteenth Century. Manchester University Press. 113
McManners, John. 1998. Church and Society in Eighteenth-Century France: TheClerical Establishment and Its Social Ramification. Vol. 1, Oxford: Clarendon Press.112, 113
McMichael, Anthony J. 2012. “Insights from Past Millennia into Climatic Impactson Human Health and Survival.” Proceedings of the National Academy of Sciences,109(13): 4730–4737. 94
Mehlum, Halvor, Edward Miguel, and Ragnar Torvik. 2006. “Poverty and Crimein 19th Ccentury Germany.” Journal of Urban Economics, 59(3): 370–388. 99, 169,187, 203, 206, 238
Meier, Nicole, Christian Pfister, Heinz Wanner, and Jürg Luterbacher. 2007.“Grape Harvest Dates as a Proxy for Swiss April to August TemperatureReconstructions Back to AD 1480.” Geophysical Research Letters, 34(20). 184, 202
Meilheurat, M. 1868. “Recherche historique dans les études du notariat.” LeCabinet historique : revue, 14(1): 285–302. 58
Mellot, Jean-Dominique, and Élisabeth Queval. 2004. Répertoire d’imprimeurs-libraires (vers 1500–vers 1810). Bibliothèque nationale de France. 265

Bibliography 339
Mélo, Alain. 2015. ““Fruitières comtoises” (Franche-Comté, France). From Vil-lage Associations to an Agro-Industrial District: a Mountain Story?” Journal ofAlpine Research, 103(1). 44
Menault, Ernest. 1890. Histoire agricole du Berry. Paris : Hachette. 63
Mentzer, Raymond A. 1984. “Heresy Proceedings in Languedoc, 1500–1560.”Transactions of the American Philosophical Society, 74(5): 1–183. 253
Mentzer, Raymond A. 2014. Les registres des consistoires des Églises réformées deFrance, XVIe–XVIIe siècles : un inventaire. Librairie Droz. 259
Merlin, Colette. 1994. Ceux des villages : la société rurale dans la “Petite Montagne”jurassienne à la veille de la Révolution. Presses Universitaires de Franche-Comté.15, 30, 34, 72
Meuvret, Jean. 1946. “Les crises de subsistances et la démographie de la Franced’Ancien Régime.” Population, 1(4): 643–650. 32
Meyer, Jean. 1966. La noblesse bretonne au XVIIIe siècle. S.E.V.P.E.N. 21, 264
Meyzie, Philippe. 2007. La table du Sud-Ouest et l’émergence des cuisines régionales :1700–1850. Presses Universitaires de Rennes. 39, 64
Michel, Louis. 1979. “La dîme et les revenus du clergé d’Anjou à la fin de l’AncienRégime.” Annales de Bretagne et des pays de l’Ouest, 86(4): 565–605. 113, 114
Michon, Bernard. 2011. Le port de Nantes au XVIIIe siècle. Construction d’une aireportuaire. Presses Universitaires de Rennes. 35
Miguel, Edward, and Shanker Satyanath. 2011. “Re-examining EconomicShocks and Civil Conflict.” American Economic Journal: Applied Economics,3(4): 228–232. 103
Miller, Judith A. 1992. “Politics and Urban Provisioning Crises: Bakers, Police,and Parlements in France, 1750–1793.” The Journal of Modern History, 64(2): 227–262. 112
Miller, Judith A. 1999. Mastering the Market: The State and the Grain Trade inNorthern France, 1700–1860. Cambridge University Press. 109, 129
Miller, Stephen J. 2009. “The Economy of France in the Eighteenth and Nine-teenth Centuries: Market Opportunity and Labour Productivity in Langue-doc.” Rural History, 20(01): 1–30. 103
Minois, Georges. 1981. “Le climat, les dîmes et les prix trégorrois à travers leculte de Saint-Yves (XVIIe–XVIIIe siècles).” Annales de Bretagne et des pays del’Ouest, 88(1): 87–108. 264
Minvielle, Stéphane. 2010. La famille en France à l’époque moderne : XVIe–XVIIIe
siècles. Armand Colin. 31
Miroy-Destournelles, M. 1814. “Aperçu de l’état actuel de l’agriculture dans ledépartement de l’Aisne.” Annales de l’agriculture française, LVII: 5–70. 58
Moessinger, Marc-Daniel. 2014. “Do the Personal Characteristics of FinanceMinisters Affect Changes in Public Debt?” Public choice, 161(1–2): 183–207. 98
340 Bibliography
Molinier, Alain. 1968. Une paroisse du bas Languedoc : Sérignan, 1650–1792.Mémoires de la Société archéologique de Montpellier, tome XII, Montpellier : Im-primerie Déhan. 176
Molinier, Alain. 1976. Paroisses et communes de France. Dictionnaire d’histoireadministrative et démographique : Ardèche. Éditions du CNRS. 256
Molinier, Alain. 1980. “En Vivarais au XVIIIe siècle : une croissance démo-graphique sans révolution agricole.” Annales du Midi : revue archéologique,historique et philologique de la France méridionale, 92(148): 301–316. 60
Molinier, Alain. 1984. “Niveau d’instruction dans le Vivarais rural protestantXVIIe-début du XIXe siècle.” Bulletin de la Société de l’Histoire du ProtestantismeFrançais, 130(1): 47–68. 133, 270
Molinier, Alain. 1985. Stagnations et croissance : le Vivarais aux XVIIe–XVIIIe siècle.Éditions de l’École des Hautes Études en Sciences Sociales. 102, 175
Montenach, Anne. 2016. “Conflit, territoire et économie de la frontière : lacontrebande dans les Alpes dauphinoises au XVIIIe siècle.” Revue de géographiealpine, 104(1). 19
Monter, William E. 1999. Judging the French Reformation: Heresy Trials by Sixteenth-Century Parlements. Harvard University Press. 252, 253
Moody, Margaret Josephine. 2001. The Royal Poorhouse in the 18th Century Turin,Italy: the King and the Paupers. E. Mellen Press. 190
Moreau Kerlidu, M. 1762. “Sur la culture des Pommes de terre, & les avantagesque l’on peut retirer de cette plante.” Journal oeconomique ou mémoires, note etavis sur l’agriculture, les arts, le commerce, (Février): 57–61. 76
Moriceau, Jean-Marc. 1994. “Au rendez-vous de la “Révolution agricole” dansla France du XVIIIe siècle. À propos des régions de grande culture.” Annales.Histoire, Sciences Sociales, 49(1): 27–63. 45
Moriceau, Jean-Marc, and Gilles Postel-Vinay. 1992. Ferme, entreprise, famille :grande exploitation et changements agricoles, XVIe–XlXe siècles. Éditions de l’Écoledes Hautes Études en Sciences Sociales. 42
Morineau, Marcel. 1970. “La pomme de terre au XVIIIe siècle.” Annales.Économies, Sociétés, Civilisations, 25(6): 1767–1785. 77, 102
Morineau, Michel. 1971. Les faux-semblants d’un démarrage économique : agricultureet démographie en France au 18e siècle. Armand Colin. 41, 77, 264
Morineau, Michel. 1972. “Budgets populaires en France au XVIIIe siècle.” Revued’histoire économique et sociale, 50(2): 203–237. 38
Morineau, Michel. 1985. Pour une histoire économique vraie. Presses Universitairesde Lille. 264
Morrisson, Christian, and Wayne W. Snyder. 2000. “The Income Inequality ofFrance in Historical Perspective.” European Review of Economic History, 4(1): 59–83. 18, 22, 23, 28
Bibliography 341
Moulis, Philippe. 2013. “Frontières et contrebandes en France du nord 17e-18e
siècles.” Dix-huitième siècle, 45(1): 541–563. 19
Mours, Samuel. 1947. Le Vivarais et le Velay protestants. Notices paroissiales. Vol. 4,Valence : Imprimerie Réunies. 256
Mours, Samuel. 1958. Les Églises réformées en France : tableaux et cartes. Librairieprotestante. 244, 245, 253, 259
Mousnier, Roland. 1967. Fureurs paysannes. Les paysans dans les révoltes du XVIIe
siècle (France, Russie, Chine). Calmann-Lévy. 2
Mousnier, Roland. 1979. The Institutions of France under the Absolute Monarchy,1598–1789. Volume 1: Society and the State. University of Chicago Press. 299
Munno, Cristina. 2013. “La crise démographique de 1740 à Charleville.” Histoire& Mesure, 28(2): 53–88. 33
Murshed, Syed Mansoob, and Mohammad Zulfan Tadjoeddin. 2009. “Revis-iting the Greed and Grievance Explanations for Violent Internal Conflict.”Journal of International Development, 21(1): 87–111. 171
Musset, Benoît. 2011. “Les grandes exploitations viticoles de Champagne (1650–1830).” Histoire & Sociétés Rurales, 35(1): 79–98. 43, 103
Nassiet, Michel. 1993. Noblesse et pauvreté : la petite noblesse de Bretagne (XVe–XVIIIe siècles). Société historique et archéologique de Bretagne. 264
Nassiet, Michel. 1998. “La diffusion du blè noir en France à l’époque moderne.”Histoire & Sociétés Rurales, 9(1): 57–76. 36, 102
Nel, Philip, and Marjolein Righarts. 2008. “Natural Disasters and the Risk ofViolent Civil Conflict.” International Studies Quarterly, 52(1): 159–185. 174
Nicolas, Jean. 1973. “Éphémérides du refus : Pour une enquête sur les émotionspopulaires au XVIIIe siècle. Le cas de la Savoie.” Annales historiques de laRévolution française, 214(4): 593–607. 3, 234
Nicolas, Jean. 1974. “Éphémérides du refus : Pour une enquête sur les émotionspopulaires au XVIIIe siècle. Le cas de la Savoie.” Annales historiques de laRévolution française, 215(1): 111–153. 3, 234
Nicolas, Jean. 1978. La Savoie au XVIIIe siècle, Noblesse et bourgeoisie. Maloine. 21,29, 192, 193, 195, 200, 202, 206, 229, 231, 235, 237
Nicolas, Jean. 1979. “L’innovation alimentaire en Savoie au XVIIIe siècle.” 69–80,Congrès des sociétés savantes de Savoie. Sociétés Savantes de Savoie. 38, 39,184, 193, 194, 219
Nicolas, Jean. 2002. La rébellion française. Mouvements populaires et conscience sociale(1661–1789). Gallimard. 3, 11, 19, 20, 22, 29, 50, 96, 100, 105, 115, 116, 118, 124,130, 169, 175, 263
Nicolas, Sylvie. 1998. Les derniers maîtres des requêtes de l’Ancien Régime (1771–1789) : dictionnaire prosopographique. École Nationale des Chartes. 107
342 Bibliography
Nières, Claude. 2004. Les villes de Bretagne au XVIIIe siècle. Presses Universitairesde Rennes. 12, 24, 35, 49
Nunn, Nathan, and Nancy Qian. 2011. “The Potato’s Contribution to Populationand Urbanization: Evidence From a Historical Experiment.” Quarterly Journalof Economics, 126(2): 593–650. 36, 102
Oberschall, Anthony. 1978. “Theories of Social Conflict.” Annual Review ofSociology, 4: 291–315. 169, 170
O’Brien, Patrick K. 1996. “Path Dependency, or Why Britain Became an Industri-alized and Urbanized Economy Long Before France1.” Economic History Review,49(2): 213–249. 41, 45
Ó Gráda, Cormac, and Jean-Michel Chevet. 2002. “Famine and Market in AncienRégime France.” Journal of Economic History, 62(3): 706–733. 105
Onorato, Massimiliano G., Kenneth Scheve, and David Stasavage. 2014. “Tech-nology and the Era of the Mass Army.” Journal of Economic History, 74(2): 449–481. 16
Orland, Barbara. 2004. “Alpine Milk: Dairy Farming as a Pre-Modern Strategy ofLand Use.” Environment and History, 10(3): 327–364. 235
Oster, Emily. 2004. “Witchcraft, Weather and Economic Growth in RenaissanceEurope.” The Journal of Economic Perspectives, 18(1): 215–228. 99
Ouellet, Marie-Ève. 2014. “Et ferez justice : le métier d’intendant au Canada etdans les généralités de Bretagne et de Tours au 18e siècle (1700–1750).” PhDdiss. Université Rennes 2. 8, 121
Palluel-Guillard, André. 1963. “L’administration communale de Chambéry auXVIIIe siècle.” Mémoires et Documents de la Société Savoisienne d’Histoire etd’Archéologie, 73: 9–142. 232, 233
Papaioannou, Kostadis J. 2016. “Climate Shocks and Conflict: Evidence fromColonial Nigeria.” Political Geography, 50: 33–47. 99, 169
Parker, David. 2002. Class and State in Ancien Régime France: The Road toModernity? Routledge. 21, 22, 23, 38, 41, 101, 299
Parmentier, Antoine. 1781. Recherches sur les végétaux nourrissans, qui, dans lestemps de disette, peuvent remplacer les aliments ordinaires. Paris : ImprimerieRoyale. 89
Pauling, Andreas, Jürg Luterbacher, Carlo Casty, and Heinz Wanner. 2006. “FiveHundred Years of Gridded High-Resolution Precipitation Reconstructions overEurope and the Connection to Large-Scale Circulation.” Climate Dynamics,26(4): 387–405. 119, 120, 201
Pebesma, Edzer. 2018. “Simple Features for R: Standardized Support for SpatialVector Data.” The R Journal, 10(1): 439–446. xviii
Pei, Qing, and D Zhang. 2014. “Long-Term Relationship between ClimateChange and Nomadic Migration in Historical China.” Ecology and Society,19(2): 68–68. 99

Bibliography 343
Péronnet, Michel. 1987. “Les établissements des jésuites dans le Royaume deFrance à l’époque moderne.” Les Jésuites parmi les hommes, aux XVIe et XVIIe
siècles, ed. Guy Dermerson, Geneviève Dermerson, Bernard Dompnier andAnnie Regond. Clermont-Ferrand : Faculté des Lettres et Sciences Humainesde l’Université de Clermont-Ferrand. 271
Pérouse, Gabriel. 1930. “Histoire d’une population aux XVIIe et XVIIIe siècles.Étude statistique et démographique sur Saint-Sorlin d’Arves, commune deshautes vallées alpines.” Mémoires et Documents de la Société Savoisienne d’Histoireet d’Archéologie, 67: 15–65. 197
Peugniez, Bernard. 2001. Routier cistercien. Abbayes et Sites : France, Belgique,Luxembourg, Suisse. Éditions Gaud. 265
Pfaff, Steven. 2013. “The True Citizens of the City of God: The Cult of Saints,the Catholic Social Order, and the Urban Reformation in Germany.” Theory andSociety, 42(2): 189–218. 248
Pfister, Christian, and Rudolf Brázdil. 2006. “Social Vulnerability to Climate inthe ”Little Ice Age”: An Example from Central Europe in the Early 1770s.”Climate of the Past, 2(2): 115–129. 2, 191
Pfister, Christian, Rudolf Brázdil, and Rüdiger Glaser. 1999. “Climatic Vari-ability in Sixteenth-Century Europe and its Social Dimension: A Synthesis.”Climatic Change, 43(1): 5–53. 119
Phillips, Rod. 2014. Alcohol: A History. UNC Press Books. 187, 196
Pichard, Georges, and émeline Roucaute. 2014. “Sept siècles d’histoire hydrocli-matique du Rhône d’Orange à la mer (1300–2000): climat, crues, inondations.”Revue Méditerranée, (hors-série): 1–192. 102
Picot de Lapeyrouse, Philippe-Isidore. 1814. Topographie rurale du canton deMontastruc, département de la Haute-Garonne, et Tableau des améliorations qui ontété introduites dans son agriculture, depuis environ cinquante ans. Paris : ImprimerieMadame Huzard. 67
Pigeon, Jérôme. 2011. L’Intendant de Rouen : Juge du contentieux fiscal au XVIIIe
siècle. Presses Universitaires de Rouen et du Havre. 13, 18
Piguet, Émile. 1934. Les Dénombrements généraux de Réfugiés au Pays de Vaud et àBerne, à la fin du XVIIe siècle. Éditions La Concorde. 260
Piguet, Etienne. 2010. “Linking Climate Change, Environmental Degradation,and Migration: A Methodological Overview.” Wiley Interdisciplinary Reviews:Climate Change, 1(4): 517–524. 1
Pillorget, René. 1975. Les mouvements insurrectionnels de Provence entre 1596 et1715. Vol. 2, A. Pédone. 2, 100
Plack, Noelle. 2013. Common Land, Wine and the French Revolution: Rural Societyand Economy in Southern France, c. 1789–1820. Ashgate Publishing, Ltd. 235

344 Bibliography
Poiteau. 1931. “Pomme de terre, ou Parmentière (Solanum tuberosum, L.).Résumé de sa culture, de ses usages et de ses propriétés reconnues.” LeCultivateur : journal des progrès agricoles, 4(19): 426–435. 84
Poitrineau, Abel. 1962. “L’alimentation populaire en Auvergne au XVIIIe siècle.”Annales. Économies, Sociétés, Civilisations, 17(2): 323–331. 80
Ponsot, Pierre. 2005. “Les débuts du maïs en Bresse sous Henri IV.” Histoire &Sociétés Rurales, 23(1): 117–136. 101
Porchnev, Boris Fedorovich. 1963. Les soulèvements populaires en France de 1623 à1648. S.E.V.P.E.N. 2, 100
Potter, Mark, and Jean-Laurent Rosenthal. 1997. “Politics and Public Finance inFrance: The Estates of Burgundy, 1660–1790.” Journal of Interdisciplinary History,27(4): 577–612. 8
Poussou, Jean-Pierre. 1977. “Recherche sur l’alphabétisation de l’Aquitaine auXVIIIe siècle.” Lire et écrire : l’alphabétisation des Français de Calvin à Jules Ferry,ed. François Furet and Jacques Ozouf Vol. 2, 294–352. Les Éditions de Minuit.262
Poussou, Jean-Pierre. 1980. “Les crises démographiques en milieu urbain :l’exemple de Bordeaux (fin XVIIe-fin XVIIIe siècle).” Annales. Économies, So-ciétés, Civilisations, 35(2): 235–252. 33
Poussou, Jean-Pierre. 1993. “La « méthode Maggiolo »et la mesure del’alphabétisation du Sud-Ouest de la France à la fin du XVIIIe siècle.” Annalesdu Midi, 105(202): 209–223. 262, 263
Poussou, Jean-Pierre. 1999. La terre et les paysans en France et en Grande-Bretagneaux XVIIe et XVIIIe siècles. Editions Sedes. 42, 43
Poussou, Jean-Pierre, and Jean-Pierre Loupès. 1986. “Les protestants bordelaisdes années 1680 et la Révocation.” 149–172, Société de l’Histoire du Protes-tantisme Français. 257
Quéniart, Jean. 1978. Culture et société urbaines dans la France de l’Ouest au XVIIIe
siècles. Klincksieck. 262
Raleigh, Clionadh, Andrew Linke, Håvard Hegre, and Joakim Karlsen. 2010.“Introducing acled: An armed conflict location and event dataset special datafeature.” Journal of peace Research, 47(5): 651–660. 168
Ranson, Matthew. 2014. “Crime, Weather, and Climate Change.” Journal ofenvironmental economics and management, 67(3): 274–302. 169
Ratha, Dilip. 2005. “Workers’ Remittances: An Important and Stable Source ofExternal Development Finance.” Remittances: Development Impact and FutureProspects, 19–51. The World Bank. 186
Raulin, Victor Félix. 1864. “Observations pluviométriques faites dans le sud-ouest de la France (Aquitaine et Pyré né es) de 1714 à 1860.” Actes de l’Académiedes sciences, belles-lettres et arts de Bordeaux, 177–492. 141
Bibliography 345
Raulin, Victor Félix. 1874. Observations pluviométriques faites dans la France mérid-ionale (Sud-Ouest, Centre et Sud-Est) de 1704 à 1870. Bordeaux : Veuve Chaumas.141
Reuveny, Rafael. 2007. “Climate Change-induced Migration and Violent Con-flict.” Political Geography, 26(6): 656–673. 1
Richards, Toni. 1983. “Weather, Nutrition, and the Economy: Short-run Fluc-tuations in Births, Deaths, and Marriages, France 1740–1909.” Demography,20(2): 197–212. 31
Ricommard, Jean. 1934. La lieutenance générale de police à Troyes au XVIIIe siècle.Hachette. 178
Rives, Jean. 1976. Dîme et société dans l’archevêché d’Auch au XVIIIe siècle. Paris :Bibliothèque Nationale. 113, 114
Robinet, Jean-Baptiste-René. 1777. Supplément à l’Encyclopédie ou Dictionnaireraisonné des sciences, des arts et des métiers. Tome IV, N-Z. Amsterdam : Rey. 68
Rochlitz, Michael, Vera Kulpina, Thomas Remington, and Andrei Yakovlev.2015. “Performance Incentives and Economic Growth: Regional Officials inRussia and China.” Eurasian Geography and Economics, 56(4): 421–445. 97
Rolland, Christian. 2003. “Spatial and Seasonal Variations of Air TemperatureLapse Rates in Alpine Regions.” Journal of Climate, 16(7): 1032–1046. 191
Root, Hilton L. 1992. Peasants and King in Burgundy: Agrarian Foundations of FrenchAbsolutism. University of California Press. 12, 110
Rosenthal, Jean-Laurent. 1990. “The Development of Irrigation in Provence,1700–1860: The French Revolution and Economic Growth.” Journal of EconomicHistory, 50(3): 615–638. 42
Rossi, Martín A. 2017. “Self-Perpetuation of Political Power.” The EconomicJournal, 127(605): F455–F473. 98
Roucaute, Émeline, George Pichard, Éric Faure, and Manuela Royer-Carenzi.2014. “Analysis of the Causes of Spawning of Large-Scale, Severe MalarialEpidemics and Their Rapid Total Extinction in Western Provence, Historicallya Highly Endemic Region of France (1745–1850).” Malaria journal, 13(1): 72. 32,140, 141
Rousseau, Raymond. 1960. La population de la Savoie jusqu’en 1861. S.E.V.P.E.N.200
Rousseaux, Xavier. 2006. “Historiographie du crime et de la justice criminelledans l’espace français (1990–2005). Partie I : du Moyen-Âge à la fin de l’AncienRégime.” Crime, Histoire & Sociétés / Crime, History & Societies, 10(1): 123–158. 3
Roze, E. 1898. Histoire de la pomme de terre : traitée aux points de vue historique,biologique, pathologique, cultural et utilitaire. J. Rothschild. 61, 71, 73, 76, 78, 88
Rubin, Jared. 2014. “Printing and Protestants: An Empirical Test of the Role ofPrinting in the Reformation.” Review of Economics and Statistics, 96(2): 270–286.245, 248, 267, 268
346 Bibliography
Rubin, Jared. 2017. Rulers, Religion, and Riches: Why the West Got Rich and theMiddle East Did Not. Cambridge University Press. 249
Rudé, George. 1964. The Crowd in History: A Study of Popular Disturbances in Franceand England, 1730–1848. John Wiley & Sons, New York. 96
Ruff, Julius R. 1984. Crime, Justice and Public Order in Old Regime France: TheSénéchaussées of Libourne and Bazas, 1696–1789. Taylor & Francis. 9, 199, 200, 231
Ruff, Julius R. 2001. Violence in Early Modern Europe, 1500–1800. CambridgeUniversity Press. 12, 22, 29
Ruggiero, Alain. 2002. La population du comté de Nice de 1693 à 1939. Serre Éditeur.35
Rule, John C., and Ben S. Trotter. 2014. A World of Paper: Louis XIV, Colbert deTorcy, and the Rise of the Information State. McGill-Queen’s University Press. 8
Sageret. 1809. Mémoire sur l’agriculture d’une partie du département du Loiret et surquelques tentatives d’amélioration. Paris : Imprimerie Madame Huzard. 73
Saint-Jacob, Pierre de. 1935. “L’assolement en Bourgogne au XVIIe siècle (noteset documents).” Les Études rhodaniennes, 11(2): 207–219. 46
Saint-Jacob, Pierre de. 1960. Les paysans de la Bourgogne du nord au dernier siècle del’Ancien Régime. Publications de l’Université de Dijon. 12
Salehyan, Idean, Cullen S. Hendrix, Jesse Hamner, Christina Case, ChristopherLinebarger, Emily Stull, and Jennifer Williams. 2012. “Social Conflict inAfrica: A New Database.” International Interactions, 38(4): 503–511. 168
Salmon, J. H. M. 1967. “Venality of Office and Popular Sedition in Seventeenth-Century France. A Review of a Controversy.” Past & Present, (37): 21–43. 2
Salveton, Henri. 1927. Histoire de Nonette. Clermont Ferrand. 80
Sambanis, Nicholas. 2004. “What Is Civil War?: Conceptual and Empirical Com-plexities of an Operational Definition.” Journal of Conflict Resolution, 48(6): 814–858. 167
Sarkees, Meredith Reid, and Frank Whelon Wayman. 2010. Resort to War: A DataGuide to Inter-state, Extra-state, Intra-state, and Non-state Wars, 1816-2007. Cq Pr.168
Sarmant, Thierry. 2012. Louis XIV. Homme et roi. Tallandier. 8
Saugrain, Claude-Marin. 1726. Dictionnaire universel de la France ancienne etmoderne et de la Nouvelle France. Vol. 3, Paris : Saugrain. 116
Schelle, Gustave. 1913a. Oeuvres de Turgot et documents le concernant. Tome 2. Paris :Imprimerie Félix Alcan. 90
Schelle, Gustave. 1913b. Oeuvres de Turgot et documents le concernant. Tome 3. Paris :Imprimerie Félix Alcan. 90
Schmocker-Fackel, Petra, and Felix Naef. 2010. “Changes in Flood Frequenciesin Switzerland since 1500.” Hydrology and Earth System Sciences, 14(8): 1581–1594. 191
Bibliography 347
Schofield, Roger S. 1968. “The Measurement of Literacy in Pre-Industrial Eng-land.” Literacy in Traditional Societies, ed. Jack S. Goody, 311–325. CambridgeUniversity Press. 262
Scoville, Warren Candler. 1953. “The Huguenots in the French Economy, 1650–1750.” Quarterly Journal of Economics, 67(3): 423–444. 3, 247
Scoville, Warren Candler. 1960. The Persecution of Huguenots and French EconomicDevelopment, 1680–1720. University of California Press. 3, 247, 255, 256, 257,263, 274, 275
Scuiller, Sklaerenn. 2008. “Propriété et usages collectifs. L’exemple des maraisde Redon au XVIIIe siècle.” Histoire & Sociétés Rurales, 29(1): 41–71. 235
Sée, Henri. 1906. Les classes rurales en Bretagne, du XVIe siècle à la Révolution. Paris :V. Giard et E. Bière. 66, 69
Sen, Amartya. 1981. Poverty and Famines: An Essay on Entitlement and Deprivation.Oxford University Press. 104
Séverin, Rachel. 1903. L’agriculture en Bazadais à la veille de la Révolution. Bazas :Imprimerie Constant. 68
Sharp, Paul R., and Jacob L. Weisdorf. 2012. “French Revolution or IndustrialRevolution? A Note on the Contrasting Experiences of England and France upto 1800.” Cliometrica, 6(1): 79–88. 47
Siddle, David J. 1997. “Migration as a Strategy of Accumulation: Social andEconomic Change in Eighteenth-Century Savoy.” Economic History Review,50(1): 1–20. 188, 196, 209, 229
Silventoinen, Karri. 2003. “Determinants of Variation in Adult Body Height.”Journal of biosocial science, 35(2): 263–285. 37
Smedley-Weill, Anette. 1995. Les intendants de Louis XIV. Fayard. 11, 12, 108
Smets, Josef. 2001. “À la table d’un seigneur languedocien en 1766 : les comptesdu cuisinier.” Revue d’histoire moderne et contemporaine, 48(4): 32–49. 39, 69
Soulingeas, Yves. 1971. “Quatre paroisses en Bas-Limousin, Allasac, Donzenac,Sadroc, Voutezac : Étude économique et sociale.” Master’s diss. École Na-tionale des Chartres. 264
Spolaore, Enrico, and Romain Wacziarg. 2013. “How Deep Are the Roots ofEconomic Development?” Journal of Economic Literature, 51(2): 325–369. 243
Squicciarini, Mara P., and Nico Voigtländer. 2015. “Human Capital and Indus-trialization: Evidence from the Age of Enlightenment.” Quarterly Journal ofEconomics, 130(4): 1825–1883. 135, 249, 298
Storrs, Christopher. 2007. “Provincial Governors and the Absolute State: Pied-mont 1713–48.” European History Quarterly, 37(1): 35–60. 190
Storrs, Christopher. 2013. “The Savoyard Fiscal-Military State in the Long Eigh-teenth Century.” The Fiscal-Military State in Eighteenth-Century Europe: Essays inHonour of PGM Dickson, 1339–1368. Ashgate Publishing, Ltd. 189
348 Bibliography
sur le concours, Rapport. 1809. “Rapport sur le concours pour un Exposé his-torique des améliorations introduites, depuis cinquantes ans, dans les diversesbranches de l’économie rurale de la France.” Mémoires d’agriculture, d’économierurale et domestique, 12: 46–101. 61, 64, 82, 84
Swann, Julian. 2001. “The State and Political Culture.” Old regime France 1648–1788. The Short Oxford History of France, 1339–1368. Oxford University Press. 8,12, 13, 106
Swann, Julian. 2003. Provincial Power and Absolute Monarchy: The Estates Generalof Burgundy, 1661–1790. Cambridge University Press. 12
Symcox, Geoffrey. 1983. Victor Amadeus II: Absolutism in the Savoyard State, 1675–1730. University of California Press. 189
Tackett, Timothy. 1977. Priest and Parish in Eighteenth-Century France. PrincetonUniversity Press. 21
Tackett, Timothy. 1979. “L’histoire sociale du clergé diocésain dans la France duXVIIIe siècle.” Revue d’histoire moderne et contemporaine, 27(2): 198–234. 21
Taillebois, Édouard. 1858. “La société d’agriculture du Limousin de 1763 à 1791.”Bulletin de la Société scientifique historique et archéologique de la Corrèze, 1(Octobre-Novembre): 521–591. 62
Taylor, Larissa. 1992. Soldiers of Christ: Preaching in Late Medieval and ReformationFrance. University of Toronto Press. 267
Teisseyre-Sallmann, Line. 1995. L’industrie de la soie en Bas-Languedoc : XVIIe–XVIIIe siècles. école Nationale des Chartes. 46
Tennekes, Martijn. 2018. “tmap: Thematic Maps in R.” Journal of StatisticalSoftware, 84(6): 1–39. xviii
Terrier, Didier, and Robert Muchembled. 1998. Histoire économique de la Franced’Ancien Régime. Hachette. 44, 45, 46
Thayer, Anne T. 2017. Penitence, Preaching and the Coming of the Reformation.Routledge. 267
Thuillier, Guy. 1965. “Au XIXe siècle : l’alimentation en Nivernais.” Annales.Économies, Sociétés, Civilisations, 20(6): 1163–1184. 42
Tilly, Charles. 1990. Coercion, Capital, and European States, AD 990–1992. BasilBlackwell. 16, 172
Tilly, Louise A. 1972. “La révolte frumentaire, forme de conflit politique enFrance.” Annales. Histoire, Sciences Sociales, 27(3): 731–757. 100, 105
Tissot, E. 1887. “Résumé des observations météorologiques d’Annecy et de laHaute-Savoie faites en 1885 et pendant la période décennale antérieure.” Revuesavoisienne, 28: 3–10. 202
Tochon, Pierre. 1871. Histoire de l’agriculture en Savoie. Imprimerie de F. Puthod.195
Bibliography 349
Tracq, Francis. 2000. La mémoire du vieux village : la vie quotidienne à Bessans audébut du XXe siècle. La Fontaine de Siloë. 236
Traxler, Christian, and Carsten Burhop. 2010. “Poverty and Crime in 19thCentury Germany: A Reassessment.” MPI Collective Goods Preprint, (2010/35).187
Treasure, Geoffrey. 2013. The Huguenots. Yale University Press. 244, 251, 253, 254,257, 269, 276, 299
Tulchin, Allan. 2010. That Men Would Praise the Lord: The Triumph of Protestantismin Nimes, 1530–1570. Oxford University Press. 253
Van Bavel, Bas, and Auke Rijpma. 2016. “How Important were FormalizedCharity and Social Spending before the Rise of the Welfare State? A Long-runAnalysis of Selected Western European Cases, 1400–1850.” Economic HistoryReview, 69(1): 159–187. 99, 112
Van Deursen, Arie Theodorus. 1960. Professions et métiers interdits : un aspect del’histoire de la révocation de l’Édit de Nantes. Groningue: J. B. Wolters. 257
Vanlandtschoote, éric. 2008. “L’élevage ovin entre pratiques collectives et en-treprises individuelles dans le Hainaut au XVIIIe siècle.” Revue du Nord, 375-376(2): 371–389. 43
Van Zanden, Jan L. 1999. “Wages and the Standard of Living in Europe, 1500–1800.” European Review of Economic History, 3(2): 175–197. 29, 37
Vardi, Liana. 1993. The Land and the Loom: Peasants and Profit in Northern France,1680–1800. Duke University Press. 48
Vassort, Jean. 1995. Une société provinciale face à son devenir. Le Vendômois aux XVIIIe
et XIXe siècles. Publications de la Sorbonne. 27, 46, 195, 263
Velde, François R., and David R. Weir. 1992. “The Financial Market andGovernment Debt Policy in France, 1746–1793.” Journal of Economic History,52(1): 1–39. 15
Verdo, Rémy. 2012. “Les attributions des intendants sardes en Savoie au XVIIIe
siècle.” Revue historique de droit français et étranger, 90(4): 517–548. 229
Vermale, François. 1911. Les classes rurales en Savoie au XVIIIe siècle. E. Leroux.193, 219
Verneilh-Puiraseau, Joseph. 1807. Statistique générale de la France : département deMont-Blanc. Paris: Imprimerie Testu. 185
Viallet, Hélène. 1993. Les alpages et la vie d’une communauté montagnarde : Beaufortdu Moyen-Âge au XVIIIe siècle. Mémoires et Documents publiés par l’AcadémieSalésienne. 191, 194, 196, 202, 235
Viazzo, Pier Paolo. 1989. Upland Communities. Environment, Population and SocialStructure in the Alps since the Sixteenth Century. Cambridge University Press. 196
350 Bibliography
Vigneron, Sylvain. 2007. La pierre et la terre : le marché foncier et immobilier dansles dynamiques sociales du Nord de la France aux XVIIe et XVIIIe siècles. PressesUniversitaires Septentrion. 23, 24, 26, 27, 35
Villard, Madeleine. 1978. “Le pouvoir devant la foi : La révocation de l’Édit deNantes à Marseille et en Provence d’après la correspondance de l’intendant.”Cinq siècles de Protestantisme à Marseille et en Provence. Acte du colloque tenu àMarseille, Mai 1976, 61–72. Église réformée de Marseille et Fédération historiquede Provence. 275
Vion, Robert. 1956. “Un vignoble savoyard. La Chautagne.” Revue de géographiealpine, 44(4): 717–739. 195
Viton de Saint-Allais, Nicolas. 1813. La France législative, ministérielle, judiciaireet administrative sous les quatre dynastie. Vol. 2, Paris : Imprimerie de P. Didotl’aîné. 121
Vivier, Nadine. 1990. “Les biens communaux du Briançonnais aux XVIIIe et XIXe
siècles.” Études rurales, (117): 139–158. 235
Vivier, Nadine, and Alain Corbin. 1998. Propriété collective et identité communale.Les biens communaux en France 1750–1914. Publications de la Sorbonne. 235
Vouette, Isabelle. 2007. “Millet, panis, sarrasin, maïs et sorgho: Les menus grainsdans les systèmes agricoles anciens (France, milieu du XVIe siècle-milieu duXIXe siècle).” PhD diss. Université Paris 7. 36, 38, 102
Vovelle, Michel. 1975. “Y at-il eu une révolution culturelle au XVIIIe siècle?À propos de l’éducation populaire en Provence.” Revue d’histoire moderne etcontemporaine, 22(1): 89–141. 263
Vovelle, Michel. 1986. “Carte des Généralités, Subdélégations et Élections enFrance à la veille de la Révolution de 1789 par Guy Arbellot, Jean-PierreGoubert, Jacques Mallet, Yvette Palazot.” Annales historiques de la Révolutionfrançaise, 264(1): 232–233. 115
Waldinger, Maria. 2014. “Drought and the French Revolution: The Effects ofAdverse Weather Conditions on Peasant Revolts in 1789.” 127, 176
Walsby, Malcom. 2017. “Promoting the Counter-Reformation in ProvincialFrance: Printing and Bookselling in Sixteenth-Century Verdun.” Books in Mo-tion in Early Modern Europe. Beyond Production, Circulation and Consumption, ed.Daniel Bellingradt, Paul Nelles and Jeroen Salman, 15–38. Palgrave Macmillan.268
Weir, David R. 1997. “Economic Welfare and Physical Well-being in France,1750–1990.” In Health and welfare during industrialization. 161–200. Universityof Chicago Press. 37, 39
White, Eugene N. 2004. “From Privatized to Government-Administered TaxCollection: Tax Farming in Eighteenth-Century France.” Economic HistoryReview, 57(4): 636–663. 17
Bibliography 351
White, James W. 1995. Ikki: Social Conflict and Political Protest in Early ModernJapan. Cornell University Press. 99
Wickham, Hadley. 2017. “tidyverse: Easily Install and Load ’Tidyverse’ Pack-ages.” RStudio, R package version 1.2.1. xviii
Wilcox, Peter, and Bernard Roussel. 1993. “L’envoi de pasteurs aux Églises deFrance : Trois listes établies par Colladon (1561–1562).” Bulletin de la Société del’Histoire du Protestantisme Français, 139(3): 347–374. 267
Wurpts, Bernd, Katie E. Corcoran, and Steven Pfaff. 2018. “The Diffusionof Protestantism in Northern Europe: Historical Embeddedness and Com-plex Contagions in the Adoption of the Reformation.” Social Science History,42(2): 213–244. 247
Yang, Dean, and HwaJung Choi. 2007. “Are Remittances Insurance? Evidencefrom Rainfall Shocks in the Philippines.” The World Bank Economic Review,21(2): 219–248. 186
Yao, Yang, and Muyang Zhang. 2015. “Subnational Leaders and EconomicGrowth: Evidence from Chinese Cities.” Journal of Economic Growth, 20(4): 405–436. 97
Yardeni, Myriam. 1993. “Naissance et essor d’un mythe : la Révocation de l’Éditde Nantes et le déclin économique de la France.” Bulletin de la Société de l’Histoiredu Protestantisme Français, 139(1): 79–96. 247, 257
Young, Arthur. 1906. Arthur Young’s Travels in France During the Years 1787, 1788,1789. London: George Bell and Sons. 113
Zucca Micheletto, Beatrice. 2006. “In seguito alla deliberazione di trattenersi incittà : scelta individuale e percorsi migratori nella Torino di Ancien Régime.”PhD diss. Università di Torino. 198