environmental vulnerability and social unrest: a
TRANSCRIPT
University of VermontScholarWorks @ UVM
Environmental Studies Electronic Thesis Collection Undergraduate Theses
2018
Environmental Vulnerability and Social Unrest: AComparative IndexMichela H. Grunebaum
Follow this and additional works at: https://scholarworks.uvm.edu/envstheses
This Undergraduate Thesis is brought to you for free and open access by the Undergraduate Theses at ScholarWorks @ UVM. It has been accepted forinclusion in Environmental Studies Electronic Thesis Collection by an authorized administrator of ScholarWorks @ UVM. For more information,please contact [email protected].
Recommended CitationGrunebaum, Michela H., "Environmental Vulnerability and Social Unrest: A Comparative Index" (2018). Environmental StudiesElectronic Thesis Collection. 50.https://scholarworks.uvm.edu/envstheses/50

Running head: ENVIRONMENTAL VULNERABILITY AND SOCIAL UNREST 1
Environmental Vulnerability for Future Social Unrest: A Comparative Index
Michela H. T. Grunebaum
A senior thesis submitted in partial fulfillment of the requirements of the
requirements for the degree of Bachelor of Science
Environmental Program
University of Vermont
2018
Advisors: Robert V. Bartlett, Gund Professor of Liberal Arts, University of Vermont
Edward McMahon, adjunct associate Professor of Community Development and Applied Economics, University of Vermont

ENVIRONMENTAL VULNERABILITY AND SOCIAL UNREST 2
Abstract
A body of literature has identified links between existing social and environmental conditions
and the likelihood of civil unrest due to future climate-driven events. Recent episodes of social
unrest including, but not limited to the Arab Spring, the Syrian Civil War, increased terrorism
and the Darfur conflict can be linked to previously existing environmental vulnerabilities. The
literature identifies individual factors associated with climate-driven vulnerability for future
social unrest, but no comprehensive index exists. An index of environmental vulnerability to
climate-driven impacts as a possible predictor for hot-spots for future social unrest was created
using previously identified variables via a review and analysis of prior journal articles and
relevant international indices. A vulnerability assessment framework to climate-driven social
unrest was developed to identify countries that appear highly vulnerable to such outbreaks based
on chosen factors. Selected variables are complimented with the inclusion of national-level
indicators that are selected from global indices for which data has previously been compiled.
This index is a comparative tool to identify patters and opportunities for mitigation on the
national level.

ENVIRONMENTAL VULNERABILITY AND SOCIAL UNREST 3
Acknowledgements
I am grateful to all of those with whom I have had the pleasure of speaking through the
outset of this thesis.
Dr. Brendan Fisher, associate professor of Environmental Studies at the University of
Vermont has offered invaluable advice before and throughout the writing process. Without his
support, this work would not be possible.
Edward McMahon, adjunct associate Professor of Community Development and Applied
Economics at the University of Vermont has offered helpful advice and direction in pursuit of
my thesis direction and topic.
Robert V. Bartlett, Gund Professor of Liberal Arts at the University of Vermont has
provided me with extensive professional guidance and pointed me towards valuable resources.
ENVIRONMENTAL VULNERABILITY AND SOCIAL UNREST 4
Table of Contents
Abstract………………………………………………………………………….………….……..2
Acknowledgements………………………………………………………………….…………….3
Introduction…………………………………………………………………………….………….5
Literature Review……………………………………………………………….…………………7
The Arab Spring……………………………………………………….…………………..7
The Conflict in Syria……………………………………………….……………………...8
Terrorism…………………………………………………………………………………10
Darfur…………………………………………………………………...………………..11
The Vulnerability of the State ……………………………………....……………………13
Threats to Food Security…………………………………………………...…………….15
Water Security………………………………………………………………………...…19
Methods……………………………………………………………………................…………..21
Country Selection………………………………………………………………………...21
Variable Selection………………………………………………………………………..25
Sensitivity…………………………………………………………………………...…...26
Adaptive Capacity………………………………………………………………………..34
Results………………………………………………………………………………….………...38
Discussion……………………………………………………………………....………….…….40
References………………………………………………………………..……..………………..49
Appendices………………………………………………………………..……………………...60
Appendix A………………………………………………………..……………………..60

ENVIRONMENTAL VULNERABILITY AND SOCIAL UNREST 5
Environmental Vulnerability for Future Social Unrest: A Comparative Index
Since the 1980s, the number of recorded natural disasters related to weather and climate events
has roughly doubled (Munich, 2012). Direct damages to monetized assets, that is the reported losses
from global weather and climate-related events have dramatically increased over recent decades
(Intergovernmental Panel on Climate Change [IPCC], 2010). Monetary losses from these impacts have
been significant, but losses to human life, cultural heritage and ecosystem services are much more
difficult to calculate.
Studies that have attempted to catalogue these losses – and predict future losses – have
yet to fully account for the vulnerability of current conditions in civil society to climate-related
events due to lack of data. There are apparent links between the existing environmental
conditions and civil structures when a climate event occurs and the severity of harm to a society
and likelihood of strife. It appears that such elements as food security, water security, drought,
settlement patterns, urbanization, and changes in socioeconomic conditions have influenced the
observed trends in the exposure and magnitude of harm from climate events to civil society, but
as of yet, there is no index compiled of such risk factors (IPCC, 2012). Vulnerability to these
increasing events is, of course, highly dependent on local and regional factors (United Nations
International Strategy for Disaster Reduction, 2009). Projections for the next few decades
indicate the likelihood of greater changes in the frequency, intensity, duration and spatial extent
of climate related events and thus the importance of understanding the vulnerability of civil
society, risk factors and costs associated with them is rising (IPCC, 2012).
In climate literature, the likelihood of harm as a result of indirect or direct exposure to a
climate event is often called susceptibility (Kasperson & Kasperson, 2001; Adger, 2006; Eakin
& Luers, 2006; Gailard, 2010). Vulnerability is defined as “the state of susceptibility to harm
ENVIRONMENTAL VULNERABILITY AND SOCIAL UNREST 6
from exposure to stresses associated with environmental and social change and from the absence
of capacity to adapt” (Adger, 2006 p. 268). Susceptibility is one component of vulnerability that
becomes most evident when an exposed population experiences a climate related event. It is
distinguishable from actions taken to alleviate harm following exposure to an event. There is a
large body of literature that explores the characteristics that influence the susceptibility of a
population to both direct and indirect harm from climatic risk and hazards (Liverman, 1990;
Kasperson & Kasperson, 2001; Adger, 2006; Eakin & Luers, 2006; Leichenko & O’Brien, 2008;
Adger et al., 2009; Keskitalo, 2009; Gaillard, 2010). Unpacking which elements of susceptibility
are most linked to civil strife from climate-driven weather events will be in part the topic of this
thesis.
Factors that are commonly considered significant in influencing susceptibility include
economic, demographic, social, cultural and environmental conditions; the form or quality of the
infrastructure and the built environment; the presence of social capital; the effectiveness of
institutions and governance; and the presence or recent history of violent conflict (IPCC, 2007,
2012). These factors are complex and often interrelated, making it difficult to isolate causality
due to a single factor, in addition to the fact that such measures are dynamic and are influenced
by other non-climatic processes such as globalization and urbanization (O’Brien & Leichenko,
2007; Leichenko & O’Brien, 2008).
Many of the variables that impact prior vulnerability to social unrest caused by climatic
events are overlapping and interrelated. It is difficult to predict the timing, magnitude and
character of unrest events. Yet combining a number of such factors and adjusting their relative
weights based on historical patterns may lead to an understanding of where civil strife is most
likely to occur. The purpose of this project is to identify and compile the most relevant variables
ENVIRONMENTAL VULNERABILITY AND SOCIAL UNREST 7
that best demonstrate a countries’ vulnerability to climate-driven social unrest using a review of
prior literature and relevant international indices. The assessment framework used will be an
index of selected variables supported by national-level indicators that are selected from global
indices for which data has previously been compiled. Assessing vulnerability to climate-driven
social unrest is crucial to avoiding or mitigating future turmoil that will only increase as the
climate becomes increasingly unstable.
Literature Review
The Arab Spring
Beginning in late 2010, the Arab Spring was an unprecedented progression of marches,
nonviolent protests and ultimately violent demonstrations, riots, coups and civil wars in the
North Africa and Middle East region. The Arab Spring is widely believed to have been instigated
by dissatisfaction, particularly of youth and unions, with the corruption and factional rule of local
and national governments. Initial demonstrations were catalyzed first in Tunisia, when Mohamed
Bouazizi, a fruit vendor in the town of Sidi Bouzid, doused himself with gasoline and set himself
afire in protest of his wares being confiscated from his roadside fruit stand and being unable to
find any other work.
The Arab Spring, and the many country-specific movements it generated, eventually
brought down dictators in Tunisia, Libya, Yemen and Egypt and the repercussions continue to
impact the region today. Although the direct spark of the unrest was Mohamed Bouazizi,
empirical evidence suggests that a spike in food prices across the Arab world was responsible for
setting the stage (Johnstone & Mazo, 2011). By late 2010, global food prices – including in the
Arab world – had increased by 40 percent in the course of one year, largely due to droughts in
ENVIRONMENTAL VULNERABILITY AND SOCIAL UNREST 8
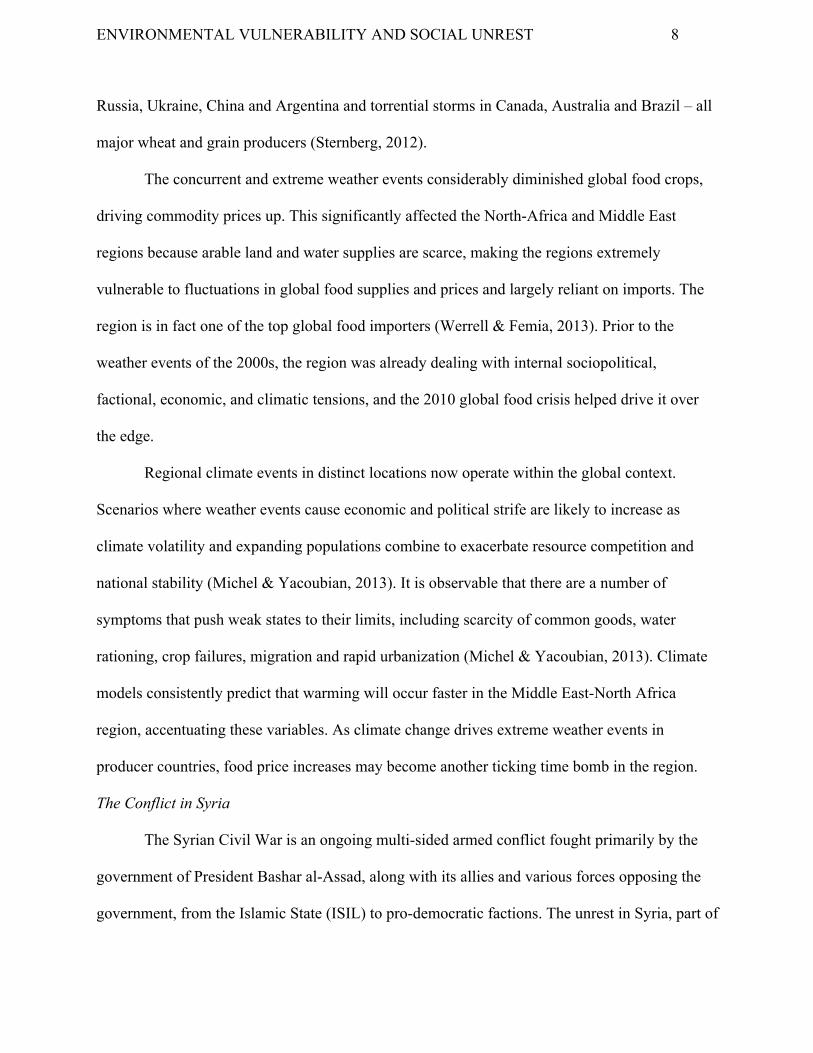
Russia, Ukraine, China and Argentina and torrential storms in Canada, Australia and Brazil – all
major wheat and grain producers (Sternberg, 2012).
The concurrent and extreme weather events considerably diminished global food crops,
driving commodity prices up. This significantly affected the North-Africa and Middle East
regions because arable land and water supplies are scarce, making the regions extremely
vulnerable to fluctuations in global food supplies and prices and largely reliant on imports. The
region is in fact one of the top global food importers (Werrell & Femia, 2013). Prior to the
weather events of the 2000s, the region was already dealing with internal sociopolitical,
factional, economic, and climatic tensions, and the 2010 global food crisis helped drive it over
the edge.
Regional climate events in distinct locations now operate within the global context.
Scenarios where weather events cause economic and political strife are likely to increase as
climate volatility and expanding populations combine to exacerbate resource competition and
national stability (Michel & Yacoubian, 2013). It is observable that there are a number of
symptoms that push weak states to their limits, including scarcity of common goods, water
rationing, crop failures, migration and rapid urbanization (Michel & Yacoubian, 2013). Climate
models consistently predict that warming will occur faster in the Middle East-North Africa
region, accentuating these variables. As climate change drives extreme weather events in
producer countries, food price increases may become another ticking time bomb in the region.
The Conflict in Syria
The Syrian Civil War is an ongoing multi-sided armed conflict fought primarily by the
government of President Bashar al-Assad, along with its allies and various forces opposing the
government, from the Islamic State (ISIL) to pro-democratic factions. The unrest in Syria, part of
ENVIRONMENTAL VULNERABILITY AND SOCIAL UNREST 9
a wider wave of 2011 Arab Spring protests, grew out of discontent with the Assad government
and escalated into an armed conflict after protests calling for his removal were violently
suppressed.
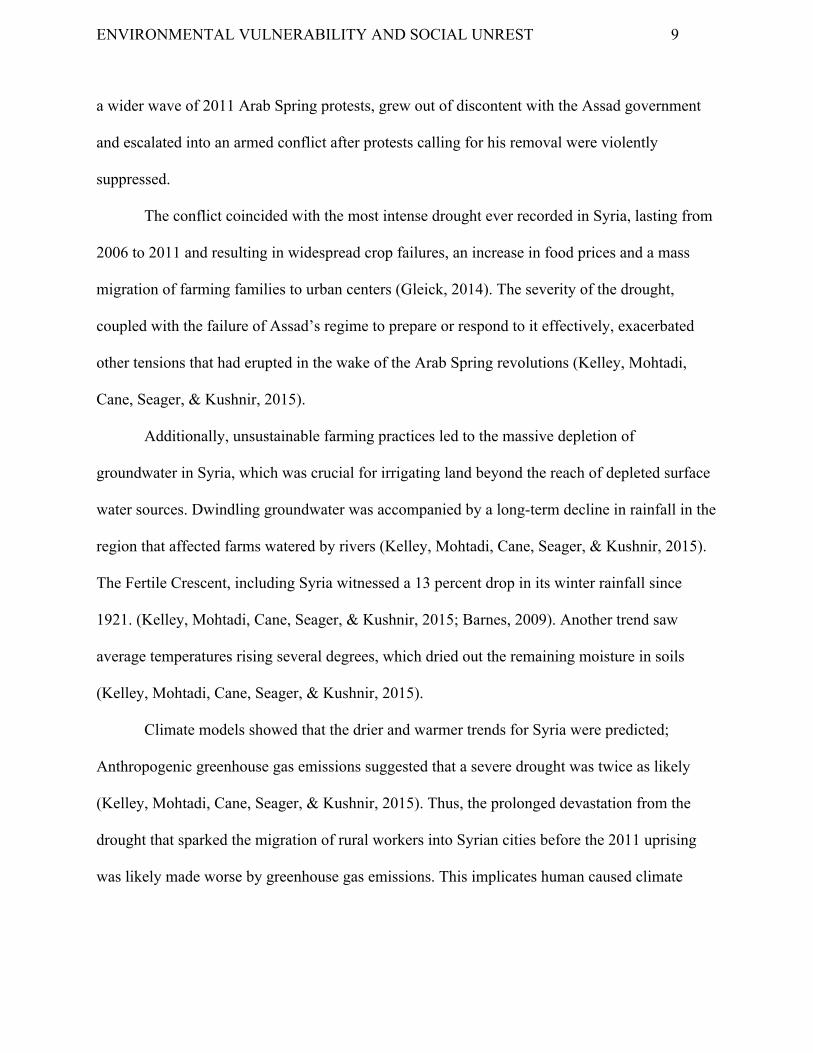
The conflict coincided with the most intense drought ever recorded in Syria, lasting from
2006 to 2011 and resulting in widespread crop failures, an increase in food prices and a mass
migration of farming families to urban centers (Gleick, 2014). The severity of the drought,
coupled with the failure of Assad’s regime to prepare or respond to it effectively, exacerbated
other tensions that had erupted in the wake of the Arab Spring revolutions (Kelley, Mohtadi,
Cane, Seager, & Kushnir, 2015).
Additionally, unsustainable farming practices led to the massive depletion of
groundwater in Syria, which was crucial for irrigating land beyond the reach of depleted surface
water sources. Dwindling groundwater was accompanied by a long-term decline in rainfall in the
region that affected farms watered by rivers (Kelley, Mohtadi, Cane, Seager, & Kushnir, 2015).
The Fertile Crescent, including Syria witnessed a 13 percent drop in its winter rainfall since
1921. (Kelley, Mohtadi, Cane, Seager, & Kushnir, 2015; Barnes, 2009). Another trend saw
average temperatures rising several degrees, which dried out the remaining moisture in soils
(Kelley, Mohtadi, Cane, Seager, & Kushnir, 2015).
Climate models showed that the drier and warmer trends for Syria were predicted;
Anthropogenic greenhouse gas emissions suggested that a severe drought was twice as likely
(Kelley, Mohtadi, Cane, Seager, & Kushnir, 2015). Thus, the prolonged devastation from the
drought that sparked the migration of rural workers into Syrian cities before the 2011 uprising
was likely made worse by greenhouse gas emissions. This implicates human caused climate
ENVIRONMENTAL VULNERABILITY AND SOCIAL UNREST 10
change as one of the factors that led to the Syrian conflict, which has claimed more than 190,000
lives (De Chatel, 2014).
The failure of crops in the Fertile Crescent has wiped out livelihoods for an estimated 1 to
1.5 million people that have been forced to migrate to the cities (De Chatel, 2014; Goldstone,
2002). This migration in Syria has caused a huge population shock in the country’s urban
centers. Critics of this causal link point to the uprising having more to do with the government’s
failure to respond to the drought than the drought itself. This critique argues that the drought
exacerbated social unrest through less direct cause. It is fair to say that civil unrest rarely has a
simple or unique cause, and the civil war in Syria is no exception. Yet, climate change is
predicted to bring more severe climate events that could hit countries, exacerbating existing
instabilities and weaknesses and potentially sparking unrest. The Syrian civil war, and unrest
throughout the North-African and Middle East regions, are examples of the emergence of climate
change’s negative and destabilizing influence in countries, a phenomenon that will be
increasingly common in the future given current climate models.
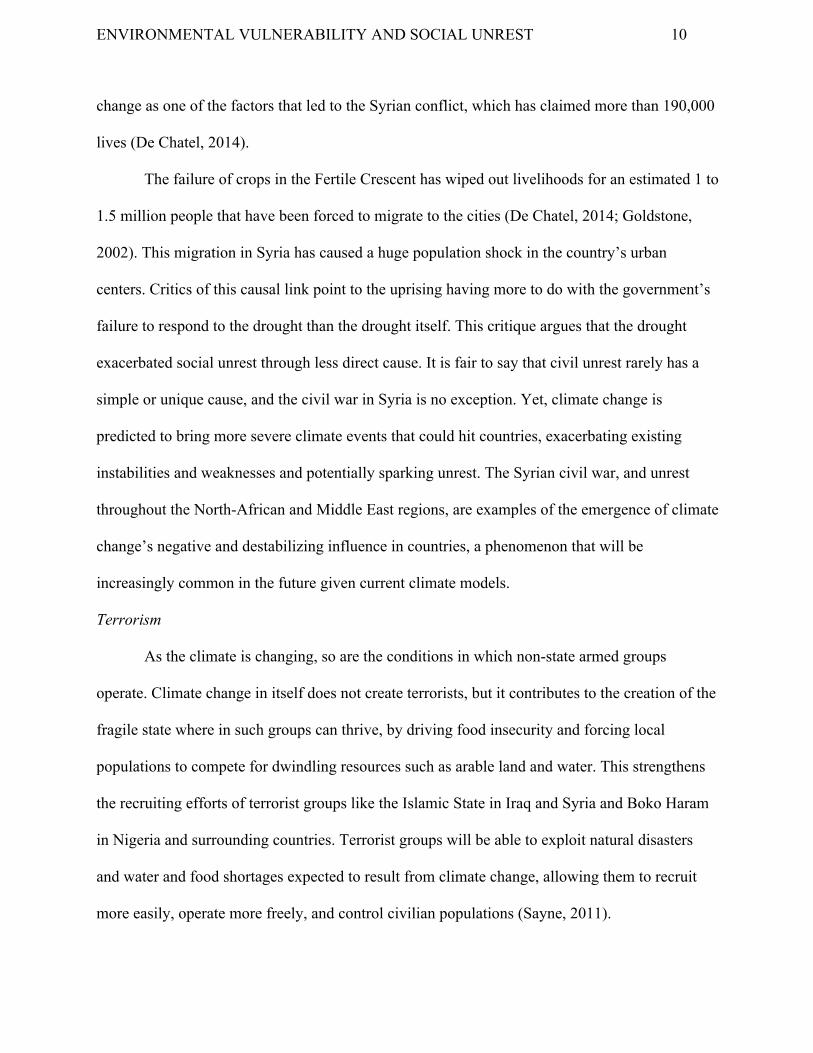
Terrorism
As the climate is changing, so are the conditions in which non-state armed groups
operate. Climate change in itself does not create terrorists, but it contributes to the creation of the
fragile state where in such groups can thrive, by driving food insecurity and forcing local
populations to compete for dwindling resources such as arable land and water. This strengthens
the recruiting efforts of terrorist groups like the Islamic State in Iraq and Syria and Boko Haram
in Nigeria and surrounding countries. Terrorist groups will be able to exploit natural disasters
and water and food shortages expected to result from climate change, allowing them to recruit
more easily, operate more freely, and control civilian populations (Sayne, 2011).

ENVIRONMENTAL VULNERABILITY AND SOCIAL UNREST 11
Further, terrorist groups are increasingly explicitly using natural resources as weapons of
war, controlling access to them, and compounding and exacerbating resource scarcities. The
scarcer resources become, the more power is given to those who control them, especially in
regions where people are particularly reliant on scarce natural resources for their livelihoods. As
climate change affects food security and the availability of water and land, affected people will
become more vulnerable not only to negative climate impacts, but also to recruitment by terrorist
groups offering alternative livelihoods and economic incentives.
In the drought-ravaged region around Lake Chad in central Africa, food and water
shortages, near-economic collapse and weak governments are providing a ripe recruiting ground
for Boko Haram. Many of the group’s foot soldiers are those displaced by severe drought and
food shortages in neighboring Chad and Niger, people dislocated due to ecological disasters
taking place in a chaotic state of absolute poverty. This social dislocation is caused by the drive
for food, water, shelter, jobs and means of livelihood (Odjugo, 2005; Coe & Foley, 2001).
Thousands of farmers and herdsmen had lost their livelihoods and were facing starvation
in the North-Africa region (Sayne, 2011). Many of these men were found in major cities like
Lagos, pushing water carts and repatriating their earnings to the families they left behind, but
others were believed to have been lured to join Boko Haram (Sayne, 2011). The Nigerian
military itself has now recognized a correlation between regional climatic events and an upsurge
in extremist violence (Ahmed, 2014).
Darfur
The War in Darfur is a major armed conflict in the Darfur region of Sudan that began in
2003 when two rebel groups, the Sudan Liberation Movement and the Justice and Equality
Movement began fighting the government of Sudan which they accused of oppressing Darfur’s
ENVIRONMENTAL VULNERABILITY AND SOCIAL UNREST 12
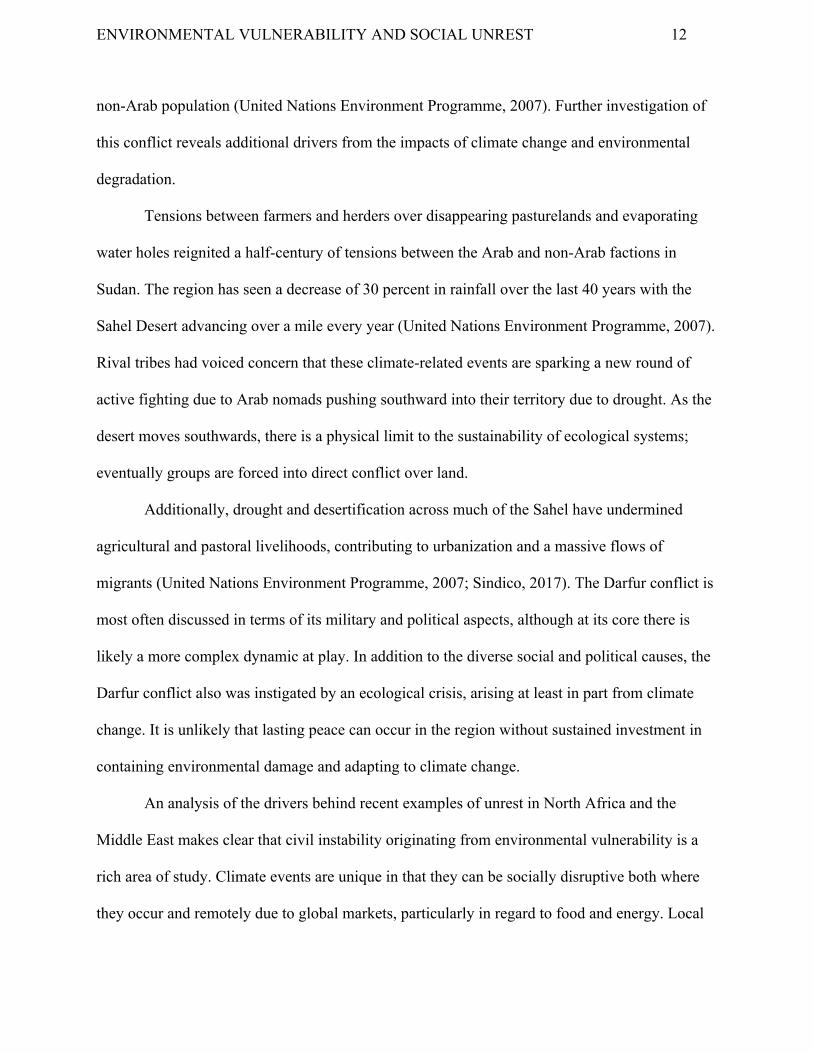
non-Arab population (United Nations Environment Programme, 2007). Further investigation of
this conflict reveals additional drivers from the impacts of climate change and environmental
degradation.
Tensions between farmers and herders over disappearing pasturelands and evaporating
water holes reignited a half-century of tensions between the Arab and non-Arab factions in
Sudan. The region has seen a decrease of 30 percent in rainfall over the last 40 years with the
Sahel Desert advancing over a mile every year (United Nations Environment Programme, 2007).
Rival tribes had voiced concern that these climate-related events are sparking a new round of
active fighting due to Arab nomads pushing southward into their territory due to drought. As the
desert moves southwards, there is a physical limit to the sustainability of ecological systems;
eventually groups are forced into direct conflict over land.
Additionally, drought and desertification across much of the Sahel have undermined
agricultural and pastoral livelihoods, contributing to urbanization and a massive flows of
migrants (United Nations Environment Programme, 2007; Sindico, 2017). The Darfur conflict is
most often discussed in terms of its military and political aspects, although at its core there is
likely a more complex dynamic at play. In addition to the diverse social and political causes, the
Darfur conflict also was instigated by an ecological crisis, arising at least in part from climate
change. It is unlikely that lasting peace can occur in the region without sustained investment in
containing environmental damage and adapting to climate change.
An analysis of the drivers behind recent examples of unrest in North Africa and the
Middle East makes clear that civil instability originating from environmental vulnerability is a
rich area of study. Climate events are unique in that they can be socially disruptive both where
they occur and remotely due to global markets, particularly in regard to food and energy. Local
ENVIRONMENTAL VULNERABILITY AND SOCIAL UNREST 13
disruptions create obvious and visible impacts: storms, floods, heat waves and droughts.
However, less obvious shocks can reverberate around the world impacting human well being in
populations far removed from where the climate event occurs, as in the case of the Arab Spring.
More overt climate related consequences have obvious local impacts that can disrupt societies by
exacerbating existing social and political stresses.
The Vulnerability of the State
The effects of food insecurity on the likelihood of violent unrest depend on the extent to
which state structures and institutions are already vulnerable (Jones, Mattiacci, & Braumoeller,
2017). States that are less vulnerable to the threat of food insecurity will be better able to avoid
violent unrest than states that are more vulnerable (Hegre & Sambanis, 2006; Fearon & Laitin,
2003; Collier & Hoeffler, 2004). Crucial to avoiding threats of food insecurity are a state's ability
to mobilize the resources and employ the policy tools necessary to quickly respond to these
negative ramifications (Adger, 2006). The 2003-2004 extreme drought that affected Kenya and
Ghana demonstrated how prior state vulnerability exacerbates impacts from shocks to the system
induced by extreme weather (IPCC, 2013). Kenya experienced far more violent unrest compared
with Ghana that can be explained by examining its relatively significant comparative
vulnerability (Salehyan et al., 2012). Ghana was able to marshal state resources to mitigate
negative impacts from the shock because of a smaller population, larger Gross Domestic Product
per capita, and robust government action in the form of a $1 billion dollar aid package swiftly
approved by the president (Jones, Mattiacci, & Braumoeller, 2017). Food insecurity is more
likely to trigger violent unrest in vulnerable states like Kenya, than in comparably stronger states
(Jones, Mattiacci, & Braumoeller, 2017).
ENVIRONMENTAL VULNERABILITY AND SOCIAL UNREST 14
The role of the state is crucial due to its position and ability to apply policy tools to
mediate the relationship between weather extremes and violence (Jones, Mattiacci, &
Braumoeller, 2017). The likelihood of weather extremes to produce conflict will vary depending
on the prior vulnerability of the state (Jones, Mattiacci, & Braumoeller, 2017). State capacity and
vulnerability are multifaceted phenomena. Failing to account for the multifaceted nature of state
capacity risks omitting potentially crucial dimensions of a state’s ability to avoid and respond to
extreme weather events and the increase of food security they amplify (Hendrix, 2010; Jones,
Mattiacci, & Braumoeller, 2017).
Governments that are institutionally coherent greatly reduce a state’s vulnerability to
food insecurity, because institutional coherence allows states to take advantage of their
resources, enabling food insecurity to be addressed more rapidly and more effectively than
institutionally incoherent regimes (Adger, 2006; Hegre & Sambanis, 2006). Coherent
governments can use a wide range of resources to face threats of food insecurity. For example,
democratic regimes may embrace economic intervention packages or redistribution due to their
more open and stable political structures that incentivize politicians to respond to the concerns of
their vulnerable and impacted citizens (Adger, 2006; Collier & Hoeffler, 2004; Fearon & Laitin,
2003; Hendrix & Haggard, 2015).
The capacity of the state to combat food insecurity will also vary based on the strength of
its bureaucratic apparatus which is essential in identifying the sources of unrest, efficiently
implementing policies to counter unrest and marshaling the resources to support these policies
(Jones, Mattiacci, & Braumoeller, 2017). States that direct a higher level of resources toward
government expenditures are likely to possess more competent and efficient bureaucracies that
are able to better respond in times of crisis. Wealthier states also have the ability to use their
ENVIRONMENTAL VULNERABILITY AND SOCIAL UNREST 15
resources to access international commodity markets to offset domestic production shortfalls in
addition to relying on better financed administrative agencies that are able to act quickly in times
of crisis (Jones, Mattiacci, & Braumoeller, 2017). Finally, wealthier states have more overall
resources for governments to draw from in periods of turmoil (Jones, Mattiacci, & Braumoeller,
2017). High agricultural productivity may also reduce vulnerability as it indicates that more food
production is possible with fewer inputs (Jones, Mattiacci, & Braumoeller, 2017).
Greater vulnerability to food insecurity characterized by governments with less
institutional coherence, less bureaucratic capacity, and lower revenues will amplify its effects,
whereas less vulnerability will mitigate the effects of food insecurity (Jones, Mattiacci, &
Braumoeller, 2017). Addressing the vulnerability of states is crucial to breaking the link between
food insecurity and civil unrest (Jones, Mattiacci, & Braumoeller, 2017). Vulnerability is a
multidimensional phenomenon, thus counteracting climate-induced food scarcity must entail
initiatives to stabilize domestic regimes and policies to strengthen their structural resilience
(Jones, Mattiacci, & Braumoeller, 2017).
Threats to Food Security
The Food and Agriculture Organization (2006), points to four dimensions of food
security: food availability, the availability of sufficient quantities of food of appropriate quality,
supplied through domestic production or imports; food access, access by individuals to adequate
resources for acquiring appropriate foods for a nutritious diet; utilization, utilization of food
through adequate diet, clean water, sanitation and health care to reach a state of nutritional well-
being where all physiological needs are met; and stability, to be food secure a population,
household or individual must have access to adequate food at all times (p.1). Studies demonstrate
ENVIRONMENTAL VULNERABILITY AND SOCIAL UNREST 16
and scholars argue that climate related threats to food security have contributed to destabilizing
numerous countries in recent decades/years.
A state’s vulnerability to food insecurity is determined by two key features: a state’s
capacity to manage and mitigate sudden increases in the threat of food insecurity and the state’s
underlying susceptibility to food insecurity (IPCC, 2014a). The Intergovernmental Panel on
Climate Change (2014a) defines state vulnerability as including sensitivity or susceptibility to
harm and lack of capacity to cope and adapt (p. 5). Susceptibility refers to economic and
geographic factors that exacerbate and broaden food insecurity following extreme weather events
by causing shortages and extreme price fluctuations (Almond & Powell, 1966). Capacity refers
to the ability of a state to respond to and manage sudden increases in food insecurity (Fearon &
Laitin, 2003).
State capacity and vulnerability are complex phenomena, with multiple dimensions.
Discounting the multifaceted nature of state capacity risks disregarding crucial dimensions of a
state’s ability to avoid and respond to extreme weather events and the increase of food insecurity
(Jones, Mattiacci, & Braumoeller, 2017). Extreme weather and international food prices are the
most significant factors impacting the risk of food insecurity (Buhaug, Gleditsch, & Theisen,
2008). State vulnerability dramatically increases the impact of threats to the local and global
food supply and the likelihood of violent unrest (Jones, Mattiacci, & Braumoeller, 2017).
Historical accounts catalogue many instances of sudden increases in food insecurity contributing
to, or directly producing, violent protests and riots (Jones, Mattiacci, & Braumoeller, 2017).
Drivers of these events include food shortages, which decrease food availability, thus impairing
the basic ability of individuals to survive (Jones, Mattiacci, & Braumoeller, 2017). Additionally,
citizens are more likely to participate in violent demonstrations which, while risky to personal
ENVIRONMENTAL VULNERABILITY AND SOCIAL UNREST 17
safety, may be a preferable alternative to not demonstrating and potentially being unable to feed
oneself or one’s family (Brinkman & Hendrix, 2011). Individual willingness to participate in
violent demonstrations and riots increases in the face of food scarcity because food is a crucial
resource for survival (Jones, Mattiacci, & Braumoeller, 2017).
Food insecurity hinders the ability of people to procure food and exacerbates previous
existing inequalities in a society between those with relatively easy access to food and those
whose ability to procure food is already tenuous (Jones, Mattiacci, & Braumoeller, 2017). This
can generate competition and animosity between different social groups and between societal
groups and the government (Jones, Mattiacci, & Braumoeller, 2017). Abrupt changes in food
availability inevitably amplify existing inequalities and conflicts between and amongst different
groups (Jones, Mattiacci, & Braumoeller, 2017). Vulnerability or strength of the state to food
insecurity plays a crucial role in moderating food insecurity impacts, which may increase the
likelihood of violence (Jones, Mattiacci, & Braumoeller, 2017). When states are especially
vulnerable, the ramifications of abrupt increases in food insecurity are likely to be widespread,
and grievances are more likely to trigger violence precisely because the state lacks the economic
and institutional resilience necessary to address the grievances of its population and deter
violence (Adger, 2006).
Abrupt and dramatic reductions in the ability of individuals to access food may result
from either domestic or international processes, or both (Jones, Mattiacci, & Braumoeller, 2017).
Higher international food prices increase the risk of food insecurity, because high prices make it
more burdensome for consumers, particularly those on the margins to purchase food (Raleigh,
Choi, & Kniveton, 2015; Smith, 2014). Sudden increases in international prices unexpectedly
cause shortages that are difficult for consumers to anticipate and plan for (Jones, Mattiacci, &
ENVIRONMENTAL VULNERABILITY AND SOCIAL UNREST 18
Braumoeller, 2017). Food insecurity may also originate from local conditions, most importantly
from the effects of weather on food production within a state. Adverse weather conditions, by
depressing local crop yields, challenge both producers and consumers of food (Jones, Mattiacci,
& Braumoeller, 2017). Extreme precipitation variability contributes to this through flooding,
storm events or droughts that can negatively impact agricultural production. Other country
specific factors include the level of reliance on agricultural production. Heavy reliance on a
domestic agriculture is likely to increase vulnerability because a shock to domestic agricultural
production in a state economically centered solely around its own production has the added
impact of displacing a substantial number of workers and subsistence farmers due to
unemployment (Jones, Mattiacci, & Braumoeller, 2017). Extreme weather also dramatically
reduces the ability of individual subsistence farmers to produce enough food for themselves,
forcing them into the marketplace (Jones, Mattiacci, & Braumoeller, 2017).
Contradictory studies argue that droughts have a pacifying effect on armed conflict
because more water enables mobilization of distinct groups thus allowing them to avoid conflict
(Salehyan & Hendrix, 2014). Both particularly dry and wet years, as identified by deviations
from the long-term annual mean of precipitation, were found to increase the probability of
violent conflict (Salehyan & Hendrix, 2014). Deviations from mean precipitation are associated
with major production shortfalls in the agricultural sector (Salehyan & Henrix, 2014). However,
other studies counter this argument by affirming that positive changes in rainfall are associated
with a decreased likelihood of conflict in the following year (Burke, Miguel, Satyanath, Dykema,
& Lobell, 2009; Buhaug, Benjaminsen, Sjaastad, & Theisen, 2015; Hendrix & Glaser, 2007;
Riha, Wilks, & Simoens, 1996). While other studies argue that both extreme drought conditions
and extremely wet conditions are conducive to communal violence (Raleigh & Kniveton, 2012).
ENVIRONMENTAL VULNERABILITY AND SOCIAL UNREST 19
Authors largely conclude that deviations from normal precipitation and mild temperature
patterns systematically increase the risk of conflict, often considerably (Hsiang, Burke, &
Miguel, 2013).
Food insecurity has been shown to produce new grievances and exacerbate existing ones
between domestic groups and between domestic groups and the government, as well as
negatively affect both producers and consumers (Jones, Mattiacci, & Braumoeller, 2017). There
are two main channels through which sudden increases in food insecurity contribute or directly
produce violent protests and riots: decreasing food availability and highlighting differing food
entitlements of societal groups (Adger, 2006; Sen, 1981). Increasing food insecurity clearly
increases the likelihood of violent unrest.
Water Security
Water plays a fundamental role in sustaining and supporting life, a healthy environment,
and human well-being, therefore the quality and availability of water attracts international
attention. Water can only be replenished at costs beyond what many water-stressed countries can
afford. Thus, unlike other resources, such as energy and food, natural water resources are
essentially unsubstitutable and irreplaceable. Conflict over this crucial resource stems primarily
from issues of availability to meet competing needs. In the coming decades, this will be
exacerbated due to projections of an increasing imbalance between supply and demand for water
in the future. The 2030 Water Resources Group (2009) forecasts a gap of 40 percent between
global water requirements and accessible, reliable water supply by 2020. This model contains
uncertainties due to changes in land use patterns, population growth, changing dietary patterns,
rapid urbanization, and economic development, all of which tend to increase the need for water.
These factors would thus exacerbate competition over the vital resource.
ENVIRONMENTAL VULNERABILITY AND SOCIAL UNREST 20
Wolf (2007) notes, “There are 263 rivers around the world that cross the boundaries of
two or more nations,” thus this necessary resource is intrinsically transnational (p. 245). These
river basins are home to 40 percent of the world’s population and make up some part of 145
countries (Wolf, Natharius, Danielson, Ward, & Pender, 1999). Furthermore, 2 billion people
worldwide depend on groundwater, which includes an estimated 300 transboundary aquifer
systems (United Nations Water Annual Report, 2008). Many countries depend on water sources
that must be shared – an invitation for conflict. Even in the absence of aggravated conditions,
this resource is evidently contentious.
Climate change is projected to affect water supplies in varied ways across regions. Dry
areas are expected to get drier and wet areas wetter. Noticeable shifts in precipitation frequency
and distribution have already taken place in the past several decades. Current desert areas are
projected to experience a 5 to 10 percent reduction in precipitation for each degree of global
warming (United Nations Water, 2008). Warmer temperatures cause more evaporation, thus less
refilling of water tables. On the other end of the spectrum, warmer air holds more moisture
leading to an increase in the intensity of precipitation in some regions, which can lead to
flooding. Climate change’s impacts on water supply, combined with significant human impacts
on supply and demand, could lead to tensions and conflicts in the future (Steinbruner, Stern, &
Husbands, 2013).
Extensive literature exists cataloging water disputes that date back to 3,000 BCE. It is
widely recognized that water scarcity can be a direct source of national or international unrest
(Cooley, 1984; Starr, 1991; Bulloch & Darwish, 1993; Homer-Dixon, 1994; Remans, 1995;
Amery, 2002). More commonly, major reports note that conflicts arising over water often lead to
internal unrest in addition to the increasing risk of war between nations. A framework of
ENVIRONMENTAL VULNERABILITY AND SOCIAL UNREST 21
overlapping categories for water-driven conflict can be used to assess vulnerability is included in
Appendix A. The National Research Council (2012) indicates that changes in the availability of
water resources may play an increasing role in political tensions, especially if existing water
management institutions do not evolve to take better account of social, economic, and ecological
complexities.
Methods
Index creation consisted of two primary tasks. The first of these tasks was selecting what
countries to focus on for analysis. The second of these tasks was selecting the variables by which
countries would be analyzed. These tasks were both crucial in creation of the final index
demonstrating climate-driven vulnerability to social unrest.
Country Selection
The countries chosen for the index were selected through a process beginning with the
United Nations designated Least Developed Countries (LDCs) list that was then cross-listed with
the top one hundred countries most vulnerable to climate change risks according to the
Germanwatch Global Climate Risk Analysis report.
The United Nations list of LDCs consists of 47 countries (as of June 2017) that exhibit
the lowest indicators of socioeconomic development according to specific criteria. The process
of LDC identification is conducted by The UN Committee for Development Policy mandated by
the General Assembly and the Economic and Social Council of the United Nations. These bodies
review the list of LDCs every three years to make “recommendations on the inclusion and
graduation of eligible countries” (LDC Identification Criteria & Indicators, United Nations).
Three critical criteria are used to identify eligible countries: income, human assets and
economic vulnerability. The United Nations Development Policy & Analysis Division defines
ENVIRONMENTAL VULNERABILITY AND SOCIAL UNREST 22
and justifies why these three criteria are used to identify Least Developed Countries. The first
criterion, income, is based on Gross National Income (GNI) on a per capita basis and is utilized
because it “provides information on the income status and the overall level of resources available
to a country” (LDC Identification Criteria & Indicators, United Nations). The World Bank
classifies low-income countries as being below a three-year average threshold of U.S. $1,025
GNI per capita. GNI is calculated, “from national accounts data converted into USD using the
World Bank Atlas method to reduce impact of short-term exchange rate fluctuations” (LDC
Identification Criteria & Indicators, United Nations). The per capita GNI is then derived from
this calculation by dividing it by the population of a country in the year of GNI measurement.
Using information from its National Accounts Main Aggregates Database, the United Nations
Statistics Division performs these calculations. Population data are taken from the United
Nations Population Division.
The second criterion used to identify Least Developed Countries is a country’s Human
Assets Index (HAI). The Human Assets Index is a measure of human capital. It is noted by the
LDC Identification Criteria and Indicators body of the United Nations (2018) that “low levels of
human assets indicate major structural impediments to sustainable development.” Lower HAI
scores represent lower development of human capital within a country. The U.N. Committee for
Development Policy has established the threshold score of sixty to determine inclusion on the
Least Developed Country list with countries below that level included. Five weighted indicators
are grouped into health and education sub-indices and these together determine the Human
Assets Index. The Health Index is composed of: mortality rate for under five year olds,
percentage of population undernourished and maternal mortality rate. The Education Index is
comprised of: gross secondary school enrolment ratio and adult literacy rate.
ENVIRONMENTAL VULNERABILITY AND SOCIAL UNREST 23
The final criterion used to identify Least Developed Countries is the Economic
Vulnerability Index (EVI). The Economic Vulnerability Index is a measure of “structural
vulnerability to economic and environmental shocks” (LDC Identification Criteria & Indicators,
United Nations). High vulnerability indicates major structural impediments to sustainable
development and therefore higher economic vulnerability. The U.N. Committee for
Development Policy has indicated a threshold of 36 for inclusion on the Least Developed
Country list. The EVI is composed of two indicators grouped into eight sub-indices. First is the
“exposure” sub-index, which is comprised of the “size” sub-index which focuses on population;
the “location” sub-index which measures remoteness; the “economic structure” sub-index which
is comprised of merchandise export concentration and share of agriculture, hunting, forestry, and
fishing in GDP, and the “environment” sub-index which is composed of the share of the
population in low elevation coastal zones. The “shock” sub-index is composed of two sub-
indices, the “trade shock” sub-index, which is composed of instability of exports of goods and
services, and the “natural shock” sub-index, which is composed of the number of victims of
natural disasters and the instability of agricultural production.
The Least Developed Countries were chosen as the initial list of countries for analysis
because they have exhibited prior vulnerabilities that can be attributed to weak human and
institutional capacities, low and unequally distributed income, and scarcity of domestic financial
resources (United Nations Office of the High Representative for the Least Developed Countries,
2018). These countries often suffer from governance crises, political instability and internal and
external conflicts in addition to being highly vulnerable to external shocks (United Nations
Office of the High Representative for the Least Developed Countries, 2018). Further, these
countries represent the poorest and weakest segment of the international community while
ENVIRONMENTAL VULNERABILITY AND SOCIAL UNREST 24
representing 12 percent of the world population, or 880 million people (United Nations Office of
the High Representative for the Least Developed Countries, 2018).
Despite the otherwise comprehensive nature of the classification of the Least Developed
Countries, minimal attention is given to vulnerability to risks from climate change. Because of
this, the LDCs were cross-listed with the Germanwatch Global Climate Risk Index countries to
create a list that comprehensively identified vulnerability from multiple internal and external
stressors.
Germanwatch is a non-profit, non-governmental organization that produces an annual
report that analyzes the extent to which countries have been affected by the impacts of weather-
related loss events (Eckstein, Kunzel, & Schafer, 2017). The Germanwatch Global Climate Risk
Index was chosen as the most reputable source to identify countries that face risks associated
with climate change because it is backed by the United Nations. The information collected by
Munich Reinsurance Company through its NatCatSERVICE program serves as the basis for the
Global Climate Risk Index analysis. “For the countries of the world, Munich Re collects the
number of total losses caused by weather events, the number of deaths, the insured damages and
the total economic damages” (Eckstein, Kunzel, & Schafer, 2017 p. 19).
The following indicators were used for the Global Climate Risk Index: number of deaths,
number of deaths per 100,000 inhabitants, sum of losses in US$ in purchasing power parity
(PPP) and losses per unit of Gross Domestic Product (Eckstein, Kunzel, & Schafer, 2017).
International Monetary Fund data contributed to economic and population data used for
indicators two through four. The Climate Risk Index is based on figures from 1997-2016
whereby each country’s average ranking in all four weighted categories was used to determine
ENVIRONMENTAL VULNERABILITY AND SOCIAL UNREST 25
final rankings. Weighting is as follows: death toll, 1/6; deaths per 100,000 inhabitants, 1/3;
absolute losses in PPP, 1/6; losses per GDP unit, 1/3 (Eckstein, Kunzel, & Schafer, 2017).
Although the Germanwatch Global Climate Risk Index analyzes previously identifiable
hazards, it has implications for future climate risks as well. The CRI “does not allow for an exact
measurement of vulnerability, [but] it can be seen as at least an indication or pattern of
vulnerability” (Eckstein, Kunzel, & Schafer, 2017 p. 20). Additionally, the historical existence of
many dramatic climate events in a given country may demonstrate a higher vulnerability to
future events. Countries were selected for this analysis was selected if they met the following
criteria – they were found on both the Least Developed Countries list and in the top one hundred
countries on the Climate Risk Index. These countries are as follows: Bangladesh, Burundi,
Cambodia, Djibouti, Ethiopia, Haiti, Lao People’s Democratic Republic (Lao PDR),
Madagascar, Malawi, Mauritania, Mozambique, Myanmar, Nepal, Niger, Solomon Islands,
Sudan, Uganda and Vanuatu.
Variable Selection
The variables selected for inclusion in the vulnerability to social unrest index were
categorized based on the methodology used in the paper Vulnerability of national economies to
the impacts of climate change on fisheries (Allison et al., 2011). Vulnerability is defined as a
function of “…extrinsic exposure of groups or individuals or ecological systems to a hazard,
such as climate change, their intrinsic sensitivity to the hazard, and their lack of capacity to
modify exposure to, absorb, and recover from losses stemming from the hazard...” (Allison et al.,
2011 p. 175; Adger et al., 2005; Brooks et al., 2005; Smit & Wandel, 2006). Allison and
colleagues distinguish three components of vulnerability: “exposure to physical effects of
climate change, the degree of intrinsic sensitivity of the natural resource system or dependence
ENVIRONMENTAL VULNERABILITY AND SOCIAL UNREST 26
of the national economy upon social and economic returns from that sector and the extent to
which adaptive capacity enables these potential impacts to be offset” (Allison et al., 2011 p. 175;
IPCC, 2001). These components can be simplified as “exposure,” “sensitivity” and “adaptive
capacity,” as I will refer to them throughout this paper. Exposure for a particular country is
demonstrated – as noted earlier – by selecting those countries appearing on the Least Developed
Country list that also fall into the top one hundred most vulnerable to climate risk as denoted by
the Germanwatch Global Climate Risk Index. Eleven factors were then selected from the
literature to represent sensitivity and adaptive capacity to social unrest in the face of exposure to
climate risks (Table 1). Each factor chosen is represented by a statistical variable that is used to
create an index of sensitivity and adaptive capacity that each country faces along a uniform
standard, allowing comparison between countries.
Sensitivity
Sensitivity is defined by the Intergovernmental Panel on Climate Change (2001) as “the
degree to which a system is affected, either adversely or beneficially, by climate-related stimuli”
(p. 877). For this analysis, sensitivity is evaluated somewhat differently due to the complex
ecological and human causes of social unrest provoked by climate change. In this paper,
sensitivity refers to an aspect of in-country vulnerability to potential social unrest due to climatic
events. Based on the literature, the factors considered most relevant for assessing sensitivity are
listed below. Unless otherwise noted, all data were taken from the most recent year available.
1.1 Food Supply Variability
Food shortages around the world have occurred due to impacts from various weather
discrepancies including El Niño. Millions now face the threat of famine due to the cycle of
drought, armed conflict, civil unrest and destroyed harvests. Addressing issues of climate
ENVIRONMENTAL VULNERABILITY AND SOCIAL UNREST 27
adaptation, particularly with regards to impacts on agriculture, are crucial for preventing further
unrest and food insecurity. Drought has caused vulnerability to famine and food scarcity among
many populations that are already facing high levels of poverty. Climate change impacts have
decimated harvests in many parts of the world in recent years and this has been widely reported
to be a leading cause of increased conflict and civil unrest (Food and Agriculture Organization,
2018). The catalyst for this conflict is often the mass migrations of rural populations to cities as
they seek hope of survival. Studies indicate a preponderance of these populations end up in the
streets as beggars or in prostitution. Some families have fled to neighboring countries for
survival and that has exacerbated transnational tensions.
Food supply variability results from a combination of factors including government
instability and responsiveness to production, trade, consumption and storage concerns in addition
to changes in government policies such as trade restrictions, taxes and subsidies. The Food and
Agricultural Organization calculates the national estimate of total food supply using data from
government agencies, marketing authorities and industrial/manufacturing surveys (Food and
Agriculture Organization, 2001).
In this index, food supply variability will be represented by per capita food supply
variability (kcal/capita/day) provided by the Food and Agriculture Organization. To denote
variability correctly, the lowest food supply variability value catalogued by FAOSTAT was
subtracted from the highest.
1.2 Arable Land
Arable land is defined by the U.N. Food and Agriculture Organization (2016) as land
under temporary crops, temporary meadows for moving or for pasture, land under market or
kitchen gardens, and land temporarily fallow. Food insecurity has been linked to outbreaks of
ENVIRONMENTAL VULNERABILITY AND SOCIAL UNREST 28
social unrest in many past and ongoing instances. Conflict is common when shared resources are
put under pressure by outside factors such as climate change. This increases competition for
control of important resources utilized for food production, most notably land and water (Bora et
al., 2010). Variables such as deviation from typical climate and price volatility are two common
stressors that may lead to civil unrest or worsening conflict (Bora et al., 2010). Often countries
under the greatest stress have the least capability to respond. For example, countries with large
rural populations and poorer countries often are more dependent on indigenous agriculture for
both food and livelihood (Bora et al., 2010). Unsurprisingly, agriculture has been shown to be
extremely vulnerable to climate change. Higher temperatures and more erratic rainfall patterns
reduce yield, encourage weed and pest proliferation and increase the likelihood of short-run crop
failures and long-run production declines (Bora et al., 2011). Prices in local markets often
become volatile if local supply becomes more variable through climate change impacts.
Countries that produce their own commodities may be at risk for domestic production shocks due
to climate change. In this index, arable land will be represented by agricultural area in each
country as calculated by the Food and Agricultural Organization. This number will then be
divided by the population of each country to calculate arable land per capita.
1.3 Reliance on Imports
Dramatic fluctuations in food prices and agricultural productivity due to impacts from
climate change will often heavily affect countries that are highly reliant on imports to meet
domestic needs for food (Food and Agriculture Organization, 2014). Many of the countries that
rely predominantly on imports are those in the developing world. The global food crisis of 2007-
2008 demonstrates how natural disasters can affect international food prices. In 2007, food prices
on international markets increased by 23% compared to the previous year (Ching-Hsien et al.,
ENVIRONMENTAL VULNERABILITY AND SOCIAL UNREST 29
2017). Because of shortages, the world’s major exporting countries chose to impose restrictions,
therefore crippling food supply in countries dependent on imports to meet domestic demand.
Drought, precipitation variability, natural disasters and other climate change impacts will only
aggravate fluctuations in food prices in the future (Food and Agriculture Administration, 2014).
In the face of a fluctuating global market, food secure countries will be less dependent on
volatile international markets. When food is imported due to insufficient domestic production,
countries become overly dependent on outside sources to feed their populations. Collier (2000)
states, “a country that is heavily dependent upon primary commodity exports with a quarter of its
national income going to them, has a risk of conflict four times greater than one without
primarily commodity exports” (p. 6).
Price volatility caused by climate stressors may also contribute to outbreaks of unrest.
Unrest sparked by price volatility has occurred not only in countries with low performance
indicators in governance, but also in countries with relatively high governance performance
indicators (von Braun, 2008). Volatile prices lead to food insecurity that can, in turn, lead to
conflict. Future global prices for major food staples including maize, wheat and rice are
extremely uncertain due to volatile sources and variable supply due to increasing climate change
impacts. “The country impact of global food price volatility is conditioned by the trade status of
countries, net food importers generally lose from higher prices, net exporters generally gain”
(Bora et al., 2010 p. 5; Zaman et al., 2008; Ivanic & Martin, 2008). Higher global prices mean
larger import costs for countries that already are at risk for instability due to lack of food.
Reliance on imports is represented in the index by each country's value of food imports
over total merchandise exports as a percentage of the most recent three-year average as
calculated by the Food and Agriculture Organization. This indicator “captures the adequacy of
ENVIRONMENTAL VULNERABILITY AND SOCIAL UNREST 30
foreign exchange reserves to pay for food imports, which has implications for national food
security depending on production and trade patterns” (Land Portal, 2018).
1.4 Political Stability
The political stability and absence of violence/terrorism variable measures perceptions of
the likelihood of political instability or politically motivated violence, including terrorism
(FAOSTAT, 2016). This measurement was calculated by the World Bank for the Worldwide
Governance Indicators project. Political stability within a nation may indicate how a country
copes with external stressors such as climate change. Coping, response and recovery after a
disruptive event is one of the keys to avoiding lasting social unrest. Political stability and the
absence of violence/terrorism within a country often speaks to the quality of governance in that
nation and the ability of governmental services to provide structures which support a country’s
human needs. Additionally, prior violence and terrorism indicates that there are preexisting
tensions that may erupt in the future due to external pressures associated with climate change.
Political stability and absence of violence/terrorism here is represented by an index that ranges
from -2.5 to +2.5 with -2.5 representing weak political stability and +2.5 representing strong
political stability. It is developed using individual variables from multiple data sources, which
are listed in Table 2.
1.5 Control of Corruption
Control of corruption reflects the extent to which public power is exercised for private
gain, including both petty and grand forms of corruption, as well as "capture" of the state by
elites and private interests (World Bank, 2018). This measurement was calculated by the World
Bank for the Worldwide Governance Indicators project. It is formulated using individual
variables from multiple data sources, which are listed in Table 3. Corruption can weaken public
ENVIRONMENTAL VULNERABILITY AND SOCIAL UNREST 31
financial management and increase poverty because government expenditure typically favors the
rich and well connected. Funds earmarked for public institutions providing a safety net may be
used instead to pad the pockets of those in control. Corruption within a government may also
point to other negative qualities within a regime that hinder response to stressful climatic events
and therefore increase the likelihood of social unrest. Qualities that corrupt governments
generally do not employ such as transparency, integrity and collaboration are crucial to
governmental flexibility that will be necessary in the face of climatic variation and adaptation.
Control of corruption was chosen for this index because it allows for the measurement of
the integrity, transparency and overall quality of governance in each country. The physical
effects of climate change will increase resource stress and conflict over these resources. Citizens
living in corrupt countries are more likely to engage in activities associated with social unrest
such as protesting, rioting, looting, etc. stemming from climate events, because corrupt
governments are less suited to developing long term solutions requiring ambitious and efficient
management strategies. Additionally, in corrupt countries, resilience strategies may only focus
on those who are well connected and wealthy, thus leading to resentment that could degrade into
conflict (Transparency International, 2011). Control of corruption is measured in an index from
-2.5 to +2.5 with -2.5 representing weak control of corruption and +2.5 representing strong
control of corruption. It is developed using individual variables from multiple data sources,
which are listed in Table 3.
1.6 Income Inequality
In this index, income inequality is represented using the Gini index. The Gini index
measures the degree of inequality in the wealth distribution of a nation's residents. The Gini
index is the most commonly used measure of wealth inequality. The coefficient score for each
ENVIRONMENTAL VULNERABILITY AND SOCIAL UNREST 32
country is a single number aimed at measuring how far a country’s wealth distribution deviates
from the totally equal distribution of productivity. A country with perfect equality across the
population would receive a Gini score of 0 while a country with perfect inequality would receive
a score of 100. The global leader is currently Finland with a score of 21.5.
Income inequality represented by the Gini coefficient was chosen for this index because
inequality in societies may make them more sensitive to social unrest caused by climate change
impacts. Inequality may indicate the level of opportunity or difficulty for citizens to advance
their position with regards to jobs and resources such as housing and education. Additionally,
those who are underprivileged in countries that have high levels of inequality may be more likely
to engage in behavior that will lead to social unrest due to the perceived lack of available social
strata for them to advance their status. Climate change will place stress on resources within
countries and those who are less privileged will likely experience differentiated access to them in
comparison to those who are better off in society. Inequality on its own has a high potential to
cause social unrest, however in the face of climate stress it is even more likely. The Gini
coefficient of a country displays the level of inequality present today, and thus the susceptibility
of a country to social unrest in concert with the additive climate change stressors.
1.7 Previous Political or Ethnic Strife
Previous political or ethnic strife is characterized by the likelihood for political instability
and/or politically motivated violence, including terrorism (The World Bank, 2016). Preexisting
political and socio-economic conditions play a significant role in predicting the extent to which
outside stressors can be destabilizing in a country. For example, resource grievances can be
exploited by groups with a desire to cause conflict (Pinstrup-Andersen & Shimokawa, 2008).
Extant ethnic conflict and political strife have deep-seated structural causes and can lead to
ENVIRONMENTAL VULNERABILITY AND SOCIAL UNREST 33
future tensions. These deep-seated divides may prime countries for conflict when external
stressors like climate change put additional pressure on these countries. This affects the
sensitivity of a country to social unrest instigated by climatic pressures. In many areas, climate
change will cause weather variability that may lead to crop failures or destructive floods that will
put resource strains on groups that may already experience competition for resources and ethnic
strife.
Previous political and ethnic strife was chosen for this index because of its value in
indicating prior instability in a country independent of the added impacts of future climate
change. In the future, instability in countries will be exacerbated by climate-related events and
countries that have existing political or ethnic strife will be more sensitive to these impacts.
Previous political or ethnic strife is measured in an index from -2.5 to +2.5 with -2.5 representing
weak previous political or ethnic strife and +2.5 representing strong previous political or ethnic
strife.
1.8 Human Development
The Human Development Index was created as an alternate measure for assessing the
development of a country that does not rely solely on economic evaluation. It measures the
average achievement in three categories using the geometric mean of normalized indices for each
dimension. The dimensions are: a long and healthy life, being knowledgeable and standard of
living. The “long and healthy life” category is comprised of a single indicator: life expectancy at
birth. Knowledge is comprised of two indicators: expected years of schooling and mean years of
schooling. Standard of living is comprised of GNI per capita (PPP $). Each dimension is
simplified and represented using a dimension index. The dimension indices are as follows: life
expectancy index, education index and GNI index. A country receives a high Human
ENVIRONMENTAL VULNERABILITY AND SOCIAL UNREST 34
Development score when the key indicators – education, lifespan and GDP per capita – are
higher. The Human Development score, combining these three important indices, communicates
well-being in a given country. Central to this idea is the concept of the capability for citizens
within a country to reach their full human potential. The creators of the Human Development
Index selected the categories of health, knowledge and standard of living to represent the basic
capabilities valued by everyone.
The Human Development Index was included in this index based on its representation of
social development in countries. The level of social development in countries may indicate how
sensitive they are to extrinsic stressors or hazards such as climate change. Literature indicates
that countries with low social development and human potential may be less resilient, with
recovery from climactic events more difficult. “Developing countries, and more specifically poor
countries, bear the main human burden of climate related extreme events” (Carvajal, 2018 p. 4).
Multiple countries face climate risks, however the level of vulnerability is skewed depending on
factors including the Human Development Index score. Countries receive a score from 0-1, with
1 representing high human development.
Adaptive Capacity
Adaptive capacity is defined by the Intergovernmental Panel on Climate Change (2001)
as “the potential or capability of a system to adapt to (to alter to better suit) climatic stimuli or
their effects or impacts” (p. 894). The literature indicates that social capital, human capital and
governance structures are often key indicators of adaptive capacity (Haddad, 2005; Yohe et al.,
2006; Tol & Yohe, 2007; Vincent, 2007). In this analysis, adaptive capacity is a crucial
component when investigating social unrest in the face of climate change because the
significance of such events depends on the characteristics of the society exposed to them
ENVIRONMENTAL VULNERABILITY AND SOCIAL UNREST 35
(Auspel, 1991; Rayner & Malone, 1998; Munasinghe, 2000). Countless examples exist in the
literature that catalogue similar hazardous events occurring at different times, but having vastly
different outcomes due to societal transformations that have occurred between the events (IPCC,
2001 p. 895). For example, “…rainfall and temperature fluctuations in western Europe have far
milder effects on human well-being today (society is generally less vulnerable) than they did in
the medieval and early modern periods, essentially as a result of enhanced adaptive capacity that
reflects changes in practice, economics, and government programs” (IPCC, 2001 p. 895; Abel,
1976; De Vries, 1977; Rayner & Malone, 1998). Currently, the most notable difference in
adaptive capacity to climate events or hazards is between developing and developed countries
due to differences in coping ability (Rayner & Malone, 1998; Burton et al., 1993). Magalhaes
(1996) notes, “any extreme climatic event can become a social catastrophe when combined with
the social-political characteristics of the region, for example, the droughts and internecine wars
in Ethiopia interact to increase the adverse effects on both” (p. 48). The degree of adaptive
capacity varies greatly between regions and therefore is an important aspect in the study of
vulnerability to social unrest in the face of climate change. The factors considered most relevant
to adaptive capacity based on the literature are listed below. Unless otherwise noted, all data
were taken from the most recent year available.
2.1 Agricultural Productivity
Agricultural productivity is one dimension of food security. Food security as previously
defined is: food availability, that is the availability of sufficient quantities of food of appropriate
quality supplied through domestic production or imports; food access, meaning access by
individuals to adequate resources for acquiring appropriate foods for a nutritious diet; utilization,
meaning the utilization of food through adequate diet, clean water, sanitation and healthcare so
ENVIRONMENTAL VULNERABILITY AND SOCIAL UNREST 36
that populations reach a state of nutritional well-being where all physiological needs are met; and
stability, meaning that a population, household or individual must have access to adequate food
at all times (Food and Agriculture Organization, 2006). Studies demonstrate and scholars argue
that climate-related threats to food security have contributed to the destabilization of numerous
countries in recent decades/years.
Agricultural productivity is one of several indicators selected in this paper to represent
country-level food security. According to the Food and Agriculture Organization (2017) and the
Intergovernmental Panel on Climate Change (2014b), climate change has influenced global food
production and resulted in severe food supply shortages in some regions. Under the effect of
climate change, global food production fluctuation and uncertainty will increase (Ching-Hsien et
al., 2018). As climate change advances, there may be occurrences when food production is
unable to meet the demands of populations, thus food distribution will become more competitive
and lead to conflict (Rice & Garcia, 2011). Gross Agricultural Production will represent
agricultural productivity in this index. Gross Agricultural Production is comprised of total
harvest, produce of perennial and ornamental plants, value of growing new orchards and berry
plantations, livestock and poultry farming and animal produce at current producer prices over a
calendar year as calculated by the Food and Agriculture Administration (Food and Agriculture
Organization, 2016).
2.2 Government Effectiveness
Government effectiveness reflects perceptions of the quality of public services, the quality
of the civil service and the degree of its independence from political pressures, the quality of
policy formulation and implementation, and the credibility of the government's commitment to
such policies (The World Bank, 2016). Vallings and Moreno-Torres (2005) argue, “the central

ENVIRONMENTAL VULNERABILITY AND SOCIAL UNREST 37
driver of fragility is weak state institutions” (p.7). Poor areas are not necessarily fragile,
however fragility can occur when poverty or economic decline are combined with weak state
institutions. The primary reason for this is that states with weak institutions cannot properly or
successfully manage challenges caused by outside stressors, for example climate change. The
Food and Agriculture Organization (2008) echoes this argument, stating, “structural factors –
such as failed institutions and conflicts over land and resources – are at the root cause of most
protracted crises”.
Government effectiveness was chosen for this index because weak institutions
demonstrate clear vulnerabilities to social unrest in the face of climate impacts. This
measurement was calculated by the World Bank for the Worldwide Governance Indicators
project. It is measured with an index from -2.5 to +2.5 with -2.5 representing weak government
effectiveness and +2.5 representing strong government effectiveness. It is developed using
individual variables from multiple data sources, which are listed in Table 4.
2.3 Regulatory Quality
Regulatory quality reflects the ability of the government to formulate and implement
sound policies and regulations that permit and promote private sector development (The World
Bank, 2016). This measurement was calculated by the World Bank for the Worldwide
Governance Indicators project. It is formulated using individual variables from multiple data
sources. The individual variables are listed in Table 5. The Worldwide Governance Indicators
were created in recognition of the link between good governance and successful development.
Countries that have good governance structures are more likely able to prepare and react to
external stresses through policy formulations/changes/adaptations. One example of how good
ENVIRONMENTAL VULNERABILITY AND SOCIAL UNREST 38
governance accomplishes this is through adjusting regulatory systems to make them more
responsive and efficient in times of crisis.
Regulatory quality was chosen for this index because it may demonstrate a country’s
ability to react to climatic events through government resilience leading to a reduced likelihood
of social unrest. Countries with good governance often are at a lower risk for social unrest or
conflicts, while bad governance often coincides with countries that are less developed and are
more at risk. Regulatory quality is measured in an index from -2.5 to +2.5 with -2.5 representing
weak regulatory quality and +2.5 representing strong regulatory quality.
Results
Subsequent to factor, variable and country selection, raw data was aggregated into a
single table titled “raw data,” to more easily rank countries against each other (Table 6). Each
country was then assigned a number, one through eighteen, representing their rank in each
variable category with one being the worst. For example, one represents the country with the
greatest food supply variability and eighteen represents the country with the least. An additional
table was created to display each country ranked for every factor (Table 7). These rankings were
summed for each country and this number formed the basis for a comprehensive table displaying
the final rankings for each country with the ranks for all individual factors summed (Table 8). A
correlation matrix was then created using raw data for each country (Table 9). The correlation
matrix measured the association between the two variables chosen for the analysis. This process
was conducted to determine whether any of the two variables chosen for the analysis could be
combined because of their similarity. A strong correlation between two variables indicates that
they are strongly related therefore the inclusion of both is potentially repetitive.

ENVIRONMENTAL VULNERABILITY AND SOCIAL UNREST 39
Correlation coefficients are strongest when they are close to 1 and weak when they are
closer to 0 with -1 indicating a negative correlation. In this analysis, a correlation coefficient of
0.5 or higher was considered strong enough to report. The correlation coefficient for two factors
– previous political and ethnic strife and political stability – was 0.961 (Figure 1). This
demonstrates that these two factors are very closely related and could be combined when
conducting further analysis.
The correlation coefficient for previous political and ethnic strife and political stability
was the strongest correlation coefficient calculated in the matrix. However, three additional
correlation coefficients were above 0.5 and therefore were moderately correlated. Human
development and previous political and ethnic strife displayed a correlation coefficient of 0.546
(Figure 2). Regulatory quality and previous political and ethnic strife displayed a correlation
coefficient of 0.502 (Figure 3). Regulatory quality and government effectiveness displayed a
correlation coefficient of 0.567 (Figure 4). However, previous political and ethnic strife and
political stability are the sole factors with a correlation coefficient high enough to consider
combining measurements in future analysis. Income inequality and government effectiveness
displayed a correlation coefficient of -0.683, which indicates as strong negative correlation
(Figure 5). In practice this means that as government effectiveness decreases, income inequality
increases or visa versa. However it is worth noting that after further analysis, one data point
appeared to be an outlier and was skewing the data. After this data point was removed the
correlation coefficient was -0.25. This data point was Haiti, as it received an extremely low score
in government effectiveness and income inequality, -2.06 with -2.5 indicating weak government
effectiveness and 60.8 with 100 indicating the most income inequality.

ENVIRONMENTAL VULNERABILITY AND SOCIAL UNREST 40
The final country ranking represents which countries are in theory most vulnerable to
social unrest in the face of climate risk. Four evaluated countries received scores under 100,
meaning they ranked as some of the lowest scoring countries for individual variable rankings.
These are: Burundi, Haiti, Sudan and Djibouti. Further analysis of why these countries received
the lowest rankings can be conducted by looking at individual ranks received in each variable
category. Burundi, the lowest ranking country of the four, ranked in the top ten countries in
every category, meaning it had poor outcomes across the board. However, Djibouti had the worst
outcomes in agricultural land per capita, reliance on imports and gross agricultural production,
but did not perform nearly as poorly in key governance indicators including political stability,
corruption and regulatory quality. Haiti also was ranked one of the top ten countries in every
category, meaning it performed poorly across the board. Sudan, like Djibouti, showed more
variability in individual factor rankings. It ranked within the top ten countries for every factor
besides agricultural land per capita, inequality and gross agricultural production, where
outcomes seemed more promising. Further, it is notable that Sudan received poorest ranking in
key governance indicators including political stability, corruption, previous political and ethnic
strife, and regulatory quality and was also ranked second worst in effective governance.
Discussion
Based on the analysis herein, it is clear that countries ranked poorly for several different
reasons. Certain countries rank low because they performed poorly in limited categories, while
some rank low because they are below average in most categories. Burundi, Haiti, Sudan and
Djibouti received the worst rankings overall, however they can be grouped into two subtypes.
Burundi and Haiti received low scores across the board and were more at risk for social unrest
due to climate change than Djibouti and Sudan, who displayed relatively low scores for a subset
ENVIRONMENTAL VULNERABILITY AND SOCIAL UNREST 41
of variables and not for others. Sudan scored very poorly in variables related to governance, but
not food security, while Djibouti scored poorly in variables related to food security, but not
governance. Further analysis of the data could provide additional insights into whether individual
categories are more causative than others.
The literature clearly makes the connection between variables associated with poor
governance and instances of social unrest due to climate events. Governance, institutions and
social capital – including the level of public spending, the quality of the public health
infrastructure, access to healthcare, the transparency and legitimacy of governing institutions, the
presence of social networks and the level of social cohesion all influence the coping, response
and recovery capacities following climatic events and thus are likely to contribute to a country’s
vulnerability to social unrest from such events (Adger, 2003, 2006; Adger, Arnell, & Tompkins,
2005; Adger et al. 2009; Brooks, Adger, & Kelley, 2005; O’Brien, Hayward, & Berkes, 2009;
Termeer, Biesbroek, & Van Den Brink, 2012; Wamsler & Lawson, 2012). Further, Vallings and
Moreno-Torres (2005) argue that weak state institutions are the central driver of fragility because
they cannot manage popular grievances associated with inequitable distribution of resources. The
Food and Agriculture Organization (2008) further confirms that structural factors associated with
governance institutions, land and resources are the root cause of most unrest. Therefore it is not
surprising that that countries with poor governance indicators are more susceptible to unrest.
Vulnerability to climate impact related social unrest is clearly influenced by the presence
of political or ethnic strife previously afflicting a region. Infrastructure and complex institutions
may have already been weakened by conflict and when a climactic event occurs, those
institutions and elements of infrastructure may be less resilient and thus unprepared to respond to
events (Barnett, 2006; Barnett & Adger, 2007; Brklacich, Chazan, & Bohle, 2010). Therefore, it

ENVIRONMENTAL VULNERABILITY AND SOCIAL UNREST 42
stands to reason that countries scoring low in key governance indicators – due to previously
weakened institutions – would be at risk for social unrest due to climate impacts.
In the case of Djibouti, the literature’s identification of the challenges due to the
country receiving lower ranks in key food security variables including agricultural land per
capita and gross agricultural production cannot be overstated. The key dimensions of food
security are: availability, the availability of sufficient quantities of appropriate quality; access,
access by individuals to adequate resources for acquiring appropriate food for a nutritious diet on
a regular basis; utilization, utilization of food through adequate diet, clean water, sanitation and
health care to reach a nutritional well-being where all physiological needs are met; stability, a
population, household or individual must have access to food at all times and should not risk
losing access as a consequence of sudden shocks or cyclical events (Bora et al., 2010 p.2).
Food insecurity may result from complications, which prevent a population from
securing any of the needs listed above, however the aspect of stability is most commonly
associated with outbreaks of social unrest or more severe forms of conflict (Bora et al., 2010).
Often, external stressors like climate change can interfere with multiple aspects of food security
simultaneously. These stressors can in turn, lead to conflict (Bora et al., 2010). In relation to the
conducted analysis, Djibouti received a low ranking in the inequality category. Pinstrup-
Anderson and Shimokawa (2008), emphasize that unequal distribution of income within a
country in concert with poverty, hunger and food insecurity, “provide a fertile ground for
grievances that can be exploited by individuals and groups with a desire to cause conflict” (Bora
et al., 2010 p.3).
All but one of the most poorly ranked countries – Sudan – received an individual
score in the income inequality category that was above ten. Sudan scored 14, while Burundi,
ENVIRONMENTAL VULNERABILITY AND SOCIAL UNREST 43
Haiti and Djibouti all displayed poor outcomes in this measurement. Additionally, Burundi, Haiti
and Sudan ranked in the top ten most corrupt countries in their individual scores for the
corruption category. According to the literature, it is clear that climate change will exacerbate
growing competition for crucial resources like land and water due to desertification, salinization,
soil erosion and deforestation. The literature tells us that this competition will undoubtedly lead
to increased conflict. In countries where corruption and inequality are abundant, social unrest
may occur because foreign and domestic government actors and wealthy private actors are
buying up land to secure their own long-term food security. For example, “in Madagascar,
discontent with a land deal between the government and a foreign private corporation was a
factor in the coup that led to the ouster of the president” (Bora et al., 2010 p.4). Deals of this sort
are more likely in countries with corruption and inequality.
Messer and Cohen (2006) further emphasize the impact of inequality on conflict
potential, noting that the potential is higher when inequalities or environmental degradation lead
to extreme marginalization of large segments of the population. Bora et al. (2010) identify three
categories of triggers that may induce unrest in the face of inequality: natural, economic and
political. Natural triggers include climate change related events encompassing drought and
overall variability as seen in Ethiopia in 1973-1974 (Shepherd, 1975). Economic triggers include
price volatility in crops as was seen in Haiti and Rwanda when the principal crop and cash crops
suffered a big rise in price that deprived the populations of their previous standard of living
(Urvin, 1996). Lastly, political triggers include issues of bad governance such as the denial of
access to land or social welfare programs as was noted earlier with Madagascar and land access.
There are countless agricultural trends associated with poor governance that may
exacerbate social unrest when a country is faced with the external pressure of climate change.

ENVIRONMENTAL VULNERABILITY AND SOCIAL UNREST 44
For example, one of the variables chosen as an aspect of food insecurity, food supply variability
has many security implications. It is clear that price volatility exacerbated by climate change
creates conditions that put countries at risk for unrest. Zaman et al. (2008) point to the years
2006 to 2008 when global wheat prices almost doubled and rice prices almost tripled, leading to
a surge in domestic prices that instigated strikes, protests and riots in more than 60 countries.
Even more relevant to the analysis in this paper, most of this unrest occurred in countries that
had low performance indicators in governance (von Braun, 2008). Further, Least Developed
Countries are at increased risk for this because most fragile countries are net consumers and
therefore are more susceptible to higher global prices due to volatility caused by climate change
which directly lead to greater import costs (Bora et al., 2010).
It is also important to note that ten out of the eighteen countries in this analysis are in
Africa, with nine out of those ten in Sub-Saharan Africa. A significant body of research exists
showing the detrimental effect of climate change on Africa and Sub-Saharan Africa in particular,
in addition to social unrest associated with this change. Schlenker and Lobell (2010) combined
historical crop production and weather data with future estimates, comparing 1961-2002 relative
to 2046-2065 to estimate the yield response to climate change for five key African crops: maize,
sorghum, millet, groundnut and cassava. “In all cases except cassava, there is a 95 percent
probability that yield declines exceed 7 percent, and a 5 percent probability that they exceed 27
percent” (Bora et al., 2010 p. 6; Schlenker & Lobell, 2010). As noted several times, external
pressure on key resources – as is occurring in many parts of Africa – has the potential to provoke
social unrest.
An additional pattern associated with governance and food security that may lead to
conflict in the face of climate change is migration. “Climate change is likely to be a significant
ENVIRONMENTAL VULNERABILITY AND SOCIAL UNREST 45
factor leading to mass exodus from increasingly uninhabitable areas, and population shifts
stemming directly or indirectly from environmental pressures can place significant burdens on
migrant receiving areas” (Bora et al., 2010 p.6). Two identifiable pathways exist where
migration induced by crop loss from climate change leads to conflict. The first is environmental
degradation leading directly to emigration. The second is when resource competition and conflict
occurs in a home area producing more refugees. Gleditsch et al. (2007), notes, “migration
directly caused by environmental factors may lead to social tensions and sporadic violence in
receiving areas” (Bora et al., 2010 p.7).
There are obvious solutions to combat many of these circumstances that are easier said
than done. Strengthening local institutions, improving access and availability of food and
increasing social safety nets are a few mechanisms suggested by the literature. Social and
economic safety nets are crucial in preventing a recurring cycle of conflict due to external
climate pressures. For example, populations with the ability to return to somewhat normal
livelihoods after climate shocks will fare much better than those that cannot. Public infrastructure
must be robust enough to allow this.
Additionally, susceptibility to shocks from climate change can be reduced through
targeted national, regional and international policies. Building resilience in at-risk countries to
known global patterns that lead to increasing resource scarcity and climate destabilization
decrease the likelihood of social unrest occurring in fragile states. An integrated approach
towards increasing institutional quality will clearly increase the ability for response and recovery
to shocks (Food and Agriculture Organization, 2010). Much like the analysis conducted in this
paper, further study of exposure, susceptibility and adaptive capacity to identify at-risk countries
ENVIRONMENTAL VULNERABILITY AND SOCIAL UNREST 46
will be crucial in the prevention and mitigation of social unrest due to climate change. In
addition, informal assessments of local institutions are crucial to predicting at-risk areas.
More broadly, mitigating climate change at the global level will decrease the trend
toward catastrophic impacts that lead to further social unrest. To avoid disastrous impacts of
climate change, the IPCC suggest that greenhouse gas emissions need to be reduced 50-80
percent below 1990 levels by 2050 (UNFCC, 2010). Although success currently appears
unlikely, perhaps effective action on climate change will be motivated by a desire to limit
conflict supported by the increasingly recognized connection between the two. The international
community would surely benefit from a reduction in conflict in fragile states and the associated
economic and human losses.
As noted above, mainstream news sources are now beginning to make the connection
between climate change and events characterized by social unrest globally. With the Arab Spring
and recent conflicts in the Middle East and Africa there is a renewed focus on the drivers of this
unrest. In recent decades, extensive study and analysis has been done on the connection between
climate change and how its impacts may drive or contribute to social unrest. There is a clear
consensus in the literature that the effects of climate destabilization may contribute in large and
small amounts to recent unrest. Because of the extremely complex nature of climate change and
social unrest however, it is impossible to identify exactly which climatic event and in what
quantity contributed to these episodes of unrest, much like attempts to connect particular weather
events directly to climate change, yet we accept these connections as statistically relevant. Even
more difficult is attempting to predict how climatic events will impact vulnerable countries
across the world. However, attempting to catalogue which factors impact vulnerability is crucial
ENVIRONMENTAL VULNERABILITY AND SOCIAL UNREST 47
to avoiding or mitigating future social unrest that may result in catastrophic human impacts. This
paper aims to create an initial framework where this analysis is possible.
The approach used in this paper includes key indicators associated with aspects of
vulnerability including exposure, sensitivity and adaptive capacity to assess the risk of social
unrest in countries facing climate risks. These indicators provide literature-based metrics of
vulnerability with which to assess countries by. The primary result of the analysis identifies
which countries are most vulnerable to social unrest in the face of climate change based on the
factors chosen for consideration. The model of analysis used in Allison et al. can clearly be
adapted and applied to other forms of vulnerability analysis as demonstrated in this paper.
Data Gaps
1. Eckstein, Kunzel and Schafer (2017) emphasize that the Climate Risk Index (CRI),
“should not be regarded as the only evidence for which countries are already afflicted or
will be affected by global climate change” (p.20). An additional concern is that the
current analysis in the Global Climate Risk Index solely includes weather-related events
such as storms, floods, temperature extremes, heat waves and cold waves. These events
are important, but only represent acute instances of climate extremes. Long-term trends in
weather, for example, “decline in precipitation that was shown in some African countries
as a consequence of climate change” are not presented in the CRI (Eckstein, Kunzel, &
Schafer, 2017 p. 19). However, these trends are also clearly significant in evaluating risk
because of the impact on resource availability, in particular for agricultural productivity
and water stocks.
2. Within the food supply variability index – represented by food supply variability
kcal/capita/day – it is important to note that there were several data gaps. The database
ENVIRONMENTAL VULNERABILITY AND SOCIAL UNREST 48
from which countrywide information was drawn, FAOSTAT, did not include data for two
countries, Burundi and Sudan. Data for Sudan was provided by the Sudan Federal Food
Security Technical Secretariat, however after extensive probing, data for Burundi was not
available. This indicates uncertainties for the data utilized to rank countries by food
supply variability and for summed country rankings.
3. It is notable that the income inequality index represented by the Gini Coefficient also
contains information from over 17 years of time-span thus weakening the value of
comparisons. The Gini Coefficient data for countries ranges from 1998 to 2015 as the
most recent year of calculation.
4. It is also worth noting that countries sometimes received similar scores in the raw
variable data yet the ranking system caused them to appear further apart than they were in
reality. However the ranking system was necessary for analysis. Further, countries that
perform well in this analysis remain on the Least Developed Country and Global Climate
Risk Index lists, therefore scoring “well” in the ranking is relative.
ENVIRONMENTAL VULNERABILITY AND SOCIAL UNREST 49
References Abel, W. (1976). Mass poverty and hunger crisis in pre-industrial Europe. Hamburg, HR
Adger, W. N. (2003). Social capital, collective action, and adaptation to climate change.
Economic Geography, 79(4), 387-404
Adger, W. N. (2006). Vulnerability. Global Environmental Change 16(3), 268-281
Adger, W. N., Arnell, W. N., Tompkins, E. L. (2005). Successful adaptation to climate change across scales. Global Environmental Change, 15(2), 77-86
Adger, W. N., Dessai, S., Goulden, M., Hulme, M., Lorenzoni, I., Nelson, R. D., . . . Wreford, J.
A. (2009). Are there social limits to adaptation to climate change? Climatic Change, 93(3-4), 335-354
Ahmed, N. (2014). Behind the rise of Boko Haram: Ecological disaster, oil crisis, spy games
[Islamist militancy in Nigeria is being strengthened by western and regional fossil fuel interests].
Almond, G. A. & Bingham, J. (1966). Comparative Politics: A Developmental Approach.
Boston: Little, Brown.
Amery, H.A. (2002). Water wars in the Middle East: A looming threat. Geographical Journal 168(4), 313–323
Ausubel, J. (1991). A second look at the impacts of climate change. American Scientist 79, 211–
221
Barnett, J. (2006). Climate change, insecurity, and justice. W.N. Adger, J. Paavola, M.J. Mace, and S. Huq (Eds.). Cambridge, MA: MIT Press.
Barnes, J. (2009). Managing the waters of Baath country: The politics of water scarcity in Syria.
Geopolitics, 14(3), 510-530
Barnett, J., & Adger, W. N. (2007). Climate change, human security and violent conflict. Political Geography, 26(6), 639-655
ENVIRONMENTAL VULNERABILITY AND SOCIAL UNREST 50
Bollfrass, A., & Shaver, A. (2015). The effects of temperature on political violence: Global
evidence at the subnational level. PLoS ONE, 10(5)
Bora, S., Ceccacci, I., Delgado, C., & Townsend, R. (2010). Food security and conflict. World Bank Development Report 2011.
Brinkman, H. & Hendrix, C. H. World Food Program. (2011). Food insecurity and violent
conflict: Causes, consequences, and addressing the challenges. Rome, Italy: World Food Programme.
Brklacich, M., Chazan, M., Bohle, H. G. (2010). Human security, vulnerability, and global
environmental change. R. Matthew, J. Barnett, B. McDonald, K. O’Brien (Eds.), Global environmental change and human security (35-52). Cambridge, MA: MIT Press.
Brooks, N., Adger, W. N., Kelley, P. N. (2005). The determinants of vulnerability and adaptive
capacity at the national level and the implications for adaptation. Global Environmental Change, 15(2), 151-163
Buhaug, H., Gleditsch, N. P., & Theisen, O. M. World Bank. (2008). Implications of climate
change for armed conflict. DC, District of Columbia: World Bank.
Buhaug, H., Benjaminsen, T. A., Sjaastad, E., & Theisen, O. M. (2015). Climate variability, food production shocks, and violent conflict in sub-Saharan Africa. Environmental Research Letters 10(12), 1-11
Bulloch, J., & Darwish, A. (1993). Water wars: Coming conflicts in the Middle East. London, UK: St. Edmundsbury Press.
Burke, M. B., Miguel, E., Satyanath, S., Dykema, J. A., & Lobell, B. D. (2009). Warming
increases the risk of civil war in Africa. Proceedings of the National Academy of Sciences 106(49), 20670–20674
Burton, I., Kates, R.W., & White, G.F. (1993). The Environment As Hazard. New York, NY:
The Guilford Press.

ENVIRONMENTAL VULNERABILITY AND SOCIAL UNREST 51
Ching-Hsien, H., Huu-Sheng, L., Ming-Hwi, Y., Fang-Ching, L., Ying-Ting, L., Nobuyuki, Y., & Hsueh-Jung, L. (2017). The impact on food security and future adaptation under climate variation: A case study of Taiwan’s agriculture and fisheries. Mitigation and Adaptation Strategies for Global Change, 23(1), 311-347.
Coe, M., Foley, J. A. (2001). Human and natural impacts on the water resources of the Lake
Chad basin. Journal of Geophysical Research, 106(2001), 3349-3356
Collier, P. (2000). Greed and grievance: Economic agendas in civil wars. Boulder, CO: Lynne Rienner Publishers
Collier, P., & Hoeffler, A. (2004). Greed and grievance in civil war. Oxford Economic Papers
56(4), 563–595
Cooley, J.K. (1984). The war over water. Foreign Policy 54, 3–26
De Chatel, F. (2014). The role of drought and climate change in the Syrian uprising: Untangling the trigger of the revolution. Middle East Studies 50(4), 521-535
De Vries, J. (1977). Histoire du climat et économie: des faits nouveaux, une interprétation
différente. Annales: Economies, Sociétés, Civilisations 32, 198–227
Eakin, H., & Luers, L. A. (2006). Assessing the vulnerability of social-environmental systems. Annual Review of Environment and Resources, 31, 365-394
Eckstein, D., Kunzel, V., & Schafer, L. (2017). Global Climate Risk Index 2018. Bonn, BL:
Germanwatch.
Food and Agriculture Organization. (1998). FAOSTAT statistics database. Rome, IT: Food and Agriculture Organization.
Food and Agriculture Organization. (2006). Food security. Rome, IT: Food and Agriculture
Organization.
Food and Agricultural Organization. (2008). Food security in protracted crises: What can be done? Rome, IT: Food and Agriculture Organization.
ENVIRONMENTAL VULNERABILITY AND SOCIAL UNREST 52
Food and Agriculture Organization. (2010). When emergencies last for decades: How to improve
food security in protracted crises. Rome, IT: Food and Agriculture Organization.
Food and Agricultural Organization. (2017). The future of food and agricultural: Trends and challenges. Rome, IT: Food and Agriculture Organization.
Food and Agriculture Organization. (2018). Crop prospects and food situation. Rome, IT: Food
and Agriculture Organization.
Fearon, J. D., & Laitin, D. D. (2003). Ethnicity, insurgency, and civil war. American Political Science Review 97(1), 75–90
Gaillard, J. C. (2010). Vulnerability, capacity and resilience: Perspectives for climate and
development policy. Journal of International Development, 22(2), 218-232
Gleditsch, P., Nordas, R., & Salehyan. (2007). Climate change and conflict: The migration link. Vienna, AT: International Peace Academy.
Gleick, P. H. (2014). Water, drought, climate change, and conflict in Syria. Weather, Climate,
and Society, 6(3), 331-340.
Goldstone, J. (2002). Population and security: How demographic change can lead to violence conflict. Journal of International Affairs, 56(1), 3-22
Haddad, B. M. (2005). Ranking the adaptive capacity of nations to climate change when socio-
political goals are explicit. Global Environmental Change 15, 165–176
Hegre, H., & Sambanis, N. (2006). Sensitivity analysis of empirical results on civil war onset. Journal of Conflict Resolution 50(4), 508–535
Hendrix, S. C. (2010). Measuring state capacity: Theoretical and empirical implications for the
study of civil conflict. Journal of Peace Research 47(3), 273–285
Hendrix, S. C., & Glaser, S. M. (2007). Trends and triggers: Climate, climate change and civil conflict in sub-Saharan Africa. Political Geography 26(6), 695–715
ENVIRONMENTAL VULNERABILITY AND SOCIAL UNREST 53
Hendrix, S. C., & Haggard, S. (2015). Global food prices, regime type, and urban unrest in the
developing world. Journal of Peace Research 52(2), 143–157
Homer-Dixon, T. (1991). On the threshold: Environmental changes as causes of acute conflict. International Security 16(2), 76–116
Hsiang, S. M., Burke, M., & Miguel, E. (2013). Quantifying the influence of climate on human conflict. Science 341(6151), 1212-1235
Intergovernmental Panel on Climate Change. (2001). Climate change 2001: Impacts, adaptation
& vulnerability. Contribution of Working Group II to the Third Assessment Report of the Intergovernmental Panel on Climate Change. Cambridge, UK: Cambridge University Press.
Intergovernmental Panel on Climate Change. (2007). Climate change 2007: Impacts, adaptation, and vulnerability. Cambridge, UK: Cambridge University Press.
Intergovernmental Panel on Climate Change. (2012). Managing the risks of extreme events and
disasters to advance climate change adaptation. Special report of working groups I and II of the Intergovernmental Panel on Climate Change. C.B. Field, V. Barros, T.F. Stocker, D. Qin, D.J. Dokken, K.L. Ebi, M.D. Mastrandrea, . . . P.M. Midgley (Eds). Cambridge, UK: Cambridge University Press.
Intergovernmental Panel on Climate Change. (2013). Climate change 2013: The physical science
basis: Working group I contribution to the fifth assessment report of the Intergovernmental Panel on Climate Change. Vol. 5. Cambridge, UK: Cambridge University Press.
Intergovernmental Panel on Climate Change. (2014a). Climate change 2014: Impacts, adaptation, and vulnerability, 5. IPCC working group II report, summary for policymakers. Cambridge, UK: Cambridge University Press.
Intergovernmental Panel on Climate Change. (2014b). Climate change 2014: Synthesis report. Contribution of Working Groups I, II and III to the Fifth Assessment Report of the Intergovernmental Panel on Climate Change. R.K. Pachauri & L.A. Meyer (Eds). Geneva, CH: Intergovernmental Panel on Climate Change.

ENVIRONMENTAL VULNERABILITY AND SOCIAL UNREST 54
Ivanic, M., & Martin, W. (2008). Implications of Higher Global Food Prices for Poverty in Low-Income Countries. Policy Research Working Paper 4595. Washington, DC: The World Bank.
Johnstone, S., & Mazo, J. (2011). Global warming and the Arab Spring. Global politics and strategy, 53(2), 11-17
Jones, B. T., Mattiacci E., & Braumoeller, B. F. (2017). Food scarcity and state vulnerability: Unpacking the link between climate variability and violent unrest. Journal of Peace Research 54(3), 335-350
Kasperson, E. R., & Kasperson, X. J. (2001). Climate change, vulnerability, and social justice. Risk and Vulnerability Programme, 1-17
Kelley, P. C., Mohtadi, S., Cane, M. A., Seager, R., & Kushnir, Y. (2015). Climate change in the
Fertile Crescent and implications of the recent Syrian drought. Proceedings of the National Academy of Sciences, 112(11), 3241-3246
Keskitalo, H. C., & Kulyasova, A. A. (2009). The role of governance in community adaptation to
climate change. Polar Research, 28(1), 60-70
Land Portal Foundation. (2018). Value of food imports over total merchandise exports (%) (3-year average)
Leichenko, R.M., & O’Brien, K. L. (2008). Environmental change and globalization: Double
exposures. New York, NY: Oxford University Press.
Liverman, D. M. (1990). Vulnerability to global environmental change. Environmental change, 29(1), 47-55
Magalhães, A. R. (1996). Adapting to climate variations in developing regions: a planning
framework. Adapting to Climate Change, 44-54
Messer, E., & Cohen, M. (2006). Conflict, food insecurity, and globalization. Washington, DC: International Food Policy Research Institute.
ENVIRONMENTAL VULNERABILITY AND SOCIAL UNREST 55
Michel, D., & Yacoubian, M. (2013). The Arab Spring and climate change, sustaining the spring: Economic challenges, environmental risks, and green growth. Center for American Progress
Munich Reinsurance Company. (2012). Natural catastrophes. Munich, HR: Munich Reinsurance Company.
Munasinghe, M. (2000). Development, equity and sustainability in the context of climate change.
Climate Change and Its Linkages with Development, Equity and Sustainability, 27-29
National Research Council. (2012). Climate change: Evidence, impacts, and choices. Washington, DC: The National Academies Press.
O’Brien, K., & Leichenko, R. (2007). Human security, vulnerability, and sustainable adaptation.
New York, NY: United Nations Development Programme.
O’Brien, K., Leichenko, R., Kelkar, U., Venema, H., Aandahl, G., Tompkins, H., Javed, A., . . . West, J. (2004). Mapping vulnerability to multiple stressors: climate change and globalization in India. Global Environmental Change, 14(4), 303-313
O’Brien, K.L., Hayward, B., & Berkes, F. (2009). Rethinking social contracts: Building resilience in a changing climate. Ecology and Society 14(2), 12
Paavola, J. (2008). Livelihoods, vulnerability and adaptation to climate change in Morogoro,
Tanzania. Environmental Science & Policy, 11(7), 642-654
Pinstrup-Andersen, P., & Shimokawa, S. (2008). Do poverty and poor health and nutrition increase the risk of armed conflict onset? Food Policy 33(6), 513-520
Odjugo, P. (2005). An analysis of rainfall pattern in Nigeria. Global Journal of Environmental
Science, 4(2), 139-145
Raleigh, C., & Kniveton, D. (2012). Come rain or shine: An analysis of conflict and climate variability in East Africa. Journal of Peace Research 49(1), 51–64

ENVIRONMENTAL VULNERABILITY AND SOCIAL UNREST 56
Raleigh, C., Choi, H. J., & Kniveton, D. (2015). The devil is in the details: An investigation of the relationships between conflict, food price and climate across Africa. Global Environmental Change 32, 187–199
Rayner, S., & Malone, E.L. (1998). Human choice and climate change volume 3: The tools for policy analysis. Columbus, OH: Battelle Press
Remands, W. (1995) Water and war. Hum Volkerr 8(1), 4–14
Rice, J. C., & Garcia, S. M. (2011). Fisheries, food security, climate change, and biodiversity:
Characteristics of the sector and perspectives on emerging issues. ICES Journal of Marine Science, 68(6), 1343-1353
Riha, S. J., Wilks, D. S., & Simoens, P. (1996). Impact of temperature and precipitation
variability on crop model predictions. Climatic Change 32(3), 293–311
Salehyan, I., & Hendrix, C. S. (2014). Climate shocks and political violence. Global Environmental Change 28, 239–250
Salehyan, I., Hendrix, C. S., Hamner, J., Case, C., Linebarger, C., Stull, E., & Williams, J.
(2012). Social conflict in Africa: A new database. International Interactions 38(4), 503–511
Satterthwaite, D., Huq, S., Pelling, M., Reid, H., & Romero-Lankao, P. (2007). Building climate
change resilience in urban areas and among urban populations in low- and middle-income nations. New York, NY: Center for Sustainable Urban Development.
Sayne, A. (2011). Climate change adaptation and conflict in Nigeria. Washington, DC: United
States Institute of Peace.
Sen, A. (1981). Ingredients of famine analysis: Availability and entitlements. Quarterly Journal of Economics 96(3), 433–464
Schlenker, W., & Lobell, D. (2010). Robust negative impacts of climate change on African
agriculture. Environmental Research Letters 5(1), 1-8
ENVIRONMENTAL VULNERABILITY AND SOCIAL UNREST 57
Shepherd, J. (1975). The politics of starvation. New York, NY: Carnegie Endowment for International Peace.
Sindico, F. (2017). Climate change and security. Carbon & Climate Law Review, 11(3), 187-190
Smith, T. G. (2014). Feeding unrest. Journal of Peace Research 51(6), 679-695
Smit, B., & Wandel, J. (2006). Adaptation, adaptive capacity and vulnerability. Global
Environmental Change 16, 282–292
Starr, J.R. (1991). Water wars. Foreign Policy 82, 17–36
Steinbruner, J. D., Stern, P. C., & Husbands, J. L. (Eds.). (2013). Climate and social stress: Implications for security Analysis. Washington, DC: The National Academies Press.
Steinbruner, J. D., Stern, P. C., & Husbands, J. L. (2013). Current, sometimes overlapping categories of types of conflict [Table]. In Steinbruner, J. D., Stern, P. C., & Husbands, J. L. Climate and social stress: Implications for security Analysis. Washington, DC: The National Academies Press.
Sternberg, T. (2012). Chinese drought, bread and the Arab Spring. Applied Geology, 34, 519-524
Termeer, C., Biesbroek, R., & Van Den Brink, M. (2012). Institutions for adaptation to climate
change: Comparing national adaptation strategies in Europe. European Political Science 11(1), 41–53
Tol, R.S.J., & Yohe, G.W. (2007). The weakest link hypothesis for adaptive capacity: An
empirical test. Global Environmental Change-Human and Policy Dimensions 17, 218–227
Transparency International. (2011). Global corruption report: Climate change. Washington, DC:
Earthscan.
United Nations Environment Programme. (2007). Sudan: Post-conflict environmental assessment. Nairobi, Kenya: United Nations Environment Program.
ENVIRONMENTAL VULNERABILITY AND SOCIAL UNREST 58
United Nations International Strategy for Disaster Reduction. (2009). 2009 global assessment
report on disaster risk reduction: Risk and poverty in a changing climate. Geneva, Switzerland: United Nations.
United Nations Water. (2008). Transboundary water: Sharing benefits, sharing responsibilities.
Zaragoza, Spain: United Nations Office to Support the International Decade for Action.
United Nations. (2018). LDC Identification Criteria & Indicators. New York, NY: United Nations.
United Nations Office of the High Representative for the Least Developed Countries,
Landlocked Developing Countries and Small Island Developing States. (2018). About LDCs.
United Nations Framework Convention on Climate Change. (2010). Fact sheet: Why is a global
climate change deal so important? Bonn, HR: United Nations
U.S. Department of Defense. (2008). Climate change and international security: Quadrennial defense review report. European Commission
Uvin, P. (1996). Tragedy in Rwanda: The political ecology of conflict. Environment 38(3), 6-15
Vallings, C., & Moreno-Torres, M. (2005). Drivers of fragility: What makes states fragile?
London, UK: Department for International Development
Vincent, K. (2007). Uncertainty in adaptive capacity and the importance of scale. Global Environmental Change. Human and Policy Dimensions 17, 12–24
von Braun, J. (2008). Food and Financial Crisis: Implications for Agriculture and the Poor.
Food Policy Report. Washington, D.C.: International Food Policy Research Institute
Wamsler, C., Lawson, N. (2012). Complementing institutional with localized strategies for climate change adaptation: A south-north comparison. Disasters, 36(1), 28-53
Werrell, C. E., & Femia, F. (2013). The Arab Spring and climate change: A climate and security

ENVIRONMENTAL VULNERABILITY AND SOCIAL UNREST 59
correlations. Center for American Progress
Wolf, A.T. (2007). Shared waters: Conflict and cooperation. Annual Review of Environmental Resources 32, 241–269
Wolf, A.T., Natharius, J., Danielson, J., Ward, B., & Pender, J. (1999). International river basins
of the world. International Journal of Water Resources Development 15(4), 387–427
World Bank, Development Research Group (2015). Gini index. [Data File].
World Bank, Worldwide Governance Indicators (2016). Control of corruption [Data File].
World Bank, Worldwide Governance Indicators (2016). Government effectiveness [Data File].
World Bank, Worldwide Governance Indicators (2016). Previous political or ethnic strife [Data File].
World Bank, Worldwide Governance Indicators (2016). Regulatory quality [Data File].
Yohe, G., Malone, E., & Brenkert, A., Schlesinger, M., Meji, H., Xing, X., & Lee, D. (2006). A
synthetic assessment of the global distribution of vulnerability to climate change from the IPCC perspective that reflects exposure and adaptive capacity. New York, NY: Columbia University
Zaman, H., Delgado, C., Mitchell, D., & Revenga, A. (2008). Rising food prices: Are there right policy choices? Development Outreach 10(3), 6-8
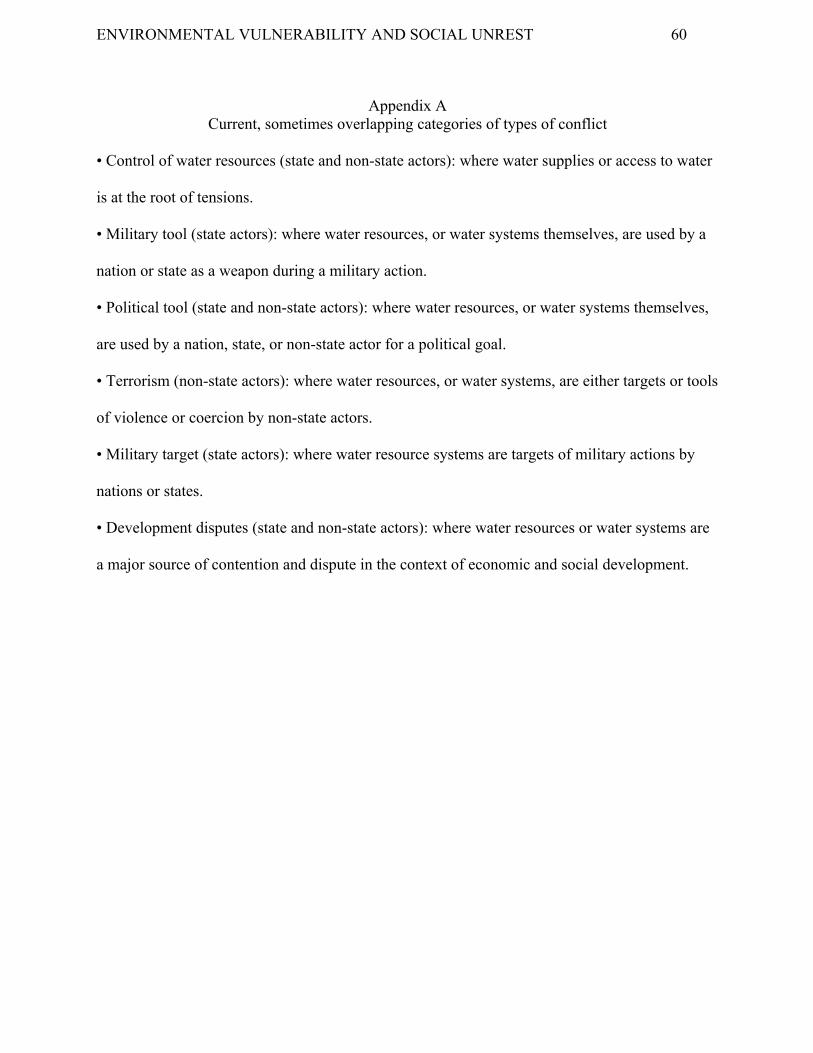
ENVIRONMENTAL VULNERABILITY AND SOCIAL UNREST 60
Appendix A Current, sometimes overlapping categories of types of conflict
• Control of water resources (state and non-state actors): where water supplies or access to water
is at the root of tensions.
• Military tool (state actors): where water resources, or water systems themselves, are used by a
nation or state as a weapon during a military action.
• Political tool (state and non-state actors): where water resources, or water systems themselves,
are used by a nation, state, or non-state actor for a political goal.
• Terrorism (non-state actors): where water resources, or water systems, are either targets or tools
of violence or coercion by non-state actors.
• Military target (state actors): where water resource systems are targets of military actions by
nations or states.
• Development disputes (state and non-state actors): where water resources or water systems are
a major source of contention and dispute in the context of economic and social development.