environmental systems analysis of municipal solid waste...
TRANSCRIPT

KTH Chemical Engineering and Technology
Environmental Systems Analysis ofMunicipal Solid Waste Management
in Chisinau, Moldova
P A V E L G A V R I L I T A
Master of Science ThesisStockholm 2006


KTH Chemical Engineering and Technology
Pavel Gavrilita
Master of Science ThesisSTOCKHOLM 2006
ENVIRONMENTAL SYSTEMS ANALYSIS OF MUNICIPAL
SOLID WASTE MANAGEMENT IN CHISINAU, MOLDOVA
Current situation and future perspectives
PRESENTED AT
INDUSTRIAL ECOLOGY ROYAL INSTITUTE OF TECHNOLOGY
Supervisors: Björn Frostell, Monika Olsson
Examiner: Monika Olsson

TRITA-KET-IM 2006:11 ISSN 1402-7615 Industrial Ecology, Royal Institute of Technology www.ima.kth.se

Environmental Systems Analysis of Municipal Solid Waste Management in Chisinau, Moldova
Current situation and future perspectives
Pavel Gavrilita
Supervisors Björn Frostell
Monika Olsson
Master of Science Thesis
Stockholm 2006


Moldova is a picturesque country - all rolling green hills, whitewashed villages, placid lakes and sunflower fields with an old-world charm that's hard to manufacture.
Source: Lonely Planet’s website


Environmental Systems Analysis of Municipal Solid Waste Management in Chisinau, Moldova Current situation and future perspectives
I
ABSTRACT The increasing scale of economic activity, i.e. industrialization, urbanization, rising standards of living and population growth, has led to a sharp increase in the quantity of waste generated. The environment has a limited capacity for waste assimilation. If too much waste enters the environment rather than being recycled or reused, the assimilative capacity of the environment is put under too much stress to be able to handle the total quantity of waste generated. Nowadays, due to improper treatment, waste management is something that affects people. In the Republic of Moldova handling of all types of waste such as municipal, hazardous, industrial etc. relies on landfilling only. This thesis is a basis for decision-making for local authorities and is about environmental systems analysis and computer modelling of municipal solid waste management in Chisinau. The ORWARE model was used for systems analysis, aiming to examine the environmental impacts that could be expected from different future alternatives (scenarios) for future municipal solid waste management. By having a strong foundation in life cycle assessment, ORWARE intends to cover the environmental impacts through the entire life cycle of waste management. The model consists of several submodels starting from the generation point; collection, transportation, biological treatment, incineration and final disposal. Moreover, the model comprises material recycling of plastics and cardboard. Different solid waste management scenarios were constructed, simulated and compared with each other. The first scenario was the current waste management in Chisinau that contains only landfilling. Three other scenarios for future waste management in (2020) were constructed and simulated. They took into consideration that a certain amount of materials will be recycled in 2020; consequently the same amount of materials was assumed to be recycled in all future scenarios. The business as usual scenario had as a basis landfilling with greater amount of waste as in the year 2005. The incineration scenario had a mixture of landfilling and incineration with energy recovery. The last scenario, the biological treatment scenario, differed from the incineration scenario in that 25% of the organic waste was treated by anaerobic digestion with biogas production and fertilizer for spreading on arable land. The simulation results show that the incineration and anaerobic digestion scenarios have great environmental advantages over the landfill scenario. Even though only one forth of the organic waste is treated biologically, the last scenario is the most environmentally friendly treatment option. If more organic waste will be separated and treated biologically, the impact will be further reduced. Economical aspects were not included in this study, due to limited time but a further analysis of the costs is necessary for a proper decision making.

Environmental Systems Analysis of Municipal Solid Waste Management in Chisinau, Moldova Current situation and future perspectives
II

Environmental Systems Analysis of Municipal Solid Waste Management in Chisinau, Moldova Current situation and future perspectives
III
ACKNOWLEDGMENT
I started my Master of Science thesis on Environmental Systems Analysis of Municipal Solid Waste in Chisinau Moldova in the middle of August 2005. I was an especially lucky student to have two exceptional supervisors in Björn Frostell and Monika Olsson. When it came to making a decision, it was very fast and effective. I am very grateful for their support, advices and our interesting discussions. I have learned a lot about environmental systems analysis, municipal solid waste management while my skills as a researcher were shaped. Thank you for your constructive comments, for being friendly and tolerant to extra meetings.
Probably, my thesis work would have required much more time to be finished if I would not have had the possibility to access the facilities at the Division of Industrial Ecology. At this cosy division, I enjoyed both the work and the social environment. I would also like to thank the teachers and colleagues from the division for the invaluable coffee breaks, lunches and different other activities that we had together. It was also really entertaining to play one of the most famous Swedish games called innebandy every Thursday with Stefan Johansson and the guys from the Chemistry Department.
What I have learned for sure is that hard work always gives a positive result. When you deal with systems analysis, the most important attribute is to be patient. I always wanted to do things at once but in the reality it does not happen like that, especially if you work with a computer model. I am proud to say that I have improved that. Thanks to Getachew Assefa who assisted me with the ORWARE model and who used to tell me dig in, be patient and you will find the mistakes. I remember those days when I used to solve three model errors with red marks and to have five or six new ones after running the model again. One day, it happened that the simulation command “runpavel” just ran … so that was the most tremendous achievement of my work.
I am grateful to my EESI colleges, course teachers and friends. I had never met so many nationalities before my studies in Sweden. It was a fantastic experience to learn about different cultures and different peoples’ perceptions. It was, nevertheless, very exiting.
Last but not least I would like to extend my gratitude and my love to my family for their never-ending care and support.
Stockholm, March, 2006
Pavel Gavrilita

Environmental Systems Analysis of Municipal Solid Waste Management in Chisinau, Moldova Current situation and future perspectives
IV

Environmental Systems Analysis of Municipal Solid Waste Management in Chisinau, Moldova Current situation and future perspectives
V
TABLE OF CONTENTS
1. INTRODUCTION ......................................................................1 1.1 STRATEGIC ASPECTS OF MSWM..................................................................................................2
Political aspects ........................................................................................................................................2 Social aspects ...........................................................................................................................................2 Economic aspects......................................................................................................................................3 Ecological aspects .....................................................................................................................................3
1.2 GOAL AND OBJECTIVES..................................................................................................................3 1.3 THE LIMITATIONS OF THE STUDY.................................................................................................3
2. THE STUDY AREA ....................................................................5 2.1 GENERAL INFORMATION ..............................................................................................................5
Economic features.....................................................................................................................................5 Environmental features ............................................................................................................................6 Why is there a need for changes? ...............................................................................................................6
2.2 SOLID WASTE IN THE REPUBLIC OF MOLDOVA .........................................................................7 2.3 CURRENT SITUATION OF MSW IN CHISINAU..............................................................................8
Composition of MSW..............................................................................................................................9 Transportation .........................................................................................................................................9 Landfill .................................................................................................................................................10
2.4 THE ANTICIPATED MSW SITUATION OF CHISINAU IN 2020...................................................11 2.5 BASELINE SCENARIO IN 15 YEARS...............................................................................................12 2.6 DESCRIPTION OF PLANNED FUTURE STRATEGY.......................................................................13
3. RESEARCH METHODOLOGY....................................................15 3.1 SOLID WASTE INVENTORY AND DATA COLLECTION...............................................................15 3.2 SYSTEMS ANALYSIS OF SOLID WASTE MANAGEMENT..............................................................15
Choice and combinations of tools.............................................................................................................16 Substance Flow Analysis (SFA) ...........................................................................................................17 Material Flow Analysis (MFA)............................................................................................................17 Life Cycle Analysis (LCA)...................................................................................................................17 Life Cycle Costing (LCC)......................................................................................................................17
3.3 GENERAL DESCRIPTION OF ORWARE....................................................................................18 ORWARE in decision-making .............................................................................................................19
3.4 SYSTEM BOUNDARIES.................................................................................................................20 Time......................................................................................................................................................20 Space .....................................................................................................................................................20 The functional unit.................................................................................................................................20
3.5 SCENARIOS ....................................................................................................................................22 3.6 SUB-MODELS .................................................................................................................................25
Solid waste sources and waste fractions....................................................................................................25 Transport ..............................................................................................................................................26 Landfill .................................................................................................................................................26 Incineration............................................................................................................................................26 Anaerobic digestion and biogas utilization ..............................................................................................27 Recycling ................................................................................................................................................27 Spreading of residues ..............................................................................................................................27 Arable land ...........................................................................................................................................28 The up-stream and compensatory system..................................................................................................28

Environmental Systems Analysis of Municipal Solid Waste Management in Chisinau, Moldova Current situation and future perspectives
VI
3.7 SIMULATIONS ................................................................................................................................30
4. RESULTS ...............................................................................31 4.1 WASTE TREATMENT IN EACH SCENARIO ..................................................................................31 4.2 FUNCTIONAL UNIT OUTPUT........................................................................................................32 4.3 ENVIRONMENTAL IMPACTS ........................................................................................................32
Global Warming Potential (GWP)........................................................................................................32 Acidification ..........................................................................................................................................34 Eutrophication.......................................................................................................................................35 Photo-oxidant VOC .............................................................................................................................36 Photo-oxidant NOx...............................................................................................................................38 Total environmental impacts ...................................................................................................................39
4.4 ENERGY TURNOVER....................................................................................................................41 4.5 MATERIALS RECOVERY................................................................................................................42
5. DISCUSSION .........................................................................43 5.1 ENVIRONMENTAL IMPACTS ........................................................................................................43 5.2 ENERGY AND MATERIALS RECOVERY .......................................................................................44
6. RECOMMENDATIONS.............................................................45
7. CONCLUSIONS ......................................................................47
REFERENCES ................................................................................48

Environmental Systems Analysis of Municipal Solid Waste Management in Chisinau, Moldova Current situation and future perspectives
VII
LIST OF TABLES TAB. 2.1 TOTAL POPULATION (THOUSANDS OF INHABITANTS) .............................................................5 TAB. 2.2 GENERATION OF WASTE IN URBAN AREAS OF THE REPUBLIC OF MOLDOVA (RM),
(THOUSANDS TONNES)........................................................................................................................7 TAB. 2.3 VOLUME OF TRANSPORTED MSW IN CHISINAU, MOLDOVA,(THOUSANDS OF M3) .............8 TAB. 2.4 CALCULATED AVERAGE COMPOSITION AND QUANTITIES OF MSW IN CHISINAU,
MOLDOVA ............................................................................................................................................9 TAB. 2.5 WASTE TRANSPORTATION TRUCKS IN CHISINAU, MOLDOVA ................................................9 TAB. 2.6 CONSUMED FUEL FOR TRANSPORTATION OF MSW TO THE LANDFILL DURING 2003 .....10 TAB. 2.6 AVERAGE WASTE COMPOSITION IN DIFFERENT COUNTRIES 2005 AND PREDICTED
MOLDOVA COMPOSITION 2020, ......................................................................................................11 (WEIGHT PERCENTAGE).............................................................................................................................11 TAB. 2.7 COMPARISON OF WASTE GENERATION RATES FOR CHISINAU IN 2004 AND ASSUMED
RATES IN 2020 ....................................................................................................................................12 TAB. 2.8 AMOUNT OF GAS EMISSIONS CONVERTED TO CO2-EQ. FROM THE LANDFILL (THOUSANDS
M3) ........................................................................................................................................................12 TAB. 2.9 BASELINE EMISSION FORESEEN IN THE MOLDOVAN-DANISH CO-OPERATION PROJECT
ON LDG CAPTURE, PROJECT ...........................................................................................................13 EMISSIONS AND EMISSION REDUCTION, (THOUSANDS M3)....................................................................13 TAB. 3.1 CONTACTED MOLDOVAN INSTITUTIONS AND ORGANISATIONS RELATED TO WASTE
MANAGEMENT ...................................................................................................................................15 TAB. 3.2 ASSUMED RECYCLING OF WASTE MATERIALS IN 2020 ...........................................................22 TAB. 3.3 AMOUNT OF WASTE IN 2004 AND ESTIMATED AMOUNTS IN 2020 (TONNES AND %) .......22 TAB. 3.4 SUMMARY OF SCENARIOS ...........................................................................................................24 TAB. 3.5 SCENARIOS 2020 AND AMOUNT OF TREATED WASTE ............................................................24 TAB. 3.6 SUMMARY OF PRIMARY PROCESSES, VARIABLES OF INTEREST AND DATA SOURCES IN
SUBMODELS ........................................................................................................................................29 TAB. 4.1 PROPORTION OF TOTAL WASTE TREATED BY DIFFERENT METHODS IN THE DIFFERENT
SCENARIOS (TONNES PER YEAR)......................................................................................................31 TAB. 4.2 FUNCTIONAL UNITS FOR 2005 AND 2020 ................................................................................32 TAB. 4.3 RELATIVE CONTRIBUTIONS TO GWP FROM CO2, CH4 AND N2O .......................................33 TAB. 4.4 ENERGY USE AND PRODUCTION FOR DIFFERENT SCENARIOS (TJ) ....................................41
LIST OF FIGURES
FIG. 2.1 MSW GENERATION IN RM, (THOUSANDS OF M3) .....................................................................8 FIG. 2.2 VOLUME OF MSW AND IW DISPOSED IN RM, (THOUSANDS OF M3) ......................................8 FIG. 3.1 HIERARCHICAL STRUCTURE OF SYSTEMS..................................................................................16 FIG. 3.2 A CONCEPTUAL DESIGN OF A PROCESS SUB-MODEL IN ORWARE......................................18 FIG. 3.3 A CONCEPTUAL MODEL OF A COMPLETE WASTE MANAGEMENT SYSTEM IN ORWARE..19 FIG. 3.4 CONCEPTUAL MODEL OF THE TOTAL SYSTEM IN ORWARE................................................21 FIG. 3.5 GRAPHICAL INTERFACE OF ORWARE MODEL FOR CHISINAU CITY...................................25 FIG. 4.1 WASTE MANAGEMENT SYSTEMS (TONNES OF TOTAL GENERATED WASTE) ......................31 FIG. 4.2 GLOBAL WARMING POTENTIAL FROM THE CORE SYSTEM (KILOTONNES OF CO2-
EQUIVALENTS) ...................................................................................................................................32 FIG. 4.3 GLOBAL WARMING POTENTIAL INCLUDING EXTERNAL SYSTEM (KILOTONNES OF CO2-
EQUIVALENTS) ...................................................................................................................................33 FIG. 4.4 ACIDIFICATION FROM CORE SYSTEM (TONNES OF SO2-EQUIVALENTS) ..............................34 FIG. 4.5 ACIDIFICATION INCLUDING EXTERNAL SYSTEM (TONNES OF SO2-EQUIVALENTS) ..........34

Environmental Systems Analysis of Municipal Solid Waste Management in Chisinau, Moldova Current situation and future perspectives
VIII
FIG. 4.6 EUTROPHICATION FROM CORE SYSTEM (TONNES OF NO2-EQUIVALENTS) ........................35 FIG. 4.7 EUTROPHICATION INCLUDING EXTERNAL SYSTEM (TONNES OF NO2-EQUIVALENTS) ....36 FIG. 4.8 PHOTO-OXIDANT VOC FROM CORE SYSTEM (TONNES OF ETHENE-EQUIVALENTS) ........37 FIG. 4.9 PHOTO-OXIDANT VOC INCLUDING EXTERNAL SYSTEM (TONNES OF ETHENE-
EQUIVALENTS) ...................................................................................................................................37 FIG. 4.10 PHOTO-OXIDANT NOX FROM CORE SYSTEM (TONNES OF ETHENE-EQUIVALENTS) ......38 FIG. 4.11 PHOTO-OXIDANT NOX INCLUDING EXTERNAL SYSTEM (TONNES OF ETHENE-
EQUIVALENTS) ...................................................................................................................................39 FIG. 4.12 ENVIRONMENTAL IMPACT OF CORE SYSTEM.........................................................................39 FIG. 4.13 ENVIRONMENTAL IMPACT OF TOTAL SYSTEM.......................................................................40 FIG. 4.14 ENERGY BALANCE FOR THE WASTE MANAGEMENT SYSTEM [TJ (1012J)] ...........................41
LIST OF MAPS MAP 2.1 MAP OF THE REPUBLIC OF MOLDOVA.......................................................................................5 MAP 2.2 MAP OF CHISINAU CITY AND THE CHISINAU LANDFILL........................................................10
ABBREVIATIONS CHP - Combined Heat and Power HDPE – High Density Poly Ethylene GWP - Global Warming Potential IW - Industrial Waste LCA – Life Cycle Analysis LCC – Life Cycle Costing LDPE – Low Density Poly Ethylene LFG - Landfill Gas MFA – Material Flow Analysis MSW - Municipal Solid Waste MSWM - Municipal Solid Waste Management NOx – Nitrogen Oxides RM – The Republic of Moldova SFA – Substance Flow Analysis TJ – Terra Joule VOC - Volatile Organic Compounds WM - Waste Management

Environmental Systems Analysis of Municipal Solid Waste Management in Chisinau, Moldova Current situation and future perspectives
IX
GLOSSARY OF TERMS Compensatory process: process of conventional production of a function, which is added to a system as a means to circumvent the problem of different functional output of systems in a comparative study Core system: part of analysed system that is directly related to the function of a system, includes those activities that may be directly affected by decisions based on the study. In this study, it mostly relates to the function of handling and treating of solid waste Down-stream process: part of analysed system that takes place as a successor of activities in the core system Environmental systems analysis: systems analysis for assessment of environmental impacts and/or natural resource use caused by the studied system (a product, service, economy, or project), often focused on quantification of material and energy flows in subsystems of nature and society and the evaluation of the future sustainability of different alternatives of action Functional unit: quantified measure of functional output from a system for use as a reference unit in a life cycle assessment Model: simplified representation of reality, in the context of this thesis generally meaning a computerized mathematical model Organic waste: solid waste mainly as food scrap, which is readily biodegradable in biological treatment such as composting or anaerobic digestion ORWARE: an acronym for ORganic WAste REsearch. It is a computer-based model for calculation of substance flows, environmental impacts, and costs of waste management. Scenario: description of a possible future situation, based on assumptions about the future, and is characterized by choice of system boundaries, allocation methods, technology, time, and space Municipal Solid Waste: refers to a mixture of different wastes with a low overall content generated by household, business, street, traditional market and industry (excluded non-hazardous materials). Sub-model: smaller, detachable entities of an entire model, i.e. landfill and incineration submodels of a model of a solid waste management system System boundary: delimitation in time, space and function between a system and its surroundings System: a set of related entity that interact with each other in some way Upstream process: part of analysed system that provides necessary input to the core system, e.g. extracting and processing resources used by the core system

Environmental Systems Analysis of Municipal Solid Waste Management in Chisinau, Moldova Current situation and future perspectives
X

Environmental Systems Analysis of Municipal Solid Waste Management in Chisinau, Moldova Current situation and future perspectives
1
1. INTRODUCTION Definition of Municipal Solid Waste The majority of human activities will inevitably result in the generation of waste, due to the imperfect utilization of energy and resources. Waste is a source of pollution and land degradation of growing concern. It seems that the production of waste cannot be avoided. The generation of waste is closely related to economic and population growth, and changes in consumption patterns. There are numerous definitions of what exactly constitutes waste, and many classifications, which attempt to categorize waste flows. According to the European environmental Protection Act (1990), “waste is any substance, which constitutes scrap material or any effluent or other unwanted surplus substance arising from the application of a process, or any substance or article, which requires to be disposed of as being broken, worn out, contaminated or otherwise spoiled”. By nature, municipal solid waste (MSW) is one of the most difficult sources of waste to manage due to its complex composition and diverse sources of generation (Read, 1999). MSW is defined to include refuse from households, non-hazardous solid waste from industrial, commercial and institutional establishments (including hospitals), market waste, yard waste and street sweepings. Management of MSW is a major responsibility of local governments. The Waste Management Hierarchy Management of waste is a complex task, which requires appropriate organisational capacity and cooperation between numerous stakeholders in the private and public sectors. Although it is essential to public health and environmental protection, solid waste management in most cities of developing countries is highly unsatisfactory. In general, there are five main categories of socially acceptable waste handling options available (waste hierarchy), namely (1) prevention, (2) re-use (3) recycling (4) waste to energy (incineration) and (5) landfilling (EU 1999). However, not every waste handling option is suitable for every category of waste. Each waste handling option has its own economic and environmental characteristics. Waste prevention or minimization is usually the most favoured waste handling option, but may be difficult to achieve in our consumer society. Re-use and recycling of waste have clear environmental advantages. By re-using and recycling materials, less virgin materials need to be used, ultimately resulting in a closed production cycle in which no or at least very few virgin materials are actually required. The economic costs of re-use and recycling, however, are substantial, and there may be technical problems preventing re-use and recycling on a large-scale. Moreover, it should be noted that even recycling and re-use might cause environmental damage. Biological treatment is also one way of recycling and it is one of the most environmentally favoured methods of the organic waste treatment. Energy can be obtained through incinerating waste. Incineration provides a major contribution to reaching the targets set by the European government for the use of energy from renewable resources. Landfilling of waste predominant until a decade ago in developed countries and still the only option in most developing countries is the least preferred option for waste treatment. Although it is relatively cheap, it also leads to relatively high environmental risks due to emissions into the air and groundwater. The Waste Management Problem The increasing scale of economic activity, i.e. industrialization, urbanization, rising standards of living and population growth, has led to a sharp increase in the quantity of waste generated. The environment has a limited capacity for waste assimilation. If too much waste enters the environment rather than being recycled or reused, the assimilative capacity of the environment is put under too much stress to be able to handle the total quantity of waste generated. This may result in pollution and resource degradation and consequently economic damage (Turner, 1995).

Environmental Systems Analysis of Municipal Solid Waste Management in Chisinau, Moldova Current situation and future perspectives
2
According to the mass balance principle, which can be derived from the second law of thermodynamics1 “mass inputs must equal mass outputs for any process”. This implies that any virgin materials used in both the production and consumption process must eventually be returned to the environment as higher entropy waste products or pollutants (Ayres, 1989). It is not yet possible to achieve a one hundred percent recycling rate. A society is, however, to some extent able to choose the quantity and quality of waste it will generate. The transformation of a useful product into waste strongly depends on the functions it has for the owner and its economic value. Waste management is inevitably linked to the economy, as waste is defined by its relative economic value. It is likewise linked to ecology, since left on its own waste is likely to affect the environment. Finally, it is a social issue, as waste is mainly a social construct and it raises the question about the responsibilities of individuals towards society (Ludwinget et al., 2003). 1.1 Strategic Aspects of MSWM To achieve a sustainable and effective waste management, development strategies must go beyond purely technical considerations to formulate specific objectives and implement appropriate measures with regard to political, social, economic and ecological aspects of municipal solid waste management (MSWM): Political aspects Political aspects concern the formulation of goals and priorities, determination of roles and jurisdiction, and the legal and regulatory framework: - Society’s goals and priorities regarding environmental protection and equitable service access
must be clearly articulated in order to mobilise popular support and resources required for their realisation.
- A clear definition of jurisdiction and roles is essential to the political sustainability of MSWM systems. The strategic plan for MSWM provides a basis for putting the defined roles of government authorities and other actors into effect.
- By laws, ordinances and regulations for MSWM should be few in number, transparent, explicit and reasonable (Schübeler et al., 1996).
Social aspects As soon as waste is out of sight it is no longer perceived as a problem. Social acceptance problems arise mainly from local opposition when new plans to build a waste treatment facility in peoples’ neighbourhood are established (Ludwing et al., 2003). Social aspects of MSWM include the patterns of waste generation and handling of households and other users, community-based waste management and the social conditions of waste workers: - Waste generation patterns are determined by people’s attitudes as well as their socio-
economic characteristics. Attitudes towards waste may be positively influenced by awareness-building campaigns and educational measures.
- Even where municipal waste collection services are provided, user cooperation is essential to efficient MSWM operations. Cooperation may be promoted through general awareness-building programmes as well as focused MSWM information campaigns (Schübeler et al., 1996).
1 The second law of thermodynamics, the law of conservation of mass/energy, states that physical processes always require conservation of energy/mass. In other words, energy and matter cannot be created or destroyed (Perman et al., 1996)

Environmental Systems Analysis of Municipal Solid Waste Management in Chisinau, Moldova Current situation and future perspectives
3
Economic aspects The economic problems of the waste are due to the fact that, by definition, waste is material with no value. Classical economic mechanisms of supply and demand controlling the flow of goods, therefore, fail for waste materials. As a consequence, they tend to accumulate in the natural environment without any measures of authorities (Ludwing et al., 2003). Economical aspects of MSWM are concerned with the impact of services on economic activities, cost-effectiveness of MSWM systems, macro-economic dimensions of resource use and conservation, and income generation: - Solid waste generation and the demand for waste collection services generally increase with
economic development. - Economic evaluation constitutes an important input to strategic planning and investment
programming for MSWM. - Measures should be introduced which discourage wasteful use of materials and encourage
waste minimisation. The best way to promote efficient use and conservation of materials is to internalise the costs of waste management as far as possible in the production, distribution and consumption phases (Schübeler et al., 1996).
Ecological aspects Industrial civilization relies on materials that are mined from enrichment deposits and are hence very different in composition from the resources that natural systems draw on. Our civilization leaves chemical footprint in the environment i.e. it changes chemical composition of some sensitive ecological compartments such as air, water, soil, etc (Ludwing et al., 2003). 1.2 Goal and objectives The goal The goal of this thesis is to provide improved knowledge and information on systems aspects of waste management in Chisinau, Moldova. Since Moldova aims to join the European Union and has signed a number of environmental agreements, current waste management (WM) definitely must be changed since it does not comply with the European Waste Regulation. The objectives 1. Provide an analysis of material flows that constitute the municipal solid waste in Chisinau. 2. Analyse current and future waste management treatment alternatives 3. Describe environmental systems analysis of waste management in general and specifically
with the ORWARE model. 4. Simulate the Chisinau waste management system in the ORWARE model. 5. Discuss advantages and disadvantages of future scenarios. 6. Based on the study results, suggest the means of achieving improvements in the Chisinau
municipal solid waste management. 1.3 The limitations of the study ORWARE consists of a number of separate sub-models. One of the challenges of this thesis is the collection of data before performing a simulation. Since Moldova is deeply focused on economical aspects of the country, such advanced environmental systems thinking as in Sweden have not developed yet. That way it is so difficult to find data and in most cases it simply does not exist even in the capital of the country, Chisinau. Thus several assumptions had to be made in order to perform the simulations. The assumptions were based on the experience from other

Environmental Systems Analysis of Municipal Solid Waste Management in Chisinau, Moldova Current situation and future perspectives
4
countries and were always discussed with my supervisors. Due to lack of data, only one stream as a source of waste including households, institutions, market, etc. were considered. Also it was quite complicated to forecast what will happen in 15 years from now. How will people’s manners change and to what extent will they become more environmentally alert in the becoming years? How much will be recycled? What will be the quality of recycled materials? Another challenge of this thesis is the timeframe, thus influencing system boundaries. The attempt to cover as much as possible is limited by the same time frame. Due to the same reason, just a few applications of ORWARE are used in this thesis, which can be seen in the subsection “ORWARE in decision-making”.

Environmental Systems Analysis of Municipal Solid Waste Management in Chisinau, Moldova Current situation and future perspectives
5
2. THE STUDY AREA The following section provides a brief description of Chisinau city, capital of the Republic of Moldova, as well as the country itself including its socio-economic and environmental features. The existing waste management system and the waste characteristics of Chisinau city are analysed. Moreover, the anticipated municipal solid waste amount and composition is also estimated. 2.1 General information The Republic of Moldova (map 2.1) is a small country, favourably situated in the south-eastern part of Europe, neighbouring Romania to the West and Ukraine to the East. With a population of 4.3 million inhabitants, it occupies a territory of 33700 km2 (slightly larger than that of Belgium), which stretches a maximum distance of 350 km from north to south and 150 km from east to west at its widest point. On August 27, 1991, the Moldovan parliament and its General Assembly declared its independence. Following Moldova’s declaration of independence in 1991, two regions of the republic subsequently declared their own independence establishing the self-proclaimed Republic of Gagauzia (comprising a region in the south of Moldova dominated by a Turkish-speaking, Christian-Orthodox population) and the self-proclaimed Republic of Transnistria (consisting of the region located on the left bank of the south-flowing Nistru river and it is not under control of Moldovan authorities). The independence of these regions was and is not recognized by the Moldovan Government, nor has it been by any other nation. The capital of the country, city of Chisinau, situated in the middle of the country and occupying 120 square km is the main administrative, economic, scientific and cultural centre of the Republic of Moldova. The population of Chisinau municipality on January 2005 was 716700 people (Tab. 2.1), which makes it the largest and the most developed city in Moldova. Map 2.1 Map of the Republic of Moldova Tab. 2.1 Total population (thousands of inhabitants) Total Urban area Rural area Chisinau municipality 716.7 647.7 69 Chisinau city 592.6 592.6 - Total population of Moldova without Transnistria
3386 1 308.8 2 077.2
Source: Internet data (Statistical Yearbook of Moldova 2004) Economic features The Republic of Moldova is an industrial-agricultural country and still remains one of the poorest countries in Europe, despite recent progress from its small economic base. Since Moldova has no mineral resources, the economy depends heavily on agriculture, featuring fruits, vegetables, wine,

Environmental Systems Analysis of Municipal Solid Waste Management in Chisinau, Moldova Current situation and future perspectives
6
and tobacco. Moldova must import almost all of its energy supplies from Russia. Energy shortages contributed to sharp production declines after the break-up of the Soviet Union in December 1991. The share of agriculture and industry in real GDP constituted 37 % in 2003. Approximately 75% of the Moldovan territory is covered by rich black soil (chernozem), which together with the mild climate, makes the country a naturally productive region for agriculture. About 51% of the country’s active population is involved in agriculture. The main products imported by Moldova are natural gas, petroleum products, transport machinery, and equipment. After independence, Moldova introduced a convertible currency, freed prices, stopped issuing preferential credits to state enterprises, backed steady land privatization, removed export controls, and freed interest rates. The economy returned to a positive economic growth of 2.1% in 2000, 6.1% in 2001, 7.2% in 2002, 6.3% in 2003, and 6.8% in 2004. The economy remains vulnerable to higher fuel prices, poor weather, and the scepticism of foreign investors. Environmental features The only existing means of waste management in the Republic of Moldova is landfilling, which in many cases is unauthorised. Currently, only 331 out of 1781 landfills fulfil international standards. Many landfills are overloaded in comparison to existing permits and are not maintained in a proper way, causing more pollution. The total surface of landfills in the country constitutes 1144 ha, with an amount of 29.4 million m3 of waste. All types of wastes; municipal, industrial, medical and hazardous are disposed of together that cause a danger to the environment and human health. In Moldova, no landfill gas capturing method is practiced, as is used in many other countries because it is not seen as a business. An important problem is the general environment impact caused by anthropogenic activities since the population is not environmentally educated. The management of waste should definitely be improved but since considerable investments are required, this development is slow. There is also an important need to achieve public participation in waste separation and recycling. Since Moldova searches membership in the European Union, it started to create strategic development plans. One of them is the Strategic Plan for social-economic development of the Republic of Moldova, whose main environmental objectives are: - Rational utilisation of non-renewable materials and transfer to alternative sources of raw
materials and energy. Start to reuse and recycle renewable resources. - Develop and promote cleaner technologies with the purpose of reducing the use of raw
materials and minimizing the generation of industrial waste until their elimination. - Maximum reduction of MSW generation, separation, composting and increased use of
secondary raw materials. Why is there a need for changes? Environmental degradation remains the most important factor contributing to a decreasing quality and longevities of life in Moldova. Due to the social and political situation, the waste management in Moldova remains at the same stage of management as 20 years ago. Until now, no sufficient actions were taken in the direction of improving the current waste management. The existing way leads to growing impacts. The recommendation from the European Union for waste management is formulated in the waste hierarchy (EU 1999): 1. Waste prevention; 2. Re-use of products; 3. Recycling of materials; 4. Recovery of energy; 5. Final disposal. This guideline seems impressive and attractive but Moldavian legislation has not supported this hierarchy by any laws. Even though a “National Program of Capitalization of Industrial and Municipal Solid Waste” was created, no serious measures were taken to change the current situation. Final disposal or landfilling is a process under almost no control with high emissions and it is the least preferable waste treatment. Due to shortcoming in technological capacity for collection, reuse and recycling, most generated waste is landfilled even though it contains useful materials such as

Environmental Systems Analysis of Municipal Solid Waste Management in Chisinau, Moldova Current situation and future perspectives
7
glass, metal., plastic etc. These materials have a value which is wasted when the products are dumped. Note: Paper production from recycled paper needs only 15-20% of the energy needed for direct paper production. It can also save around 25 m3 of water, 25% of bleaching chemicals and reduce air pollution with 95%. One recycled tonne replaces 4m3 of raw wood. Five adult trees (80-100 years of age) are needed to produce one tonne of paper. Recycling of glass reduces air pollution with 20% in comparison to the production of glass from virgin materials. It is even more important to know that glass can be reused 25-30 times before recycling. Production of one tonne of recycled glass can save such as 630 kg of sand, 40 kg of feldspar, 112 kg of limestone, 180 kg of caustic soda and other materials. Plastics constitute around 10% of the total MSW quantity in Moldova. Its decomposition takes 100 to 1000 years with a negative impact on the environment. Since MSW contains many different types of plastic, it is quite difficult to recycle it. In the view fact that plastic has a high calorific value, unsorted plastic has to be incinerated. 2.2 Solid Waste in the Republic of Moldova The composition of MSW is a mirror of society’s consumption patterns. Figures show that in developed countries, more waste is generated per capita compared to developing countries. Based on the same figures in low income areas the main components of MSW are readily bio-degradable waste, this fraction is less dominant in highly developed cities (Ludwing et al., 2003). In Tab. 2.2, the total amount of generated waste in urban areas in the Republic of Moldova divided in different types of waste is given. The greatest amount of waste in the country is produced by quarrying industry and food and drinks production industry. Due to a high demand for real estate, waste from quarrying industry is growing every year. Tab. 2.2 Generation of waste in urban areas of the Republic of Moldova (RM), (thousands tonnes)
Type of waste 2001 2002 2003 Waste of quarrying industry 235 417 943 Waste of animal production 371 485 281 Waste of foodstuff and drinks production industry 1051 1086 567 Waste of municipal economy 207 599 478 Household waste 8 4 7 Waste of inorganic chemistry 2 4 2 Waste of plant growing 48 62 47 Waste of forestry industry 17 13 15 Secondary raw materials from ferrous metallurgy 19 7 103 Secondary raw materials from non-ferrous metallurgy 1 1 3 Total 2040 2754 2538
Source: Statistical Yearbook of Moldova, 2004

Environmental Systems Analysis of Municipal Solid Waste Management in Chisinau, Moldova Current situation and future perspectives
8
2908, 33444, 7
1373, 51399, 7
1305, 81306, 2
1211, 41144, 6
11011148, 4
1143, 5
0500
100015002000250030003500
1985 1991 1995 1996 1997 1998 1999 2000 2001 2002 2003
26160 32418 24866
0
10000
20000
30000
40000
2000 2001 2003
Figure 2.1 indicates that the generation of municipal solid waste decreased considerably after the collapse of the Soviet Union. The waste generation drop is caused by fall in the demand, consequently industrial activities were reduced. Since those times, it has remained quite stable during a transition to market economy.
Fig. 2.1 MSW generation in RM, (thousands of m3) Source: Environmental Information Centre
The amount of waste disposed of varied considerably between 2001 and 2002 (Fig. 2.2). A probable explanation is a variation in industrial activity due to economical instability.
Fig. 2.2 Volume of MSW and IW disposed in RM, (thousands of m3) Source: Environmental Information Centre 2.3 Current situation of MSW in Chisinau According to the Statistical Yearbook of Moldova 2003, 29.4 million tonnes of waste were disposed of in the county. Most of the waste was produced in big cities mainly in the capital of the country. Every inhabitant in the capital produces annually 350-400 kg of MSW that constitute 1m3. A larger amount of waste, around 1.6 m3 per year, was generated by small houses residents. The generation of MSW has a grown more or less 2.5% per year since 2002. The volume of transported waste was given by Regia Autosolubritate (the waste management company in Chisinau city) can be seen in Tab. 2.3. Tab. 2.3 Volume of transported MSW in Chisinau, Moldova,(thousands of m3) 2002 2003 2004 Apartments 491 484 479 Private houses 24 26 32 Businesses, institutions, agencies 202 222 242 Transported by companies, own transport means 24 20 20 Total 741 752 773
Source: Regia Autosolubritate

Environmental Systems Analysis of Municipal Solid Waste Management in Chisinau, Moldova Current situation and future perspectives
9
Composition of MSW The average composition of MSW in Chisinau city is shown in Tab. 2.4. The quantity of each fraction was calculated based on the total volume of transported waste from the Tab. 2.3. The total volume of waste was converted to total mass of waste based on the relation 1 m3 = 0.4 tonne. With this conversion factor, the generation of waste was 300800 in 2003 and 309200 tonnes in 2004. Tab. 2.4 Calculated average composition and quantities of MSW in Chisinau, Moldova
Source: Regia Autosolubritate and own calculations Transportation All solid wastes are collected in containers and transported to the Cretoaia landfill, located 44 km from the city centre. Most of the collection and transport is carried out by the company Regia Autosolubritate. A small amount of waste is transported by big companies by means own waste transport vehicles. The transport services are provided for approximately 500 thousand inhabitants of Chisinau city and also for private companies, agencies, institutions etc. The trucks used for waste transportation and their capacity are presented in Tab. 2.5. Tab. 2.5 Waste transportation trucks in Chisinau, Moldova
Source Regia Autosolubritate The transport from the city to the landfill is carried out in 2 stages. First, waste is transported to the edge of the city by trucks with smaller capacities such 11 and 14 m3 for an average distance of 11 km. Here, waste is loaded into trucks with bigger capacity (from 35 to 50 m3). The distance from the edge of the city to the landfill is 33 km. For waste transportation, the types of vehicle
Weight percentage Quantity, tonnes Type of waste Average 2003/2004 2003 2004
Paper and carton 5.1 % 15 341 15 769 Organic substances (food rest) 64.6 % 194 317 199 743 Organic substances (leaves, branches) 3.9 % 11 731 12 059 Glass 4.1 % 12 333 12 677 Metals 3.1 % 9 325 9 585 Plastics 9.7 % 29 178 29 992 Textiles 4.9 % 14 739 15 151 Waste of construction (wood) 1.7 % 5 114 5 256 Waste of construction (stones, mortar) 2.9 % 8 723 8 967
Total 100% 300 800 309 200
Type of trucks Number of trucks Capacity, m3 GAZ 53 10 11 KO 413 10 14 MAZ 9 35 KAMAZ 17 40 MAN 7 50 Total 63

Environmental Systems Analysis of Municipal Solid Waste Management in Chisinau, Moldova Current situation and future perspectives
10
from Tab. 2.5 are used. The annual amount of consumed fuel for waste transportation can be seen in Tab. 2.6 and is included due to its impact on the environment from gas emissions to the atmosphere. Tab. 2.6 Consumed fuel for transportation of MSW to the landfill during 2003
Source: Regia Autosolubritate Landfill The landfill with an area of 19.4 ha and a capacity of 44 million m3 is located 5 km from the villages Cretoaia and Tintareni (Map 2.2).
Map 2.2 Map of Chisinau city and the Chisinau landfill
Type of fuel Quantity, thousand litres Gasoline 246 Diesel 1152 Liquid Natural Gas 424

Environmental Systems Analysis of Municipal Solid Waste Management in Chisinau, Moldova Current situation and future perspectives
11
Approximately 3000 m3 of waste is disposed of daily, 5 days per week on this landfill. Based on the initial landfill project, the thickness of each layer of waste should be 2 m which should be covered with 40 cm of soil. At the moment, this condition is not respected. Due to the absence of more advance treatment technologies, the volume of accumulated waste in the landfill is growing steadily. The annual accumulation is circa 750 thousand m3 of MSW. For instance, in 2003 it was 752 thousands m3 and in 2004 the disposed amount was 773 thousands m3. Until 2004, a total of 11500 thousand m3 of waste, representing 25% of the total capacity of the landfill, had been disposed of. There is no landfill gas collection system installed and the leachate emissions are poorly controlled. 2.4 The anticipated MSW situation of Chisinau in 2020 Currently, the MSW generation rate in Chisinau is growing steadily, by 2.5% per year. Since Moldova has a quite high GDP growth per year (2004 it was 6.8%) and the population tends to move to urban areas, it is presumed that the waste generation rate will increase up to 4% per year in the future. It is probably reasonable to assume an average growth rate of 3% per year for the next 15 years. Following this, the annual generation of waste in Chisinau may be expected to grow to 1204 thousand m3 that correspond to 482 thousand tonnes of MSW in 2020. Indeed, not only changes in the generated amount of waste may be expected but also a change in their composition. It is well known that waste composition depends on country GDP. The GDP of Moldova in 2020 was estimated based on previous years annual growth. Looking at the GDPs and waste composition of Western (Denmark, Germany, Sweden) and Eastern (Romania, Hungary, Slovakia) European countries, the future waste composition in Moldova (2020) was forecasted (Tab. 2.6). Tab. 2.6 Average waste composition in different countries 2005 and predicted Moldova composition 2020,
(weight percentage)
Source: Internet data (MSW composition in USA, European Union and Developing Countries, 2005) Here, the concentration of organic waste is considered as a development indicator of the country. The more developed a country is, the lower is the value of this indicator. This is reflected in the figures for Western Europe, where it is 27%, compared to Eastern Europe at 42%. Even though presently Moldova has a high economic growth, it will not reach the same level as the Eastern European countries in the next 15 years. It is assumed that Moldova in 2020 will approach the
Type of waste Western European Countries 2005
Easter European Countries 2005
Moldova 2005 Moldova 2020
Paper and carton 26 14 5.1 11
Organic material 27 42 68.5 55
Glass 6 5 4.1 5
Metals 4 5 3.1 4
Plastics 7 9 9.7 10
Textiles 2 5 4.9 5
Bulk 3 0 0 0
Other waste 25 20 4.6 10

Environmental Systems Analysis of Municipal Solid Waste Management in Chisinau, Moldova Current situation and future perspectives
12
Romanian development level in 2004. That way it was assumed that the fraction of organic waste will be reduced from 68% to 55% and not less between the year 2005 and 2020. With the same assumption, the function of paper and carton was expected to increase from 5 to 11% during the same period of time. Other types of waste were assumed to maintain their relative generation rates. In Tab. 2.7, the generated amount of MSW in 2004 has been compared to the anticipated amounts in 2020. A considerable increase (more than 3 times) in the generation of paper and carton waste is anticipated. The generation of plastic, metals and textile waste will increase by a factor of two in the same period. Tab. 2.7 Comparison of waste generation rates for Chisinau in 2004 and assumed rates in 2020
2004 2020 Type of waste % tonnes % tonnes
Paper and carton 5.1 15 769 11 53 020 Organic material 68.5 211 802 55 265 100
Glass 4.1 12 677 5 24 100 Metals 3.1 9 585 4 19 280 Plastics 9.7 29 992 10 48 200 Textiles 4.9 15 150 5 24 100
Bulk 0 0 0 0 Other waste 4.6 14 223 10 48 200
Total 100 309 000 100 482 000 Source: Regia Autosolubritate and own calculations for 2020 2.5 Baseline scenario in 15 years The amount of generated waste is steadily growing. Business-as-usual for current landfill means no gas capturing and all green house gases will be emitted to the atmosphere (Tab. 2.8). No landfill gas (LFG) capturing leads to an increase of other environmental (gas and leachate emissions) and social (odour, disease) impacts. Due to the absence of protecting liner and a collection system in the landfill, leachate can easily infiltrate into the soil and migrate to surface and groundwater environments. Because groundwater is the main drinking water resource in Moldova, it is clear that migration of leachate to groundwater poses a real risk to human health. Air emissions constitute another considerable impact. Landfill gas contains a high methane concentration and methane is well known as a strong contributor to global warming. Tab. 2.8 Amount of gas emissions converted to CO2-eq. from the landfill (thousands m3)
Converted to CO2 equivalents, tonnes CO2/year 2005 2010 2015 2025 2005-2011 2012-2018 LFG emissions 109.478 130.728 147.277 89.328 857.116 970.682 Source: Internet data (Danish Project ”Landfill Gas Capturing and Flaring at Chisinau landfill, Moldova”)

Environmental Systems Analysis of Municipal Solid Waste Management in Chisinau, Moldova Current situation and future perspectives
13
2.6 Description of planned future strategy There is no collection of landfill gas at the Chisinau landfill. Likewise, there are no specific present or planned national guidelines or regulations, which prescribe the installation of gas handling or its utilisation. Moldova has adopted Climate Change Conventions and ratified the Kyoto Protocol. The first National Communication states that emission reductions should be aimed at. No measurable and time-bound targets have been set so far and no CO2 reduction technologies have been appointed as preferred or recommended. Neither have relevant requirements for emission reductions from landfills been posed at the national nor at the municipal level. “The landfill gas capture and flaring at Chisinau landfill” project was proposed by the Danish Co-operation for Environment in Eastern Europe in 2004. The predicted reductions in landfill gas emissions are given in Tab. 2.9. The project host Regia Autosolubritate is a private company in charge of MSWM in Chisinau. The Danish-Moldovan co-operation project was aimed at landfill gas extraction, followed by gas burning in an open flare to reduce green house gas emissions. The highest emissions during the project (2005-2018) are expected to be 17.8 million m3 of gas of which 8.9 million m3 of methane. Later during the project, a conversion from gas to electricity generation is foreseen. An additional benefit of the project is the improvement of operational procedures at the landfill, thereby improving the environmental aspects of the day to day operations of the landfill. The expected life time for the LFG recovery pipes is minimum 25 years, for the pumping unit 15-20 years and for the gas combustion unit 15-20 years. The LFG capture and utilisation technology to be implemented is based upon well known technology from west European countries. The project was planned to be started on the 1st of January 2005 but has not been realised yet due to unknown reasons. An additional plan that has been discussed is the construction of an incineration plant. There has been and still are many discussions going on about this potential solution. At the moment, it is quite difficult for the Moldavian authorities to implement it, due to the high investment cost. At the same time, it has so far proven difficult to manage interests with foreign investors. Until now, there is no decision about the construction and it is uncertain whether there will be any in the future. Tab. 2.9 Baseline emission foreseen in the Moldovan-Danish co-operation project on LDG capture, project
emissions and emission reduction, (thousands m3) Converted to CO2 equivalents, tonnes CO2/year
LFG emissions 2005 2010 2015 2025 2005-2011 2012-2018 Baseline emissions 109.478 130.728 147.277 89.328 857.116 970.682 Project emissions 54.739 65.364 73.639 26.798 428.558 551.355 Emissions reduction 54.739 65.364 73.639 26.798 428.558 419.327 Source: Internet data (Danish Project ”Landfill Gas Capturing and Flaring at Chisinau landfill, Moldova”)

Environmental Systems Analysis of Municipal Solid Waste Management in Chisinau, Moldova Current situation and future perspectives
14

Environmental Systems Analysis of Municipal Solid Waste Management in Chisinau, Moldova Current situation and future perspectives
15
3. RESEARCH METHODOLOGY 3.1 Solid waste inventory and data collection As every study, this one with no exceptions started with gathering information. For this, questions were formulated and relevant stakeholders were identified. - What is the total amount of generated Municipal Solid Waste (MSW) and Production Waste
in the Republic of Moldova and Chisinau? - What are the main sources of waste generation in Chisinau city? - What is the composition of MSW in fractions of paper, plastic, glass, metal., rubber, textile,
organic waste, street waste? - Current management of MSW? Who is responsible for collection, transportation and
disposal? - Transportation of MSW (distances and fuel consumption)? - Does the municipality have any projects for building up new treatment facilities? - The institutions and organisations related to the waste field that were visited, contacted by
phone and/or by email have been listed in Tab.3.1. Tab. 3.1 Contacted Moldovan institutions and organisations related to waste management The Ministry of Ecology and Natural Resources The Regional Environmental Centre The Department of Statistics and Sociology of Republic of Moldova The Environmental Movement of Moldova The Environmental Informational Centre of Republic of Moldova The Municipality of Chisinau The Central Environmental Agency Regia Autosolubritate - a private company responsible for waste collection and disposal in Chisinau city Source: Own 3.2 Systems analysis of solid waste management When a complex problem exists, a systems analysis is often of great help. Systems analysis can provide great help, even if it does no more than highlight relevant information or indicate that certain actors offer little hope of bringing about improvement. In most cases, the analysis may even point at a course of action that will bring about the desired changes, a course that can be recognised as the most advantageous and implemented by those with authority to act. Anything in society or nature may be described as a system consisting of sub-systems and itself acting as a sub-system in a larger context forming a sort of hierarchical structure. A system can be viewed as a hierarchical structure (Fig 3.1) of more and more detailed sub-systems (Gustavsson et al., 1982). “A systems analysis commonly focuses on a problem arising from interaction among elements in society, enterprises and the environment, considers various responses to this problem and supplies evidence about the consequences” (Miser & Quade, 1985). “System analysis brings to bear the knowledge and methods of modern science and technology, in combination with concept of social goals and equities, elements of judgement and taste and

Environmental Systems Analysis of Municipal Solid Waste Management in Chisinau, Moldova Current situation and future perspectives
16
appropriate consideration of the large contexts and uncertainties that inevitably attend such problems” (Miser and Quade, 1985).
Fig. 3.1 Hierarchical structure of systems Source: Own In the research plan which is the guiding statement for research conducted at the division of Industrial Ecology at the Royal Institute of Technology, environmental system analysis is defined as:” …models and methods for integrated quantification and presentation of materials and energy flows in different subsystems of nature and society and the evaluation of the future sustainability of different alternatives of action” (Industrial Ecology, 1997). Systems analysis is simply the analysis of systems. Its purpose is generally to help in decision-making and planning of complex systems such as the waste management system. The interaction among elements is done through systems analysis. By understanding the behaviour of the subsystems and the linkage between them, the effects can be estimated. The subsystems and their linkage can be described in some kind of model, a simplified abstraction that could be a computer model, consisting of a mathematical description of the system. The aim of modelling a system is to introduce an increased flexibility in the possibilities to investigate different cases (Björklund, 1998). Choice and combinations of tools The idea of tools is broad and includes everything from physical tools to computer software to methods and processes. To date, many of the tools to support environmental decisions have been developed with an analytical mode of decision-making in mind. All of them are based on the principle that systematic gathering and analysis of information is the best route to an optimal decision. It is difficult to specify universal criteria for choosing among tools (Dale et al., 1999). There are more or less ten tools with different features and basis that could be combined for Environmental Decision Support. According to Brattebro (2001), assessment tools can be based on quantitative and qualitative tradition. The qualitative approach is desirable since it is difficult to manage something that is not measured. Among quantitative tools are e.g. Material Flow Analysis, Substance Flow Analysis, Life Cycle Assessment and Life Cycle Costing. The qualitative group is a logical complement to a quantitative approach and includes among others, Interviews, Scenario Analysis (forecasting/backcasting), Panels and Consensus Conferences. A classification cannot always be done in a clear manner since there are qualitative elements within the qualitative tools and vice-versa.
System
Sub-system Sub-system Sub-systemSub-system

Environmental Systems Analysis of Municipal Solid Waste Management in Chisinau, Moldova Current situation and future perspectives
17
Discussions concerning possibilities of combining different tools have been going on at different levels. Combinations of tools are important in both avoiding problem shifting and compensating for weaknesses in tools (Wrisberg et al., 2002). As mentioned in Eriksson (2002) and Björklund (2000), Life Cycle Assessment (LCA), Material Flow Accounting (MFA), Substance Flow Analysis (SFA) and Life Cycle Costing (LCC) are the major contributors to the method ORWARE. Substance Flow Analysis (SFA) SFA can be used to trace sources of environmental problems, discover potential future problems, or form a basis for regulations in substance handling. It is based on the thermodynamic law of mass conservation and accounts in physical units the flows of selected materials through a certain area. It is closely related to LCA, in that it is one of the means to provide input data to the LCA. SFA may serve goals such as error check of inventory data, identification of missing flows or hidden leaks in society, identification of problem flows and causes of environmental problems, monitoring, prediction of effectiveness of pollution abatement measures, possible shifting of problems caused by redirected substance flows or screening to identify issues for further investigation with other analytical tools (Björklund, 1998). Material Flow Analysis (MFA) MFA is used to describe the static situation of different material flows and to handle a large number of physical flows. MFA is a wider concept than SFA and may include e.g. bulk material flows. Flows such as total solids and polycyclic aromatic hydrocarbons as well as single elements such as chlorine and copper may be followed. In the current ORWARE model, the flow of over 50 parameters can be followed simultaneously (Eriksson et al., 2002). MFA is used to comment on the materials throughput or the materials intensity of national economies, important sectors or large functional systems and therefore concentrates on mass flows. SFA is used to identify the causes of specific pollution problems in the economy and find possibilities for amending or preventing those problems and therefore is concerned with the flows of specific substances. Generally, MFA stops at the border of the environment, while SFA also considers the environmental flows (Bringezu, 1997). Life Cycle Analysis (LCA) During the last decade, LCA has appeared as a new approach to analyse environmental impacts of waste management. The basic idea of LCA is to evaluate the potential environmental impact associated with a product over its entire life cycle (ISO, 1997). A product may be either a material product or a service with focus on the function provided. LCA fulfils the purpose of identifying, quantifying and assessing the impact of energy and material use related to a product from raw materials acquisition through production, use and disposal, commonly known as “from cradle to grave”. LCA is a tool for comparative assessments, either between different products providing similar functions or between different life cycle stages of a product in an improvement analysis. A waste management system can be described as a service, the function of which is to collect, transport, and treat waste from a certain area in an adequate manner. Life Cycle Costing (LCC) Many traditional cost-accounting systems lead to incorrect investment decisions concerning environmental costs (Bennett, 1997). LCC is a tool that looks at the entire life cycle of a product, process or activity and calculates the entire life cycle cost, which includes all internal costs plus external costs, incurred throughout the entire life cycle. LCC aims at the analysis of the processes in connection with a given function, like LCA. Environmental impacts in comprehensive LCC can be translated into monetary metrics at three stages. By translating the information to a monetary dimension, it is possible that decision-makers would include environmental concerns in

Environmental Systems Analysis of Municipal Solid Waste Management in Chisinau, Moldova Current situation and future perspectives
18
the investment decision. However, even though LCC might translate environmental information into more familiar units, uncertainties pose special problems concerning cognitive and motivational influences on decisions that are the decision maker's personal view of reality. This may affect what parameters that are considered in the calculation (Ajzen & Fishbein, 1977). Examples are initial interventions as emissions of CO2, “midpoint effects as increasing acidity in water bodies and impacts on endpoints as the fish kill and lose of biodiversity resulting from increased acidity”. LCC uses different costing approaches and techniques that may vary from case to case, depending on where in the impact chain the impacts are assessed (Assefa, 2002). Even if not theoretically accurate, the results from an LCC calculation might provide at least an indication of which strategic decisions should be made (Gluch & Baumann, 2004). 3.3 General description of ORWARE ORWARE (ORganic WAste REsearch) is a tool for environmental systems analysis of waste management. It is a computer-based model for calculation of substance flows, environmental impacts and costs of waste management. It was first developed for systems analysis of organic waste management, hence the acronym ORWARE but now covers inorganic fractions in municipal waste as well. ORWARE consists of a number of separate sub-models, which may be combined to design a waste management system for e.g. a city, a municipality or a company. A first description of the ORWARE model was given by (Dalemo et al., 1997). All process sub-models in ORWARE calculate the turnover of materials, energy and financial resources in the process, Fig. 3.2.
Fig. 3.2 A conceptual design of a process sub-model in ORWARE Source: Municipal solid waste management from a system perspective (Eriksson and Frostell, 2001)
Processes within the waste management system are e.g. waste collection, anaerobic digestion or landfill disposal. Materials turnover is characterised by the supply of waste materials and process chemicals and by the output of products, secondary wastes, and emissions to air, water and soil. Energy turnover is use of different energy carriers such as electricity, coal, oil or heat, and recovery of e.g. heat, electricity, hydrogen or biogas. The financial turnover is defined as costs and revenues of individual processes. A number of sub-models may be combined to a complete waste management system in any city or municipality (or other system boundary). Such a conceptual ORWARE model of a complete waste management system is shown in Fig. 3.3.
Products
Emissions
Energy
Revenues
Additional materials
Energy
Costs
Sub-model
for
waste management
Waste
Secondary Waste
Environmental Systems Analysis of Municipal Solid Waste Management in Chisinau, Moldova Current situation and future perspectives
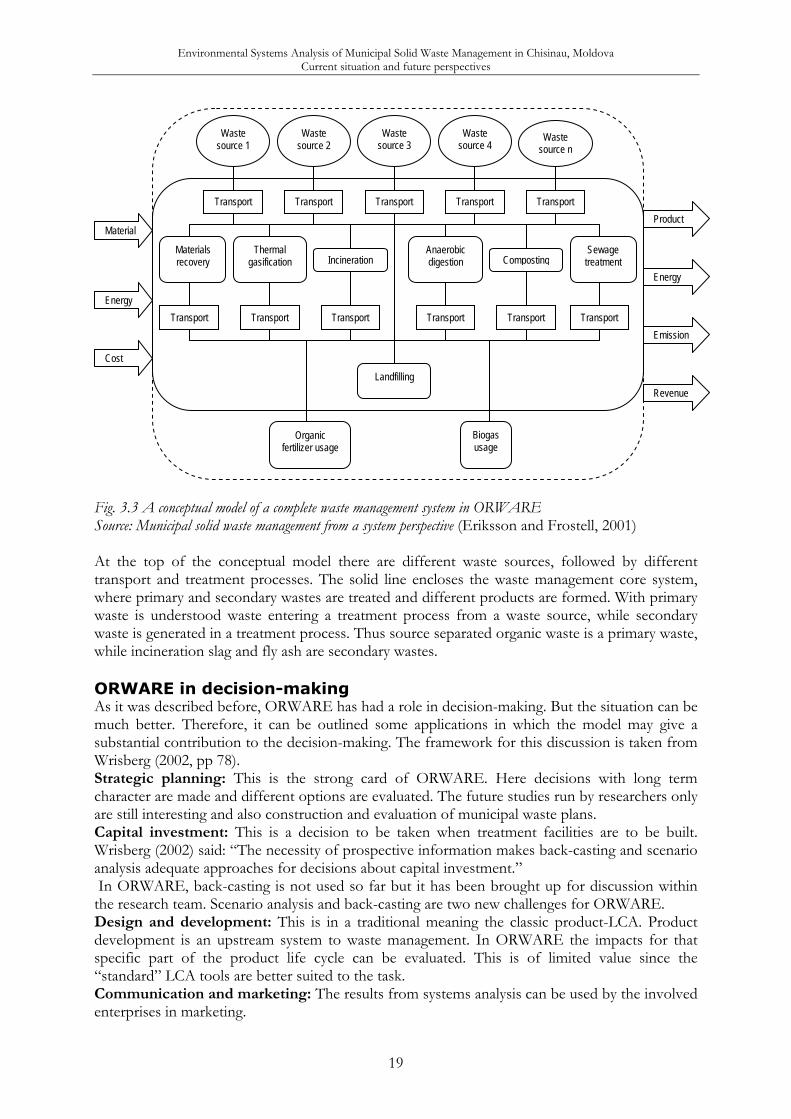
19
Fig. 3.3 A conceptual model of a complete waste management system in ORWARE Source: Municipal solid waste management from a system perspective (Eriksson and Frostell, 2001) At the top of the conceptual model there are different waste sources, followed by different transport and treatment processes. The solid line encloses the waste management core system, where primary and secondary wastes are treated and different products are formed. With primary waste is understood waste entering a treatment process from a waste source, while secondary waste is generated in a treatment process. Thus source separated organic waste is a primary waste, while incineration slag and fly ash are secondary wastes. ORWARE in decision-making As it was described before, ORWARE has had a role in decision-making. But the situation can be much better. Therefore, it can be outlined some applications in which the model may give a substantial contribution to the decision-making. The framework for this discussion is taken from Wrisberg (2002, pp 78). Strategic planning: This is the strong card of ORWARE. Here decisions with long term character are made and different options are evaluated. The future studies run by researchers only are still interesting and also construction and evaluation of municipal waste plans. Capital investment: This is a decision to be taken when treatment facilities are to be built. Wrisberg (2002) said: “The necessity of prospective information makes back-casting and scenario analysis adequate approaches for decisions about capital investment.” In ORWARE, back-casting is not used so far but it has been brought up for discussion within the research team. Scenario analysis and back-casting are two new challenges for ORWARE. Design and development: This is in a traditional meaning the classic product-LCA. Product development is an upstream system to waste management. In ORWARE the impacts for that specific part of the product life cycle can be evaluated. This is of limited value since the “standard” LCA tools are better suited to the task. Communication and marketing: The results from systems analysis can be used by the involved enterprises in marketing.
Waste source 1
Waste source 2
Waste source 3
Waste source 4
Transport Transport Transport Transport
IncinerationThermal
gasification Materials recovery
Anaerobic digestion
Landfilling
Biogas usage
Waste source n
Transport
CompostingSewage
treatment
Transport Transport Transport Transport Transport
Organic fertilizer usage
Material
Energy
Product
Energy
Emission
Cost
Revenue
Transport

Environmental Systems Analysis of Municipal Solid Waste Management in Chisinau, Moldova Current situation and future perspectives
20
Operational management: The type of model ORWARE is representing, may not be the most suitable but systems analysis performed by very simple models can be of interest. Just using the material flow analysis part of ORWARE is perhaps a more simple form of systems analysis that is easier to adapt to day-to-day analysis. Policy/legislation: Systems analysis is useful to map the problem area and maybe to sort small things from large. Systems analysis and ORWARE can also be used for quantification. But systems analysis can only be a small part of the total basis for a decision about new policies and legislation. 3.4 System Boundaries System boundaries delimit the system under study from its surroundings. It determines what should and what should not be analysed and have a large influence on the result and conclusion of the analysis. For this thesis, the system boundaries are set to fit the cradle to grave perspective of the waste entered. Essentially, there are tree dimensions of which system boundaries should be defined; time, space and function. It depends on the scope in an analysis of a certain system. The temporal system varies between different studies and sub-models. Annual averages are used for most of the input data but for the landfill model and the arable land, long-term effects are also included. The system boundaries in ORWARE are strictly connected to the core function of collecting and treating waste. Depending on the structure of the waste management system, this may also be a geographical or political boundary. Consumption of energy and resources, production of energy, emissions to the air and water and residual effluents are related to the quantity and composition of the material flow to the process. Besides the core function, treatment of a certain amount of waste, additional functions such as district heating, electricity generation, phosphorus (fertiliser) and nitrogen may be delivered from the waste management system (Björklund, 1998). Time The period of the analysis must be delimited to define the time span (years, centuries or other) for which inputs and outputs of the system should be included. The ORWARE calculates the impact caused by handling and treating waste generated during one year in a selected area. The emissions mainly occur during that same year but in the case of landfilling, long-term emissions are included. Generally, scenarios are designed to mirror a not too distant future from the present, ten to fifteen years from today (Björklund, 2000). Space The geographical boundaries of the analysis may be determined by for instance political boundaries (e.g. a municipality, county or nation) or natural boundaries (e.g. an ecosystem, lake or watershed). In ORWARE, the special boundaries of the core system are the geographical boundaries of the waste collection system. Emissions and resources depletion are, however included regardless of where they occur (upstream systems, core systems or downstream systems). In Moldova, more than one fifth of the total population and almost 45% of industries are located in Chisinau. Currently, all the waste from the city is disposed of in the only existing landfill, situated 44 km from the city centre. As a geographical system boundary for this thesis was considered the city of Chisinau including the landfill site. The functional unit The main function of solid waste management is to treat the solid waste generated within the studied area. Other functions, e.g. providing different kinds of products from waste recovery are

Environmental Systems Analysis of Municipal Solid Waste Management in Chisinau, Moldova Current situation and future perspectives
21
also possible nowadays. Functional units form the basis for impact quantification, meaning that all scenarios must fulfil a number of functions to the same degree. The functional unit should be clearly defined (ISO, 1998) and could be:
- Manage one year’s waste generation from a selected area - Produce a certain amount of electricity - Produce a certain amount of phosphorus fertiliser, etc.
In order to achieve a just comparison between the scenarios, functions not present in a certain system have to be compensated for. The compensation of functional units in ORWARE is achieved by expanding the system boundaries to include different so called compensatory processes (Eriksson, 2003). As the system boundary in ORWARE follows an LCA perspective, it should include in principle all processes that are connected to the entire life cycle. This is done by enlarging the core system (the waste management system) to take into account relevant up-stream (e.g. energy generation) and down-stream (e.g. biogas usage) activities and processes. According to Eriksson (2003), up-stream material flows associated with the use of energy carriers in the core system are included in the ORWARE model. In a similar way, down-stream flows associated with the spreading of organic fertilizer from biological treatment may be included in the analysis. Compensatory processes also have up-stream and down-stream processes. Therefore, the conceptual model of the total system in the ORWARE is now enlarged comprises the core system, the compensatory system and their relevant up-stream and down-stream systems, as illustrated in Fig. 3.4.
Fig. 3.4 Conceptual model of the total system in ORWARE Source: Municipal solid waste management from a system perspective (Eriksson and Frostell, 2001)
Waste Management
System
Compensatory Systems
Upstream Systems
Functional Units
Material and energy flows
Material and energy flows
Downstream Systems

Environmental Systems Analysis of Municipal Solid Waste Management in Chisinau, Moldova Current situation and future perspectives
22
3.5 Scenarios In the waste management system, a scenario is described as a description of the core system, which consists of a treatment method. Scenarios are designed to provide a certain function and then compared for different environmental impact categories and energy consumption. The results are calculated for all parts of the waste management system and compensatory system but may be analyzed from different angles to reveal different interesting aspects of the system (Eriksson, 2003). These scenarios offer a quantitative look ahead and a way to think about today's choices from the perspective of the future. As such, scenarios can help to free us from the grip of the past and enable us to prepare for a future that will surely be different from today. In the present study, four different scenarios were investigated, considering an improvement in the Chisinau waste management system, by phasing out landfill as the major treatment to biological treatment and incineration. The current situation (Landfill 2005) is compared to tree different scenarios established for the year 2020 (Landfill, Landfill + Incineration, Landfill + Incineration + Anaerobic Digestion). Tab. 3.2 Assumed recycling of waste materials in 2020
Type of waste % Paper and carton 20 Organic waste 25 Glass 60 Metals 10 Plastics 40 Source: Own estimations In all 2020 scenarios, material recovery is included. Material recovery is nowadays practiced in Chisinau mainly in big industries or better to say, big waste sources, especially when the wastes are not mixed. This waste is not considered in the present thesis, since it is collected by private companies and no data was available. Recycling of waste was considered to be zero in 2005 and was assumed to grow up to figures given in Tab. 3.2 since by that time source separation of waste will certainly be introduced. Due to a lack of data, a number of assumptions were made based on telephone conversations with Moldovan authorities’ (Tab. 3.3). Tab. 3.3 Amount of waste in 2004 and estimated amounts in 2020 (tonnes and %)
2004 2020 Type of waste % tonnes % tonnes
Paper 40 6 308 60 31 812 Paper and carton Carton 60 9 461 40 21 208
LDPE 40 11 997 40 19 280 Plastic HDPE 60 17 995 60 28 920
Non-combustible 65 9 245 65 31 330 Other waste Combustible 35 4 978 35 16 870
Source: Own estimations

Environmental Systems Analysis of Municipal Solid Waste Management in Chisinau, Moldova Current situation and future perspectives
23
Paper and carton constitute nowadays 5.1 % and plastic represent 9.7 % of total amount of generated waste. Based on previous assumptions (Tab. 2.7) for 2020, an increase in paper and carton recycling to 11 % and plastic to 10 % is expected. Category of other waste with 4.5 % in 2005 and 10 % in 2020 include construction waste with a share of non-combustible 65 % and combustible waste 35 %. 1. Landfill 2005 The Landfill 2005 scenario serves as a reference of the current waste management system in Chisinau. The total amount of solid waste (309 thousand tonnes) collected by the municipality is disposed of on the landfill. Generated solid waste is discarded without source separation of recyclable materials by households, business, etc. 2. Landfill 2020 In this scenario, the solid waste management works in a similar way to the Landfill 2005. It differs only in the annual amount of solid waste generated within the city, which is projected to be 482 thousands tonnes plus a partial recovery of recyclable materials. A so called ‘business as usual’ scenario is thus formed, enabling a comparison of its impacts to the first scenario. It is also utilized to illustrate some environmental impacts that can be avoided by changing to better options, i.e. the next other two scenarios. Therefore, this second scenario is considered as the future reference case, with which the two last scenarios were compared. 3. Landfill + Incineration in 2020 This scenario was selected in accordance with the current discussion about the future waste management of the city. Incineration was assumed to be the core of waste treatment. Organic waste was included in the portion of waste allocated for incineration. The incineration plant was assumed to be similar to the Högdalen incineration plant in Stockholm since here the organic fraction is not collected separately and is combusted besides other MSW fractions. Bottom ash was assumed to be used as a construction material and fly ash due to its toxicity disposed of to the hazardous waste landfill site (EC Waste Landfill Directive, 1999). The rest of the collected solid waste (non-combustible waste) will still go to the landfill. As a source separation has been introduced, a part of the recyclable materials would be collected separately. A greater separation of recyclable material is not expected, due to a lack of environmental awareness. In the view fact that the incineration plant is located at the edge of the city centre to optimise energy delivery and waste transport, the average waste transport distance is only 11 km. 4. Incineration + Anaerobic Digestion in 2020 This scenario is based on incineration and anaerobic digestion as the two most important treatment technologies forming the core of the waste treatment system. This treatment option provides heat and electricity from incineration and biogas plus compost product from anaerobic digestion. The hazardous landfill is used to dispose of fly ash from incineration. The recycling of materials was assumed to be the same as in the third scenario. A summary of characteristic features of the established scenario is presented in Tab. 3.4. Functional units taken in consideration in this thesis are: 1. The main function is treatment of certain amount of solid waste generated annually in the city (309 thousands tonnes in 2005 and 482 thousands tonnes by 2020) 2. Production of district heating 3. Production of electricity 4. Production of biogas as a vehicle fuel 5. Production of fertilizer

Environmental Systems Analysis of Municipal Solid Waste Management in Chisinau, Moldova Current situation and future perspectives
24
Tab. 3.4 Summary of scenarios Scenario Features
Landfill 2005
There is no source separation and no sorting of recyclable materials; All MSW in a quantity of 309 thousand tonnes is landfilled; There is no landfill gas capture and no energy recovery; Waste is transported an average distance of 44 km.
Landfill 2020
The same scenario as Landfill 2005, larger waste amount (436000 tonnes); A part of recyclable materials (46000 tonnes) is sorted out; Waste is transported an average distance of 44 km.
Landfill +
Incineration 2020
A part of recyclable materials (46000 tonnes) is sorted out; Incineration of 78% of mixed waste; Heat and electricity are recovered from incineration; The rest of solid waste is landfilled; Only rejected materials from incineration are landfilled; Waste is transported an average distance of 44 km to the landfill and 11 km to the incineration plant.
Landfill +
Incineration +
Anaerobic Digestion
2020
A part of recyclable materials (46000 tonnes) is sorted out; Anaerobic Digestion of 25% of organic waste or 14% of total waste; Incineration of 64% of mixed waste; Heat and electricity are recovered from incineration; 100% of biogas from anaerobic digestion is used as a car fuel and the sludge is spread on land; Only rejected materials from incineration are landfilled; Waste is transported an average distance of 44 km to the landfill and 11 km to the incineration plant and to the anaerobic digestion.
Source: Own estimations Based on the previous assumptions related to the quantity of waste and the recycling rate, the amounts of treated waste in different scenarios were calculated (Tab. 3.5). Tab. 3.5 Scenarios 2020 and amount of treated waste
Waste, 2020 Scenarios 2020
Waste type
Comp. %
Amount thous. tonnes
1. Recycling2. Landfill
1. Recycling 2. Landfill 3. Incineration
1. Recycling 2. Landfill 3. Incineration 4. Anaerobic Digestion
1 2 1 2 3 1 2 3 4 Paper and carton 11 53 10.7 42.8 10.6 - 42.8 10.6 - 42.8 - Organic material 55 265.1 - 265.1 - - 265.1 - - 198.8 66.3Glass 5 24.1 14.5 9.6 14.5 9.6 - 14.5 9.6 - - Metals 4 19.3 1.9 17.4 1.9 17.4 - 1.9 17.4 - - Plastics 10 48.2 19.3 28.9 19.3 - 28.9 19.3 - 28.9 - Textiles 5 24.1 - 24.1 - - 24.1 - - 24.1 - Bulk 0 0 - - - - - - - - - Other waste 10 48.2 - 48.2 - 31.3 16.9 - 31.3 16.9 - Total 100 482
46.3
436.1
46.3
58.3 377.8 46.3 58.2 311.5 66.3
Source: Own calculations

Environmental Systems Analysis of Municipal Solid Waste Management in Chisinau, Moldova Current situation and future perspectives
25
3.6 Sub-models The graphical interface of the ORWARE model for Chisinau city that appears in the SIMULINK window is shown in Fig. 3.5. The blocks are the submodels constituting the solid waste management system in this study. The flow of the solid waste was initiated by a number of parameters in the scenarios defined. It implied for instance that in the first and second scenarios, the biological treatment and incineration submodels were not activated in the simulation because all collected solid waste was heading to the landfill system.
Fig. 3.5 Graphical interface of ORWARE model for Chisinau city Source: ORWARE model Solid waste sources and waste fractions Only one source of municipal solid waste was modelled that includes waste from households, industries, offices, markets etc. The source of incoming solid waste is grouped into several fractions such as organic waste, paper and cardboard, glass, metal and plastic. Activities that generate waste are not included, but the model begins when solid waste is collected at the source. According to Eriksson (2003), each fraction is characterized by a set of parameters describing the chemical composition of the waste, including: Parameters of environmental relevance: heavy metals, NOx, SO2, HCl, PCB, dioxins, PAH, AOX, CH4, CO, CHX, CO2, BOD, COD, NH3/NH4, P, NO2--/NO3-, etc. Parameters of relevance to process performance: C, H, O, N, P, H2O, energy etc. Parameters of economic relevance: CH4, N, P etc. (yet economic analysis is not performed)

Environmental Systems Analysis of Municipal Solid Waste Management in Chisinau, Moldova Current situation and future perspectives
26
Parameters that characterize the material recovery: paper, plastic, metals, etc. The amounts of these substances in kilograms per year in every fraction serve the basis for calculating the solid waste flow. The input data for those parameter series, which form the vectors in an ORWARE simulation, were set up based on the Stockholm version of ORWARE model. A certain amount of recyclable fractions were assumed to be sorted out and channelled to the informal collection system. In the biological treatment scenario, a portion of the organic fraction was assumed to be separated. Transport The transport sub-model comprises different types of vehicle transports. For collection of waste, back-packer and front-loader models were simulated, while to transfer the primary and secondary waste, an ordinary truck and trailer transport was assumed. Data on average load, average speed etc. were used as input in all transport sub-models. The output was total energy consumption, time consumption and costs. Emissions were calculated from the energy consumption. The transport sub-model is further described in Sonesson (1996) and in Sonesson (1998). Landfill In the landfill sub-model, mixed waste, sludge, ash and slag are modelled separately. Sludge in this particular study refers to resulting sludge from the recycling process and not sewage sludge as in Sweden. The landfill sub-model attempts to include all potential future emissions from the degradation process of primary and secondary wastes, the operation process and the leachate treatment as well. The challenge in modelling landfill emissions lies in the fact that a long period of time of landfill emissions is difficult to compare with instant emissions from other processes in the system. In ORWARE, this dilemma is addressed by separating the future impacts of landfilling into two time periods: surveyable and remaining time. Surveyable time corresponds to the time until the most active processes in the landfill have ended and a pseudo steady state of methane phase is reached for mixed waste and sludge, which is assumed to be in the magnitude of 100 years. In the case of landfilled incineration ash and slag, the surveyable time means the time needed for highly soluble substances such as alkaline salts to leak out to a large extent. Remaining time is the time until all material has been spread out in the environment through gas emissions, leaking and erosion. The remaining time includes the emissions in a kind of worst scenario. The mixed waste landfill, degradation is modelled as completely anaerobic during surveyable time. Proteins, fat, and easily degradable carbohydrates (sugars) are completely converted to CO2 and CH4, 70% of semi-stable carbohydrates, i.e. cellulose etc. is degraded, while lignin and plastic material are not degraded at all. In the simulation, it was assumed that 90% of all nitrogen is emitted as ammonium in water, while 2% of the phosphorus and 0.1 – 0.3 % of all heavy metals are emitted in the leachate (Björklund, 1998). Incineration The incineration sub-model consists of three parts: pre-treatment, incinerator and air pollution control. The pre-treatment provides baling of all of the incoming solid waste; enabling the possibility to store waste and combust it later. In the incinerator, the solid waste is combusted, resulting in outputs of raw gas, slag and fly ash. The raw gas is led to the air pollution control unit, which is modelled to transfer raw gas components to clean gas (released as air emissions) and moist or stabilized fly ash. Emission factors are calculated from material balances over each process and considered to be: (i) product related, i.e. linearly dependent on the incinerated amount of the substance, (ii) process related, i.e. depend on the amount of waste incinerated, or (iii) threshold related, i.e. parameters under legislative limited value that has to be kept. The air pollution control sub-model is able to remove about 95 – 98% of dioxin, 99.99% of dust and 95% of mercury in the raw gas. The clean gas, however, still contains 100% of NOx, CO and CO2-fossil origin in raw gas. The energy recovered in this sub-model includes heat and electricity.

Environmental Systems Analysis of Municipal Solid Waste Management in Chisinau, Moldova Current situation and future perspectives
27
The combined heat and power (CHP) plant was assumed to be operated at 88% of thermal energy efficiency, of which 22% is power and 78% heat. Anaerobic digestion and biogas utilization The sub-model for anaerobic digestion is based on a real treatment plant comprising a continuous single stage mixed tank reactor in Uppsala, Sweden and suitable for a thermophilic or a mesophilic process (Eriksson, 2003). The incoming material is cleared from plastic bags and metals, homogenized and hygienised at 70°C also can be at 130°C prior to the digester. The separation will result in a loss of organic material. The model automatically calculates the energy needed for hygienisation and digestion as well as the need of water for adjustment of the total solid content. After the digestion step, the substrate passes through a heat exchanger and dewatering equipment. The amount of gas generated depends on the composition of different organic compounds e.g. fat, proteins, cellulose, hemi-cellulose, lignin, rapidly degradable carbohydrates and the retention time. The sludge from the digester is separated into a solid and a liquid phase in the dewatering process. The digestion residue is stored in large covered lagoons in solid or liquid phase. Electricity is consumed for mixing, pumping and drying. The sub-model delivers sludge for spreading and biogas to be combusted. Wet sludge is dried completely in the biogas-fired drier before spreading. Produced biogas is used partly for powering this drier, which will result in a loss of biogas energy from the digestion process. The biogas utilization sub-model comprises possibilities of generating power, engine fuel or hydrogen in a steam reforming process. In this study, the net amount of biogas was utilized for fuelling busses – as described earlier in the scenario – in an attempt to see its potential in delivering this function. It passes through a gas purification step before methane enriched gas is used to fuel busses. Electricity consumption is calculated for this process, as well as emissions from gas purification and gas consumption in busses. Recycling In ORWARE, there are sub-models for recycling of plastics and cardboard, which are based on specific Swedish plants. The sub-model for plastic recycling represents polyethylene recycling. A certain amount of incoming plastic to the recycling plant is sorted out as reject. The plastic that is recycled gives rise to electricity consumption. The output from the model is emissions to water, waste in the form of sludge and finally plastic granules, which are assumed to replace virgin polyethylene. In the cardboard recycling model, the recycled cardboard needs 15% extra weight to replace virgin cardboard. The cardboard recycling plant gives rise to emissions to water, energy related emissions to air and energy consumption and waste in form of bio-sludge and plastic reject (Eriksson, 2003). Spreading of residues The spreading sub-model uses dry sludge from anaerobic digestion as input. It is divided into three steps: calculation of spreading areas and transport distances, transport of residues from the treatment plant to the centre of spreading areas and finally the spreading itself. The maximum spreading of residues per hectare is determined from the rest product content of phosphorus and nitrogen. The distance to and the area of each spreading area is used as input data and the model calculates the total distance and energy consumption. Two different spreaders are modelled, one for liquid products and one for solid products. The model determines what kind of spreader is needed depending on the dry matter content of the rest product. The spreader model calculates the emissions from the truck transport and the spreading procedure and also the energy consumption for the vehicles (Eriksson, 2003). As a spreading system is not in place today for Chisinau, an assumption was made for the spreading location. It was not based on the location of arable land available (due to inadequate geographical information) but instead by plausible assumption to simply set up a particular area and distance from the city centre.

Environmental Systems Analysis of Municipal Solid Waste Management in Chisinau, Moldova Current situation and future perspectives
28
Arable land The chemical processes of nutrient utilization by plants in arable land after spreading of residues are modelled in this sub-model. The model calculates the emissions of nitrogen compared to the use of mineral fertilizer. Thus, relative values are calculated rather than absolute as in the other sub-models. Nitrogen is assumed to exist in three forms: ammonia, nitrate and organically bound. The model gives emissions from mineralization of organically bound nitrogen during the first year after spreading and the long-term effects of mineralization. The emissions of laughing gas (N2O), nitrate (NO3-) and ammonia (NH3) depend on the soil condition, the spreading conditions and the climatic region which can be adjusted for the model. The up-stream and compensatory system In ORWARE, the energy produced and environmental impact from electricity and district heating generation plants are included as up-stream processes if needed in a waste treatment process, or as a compensatory process if necessary to fulfil a functional unit. The up-stream transport considers the extraction and refining of vehicle fuels, while the core system of this compensatory process deals with direct effects of operating the vehicles. Compensatory production of mineral fertilizer covers production of nitrogen and phosphorus. Cardboard and plastic compensatory processes consider their production from virgin resources (Eriksson, 2003). In this study, the data for the up-stream and compensatory systems were based on Swedish values. The summary of processes and data source is presented in Tab. 3.6.

Environmental Systems Analysis of Municipal Solid Waste Management in Chisinau, Moldova Current situation and future perspectives
29
Tab. 3.6 Summary of primary processes, variables of interest and data sources in submodels Sub-model Primary process Variable of interest Data sources Waste Initiating waste vectors as one waste
stream Amount of waste MSW data
collection. Regia Autosolubritate
Direct collection system: Air emissions Organic waste Water emissions
Collection by municipality
Rest waste Oil consumption
MSW data collection. Regia Autosolubritate. Swedish data
Transport by ordinary truck Air emissions Reject to incineration Water emissions Collected cardboard to recycling plant Distance route
Oil consumption Collected plastic to recycling plant Transport by truck and trailers Slag and stabilized ash to landfill Moist ash to landfill Reject cardboard to incineration/landfill
Assumed data. Swedish data
Transportation
Rejected plastic to incineration/landfill
Informal collection
Grouping of recyclable materials Amount of recyclable materials based on group
Assumed data
Household waste landfill from waste source Degradation of organic, inorganic materials
Air emissions Water emissions Oil consumption Air emissions from
Sludge landfill from recyclable plant trucks Ash landfill from incinerator
Landfill
Water purification
Swedish data
Wrapping and sorting Air emissions Swedish data Slag and raw gas formation Energy production
Incineration
Air pollution control Energy consumption
Pre-treatment Amount of treated organic waste
Swedish data
Digestion Biogas production Biogas storage Energy consumption Sludge drying Amount of rejected
materials Amount of sludge produced Water emissions
Anaerobic Digestion
Purification of biogas to vehicle gas Amount of sludge produced
Biogas utilisation
Gas consumption in busses Biogas production Swedish data
Transporting and spreading of the residues from anaerobic digestion
Air emissions ( from gas purification and consumption in busses)

Environmental Systems Analysis of Municipal Solid Waste Management in Chisinau, Moldova Current situation and future perspectives
30
Air emissions Swedish data Oil consumption
Transport and spreading
Calculation of area required for spreading
Area required for spreading
Assumed data
Air emissions Water emissions
Arable land Utilisation of spread organic materials by plants
Soil emissions
Assumed data
Upstream and compensatory system
External process of electricity and district heating generation, nitrogen and phosphorus production. Cardboard and plastic production and biogas generation
External energy consumption and environmental impact
Swedish data
Source: Own 3.7 Simulations The simulations were carried out after (i) the sub-models were connected to each other to form a larger system, (ii) the scenarios were defined and (iii) all necessary parameters input had been specified in the MATLAB files as well as the graphical interface of SIMULINK. All input data are specified. The emissions from the core system, e.g. collection and transport of waste, incineration, landfill, etc. are being summed up and each substance is weighted according to its impact to the air, water and soil environment. Five categories of impact were set up, which included global warming potential, acidification, eutrophication, the effect of photo-oxidant agents of VOC and flows of NOx. A rather similar calculation was applied for the external system, i.e. the effects of upstream and compensatory systems for fulfilling the functional units. Given the same amount of functional unit outputs, the external contribution from the compensatory system can be calculated, which is defined as the difference between the maximum output of functional unit and its production in each scenario. Impacts on air and water were considered for cardboard and plastic production, while for the rest of compensatory systems, only air emissions were considered. The external emissions combined with the ones from the core system were thus forming the total environmental impacts. Energy turnover from the core system covered oil consumption from all collection and transport vehicles, heat and electricity consumed to support the waste treatment processes, produced heat and electricity e.g. from the incineration system and fuel gas generation from anaerobic digestion. The total consumption of primary energy carriers was thus calculated by summing up all energy consumed by the core system and the external system i.e. the up-stream and compensatory systems. The primary energy carriers can also be categorized in term of renewable or non-renewable energy sources, e.g. hydro power, biomass, natural gas, etc.

Environmental Systems Analysis of Municipal Solid Waste Management in Chisinau, Moldova Current situation and future perspectives
31
4. RESULTS After simulation was performed, all results were combined and transferred to Excel format in tables and graphics to be easily interpreted. The following chapter presents the results and results analysis. 4.1 Waste treatment in each scenario The waste management system in Chisinau, Moldova in tonnes is illustrated in Fig. 4.1. The bars represent the amounts of primary waste coming into the system, excluding the residues from treatment. The last 3 scenarios handle more waste than the first one since the amount of generated waste will increase by 1.56 times in 15 years from now. The 2020 scenarios represent different treatment methods landfill, incineration and biological treatment. Biological treatment in the 4th scenario is related to anaerobic digestion. The amount of waste is presented in Tab.4.1.
Fig. 4.1 Waste Management Systems (tonnes of total generated waste) Source: ORWARE results for Chisinau model Today in Moldova, there is no material recycling from MSW. It is assumed that the same amount of materials will be recovered in all scenarios in 2020, even though treatment methods are different. Material recycling includes: paper, metal., plastic and glass. However, only the emissions and energy consumption of plastic and cardboard are modelled. Tab. 4.1 Proportion of total waste treated by different methods in the different scenarios (tonnes per year)
Scenario Landfill Incineration Biological Materials recycling Total
Landfill 2005 309200 0 0 0 309200 Landfill 2020 436100 0 0 46300 482000 Lf + Inc 2020 58300 377800 0 46300 482000 Lf + Inc + Ad 2020 58300 311500 66300 46300 482000 Source: ORWARE results for Chisinau model
0
100 000
200 000
300 000
400 000
500 000
600 000
Landfill 2005 Landfill 2020 Lf + Inc 2020 Lf + Inc + Ad 2020
Materials recyclingBiological IncinerationLandfill

Environmental Systems Analysis of Municipal Solid Waste Management in Chisinau, Moldova Current situation and future perspectives
32
4.2 Functional unit output Functional unit outputs differ for 2005 and 2020 because of different waste generation rates. In the year 2005, represented by the first scenario, the only function fulfilled is waste treatment. Due to the absence of material and energy recovery in 2005, the functional units give no output. The values of outputs for 2020 can be seen in Tab. 4.2. Tab. 4.2 Functional units for 2005 and 2020
Functional units Unit Output in 2005 Output in 2020 Amount of waste tonnes 309 200 482 352 District Heating MJ 0 1 668 440 245 Electricity MJ 0 549 750 999 Bus Kilometer km 0 13 779 963 Phosphorous kg 0 71 576 Nitrogen kg 0 243 578 Cardboard kg 0 3 397 436 Plastic kg 0 7 717 632 Source: ORWARE results for Chisinau model 4.3 Environmental impacts Global Warming Potential (GWP) 2
Fig. 4.2 Global warming potential from the core system (kilotonnes of CO2-equivalents) Source: ORWARE results for Chisinau model The global warming potential is illustrated in Fig. 4.2. The greatest impact with an amount of more than 500 kilo tonnes of CO2 occurs in the second scenario so called business as usual in 2020. The last two scenarios have an impact three times less than the landfill scenario to global 2 Global Warming Potentials (GWP) is a measure of how much a given mass of greenhouse gases is estimated to contribute to global warming
0.0
100.0
200.0
300.0
400.0
500.0
600.0
Landfill 2005 Landfill 2020 Lf + Inc 2020 Lf + Inc + Ad 2020Scenarios
Landfill STResidual SpreadingBiogas UtilizationIncinerationPlastic RecyclingCardboard RecyclingCollectionTransport

Environmental Systems Analysis of Municipal Solid Waste Management in Chisinau, Moldova Current situation and future perspectives
33
warming 15 years from now. Scenarios 3 and 4 have almost similar GWP impacts. This is since only 25% of the organic waste goes to anaerobic digestion in scenario 4. As is evident from Fig. 4.2 the dominating GWP impact come from landfill and incineration. The effects from recycling, anaerobic digestion and transportation is negligible compared to the effects from incineration and landfilling. The relative contributors to the GWP from the three most important parameters are showing in Tab. 4.3. Tab. 4.3 Relative contributions to GWP from CO2, CH4 and N2O
Emissions Equivalency factor CO2 1 CH4 21 N2O 320
Source: Internet The GWP impact is a result of greenhouse gas emissions, mainly as a consequence of methane generation during the biological degradation of organic waste in the landfill. The landfill scenario has no gas collection system and methane produced during surveyable time escapes to the atmosphere. In the case of incineration, the GWP is largely due to combustion of plastics, which creates anthropogenic CO2 emissions. These emissions cannot be avoided since plastic due to its complexity and high calorific value will not be sorted out before incineration.
Fig. 4.3 Global warming potential including external system (kilotonnes of CO2-equivalents) Source: ORWARE results for Chisinau model Due to the need for compensatory heating and upstream electricity for external systems, the situation will become worse for the landfill 2020 scenario (Fig. 4.3). The GWP grows up to 760 kilotonnes of CO2 equivalents. By adding impacts from external systems, the relation between scenarios is not changed. Even the last two scenarios have equal impact, only increased in emissions with 40 kilotonnes of CO2 equivalents. For the incineration scenario, the impact from compensatory petrol was added and for biological treatment the impact from compensatory heating.
0.00
100.00
200.00
300.00
400.00
500.00
600.00
700.00
800.00
Landfill 2005 Landfill 2020 Lf + Inc 2020 Lf + Inc + Ad 2020
Upstream ElectricityCompensatory CardboardCompensatory PlasticCompensatory Fertilizer Compensatory PetrolCompensatory HeatingCore System

Environmental Systems Analysis of Municipal Solid Waste Management in Chisinau, Moldova Current situation and future perspectives
34
Acidification3 The largest core system acidification impacts (in contrast to GWP) come from the 4th scenario followed by the 3rd scenario. Emissions from the landfill 2020 scenario with 100 tonnes SO2 equivalents are more than 3 times lower than biological treatment scenario and 2.5 times lower than the incineration scenarios as can be observed in Fig. 4.4.
Fig. 4.4 Acidification from core system (tonnes of SO2-equivalents) Source: ORWARE results for Chisinau model
Fig. 4.5 Acidification including external system (tonnes of SO2-equivalents) Source: ORWARE results for Chisinau model
3 Acidification is a process whereby air pollution – mainly ammonia, sulphur dioxide and nitrogen oxides – is converted into acid substances
0.00
50.00
100.00
150.00
200.00
250.00
300.00
350.00
Landfill 2005 Landfill 2020 Lf + Inc 2020 Lf + Inc + Ad 2020
Landfill STResidual SpreadingBiogas UtilizationIncinerationPlastic RecyclingCardboard RecyclingCollectionTransport
0.00
100.00
200.00
300.00
400.00
500.00
600.00
700.00
800.00
Landfill 2005 Landfill 2020 Lf + Inc 2020 Lf + Inc + Ad 2020
Upstream ElectricityCompensatory CardboardCompensatory PlasticCompensatory Fertilizer Compensatory PetrolCompensatory HeatingCore System

Environmental Systems Analysis of Municipal Solid Waste Management in Chisinau, Moldova Current situation and future perspectives
35
Acidification is much affected by ammonia, nitrogen oxides and sulphur dioxides that are emitted as air pollution from different treatment processes and transports and converted into acid substances in the atmosphere. In the waste management systems, acidification impacts mainly are caused by incineration, landfilling, collection and transportation. Residue spreading from anaerobic digestion has the second largest impact to acidification after incineration. The impact from material recycling is almost negligible in comparison to other treatment options. Acidification impacts from the external system (Fig. 4.5) significantly change the order of scenarios. Because of upstream electricity and compensatory petrol the landfill 2020 scenario gives a value of 620 tonnes of SO2 equivalents that is 6 times higher than the core system. Compensatory petrol increases the impact by 120 tonnes of SO2 equivalents in the incineration scenario, placing it on the second lowest place with respect to acidifying emissions. Together with the external system, the biological treatment scenario has the lowest acidification impact. Since it produces fuel for busses and at the same time generates electricity and heat, there is no need for compensatory petrol and energy. Eutrophication4 As for GWP the landfill scenario is the main contributor to eutrophication impact with an amount of 5800 tonnes of NO2-equivalentss per year (Fig. 4.6). The incineration scenario has the lowest impact that is 50% less than the landfill scenario. The impact from the landfill is so high that in the incineration scenario the emission from the landfill has the same value as emissions from incineration even though only 12% of waste is landfilled. In the biological treatment scenario, emissions from residue spreading are added to those from the incineration and the landfill. Transportation of waste has less impact but still is considerable. For this impact category, plastic recycling has a small impact in comparison to previous ones.
Fig. 4.6 Eutrophication from core system (tonnes of NO2-equivalents) Source: ORWARE results for Chisinau model
4 Eutrophication is the fertilisation of an aquatic system by addition of nutrients, primarily phosphorus and nitrogen that stimulate blooms of algae
0.00
1 000.00
2 000.00
3 000.00
4 000.00
5 000.00
6 000.00
7 000.00
Landfill 2005 Landfill 2020 Lf + Inc 2020 Lf + Inc + Ad 2020
Landfill STResidual SpreadingBiogas UtilizationIncinerationPlastic RecyclingCardboard RecyclingCollectionTransport

Environmental Systems Analysis of Municipal Solid Waste Management in Chisinau, Moldova Current situation and future perspectives
36
Emissions of nitrogen (mostly in the form of ammonia and NOx) are identified as the major cause of this effect. A relatively insignificant contribution comes from a small amount of phosphorus. Fig. 4.7 Eutrophication including external system (tonnes of NO2-equivalents) Source: ORWARE results for Chisinau model The order between the 3rd and the 4th scenario is changed after including impacts from upstream and compensatory systems (Fig. 4.7). The biological treatment scenario has the lowest impact where the external system contributes with a very small impact from compensatory heating. Because of compensatory petrol, the incineration scenario has increased to 3500 tonnes of NO2-equivalents and has the second lowest emissions. The landfill 2020 scenario has the highest impact as for the core system. It increases the impact by 30% due to compensatory petrol, heating and upstream electricity. Photo-oxidant VOC5 This is one of the two impact categories connected to the formation of ozone. Mainly CH4 and volatile organic gases from the landfill processes and CO from incineration cause photo-oxidant formation and are calculated in ethene-equivalents. As for global warming potentials and eutrophication, the landfill scenario dominates the impact of photo-oxidant VOC (Fig. 4.8). The emission amount corresponds to 250 tonnes of ethene-equivalents. The incineration and biological treatment scenarios have almost the same impact equivalents approximately 40 tonnes of ethene. Even though only 12% of the waste is landfilled in the incineration and biological treatment scenarios, the landfill has 5 times higher photo-oxidant VOC impact than incineration. Other treatment options have a negligible impact, except a small impact coming from biogas utilisation.
5 Photo-oxidant VOC is a measure of the photo-oxidant formation which derives from volatile organic compounds emissions , causing destruction of tropospheric ozone
0.00
1 000.00
2 000.00
3 000.00
4 000.00
5 000.00
6 000.00
7 000.00
8 000.00
9 000.00
Landfill 2005 Landfill 2020 Lf + Inc 2020 Lf + Inc + Ad 2020
Upstream ElectricityCompensatory CardboardCompensatory PlasticCompensatory Fertilizer Compensatory PetrolCompensatory HeatingCore System

Environmental Systems Analysis of Municipal Solid Waste Management in Chisinau, Moldova Current situation and future perspectives
37
Fig. 4.8 Photo-oxidant VOC from core system (tonnes of ethene-equivalents) Source: ORWARE results for Chisinau model When the photo-oxidant VOC impact from external systems are added (Fig. 4.9), the relation between scenarios remain the same. Upstream and compensatory systems main contribution come from the need for compensatory petrol, heating and upstream electricity. The impact from the landfill increases to 310 tonnes of ethene-equivalents, an increase with 60 tonnes compared to the core system. Compensatory heating and electricity for the biological scenario contribute less in photo-oxidant VOC impact than compensatory petrol for the incineration scenario.
Fig. 4.9 Photo-oxidant VOC including external system (tonnes of ethene-equivalents) Source: ORWARE results for Chisinau model
0.00
50.00
100.00
150.00
200.00
250.00
300.00
Landfill 2005 Landfill 2020 Lf + Inc 2020 Lf + Inc + Ad 2020
Landfill STResidual SpreadingBiogas UtilizationIncinerationPlastic RecyclingCardboard RecyclingCollectionTransport
0.00
50.00
100.00
150.00
200.00
250.00
300.00
350.00
Landfill 2005 Landfill 2020 Lf + Inc 2020 Lf + Inc + Ad 2020
Upstream ElectricityCompensatory CardboardCompensatory PlasticCompensatory Fertilizer Compensatory PetrolCompensatory HeatingCore System

Environmental Systems Analysis of Municipal Solid Waste Management in Chisinau, Moldova Current situation and future perspectives
38
Even though the biological scenario has the lowest impact, the difference between the 3rd and the 4th scenario is very small. It contributes with an average of 55 tonnes ethene-equivalents that is more than 5 times less than the landfill scenario. Photo-oxidant NOx
6 NOx is partly responsible for a series of problems, including acidification and increased concentration of photo-oxidant in the atmosphere. That way the acidification and photo-oxidant NOx impacts show similarities (Fig. 4.10).
Fig. 4.10 Photo-oxidant NOx from core system (tonnes of ethene-equivalents) Source: ORWARE results for Chisinau model The lowest impact emission comes from the landfill scenario with an amount of 13 tonnes of ethene-equivalents. The incineration and biological treatment scenarios have the highest impact with an amount of 65 tonnes of ethene-equivalents. Emissions of nitrogen oxides (NO and NO2) arise primarily from the reaction of nitrogen and oxygen during the combustion of fossil fuels and biomass. In Fig. 4.11 it is clearly illustrated that impact occurs mainly from incineration, followed by waste collection and biogas utilization. Both for acidification (Fig. 4.5) and photo-oxidant NOx (Fig. 4.11), the order between scenarios is drastically changed by adding external systems. High emissions with an amount of 150 tonnes of ethene-equivalents from the landfill scenario are a result from compensatory petrol, heating and upstream electricity. The incineration scenario has the same high impact from compensatory petrol and has the second lowest impact. Biological treatment has the lowest emissions for this impact category. The emissions from the 4th scenario correspond to 90 tonnes of ethene-equivalents.
6 Photo-oxidant NOx is the photo-oxidant formation which derives from NOx compounds reaction, causing destruction of tropospheric ozone
0.00
10.00
20.00
30.00
40.00
50.00
60.00
70.00
Landfill 2005 Landfill 2020 Lf + Inc 2020 Lf + Inc + Ad 2020
Landfill STResidual SpreadingBiogas UtilizationIncinerationPlastic RecyclingCardboard RecyclingCollectionTransport

Environmental Systems Analysis of Municipal Solid Waste Management in Chisinau, Moldova Current situation and future perspectives
39
0.00
0.20
0.40
0.60
0.80
1.00
1.20
GlobalWarming
Acidification Eutrophication Photo-oxidant-VOC
Photo-oxidant-NOx
Landfill 2020Lf + Inc 2020Lf + Inc + Ad 2020
Fig. 4.11 Photo-oxidant NOx including external system (tonnes of ethene-equivalents) Source: ORWARE results for Chisinau model Total environmental impacts All core system environmental impacts from the different scenarios are summarised and normalised in Fig. 4.12. The landfill 2005 scenario was excluded from this comparison, since it is not of interest for future planning. Values were normalized against highest value within each impact category Fig. 4.12 Environmental impact of core system Source: ORWARE results for Chisinau model Three out of five impact categories demonstrate that the landfill 2020 scenario may be considered the worst, causing the highest environmental impacts. Incineration and biological treatment show
0.00
20.00
40.00
60.00
80.00
100.00
120.00
140.00
160.00
180.00
200.00
Landfill 2005 Landfill 2020 Lf + Inc 2020 Lf + Inc + Ad 2020
Upstream ElectricityCompensatory CardboardCompensatory PlasticCompensatory Fertilizer Compensatory PetrolCompensatory HeatingCore System

Environmental Systems Analysis of Municipal Solid Waste Management in Chisinau, Moldova Current situation and future perspectives
40
nearly the same impacts from the core system. Biological treatment has a higher acidification impact (23%) and eutrophication (5%) than the incineration scenario. For photo-oxidant VOC impacts, both the incineration and biological treatment scenarios reduce impact by 80% compared to the landfill 2020 scenario. For photo-oxidant NOx, the situation is opposite; here the landfill scenario shows 4 times lower impact from the core system compared to the 3rd and the 4th scenarios. By adding the external system the situation has changed Fig. 4.13. Five out of five environmental impacts demonstrate that the landfill 2020 scenario has the highest environmental impacts. The landfill scenario therefore may be considered the least preferable waste management system regarding overall environmental impacts. The lowest impact is achieved for the biological treatment scenario, followed by the incineration scenario. These two scenarios may be considered as representing improved future waste management, since they are capable of decreasing the emissions. The main reduction of emissions of the incineration and biological treatment scenario is seen for photo-oxidant VOC followed by GWP and eutrophication impact categories. The incineration and biological treatment scenarios have almost the same acidification and photo-oxidant NOx impacts. The impacts reduction for different environmental impact categories varies from 35 to 80% when a transfer from landfilling to the biological treatment scenario is introduced.
Fig. 4.13 Environmental impact of total system Source: ORWARE results for Chisinau model
Values normalized against highest value within each impact category
0.00
0.20
0.40
0.60
0.80
1.00
1.20
GlobalWarming
Acidification Eutrophication Photo-oxidant-VOC
Photo-oxidant-NOx
Landfill 2020Lf + Inc 2020Lf + Inc + Ad 2020

Environmental Systems Analysis of Municipal Solid Waste Management in Chisinau, Moldova Current situation and future perspectives
41
4.4 Energy Turnover The energy consumption and production for different scenarios in this study was calculated for transport fuel (waste transportation), electricity and heat. The model takes into account the use of energy sources as coal, natural gas, oil, biomass, hydropower and nuclear energy. At the moment Moldova does not use biomass or nuclear energy. For energy turnover calculations, the ORWARE Stockholm model was used, that calculates an average national mix for both heat and electricity production from different sources. Tab. 4.4 Energy use and production for different scenarios (TJ)
Energy in the WMS [TJ](Internal) Landfill 2005 Landfill 2020Lf + Inc
2020 Lf + Inc + Ad 2020
Oil Consumption -33 -58 -49 -50 Electricity consumption 0 -55 -157 -172 Heat Consumption 0 0 0 -22 Fuel gas production 0 0 0 31 Electricity production 0 0 550 495 Heat Production 0 0 1668 1503 Source: ORWARE results for Chisinau model In the scenario 2005, only oil is used for waste transportation to the landfill. For all 2020 scenarios, energy consumption is added for transportation activities and material recycling. Since the incineration and biological treatment scenarios are more complex systems, they lead to more transport and energy use. The incinerator is placed at the boundary of the city centre in order to optimise infrastructure for heat and electricity distribution and waste transport. The use of oil for waste transportation is almost the same for all 2020 scenarios (Tab. 4.4). Due to an increased systems complexity, the electricity consumption for the 3rd and 4th scenarios is 3 times higher than for the landfill 2020 scenario.
Fig. 4.14 Energy balance for the waste management system [TJ (1012J)] Source: ORWARE results for Chisinau model
-500
0
500
1000
1500
2000
2500
Landfill 2005 Landfill 2020 Lf + Inc 2020 Lf + Inc + Ad 2020
Heat ProductionElectricity productionFuel gas productionHeat ConsumptionElectricity consumptionOil Consumption

Environmental Systems Analysis of Municipal Solid Waste Management in Chisinau, Moldova Current situation and future perspectives
42
The biological treatment scenario consumes an additional amount of 22 TJ of heat. Waste is incinerated in both the 3rd and 4th scenarios and produces an average of 500 TJ of electricity and 1500 TJ of heat. In Fig. 4.14, the energy turnover is shown for the four simulated scenarios. The incineration scenario produces over ten times more energy than it uses, while the biological treatment scenario produces over eight times more energy than it uses. As a result of anaerobic digestion, biogas for busses is produced. The amount of energy produced is 31 TJ per year, contributing to nearly 14 million bus transport km. 4.5 Materials recovery At the moment, there is no material recovery in Moldova. It was assumed that by 2020 the material recovery will be introduced and the same level of material recycling was assumed for all future scenarios (see Tab. 3.2). The simulated model calculates only the amount of recycled cardboard in the form of virgin cardboard substituted and recycled plastic in the form of HDPE granules. The amount of recycled cardboard will constitute 3400 tonnes per year and the amount of recycled plastic will be 7700 tonnes per year. It was found that the environmental impact from recycling is quite small. There is a small acidification and photo-oxidant impacts from plastic recycling. The impact from cardboard recycling is not visible in any impact categories and it is negligible in comparison with impacts from other systems.

Environmental Systems Analysis of Municipal Solid Waste Management in Chisinau, Moldova Current situation and future perspectives
43
5. DISCUSSION The thesis provides technical and environmental information on solid waste management in Chisinau, Moldova. The study covers the whole waste stream since the aim was to find the total impact for different treatment methods. The MSW flow in 2020 has been analysed in three different scenarios; landfill, incineration and incineration plus biological treatment. The analysis has provided the possibility of a quantitative assessment of different environmental impacts, energy potentials and how some materials can be recycled. From the analysis, it is obvious that traditional landfilling of mixed household waste is not a good treatment option. However, the landfill 2020 scenario was included to have a clear picture of what should be expected and how bad the situation can be in comparison with other treatment options. The study shows that decision makers have to set goals to avoid a so called business as usual situation and to focus on more sustainable treatment methods. The results presented are influenced by many factors. They depend on system boundaries, specific parameters, the model construction and how suitable the assumptions made for Chisinau were. Lack of data and a low accessibility to existing data might have affected the accuracy of the simulations performed. One important issue is that the ORWARE model has been developed for Sweden that has different geographic and climatic conditions from Moldova.
5.1 Environmental impacts The study does not include a justification of the importance of different impact categories among themselves. One impact category at a time was considered to make comparisons between different treatment options. As mentioned before, landfilling is the least preferable choice with focus on environmental issues. GWP, acidification and photo-oxidant formation from VOC are very much affected by the operation and maintenance procedures at landfills. There is no doubt today that landfilling causes many problems in surrounding areas. Due to inadequate operation, many people complain about odour and health problems related to bad air and water. The simulations performed cannot show such impacts. The development level of a country influences the waste treatment methods used. At the present time, landfilling is the most common waste treatment method not only in Moldova but also in all former Soviet Union countries. This happened due to the reason that landfill taxes were and are very low. Since Moldova has signed the Kyoto protocol to reduce carbon dioxide emissions, measures should be taken without delay. In the national discussion, incineration and biological treatment have been considered but have not yet been implemented. This is a pity, since landfilling is not a treatment method but rather postponing the handling of a problem, while causing different types of impacts. Here, as always, financial factors stay in front of environmental issues. It was assumed that if a project should start, it has to be of economical interest. Therefore, the incineration (3rd) scenario was chosen due to electricity and heat production and the ash can be used as a construction material. From an environmental point of view, it was found that the combustion process has a considerable potential to reduce most of the environmental impacts, except NOx emissions. At the same time, the ORWARE simulations for the entire system resulted in lower environmental impacts if a certain amount of electricity and heat is produced by conventional systems. That is because formation of photo-oxidant NOx is lower in an incinerator. It should be noted that the incinerator was simulated to function as incinerator from Stockholm with efficient process control and has a strict air control system. It has very low NOx emissions compared to other incinerators from Europe. Thus, the simulation figures may give a too positive picture for a number of released gases. More than that, upstream and compensatory systems are likely to be different. One step forward is biological treatment (4th)

Environmental Systems Analysis of Municipal Solid Waste Management in Chisinau, Moldova Current situation and future perspectives
44
scenario that is performed through anaerobic digestion of organic waste and also has incineration as a treatment method for the rest of the waste. The anaerobic digestion technology is proven to be one of the best available technologies for organic solid waste. As mentioned before, the biogas will be used as a fuel for city busses. That will certainly improve the air quality in Chisinau. In view of the fact that only 25% of organic waste is biologically treated in the 4th scenario, there is a slight difference of GWP photo-oxidant NOx and VOC impacts between the 3rd and 4th scenarios. But by adding external systems, the impacts from the biological treatment scenario give the lowest values. Due to lower environmental impacts than the landfill scenario, both for the incineration and biological treatment scenario may be considered as future improved waste management options. 5.2 Energy and materials recovery Moldova has no natural resources and any alternative energy is most welcome. By using alternative sources, Moldova may start to reduce, little by little, the national dependence on imported energy and raw materials. Here, energy from waste is an interesting alternative. As an example, heat recovery from waste incineration should be very interesting, since Chisinau has a winter temperature that is an average by 4oC lower than that in Stockholm. More than that, 40% of the Moldovan industry is located in Chisinau and as it is well known, industry demands always heat and electricity. Unfortunately, there is no material recovery from MSW in Moldova today. There are local actors that recycle industrial waste but no one has focused on material recovery from MSW. Moldova has quite a fast economic growth and the presence of paper, plastic, glass and metals increases while organic waste decreases in percentage. There will be some time before Eastern European countries will reach the recycling level of Western European countries. In a country like Moldova, first of all, there is a need to work with social aspects of development. Later, other issues such as more sophisticated waste management, using full cost accounting and extended producer responsibility, might be introduced. Recycling should focus on efficient use of recycled material, energy conservation and environmental protection. In the model, presence of a good infrastructure for waste management and a well-informed population was assumed, something that may not be in Moldova. Therefore, the quality of recycled material in Chisinau might be lower.

Environmental Systems Analysis of Municipal Solid Waste Management in Chisinau, Moldova Current situation and future perspectives
45
6. RECOMMENDATIONS The Model: There were many complications with data gathering. First of all, the institutions and organisations responsible for waste management should be well organised and have a suitable distribution of responsibilities. After all, the collected information provided only a general picture of MSW flow in Chisinau. When it comes to ORWARE application, there was insufficient data; therefore assumptions had to be made to simulate the model. Many parameters included in the ORWARE, simulations presented here, were therefore assumed to follow Swedish figures. Due to differences in geographic and climatic conditions, the same waste will perform differently in different places. That way, the studied area must be investigated and characterised first. It is essential to collect as much as possible valid data to avoid assumptions. The local data should give a detailed waste characterisation and waste sources mapping. More accurate waste data would result in better decision-making. Another concern is the development of the recycling sub-models such as glass, metal and paper in the ORWARE model. It would be valuable to achieve the whole picture of the environmental impacts from recycling. In order to include all costs in the systems analysis, the system boundaries should be enlarged. Waste Management: Based on the simulation results, the biological treatment scenario using incineration and anaerobic digestion is the best simulated waste treatment option from an environmental point of view. The incineration scenario may be seen as a good future waste handling option too since it might significantly decrease the environmental impacts compared to the landfill scenario. Firstly, the decision-makers’ focus should be on incinerating the municipal solid waste and gradually to increase public awareness in order to promote recycling. Material recycling has an economic, environmental and social advantage in addition to its benefits of reducing the quantities of waste to be landfilled. Therefore, based on Swedish experience, an extended producer’s responsibility should be introduced. If producers will be in charge to recycle their products or materials, there is a good chance that they will reduce the products complexity and will increase the use of recycled materials. With time, besides an increase in materials recycling, organic waste will be sorted out too with an increased producers’ responsibility. When enough organic waste will be recycled, a biological treatment facility will be built. Since an anaerobic digester facility normally has a smaller scale than an incinerator plant, several organic treatment facilities will have to be built with time. By developing an infrastructure of anaerobic digestion plants, the organic waste transport distances will be reduced and perhaps more organic waste can be sorted out. A successful implementation of a new waste management program has, however, to be done incrementally, taking into consideration social acceptability. Environmental Information and Public Participation: Public participation and environmental awareness are important issues in improving the local waste management system. Unfortunately, it takes a long time to make people aware of the necessity to improve the waste management system and to increase their participation. Here, pilot programs, supported with education programs, are of importance. The pilot program could be started in small residential areas, before being extended to the entire city. If combined with a strong education and publicity program, the pilot program can help people become more environmentally alert. The potential users of recycled materials have to be informed about the solid waste management system and where it is possible to obtain those materials. Another suggestion is to extend the environmental information centre currently in operation in Chisinau. The centre should work in close cooperation with environmental organisations and institutions and all environmental information should be provided to the public. Such a mechanism would result in a faster increase of the local environmental awareness and improve public participation.

Environmental Systems Analysis of Municipal Solid Waste Management in Chisinau, Moldova Current situation and future perspectives
46

Environmental Systems Analysis of Municipal Solid Waste Management in Chisinau, Moldova Current situation and future perspectives
47
7. CONCLUSIONS Due to a lack of time, a cost analysis was not included in this report. Social impacts such as human health were not evaluated neither. In this study, I have tried to apply systems analysis by using the ORWARE model. This resulted in broad analysis of (i) identifying the linkage between the solid waste stream and surroundings and (ii) pointing out the entire magnitude of environmental consequences associated to the present and a number of future waste management options. The current waste management in Moldova (landfilling) causes serious environmental problems. An increasing waste generation will result in increasing environmental problems. The study results show that by changing the waste management system, there will be an essential decrease of environmental impacts. Three out of five impact categories give lower emissions results for the incineration and biological treatment scenarios. The incineration scenario has a reduction of global warming potential with 65% and photo-oxidant VOC with 80%, while biological treatment with a combination of incineration and anaerobic digestion results in even lower emissions. Five out of five results show lower emissions for the incineration and biological treatment scenarios by including the external systems. The biological treatment scenario releases the lowest emissions in providing the same function. Such a waste treatment system with a combination of incineration and anaerobic digestion would supply the city with heat and electricity and biogas for busses. As a consequence, the air quality in the city will improve. Nevertheless, despite it was assumed that not more than 25% of the organic waste will be separated in 15 years from now; biological treatment combined with incineration was the best waste treatment scenario. Being the dominant fraction, the organic waste should be seen as of key importance for an effective waste management in Chisinau. An efficient organic waste source separation should therefore be developed. If more organic waste will be separated and treated biologically, the impact will be further reduced. Besides the organic fraction, recycling of different materials should be improved. At the moment, the separation system has not been developed yet. The simulation results show that environmental impacts from recycling of plastic and carton are almost negligible compared to other treatment options. The municipality of Chisinau should start to implement an effective source separation of waste as soon as possible. As mentioned before, it is also very important to increase public environmental awareness, since this factor influences the quality of separated waste and their treatment. The solid waste management in Moldova should be regarded in a broader perspective. A number of parallel measures should be taken that will avoid or minimize impacts from waste and waste management. Any possibilities to energy and material recovery should be regarded as potential alternative sources and investigated in more detail. These waste programs and policies have to be realistic, effective and integrated with other systems.

Environmental Systems Analysis of Municipal Solid Waste Management in Chisinau, Moldova Current situation and future perspectives
48
References Ajzen, I. and Fishbein, M. (1977) Attitude-behaviour relations: a theoretical analysis and review
of empirical research, Psychological Bulletin 84, pp 888–918. Assefa, G. (2002) Towards a systematic approach for Technology Assessment by combining
Material Flow Analysis, Life Cycle Assessment and Life Cycle Costing, Licentiate Thesis, Division of Industrial Ecology, Department of Chemical Engineering and Technology, Royal Institute of Technology, Stockholm, Sweden (ISBN 91-631-3448-9).
Ayres, R.U. (1989) Industrial metabolism and global change, International Social Science Journal 121,
pp 363-373. Bennett, M. and James, P. (1997) Environment-related management accounting: current practice
and future trends. Greener Management International 97, pp 32–52. Björklund, A. (2000) Environmental systems analysis of waste management - Experiences from
applications of the ORWARE model, Doctoral Thesis, Division of Industrial Ecology, Department of Chemical Engineering and Technology, Royal Institute of Technology, Stockholm, Sweden (TRITA-KET-IM 2000:15).
Björklund, A. (1998) Environmental systems analysis of waste management with emphasis on
substance flows and environmental impact, Licentiate Thesis, Division of Industrial Ecology, Department of Chemical Engineering and Technology, Royal Institute of Technology, Stockholm, Sweden (TRITA-KET-IM 1998:16, AFR-Report 211).
Brattebro, H. (2001) Formal Education in Industrial Ecology. The Science and Culture in
Industrial Ecology, The International Society for Industrial Ecology, The Nederlands 12-14 November 2001. [Online] <www.yale.edu/is4ie/images/Brettebro.pdf>
Bringezu, S., Fischer-Kowalski, M., Kleijn, R., Palm, V. (Eds.), (1997) Regional and National
Material Flow Accounting, From Paradigm to Practice of Sustainability, Proceedings of the ConAccount workshop 21–23 January 1997, Leiden, The Netherlands. Wuppertal Institute for Climate, Environment and Energy.
Dale, V. & English, M. (1999) Tools to aid environmental decision making, Chapter 3:
Environmental decision by organisations: Choosing the right tools, Springer-Verlag, New-York, USA.
Dalemo et al., (1997) M. Dalemo, B. Frostell, H. Jönsson, K. Mingarini, T. Nybrant, U. Sonesson
et al., ORWARE—a simulation model for organic waste handling systems, part 1: model description. Resources, Conservation and Recycling 21, pp 17–37.
EC Waste Incineration Directive. (1999). Council Directive 1999/31/EC, L 182/1, 26.4.1999,
Landfill of Waste. Official Journal of the European Communities, Brussels. Eriksson, O. and Frostell, B., (2001) An approach to sustainability assessment of energy systems,
Chapter 16, In: Silvera, S. (editors) Building Sustainable Energy Systems: Swedish Perspectives, Swedish National Energy Administration, Stockholm, pp 503-530.

Environmental Systems Analysis of Municipal Solid Waste Management in Chisinau, Moldova Current situation and future perspectives
49
Eriksson, Ola. (2003) Environmental and Economic Assessment of Swedish Municipal Solid Waste Management in a System Perspective, Doctoral Thesis, Industrial Ecology, Department of Chemical Engineering and Technology, Royal Institute of Technology, Stockholm.
Eriksson, Ola., Frostell, Björn., Björklund, A., Assefa, G., Sundqvist, J.-O., Granath, J., Carlsson,
M., Baky, A., Thysellius, L. (2002) ORWARE – a simulation tool for waste management. Resources, Conservation and Recycling 36, pp 287 – 307.
EU (1999) EU Focus on Waste Management, European Commission, Office for Official
Publications of the European Communities, Luxembourg. Gluch, P & Baumann, H. (2004), The life cycle costing (LCC) approach: a conceptual discussion
of its usefulness for environmental decision-making, Building and Environment 39, Issue 5 , pp 571-580.
Gustavsson, L., Lanshammar, H., and Sandblad, B. (1982) System och modell: en introduktion till
systemanalysen. Studentlitteratur, Lund, Sweden. ISO (1997) Environmental Management – Life Cycle Assessment – Principles and Framework.
ISO 14040:1997. European Committee for Standardization CEN, Brussels, Belgium. ISO (1998) Environmental Management – Life Cycle Assessment – Principles and Framework.
ISO 14041:1998. European Committee for Standardization CEN, Brussels, Belgium. Ludwing, C., Hellwek, S., Stucki, S., (2003) Municipal Solid Waste Management Strategies and
Technologies for Sustainable Solutions, Springer-Verlag, Germany, (ISBN3-540-44100-X). Miser, H. J., Quade, E. S. (1985) Handbook of systems analysis. Volume 1: Overview of Uses,
procedures, Applications and Practice, John Wiley & Sons, Chichester, New York, Brisbane, Toronto, Singapore (ISBN 0-471-90743-X).
Sonesson, U. (1996) The ORWARE Simulation Model-Compost and Transport Sub-Models.
Licentiate Thesis, Department of Agricultural Engineering, Swedish University of Agricultural Science, Uppsala, Sweden (Report No. 215).
Sonesson, U. (1998) System Analysis of Waste Management, The ORWARE model,
Transport and Compost Sub-Models, Doctoral Thesis, Swedish University of Agricultural Sciences, Uppsala.
Schübeler P., Wehrle K., Christen J., (1996) Conceptual Framework for Municipal Solid Waste
Management in Low-Income Countries, UNDP/UNCHS (Habitat)/World Bank/SDC Collaborative Programme on Municipal Solid Waste management in Low-Income Countries.
Read, A. (1999) Implementing solid waste management in UK; problems and barriers to
localize sustainable waste management, IWM Proceedings, March 1999, pp 19-25. Turner, R. (1995) Waste Management. In: H. Folmer, H. Gabel, and H. Opschoor (eds)
Principles of Environmental and Resource Economics, Aldershot: Edward Elgar.

Environmental Systems Analysis of Municipal Solid Waste Management in Chisinau, Moldova Current situation and future perspectives
50
Wrisberg, N., Udo de Haes, H., Bilitewski, B., Bringezu, S., Bro-Rasmusse, F., Clift, R.., Eder, P., Ekins, P., Frischknecht, R., and Triebswetter, U. (2002) Demand and supply of environmental information. In: N. Wrisberg and H.A. Udo de Haes (Eds.) Analytical Tools for environmental Design and Management in a systems perspective, The combined use of tools, Kluwer Academic Publishers, Boston.
Web sites (Statistical Yearbook of Moldova. 2004) http://www.statistica.md/statistics/dat/656/ro/Ecologia_si_mediul_1995_2003_ro.htm (MSW composition in USA, European Union and Developing Countries, 2005) http://www.geo.mtu.edu/~asmayer/ce5993/MSW%20overview%20January%2013%202005.pdf (Landfill Gas Capturing and Flaring at Chisinau landfill, Moldova) http://www.dnv.com/certification/ClimateChange/Upload/PDD_Chisinau%20Landfill_2004-07-27.pdf
Contacted people Ala Arghina, main bookkeeping, Regia Autosolubritate, tel. +373 22 740403 Radion Bajureanu, Prime vice-director of Central Environmental Agency subordinated to Ministry of Environment and Natural Resources of Republic of Moldova. tel. +373 22 281004 Elena Orlov, chief of the environmental division, Department of Statistic and Sociology of the Republic of Moldova. tel. +373 22 731747 Lidia Ilashcu, chief of environmental division, Municipality of Chisinau. tel. +373 22 238084 Andrei Isac, Regional Environmental Centre. tel. +373 22 238685 Nicu Vrednic. Journalist, Environmental informational centre of the Republic of Moldova, tel. +373 22 204533 Stefan Stasiev, main specialist in MSW, Ministry of Ecology and Natural Resources. tel. +373 22 204526 Tamara Guvir, specialist in MSW, Ministry of Ecology and Natural Resources. tel. +373 22 204526 Vladimir Garaba, president of Environmental Movement of Moldova, tel. + 373 22 226227


TRITA-KET-IM 2006:11 ISSN 1402-7615 Industrial Ecology, Royal Institute of Technology www.ima.kth.se