environmental report 2018 - kirin holdings · 2019-08-29 · kyowa hakko kirin, kyowa hakko bio,...
TRANSCRIPT

2018.9
EnvironmentalReport 2018

2
Corporate Governance SystemResponse to the New Frameworks for Disclosure of Climate Related InformationScenario AnalysisStakeholderResource CirculationPreventing PollutionSustainable ProcurementConsideration of the Environment in Product DevelopmentEnvironmental Education
Performance·highlight
Overview of Approaches Progress on Biological Resources Overview of Approaches in the Value Chain Tea farms Vineyards Hop Fields Paper and Printed Materials / Palm oil The Local ecosystem
ContentsAbout this Environmental Report
Message from Top ManagementCorporate DataMessage from the Director in Charge of CSV StrategyTop Management DialogueIdentification of MaterialitiesKirin Group Long-Term Environmental VisionCSV CommitmentStrategies for responding to key environmental issuesKey Targets of the Long-Term Environmental Vision and CSV CommitmentsProgressExternal Evaluation
89919293949599100101103
3
45681012131416
1718
Environmental Data Calculation MethodsEnvironmental AccountingMaterial BalanceWater ResourcesContainers and PackagingGlobal WarmingReduction of waste and prevention of pollutionStatus of Environmental Management CertificationsGRI Contents IndexIndependent Assurance Report
Activity
Environmental Strategy
Environmental Data
21222324252627282930
3233343536373839404142444546474849525354565859606162636465666768
Overview of Approaches Progress on Water Resources Overview of Approaches in the Value Chain The production regions Water sources Manufacturing Wastewater Business Location Water Risk Assessment Value Chain Water Risk Assessment Water Graphs
Overview of Approaches Progress on Containers and Packaging Overview of Approaches in the Value Chain The Sustainability of raw materials Reduce Recycling Reuse With the Society Graphs for Containers and Packaging
Overview of Approaches Progress on Global Warming Overview of Approaches in the Value Chain Value chain upstream Manufacturing Distribution Sale Natural energy GHG date GHG Graphs
Biological Resources
Water Resources Environmental management
Containers and Packaging
Global Warming
707175
767781828386
87
Env i ron m e n t a lS t ra teg y
Env i ron m e n t a lDa t a
Ac t i v i t y■Biological Resources ■Water Resources ■Containers and Packaging ■Global Warming ■Environmental management

3
GRI Standards 2016 Environmental Reporting Guidelines (FY2018 version),Ministry of the Environment of JapanDraft framework for reporting environmental information & natural capital, ClimateDisclosure Standards Board (CDSB) (October 2014 version)
Forward-looking statements in this report, including forecasts, targets, and plans, are based on the current assessments by management at the time of preparation of the report. They contain inherent uncertainty that the outcomes will differ from the statements in this report due to changes in a variety of factors. Statements about risks and opportunities are also included in the report from the perspective of proactive information disclosure, even if they do not necessarily constitute risk factors that would have a material impact on investor decisions. The Kirin Group will, upon identification and acknowledgment of various risks associated with its business, strive to strengthen its risk management structure and to prevent and mitigate those risks, and will make its best efforts to respond to risks that become apparent.
Kirin Holdings InvestorRelations Informationhttps://www.kirinholdings.co.jp/english/ir/library/
KIRIN REPORT 2018 (Integrated Report)https://www.kirinholdings.co.jp/english/ir/library/integrated/
KYOWA KIRIN Annual Reporthttp://ir.kyowa-kirin.com/en/index.html
Kirin Holdings CSV Website https://www.kirinholdings.co.jp/english/
KIRIN GROUPENVIRONMENTAL REPORThttps://www.kirinholdings.co.jp/english/csv/report/env/
LION SUSTAINABILITY REPORThttp://lionco.com/sustainability/sustainability-reports
About this Environmental Report
The Kirin Group consists of its Integrated Beverages Business, which covers Japan, Oceania, and Asia, its Pharmaceuticals and Bio-chemicals Business, and other businesses, with the Integrated Beverages Business, including overseas operations, accounting for approximately 80% of net sales. Initiatives to address the environmental issues are positioned as one of the three key issues of CSV (the creation of value that can be shared with society), which is the core of our management strategy for the realization of sustainable growth. The editing of this report has taken into account the characteristics of the Kirin Group’s business and the positioning of its environmental approaches.
FY2017 (January–December 2017)Please note that some environmental data for Lion Pty Limited covers the period October 2016-September 2017.Where necessary, this report also contains historical data showing trends for the past 3 to 5 years.
About Calculation Method of Environmental Data
Information on the corporate activities of the Kirin Group, including this Report, discloses a diverse range of information in the interests of shareholders and investors, as well as the interests of a wide range of stakeholders in our local communities, including our customers.
Editorial Policy
Reporting Period
Organizations Covered by this Report (FY2017)
Calculation Method of Environmental Data
Reference Guidelines
Structure of Corporate Information Disclosure
Business Company
Japan Integrated Beverages Business
Kirin, Kirin And Communications, Kirin Engineering, Kirin City, Kirin Techno-System, Kirin Brewery, Kirin Distillery, Kirin Group Logistics, Spring Valley Brewery, Eishogen, Mercian, Nippon Liquor, Daiichi Alcohol, Wine Curation, Kirin Beverage, Shinshu Beverage, Kirin Beverage Value Vendor, Hokkaido Kirin Beverage, Kirin Maintenance Service, Kirin Tropicana, Each Site Of Kirin Beverage Service (Hokkaido, Sendai, Tokyo, Tokai, Chubu, Kansai), Hakodate Daiichi Vending, Kirinvivax, Tokai Beverage Service
Overseas Integrated Beverages Business
Kirin Brewery (Zhuhai), Lion, Myanmar Brewery, Interfood, Vietnam Kirin Beverage, Four Roses Distillery, Azuma Kirin
Pharmaceuticals and Bio-chemicals Business
Kyowa Hakko Kirin, Kyowa Hakko Bio, Kyowa Pharma Chemical, Kyowa Medex, Kyowa Hakko Kirin China Pharmaceutical, Biokyowa Inc., Shanghai Kyowa Amino Acid, Thai Kyowa Biotechnologies
Other Kirin Holdings, Kirin Business Expert, Kirin Business System, Koiwai Dairy Products, Kirin Echo
▶P.89〜P.91
▶P.101〜P.102
Env i ron m e n t a lS t ra teg y
Env i ron m e n t a lDa t a
Ac t i v i t y■Biological Resources ■Water Resources ■Containers and Packaging ■Global Warming ■Environmental management

4
Message from Top Management
President and CEOKirin Holdings Company, Limited
Yoshinori Isozaki
Tackling Social Issues and Creating Value Together with Our Stakeholders
The Kirin Group has three core businesses: alcoholic beverages; non-alcoholic beverages; and pharmaceuticals and bio-chemicals. In the past, these businesses enjoyed stable growth as their markets expanded with economic growth. In recent years, however, with low fertility rate, longevity and declining population, they are facing difficult times. For example, growth in the Japanese beer market has been declining for more than twenty years. The global market is also growing increasingly mature as economic growth slows in North America, Europe and Oceania.In such difficult circumstances, the key to the Kirin Group for achieving long-term growth is creating shared value (CSV), which we positioned as our core management principle from 2012. With the CSV concept, instead of reacting passively to a changing market, we view those changes as a business opportunity.The Kirin Group has a unique business portfolio, comprising the two domains of food and medicine. There is none other like it anywhere in the world. In building this portfolio, we have gained technological
and marketing acumen that we leverage using our management resources to deliver products and services true to the Kirin brand. It is by focusing on positive outcomes for social value and economic value that we will be able to achieve sustainable growt h.
Increasingly, investors are using environmental, social, and governance initiatives as a measure when considering a firm’s investment potential. Behind this trend is the belief that a firm will not be sustainable if the economic value it achieves depends tradeoffs against society, the environment, employees, and other stakeholders.It was against this background that the Kirin Group announced its CSV Story and CSV Commitment in February 2017. We selected health and well-being, community engagement, environment, and our responsibility as an alcoholic beverages manufacturer, the premise of a corporate group handling alcoholic beverages, as the social issues that the Group would address as a priority. We have incorporated these issues into specific initiatives, using the United Nations’ Sustainable Development Goals (SDGs) and other measures as reference.Looking ahead, in addition to technological innovations, the acceleration of these initiatives will require major reforms, including changes to processes and systems of business and society.When the company was first founded about 110 years ago, no doubt, our founders had overcome many and varied hurdles in their desire to “make society brighter by providing the people delicious beer and making them happy”. Never forgetting this founding spirit, we will continue to engage ourselves in the creation of new value that looks towards the next 100 years.
Striving to Create New Valuefor the Next 100 Years
“New Kirin Group Vision 2021” (New KV2021)
Value CreationSocial issues
Technological CapabilitiesOrganizations Capabilities
Value CreationConsumer
expectations
2021 Vision
Creation of Economic Value and Social Value
“Passion and Integrity”
Outcomes
Strategicframework
“One Kirin” Values
(=Kirin Group'sunique CSV)
Co-achieve sustainable growth with our societies by realizing value creation, addressing social issues and understanding consumer expectations via the core businesses* of the Kirin group
* alcoholic beverages, non-alcoholic beverages, pharmaceuticals and bio-chemicals
Env i ron m e n t a lS t ra teg y
Env i ron m e n t a lDa t a
Ac t i v i t y■Biological Resources ■Water Resources ■Containers and Packaging ■Global Warming ■Environmental management

5
Corporate Data Trade NameDate of IncorporationHead Office
President and CEOPaid-in CapitalNumber of EmployeesMain Business
Kirin Holdings Company, LimitedFebruary 23, 1907
NAKANO CENTRAL PARK SOUTH10-2, Nakano 4-chome, Nakano-ku, Tokyo 164-0001, Japan+81-3-6837-7000 [ Information Desk ]
Yoshinori Isozaki102,045,793,357 yen31,033employees on a consolidated basis(as of March 29, 2018)Developing group-wide management strategies and overseeing their implementation
Normalized EPS/Normalized current profitConsolidated operating profit/Consolidated operating profit margin
NormalizedEPS
Normalizedcurrent profit
0
40
80
120
2013 2014 2015 2016 2017 2013 2014 2015 2016 2017
Consolidatedoperatingprofit margin
Consolidatedoperatingprofit
160
0
500
1,000
1,500
2,000
0
4
8
12
16
0
400
800
1,200
1,600(yen) (billion yen) (billion yen) (%)
ROE/Current profit margin
0
5
-5
10
15
20
25
2013 2014 2015 2016 2017
30(%)
1,377billion yen
151yen(+8.6%)
12.3%
1,943billion yen
Currentprofit margin
ROE
29.1%
13.0%
Kirin Holdings Co., Ltd.
Japan IntegratedBeverages Business
50 subsidaries
Note:The Other business segment includes Koiwai Dairy Products Co, Ltd,and one other company.
Overseas IntegratedBeverages Business
91 subsidaries
Pharmaceuticals andBio-chemicals Business
49 subsidaries
Kirin Co., Ltd. Lion Pty Ltd.
MyanmarBrewery LimitedKirin Holdings
Singapore Pte.Ltd
Kirin Brewery Co., Ltd.
Kirin Beverage Co., Ltd.
Mercian Corporation
46 other subsidaries
88 other subsidaries
47 other subsidaries
Kyowa Hakko Kirin Co., Ltd.
Kyowa Hakko Bio Co., Ltd.
Japan IntegratedBeverages Business
37.3%
Overseas IntegratedBeverages Business
34.0%
Pharmaceuticals andBio-chemicals Business
32.0%
Other
0.5%
Intercompany eliminations
-3.8%
Japan IntegratedBeverages Business
56.4%
Overseas IntegratedBeverages Business
24.1%
Pharmaceuticals andBio-chemicals Business
18.6%
Other
0.9%
1trillion
8,637billion yen
2017 Operating profit2017 Sales revenue
1,943billion yen
■Invest, strengthen, and grow profit base in the beer business (Kirin Brewery, Lion Beer,Spirits and Wine, Myanmar Brewery)■Restructure and revitalize low-profit businesses (Brazil Kirin, Kirin Beverage, Lion Daily&Drinks)■Invest to realize outstanding growth in the Pharmaceutical and Bio-chemicals businesses(Kyowa Hakko Kirin)
■ROE before goodwill amortization etc.: 15% or higher■CAGR in normalized* EPS: 6% or higher
■Dividends30%+of normalized EPS-Stable returns to shareholders■Steadily repay debt to achieve financial flexibility
Kirin Group 2016-2018 Medium-term Business Plan
Basic Policy Restructure and Revitalize Kirin, Groupwide
Implement specific strategies in accordance with the positioning of each business
Raising Group profitability is our top priority, Targeting increased capital efficiency and sustained growth in shareholder value.
Stable shareholder returns through dividends, enhanced financial flexibility
KeyInitiatives
2018QuantitativeTargets
Financialstrategy
*The Kirin Group adopted International Financial Reporting Standards (IFRS) in December 2017. For details, please refer to the Financial and Non-Financial Highlights of KIRIN REPORT 2018.
*Normalized EPS = adjusted net income / average number of shares outstanding during periodAdjusted net income = net income + depreciation of goodwill, etc. +/- extraordinary gains/losses aftertaxes & minority interests
Env i ron m e n t a lS t ra teg y
Env i ron m e n t a lDa t a
Ac t i v i t y■Biological Resources ■Water Resources ■Containers and Packaging ■Global Warming ■Environmental management

6
Japan-grown hops and craft beer
Message from the Director in Charge of CSV Strategy
Enhancement of the natural and social capital that is essential to Kirin’s business and the creation of
Kirin’s economic value
Creation of value that can be shared with society
Marketing capability and knowledge / Know-how / Networks
* See KIRIN Report for details of the Kirin Group’s Value Creation Model.
・Stabilization of hops production・Securing new hops growers
・Longevity of growers・Decline in Japanese hops production
・Expansion of craft beer・Differentiation with Japan-grown hops
Hops Fields Living Species SurveyPromotion of the TONO
BEER EXPERIENCE
・Leadership in new categories・Expansion of high value-added products
CSV ModelAt the United Nations Summit in 2015, 17 Sustainable Development Goals (SDGs) were adopted as goals for the public and private sectors throughout the world to work toward by 2030. Engagement in solutions to social issues has been described as a way of not only contributing to the natural environment and society, but also leading to the sustainable growth of nations and companies. The Kirin Group’s CSV Commitment, established in February 2017, was also developed on the basis of this belief. Finding solutions to social issues through business is also the source of the growth of Kirin’s business.We have positioned the environment as one of the three priority CSV challenges for the Kirin Group. One initiative to meet that challenge is our commitment to protecting the natural environment and preserving ecosystems in the regions where our ingredients are grown and in our business domains.
Take Japan-grown hops, for example. Hops are one of the ingredients of beer. Almost all of Japan’s hops are grown in the Tohoku region. Kirin purchases about 70% of the hops grown in Japan. Contracted farming of hops in Tono in Iwate Prefecture has continued for more than fifty years. In recent years, however, as farmers have aged, the area’s population has declined and production has fallen sharply, putting the very survival of hops farming at risk. Together with the City of Tono, Kirin has responded to this crisis with a variety of regional revitalization initiatives designed to take maximum advantage of the value of hops. Surrounded by windbreak forests, the hops fields have value as traditional Japanese rural landscapes. The Hops Fields Living Species Survey, which revealed that they protect the biodiversity of the area, is an example of the action we are taking in this area.Meanwhile, the craft beer market has shown remarkable growth in Japan in recent years. The varieties of hops and the way they are used in the beer have become major selling points. Craft beer brewers favor Japan-grown hops for their
Director of the Board, Senior Executive Officer Kirin Company,Limited and Director of the Board, Senior Executive Officer Kirin Holdings Company,Limited
Ryosuke Mizouchi(Group CSV Stratery)
Creating value for Japanese hops through craft beers.
CSV, the Source of Kirin's Business Growth
Regional issues
Kirin’s issues
Japan-grown hops and craft beer
Communityengagement
The Environment
Env i ron m e n t a lS t ra teg y
Env i ron m e n t a lDa t a
Ac t i v i t y■Biological Resources ■Water Resources ■Containers and Packaging ■Global Warming ■Environmental management

7
Regional issues
Mercian’s issues
・Expansion of idle and devastated land
・Loss of jobs
・Expansion of Japanese-made wine
・Expansion of vineyards in Japan
・Leadership in the Japanese wine industry・Expansion of high value-added products
・Vineyard ecosystem surveys
・Vegetation regeneration activities
・Conversion of idle and devastated land to vineyards
・Establishment of new wineries
・Regional revitalization・Job growth
Marketing capability and knowledge / Know-how / Networks
Value that can be shared with society
Enhancement of the natural and social capital that is essential to Kirin’s business and the creation of
Kirin’s economic value
Japanese wine and Vineyards
CSV Model
distinctive, delicate flavor, but are finding it difficult to secure adequate supplies. Kirin has come to the rescue by launching external sales of Japan-grown CSV-model hops under its own brand, “IBUKI”. We are likely to see the further extension of these dual trends of solving the problems of an ingredient production area and nurturing the craft beer market with the expansion of Tap Marché, our initiative to encourage the enjoyment of Japanese craft beers at bars and restaurants around the country.The growth of craft beers made with Japan-grown hops will not only provide production stability for hops growers. The increased interest in craft beer will help to secure new hops growers, which will be the key to that stability, and to protect the traditional rural landscapes. Kirin, too, will benefit. By driving the growth of the lucrative craft beer market and becoming a leader in that market, we can expect to see improvements in our profit margins and increases in sales revenue.
The same can also be said for the expansion of vineyards that grow wine grapes in Japan.According to the National Tax Agency’s Overview of Wine Production in Japan, the volume of Japan-made wine shipped to domestic market in 2016 increased by 5.2% compared to 2015, and accounted for 4.8% of total domestic market. Mercian also has plans to double its production over 2016 figures by 2027, making the opening of new vineyards for Japanese wine a task of much urgency. Ecological surveys have been undertaken at Mercian’s directly-managed Mariko Vineyard by National Agriculture and Food Research Organization, NARO, at Mercian’s request to determine what kind of impact the conversion of idle farming land into vineyards has had on the area’s ecosystems. These surveys have found that the vineyards for Japanese wines play a role as quality grasslands. They are serving to cultivate diverse ecosystems, including for endangered species. These findings are very beneficial for the many Japanese wine businesses who are seeking to convert idle and devastated land into vineyards. The expansion of Japanese wine will solve social issues such as the use of idle and devastated land and regional revitalization, while at the same time, enriching the
area’s ecosystems. We will publicize these findings widely going forward and continue to conduct further scientific studies.
We are also taking actions in the areas of water resources, containers and packaging, and global warming.In the area of water resources, we are conducting surveys of the water risks of catchment areas around our manufacturing plants and upstream in the value chain. After the first such survey was conducted in 2014, a more precise survey was conducted in 2017. The results of the later survey confirmed a high water risk in the regions producing the tea leaves used to produce black tea. In light of these findings, in addition to assisting tea growers to obtain Rainforest Alliance certification, we decided to launch water source conservation activities on the tea farms. We anticipate that these initiatives will improve the water source cultivation function of highland tea farms. It is also hoped that the stable supply of black tea leaves will support the sustainable growth of Gogo-no-Kocha. In containers and packaging, in addition to the pursuit of lighter containers and packaging, we also working on the adoption of FSC®-certified paper for our paper containers. We aim to switch over completely by the end of 2020. As well as solving the problems of the forests, this will also guarantee the sustainability of paper containers. In response to global warming, we have prepared a roadmap that includes the introduction of renewable energies, to achieve SBT* approved greenhouse-gas reduction targets. Further, to counter the problem of a shortage of truck drivers, we have embarked on large-scale joint delivery with our competitors. This has enabled us to reduce our CO2 emissions and to achieve stable delivery frameworks.All of these environmental initiatives demonstrate that our work in this area has moved beyond the stage of merely environmental considerations in our business activities and has entered the stage of taking action as business strategies that will contribute to both social value and Kirin’s value.Looking ahead, as we strive to create a happy future together with our customers, as well as contributing to society by solving social issues through business, we will pursue CSV as the source of our next growth. *For details about SBT ▶P.59
Expansion of vineyards for Japanese wine will enrich ecosystems
Social value and Kirin’s value brought by CSV
Communityengagement
The Environment
Env i ron m e n t a lS t ra teg y
Env i ron m e n t a lDa t a
Ac t i v i t y■Biological Resources ■Water Resources ■Containers and Packaging ■Global Warming ■Environmental management

8
Top Management Dialogue
CDPChief Executive OfficerPaul Simpson
Director of the Board, Senior Executive Officer Kirin Company,Limited and Director of the Board, Senior Executive Officer Kirin Holdings Company,LimitedRyosuke Mizouchi (Group CSV Stratery)
Simpson●Kirin is displaying leadership with the many climate change and water initiatives it is pursuing.Mizouchi●Thank you.Simpson●For a large-scale global corporation like Kirin, supply chains are an important issue.Mizouchi●We believe so. That is why we have set a target of reducing our Scope 3 greenhouse gas emissions by 30% from 2015 levels by 2030. This target has been approved by the SBT initiative as a science based target.Simpson●I think a 30% reduction is extremely ambitious. The world’s leading firms have all declared science based reduction targets. They are of a similar level and I think they are appropriate.Mizouchi●Kirin’s objective in participating in CDP is transparent disclosure. However, disclosure alone is meaningless. It is important to set targets, develop plans, and execute them. If you think about in this way, setting science based targets and working to achieve those targets is the obvious step to take.Simpson●I am very glad that you made that decision. I have heard that many firms have found that setting ambitious targets raises the motivation of their employees.Mizouchi●At Kirin as well, our employees are engaging very enthusiastically in planning to meet the targets.
Simpson●What challenges do you envisage encountering in seeking the cooperation of your supply chain? Also, will it only be your supply chain in Japan that you will target?Mizouchi●Of course, our entire supply chain, including overseas, will be targeted. There are various issues regarding the supply chain initiatives, but at the same time, these also represent an opportunity for Kirin. For example, in Japan, there is a shortage of truck drivers to deliver our beer and beverages. So what we did was to talk to our
Paul Simpson, CEO of CDP, and Ryosuke Mizouchi, Senior Executive Officer of Kirin Holdings and director in charge of CSV strategy, held a discussion on November 30, 2017, during the former’s visit to Japan. CDP is an international non-profit organization that provides environmental information disclosure systems. Its data are some of the most referenced data in ESG today.
competitors, and we chose to solve this problem with joint delivery. This initiative is still confined to certain regions, including Hokkaido and Hokuriku, but we hope to extend it to the whole of Japan in future. As well as solving the company’s problem of a shortage of drivers, this initiative will also serve to reduce our CO2 emissions. The only thing is that many of the companies in the logistics sector are small businesses, so the question will be how to support those companies. Overseas, in Australia, where we have large operations, the problem is rising electricity prices. To counter this, we decided to build a 10-megawatt solar power generation facility by 2026. For improvement of the supply chain, we have the same major problem as in Japan about how to obtain the cooperation of small businesses. In Asia, we acquired a beer company in Myanmar two years ago. The business is expanding, but the brewery is extremely outdated. As well as undertaking new investments to expand production capacity, we plan to achieve major reductions in CO2 emissions by introducing state-of-the-art energy-saving equipment.Simpson●As you say, challenges certainly have the potential to become opportunities for businesses. One thing that CDP is doing is to provide support. It is only natural that companies compete; that is how they create Paul Simpson
Env i ron m e n t a lS t ra teg y
Env i ron m e n t a lDa t a
Ac t i v i t y■Biological Resources ■Water Resources ■Containers and Packaging ■Global Warming ■Environmental management

9
value. However, when it comes to sustainability, I think there are many opportunities to be captured through cooperation among companies from different industries and even, on occasion, competitors in the same industry. The presence of many small suppliers is a challenge, but some global firms are transferring their knowledge to their suppliers by providing training, and even investing directly in those small suppliers, as a means of reducing energy costs and sharing the benefits. Previously, it was common for the companies to treat the know-hows regarding these kinds of initiatives as confidential, but today, the notion that companies can learn from each other by sharing these know-hows as best practices is becoming increasingly common.Mizouchi●We at Kirin hope to become a model company among Japanese companies in terms of such solutions. CDP has a wealth of knowledge about best practice in the reduction of greenhouse gases, so it would be wonderful if you could share it with us.Simpson●We would be happy to. Water is an important resource of Kirin, and you are undertaking leading initiatives in this area as well, I understand.Mizouchi●To make the best beer, we need clean, high quality water, so the issue of water is our most important challenge. There is plenty of clean water in Japan, but in Australia, water is in short supply. We try to understand the regional nature of these kinds of water issues, and in Australia, we aim to implement more sophisticated water-saving measures.Simpson●A survey that CDP conducted also revealed that, while water is plentiful in Japan and Northern Europe, water shortages and deterioration of water quality have become serious problems elsewhere, such as Southern Europe, the United States, China, India, and Australia. Meanwhile, the World Economic Forum has described water issues as the most serious global economic risk. Many people still consider climate change and the issues of water and forests to be separate issues, but they are
actually inseparable issues.Mizouchi●In Japan, there is a common recognition that water is a precious resource, but perhaps because it is so plentiful here, I have the feeling that Japan is lagging behind somewhat in its understanding that water is a global issue and that it is connected to many other issues. On the other hand, Japan imports much of its fuel and raw materials, so there is a sense that it would be easier to make progress in energy and resources issues. While it will be difficult to achieve 100% renewable energy immediately, we do have a policy to increase it steadily.Simpson●Energy is something that everyone needs. Japan has made significant technological advances in the improvement of energy efficiency, so I have great expectations.Mizouchi●Myanmar is a good example. We think that investment in technology will lead to major opportunities.Simpson●Is there anything that CDP can do for you?Mizouchi●Having received a high rating from CDP in the areas of climate change and water, we hope we can use that to secure finance through ESG investments that will allow us to conduct our business in sustainable ways.Simpson●I get the impression that Japan’s investment industry is somewhat behind in terms of ESG. The GPIF conducts many programs regarding ESG indices, so I think major progress will be made going forward.Mizouchi●Kirin holds meetings of various sizes with investors and securities analysts on an annual basis, so we have gained a real sense that this is the case. Five or six years ago, there were virtually no questions about ESG,
whereas today, we receive many questions about it.Simpson●I’m glad to hear that things are changing. We are very grateful for the cooperation that Kirin has given CDP over the years.Mizouchi●We are looking forward to the expansion of CDP’s activities. When more people have an understanding about CDP, I think we will see an increase in opportunities to invest in Kirin.Simpson●CDP is only a small organization, but we hope to provide support so that dialogue between investors and companies will continue to lead to investment decisions.Mizouchi●CDP is not small at all. We think it has huge influence. Thank you very much for coming to see us today.Simpson●Thank you for inviting me. I understand there is a place near here that serves Kirin’s craft beer. Next time, I hope we can raise a glass together.
Env i ron m e n t a lS t ra teg y
Env i ron m e n t a lDa t a
Ac t i v i t y■Biological Resources ■Water Resources ■Containers and Packaging ■Global Warming ■Environmental management

10
Identification of MaterialitiesFor the identification of environment-related materialities (important issues), we extract a variety of issues, considering the state of the natural capital, local communities and global environment, all of which are essential to the businesses of the Kirin Group, and taking into consideration trends in debate in Japan and abroad, and the perspectives of our diverse stakeholders. The executives then discuss these issues, identify the priority issues that impact on the sustainability of society and on the Group’s business, and incorporate them into our business plans.
Consideration of the environmental needs of 2050 The potential to wreak major harm on natural capital
Long-term environmental vision
Long-termmanegement plan
Technological Capabilities
Value CreationSocial issues
Value CreationConsumerexpectations
Organizations Capabilities
Realization of society that is based on 100% recyclingOur direction
Worldwide issues for 2050 (2012→2050)The Kirin Group has three core businesses: alcoholic beverages; non-alcoholic beverages; and pharmaceuticals and bio-chemicals. All of these products are made with the blessings of nature. These businesses are built directly on the blessings of natural capital. In 2050, the global population is forecast to increase greatly from the current 7.6 billion to 9.8 billion. This has the potential to wreak major harm on natural capital. We determined that, for the sake of a sustainable society and business, we needed to respond to these kinds of long-term risks.
The Kirin Group shares with all the people associated with its value chainits aspiration to continue to enjoy the bounty of nature and pass it down to the generations to come.
Identification of key environmental issues through dialogue and discussions
Through wide-ranging dialogue with external experts, NGOs and other diverse stakeholders of the Kirin Group, as well as discussions with the Kirin Group operating companies and the executives, we identified and considered the risks and opportunities for our business and society. Based on this, we identified biological resources, water resources, containers and packaging, and global warming as the most important environmental issues. At the Management Meeting in 2012, we established our Long-Term Environmental Vision, the ideal image for the year 2050.
Integration into the Long-Term Business Plan
In our Long-Term Business Plan, New KV2021, in addition to the creation of value that will meet our customers’ expectations, we positioned the creation of value by addressing social issues as a new opportunity for growth, and revealed our 2021 Vision and our Strategic Framework for Value Creation. We also defined “technical expertise” as a strength of the Kirin Group. Through our core businesses of alcoholic beverage, non-alcoholic beverages, and pharmaceuticals and bio-chemicals, while leveraging the Group’s strength of technical expertise across the Group, we aim to balance solutions to social issues with the provision of value to consumes and realize the creation of both economic and social value. Through this, the Kirin Group’s own unique CSV, we aim to achieve sustainable growth together with society.
Ascertaining risks and opportunities
Determination of environmental materialities
Integration with Group CSV Strategy(Determination of Group materialities)
Area of matureforest
13.4% 40% Triple 50% more
Percentage of population living in areas with severe water stress
Annual extractionof resources
GHG emissions
WaterResources
BiologicalResources
GlobalWarming
Containers andPackaging
Products
※1 OECD(2012)Environmental Outlook to 2050※2 UNEP(2011)Decoupling natural resource use and environmental impacts from economic growth
※1 ※1※1 ※2downby
andmore
ormore
Materialities Decision-Making ProcessConsiders the circumstances surrounding the Kirin Group and extracts the relevant issues, referring to international standards and trends in domestic and international debate.
Consults extensively with various stakeholders, including external experts and NGOs, reflecting their views in internal discussions within Kirin.
Holds discussions at the executive management level, determines risks and opportunities for business and society, and develops an action plan, which includes target indicators.Ongoing consideration of the need for review of the materialities, reflecting the constantly changing state of social and environmental issues and the Kirin Group’s circumstances.
STEP 1Extraction of relevant issues
STEP 2Confirmation of appropriateness
STEP 3Identification of Materialities
STEP 4Ongoing Review
Env i ron m e n t a lS t ra teg y
Env i ron m e n t a lDa t a
Ac t i v i t y■Biological Resources ■Water Resources ■Containers and Packaging ■Global Warming ■Environmental management

11
2030Toward the Realization of our CSV Commitment
2050Toward the Realization of Our Long-TermEnvironmental Vision
Consideration of management issues for sustainable growth
We have identified the management issues for sustainable growth, mapped out their impact on social sustainability and on the Group’s business, and organized them into a Group Materiality Matrix. In February 2017, the Group CSV Committee decided on an order of priority to the issues within that Matrix, after taking into consideration the various guidelines and the perspectives of our stakeholders. We established that our responsibility as an alcoholic beverages manufacturer, health and well-being, community engagement, and environment as our CSV Priority Issues. For the environment, targets to be achieved in the medium term were set for the four themes of the Long-Term Environmental Vision.
Establishment of KPIs for contribution to SDGs
For the entire Group to share a common purpose and address our CSV Priority Issues, we have set down the vision we hope to achieve in the form of 17 commitments, referencing the SDGs (Sustainable Development Goals) adopted by the United Nations. We have also established concrete approaches and performance indicators for meeting those commitments. Four such commitments were set for the environment. Four of the commitments for community engagement also have a strong correlation with the environment, so will contribute to both.To address these issues, taking into account our management strengths and directions, as well as the risks and opportunities in aiming for the sustainable growth of our businesses, we have set key environmental issues to be addressed as a priority in our medium-term business plans and annual plans, turning the PDCA cycle as we address them.
Integration into business strategies and business plans
The Kirin Group has incorporated initiatives designed to achieve its Long-Term Environmental Vision and CSV Commitment into its business strategies, and we aim to create both social and economic value (CSV).
For each priority area set for the environment, we take into account our business strengths and directions and the risks and opportunities for sustainable growth, incorporate them into our business strategies, and implement our business plans.
Group Materiality Matrix
PDCA management
CSV Commitments Contribution to SDGs
CSV Priority Issues
Group CSV Committee
Impa
ct o
n so
cial
sus
tain
abili
ty
Impact on the Kirin Group’s business
Respon- sibility as a
pharmaceutical manufacturer
Sustainablesourcing Human rights
Humanresources
and corporateculture
Corporategovernance
New valuecreation
TheEnvironment
Health and well-being
Communitydevelopment
A Responsibilealcoholic producter
Safety and security of our
products
PLANDO
CH
ECK
ACT
TheEnvironment
Health and well-being
Communityengagement
12
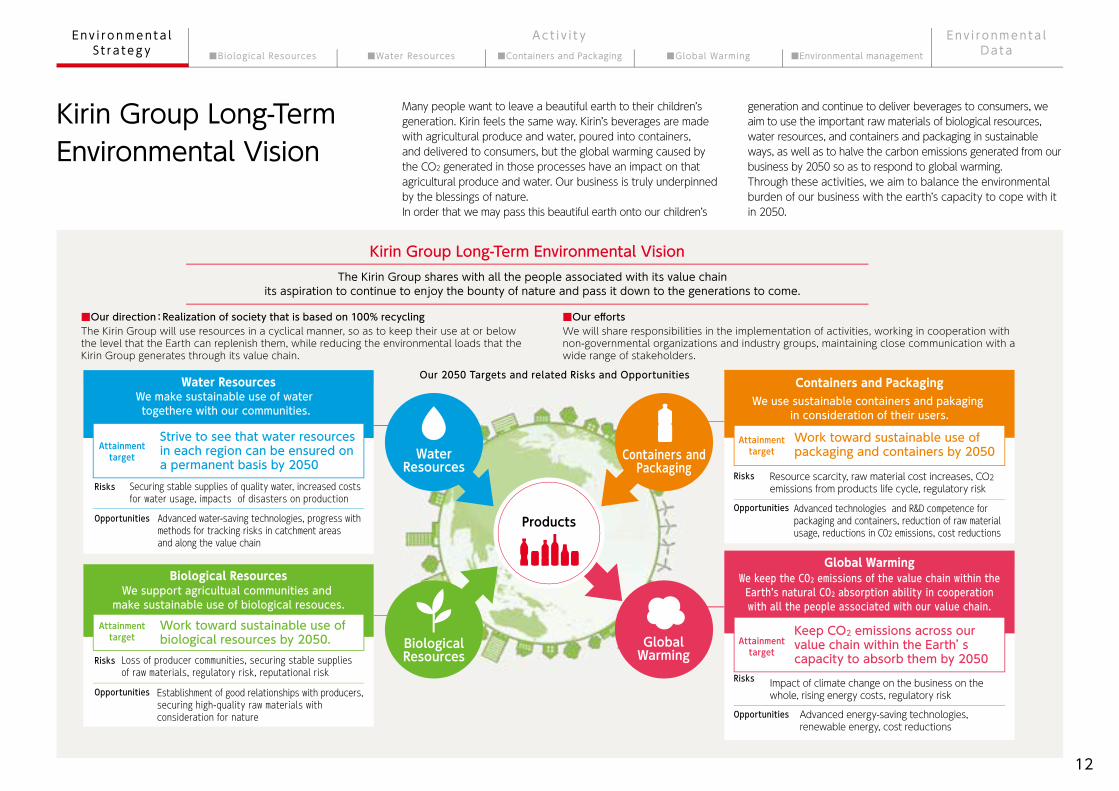
Kirin Group Long-Term Environmental Vision
Many people want to leave a beautiful earth to their children’s generation. Kirin feels the same way. Kirin’s beverages are made with agricultural produce and water, poured into containers, and delivered to consumers, but the global warming caused by the CO2 generated in those processes have an impact on that agricultural produce and water. Our business is truly underpinned by the blessings of nature.In order that we may pass this beautiful earth onto our children’s
Our 2050 Targets and related Risks and Opportunities
Securing stable supplies of quality water, increased costs for water usage, impacts of disasters on production
Advanced water-saving technologies, progress with methods for tracking risks in catchment areas and along the value chain
WaterResources
We support agricultual communities and make sustainable use of biological resouces.
We make sustainable use of water togethere with our communities.
Strive to see that water resources in each region can be ensured on a permanent basis by 2050
Attainmenttarget
Attainmenttarget
Work toward sustainable use of biological resources by 2050.
Loss of producer communities, securing stable suppliesof raw materials, regulatory risk, reputational risk
Establishment of good relationships with producers,securing high-quality raw materials withconsideration for nature
Risks
Opportunities
Risks
Opportunities
Keep CO2 emissions across our value chain within the Earth’s capacity to absorb them by 2050
Impact of climate change on the business on the whole, rising energy costs, regulatory risk
Advanced energy-saving technologies, renewable energy, cost reductions
Attainmenttarget
Attainmenttarget
Work toward sustainable use of packaging and containers by 2050
Resource scarcity, raw material cost increases, CO2 emissions from products life cycle, regulatory risk
Advanced technologies and R&D competence for packaging and containers, reduction of raw material usage, reductions in CO2 emissions, cost reductions
We use sustainable containers and pakaging in consideration of their users.
We keep the CO2 emissions of the value chain within theEarth’s natural CO2 absorption ability in cooperationwith all the people associated with our value chain.
Risks
Opportunities
Risks
Opportunities
WaterResources
BiologicalResources
BiologicalResources
GlobalWarming
GlobalWarming
Containers andPackaging
ContainersandPackaging
Products
generation and continue to deliver beverages to consumers, we aim to use the important raw materials of biological resources, water resources, and containers and packaging in sustainable ways, as well as to halve the carbon emissions generated from our business by 2050 so as to respond to global warming.Through these activities, we aim to balance the environmental burden of our business with the earth’s capacity to cope with it in 2050.
Kirin Group Long-Term Environmental VisionThe Kirin Group shares with all the people associated with its value chain
its aspiration to continue to enjoy the bounty of nature and pass it down to the generations to come.
■Our direction:Realization of society that is based on 100% recyclingThe Kirin Group will use resources in a cyclical manner, so as to keep their use at or below the level that the Earth can replenish them, while reducing the environmental loads that the Kirin Group generates through its value chain.
■Our effortsWe will share responsibilities in the implementation of activities, working in cooperation with non-governmental organizations and industry groups, maintaining close communication with a wide range of stakeholders.
Env i ron m e n t a lS t ra teg y
Env i ron m e n t a lDa t a
Ac t i v i t y■Biological Resources ■Water Resources ■Containers and Packaging ■Global Warming ■Environmental management

13
CSV Commitment Our CSV Commitment sets out 16 commitments that clarify the medium to long-term image we are aiming for through our business. Among those 16 commitments, there are four that deal with social issues related to the environment, which have target years between 2020 and 2030 to meet our Long-
* Our entire CSV Commitment, which, in addition to environment, includes our commitment as a responsible alcohol producer, to health and well-being, and to community engagement, is disclosed in detail on the following webpage: https://www.kirinholdings.co.jp/english/csv/commitment/
Term Environmental Vision. Four other commitments related to community engagement will also solve social issues related to the environment. The entire Group will unite as one to engage in these commitments, with the aim of contributing to a happy future for consumers.
We will reduce water usage in production activities, and continuously preserve water sources.
We will continue to reduce the weight of containers and packaging, and rely less on non-renewable resources and increase the sustainability of materials.
We will work to further reduce GHG emissions through various initiatives including the introduction of renewable energy.
Suppliers, Group companies
Community, Group companies
Customers, suppliers, Group companies
Suppliers, Group companies
We will work on improving the quality and stable procurement of Japanese hops and brew unique beers that can only be made by using Japanese hops, while contributing to the revitalization of key producing areas. (Kirin Brewery)We will support Sri Lankan black tea farmers through long-term initiatives such as facilitating the acquisition of Rainforest Alliance certification, and expand the use of certified tea leaves. (Kirin Beverage)We will drive development of Japanese wines to ensure global recognition, and contribute to revitalizing key producing areas and local communities that are the foundations of growing grapes and making wines. (Mercian)We will continue to develop long-term, sustainable and mutually beneficial partnerships with our dairy farmers that build a profitable demand for dairy and ensure sustainable returns and the creation of value through the supply chain. (Lion)
We will protect the natural environment and preserve the ecosystems surrounding our business sites as well as areas rich in raw materials.
Kirin Group Long-Term Environmental VisionCSV Commitment(2020~2030)
CommunityEngagementEnhancing sustainability of the supply chain
The EnvironmentReflecting environmentalactivities in our business strategies
We keep the CO2 emissions of the value chainwithin the Earth’s natural CO2 absorption ability in cooperation with all the people associated with our value chain.Attainment target:Keep CO2 emissions across our value chain within the Earth’s capacity to absorb them by 2050
We use sustainable containers and pakaging in consideration of their users.Attainment target:Work toward sustainable use of packaging and containers by 2050
We make sustainable use of water togethere with our communities.Attainment target:Strive to see that water resources in each region can be ensured on a permanent basis by 2050
We support agricultual communities and make sustainable use of biological resouces.Attainment target:Work toward sustainable use of biological resources by 2050.
Social Issues SDGs Our Commitment Scope
Env i ron m e n t a lS t ra teg y
Env i ron m e n t a lDa t a
Ac t i v i t y■Biological Resources ■Water Resources ■Containers and Packaging ■Global Warming ■Environmental management
14
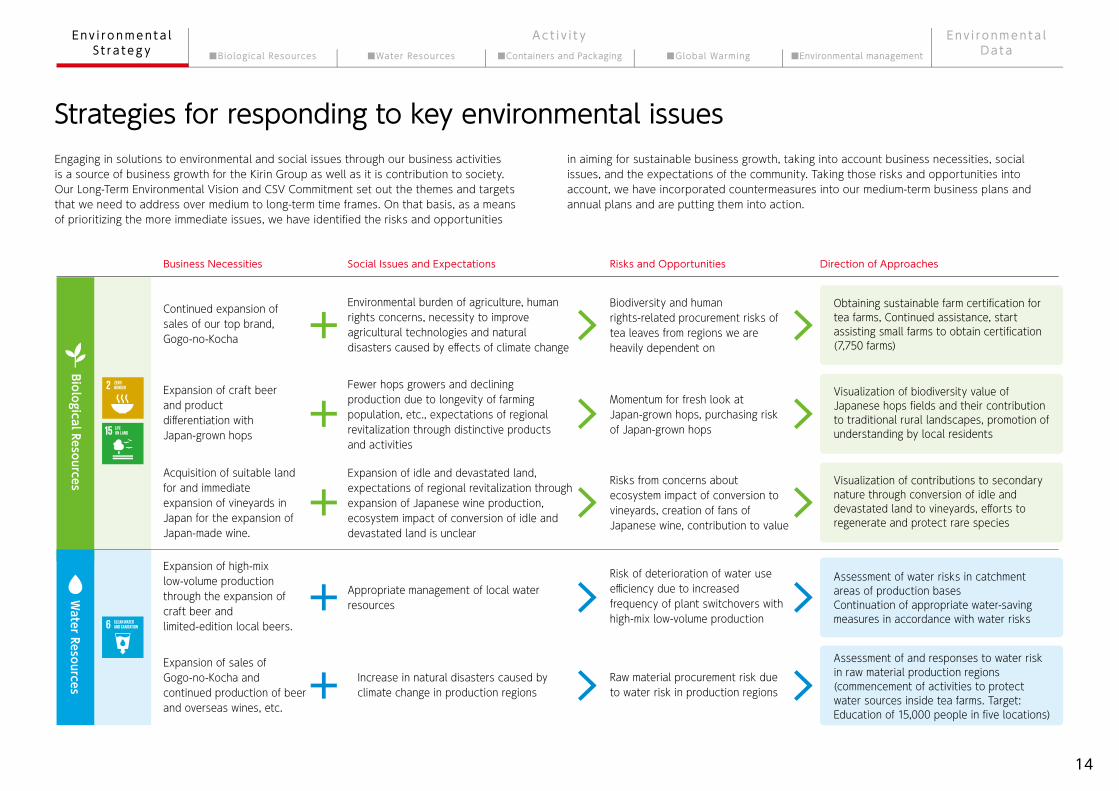
Strategies for responding to key environmental issuesEngaging in solutions to environmental and social issues through our business activities is a source of business growth for the Kirin Group as well as it is contribution to society. Our Long-Term Environmental Vision and CSV Commitment set out the themes and targets that we need to address over medium to long-term time frames. On that basis, as a means of prioritizing the more immediate issues, we have identified the risks and opportunities
in aiming for sustainable business growth, taking into account business necessities, social issues, and the expectations of the community. Taking those risks and opportunities into account, we have incorporated countermeasures into our medium-term business plans and annual plans and are putting them into action.
Business Necessities Social Issues and Expectations Risks and Opportunities Direction of Approaches
Continued expansion of sales of our top brand, Gogo-no-Kocha
Expansion of craft beer and product differentiation with Japan-grown hops
Acquisition of suitable land for and immediate expansion of vineyards in Japan for the expansion of Japan-made wine.
Expansion of high-mix low-volume production through the expansion of craft beer and limited-edition local beers.
Expansion of sales of Gogo-no-Kocha and continued production of beer and overseas wines, etc.
Environmental burden of agriculture, human rights concerns, necessity to improve agricultural technologies and natural disasters caused by effects of climate change
Fewer hops growers and declining production due to longevity of farming population, etc., expectations of regional revitalization through distinctive products and activities
Expansion of idle and devastated land, expectations of regional revitalization through expansion of Japanese wine production, ecosystem impact of conversion of idle and devastated land is unclear
Appropriate management of local water resources
Increase in natural disasters caused by climate change in production regions
Biodiversity and human rights-related procurement risks of tea leaves from regions we are heavily dependent on
Obtaining sustainable farm certification for tea farms, Continued assistance, start assisting small farms to obtain certification(7,750 farms)
Momentum for fresh look at Japan-grown hops, purchasing risk of Japan-grown hops
Visualization of biodiversity value of Japanese hops fields and their contribution to traditional rural landscapes, promotion of understanding by local residents
Risks from concerns about ecosystem impact of conversion to vineyards, creation of fans of Japanese wine, contribution to value
Risk of deterioration of water use efficiency due to increased frequency of plant switchovers with high-mix low-volume production
Raw material procurement risk due to water risk in production regions
Visualization of contributions to secondary nature through conversion of idle and devastated land to vineyards, efforts to regenerate and protect rare species
Assessment of water risks in catchment areas of production basesContinuation of appropriate water-saving measures in accordance with water risks
Assessment of and responses to water risk in raw material production regions (commencement of activities to protect water sources inside tea farms. Target: Education of 15,000 people in five locations)
Biological ResourcesWater Resources
Env i ron m e n t a lS t ra teg y
Env i ron m e n t a lDa t a
Ac t i v i t y■Biological Resources ■Water Resources ■Containers and Packaging ■Global Warming ■Environmental management

15
Business Necessities Social Issues and Expectations Risks and Opportunities Direction of Approaches
Technical expertise of Research Laboratories for Packaging Technologies, differentiation of containers and packaging, and containers and packaging cost savings
Increased use of PET bottles, continued dependence on paper containers
Industry’s combined appropriate response to various stakeholders
Expansion of high-mix low-volume production through the expansion of craft beer and limited-edition local beers.
Shortage of long-haul truck drivers, reduction of burden and cost savings through cooperation in non-competing areas
Expectations of lighter, more easily recycled containers and of 3R, resource depletion, cost reductions
Expectations of reduction of petroleum-derived materials, concerns about forest destruction and about ocean pollution
Social expectations of continuation and expansion of 3R, empty container litter, concerns about ocean pollution
Progress in global warming countermeasures through signing of Paris Agreement, expectations toward renewable energies
Expansion of issues in logistics, such as difficulties in securing truck drivers, expectations toward reduction of burden by society as a whole through cooperation in non-competing areas
Limits to light weighting of containers and packagingAccolades for easily recycled containers
Continued development of lightweight containers and packaging, leveraging the R&D of the Research Laboratories for Packaging Technologies
Legal risks, reputational risks
Improvement of sustainability of container raw materials (maintenance and expansion of bottle-to-bottle initiative, full adoption of FSC-certified paper for all paper containers and packaging (100% by 2020)
Legal risks regarding containers and packaging, impact on costs, reputational risks
Deterioration of energy efficiency due to increased frequency of plant switchovers with high-mix low-volume production
Delivery difficulties, cost increase risks
Continued promotion of 3R throughout whole of society through cooperation with various stakeholders, appropriate response to Australia’s container return schemes
Achievement of medium-term greenhouse gas reduction targets through SBT (30% reduction in Scope 1 + Scope 2 and in Scope 3 compared to 2015 levels by 2030)Conversion to renewable energies for 50% of power consumption at breweries by 2030 (Kirin Brewery)Introduction of 10MW solar power generation facility by 2026 (Lion)
Further promotion of cooperation in non-competing areas (joint delivery)
Containers and PackagingG
lobal Warm
ing
Env i ron m e n t a lS t ra teg y
Env i ron m e n t a lDa t a
Ac t i v i t y■Biological Resources ■Water Resources ■Containers and Packaging ■Global Warming ■Environmental management
16
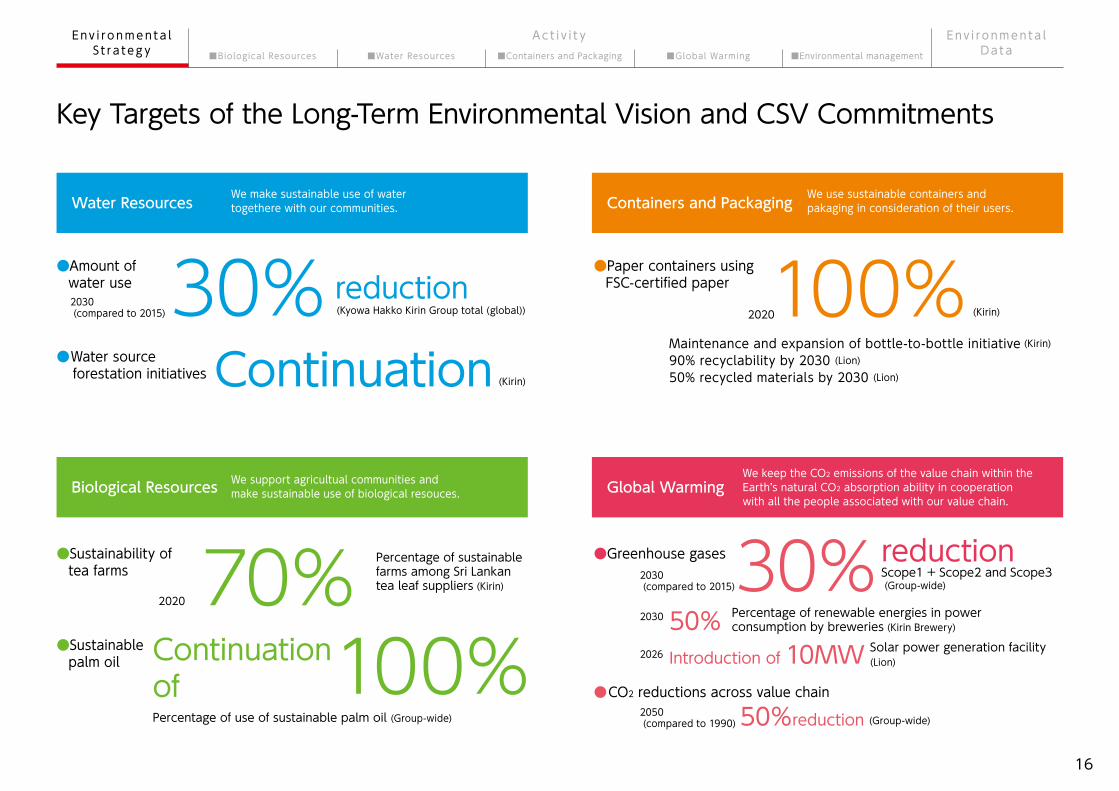
100%Percentage of use of sustainable palm oil (Group-wide)
Key Targets of the Long-Term Environmental Vision and CSV Commitments
●Amount of water use
●Sustainability of tea farms
●Sustainable palm oil
●Greenhouse gases
●CO2 reductions across value chain
●Paper containers using FSC-certified paper
(Kyowa Hakko Kirin Group total (global))
(Kirin)
Percentage of sustainable farms among Sri Lankan tea leaf suppliers (Kirin)
(Kirin)
Maintenance and expansion of bottle-to-bottle initiative (Kirin)
90% recyclability by 2030 (Lion)
50% recycled materials by 2030 (Lion)
Scope1 + Scope2 and Scope3 (Group-wide)
2026
Percentage of renewable energies in power consumption by breweries (Kirin Brewery)
Solar power generation facility (Lion)
●Water source forestation initiatives
30%
70% 30%50%
50%reduction
Introduction of 10MW
100%Continuation
Water Resources
Biological Resources
Containers and Packaging
Global Warming
We use sustainable containers and pakaging in consideration of their users.
We keep the CO2 emissions of the value chain within theEarth’s natural CO2 absorption ability in cooperationwith all the people associated with our value chain.
We make sustainable use of water togethere with our communities.
We support agricultual communities and make sustainable use of biological resouces.
2020
2020
2030 (compared to 2015)
2030 (compared to 2015)
2030
2050 (compared to 1990)
reduction
reduction
Continuation of
(Group-wide)
Env i ron m e n t a lS t ra teg y
Env i ron m e n t a lDa t a
Ac t i v i t y■Biological Resources ■Water Resources ■Containers and Packaging ■Global Warming ■Environmental management

17
BiologicalResources
Tea farms▶P.26
Improving the sustainability of tea farms in Sri Lanka Reach 50% or higher of tea farms being sustainable*. Commence assistance to obtain sustainable farm certifications for small farms in 2018.
Continuing on from 2013, conducted water risk surveys at 44 manufacturing sites in nine countries in 2017.
Continued sourcing entire volume of primary and secondary raw materials through RSPO’s Book & Claim purchasing method.
Vineyards Secure biodiversity in Japan’s agricultural areas
Secure biodiversity in Japan’s agricultural areas
Manufacturing Reduction of amount of water usage
Water sources Continuation of “water source forestation” and other water source conservation initiatives
Continuation of “water source forestation” and other water source conservation initiatives
Continued conservation of water sources in 12 locations across Japan.
Production regions
Reduce More lightweight containers and packaging through full use of R&D
In Japan, maintained Japan’s lightest returnable beer bottles, aluminum beer cans, and PET bottles for water.
In switch to FSC-certified paper for paper containers, completed switch for 100% of 6-can packs and gift boxes, and 90% of paper packs.
Maintenance of bottle-to-bottle initiativeMaintenance and expansion of bottle-to-bottle initiative
Maintenance and expansion of use of containers using FSC-certified paper
Sustainable raw materials
Achievement of greenhouse gas reduction targets through SBT
Achievement of greenhouse gas reduction targets through SBT
Increase in percentage of renewable energy
Completed development of roadmap (Kirin Brewery).
Expanded joint delivery in Hokuriku and Hokkaido.
Manufacturing
Logistics
Natural energy
Hops fields
Palm oil Use of sustainable palm oil
WaterResources
Containers andPackaging
GlobalWarming
Theme Our outcomes Progress Page
Rare species discovered in Mariko Vineyard. In response, activities for the restoration and conservation of rare and native species were undertaken, with the participation of employees. Continued ecosystem investigations in process of converting idle and devastated land to vineyards.
Conducted assessment of water risks in value chain (Japanese businesses). Based on the assessment outcomes, commenced new water source conservation on Sri Lankan tea farms.
Confirmed presence of greater diversity of species compared to idle and devastated land. Provided tours for local schoolchildren and activities to enrich nature with employee participation.
▶P.27
▶P.28
▶P.29
▶P.38
▶P.37
▶P.36
▶P.49~P.51
▶P.48
▶P.48
▶P.59
▶P.64
▶P.66
* “Highly sustainable farms” includes farms that have obtained certification with Kirin’s assistance, as well as farms that have obtained certification independently or with the assistance of international agencies, etc.
Setting of renewable energy targets (Kirin Brewery, Lion)
Progress
Env i ron m e n t a lS t ra teg y
Env i ron m e n t a lDa t a
Ac t i v i t y■Biological Resources ■Water Resources ■Containers and Packaging ■Global Warming ■Environmental management

18
External Evaluation
Evaluation by investors and incorporation into SRI index
Awards for joint delivery initiative Awards for biodiversity
The Kirin Group places great importance on transparent disclosure of information to its investors and other stakeholders. In 2017, we held a briefing for investors on the topic of ESG, published the integrated report, KIRIN REPORT, and environmental report, disclosed information on the website, and responded to investors’ questionnaire surveys.These actions have been well received, with KIRIN being recognized in 2017 as a Climate Change A List company and Water A List company, the top ranking, by CDP, an international non-profit organization that provides environmental information disclosure systems. This marked the fourth consecutive year that KIRIN received the A List ranking for Climate Change since 2014, and the second consecutive year for the Water List ranking. Kirin has also been adopted by the FTSE4Good and FTSE Blossom Japan Index and other indices.
Kirin Brewery’s initiative for joint delivery by rail of its products to the Hokuriku area received the Logistics Environmental Grand Prize at the 18th Logistics Environmental Award (Japan Association for Logistics and Transport) and the Minister of Land, Infrastructure, Transport and Tourism Award under the FY2017 Excellent Green Logistics Commendation Program.
Chateau Mercian’s Mariko Vineyard received the Judge’s Special Award in the 6th Ikimono Nigiwai Corporate Initiatives Contest for its ecosystem investigations and vegetation regeneration activities. Kirin Brewery’s Yokohama brewery also received the Minister of National Land and Transport Award: Green Programs and Activities Category in the 36th Green Cities Awards and an award at the 4th Green Social Contribution Award.
Presentation ceremony for FY2017 Excellent Green Logistics Commendation Program Awards
Presentation ceremony for 18th Logistics Environment Award
Presentation ceremony for the Ikimono Nigiwai Corporate Initiatives Contest
Activities at Mariko VineyardRelated Information Related Information▶P.64 ▶P.27
Env i ron m e n t a lS t ra teg y
Env i ron m e n t a lDa t a
Ac t i v i t y■Biological Resources ■Water Resources ■Containers and Packaging ■Global Warming ■Environmental management

19
Awards for Next-Generation Education
The Kirin School Challenge, which targets junior and senior high school students, won an Encouragement Award at the 8th Career Education Awards and the Judges Committee Encouragement Award at the FY2017 Corporate Awards for Youth Experience Activities.
Awards for Packaging and Containers
Kirin Brewery’s lightweight middle-sized bottle received a Worldstar Award in the Beverage Category of the Worldstar Packaging Awards 2018, hosted by the World Packaging Organisation (WPO). The middle-sized bottle also received the Function and Environment Award at the 14th Glass Bottles Awards, and the Research Laboratories for Packaging Technologies received the Reduce, Reuse, Recycle Promotion Council Chairman’s Award in the FY2017 Reduce, Reuse, Recycle Promotion Merit Awards. Japan’s lightest aluminum can and the lightest PET bottle, developed by Kirin, won the 41st Kinoshita Prize and the 40th Kinoshita Prize, respectively.
Presentation ceremony for Worldstar Awards 2018
Presentation ceremony for 14th Glass Bottle Awards
Presentation ceremony for 8th Career Education Awards
Presentation ceremony for FY2017 Corporate Awards for Youth Experience Activities
Related Information ▶P.50~P.51
Env i ron m e n t a lS t ra teg y
Env i ron m e n t a lDa t a
Ac t i v i t y■Biological Resources ■Water Resources ■Containers and Packaging ■Global Warming ■Environmental management

20
Environmental management
Global Warming
Containers and Packaging
Water Resources
Biological Resources
Progress report for Long-Term Environmental Vision and CSV Commitment
Activity
Work toward sustainable use of biological resources by 2050.
Strive to see that water resources in each region can be ensured on a permanent basis by 2050
Work toward sustainable use of packaging and containers by 2050
Keep CO2 emissions across our value chain within the Earth’s capacity to absorb them by 2050
P.70
P.58
P.44
P.32
P.22
Env i ron m e n t a lS t ra teg y
Env i ron m e n t a lDa t a
Ac t i v i t y■Biological Resources ■Water Resources ■Containers and Packaging ■Global Warming ■Environmental management
21
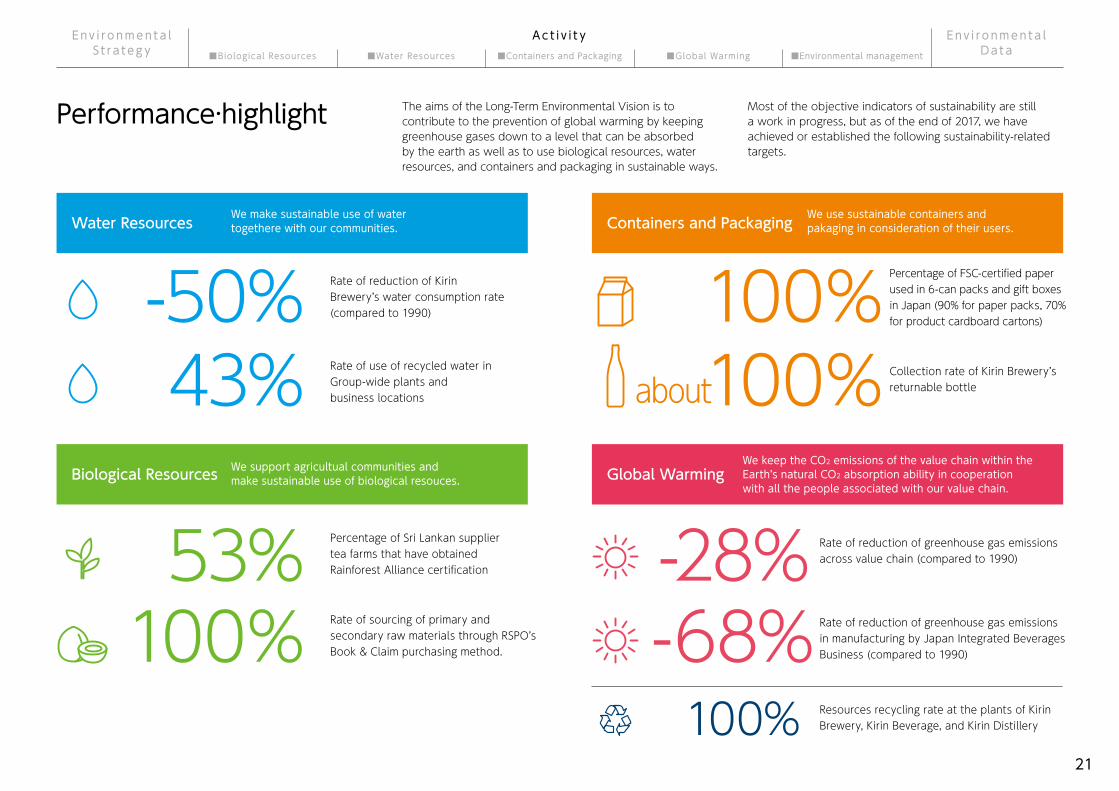
53%
100%100%about
100%Percentage of Sri Lankan supplier tea farms that have obtained Rainforest Alliance certification
Percentage of FSC-certified paper used in 6-can packs and gift boxes in Japan (90% for paper packs, 70% for product cardboard cartons)
Collection rate of Kirin Brewery’s returnable bottle
Rate of sourcing of primary and secondary raw materials through RSPO’s Book & Claim purchasing method.
-28% Rate of reduction of greenhouse gas emissions across value chain (compared to 1990)
-68% Rate of reduction of greenhouse gas emissions in manufacturing by Japan Integrated Beverages Business (compared to 1990)
100% Resources recycling rate at the plants of Kirin Brewery, Kirin Beverage, and Kirin Distillery
-50% Rate of reduction of Kirin Brewery’s water consumption rate (compared to 1990)
43% Rate of use of recycled water in Group-wide plants and business locations
The aims of the Long-Term Environmental Vision is to contribute to the prevention of global warming by keeping greenhouse gases down to a level that can be absorbed by the earth as well as to use biological resources, water resources, and containers and packaging in sustainable ways.
Most of the objective indicators of sustainability are still a work in progress, but as of the end of 2017, we have achieved or established the following sustainability-related targets.
Performance·highlight
Water Resources
Biological Resources
Containers and Packaging
Global Warming
We use sustainable containers and pakaging in consideration of their users.
We keep the CO2 emissions of the value chain within theEarth’s natural CO2 absorption ability in cooperationwith all the people associated with our value chain.
We make sustainable use of water togethere with our communities.
We support agricultual communities and make sustainable use of biological resouces.
Env i ron m e n t a lS t ra teg y
Env i ron m e n t a lDa t a
Ac t i v i t y■Biological Resources ■Water Resources ■Containers and Packaging ■Global Warming ■Environmental management

Biological resources, particularly agricultural products, are the most important and fundamental raw material of the Kirin Group’s Integrated Beverages Business. However, inconsiderate agricultural practices present a major risk to local ecosystems and to Kirin’s business. After conducting a biodiversity risk assessment, the Kirin Group has developed action plans for those commodities that were determined to be of high risk, namely black tea leaves, paper and printed materials, and palm oil, and, is dealing with this issue primarily by contributing to the expansion of certification schemes.Meanwhile, the expansion of craft beer and Japanese wines have brought renewed recognition of the importance of Japan-grown ingredients, highlighting new challenges, such as the aging of Japan’s farming population and the use of idle farming land. The Kirin Group has shown through scientific studies that environmentally-friendly farming practices serve to protect and nurture Japan’s traditional rural Satochi-Satoyama landscapes, which are a form of “secondary nature.” We are also taking various approaches to further nurture the abundance of nature, which we hope will lead to shared value for business and for the community and ecosystems.
Basic Thinking
Biological Resources
Overview of ApproachesP.23
Progress on Biological ResourcesP.24
Overview of Approaches in the Value ChainP.25
Tea farmsP.26
VineyardsP.27
Hop FieldsP.28
Paper and Printed Materials
Palm oil
The Local ecosystem
P.29
P.29
P.30

23
■Expansion of craft beer
■Risk research
■Expansion of Japanese wineM
agnitude of Risk
Risk Incidence Rate
Black tea leavesOther fruit juices
Grapes
HopsBarley
Corn
Coffee beansSoybeans
Palm oil
Paper
■Trends in idle farming land area
1975
4540352520151050
16,000kl
15,000kl
14,000kl
13,000kl
+7.3%
+5.2%12
10
8
6
4
2
01980 1985 1990 2013 2015 20161995 2000 2005 2010
ActionPlan
■Shipment volumes of Japanese wine
Source: Ministry of Agriculture, Forestry and Fisheries, March, 2011.
Source: , National Tax Agency
Current State of Idle Farming Land, Overview of Wine Produced in Japan (FY2016 Survey)
Overview of Approaches
Using data on countries and regions that supply biological resources and on supply volumes, which we gathered in the course of calculating the CO2 footprint of the value chain in 2010, we conducted an assessment of risks to business in the value chain from issues such as the loss of tropical rainforests and other precious ecosystems. This led us to identify “black tea leaves,” with our dependence on specific regions for supply without alternatives, “paper and printed materials,” which we use in large volumes for containers and packaging, and “palm oil,” which we use in extremely small quantities but which has become a major social issue, as risks. We decided, therefore, to develop and engage in detailed Action Plans* to address those risks.When we formulated our CSV Commitment in 2017, we revised some parts of these Action Plans and renewed our focus on “black tea leaves,” “paper and printed materials,” and “palm oil.”
In our beer business, craft beer has become an important target, and a major challenge is to develop and secure distinctive hops that are unique to Japan. With the decline in the number of hops growers, there is a risk that Japanese hops production could completely die out in the future. In the face of this risk, we believe that showing the world that the presence of hops fields in those areas has significance from the perspective of ecosystem preservation will help to keep hops production alive in Japan.Meanwhile, with the expanding production of Japanese wine, if the conversion of idle farming land into vineyards were to disrupt the ecosystems of that area, it would represent a major risk. In 2014, Kirin commissioned experts to conduct studies that showed that converting idle farming land into hedgerow-style vineyards actually leads to the enrichment of local ecosystems.In this way, in line with our business strategy of the expansion of craft beer and Japanese wine, we are engaging in approaches that focus on activities to show that Japanese hops fields and vineyards can contribute to the restoration of secondary nature.
Challengesin Biodiversity Leading to Forest Destruction
Assisting tea farms to obtain certification
*See for details of action plans.
Contribution of Japanese hops fields and vineyards to “secondary nature” landscapes
Challengesin Domestic Business Strategy
▶P.85
Env i ron m e n t a lS t ra teg y
Env i ron m e n t a lDa t a
Ac t i v i t y■Biological Resources ■Water Resources ■Containers and Packaging ■Global Warming ■Environmental management

24
Progress on Biological Resources
Ratio of sustainable raw materials
At the end of 2017, 53% of our black tea leaf suppliers in Sri Lanka were sustainable farms.
For palm oil, we have used the RSPO-approved Book and Claim purchasing method to source our total volume of primary raw materials since 2013 and the total volume of secondary raw materials since 2014.For paper containers, we have switched to FSC-certified paper for 100% of 6-can packs for beer and non-alcoholic beverages and gift boxes, 90% of drink boxes, and 70% of cardboard cartons for products.
Ecological surveys of our Japanese suppliers’ hops fields and vineyards have shown that a diverse range of species inhabit these fields.In the vineyards, in particular, some rare species have been discovered, and our studies have shown that restoring idle farming land by converting it to vineyards for Japanese wine will lead to the restoration of Japan’s traditional rural Satochi-Satoyama landscapes.
Ratio of sustainable farms
Sustainable farm
50%0% 100% 50%0% 100%
50%0% 100%
500 100 0 300Insects
Birds
150Insects
Plants
53%
100%100% Drink boxes
100% 104species19species
168species288species90%
Number of species discovered in fields
Tea Leaf
Hops Field
6-can packs for beer and non-alcoholic beverages
Palm oil Paper Vineyard
primary raw materialssecondary raw materials
Env i ron m e n t a lS t ra teg y
Env i ron m e n t a lDa t a
Ac t i v i t y■Biological Resources ■Water Resources ■Containers and Packaging ■Global Warming ■Environmental management

25
Products
Raw material production regions
Manufacturing plants
Overview of Approaches in the Value Chain
Assisting tea farms to obtain certificationAfter assessing the risks of our business operations leading to the loss of precious ecosystems such as tropical rainforests, we identified “black tea leaves,” “paper and printed materials,” and “palm oil” as priorities. In response to those risks, we have developed action plans and are pursuing a range of approaches. For black tea lea leaves, Kirin continues to assist farmers in Sri Lanka to obtain certification from the Rainforest Alliance sustainable farm certification scheme.
Contribution of Japanese hops fields and vineyards to “secondary nature” landscapesFor Japanese hops fields, which are becoming increasingly important as an ingredient for craft beer, and Japanese vineyards, which are expanding with the growing penetration of Japanese wine in the wine market, we have shown through ecological surveys that they contribute to secondary nature landscapes and we are engaging in initiatives to further enrich these ecosystems.
Actions at manufacturing sites to protect local ecosystemsWe are engaged in activities to protect local ecosystems using our business premises and proprietary technologies. Such activities include using biotopes established in the grounds of our manufacturing plants to protect species that are endemic to the region, and using our proprietary plant propagation technologies to assist in the regeneration of coastal protection forests in areas of Tohoku affected by the 2011 earthquake and tsunami disaster.
Contributing with our ProductsThe paper drink boxes used for Kirin Gogo-no-Kocha Straight Tea (unsweetened) have a label attached certifying that the tea is made with 100% Rainforest Alliance certified tea leaves. Also, as of the end of March 2018, we have switched to FCS-certified paper for 100% of our 6-can packs for beer and non-alcoholic beverages and gift boxes. Labels attesting to this fact are progressively being added to these packs and boxes.
Env i ron m e n t a lS t ra teg y
Env i ron m e n t a lDa t a
Ac t i v i t y■Biological Resources ■Water Resources ■Containers and Packaging ■Global Warming ■Environmental management

26
❸Commencement of activities for the conservation of tea farm water sourcesIn addition to assistance with activities to identify, isolate, and conserve water sources that are already underway in five locations in Sri Lanka, we will also commence an education program to teach the 15,000 or so residents in the vicinity of the tea farms how to use water wisely. These initiatives will mitigate the impact of water shortages and torrential rains of recent years, as well as preventing the pollution of rivers by wastewater.
Kirin Gogo-no-Kocha has been a top-selling brand in Japan for more than thirty years. When we conducted a biodiversity risk assessment in 2010-2012, we learned that about 25% of the black tea leaves imported into Japan from Sri Lanka are used in Kirin Gogo-no-Kocha. In response to this fact, in 2013, we began providing assistance for willing Sri Lankan tea farmers to obtain Rainforest Alliance certification. As of October 2017, a total of 44 tea farms have obtained certification. We hope that this approach of assisting farmers to obtain certification will improve sustainability in the production regions and contribute to the stable use of good quality ingredients into the future.
When tea farms obtain certification, they are able to farm in environmentally-friendly ways, engaging in forest conservation, surveys and protection of wildlife, and the separation and recycling of waste.Certification also has considerable benefits for farm workers and helps to improve the sustainability of farm management.
Under the Kirin Sri Lanka Friendship Project, we began a project called the Kirin Library in 2007. In this project, we donate, on a continual basis, bookshelves and about 100 books to each of the schools that the children of the tea farm workers attend. In the 10 years from 2007, we have donated books to approximately 120 schoaols, and we have plans to increase that number by 100 schools by the year 2022.
For example, farmers are preventing the loss of fertile topsoil due to heavy rainfall in the rainy season by planting grasses with deep roots on the steep slopes of their farms, and efforts to reduce the use of chemical pesticides and fertilizers are contributing to farm management by, for example, improving the health and safety of farm workers and reducing costs.By the end of 2017, the percentage of our Sri Lankan suppliers that were highly sustainable farms had increased to about 50%.
Based on what has been achieved so far, we launched three new initiatives in a new three-year plan in 2018 to further increase the sustainability of tea farmers.
❶Expansion of training programs for large farmsWe will further increase the percentage of our Sri Lankan suppliers that are highly sustainable farms.❷Commencement of assistance for small farms to obtain certificationWe will start offering assistance to the more than 7,000 small farms to obtain certification. The large tea farms that we have assisted in obtaining certification to date are surrounded by large numbers of small farms. The tea leaves grown on these small farms are sold to the large farms, where they are processed, but there has been almost no progress made in certification of these small farms. We will organize these small farms and establish systems for them to grow tea in ways that are considerate of the natural environment, to improve their sustainability.
Kirin representatives visit the farms once a year and hold discussions with the farm managers. We have decided to commence assistance for small farms, something that the tea farms have been requesting for a long time, and expand the area of tea farms with rich ecosystems.
Tea farms in Sri Lanka
*Source: 2011 Tea Statistics, Japan Tea Association
Farms that have obtained Rainforest Alliance certification have an obligation to list up and protect all wildlife on their farms.
Tea farms
Assistance to obtain Rainforest Alliance certification
Target number of small farms assisted to obtain certification
Expansion of book donations to elementary schools
7,750
15,000
Target number of residents educated on importance of water
Kirin
Tea Farms
Sustainable FarmingTrainingHigh-quality
materials
Training fundsRainforest Alliance
Supportiing Growers Obtain Rainforest Alli ance Certification
The large farm
Plant
Small farmSmall farm
Small farm
Small farm
Small farm
Small farm
Small farm
Small farm
Percentage of Sri Lankan supplier tea farms that
have obtained Rainforest Alliance certification
53%
Assistance for small farms and conservation of farm water sources
Env i ron m e n t a lS t ra teg y
Env i ron m e n t a lDa t a
Ac t i v i t y■Biological Resources ■Water Resources ■Containers and Packaging ■Global Warming ■Environmental management

27
by the vegetation being eaten by deer. A follow-up survey was conducted in 2017 after the land had been fenced off and clearing of the land had been completed. This survey confirmed that the diversity of the ecosystem is improving significantly. At the same time, seed traps were used to investigate what kinds of seeds were infiltrating the land from outside the plot. This revealed the potential for a large variety of seeds to enter the land. The area around the cultivated land has few varieties of vegetation due to deer eating the plants, but by keeping the deer out with a fence and growing grasses, the potential for regenerating richly diverse ecosystems like Mariko Vineyard has emerged. Full-scale planting of grapevines will commence in 2018. This study will continue for several years until the vines bear fruit, after which valuable findings of the study will be published widely.
With the improvement in quality and high praise that Japanese wine has been attracting from overseas, the definition of “Japanese wine” and labeling rules have been established. From October 30, 2018, only wine produced from 100% Japan-grown grapes may be labeled as “Japanese wine.” Against this background, Mercian, whose history dates back to the establishment of Dainihon Yamanashi Wine Company, Japan’s first private-sector winery, plans to increase its production capacity of Japanese wine to 67,000 cases by 2027. To achieve that aim, it will need to develop new vineyards.
Since 2014, in joint research with the National Agriculture and Food Research Organization’s Institute for Agro-Environmental Sciences (NIAES), the Kirin Group has been conducting ecological studies of Mariko Vineyard, a Kirin-managed vineyard in Ueda, Nagano Prefecture, which grows grapes for Japanese wine. These studies have confirmed the presence of 168 insect species and 288 plant species in the vineyard, revealing that the hedgerow-style vineyards are nurturing a rich ecosystem. With hedgerow cultivation, the underbrush is cut several times a year for soil management and operational purposes. This exposes rare and native species to the sun and gives the vineyards a major role as vast grassland of good quality. In other words, the expansion of vineyards for Japanese wine will lead to the expansion of Satochi-Satoyama landscapes with rich ecosystems.
Vineyards
Expansion of Japanese wine
Vineyards for Japanese wine nurture Satochi-Satoyama landscapes
Japanese wine production expansion plans
Trends in grassland area in JapanNumber of endangered species by unit area
1.4
1.2
1
0.8
0.6
0.4
0.2
0
1400
1200
1000
800
600
400
200
0
Grasslands have the highest percentage of endangered plant species
Grassland area in Japan has declined markedly since the 1980s
1890 1900 1920 1940 1960 1980 2000
2016
37,000cases
67,000cases
2027
Forests
AgriculturalAreas
Wetlands
Grasslands
Seashore
Endangered plant species per hectareSource: Western Japan Grasslands Research Group (2007)
Aggregated from Successive-Year Forest Area Statistics and MAFF Statistical Tables
In 2016, under the guidance of the experts from NIAES, the employees of the vineyard began participating in activities to regenerate rare and native species. In 2017, it was confirmed that native species had taken hold. In 2018, with the cooperation of the local community, seeds from rare plant species will be steadily collected and we have plans for activities that will lead to their establishment in the vineyard.In 2016, in Kamiodawara in Enzan, Yamanashi Prefecture, we began Japan’s first-ever joint study into how ecosystems change in the course of converting idle farming land to vineyards.Further, in 2018, we plan to launch a similar ecological study in Kikyogahara in Shiojiri, Yamanashi Prefecture, where a new winery is due to open.For the long-term growth of Japanese wine, we will continue to use idle farming land to expand our company-managed vineyards and to contribute to Satochi-Satoyama landscapes with rich ecosystems.
Mercian is seeking to convert idle farming land in Kamiodawara in Enzan, Yamanashi Prefecture, into vineyards for Japanese wine. There were no previous examples of studies into the process of converting idle farming land into hedgerow-style vineyards, so the Kirin Group is collaborating with NIAES on the first study of this kind in Japan.The state of the idle farming land was investigated in 2016. It was found that there was very little variety in the vegetation and only a very small number of insect species inhabited the land. This lack of species diversity was caused
Sophora flavescens
Zygaena niphona niphona
Argyronome laodice japonica
Vincetoxicum pycnostelma
Hemerocallis citrina var. vespertina
Leonurus japonicus
Rare species discovered
The vineyards are also vast grasslands. We have begun activities to restore native and rare species.
Joint research on the changes to ecosystems in conversion to vineyards
▶P.18Related Information
Env i ron m e n t a lS t ra teg y
Env i ron m e n t a lDa t a
Ac t i v i t y■Biological Resources ■Water Resources ■Containers and Packaging ■Global Warming ■Environmental management
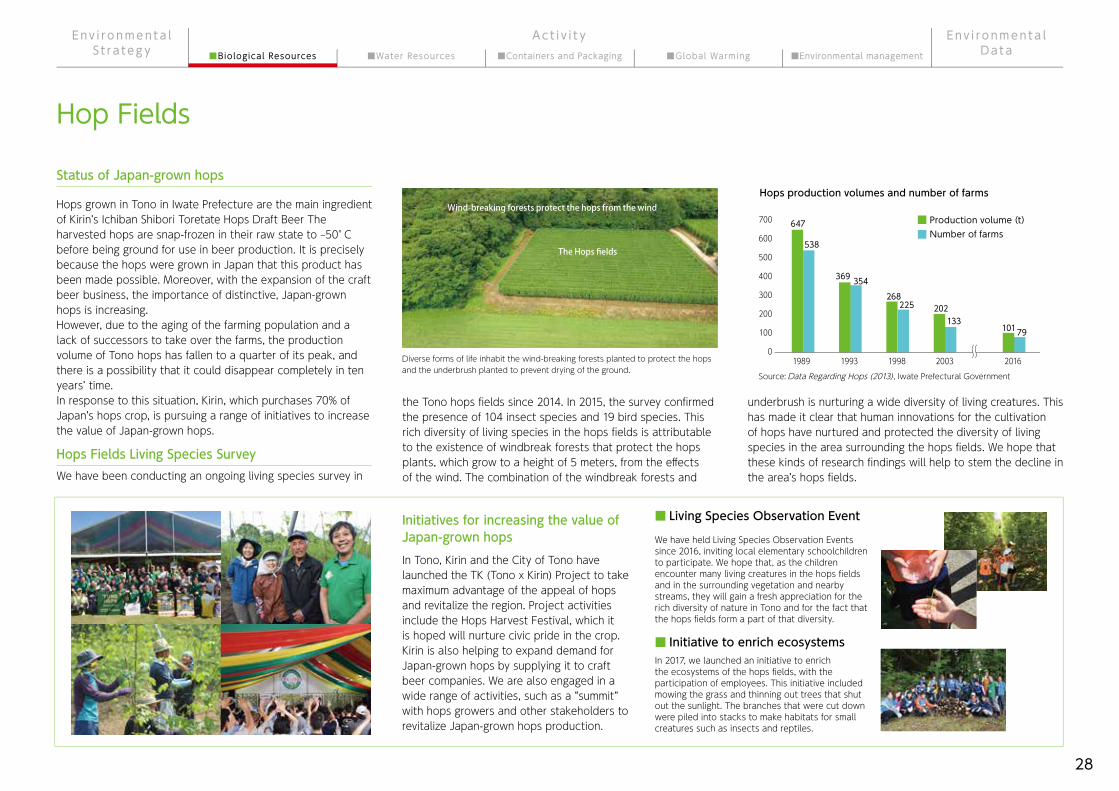
28
Hop Fields
Hops grown in Tono in Iwate Prefecture are the main ingredient of Kirin’s Ichiban Shibori Toretate Hops Draft Beer The harvested hops are snap-frozen in their raw state to ‒50°C before being ground for use in beer production. It is precisely because the hops were grown in Japan that this product has been made possible. Moreover, with the expansion of the craft beer business, the importance of distinctive, Japan-grown hops is increasing.However, due to the aging of the farming population and a lack of successors to take over the farms, the production volume of Tono hops has fallen to a quarter of its peak, and there is a possibility that it could disappear completely in ten years’ time.In response to this situation, Kirin, which purchases 70% of Japan’s hops crop, is pursuing a range of initiatives to increase the value of Japan-grown hops.
We have been conducting an ongoing living species survey in
In Tono, Kirin and the City of Tono have launched the TK (Tono x Kirin) Project to take maximum advantage of the appeal of hops and revitalize the region. Project activities include the Hops Harvest Festival, which it is hoped will nurture civic pride in the crop. Kirin is also helping to expand demand for Japan-grown hops by supplying it to craft beer companies. We are also engaged in a wide range of activities, such as a “summit” with hops growers and other stakeholders to revitalize Japan-grown hops production.
Status of Japan-grown hops
Initiatives for increasing the value of Japan-grown hops
■ Living Species Observation Event
■ Initiative to enrich ecosystems
Hops Fields Living Species Survey
Diverse forms of life inhabit the wind-breaking forests planted to protect the hops and the underbrush planted to prevent drying of the ground.
Source: Data Regarding Hops (2013), Iwate Prefectural Government
Hops production volumes and number of farms
700
600
500
400
300
200
100
01989
647
538
369 354
268225 202
13310179
1993 1998 2003 2016
Production volume(t)Number of farms
the Tono hops fields since 2014. In 2015, the survey confirmed the presence of 104 insect species and 19 bird species. This rich diversity of living species in the hops fields is attributable to the existence of windbreak forests that protect the hops plants, which grow to a height of 5 meters, from the effects of the wind. The combination of the windbreak forests and
underbrush is nurturing a wide diversity of living creatures. This has made it clear that human innovations for the cultivation of hops have nurtured and protected the diversity of living species in the area surrounding the hops fields. We hope that these kinds of research findings will help to stem the decline in the area’s hops fields.
We have held Living Species Observation Events since 2016, inviting local elementary schoolchildren to participate. We hope that, as the children encounter many living creatures in the hops fields and in the surrounding vegetation and nearby streams, they will gain a fresh appreciation for the rich diversity of nature in Tono and for the fact that the hops fields form a part of that diversity.
In 2017, we launched an initiative to enrich the ecosystems of the hops fields, with the participation of employees. This initiative included mowing the grass and thinning out trees that shut out the sunlight. The branches that were cut down were piled into stacks to make habitats for small creatures such as insects and reptiles.
Wind-breaking forests protect the hops from the wind
The Hops fields
Env i ron m e n t a lS t ra teg y
Env i ron m e n t a lDa t a
Ac t i v i t y■Biological Resources ■Water Resources ■Containers and Packaging ■Global Warming ■Environmental management

29
Priority will be given to the use of paper that is FSC-certified, paper made with wood from FSC-managed forests, paper made from recycled paper, and paper that has been confirmed through supplier surveys as not resulting in the destruction of high conservation value forests*5.
Paper and Printed Materials / Palm oil
In addition to product catalogs and other printed materials, the Kirin Group uses large quantities of paper for primary and secondary containers for shipping its products. In 2013, we established our Guidelines for the Procurement of Sustainable Biological Resources and an Action Plan, and have since pursued the use of paper that will not harm precious forests, including tropical rainforests. In February 2017, we proceeded to the next step and revised the Action Plan, setting new targets for switching to FSC®-certified paper for all 6-can packs, gift boxes, drink boxes, and cardboard cartons for products by the end of 2020. For office paper as well, we have switched to FSC-certified paper for almost all of our business cards, envelopes, copy paper, and printed materials such as catalogs. We are also progressively switching to FSC-certified paper for the return postcards we use for competitions.
The Kirin Group uses palm oil as an ingredient in some of its products, but because the quantity we use is very small and it is difficult to procure physically certified oil, we use the Book & Claim method approved by the Roundtable on Sustainable Palm Oil (RSPO) for the procurement of certified sustainable oil. In accordance with our Guidelines for the Procurement of Sustainable Biological Resources, we have been using this method for the total volume of primary raw materials every year since 2013 and the full volume of secondary raw materials as well from 2014.In March 2018, we became an associate member of the RSPO. We will continue to promote the use of sustainable palm oil.
Use of sustainable paper and printed materials Use of sustainable palm oil
Intergrated Report 2018 Kirin product catalog envelopes Reply postcards
*1 FSC Certification is given to wood and paper products produced in an economical and sustainable manner that is considerate of the conservation of forest environments and that will benefit the local communities where those forests are located. The FSC Recycled Label may be attached to paper that is made from reclaimed paper from consumer and industrial sources under proper controls.
*2 “Office paper”refers to copy paper, envelopes (excluding non-standard sizes and some industrial-use envelopes), business cards, and printed materials such as company pamphlets.
*3 Includes Kirin-Tropicana Inc.*4 Excludes limited-edition products, small-lot product varieties, special shapes,
imported products, etc.*5 HCVF (High Conservation Value Forest), as defined by FSC.
For paper container results:
For biological resources policy:
Paper and Printed Materials
●Office paper*2
●Other
●Containers and packaging*3 *4
aim to use only FSC-certified paper or recycled paper by the end of 2020.
①6-can packs:aim to use only FSC-certified paper by the end of 2017.②Gift boxes:aim to use only FSC-certified paper by the end of 2020.③Drink boxes:aim to use only FSC-certified paper by the end of 2020.④Cardboard cartons for products:aim to use only FSC-certified paper by the end of 2020.
Kirin Company, Limited, Kirin Brewery Company, Limited, Kirin Beverage Company, Limited and Mercian Corporation will:
Kirin Group Action Plan for the Sustainable Use of Biological Resources
▶P.48▶P.85
Env i ron m e n t a lS t ra teg y
Env i ron m e n t a lDa t a
Ac t i v i t y■Biological Resources ■Water Resources ■Containers and Packaging ■Global Warming ■Environmental management

30
The Local ecosystem
Using biotopes set up in the grounds of our manufacturing plants, we are protecting species that are endemic to the plants’ respective areas and providing consumers with the opportunity to engage with nature.At the Kirin Brewery Yokohama Plant, in an endorsement of the “Yokohama b Plan,” the city’s biodiversity action plan, we built a biotope in the Plant grounds in the summer of 2012. The Yokohama Plant, which is part of a widespread network of ecosystems, is pursuing initiatives to enrich the local ecosystem as a whole. Also, since 2012, the Plant has conducted “Tours to Experience the Blessings of Nature” every week from spring through fall, in collaboration with the Tsurumi River Catchment Network, a NPO which is highly conversant with the region’s natural environment. In December 2016, the Plant received the 4th Green Social Contribution Award from the Organization for Landscape and Urban Green Infrastructure.The Kirin Brewery Kobe Plant has been cultivating local endangered species, including the fish species, Hemigrammocypris rasborella (golden venus chub), and Pogonia japonica, a species of orchid, in the biotope set up in 1997. This biotope functions as a “refuge biotope” for the protection and cultivation of local endangered species.The Kirin Brewery Okayama Plant has been pursuing a program for the artificially breeding of the Parabotia curtus or “kissing loach,” which is a designated natural monument (protected species), since
Kirin’s Central Laboratories for Key Technologies participated in the Ministry of Agriculture, Forestry and Fisheries project, “Dramatic Improvement of Production of Seeds and Seedlings of Bursaphelenchus xylophilus - Resistant Black Pine for Regeneration of Coastal Forests in the Tohoku Region,”*1 for two years from 2014. We remain engaged in the regeneration of the coastal protection forests that suffered devastating damage from the tsunami in 2011. Through their research, our laboratories were successful in inducing and germinating asexual embryos from immature seeds of resistant black pine. This increased the prospects for the development of technologies for the mass supply of seedlings. Taking advantage of these outcomes, with the cooperation of the students of Miyagi Prefecture’s Shibata Norin High School, which has been cooperating with the research, the Tohoku Breeding Field of the Forestry and Forest Products Research Institute’s Forest Tree Breeding Center, the Miyagi Prefectural Forestry Technology Institute, the Miyagi Mori-no-Kai, and other local participants, the multiplied black pine seedlings
Since its inception in 2014, Lion has invested $334,000 in grants to dairy farmers through the Lion Landcare Dairy Pride Grants Program. This program supports sustainable dairy farming projects that focus on three key areas: reducing energy consumption in the dairy farming business; improving nutrition management; and increasing biodiversity on farms. Dairy farms that supply milk to Lion are invited to submit applications for grants to support such projects. This program is helping to raise the efficiency of dairy farms and improve environmental sustainability over the long term. It also serves to build mutually beneficial relationships with our dairy suppliers. In 2017, Lion once again invested $100,000 in grants provided under the Lion Dairy Pride Landcare Grants Program.
*1 Agriculture, Forestry and Fisheries Industry/Food Industry Science and Technology Research Promotion Project (lead institution: Forest Tree Breeding Center, Forestry and Forest Products Research Institute, Forest Research and Management Organization)
Biotopes in the Kirin Brewery Yokohama plant
Cultivation of asexual embryos
Regeneration of ecosystems in Tasmania
Dairy farmers who have received grants
Trial tree-plantingKissing loaches being released into the biotope at Kirin Brewery Okayama Plant
Protection of endemic species in biotopes at manufacturing plants
Assistance with regeneration of coastal protection forests in disaster-affected areas
Lion Landcare Dairy Pride Grants Program
▶P.67
▶P.80
Related Information
Related Information
were planted on a trial basis in the grounds of the Kirin Brewery Sendai Plant in October 2017.The Central Laboratories for Key Technologies will continue its research and development with the aim of contributing to the early regeneration of the coastal protection forests.
2005. The fish population having increased with the cooperation of stakeholders and local elementary schoolchildren, they were released into the Plant’s biotope in 2016 and are now being bred and displayed on the Plant grounds.
Env i ron m e n t a lS t ra teg y
Env i ron m e n t a lDa t a
Ac t i v i t y■Biological Resources ■Water Resources ■Containers and Packaging ■Global Warming ■Environmental management

31
Env i ron m e n t a lS t ra teg y
Env i ron m e n t a lDa t a
Ac t i v i t y■Biological Resources ■Water Resources ■Containers and Packaging ■Global Warming ■Environmental management

Overview of ApproachesP.33
Progress on Water ResourcesP.34
Overview of Approaches in the Value ChainP.35
P.36
Water sources
The production regions
P.37
ManufacturingP.38
Wastewater
Business Location Water Risk Assessment
Value Chain Water Risk Assessment
Water Graphs
P.39
P.40
P.41
P.42
As well as being a basic raw material for the Kirin Group’s Integrated Beverages Business, water is also an indispensable resource for washing the tanks and pipes in the manufacturing equipment of the Integrated Beverages Business and the Pharmaceuticals and Bio-chemicals Businesses.On the other hand, water resources are unevenly distributed around the earth, and different countries and regions have different risks associated with water. In 2017, the Kirin Group conducted assessments of water risks in the catchment areas around our manufacturing bases and upstream of the value chain, similar to one we conducted in 2014. We are now pursuing the appropriate countermeasures to suit the circumstances of each region.Specifically, in addition to water conservation and appropriate wastewater treatment in the manufacturing processes, we are engaged in the protection of the manufacturing plants’ water sources. We have also started responding to water risks in the upstream of our value chain, such as launching activities for the protection of water sources in agricultural production regions, where the effects of climate change are increasing water risks.
Basic Thinking
Water Resources

33
Overview of Approaches
In 2014, the Kirin Group conducted assessments of the water risks in the catchment areas of its major business locations around the world. As our business regions have changed and expanded, at the end of 2017, we repeated this catchment area water risk assessment at 44 business locations in nine countries.The survey showed that water risks were high in Australia, China, Brazil, and Vietnam. In particular, in terms of water shortages alone, we confirmed once more that there was a conspicuously high risk in Australia. In Japan, while the risk of water shortages is high in Yamaguchi Prefecture, there were no business locations that posed a high risk of water shortage for the Integrated Beverage Business.Leveraging the outcomes of this assessment, the Kirin Group is re-focusing its efforts on water conservation in high-risk regions and also working on appropriate water conservation activities in other regions in accordance with their water risks.
As it did in 2014, in late 2017, the Kirin Group conducted detailed water risk assessment for each raw material, newly using Water footprint statistics and Product water footprint statistics of the Water Footprint Network (WFN). The businesses targeted were the Japan Integrated Beverages Business, the Pharmaceuticals and Bio-chemicals Businesses, the Domestic Dairy Business, and a part of overseas businesses.The survey results showed that there was a high ratio of green water (mainly water resources that was confined in soil due to precipitation and other factors). By raw material, amid the Group’s dependence on Australia and Europe for malt, drought is particularly prevalent in Australia, and there is high potential for future drought in some parts of Europe, a situation that will necessitate caution. In the tea production regions, the repeated cycle of drought and torrential rains due to the effects of climate change is becoming a high risk. For other raw materials, water risk is believed to be relatively low at this time.In light of these findings, in Sri Lanka, where the Kirin Group has been operating a certification assistance program for more than five years, we have commenced initiatives that have a focus on protection of water resources.
Challengesin Catchment Areas
Reduction of water consumption in line with water risks ■Water risks in catchment areas of manufacturing bases (overall assessment)
Conservation of water sources in production regions (tea farms)Challengesin the Upstream of Value Chain
JapanUnited StatesChinaThailandVietnamMyanmarBrazilAustraliaNew Zealand
103020110
12201110
100
500000013
Green water for beverage raw material (by region, by raw material)
Blue water for beverage raw material (by region, by raw material)
Malt, barley, hopsGrainsFruit and vegetable juiceAlcoholic beveragesAdditives, seasonings, etc.Dairy productsTea and coffeeManufactured products (raw materials for manufactured products in Pharmaceuticals and Bio-chemicals Businesses)
JapanChinaIndiaIndonesiaMyanmarSri LankaOther areas of Asia
OceaniaCentral and South AmericaNorth AmericaEuropeAfricaOther
High Medium Low
* After assessment of the three elements of water shortages, floods, and water pollution at water sources, an overall assessment was obtained with weighted averaging by 40%, 40%, and 20% for these three elements, respectively.
byregion
byraw
material
byregion
byraw
material
24%
11%
3%
3% 4%
32%39%
8%3%
3%
21%26%
9%
15%23%
11%
2%1%1%
1% 1%
19%
6%
29%
20%
10%
2%2%
3%
9%
13%
13%
10%2%
23%
Related Information
Related Information
▶P.40
▶P.41
■Graph of water risk for the upstream of value chain
Env i ron m e n t a lS t ra teg y
Env i ron m e n t a lDa t a
Ac t i v i t y■Biological Resources ■Water Resources ■Containers and Packaging ■Global Warming ■Environmental management

34
Progress on Water Resources
Water use / Water consumption rate
Kirin Brewery Entire Kyowa Hakko Kirin Group (Global)
Water use Water consumption rate*Water use/production volume for Kirin Brewery, Myanmar Brewery and Lion. Water use/sales revenue for entire Kyowa Hakko Kirin Group (global).
1990 2017
34,900thousand m3
10.44m3/kL
11,198thousand m3
5.26m3/kL
-68%
-50%
25% reduction in water consumption rate by 2020 (compared to 2015)Target
30% reduction in water use by 2030 (compared to 2015)Target
Water use
Water consumption rate
2016 2017
52,772thousand m3
15.2thousand m3/
billion yen
52,488thousand m3
14.9thousand m3/
billion yen
-1%
-2%
Water use
Water consumption rate
Myanmar Brewery
2015 2017
4.73m3/kL
3.76m3/kL
-1%
-21%
Water use
Water consumption rate
Lion
2015 2017
5,498thousand m3
2.67m3/kL
5,516thousand m3
3.06m3/kL
0%
15%
Water use
Water consumption rate
958thousand m3
969thousand m3
Env i ron m e n t a lS t ra teg y
Env i ron m e n t a lDa t a
Ac t i v i t y■Biological Resources ■Water Resources ■Containers and Packaging ■Global Warming ■Environmental management
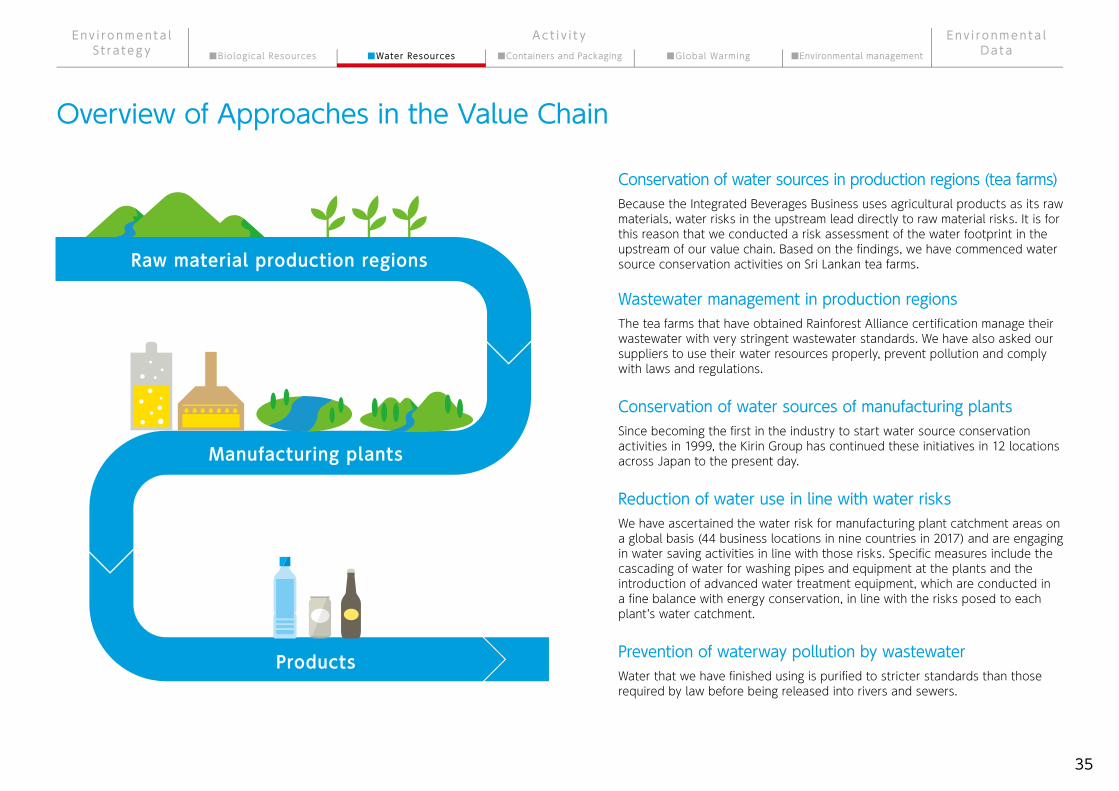
35
Products
Raw material production regions
Manufacturing plants
Overview of Approaches in the Value Chain
Conservation of water sources in production regions (tea farms)Because the Integrated Beverages Business uses agricultural products as its raw materials, water risks in the upstream lead directly to raw material risks. It is for this reason that we conducted a risk assessment of the water footprint in the upstream of our value chain. Based on the findings, we have commenced water source conservation activities on Sri Lankan tea farms.
Wastewater management in production regionsThe tea farms that have obtained Rainforest Alliance certification manage their wastewater with very stringent wastewater standards. We have also asked our suppliers to use their water resources properly, prevent pollution and comply with laws and regulations.
Conservation of water sources of manufacturing plantsSince becoming the first in the industry to start water source conservation activities in 1999, the Kirin Group has continued these initiatives in 12 locations across Japan to the present day.
Reduction of water use in line with water risksWe have ascertained the water risk for manufacturing plant catchment areas on a global basis (44 business locations in nine countries in 2017) and are engaging in water saving activities in line with those risks. Specific measures include the cascading of water for washing pipes and equipment at the plants and the introduction of advanced water treatment equipment, which are conducted in a fine balance with energy conservation, in line with the risks posed to each plant’s water catchment.
Prevention of waterway pollution by wastewaterWater that we have finished using is purified to stricter standards than those required by law before being released into rivers and sewers.
Env i ron m e n t a lS t ra teg y
Env i ron m e n t a lDa t a
Ac t i v i t y■Biological Resources ■Water Resources ■Containers and Packaging ■Global Warming ■Environmental management

36
The production regions
In the assessment of water risks in the upstream of the value chain conducted in 2017, the Kirin Group ascertained the water risks of the production regions of its major raw materials, including malt and tea leaves.Based on the results of this assessment, we have decided to take actions starting from the water sources on tea farms in Sri Lanka, where we have been providing assistance for obtaining sustainable tea farm certification since 2013, and where we have close ties with local tea farms and NGOs.In our tea-farm water source conservation initiatives planned to be commenced in 2018, we will start with five tea farms selected from among the farms we have assisted to obtain certifications.In the tea farms on the highlands, the tea bushes are planted on steep slopes. The rain flows straight down such slopes which as a result are believed to have lower water source cultivation function compared to that of the mountains and hills where native forest remains. However, in places with good conditions of soil beds and others, rain that falls near the summit and on the tea farm penetrates the ground, and numerous springs gush up in sections of the tea farm. These places are known as micro watersheds.Micro watersheds on tea farms can be found in the highlands of central Sri Lanka, and, in almost all cases, they are headstreams of any one of rivers. For this reason, while they occupy only a tiny area, they are very precious water sources.In our new initiative, we will fence off these micro watersheds to protect them from being used for other purposes such as growing vegetables or grazing pasture. Also, with the objective of bringing vegetation diversity to single-cropping tea farms, we intend to plant native and endemic species of trees around the micro watersheds. This also serves to ensure that soil that flows down the slopes during torrential rainfall does not flow into the water shed.
Due to the history of Sri Lankan tea farms, going back to when the plantations were first established, many people live on the tea farms who make a living by doing work that has nothing do with the tea farms themselves. These residents have been generally allowed to use empty plots that are not being used to grow tea for their living.For this reason, there have been cases in which these residents, not recognizing the water sources, which are called micro watersheds, as water sources, have converted those areas to vegetable patches or grazing pasture, or have cut down the trees around the watersheds for firewood.Therefore, in order to protect the water sources, instead of merely fencing off to keep the tea farms’ residents away, there is a need to educate them that those areas are the water sources we should protect.In this new initiative, we intend to conduct an educational program that will teach approximately 15,000 residents in the vicinity of the five targeted water sources about the importance of water and about what kind of functions micro watersheds have.We are also considering including local elementary schoolchildren in the educational program and incorporating it into elementary school programs.
Conservation activities for water sources on tea farms Education programs for valuing water
Filtration
Summit
Tea farm
Spring
River
Mechanism of micro watersheds
Water sources on tea farms
Tea bushes planted on steep slopes
Env i ron m e n t a lS t ra teg y
Env i ron m e n t a lDa t a
Ac t i v i t y■Biological Resources ■Water Resources ■Containers and Packaging ■Global Warming ■Environmental management

37
Water sources
Our Water Source Forestation Activities, which began as an activity to protect the water sources of our manufacturing plants, began in the forest of the Tanzawa district of Kanagawa Prefecture, which is the water source for Kirin Brewery Yokohama Plant in 1999. This initiative, which was a pioneering initiative in the industry, has since been adopted in 12 locations across Japan. Under medium and long-term agreements with the local governments and other relevant parties that manage the water source forests, the program includes tree planting, undergrowth cutting, pruning, and thinning. Today, many of the forests are bright, luxuriant forests. In some locations, some of our customers have volunteered to take part in the activities. In 2017, 1,341 people took part in activities for a total of 16 times.
Activities to protect the blessings of water
Kirin Chitose water source forestHokkaido Chitose plant
Lake Biwa water source forestShiga plant
Water source recharge of Sengari ReservoirKobe plantKirin Okayama water source forestOkayama plant
Kyowa Hakko Kirin Yamaguchi water source forestUbe plant, Yamaguchi Production Center(Hofu, Ube)
Kirin Fukuoka water source forestFukuoka plant
Tassuigaha-Ikan forestKochi branch office
Kirin north Zao water source forestSendai plant
Kirin Kanagawa water source forestYokohama plant / Shonan plant
Kirin Mt. Fuji water source forestKirin Distillery
Kirin Kiso-river water source forestNagoya plant
Kyowa Hakko Kirin Takasaki water source forestTakasaki plant
Kirin’s forest across the country
Kirin has concluded the Sengari Reservoir Groundwater Cultivation Agreement with Kobe City and is engaged in conservation of the forests in the vicinity of the Sengari Reservoir, which is the water source for Kirin Brewery Kobe Plant and an important source of water for Kobe City. Sengari Reservoir is an important reservoir for the region, supplying tap water for Kita Ward of Kobe City and other areas. However, it had become difficult to look after the surrounding forests properly, and there were concerns about an adverse impact on the water quality of the reservoir due to soil and fallen trees flowing into the reservoir and others caused by the torrential downpours in recent years. On March 17, 2018, employees of the Kirin Brewery Kobe Plant, led by the plant general manager, along with citizen volunteers who had completed a course of forest maintenance and the people from Kobe City Waterworks Bureau, conducted activities under the guidance of experts.
Forest creation consists of planting, protection and nurturing, and taking advantage of resources. Teaching people who live in cities about forests through cutting work, and giving them hands-on experiences of making things from the thinned wood - all of these things lead to forest creation. We work with the Kirin Group on the Water and Forests Classroom, a reader-participation activity sponsored by Randonnée magazine, and other activities. With the aim of forest creation that anyone can participate in, we will continue to cooperate with the Kirin Group in the pursuit of our activities.
Continuation of various water source cultivation activities across Japan
Actual records of Water Source Forestation Activities in FY2017
■ Kirin Brewery Kobe Plant
■ Voices of Stakeholder
Mr. Komatsu, Tsuchi ni Kaeru Ki Forestation Society (NPO)
Locations
16 101,341
Number of implementation Number of participants
Env i ron m e n t a lS t ra teg y
Env i ron m e n t a lDa t a
Ac t i v i t y■Biological Resources ■Water Resources ■Containers and Packaging ■Global Warming ■Environmental management

38
Manufacturing
Reducing the amount of water used in manufacturing plants is a major challenge. The Kirin Group has pursued water conservation through recycling and others in addition to initiatives such as using water only when and as much as needed. Advanced water treatment equipment that use reverse osmosis membranes are expected to achieve major water conservation but it also consumes more energy. Therefore, we have ascertained the degree of risk through manufacturing plant catchment water risk surveys and other means, and are installing and operating water-saving equipment according to the level of risk.
Much of the water used in manufacturing plants is used for washing and sterilizing processes of equipment and pipes. In addition to the establishment of frameworks and mechanisms for the confirmation and assurance, from a quality perspective, that washing is being performed, water flow rate and velocity are strictly controlled to ensure that water is not wasted. We also actively pursue the re-use of water, depending on the purpose.Specifically, the rinsing water used in the final step of the pipe and equipment washing process is still relatively clear, so it can be used again for the initial process of pipe washing. In this way, we have implemented a cascading system of water use that repeatedly uses water that has been used in washing, according to the quality of the water. In actuality, considerable knowledge on how to use this equipment is needed to achieve the right volume balance of recoverable water and water used and the timing of recovery and use, and to guarantee that the equipment and pipes are being washed properly. The Kirin Group is achieving a high level of water conservation by promoting the activities accumulating various knowledge and ideas through sharing them and feeding back outcomes and otherwise.
The high risk of water shortages in Australia was reconfirmed in the water risk survey of business location catchments conducted at the end of 2017. Our Australian operations are, in fact, frequently affected by water shortages and a high degree of water conservation is required. For this, in addition to its regular water conservation activities, Lion has been introducing advanced water treatment equipment that uses reverse osmosis membranes on a large scale since 2008. This equipment is used to highly treat the water that previously could not be re-used, bringing it to a water quality standard that makes re-use possible. By using this treated water only in the processes that do not come into direct contact with products, it has been able to achieve the world’s highest level of water consumption rate. This technology is being shared within the Kirin Group, and is now in use at Kirin Brewery’s Kobe Plant.
Water conservation measures according to risks Cascading industrial water Advanced water treatment equipment
Removal of organic matter
BlowerAeration layer
Removal ofodor & color Removal of salt
MBRunit
Activated carbon Pre-filter
RO module
Collectedw
ater
Reclaimed
water
External washer
CIP equipment
Cascading rinse water for washing tanks
Flow of sophisticated water processing facility at the Kobe Plant
▶P.93
Cleaning process(from left to right)
Blowing
New water
Blowing
Cascading
Preliminarywashing
NaOH Alkalirinsing
Finalrinsing Beer
Cascading
Collection of recycled wasterwater
Hypochloritesterilization
Related Information
Env i ron m e n t a lS t ra teg y
Env i ron m e n t a lDa t a
Ac t i v i t y■Biological Resources ■Water Resources ■Containers and Packaging ■Global Warming ■Environmental management
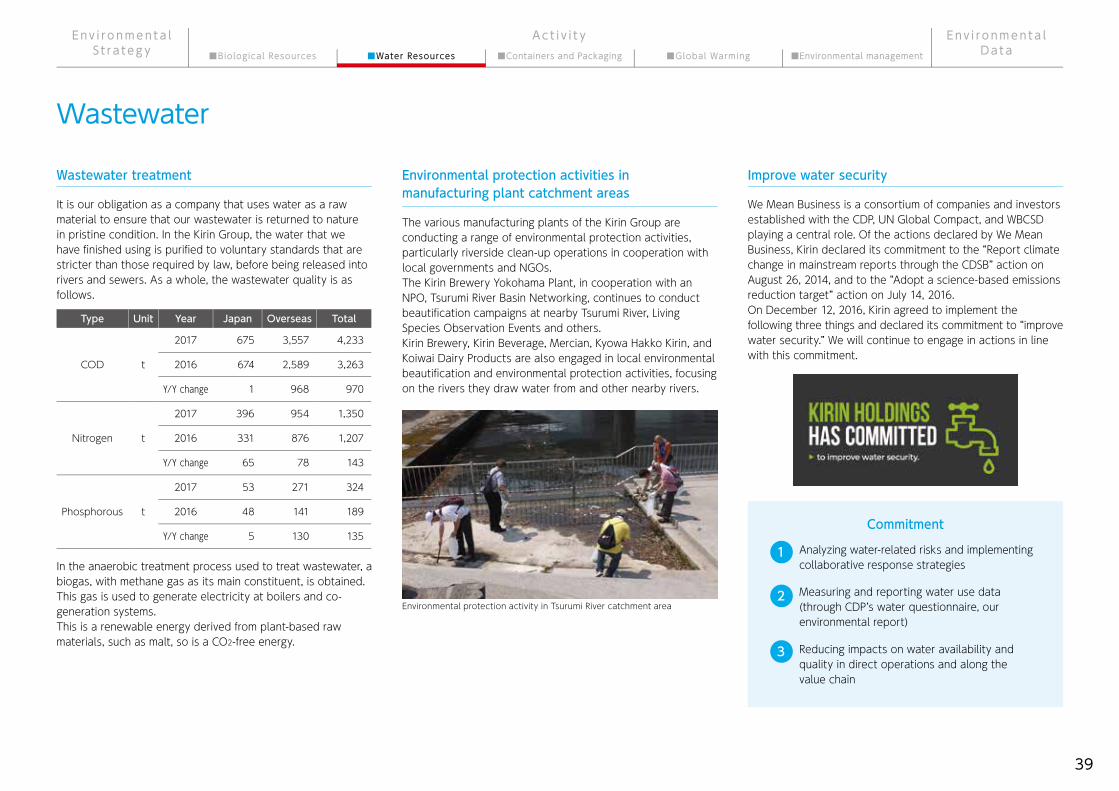
39
Wastewater
It is our obligation as a company that uses water as a raw material to ensure that our wastewater is returned to nature in pristine condition. In the Kirin Group, the water that we have finished using is purified to voluntary standards that are stricter than those required by law, before being released into rivers and sewers. As a whole, the wastewater quality is as follows.
In the anaerobic treatment process used to treat wastewater, a biogas, with methane gas as its main constituent, is obtained. This gas is used to generate electricity at boilers and co-generation systems.This is a renewable energy derived from plant-based raw materials, such as malt, so is a CO2-free energy.
The various manufacturing plants of the Kirin Group are conducting a range of environmental protection activities, particularly riverside clean-up operations in cooperation with local governments and NGOs.The Kirin Brewery Yokohama Plant, in cooperation with an NPO, Tsurumi River Basin Networking, continues to conduct beautification campaigns at nearby Tsurumi River, Living Species Observation Events and others.Kirin Brewery, Kirin Beverage, Mercian, Kyowa Hakko Kirin, and Koiwai Dairy Products are also engaged in local environmental beautification and environmental protection activities, focusing on the rivers they draw water from and other nearby rivers.
We Mean Business is a consortium of companies and investors established with the CDP, UN Global Compact, and WBCSD playing a central role. Of the actions declared by We Mean Business, Kirin declared its commitment to the “Report climate change in mainstream reports through the CDSB” action on August 26, 2014, and to the “Adopt a science-based emissions reduction target” action on July 14, 2016.On December 12, 2016, Kirin agreed to implement the following three things and declared its commitment to “improve water security.” We will continue to engage in actions in line with this commitment.
Wastewater treatment Environmental protection activities in manufacturing plant catchment areas
Improve water security
Environmental protection activity in Tsurumi River catchment area
Type Unit Year Japan Overseas Total
COD t
2017 675 3,557 4,233
2016 674 2,589 3,263
Y/Y change 1 968 970
Nitrogen t
2017 396 954 1,350
2016 331 876 1,207
Y/Y change 65 78 143
Phosphorous t
2017 53 271 324
2016 48 141 189
Y/Y change 5 130 135 Analyzing water-related risks and implementing collaborative response strategies
Reducing impacts on water availability and quality in direct operations and along the value chain
Measuring and reporting water use data (through CDP’s water questionnaire, our environmental report)
1
2
3
Commitment
Env i ron m e n t a lS t ra teg y
Env i ron m e n t a lDa t a
Ac t i v i t y■Biological Resources ■Water Resources ■Containers and Packaging ■Global Warming ■Environmental management

40
Business Location Water Risk Assessment
The results of the water risk assessment of Kirin Group business locations conducted in 2017 are as follows.For the assessment, we used WRI Aqueduct and WWF-DEG Water RiskFilter to simplify the surveys, and took information
Water shortage
72%
100% 100%
100%
100%
100% 100%
33%
67%100%
100% 100%
100%100% 100% 100%
100%
39%
33%
67%
88%
27%
67%
6%6%
39%
22%17%
11%
flood Water pollution Comprehensive evaluation
Japan(18 establishments)
America(3 establishments)
China(3 establishments)
Thailand(1 establishments)
Water shortage flood Water pollution Comprehensive evaluation
Myanmar(1 establishments)
LowDegree of risk
Brazil(1 establishments)
Australia(12 establishments)
Newzealand
(3 establishments)
Vietnam(2 establishments)
Medium High
6%
8% 8%8%
100%100% 100% 100%
100%100%
67% 84%
25%
83%
17%
100%
100%
100%
100%100% 100% 100%
published by administrations, etc. into consideration.Forty-four major manufacturing bases in Japan, the United States, China, Thailand, Vietnam, Myanmar, Brazil, Australia, and New Zealand were surveyed.
Env i ron m e n t a lS t ra teg y
Env i ron m e n t a lDa t a
Ac t i v i t y■Biological Resources ■Water Resources ■Containers and Packaging ■Global Warming ■Environmental management

41
Value Chain Water Risk Assessment The results of the value chain water risk assessment conducted in 2017 are as follows.Water footprint statistics and Product water footprint statistics from the Water Footprint Network (WFN) were used in the assessment. The assessment targeted Japan and some part of overseas businesses.
Green water
Blue water
Green water
Blue water
Green water
Blue water
Green water
Blue water
Green water
Blue water
Water use by raw material and country (malt, barley, hops)
Europe Australia Canada China Japan America
Green water
Blue water
Green water
Blue water
Green water
Blue water
malt
barley
hops
0 50 100 150 200 250(million m3)
Water use by raw material and country (grain)(million m3)
Green water
Blue water
Green water
Blue water
Green water
Blue water
Green water
Blue water
rice
soy
congritus
cornstarch
0 5 10 15 20 25 30
Japan Myanmar China America
Water use by raw material and country (dairy products)
raw milk
milkpowder
cheese
(million m3)Water use by raw material and country (tea and coffee)
tea
coffee
(million m3)0 20 40 60 80 100 120
Japan Sri Lanka India Indonesia Vietnam Other Southeast Asia Columbia Brazil Other
0 10 20 30 40 50 60 70 80
Japan New zealand Europe
Env i ron m e n t a lS t ra teg y
Env i ron m e n t a lDa t a
Ac t i v i t y■Biological Resources ■Water Resources ■Containers and Packaging ■Global Warming ■Environmental management

42
Water Graphs
Water use and consumption rate (water use/sales revenue) of entire Group
Water use and consumption rate (water use/sales revenue) of entire Kyowa Hakko Kirin Group (global)
Water use and consumption rate (water use/production volume) of Japan Integrated Beverages
Water use and consumption rate (water use/production volume) of Kirin Brewery
Water use and consumption rate (water use/production volume) of Lion
5.90 5.90 5.92 5.605.39
(thousand m3) (m3/kL)
Consumption rate
Water use
2016 201720152013 20140
5,000
10,000
15,000
20,000
0
3
2
1
4
5
6
19,903 19,155 19,928 19,303 18,313
Water use Consumption rate
2.52 2.542.67
2.933.06(thousand m3) (m3/kL)
2016 201720152013 20140
1
1.5
2
3
2.5
6,260 5,858 5,498 5,515 5,516
0
1,000
2,000
3,000
4,000
5,000
6,000
7,000
Consumption rate
Water use
Water use Consumption rate
4.90
10.4
4.84 4.96 5.06 5.26
(thousand m3) (m3/kL)
2016 2017201520131990 20140
3
2
1
4
5
6
10
9
8
7
10,791
34,900
10,573 11,098 11,006 11,198
0
5,000
10,000
35,000
30,000
25,000
20,000
15,000
Consumption rate
Water use
Water use Consumption rate
16.5 15.914.5
15.4
15.214.9
(thousand m3) (thousand m3/billion yen)
Consumption rate
Water use
Consumption rate (Japan standard)Water useConsumption rate (IFRS)
2016 201720152013 2014
56,095 52,875 52,751 52,772 52,488
0
10,000
20,000
30,000
40,000
50,000
60,000
0
10
15
5
20
37 36 3739
44 43
(thousand m3) (m3/million yen)
Consumption rate
Water use
2016 201720152013 20140
20
10
30
40
50
82,399 79,372 80,695 79,64481,685
0
20,000
40,000
60,000
80,000
100,000
Consumption rate (Japan standard)Water useConsumption rate (IFRS)
40 403943 43
(thousand m3) (%)
Cyclical use ratio
Water use
2016 201720152013 20140
20
10
30
40
50
13,163 13,020 13,508 13,386 15,123
43,39341,538 46,431 45,98941,225
0
10,000
20,000
30,000
40,000
50,000
60,000
70,000
80,000
Recycled water Cyclical use ratioRe-used water
Related Information ▶P.93
Cyclical water use and cyclical use ratio (cyclical use/ (tap water use + cyclical use)) of entire Group
Env i ron m e n t a lS t ra teg y
Env i ron m e n t a lDa t a
Ac t i v i t y■Biological Resources ■Water Resources ■Containers and Packaging ■Global Warming ■Environmental management

43
Env i ron m e n t a lS t ra teg y
Env i ron m e n t a lDa t a
Ac t i v i t y■Biological Resources ■Water Resources ■Containers and Packaging ■Global Warming ■Environmental management
Containers and packaging are essential to protect the quality of our products for delivery to our consumers. However, when we consider that used containers and packaging account for such a high proportion of household waste, unless appropriate 3R initiatives are pursued, they will become a major risk to our finite resources and to Kirin’s business. Taking advantage of the strength that is our Research Laboratories for Packaging Technologies, the Kirin Group has achieved Japan’s lightest weight in a variety of containers and packaging and has engaged in 3R, with the participation of industry organizations and the community. In Australia, the entire industry is responding to newly introduced legislative requirements concerning the collection and recycling of containers. Further, in our aim to improve the sustainability of raw materials for containers and packaging, we are pursuing initiatives in areas such as the use of recycled PET material and the proactive adoption of FSC-certified paper for our paper containers and packaging.
Basic Thinking
Containersand
Packaging
Overview of ApproachesP.45
Progress on Containers and PackagingP.46
Overview of Approaches in the Value ChainP.47
The Sustainability of raw materialsP.48
ReduceP.49
RecyclingP.52
Reuse
With the Society
Graphs for Containers and Packaging
P.53
P.54
P.56

45
Env i ron m e n t a lS t ra teg y
Env i ron m e n t a lDa t a
Ac t i v i t y■Biological Resources ■Water Resources ■Containers and Packaging ■Global Warming ■Environmental management
PET bottles
83.9%
■Trends in global forest area (1990-2015)
Source: , FAO FAO「FRA 2015 Results Desk Reference」
■Area of forests certified by FSC and PEFC (2000-2014)
Aluminiumcans
92.5%Stainlesssteel can
93.4%
year
1990
2000
2005
2010
2015
4,128,269
4,055,602
4,032,743
4,015,673
3,999,134
1990-2000
2000-2005
2005-2010
2010-2015
-7,267
-4,572
-3,414
-3,308
-0.18
-0.11
-0.08
-0.08
250
200
150
100
50
000 01 02 03 04 05 06 07 08 09 10 11 12 13 14
Forest area(x1,000 ha) Period Area
(x1,000 ha)%
change
21.3%3.6%
19.5% 39.1%16.5%
Glass bottles Aluminium cans Steel cans PET bottles Cardboard for Packaging
Global Forest Resources Assessment 2015
Overview of Approaches
Containers and packaging are essential to protect the quality of our products for delivery to our consumers. However, with used containers and packaging accounting for such a high proportion of household waste, 3R initiatives are of great importance to the Kirin Group’s Integrated Beverages Business.Leveraging its own R&D to pursue advanced weight reductions in containers and packaging, the Kirin Group has achieved the lightest weight in Japan for returnable glass beer bottles, aluminum beer cans, and 2.0-liter PET water bottles.
Reduce Challenges
More lightweight containers and packaging through R&D ■Material mix of containers and packaging in 2017, by weight
■Ratio of containers and packaging recycled in Japan3R in containers and packaging needs to be pursued by society as a whole.To this end, the Kirin Group offers containers and packaging that make it easier for consumers to participate in recycling, as well as engages in a variety of awareness-raising activities.The collection and recycling of containers and packaging is a major issue in Australia. To solve this issue, systems for the collection of empty containers in the community are being built in line with legal requirements, and Lion actively involves in it as a scheme coordinator.
Community engagement in the promotion of 3R
Japan has achieved a high standard of 3R, but recently, interest has been growing in the sustainable sourcing of raw materials for containers and packaging.To address such issue, the Kirin Group is pursuing the use of recycled PET material for its PET bottles.Further, we are dealing with the issue of forest destruction by aiming for the full adoption of FSC-certified paper for all of our paper container and packaging needs by the end of 2020.
Raw material sustainability for containers and packaging (bottle-to-bottle initiative, full adoption of FSC-certified paper for all paper containers)
Recycling and Reuse Challenges
Container and Packaging Sustainability Challenges
▶ P.52Related Information

46
Env i ron m e n t a lS t ra teg y
Env i ron m e n t a lDa t a
Ac t i v i t y■Biological Resources ■Water Resources ■Containers and Packaging ■Global Warming ■Environmental management
0
-100
-200
-300
-400
-500
-600(kt)
2012 2013 2014 2015 2016 2017
Glass bottles
Aluminium cans
Carton
6-can pack
PET bottles
Volumes used
Volume reduction
100% 93%3%
75%100%
Japan’s lightest returnable bottles
Japan’s lightest Aluminium cans
Japan’s lightest Aluminium cans
6-can pack
Pecology bottles Bottle-to-Bottle(weight ratio)
FSC®-certified paper
15k t78k t
3.5k t30k t
Progress on Containers and Packaging
Percentage of environmentally-friendly containers
Trends in accumulated weight reductions achieved through lightweighting of containers and packaging.
-627ktCumulative total
*Japan’s lightest returnable bottles and lightest aluminum cans are for Kirin Brewery. “Pecology bottles” and the bottle-to-bottle initiative for PET bottles are for Kirin Beverage.
* Covers containers and packaging of Kirin Brewery and Kirin Beverage
Volumes used and volume reductions in containers in 2017
Related Information ▶P.94

47
Env i ron m e n t a lS t ra teg y
Env i ron m e n t a lDa t a
Ac t i v i t y■Biological Resources ■Water Resources ■Containers and Packaging ■Global Warming ■Environmental management
Products
Customer
Raw material production regions
Manufacturing plants
Reduce
RecyclingReuse
Raw material sustainability for containers and packaging (bottle-to-bottle initiative, full adoption of FSC-certified paper for all paper containers)In Japan, advanced 3R initiatives have been rolling out for many years. We are also pursuing the adoption of FSC-certified paper and the use of recycled PET material to further improve the sustainability of the container and packaging materials.
More lightweight containers and packaging through R&DKirin is one of only a few integrated beverage manufacturers in Japan that develops its own containers and packaging. Leveraging the development and prototyping skills of our Research Laboratories for Packaging Technologies, we are working on the “reduce” part of 3R through the development and provision of Japan’s lightest containers for returnable glass bottles, one-way glass bottles, aluminum cans, 2.0-liter PET bottles, and other containers, while also taking ease of use into consideration.
Pursuit of re-use of containers and packagingWe continue to work with our various stakeholders to keep up our glass bottle re-use initiatives, and are maintaining our record of almost 100% collection of returnable glass beer bottles and returnable glass bottles for non-alcoholic beverages.
Community engagement in the pursuit of 3R (Australia’s drink container litter collection system)In addition to providing containers and packaging that are easily recyclable with innovations such as the use of single materials and labeling that aids trash separation, we are engaging with many stakeholders to pursue recycling together, including joining various organizations that promote recycling. We are also taking actions to comply with the legal requirements for drink container litter in Australia.
Overview of Approaches in the Value Chain

48
Env i ron m e n t a lS t ra teg y
Env i ron m e n t a lDa t a
Ac t i v i t y■Biological Resources ■Water Resources ■Containers and Packaging ■Global Warming ■Environmental management
The Sustainability of raw materials
The Kirin Group established its CSV Commitment in February 2017. As the first stage in concrete approaches, we revised the 2013 Action Plan for the Sustainable Use of Biological Resources and announced our goal of switching to FSC-certified paper for all of our paper containers and packaging by the end of 2020. This indicates that we have entered a new stage of pursuing the sustainability of container and packaging materials themselves, and it is positioned as an important approach that deals with the dual challenges of “biological resources” and “containers and packaging” mentioned in our Long-Term Environmental Vision.A major feature of this approach is that it targets 6-can packs, gift boxes, drink boxes and cardboard cartons for products, which covers almost all of our paper containers. This is the first declaration of its kind to be made by a Japanese manufacturer.
With the establishment in recent years of quality recycling methods that ensure plastics hygiene and enable recycled PET bottles to be turned back into PET bottles, Kirin Beverage is pursuing initiatives for the use of recycled PET material in the production of its PET bottles. In the mechanical recycling process, used PET bottles are washed and then processed at high temperatures in a state close to a vacuum. This process volatilizes and removes impurities trapped inside the plastic, and restores the molecular weight, which declines in the recycling process, to a level suitable for molding into bottles.
The status of achievement of targets as of the end of April 2018 is as follows.
Adoption of FSC-certified paper for containers and packaging
Bottle-to-bottle
FSC-certified paper targets and status of achievement
In the area of drink boxes, certified paper has been in use for Tropicana 250-ml drink boxes since before this declaration and the drink boxes have a label to that effect on them. In March, 2017, we made the switch to FSC-certified paper for Tropicana 900-ml boxes as well. Kirin Beverages is progressively switching to FSC-certified paper for its drink boxes, starting with its Kirin Gogo-no-Kocha Summer Citrus Tea product in May 2017.The switch to FSC-certified paper was completed for all 6-can packs for beer of all sizes in November 2017. For gift boxes, FSC-certified paper was adopted for the Kirin Ichiban Shibori Draft Set in October 2017.Further, for cardboard cartons for products, a “FSC-certified paper” label was attached to Salty Lychee boxes in May 2017, and we are progressively switching to certified paper for other cartons.
FSC-certified paper targets and rate of achievement
Type
6-can packs for beer
6-can packs for non- alcoholic beverages
Gift boxes
Drink boxes
Cardboard cartonsfor products
100%
100%
100%
100%
100%
End of 2017
End of 2017
End of 2020
End of 2020
End of 2020
100%
100%
100%
about90%
about70%
adout50%
about70%
about70%
about50%
Commenced in May 2018
Target TargetYear
Rate of FSC-certified paper
Rate of FSC labeling
▶P.85For policies on biological resources

49
Env i ron m e n t a lS t ra teg y
Env i ron m e n t a lDa t a
Ac t i v i t y■Biological Resources ■Water Resources ■Containers and Packaging ■Global Warming ■Environmental management
Reduce
Our “corner-cut cartons” were developed by the Research Laboratories for Packaging Technologies and introduced in 2004. The beveled corners have reduced the weight of the carton and, because the carton has eight sides, making it stronger, the cardboard thickness has been reduced, resulting in a 10.9% reduction in the weight of the carton compared to conventional cartons.
Innovations have been incorporated into various parts of the 6-can pack to make it more lightweight, as well as achieving ease of carrying and removing from the shelf. For example, a new cut-out section has been included at the sides of the pack to match the can edge (Kirin patent), and a “can bottom
The smart-cut carton, which we introduced in 2015, is based on the corner-cut carton technology. In addition to the reduction in weight, the corners of the long edges at the top of the carton have been cut to fit the space created by the lids of the 204-diameter can, which are smaller than the rest of the can. This has resulted in a 16% weight reduction compared to the corner-cut carton.The Research Laboratories for Packaging Technologies developed the smart-cut carton in conjunction with a container and packaging manufacturer, with whom the Laboratories have obtained a joint design registration.
Corner-cut cartons 6-can pack
Smart-cut cartons
Of the same thickness as well asthe corner often becomes resistant to load.
middle core
66.3mm
62.25mm204
Diameter
smart-cutcardboard
cases
Finger grip
Can lid lock
Triangular fold on top side holes
New 6-canpack
Previous 6-canpack
Layered for comparison
17.5mm
10mm
17.5mm
10mmNew 6-can pack
Previous 6-can pack
lock structure” is used to stabilize the bottoms of the can with paper. These innovations have resulted in a reduction in packaging material of 4 grams, or 8%, per 500-ml 6-can pack, while also improving the pack’s can-holding power.
Quantity of paper saved by eliminating corners
Quantity of paper saved by making
cardboard core thinner
2%reduction
8.9%reduction

50
Env i ron m e n t a lS t ra teg y
Env i ron m e n t a lDa t a
Ac t i v i t y■Biological Resources ■Water Resources ■Containers and Packaging ■Global Warming ■Environmental management
The Kirin Group’s Research Laboratories for Packaging Technologies have continued their technological development efforts with the aim of reducing the weight of PET bottles. In particular, the Laboratories have succeeded in reducing the weight of the PET bottle for the 2.0-liter Kirin Alkali Ion Water product from the 63 grams of prior to June 2003 to 28.9 grams, making it the lightest PET bottle for water in Japan.Simply making the bottle walls thinner would make it difficult to maintain the strength of the bottle, so a design was developed that achieved both appropriate strength and ease of holding. Innovations were also incorporated that made it easy even for a small child to crush the bottle after the contents have been drunk.
At Kirin Brewery, by reducing the diameter of the can ends and narrowing the top and bottom edges of the can body to reduce the weight of the can, as well as thinning out the walls of the can body, for our 350-ml aluminum cans, the current 204-diameter can end has achieved a weight reduction of approximately 29% compared to the old 209-diameter can end. This means an annual saving in aluminum resources* of approximately 19,000 tonnes. (*Kirin data from 2015 production volumes)Further, working with can manufacturers, we developed Japan’s lightest aluminum can with thinner can ends and bodies in 2016. The overall weight of the can has been reduced by approximately 5% (0.8 grams) from 14.6 grams to 13.8 grams. This represents a weight reduction of 33% (6.7%) from the 209-diameter can end.
Japan’s lightest PET bottle
Lighter Cans
▶P.19
▶P.19
20.5g 18.6g 14.6g 13.8g15.2g
+ + + +
Diameter andweight of the lid
1973209Diameter 206Diameter 204Diameter 204Diameter 204Diameter
1985 1994 2011 2016
Diameter andweight of the body
The weight of the cans
66.3mm
15.2g 14.7g
3.9g 3.1g5.3g
11.5g
66.3mm
66.3mm
66.3mm
69.8mm
64.7mm
62.3mm
+3.1g
12.1g
66.3mm
62.3mm
2.9g
10.9g
62.3mm
-6.7g 33% reduction
Transitionin weight of the 350ml aluminum cans
The 2.0-liter
The strength of the bottle that
does not collapse
63g
21greduction
7greduction
6.1greduction
42g 35g 28.9g
Easy to hold dent“nicely grip”
~2003 2003 2010 2015
Weightfrom
above16 of thegroove to
maintain thestrength
Kirin Alkali Ion Water
Related Information
Related Information

51
Env i ron m e n t a lS t ra teg y
Env i ron m e n t a lDa t a
Ac t i v i t y■Biological Resources ■Water Resources ■Containers and Packaging ■Global Warming ■Environmental management
As well as being light in weight, returnable glass bottles need to be durable enough to maintain their returnable functionality and strong enough to ensure consumer safety and peace of mind.To meet this challenge, the Research Laboratories for Packaging Technologies made excellent use of innovations such as a ceramic coating that forms a thin film on the bottle’s outside surface, an impact-resistant shape design, and a bottle mouth design that meets the conflicting requirements of being easy to open and able to be sealed tightly and that is also strong enough not to chip, achieving Japan’s lightest returnable glass beer bottles in all sizes, large, medium, and small.
For the 330-ml one-way glass bottles used for Grand Kirin and other products, we use the Premium Glass Bottle, developed by the Research Laboratories for Packaging Technologies, which, at 140 grams, is the lightest one-way glass bottle in Japan. Innovations developed to achieve this light weight included ensuring an appropriate wall thickness in parts of the bottle that come in contact with its surroundings, and widening the curve at the heel of the bottle to make it easier to ensure the necessary wall thickness when molding the bottle.
The Daily Drinks Co. in Australia has reduced the weight of the shelf-ready packaging for its Zooper Dooper ice candy product by 40%.
The weight of the can used for FIRE Hikitate Bito (low-sugar) coffee was reduced by 23% compared to 2008 in 2012.
No water is used in the molding process and the elimination of painting inside the can has reduced CO2 emissions.
The area of the side flap has been reduced to conserve resources. CO2 emissions during manufacture have been reduced by 10%.
Resource conservation by cutting out the four corners
In 2016, Lion Pty Limited also succeeded in reducing the weight of its one-way bottles from 205 grams to 190 grams.
Japan’s lightest returnable glass bottles
Japan’s lightest one-way glass bottle
Other Reduce initiatives
CO2 reduction effect of lighter medium-size bottles
We applied a ceramics coating technology
The large, gentle curve at the bottle heel supports the strength of the bottle, which has been made lighter by making the walls as thin as possible.
470g→380g
Mediumbottle
Largebottle
605g→475g
* Calculated on assumption of 10 million bottles a year
Medium
curve
▶P.19
Short-flap carton Steel cansAluminum Cans Laminated Inside and Outside with PET Film Corner-cut cartons
330mlone-way bottle
CO2 emmissions per one at the time of
manufacture
18%Lighter
23greduction
930treduction90g
reduction130greduction
1.5 mm less than previous bottles
Previous
Previous
Lightest in Japan
Lightest in JapanRelated Information
52
Env i ron m e n t a lS t ra teg y
Env i ron m e n t a lDa t a
Ac t i v i t y■Biological Resources ■Water Resources ■Containers and Packaging ■Global Warming ■Environmental management
Recycling
Kirin is a member of The Council for PET Bottle Recycling, through which it promotes the recycling of PET bottles. This Council was formed in response to the revision of the Container and Packaging Recycling Scheme in 2006 with the objective of voluntary promotion of 3R by business operators. Under the Third 3R Promotion Voluntary Action Plan (FY2016‒FY2020), we are working toward a target recycling rate of 85% (base year: FY2004).
Kirin is pursuing the adoption of aluminum cans, which have a high rate of recycled metal. We have also joined the Japan Aluminum Can Recycling Association, and we are providing assistance for the collection of used aluminum cans as a way to promote their recycling. (*See Page 36) The Japan Aluminum Can Recycling Association was established in response to the revision of the Container and Packaging Recycling Scheme in 2006 with the objective of voluntary promotion of 3R by business operators.Under the Third 3R Promotion Voluntary Action Plan (FY2016‒FY2020), we are working toward a target recycling rate of 90% (base year: FY2004) for both aluminum and steel cans.Empty aluminum cans that have been discarded at the breweries are recycled by the can manufacturers and used entirely for aluminum beer cans.
Old returnable glass beer bottles that can no longer be re-used and one-way bottles which are used only once are turned into cullet, for use primarily as the raw material for making new glass bottles.With the aim of the 100% recycling of empty glass bottles, we are pursuing uses for cullet made from colored glass, which cannot easily be re-used for glass bottles. We are finding other applications for colored cullet, including in building materials such as tiles and blocks and road paving materials.
Recycling of PET bottles
Recycling of glass bottles
Recycling of cans
82.6 86.9 83.985.0800
700
600
500
400
300
200
100
0
100
80
60
40
20
02015 20162014
85.8
2012 2013
(%)(kt)sales volume
・recycling volume
Recycling rate
Specified PET bottle sales volumeOverseas recycling volumeDomestic recycling volumeRecycling rate
Source: The Council for PET Bottle Recycling
Source: Japan Aluminum Can Recycling Association
Source: Japan Steel Can Recycling Association
239 199
271
227
262
241
254
569 563
221
279
596583
258
579Municipal waste-
related businessesMunicipal waste-
related businesses
Recycling-related businesses
Recycling-related businesses
Separated and collected Sorting/Storing
20162012 2013 2014 2015
2012 20162013 2014 2015
Weight of consumed volumeRecycling volumeRecycling rate
100
80
60
40
20
0
(kt)93.490.8
463
435
664
603
92.9 92.9
611
567
92.0
571
525
486
451
800
600
400
200
0
Weight of consumed volumeRecycling volumeRecycling rateCan to Can rate
92.5
224 206191 180
83.8
194 162
300
200
100
0
100
80
60
40
20
0
(Hundred million cans) (%)
(%)
94.7
62.874.7
63.468.466.7
87.4 90.1
202 175 222 199
Rate of aluminum can recycling in Japan
Rate of PET bottle recycling in Japan
CAN-to-CAN flow
Flow of recycling of PET bottles
Three methods of recycling aluminum cans
Aluminummelted
Recycledmetal
Aluminum can manufacture
Approximately 97% saving in energy required to make recycled aluminum compared to new metal
Rate of steel can recycling in Japan
Aluminumcans
Re-use Recycling
Consumer
Separated anddiscarded
Mass collection
Collection at collection points
Separation and collection
Other Recycling initiatives
PET bottles Drink boxes Outer case cartons
Aluminum cansCans with a high percentage of recycled metal used as much as possible.
Cardboard suitable for recycling.
Clear outer-packaging film eliminated for easier recycling.
Clear PET bottles used for easier recycling.
▶P.54Related Information

53
Env i ron m e n t a lS t ra teg y
Env i ron m e n t a lDa t a
Ac t i v i t y■Biological Resources ■Water Resources ■Containers and Packaging ■Global Warming ■Environmental management
Reuse
In Japan, glass bottles have been collected and re-used over and over since the Meiji Era (1868-1912), long before the word “3R” was coined.Returnable glass bottles that come back to the factory are washed thoroughly inside and out to make them as clean as a new bottle. After the bottles are stringently checked for scratches and cracks with an empty bottle inspection machine, they are put back into product service and filled with beer. When handled carefully, returnable glass bottles last for an average of about eight years. This means they are used around 24 times.Bottles that have small scratches or fine cracks or that are too old to be of service any longer are crushed and turned into a material called cullet, which is used as the raw material to make new bottles.
Kirin is one of the few Japanese integrated beverages companies to have its own “laboratory” for the development of containers and packaging. Located in the Techno-Village of Kirin Beverages’ Yokohama Plant, the Research Laboratories for Packaging Technologies is mainly engaged in the development of containers and packaging for beverages such as beer, happoshu (low-malt beer), wine, and soft drinks, and the development of
Re-use of glass bottles
TOPICS
▶P.56*For Kirin Brewery and Kirin Beverage returnable bottle collection rates
Returnable bottle (alcoholic beverages)
Returnable bottle (soft drinks)
Large commercial draft barrels (stainless steel)
Other Reuse initiativesCustomer Store
Kirinplant Washing
Rinsing
InspectionCullet
productionGlass
factory
Melting
Molding
酒
Flow of returnable glass bottles
Research Laboratories for Packaging Technologiespackaging technology. It leverages the technologies it has accumulated in these areas to provide the necessary technical assistance to bring products to market, including eco-design packaging. The Laboratory is as well equipped as a small factory, with machinery to fill glass bottles and aluminum cans with beer and equipment to attach labels to bottles.

54
Env i ron m e n t a lS t ra teg y
Env i ron m e n t a lDa t a
Ac t i v i t y■Biological Resources ■Water Resources ■Containers and Packaging ■Global Warming ■Environmental management
With the Society
As a member of the Japan Aluminum Can Recycling Association, the Kirin Group is engaged in the recycling of aluminum cans. In addition, it also supports the activities of can manufacturers to collect used cans. More than 40,000 tonnes of aluminum cans are collected via these activities, all of which are recycled back into new cans, which Kirin uses for its products.
In consideration of ease of trash separation, we endeavor as far as possible to use single materials in our containers and packaging or make it easier to separate them into single materials. Also, to raise awareness about the recycling of containers and packaging, we provide containers and packaging that are easy to separate. We also take into consideration the ability to recycle the materials without problems at general waste processing facilities.
For vending machines installed by Kirin Beverage, the company conducts a comprehensive operation, from proposal and refilling of merchandise to service and repair of the vending machines. In addition, as an environmental initiative, it collects the empty containers and even cleans the area around the vending machines.
We are engaged in a number of 3R awareness-raising activities on the internet. These include the Kirin’s Containers and Packaging and 3R website, which is the most informative website about recycling in the industry, and the Beverage Kids website for children. We also deal with the theme of 3R for containers and packaging at our Kirin School Challenge workshops for children.We also use Eco Panda, an environmental-awareness mascot character that made its first appearance to coincide with the launch of the “pecology bottle,” an environmentally-friendly, resource-conserving, easily crushable container, to conduct awareness-raising activities aimed at children.
Voluntary collection of aluminum cans Easily separated containers and packaging
Collection of used containers at vending machines
Consumer awareness activities
Bags for recycling provided by Kirin Brewery

55
Env i ron m e n t a lS t ra teg y
Env i ron m e n t a lDa t a
Ac t i v i t y■Biological Resources ■Water Resources ■Containers and Packaging ■Global Warming ■Environmental management
The individual states of Australia are beginning to introduce Container Deposit Schemes (CDS) with the aim of recovering and recycling drink containers. Lion and four other major beverage companies have established “Exchange for Change (EFC)” to manage the funds from the New South Wales (NSW) CDS, with Lion serving as a director of the organization. EFC was appointed by the NSW Government as Scheme Coordinator for their CDS in July 2017. The CDS began rolling out throughout the entire state of NSW in December 2017. Drink container litter accounts for 44% of the state’s total litter volume and costs more than $162 million to manage. Through CDS, the NSW state government aims to reduce the volume of litter in the state by 40% by 2020.Under the scheme, 150-ml to 3-liter drink containers will be eligible for a refund of 10 cents per container, with some exceptions. Beverage suppliers (manufacturers, importers, wholesalers, and retailers), including Lion, are responsible for funding the refunds and other associated Scheme costs, including the costs of recovering the containers and promoting the scheme.More than 500 collection points will be established throughout the state of NSW, in locations such as local stores, depot sites, and recycling centers. Reverse vending machines have been installed at some collection points as a means of raising public awareness of recycling. When a container is placed in the vending machine, a 10-cent refund will be paid. EFC is involved in the installation of these machines and in activities including awareness-raising campaigns targeted at children.
The Adopt Program is a method of community beautification in which residents “adopt” a section of a neighborhood and participate in cleanup activities. The Beverage Industry Environment Beautification Association (BIEBA) brings together six beverage manufacturing industry bodies to conduct promotions and activities aimed at the beautification of communities. Kirin Brewery and Kirin Beverage participate in BIEBA as members of their respective industry bodies, the Brewers Association of Japan and the Japan Soft Drink Association, providing support for activities in this Program.
Australia’s Container Deposit Schemes and Lion’s Initiatives
Adopt Program (Community Beautification)
Support for educationBIEBA grants awards to schools that are actively engaged in the education and practice of community beautification. It also produces and supplies community beautification education guides for teachers.
Littering prevention campaignBIEBA places “No Littering” stickers on roadside signs and vending machines to call for the prevention of littering.
Main activities of the Beverage Industry Environment Beautification
Association
Adopt Program
We want to work with residents
to beautify our town
Localgovernments
Local residentsBIEBA
What kind of volunteer work
can anybody do?
I want to help too!
I want to participate in community
beautification too!
Standard “No Littering” logo

56
Env i ron m e n t a lS t ra teg y
Env i ron m e n t a lDa t a
Ac t i v i t y■Biological Resources ■Water Resources ■Containers and Packaging ■Global Warming ■Environmental management
Graphs for Containers and Packaging
42g 35g
350ml Aluminum cans2L Pet bottle
10
20
30
40
50
60
70
1990 1995 2000 2005 2010 2015
(g)(g)
(g)
63g 42g
-18%35g 28.9g
Large bottle Medium bottle Small bottle
605g 475g 470g 380gTest introduced in 2004The total amount of switching in 10 years
390g 351gAll introducted in 2003
-21%
-10%
-19%
PET bottles lighter transition
5
10
15
20
Can lighter transition
350
400
450
500
550
600
650
Returnable beer bottles lighter transitionKirin Brewery trends in sale and collection of returnable glass bottles
Kirin Beverage trends in sale and collection of returnable glass bottles
18.6g 15.2g-22.2g
-1.6g
-4g
-7.7g-18%
15.2g 14.6g-4%
-5%14.6g 13.8g
-33%
-17%
20201990 1995 2000 2005 2010 2015 2020 1990 1995 2000 2005 2010 2015
30
20
10
0
(g)
Trends in weight reduction of cartons and 6-can packs.
2020
1990 1995 2000 2005 2010 2015 2020
-26.2g
6-can packs(350ml) Carton(350ml Loose)
Introduction start in 2009
Sale Collection Sale Collection
(thousand bottles)(million bottles)
300
200
100
0
30
20
10
02014 2015 201620142013 20132015 2016 2017 2017
Introduction start in 2010 Introduction start in 2015
Introduction start in 2003
Introduction start in 2011
Introduction start in 1994
Introduction start in 2016
Introduction start in 2015
Introduction start in 2006
Introduction start in 2004
Introduction start in 2015
Introduction start in 1993All introducted in 2003
▶P.94Related Information

57
Env i ron m e n t a lS t ra teg y
Env i ron m e n t a lDa t a
Ac t i v i t y■Biological Resources ■Water Resources ■Containers and Packaging ■Global Warming ■Environmental management

Overview of ApproachesP.59
Progress on Global WarmingP.60
Overview of Approaches in the Value ChainP.61
Value chain upstreamP.62
ManufacturingP.63
DistributionP.64
Sale
Natural energy
GHG date
GHG Graphs
P.65
P.66
P.67
P.68
Climate change caused by global warming has a major impact on biological and water resources, which are important raw materials for the Kirin Group’s Integrated Beverage Business. Given that greenhouse gases impact on the entire earth no matter where they are emitted, the target required to achieve by the Paris Agreement, that the increase in the global average temperature be held to well below 2°C above preindustrial levels, is an equal responsibility for all companies.In 2009, the Kirin Group declared the lofty goal of halving its CO2 emissions from a 1990 base-year across the value chain by 2050, and has been taking action toward that target. In 2017, we further set a new target of reducing the total of Scope 1 and Scope 2 emissions and Scope 3 emissions by 30% from a 2015 base-year by 2030. This target was approved by Science Based Targets (SBT), international initiatives, as a science-based greenhouse gas reduction target aimed at keeping global temperature rise less than 2°C above pre-industrial revolution level. This was the first example of such approval in Japan’s food industry.
Basic Thinking
Global Warming

59
In raw material producing countries for tea leaves, production has been severely impacted by natural disasters caused by drought and torrential rains. Our Australian manufacturing bases have also been affected by drought.In response to the manifestation of these kinds of effects of climate change, in 2013, the Kirin Group set a target of reducing its CO2 emissions across the entire value chain of its business to half of 1990 levels by 2050, and has conducted initiatives in pursuit of that goal.Further, in March 2017, it established and announced a new medium-term greenhouse gas reduction target for total of Scope 1 and Scope 2 emissions and Scope 3 emissions by 30%, respectively from a 2015 base-year by 2030, and this target was approved by SBT.To achieve this target, we have developed a roadmap and set targets for the ratios of renewable energy introduced into our energy mix.
Achievement of medium-term greenhouse gas reduction targets through SBT*
In Japan, the labor shortage is said to be most conspicuous in the logistics sector. There is a serious shortage of truck drivers for the transport of beer and non-alcoholic beverages, too.To solve this problem, the Kirin Group is making improvements in loading efficiency, pursuing modal shift and expanding joint delivery with other companies in the industry. These initiatives will help to solve two issues - the driver shortage and reduction of greenhouse gas emissions.
Response to shortage of truck drivers
Source: , Railway Freight Association
■Future projections of truck driver supply and demand
993,765
964,647
-29,118
1,030,413
924,202
-106,211
958,443
872,497
-85,946
Demand
Supply
Surplus/shortage
2010 2020 2030
FY2013 Main Committee Report
2015 2030
■Target for total Scope 1 and Scope 2 emissions
■Renewable energy targets
Kirin Brewery
Lion
■Greenhouse gas emissions across value chain and reduction targets
1990
-50%
2015 2030 2050
Science Based Targets is a joint initiative by CDP, the UN Global Compact (UNGC), the World Resources Institute (WRI) and WWF.The methods of Science Based Targets are 100% science based and this is what makes Science Based Targets a unique organisation.
Increase ratio of renewable energy in manufacturing plant electricity purchases to 50% by 2030
Install solar power facilities with 10MW capacity by 2026
Target
-30%Target
-30%Target
Overview of Approaches
Challengesin Climate Change
Challengesin Non-Competitive Sectors
Env i ron m e n t a lS t ra teg y
Env i ron m e n t a lDa t a
Ac t i v i t y■Biological Resources ■Water Resources ■Containers and Packaging ■Global Warming ■Environmental management

60
Progress on Global Warming
Ratios of greenhouse gas emissions in value chain
Trends in greenhouse gas emissions from entire value chain
Achievement of medium-term greenhouse gas emissions reductions
1990 2015 2016 2017 2050
5,081
7,197
5,209 5,347
3,598
(ktCO2e)
8,000
7,000
6,000
5,000
4,000
3,000
2,000
1,000
0
Target
-50%-25.7%
2015 2016 2017 2030
968 963 947
4,071 4,077 4,213
Scope1+2
2,850
678
Target
0
1,000
2,000
3,000
4,000
5,000
Scope3(ktCO2e)
※“Raw materials + containers” are calculated as Category 1, “transport (upstream)” as Category 4, manufacturing as Scope 1 + Scope 2, “transport (downstream)” as Category 9, and “use/disposal” as Category 11+12. This chart does not include Categories 3, 5, 6, and 7.
Please see for details of all emissions.
Raw materials + containers Transport (upstream)
Manufacturing Transport (downstream)
Use/disposal
51% 7% 19% 3%19%▶P.90
Env i ron m e n t a lS t ra teg y
Env i ron m e n t a lDa t a
Ac t i v i t y■Biological Resources ■Water Resources ■Containers and Packaging ■Global Warming ■Environmental management

61
Products
Raw material production regions
Manufacturing plants
Achievement of medium-term greenhouse gas reduction targets through SBTTo achieve our medium-term greenhouse gas reduction targets, we established a roadmap and set targets for ratios of renewable energy introduced into our energy mix.
Initiatives in production regionsIn cooperation with non-government organizations, we are providing assistance for our Australian contract dairy farmers to introduce energy-saving equipment.
Initiatives in the upstream of value chainInitiatives in this area include importing wine from overseas in large capacity special bags to eliminate transportation of glass bottles. We have also started in-house production of PET bottles, eliminating transportation of empty containers from the manufacturers.
Initiatives in manufacturingInitiatives include fuel conversion to natural gas, introduction of co-generation systems that can supply heat and electricity, introduction of high-efficiency cooling systems, reduction of power use for ventilation by anaerobic treatment of wastewater and use of generated biogas.
Response to shortage of truck driversThrough joint delivery with other companies in the industry using rail transport and other means, we are alleviating the burden on truck drivers as well as reducing CO2 emissions during transport.
Responses with productsBy reducing the weight of containers and packaging, we are reducing CO2 emissions during manufacturing and transport.
Initiatives in salesInitiatives include expanding the introduction of heat pump-style vending machines and using green power at Spring Valley Brewery Tokyo.
Overview of Approaches in the Value Chain
Env i ron m e n t a lS t ra teg y
Env i ron m e n t a lDa t a
Ac t i v i t y■Biological Resources ■Water Resources ■Containers and Packaging ■Global Warming ■Environmental management

62
Value chain upstream
The Lion Landcare Dairy Pride Grants Program supports sustainable dairy farming projects.
An in-line blowing aseptic filling machine forms PET bottles from materials known as preforms and fills bottles under aseptic conditions. Kirin Beverage introduced Japan's first in-line PET blowing aseptic filling machine to Nagano Tomato (currently Shinshu Beverage) in 1997, and subsequently installed a high speed in-line PET blowing aseptic filling machine at the Shonan Plant in 2000.Although installation of the machine increases CO2 emissions from the plant, using preforms allows us to process greater loads on trucks compared to using empty PET bottles; therefore, it significantly enhances transport efficiency. Installation consequently contributes greatly to reducing CO2 emissions from the value chain as a whole and to cutting costs.Furthermore, in 2003, we installed a preform molding equipment on the beverage manufacturing line at Kirin Distillery ahead of other players in the industry.
Mercian ships some of the wine it imports via ocean transportation in specially designed, large 24 kiloliter bags (equivalent to about 32,000 750 liter bottles) with low oxygen permeability and bottles the wine in Japan. Compared to importing bottled wine, this method lets Mercian reduce CO2 emissions during ocean transport by roughly 60%. In addition, bottling wine in Japan allows us to use Ecology Bottles (made with at least 90% recycled glass) and lightweight bottles, which contributes to making effective use of resources and reducing CO2 emissions during shipment within Japan.
At the tea farms in Sri Lanka, in recent years, they have unusual heavy rainfall in the rainy season more frequently due to the effects of climate change. In the key tea production region of Uva Province, many human lives were lost due to landslides. In the training for Rainforest Alliance certification, farmers are taught how to prevent fertile soil from being washed away by erosion caused by rain. Specifically, they are taught to plant grasses whose roots sink deep into the soil and crawl the ground on slopes. In addition to preventing landslide disasters caused by heavy rainfall, this also serves as a response to the problem of climate change.
Lion Landcare Dairy Pride Grants Program In-line blowing aseptic filling machine Ocean Transportation in Large Bags and Bottling in Japan
Responses at tea farms
▶P.30
▶P.30
Dairy farmers who have received grants
Specially designed large bags
Related Information
Related Information
Env i ron m e n t a lS t ra teg y
Env i ron m e n t a lDa t a
Ac t i v i t y■Biological Resources ■Water Resources ■Containers and Packaging ■Global Warming ■Environmental management

63
Manufacturing
A significant proportion of the fuel used in breweries is used in the boilers that generate steam. We have shifted to natural gas, which generates less CO2 than heavy oil. This fuel shift has been completed in all of Kirin Brewery’s and Kirin Beverage’s manufacturing plants. We are also achieving more efficient boiler operations through the installation of small boilers. We have introduced cogeneration systems to provide some of the plants’ heat and electricity.
At some of the plants of Kirin Brewery and Kirin Beverage, energy-saving efforts are made through improving the efficiency of refrigerating systems. This is done by implementing a cascade refrigeration system, which cools in phases in a process that involves a considerable temperature difference, or making operational improvements.
In our beer breweries, we have introduced anaerobic treatment facilities to purify the wastewater generated by the manufacturing process. Unlike conventional aerobic treatment, anaerobic treatment does not require electricity for ventilation. Also, the anaerobic microorganisms generate biogas as a by-product of the treatment process. This biogas, the main component of which is methane, can be used in biogas boilers and cogeneration systems. Derived from biological materials such as malt, biogas is a renewable energy and a CO2-free fuel.
To meet skyrocketing demand, Myanmar Brewery has made major expansions at its manufacturing and filling facilities. Its high-efficiency 100,000 KL line began operation in the beginning of 2018. From the overall design to equipment selection, installation, tuning and other work for the new facilities, we assist Myanmar Brewery which seeks maximization of investment efficiency by leveraging the experience and high level skills of Kirin Engineering, which has an excellent reputation even with food manufacturers outside the group, and engineers temporarily assigned from Kirin.Currently, with the rapid economic development in Myanmar, there are concerns about tightening of the energy supply-demand balance in the future.Against this background, we are curbing energy consumption in the various processes, such as taking advantage of the Japanese Government’s Joint Crediting Mechanism (JCM)
Fuel shift and cogeneration
Improvement of the refrigeration system
Wastewater biogas
Construction of highly efficient production facilities at Myanmar Brewery
financial assistance scheme to introduce the latest energy-saving equipment. In this way, the Kirin Group aims to achieve sustainable growth in Myanmar while contributing to both Myanmar’s economic growth and the reduction of its environmental footprint.
cogeneration
Anaerobictreatment facility
Drainagewater
Exhaustheat boiler
Transferredtomanufacturingprocess
Biogas engine
Steam boiler
The main component of biogas is methane.Biogas is produced by putting the drainage water from the plant into a tank filled with granules of an anaerobic microorganism, and circulating the water in the tank.
Drainage water is used togenerate electricity and steam.
Installed energy-saving equipmentWort pre-heating system
Heat recovery tank
Wortpre-heater
Heatexchanger
Reduction of steam used in the wort boiling process
by half
Recovery of steam generated atthe time of boiling wort and useas heat source
Vapor re-compression systemUse of steam ejector
The heat exhaust from the biogas engine is used to produce steam to be utilized in the manufacturing process
Biogas is used as the fuel for a gas engine to generate power, which is then utilized as electricity for the plant.
Manufacturingprocess
Biogas
Treatedwater
Steam
Electricity
●Brine line
Refrigarating machinefor low temperature
Solid line:Brine line Dotted line: cold water line
Cold waterCold heat load
Cold head load forcold water productionRefrigarating machine
for high temperatureCold head load forlow temperature
●Cold water production line
Cold waterHigh-
temperaturetank
Cold water Low-
temperaturetank
Brine heatstorage
tank
Before upgrading the refigeraring machine
After upgrading the refigeraring machine
Refrigeraringmachine forcold water
Cold waterCold heat
loadBrine High-temperature
tank
Brine Low-temperature
tank
Wort
Steam
Heater
BoilerScrubber
Steamejector
Refrigeraringmachine for
brine
BrineCold heat
load
Env i ron m e n t a lS t ra teg y
Env i ron m e n t a lDa t a
Ac t i v i t y■Biological Resources ■Water Resources ■Containers and Packaging ■Global Warming ■Environmental management

64
Using a truck allocation system that has master data for the precise loading capacities of each truck, the Kirin Group is working to transport our products with the most efficient combinations of trucks and cargo.Further, Kirin Beverage compensated the capacity reduction for large carbonated drink containers (1.5L) by changing its shoulder shape and changed the body diameter of the PET bottles from 92.5 mm to 89.5 mm. This means that the number of cases loaded on one pallet has been increased from 40 (10 cases x 4 stacks) to 60 (15 cases x 4 stacks), improving the loading efficiency to 1.5 times. This is expected to cut the number of trucks used to ship large carbonated drink containers by about 20%* annually.
Distribution
The Kirin Group promotes rail freight with lower CO2 emissions. Kirin Beverage and Kirin Brewery became certified with the Eco Rail Mark for their extensive use of rail freight in 2006 and in 2010, respectively. Furthermore, Kirin Beverage has switched from truck transport to rail container freight for mid-to long-distance shipments (400 to 500 km or more) and has adopted a utility model of special cartons it has developed that are less likely to rub together during long-distance shipments. These are just some of the ways we are working to reduce CO2 emissions and maintain and improve quality during shipping.
The Kirin Group has positioned the logistics area as a non-competitive sector and is actively engaging in initiatives in this area.In 2017, together with other companies in the industry, we established a joint delivery center in Kanazawa City, Ishikawa Prefecture, and launched joint transport by rail container from plants in the Kansai area. Neither of the companies has manufacturing plants on the Japan Sea side, so products had to be transported by truck over long distances - of 200 km - from their plants on the Pacific Ocean side. This was inefficient and placed a great burden on the truck drivers. Joint transportation using rail containers has not only significantly
Promoting Modal Shift in Transportation of Goods
Joint delivery
Improving loading efficiency
40 cases of old containers on pallet (10 cases x 4 stacks)
60 cases of new containers on pallet (15 cases x 4 stacks)
Kirin’s plant
Kobe plant
Competitor’splant
Kansai
Areas covered by individual companies
Joint delivery from Pacific Ocean side to Japan Sea side
Joint delivery in Hokkaido
Shipments of whole truckloads from one company to one destination are delivered from individual bases
Areas covered through joint logistics by four companies
about45km
about10km
250km
Ishikawa
Toyama
4 companies’joint base
Mixed cargo delivery by 4 companies /
Single-company delivery
Mixed cargo delivery by 4 companies
Railwaytransport
Shipping byeach
companySuita Freight Terminal
Kanazawa Freight Terminal
Bases for each beer company
JR SapporoCargo Term
inal
JR KushiroCargo Term
inal
Delivery destination
Oldcontainer
Newcontainer
CO2CO2
CO2
CO2
CO2
reduced CO2 emissions but also shortened distances between the plants and the terminals and between the terminals and the destinations with a significant alleviation of driver’s burden, which is helping to solve the social issue of truck driver shortage. A similar initiative has also been launched by the four large brewing companies in Hokkaido.Joint delivery by truck over short distances in Tokyo has also been underway since 2011.
*Calculated from large carbonated drink container actual shipments in 2016.
▶P.18Related Information
Env i ron m e n t a lS t ra teg y
Env i ron m e n t a lDa t a
Ac t i v i t y■Biological Resources ■Water Resources ■Containers and Packaging ■Global Warming ■Environmental management

65
Sale
Heat pump-style vending machines pump up the waste heat generated when cooling products and use it for heating to warm up the products. This allows reduction in power consumption compared to conventional vending machines by cutting down the power used by the heaters.Kirin Beverage was the first in the industry to introduce heat pump-style vending machines in 2006, and from 2012, almost all newly installed vending machines for cans and PET bottles are of this type. As of April 2018, more than 80% of installed vending machines have been switched to this type.The latest heat pump-style vending machines are equipped with a compressor that uses an inverter to delicately control the operation (variable speed of rotation) according to the atmospheric temperature and the temperature of the products
SPRING VALLEY BREWERY TOKYO is an all-day dining establishment that opened in Log Road Daikanyama in April 2015, where patrons can enjoy craft beer made on premises. 100% of the restaurant’s electricity needs are met by green power using Green Power Certificates issued by the Yokohama City Wind Power Generation Project.
Kyowa Hakko Kirin is proceeding with switching commercial vehicles to hybrid cars. The company started serially switching from the conventional certified low emission vehicles in 2009, and by the end of FY 2017, introduction rate of hybrid cars of its company-owned vehicles reached 87.3%. By cutting back fuel used in sales activities in this way, the company is achieving reductions in CO2 emissions.
Vending machines 「SPRING VALLEY BREWERY TOKYO」
Switching commercial vehicles to hybrid cars
About heat pump LED lighting
Trend in power consumption
Conventional fluorescent lighting is being replaced with high energy-saving LED lighting to reduce power consumption and achieve energy conservation.
in the machine. Further, some types offer higher energy-saving performance, such as with heating functions not only by using the waste heat released by the cooling chamber as previous models did, but also by capturing the heat from outside the machine, and by improving hot and cold insulation performances with the heavy use of vacuum insulation materials. These vending machines have evolved to the point where power consumption can be reduced by about 40% compared to 2013. Installation of the new models began in 2015, and we are aiming for 70% of new machines installed in 2018 to be new models.
Ordinary vending machines Heat pump-style vending machines
Improve efficiencyby simultaneous operation
Coolingchamber
Heatingchamber
Cold Hot
heatexchanger
heatexchangerHeat
dissipation
Endotherm
Endotherm
Heat dissipation
Heatdissipation
Coolingchamber
Heatingchamber
Compressor
Using of waste heat inside and outside the machine
Automatic sw
itching
heating
cooling
cooling
outside the m
achine
Automatic sw
itching
heating
Cooling stop
Cooling stop
heatexchanger
heatexchanger
▶P.66
SPRING VALLEY BREWERY TOKYO, where patrons can enjoy craft beer
2007 2010 2013 2015
1,452
940
690
540
(kWh/year)1,500
1,000
500
0
Power consum
ption
Power consumption
2007-2015Comparison among 25-selection type
(Kirin survey)
Major reductions
Related Information
Env i ron m e n t a lS t ra teg y
Env i ron m e n t a lDa t a
Ac t i v i t y■Biological Resources ■Water Resources ■Containers and Packaging ■Global Warming ■Environmental management

66
Natural energy
Kirin Brewery has set a target of increasing the ratio of renewable energy in the power purchased at its plants by 50% in 2030 compared to 2015 and has started taking action to achieve that.Lion has also set a new target of reducing its carbon emissions by 10ktCO2e by 2026 by installing solar panels on its own premises. In this plan, solar panels with a generating capacity of 4MW will be erected by 2020, increasing to 10MW by 2026.
Since April 2017, Kirin Brewery’s Toride Plant and Kirin Beverage’s Shonan Plant started using CO2-free hydroelectric power in a portion of purchased power. The plants are taking advantage of Aqua Premium, the Japan-first option offered by TEPCO Energy Partner to supply only hydroelectric power. By using hydro-electric power, which does not emit CO2 at the time of power generation, they will contribute to global warming countermeasures. This is the first example of the use of this option by any factory in Japan, not just in the food and beverages industry. From April 2017 to the end of March 2018, CO2-free hydroelectric power accounted for approximately 75% of the Toride Plant’s purchased power and approximately 48% of the Shonan Plant’s.
The Kirin Group has started the introduction of the Green Heat Certificate at Kirin Brewery’s Kobe Plant, which is equivalent to the heat consumption of fossil fuel, and the Green Power Certificate at Chateau Mercian, which is equivalent to the entire electricity consumption.We have also been sponsoring the Yokohama City Wind Power Generation Project which Yokohama City promotes using the
Manufacturing plants, including those of Kirin Brewery and Kirin Beverage, have installed solar-power generation equipment in their factory tour facilities and other locations. As part of the Kanagawa Prefectural Governments’ Thin-Film Solar Cell Promotion and Expansion Project, Kirin Brewery Yokohama Plant installed a thin-film solar cell in 2016. The Kirin Brewery Yokohama Plant, Kyowa Hakko Bio, and Shinshu Beverage have leased parts of their premises and building roofs to companies that build large-scale solar power generation facilities, contributing both to effective use of company assets and to dissemination of natural energy.
Natural energy introduction targets
CO2-free hydroelectric power
Green Heat and Green Power Certificates
Solar power generation
Ratio of renewable energy in purchased power at plants2030
50%0%
2015
Kirin Beverage's Shonan PlantRatio of hydro-electric power:
Kirin Brewery's Toride PlantRatio of hydro-electric power:
Approx.48%
Approx.75%
Green Power Certification System, as a Y (Yokohama)-Green Partner since 2007, supporting the promotion of the use of natural energy. So far, the power generated by this project
has been used by Kokoniwa, the communication space at Group Head Office, Spring Valley Brewery Tokyo and the Earth Hour hosted by WWF.
Kokoniwa
Yokohama plant
Env i ron m e n t a lS t ra teg y
Env i ron m e n t a lDa t a
Ac t i v i t y■Biological Resources ■Water Resources ■Containers and Packaging ■Global Warming ■Environmental management

67
3,118
Greenhouse emissions by business(ktCO2e)
Scope3Scope2Scope1
Entire Kyowa Hakko Kirin Group (Global)
LionJapan Integrated Beverages Entire Kyowa Hakko Kirin Group (Global)
LionJapan IntegratedBeverages
Scope3Scope2Scope1
1,330 632Total
224
2,802 1,083
265
298
6974173
92
Total Total
0
1,000
2,000
3,000
4,000
5,000
6,000
20172016201520142013
(thousand tCO2e)
0
1,000
2,000
3,000
4,000
6,000
5,000
8,000
7,000
(TJ)
5249.6
393629
4,124
370596
4,131
391615
4,074
402614
4,192
406594
4,347
2488.0
6098.8
GHG data
Value chain greenhouse gas emissions Trend in value chain greenhouse gas emissions
Energy use by business (2017)
2013 2014 2015 2016 2017
Direct emissions from corporate activities (Scope 1 + Scope 2) 1,021,944 966,466 1,006,753 1,016,080 1,000,057
Scope 1 (Emissions from use of fuel) 392,805 370,334 391,415 402,279 406,181
Scope 2 (Emissions related to purchase of power and steam) 629,139 596,133 615,338 613,800 593,877
Indirect emissions (Scope 3) 4,123,886 4,131,352 4,074,399 4,192,490 4,347,311
Raw materials (Category 1) 2,662,087 2,675,544 2,603,960 2,675,475 2,613,072
Transport - Upstream (Category 4) 338,720 330,286 383,225 383,210 375,028
Transport - Downstream (Category 9) 854,586 851,203 800,177 832,989 995,389
Product use/disposal (Category 11, 12) 80,887 76,935 75,517 80,111 158,309
Other (Category 2, 3, 5, 6, 7, 8, 10, 13, 14, 15) 187,606 197,384 211,520 220,705 205,513
Emissions from entire value chain (Scope 1 + Scope 2 + Scope 3) 5,145,829 5,097,818 5,081,152 5,208,570 5,347,369
▶P.96〜P.97
(Unit:tCO2e)
Related Information
Env i ron m e n t a lS t ra teg y
Env i ron m e n t a lDa t a
Ac t i v i t y■Biological Resources ■Water Resources ■Containers and Packaging ■Global Warming ■Environmental management

68
GHG Graphs
Total direct emissions (Scope 1+2) and intensity (emissions/sales revenue)
Direct emissions (Scope 1+2) and intensity (emissions/production) of Japan Integrated Beverage Business
Direct emissions (Scope 1+2) and intensity (emissions/sales revenue) of entire Kyowa Hakko Kirin Group (global)
Direct emissions (Scope 1+2) and intensity (emissions/production) of Kirin Brewery
Biogas generation and power generation by Kirin Brewery’s
Direct emissions (Scope 1+2) and intensity (emissions/production) of Lion
(tCO2e/million yen)(thousand tCO2e)
0
200
400
600
800
1,000
1,200
20172016201520142013
0.4
0.3
0.2
0.1
0
0.5
0.6
0.45
1022 966 1007 1016 1000
0.44 0.46
0.55
0.49
0.54
intensity(Japan standard)direct emissions
intensity
direct emissions
intensity(IFRS)
(kgCO2e/kL)(thousand tCO2e)
20172016201520142013
98
332 325 327 329 317
100 97 95 93
intensitydirect emissions
intensity
direct emissions
050
100150200250300350
0
20
40
60
80
100
(tCO2/billion yen)(thousand tCO2)
050
100150200250300350400
20172016201520142013
105
357 341 364 367 367
102 100 107
105 104
intensity
direct emissions
(thousand tCO2e)
201720162015201420131990
609
204 207 202 198 1950
100200300400500600700800
(kgCO2e/kL)
53
19 20 18 18 17
intensitydirect emissions
intensity
direct emissions
0
20
10
30
40
50
60
0
50
100
150
200
250
300(kgCO2e/kL)(thousand tCO2e)
20172016201520142013
117
292 258 258 251 247
112
125 133 137
intensitydirect emissions
intensity
direct emissions
0
30
60
90
120
150
0
5
10
15
20
25(thousand Nm3)(million kWh)
20172016201520142013
20.7
9237 8588 8967 8593 7278
19.9 19.621.2
16.0
Biogas generationBiogas power generation
Biogas generation
Biogas power generation
0
2000
4000
6000
8000
10000
0
20
40
60
80
100
120
intensity(Japan standard)direct emissionsintensity(IFRS)
▶P.95~P.98Related Information
Env i ron m e n t a lS t ra teg y
Env i ron m e n t a lDa t a
Ac t i v i t y■Biological Resources ■Water Resources ■Containers and Packaging ■Global Warming ■Environmental management
69
Env i ron m e n t a lS t ra teg y
Env i ron m e n t a lDa t a
Ac t i v i t y■Biological Resources ■Water Resources ■Containers and Packaging ■Global Warming ■Environmental management

70
Bas ic po l i c yKirin Group, a supplier of food and health products, will contribute to building a society where people and nature live in harmony by reducing the carbon footprint of all its business operations, implementing environmental conservation activities, and bringing environmental value to its customers.
Ac t iv i t y po l i c y1. Implementing an environmental policy throughout the entire value chain and all aspects of business activities, and2. Assuring the quality of environmental activities through assessments and audits.Under the leadership of top management and through the participation of all employees, Kirin Group will incorporate environmental measures into business management and pursue challenging goals by recognizing them as one of the top management priorities.●Legal requirementsWe will comply with environmental laws, regulations, and agreements as well as voluntary control standards with high moral values.●Technological developmentWe will develop technologies that coexist with nature and are valuable for both the global environment and our customers●Environmental managementWe will develop an environmental management system and make continuous improvements in accordance with our business strategy●Human resources developmentWe will make continuous efforts to develop human resources who contribute to environmental conservation activities●Environmental performanceWe will promote resource/energy saving, reduce greenhouse gas emissions, prevent environmental pollution, and promote the 3 R's (Reduce, Reuse, Recycle).●CommunicationWe will conduct community-based environmental conservation activities while providing accurate environmental information to increase transparency and gain trust
Kirin Group's Environmental Policy
Environmental Management
Corporate Governance SystemP.71
Response to the New Frameworks for Disclosure of Climate Related InformationP.75
Scenario AnalysisP.76
StakeholderP.77
Resource CirculationP.81
Preventing PollutionP.82
Sustainable ProcurementP.83
Consideration of the Environment in Product Development
Environmental Education
P.86
P.87

71
Corporate Governance System
In line with the Group’s corporate philosophy and the “One Kirin” values that are shared across the Kirin Group, the Group believes that achieving the 2021 Vision outlined in its long-term management vision New KV2021 will lead to the Group’s sustainable growth and to greater corporate value over the medium to long term. Accordingly, the Group will develop a corporate governance system that can e ectively and e ciently reach that goal.The Kirin Group believes that cooperation with its stakeholders will be indispensable to putting its corporate philosophy into practice and turn the 2021 Vision into reality, andtherefore the Group respects its stakeholders’ respective viewpoints. We will promptly disclose information to shareholders and investors based on transparency, fairness and continuity, actively engage in construc-tive dialogue, and fulfill accountability in good faith.
Basic view on corporate governance
Group companies
Kirin Holdings
Departments
Executive officers
Group Executive Committee
Group CSV CommitteeGroup Risk and Compliance
CommitteeGroup Information Disclosure
Committee
President
Board of Directors
Insidee directors 5 Outside directors 4
Chairman
Regional headquarters Operating companies
Auditing
Auditing
Auditing
Auditing
Internal auditing
Internal auditing
Audit & Supervisory Board
Insideedirectors
2
Outsidedirectors
3
Nomination and Remuneration AdvisoryCommittee
Insideedirectors
2
Outsidedirectors
3
Chairman
General Meeting of Shareholders
Groupinternalaudit
Independentaccountingauditor
Env i ron m e n t a lS t ra teg y
Env i ron m e n t a lDa t a
Ac t i v i t y■Biological Resources ■Water Resources ■Containers and Packaging ■Global Warming ■Environmental management

72
Risk Management SystemThe Kirin Group defines risk as any uncertainties that would have a major impact on the achievement of management goals and the continuity of the company. A risk management system has been established to recognize risks accurately in light of new strategies and key changes in the external environment and to respond to them appropriately. The risk management process involves the extraction of highly material risks from two perspectives: the risk that business plans will not be achieved and risks that could develop into a crisis.In the process of developing the annual plans, each Group company selects its material risks according to its strategies and business environment analysis, based on the above perspectives, and prepares a risk statement and risk response plan. The management of environmental risk is also addressed within this risk management system.Kirin Holdings oversees risk management for the Group as a whole. As well as checking the individual companies’ material risks, it considers the impact on the Group in the event that a risk materializes and sets up the material risks for the Kirin Group.
Group CSV CommitteeThe Kirin Group convenes its Group CSV Committee once a year as a general rule to encourage the proactive, self-driven pursuit of CSV management by the individual Group companies. The Committee is chaired by the President of
Promotion and Management System
Major identified risks
System to promote CSV
■Risks related to business environment1 Laws, regulations, and tax systems2 Fluctuations in foreign currency exchange rates and interest rates3 Increases in raw material/energy prices, and logistics costs4 Weather, climate change, natural disasters, and infectious diseases5 Financing6 Changes in the value of asset holdings7 Changes in the trends of economic and market environments and
pop-ulation movements8 Overseas operations
■Risks related to business operations1 Business and capitalalliances2 Human resources3 Product safety4 Information leakage and information systems5 Occurrence of litigation and fines
* Each risk item is reviewed every year.
Kirin Holdings, with the presidents of the major operating companies making up its membership. Together, they monitor the state of implementation of the CSV commitment. Where necessary, the matters decided in the Group CSV Committee are reported to and/or placed on the agenda of Kirin Holdings’ Group Executive Committee and the Board of Directors and reflected in the strategies of the entire Group. The Committee Chairman also directs the various divisions of Kirin Holdings and the individual Group companies on ways to improve their pursuit of CSV as a means of raising the degree of implementation of the policies and strategies decided in the Committee.
Kirin Holdings
Operat ing compan ies
Board of Directors
Group Executive Committee
Incorporation into the strategies of operating companies
Incorporation into the Group’ s overall strategy
Chair President & CEO, Kirin Holdings (KH)ExecutiveDirector Director of CSV Strategy, KH GroupSecretariat CSV Management Section, Corporate Strategy, KH GroupMembers Presidents of principal companies, KH vice president, and executive officers of KH Group
Group CSV Committee
Monitoring
Impa
ct o
n so
cial
sus
tain
abili
ty
Impact on the Kirin Group’s business
Respon- sibility as a
pharmaceutical manufacturer
Sustainablesourcing Human rights
Humanresources
and corporateculture
Corporategovernance
New valuecreation
TheEnvironment
Health and well-being
Communitydevelopment
A Responsibilealcoholic producter
Safety and security of our
products
The “environment” has been set as one of the Kirin Group’s “key CSV issues” to be addressed as a priority. For details ▶P.13
The individual companies implement a risk management cycle, which includes quarterly monitoring of the status of risk response plans and, where necessary, a review of their selected risks. The Group Risk and Compliance Committee also receives regular reports from the individual companies on their risk status and provides directions and support as necessary to strengthen and promote the Group’s risk management.
Env i ron m e n t a lS t ra teg y
Env i ron m e n t a lDa t a
Ac t i v i t y■Biological Resources ■Water Resources ■Containers and Packaging ■Global Warming ■Environmental management

73
The Kirin Group’s environmental management is conducted as part of the CSV management system.The Group CSV Committee discusses CSV policies and strategies, which are based on an understanding of the risks and opportunities for the Group as a whole over the medium to long term, and manages their progress.The Kirin Group Long-Term Environmental Vision was approved by the Kirin Holdings’ Board of Directors in 2012 and announced publicly in 2013. Subsequently, in 2016, the “environment” was selected as one of the priority social issues for engagement in CSV as a core element of the Group’s corporate management. The CSV Commitment was also established to convey what that the Group aims to achieve over the medium to long term in terms of social issues. In the establishment of the CSV Commitment, the Group CSV Committee held discussions in June 2016 to decide on the priority issues to be addressed, with reference to the SDGs. These priority issues were discussed again with the operating companies, relevant divisions, and other parties, before the Commitment was finalized.
The environmental management system requirements for Kirin Group operating companies are embodied in the Principle for Kirin Group Global Environmental Management (KGEMP).The KGEMP requires the appointment of a general environmental manager, who has responsibility and authority for environmental matters in each business. In addition to monitoring to ensure that the company and its constituent companies are conducting their environmental activities appropriately, the general environmental manager conducts management reviews, identifies issues for improvement, and gives the necessary directions to the relevant departments. In the event of an environmental crisis, the general environmental manager will have full authority to resolve the crisis. The KGEMP stipulates that each company comply with laws and regulations and other rules relevant to the business’s environmental activities, and strive to reduce its environmental load as well as prevent pollution under its own environmental management system. Each company will also conduct internal environmental audits to ascertain the appropriateness and legal compliance of their systems and confirm how well targets are being met. The results of these audits will then lead into management reviews.Under the KGEMP, each operating company has developed and operates its own environmental management system that best suits the nature of its business, the region it operates in, and other characteristics, based on the international standard, ISO 14001 (see P. 102).To realize their environmental policies, the Kirin Group Long-
System for the Promotion of Environmental Management
Environmental Management SystemEnvironmental Management Structure
The management of environment-related processes is integrated with company management processes in a manner suited to the companies’ respective regions.In Japan, environmental performance evaluation is incorporated into the implementation of the Kirin Group’s own balance score card, known as KISMAP. KISMAP goals are incorporated into the goal-setting for each organization and individual, and the degree to which those goals are reached is reflected in the evaluated performances of the organizations and individuals.In other regions’ operating companies as well, environmental performance evaluation is reflected in the performance evaluations of each organization and individual in a manner suited to their respective regions.Each
Group company
Kirin Holdings Co., Ltd.
Comm
on rules of the Kirin G
roupIndividual rules of each G
roup company
Essence of environmentalmanagement valued as a groupAdaptable to diverse businesscharacteristics of Group companies and their needs Each
KGEMP
Kirin Group’s Environmental Policy
Kirin Group’s Long-Term Environmental Vision
Environmental managementrules set forth individually by each Group company
Principle for Kirin Group's Global Environmental Management (KGEMP)
President of each company
General environmental manager of each company
Sales divisionsProductiondivisions
Marketingdivisions
The executive officer with responsibility for CSV strategy (as of April 2018, this was Director of the Board, Senior Executive Officer of Kirin Company Limited and Senior Executive Officer of Kirin Holdings Company, Limited) fulfills the role of Group’s general environmental manager for environmental issues overall, including climate change.
Term Environmental Vision, the CSV Commitment and other goals, each company gathers the opinions of stakeholders in an appropriate manner, identifies and evaluates the risks and opportunities surrounding the business’s environmental activities, and puts the required responses into place from medium and long-term perspectives.
Env i ron m e n t a lS t ra teg y
Env i ron m e n t a lDa t a
Ac t i v i t y■Biological Resources ■Water Resources ■Containers and Packaging ■Global Warming ■Environmental management

74
Each business location is thorough in its management of legal requirements through a ledger, and also works exhaustively to prevent environmental pollution by establishing voluntary management targets that are more stringent than those required by the legislation. A system for the reporting of environmental accidents has also been established within the Group, in which hiyari-hatto (near-miss) examples are shared within the group and counter-measures extended to other sites. Internal environmental audits are used to confirm the status of legal compliance.In 2017, there were no major infringements of laws and regulations or accidents that had a major impact on the environment.
Each of the operating companies in the Kirin Group complies with ISO 14001 and other environmental management system standards. Internal auditing is conducted in each business location and constituent company, and the environmental management divisions in the head offices of each Group company conduct auditing of business locations and constituent companies. These audits lead to improvements in the individual companies’ environmental management systems. Furthermore, on an entire Group basis, Kirin Company Ltd.’s CSV Strategy Department is contracted by Kirin Holdings to conduct environmental audits according to criteria established by the Group. These audits lead to improvements in each company’s environmental management system and are fed into to management reviews.In Japan, to guarantee further transparency and independence, an outside consultant has been contracted to perform a strict environmental legal audit, beginning in 2009. By 2014, the consultant had traveled around to all manufacturing sites in the Group companies. It has since embarked on a second round of audits, beginning in 2015, with several sites being audited each year. The issues identified in these audits to date have all been minor.
Status of compliance with environmental laws and regulations
Environmental audits
Env i ron m e n t a lS t ra teg y
Env i ron m e n t a lDa t a
Ac t i v i t y■Biological Resources ■Water Resources ■Containers and Packaging ■Global Warming ■Environmental management

75
The Kirin Group conducted a trial scenario analysis between January and May, 2018, and took other measures in accordance with the final Recommendations of the Financial Stability Board’s (FSB) Task Force on Climate-related Financial Disclosures (TCFD), which were released in 2017. Many of the items recommended by TCFD have been disclosed in our environmental reports, on our website, and in the responses to CDP questionnaires. See the summary table at right. However, we also recognize that certain issues still need to be addressed to fulfil the societal needs and expectations regarding our climate-related disclosures. We are still very much in the initial stages, but this will become the first step toward disclosure within the new framework.
Category Details Relevant pages
Governance
The Kirin Group is reliant on natural capital in the pursuit of its business. That natural capital is being affected greatly by climate change resulting from global warming. (Refer to the relevant pages of this report for specific impacts.)Perceiving such circumstances as major risks and opportunities, in 2012, the Kirin Holdings’ Board of Directors approved the Kirin Group Long-Term Environmental Vision. At the same time, it declared the lofty goal of halving the CO2 emissions of its business by 2050 from a 1990 base year, across its entire value chain.From 2017 onward, as part of the CSV Commitment, the Group CSV Committee has set a number of targets, including CO2 emission reduction targets for 2030, and is monitoring progress and establishing new policies. The Group CSV Committee was established for the Kirin Group to actively promote CSV. It brings together the presidents of the Group’s main companies and the executives responsible for finance, IR, SCM, marketing, and other divisions to formulate CSV policies and monitor the progress. Along with the CSV Commitment, the major policies decided in the Committee are discussed and approved by the Group Executive Committee or the Board of Directors.
Mainly P71~P73Other relevant topics on P10~P17
Strategy
The likely risks of climate change along with global warming include disruption of operations due to water shortages, impact on crops in production regions due to rising temperatures and natural disasters, and increased investment on energy conservation. Meanwhile, initiatives to tackle climate change, such as joint delivery, are leading to collaboration in non-competitive areas in the same and other industries. Such initiatives could provide opportunities to solve other problems for the societies and companies besides climate change.Through the appropriate identification of and response to these kinds of risks and opportunities, the Kirin Group is pursuing initiatives that will solve issues related to climate change.Climate change risks and opportunities are subject to the risk management system, and the material items and corresponding policies are reported to the Group CSV Committee, which approves the policies for dealing with them. These items are integrated in the business plans of the individual operating companies and addressed accordingly.(Refer to the relevant pages of this report for specific impacts. See the following page for details of the scenario analysis.)
Mainly P12~P17、P23、P33、P45、P59
Risk Management
The effects of climate change have already manifested, and we recognize that the physical risks and transitional risks have become greater. In particular, the impact of natural disasters on agricultural production regions can no longer be ignored and water issues are also very serious.The Kirin Group evaluated the risks surrounding biological resources in around 2013. In 2017, we repeated a 2014 evaluation of water risks in the catchments of our business locations and upstream in the value chain. Decisions on policies and the contents of initiatives are based on the tangible outcomes of investigations. Key risks are monitored by the Group CSV Committee and policies are formulated and revised where necessary. Other risks are identified and handled within the risk management system and the environmental management systems of the individual operating companies and business locations.
Mainly P14~P15、P23、P33、P40~P41、P45、P59~P60
Quantitative Targets
The Kirin Group monitors Scope 1, 2, and 3 emissions across the entire Group and uses the outcome of that monitoring in the formulation of its next strategies. For details of greenhouse gas emission reduction targets and actual values of emissions, see the Global Warming section of this report. Currently, initiatives are generally progressing as planned.
Mainly P16~P17、P21、P24、P34、P42、P46、P56、P59~P60、P67~P68、P89~P101
Response to the New Frameworks for Disclosure of Climate Related Information
Env i ron m e n t a lS t ra teg y
Env i ron m e n t a lDa t a
Ac t i v i t y■Biological Resources ■Water Resources ■Containers and Packaging ■Global Warming ■Environmental management

76
Scenario Analysis
The Kirin Group conducted a trial scenario analysis between January and May, 2018 in accordance with the final TCFD Recommendations that were released in 2017.For the analysis, we used the IPCC’s Representation Concentration Pathways (RCP) as the base scenario for physical risks, supplementing it with the Shared Socioeconomic Pathways (SSP).The scenario analysis resulted in a renewed understanding of the potential for global warming to have a major impact on the agricultural products that are important raw materials for the Kirin Group.The Kirin Group is taking action to expand sustainable farm certifications and forest certifications, to raise the sustainability of key raw materials such as tea leaves and paper. We are also addressing water resources in various ways, including proactive water-saving in regions of high water risks and the preservation of water resources in agricultural production regions. These activities will contribute to the Group’s resilience against the risks that accompany climate change. We are also pursuing initiatives for the low carbonization of entire society, including the expansion of renewable energies, with our mid-term greenhouse-gas reduction plans which were approved by SBT.While it could be said that the scenario analysis has allowed us to reaffirm that the Kirin Group’s approaches are on the right track, the results of the analysis have also hinted at even greater impacts. Global warming is one of the most important of all social issues, and we envisage that it will have a major impact on our business model from the perspective of CSV that will contribute to society and business.Risks pertaining to agricultural products and water have already been listed as key long-term risks in the risk management process and are subject to reporting to management. For even more pressing risks, we will consider reflecting them in the mid-term and annual plans of the individual Group companies and divisions. We will factor the information obtained through the scenario analysis in the
pursuit of our responses.The identification of financial impacts is still in its very initial stages and we will continue to work on it. We will also
consider transition scenarios that have not yet been given sufficient analysis, with the intention of reflecting them in our business plans.
Radiativeforcing
(W/m2)
8.5 RCP8.5
RCP6.0
Population: LowIncome: HighEnergy technology: HighRegulation: StrongGlobal economy
Population: MediumIncome: MediumEnergy technology: MediumRegulation: MediumPartial global economy
Population: HighIncome: LowEnergy technology: LowRegulation: WeakAnti-globalism
Barley:10% or more decline in winter barley yields and 20% or more decline in spring barley yieldsMaize:20% or more decline in yieldsRice: Quality deterioration throughout all of JapanTea: 40% or more decline in yieldsHops/wine grapes: Major decline in yields, movement of areas suitable for cultivation, devastating in some areasRaw milk: Major decline in yields and major increase in costs due to heat stress
Barley: 10% decline in winter barley yields and 20% decline in spring barley yieldsMaize: 20% decline in yieldsRice: Quality deterioration throughout all of JapanTea: Decline in yields at altitudes of 600 m or lowerHops/Wine grapes: Decline in yields, movement of areas suitable for cultivation, devastating in some areasRaw milk: Decline in yields and increase in costs due to heat stress
Barley: Less than 5% decline in winter barley yields and 10% decline in spring barley yieldsMaize: 20% decline in yieldsRice: Quality deterioration throughout all of JapanTea/Hops/Wine grapes: Regional impact
RCP4.5
7
6
4.5
3.7
2.6
4.3℃(3.2~5.4℃)
2.8℃(2.0~3.7℃)
2.4℃(1.7~3.2℃)
1.6℃(0.9~2.3℃)
RCP2.6=2℃Scenario
Range of risein annual average
temperature
RCP scenario
Socio-economic scenario
SSP1Sustainable
development
Outline of SSP
SSP2
Moderate
SSP3
Unwanted world
Impact of climate change on Kirin Group’ s major agricultural products
Group Scenario 3
Group Scenario 2
Group Scenario 1●Mitigation/adaptation and curtailing of physical risks through international cooperation●Spread of renewable energy●Strengthening of greenhouse gas emission restrictions in agriculture sector●Orientation toward human rights, health, and sustainability●Reduction of food loss
●Stratified society●Moderate market expansion●Regional impact on agriculture by product Large●Regional water risk Large●rocurement cost of agricultural products grown in cool climates Increase
●Import costs Large●Low-cost products/ healthcare needs Large●Agricultural impact Large●Water risk Large●Beverage consumption in summer Increase
Env i ron m e n t a lS t ra teg y
Env i ron m e n t a lDa t a
Ac t i v i t y■Biological Resources ■Water Resources ■Containers and Packaging ■Global Warming ■Environmental management

77
Stakeholder
To grow sustainably together with society, the Kirin Group has positioned Creating Shared Value (CSV) as the core of its company management in its long-term business plan, New Kirin Group Vision 2021.CSV management means achieving both solutions to social issues and the provision of value to customers. It realizes the creation of economic value and social value, with the aim of sustainable growth together with society. To achieve this, it is important that we establish and implement mechanisms for identifying and understanding the challenges, expectations, and demands of our diverse stakeholders and for two-way communication about whether or not Kirin’s business characteristics and strengths can be leveraged to meet those challenges, expectations, and demands.To this end, the Kirin Group has a range of opportunities for dialogue with the stakeholders involved in its business. In addition to dialogue, we also work together with many of our stakeholders and cooperate in voluntary activities that lead to policy recommendations.
Stakeholder Engagement
Customers
Investors
Policymakers
Economicorganizations
Consortiums
ResearchinstitutionsExperts
NGO
Agriculturalproduction
regions
Businesslocationregions
Employees
Env i ron m e n t a lS t ra teg y
Env i ron m e n t a lDa t a
Ac t i v i t y■Biological Resources ■Water Resources ■Containers and Packaging ■Global Warming ■Environmental management

78
In our support for Sri Lankan tea farms to obtain Rainforest Alliance certification, which began in 2013, Kirin staff travel to Sri Lanka once a year to exchange views with the plantation managers and local residents, to identify and address local issues.During our 2016 visit, upon learning that small farms in the area wanted to obtain certification, we considered the matter and determined that increasing the sustainability of the small farm’s tea leaves, which are transported to the larger farms, would also benefit Kirin. We therefore decided to start providing assistance to small farms to obtain certification from 2018. The decision to commence activities for the protection of water sources on the farms was also made upon identifying local issues.During our 2018 visit, we exchanged views with these small farm owners and with managers of farms where water sources are located, and we were able to confirm that they are highly appreciative of Kirin’s support.Given that, in many cases, the tea farms do not have sufficient understanding of how the tea leaves they produce are being used in products, we recognize that this kind of dialogue is a valuable opportunity to understand the company’s needs and share issues.We will use the outcomes of this dialogue as reference in our future pursuits.
Kirin’s support of Sri Lankan tea farms to obtain Rainforest Alliance certification was featured in case studies by Ministry of Environment on climate change, presented as “Sustainable Tea Production in Sri Lanka Driven by the Private Sector’s Initiatives.”Based on these case studies, the Ministry of Environment held a Workshop on the Improvement of Climate Change Impact Assessment and Adaptability Planning in the Asia-Pacific Region in Manila of Philippines from January 31 to February 1, 2018. A representative of ASLM, a local non-government organization that is in charge of training for obtaining the Rainforest Alliance certification in Sri Lanka, took part in the workshop. The workshop was conducted with the aim of encouraging the implementation of NAP (National Adaptation Plans) process and adaptation behaviors in the region, on the theme of promoting collaboration among countries, regions, and sectors. It involved sharing the experiences and lessons learned from the NAP process and case studies concerning the implementation of those adaptation plans and discussing those experiences and lessons to deepen mutual understanding.ASLM provided information about the certification initiatives in Sri Lanka and about weed management programs. The vast majority of the programs presented as examples were led by national or regional governments. The case studies presented by ASLM were the only project led by the private sector. They were well received as excellent examples of how it is possible for the private sector to pursue action on climate change adaptation effectively without involvement of the country.
Dialogue with Sri Lankan tea farms Case Study and Workshop by Ministry of Environment
NARO Activities PresentationThe National Agriculture and Food Research Organization (NARO), with which Kirin is conducting joint research in the process of converting idle and devastated farming land into vineyards, held a joint research presentation on February 15, 2018. In addition to sharing the knowledge obtained through this research, we discussed how to proceed into the future.
Japan Environmental Youth Network High School Students SDGs Seminar At October 2017, hosted by the Japan Environmental Youth Network Secretariat, which is supported by Kirin, a training was held on “sustainable society.” It was attended by senior high school students and universities from six prefectures in the Kinki region. The seminar included a lecture on Kirin’s initiatives to raise sustainability in its production regions.
Discussions with FSC officials responsible for AsiaIn 2017, we took the opportunity of a visit to Japan by FSC officials responsible for Japan and Asia to exchange opinions about raising awareness of FSC.We also hold briefings for investors on ESG themes.Scene from the Workshop on the Improvement of Climate Change
Impact Assessment and Adaptability Planning in the Asia-Pacific Region
Dialogue with tea farm managers
Dialogue with small farm owners Photograph provided by the Ministry of Environment
Env i ron m e n t a lS t ra teg y
Env i ron m e n t a lDa t a
Ac t i v i t y■Biological Resources ■Water Resources ■Containers and Packaging ■Global Warming ■Environmental management

79
Organization Activities
Japan Sustainability Local Group (JSLG)
Kirin Holdings participates as a steering committee member and director of the JSLG.
WE MEAN BUSINESS
In the WE MEAN BUSINESS coalition, the Kirin Group has committed to “setting reduction targets by SBT,” “report on climate change responses in mainstream reports by CDSB” and “improvement of water security.”
Science Based Targets(SBT)
The Kirin Group’s emission reduction targets for 2030 were the first in Japan’s food and beverages industry to be approved by SBT.
Fun to Share/COOL CHOICE
Since 2014, Kirin has endorsed the Japanese government’s new climate change campaigns, Fun to Share and COOL CHOICE, and has registered with these campaigns.
United Nations Global Compact
The Kirin Group joined the United Nations Global Compact in September 2005.
Voluntary Action Plan of Japan Business Federation (Nippon Keidanren)
In consideration of the conservation of the global environment, the Brewers Association of Japan, of which Kirin Brewery is a member, and the Japan Soft Drink Association, of which Kirin Beverage is a member, participate in initiatives for the reduction of environmental load conducted by Nippon Keidanren (Japan Business Federation) and are tackling CO2 reductions and the recycling of waste.
Eco-First
Eco-First is a program in which companies make a pledge to the Minister of the Environment to conduct their own environmental conservation initiatives, such as counter-measures to global warming. Kirin became the first manufacturer to be Eco-First accredited. It also serves as the Deputy Chair of the Eco-First Promotion Council.
Japan Business and Biodiversity Project
Kirin Holdings has joined the Japan Business and Biodiversity Partnership, which was established by Nippon Keidanren (Japan Business Federation), Japan Chamber of Commerce and Industry, and Keizai Doyukai (Japan Association of Corporate Executives) in 2010.
Organization Activities
Green Purchasing Network (GPN) The Kirin Group is a member of the Green Purchasing Network (GPN).
Containers and Packaging Diet Declaration by nine prefectures and cities
Kirin Brewery, Kirin Beverage, and Mercian endorse the Containers and Packaging Diet Declaration being promoted by the four prefectures of Saitama, Chiba, Tokyo, and Kanagawa, and the five cities of Yokohama, Kawasaki, Chiba, Saitama, and Sagamihara, and are striving to reduce their containers and packaging.
Forest Supporters
Forest Supporters Kirin participates in the activities of Forest Supporters, a civic movement that promotes the creation of beautiful forests. The National Land Afforestation Promotion Organization serves as secretariat for this movement.
Water ProjectKirin has been involved in the Water Project, a public-private sector collaborative awareness-raising project established to promote the maintenance and restoration of healthy water cycles, since 2014.
Rainforest Alliance Consortium
Kirin is a founding member of and active participant in the Rainforest Alliance Consortium, which was established in September 2015 by the Rainforest Alliance and companies that handle Rainforest Alliance certification products with the aim of promoting sustainable agriculture.
Consortium for Sustainable Paper Use (CSPU)
The Consortium for Sustainable Paper Use was established by five (now nine) companies engaged in leading-edge paper use initiatives and WWF Japan. As a founding member of the CSPU, the Kirin Group pursues initiatives for the pursuit of sustainable paper use.
Voluntary participation leading to policy recommendations
Env i ron m e n t a lS t ra teg y
Env i ron m e n t a lDa t a
Ac t i v i t y■Biological Resources ■Water Resources ■Containers and Packaging ■Global Warming ■Environmental management

80
Label Name Nature of Disclosure
Eco-Rail
In 2006, Kirin Beverage, and in 2010, Kirin Brewery were certified to display the “Eco-Rail” mark on their products by the Ministry of Land, Infrastructure, and Transport for proactively tackling global environmental issues with the use of rail freight transport.
Carbon Footprint
Kirin Brewery launched Carbon Footprint initiatives together with the beer industry in 2008. The Product Category Rule (PCR), which is the rule for the calculation of beer categories, was approved in February 2011 and revised in December 2013.
Rainforest Alliance Certification Label
The paper drink boxes used for Kirin Gogo-no-Kocha Straight Tea (500 ml) (from the renewed product launched in March 2015) display a Rainforest Alliance certification label.
FSC Certification Label
Kirin aims to switch to FSC-certified paper for all of its paper packaging and containers by 2020. To encourage understanding among consumers about the importance of protecting the forests, we place FSC-certified labels on all containers and packaging where it is possible.
ECOCERT
Mercian has been selling Bon Rouge Organic Wine Pet Bottle Red, a wine made with 100% organic fruits, since 2009. This wine is certified by ECOCERT JAPAN, the Japanese subsidiary of the global organic certification body, ECOCERT.
Name of program Nature of Activity
Plant Environmental Tours
A total of 647 people participated in 39 guided environmental tours of our manufacturing facilities in 2017. These included the Yokohama Plant’s “Feel the Blessings of Nature Tour” and the Kobe Plant’s “Environmental Tour.”
Kirin School Challenge
Since December 2014, Kirin has been holding Kirin School Challenge workshops with the aims of exchanging opinions with young people, discussing and coming up with ideas about what we should do to “lead the rich blessings of globe to the future.” Another aim of the workshops is for junior and senior high school students to convey those ideas to their own generation. These workshops are held eight to ten times a year.URL:http://www.kirin.co.jp/csv/eco/schoolchallenge/
Disclosure of environmental information through products (environmental labeling) Education Programs
▶P.30Related Information
Env i ron m e n t a lS t ra teg y
Env i ron m e n t a lDa t a
Ac t i v i t y■Biological Resources ■Water Resources ■Containers and Packaging ■Global Warming ■Environmental management

81
Resource Circulation
Recycling
Appropriate management of waste
Reducing losses from disposing of food products
100
80
60
40
20
0
99.799.8 99.8 99.899.8400
300
200
100
0
Amount of w
aste
Recycling rate
Recycling rate Waste treated on siteRecycled waste Disposed waste
204
0.5
21
226226
224
0.4 0.4
20
244244
219
0.6
24
243243
20172013 2014
(%)(kt)
213 219
0.5
14 17
228228 237237
2015 2016
Trends in recycling rates of byproducts and waste from Japan business
Recycling rate 100% (Kirin Brewery, Kirin Beverage, Kirin Distillery) The Japanese alcoholic and non-alcoholic beverages businesses have set a recycling rate target of 100% for their plants and have continued to achieve that target.Four plants, including the Kirin Brewery Yokohama Plant, first achieved a recycling rate of 100% in 1994, and in 1998, all plants achieved 100%, the first time in the beer industry.
Recycling spent grains from Beer Mashing as Livestock Feed (Kirin Brewery, Lion, Myanmar Brewery)Production processes for beer and happo-shu (low-malt beer) generate spent grains after extracting flavor during the mashing process. Because such spent grains contain residues of nutritious substances, they are efficiently used as livestock feed for cattle or for growing mushrooms. When used as feed
for cattle, these spent grains help improve the quality of beef.The spent grain from brewing processes goes to farmers as animal feed.
Research into use of BSG (Kirin)Prevention of disease in dairy cattle and other livestock and reducing the use of antibiotics are major challenges for the dairy industry. The Central Laboratories for Key Technologies have discovered that lignin glycoside, which is contained in brewer’s spent grain (BSG), that is the barley husks that remain after the barley milling process, and BSG itself, which is used to feed livestock, are effective in increasing immunoreactivity in cattle. The Laboratories are pursuing further research into these findings.
Re-use of wine grape lees (Mercian)The grape lees from wine-making are turned over in a compost heap on the company vineyard for a year to make compost, which is used as organic fertilizer.
Recovery of phosphoric acid (Kyowa Hakko Bio)Kyowa Hakko Bio Yamaguchi Production Center (Hofu) has installed a facility to recover phosphoric acid from fermentation wastewater. Previously, the recovered cake, which consists largely of calcium phosphate had been disposed as industrial waste, but in 2008, the Production Center started drying some of the cake and selling it as fertilizer material.
The Kirin Group is working toward its declared goal of the implementation and firm establishment of thorough appropriate management of waste. To this end, it has developed the Kirin
Kirin Holdings participates in Japan TCGF, which was launched by companies in the consumer goods industry in August 2011, and pursues activities to resolve common issues in areas where they do not compete. For example, the Sustainability Project Committee identifies and aims to resolve environmental issues in the value chain of manufacturing, distribution, and sales processes (e.g., stop global warming, reduce wastes, etc.) Specifically, the Committee is working to change to labeling the year and month as the best before date for soft drinks. By so doing, we expect to see significant effects on cutting losses from disposing of products. Also, we can cut environmental loads on the supply chain (CO2 emissions from transporting between distribution centers and transport-related activities, etc.) and reduce inefficiencies (e.g., storage space in distribution warehouses and loading and unloading tasks at stores) as well, by changing how to manage product delivery, storage, and display in stores based on the new best-before labelling.We also continue to exchange information on retail sales and demand fluctuation factors with plants and distribution centers to improve demand projections and reduce disposal losses. In addition, we will move forward with efforts to reduce disposal losses by strictly managing sales volume targets. Implementing these steps, we will prevent valuable biological resources and containers and packaging from going to waste.
Effective use of spent grains to livestock feed
Re-use of wine grape lees
Group Waste Management Guidelines and is pursuing the appropriate treatment of waste within common Group systems.Specific measures include the standardization of contract templates and contractor audit programs which define its frequency and contents, and the preparation of a list of staff in charge of waste management so that all the staff involved in such work can be educated using standardized textbooks.Further, the information on all waste disposal contractors for the Group is managed collectively, so if in the unlikely event that a problem arises, the details about the contractor, its permits, the waste it is being contracted to handle, and other details can be searched and confirmed immediately. The operations are being standardized in this way so that anyone who is newly assigned to waste-related work will be able to perform it with certainty.
Recycling rate of waste at the plants of Kirin Brewery and Kirin beverage 100%
▶P.99Related Information
Env i ron m e n t a lS t ra teg y
Env i ron m e n t a lDa t a
Ac t i v i t y■Biological Resources ■Water Resources ■Containers and Packaging ■Global Warming ■Environmental management
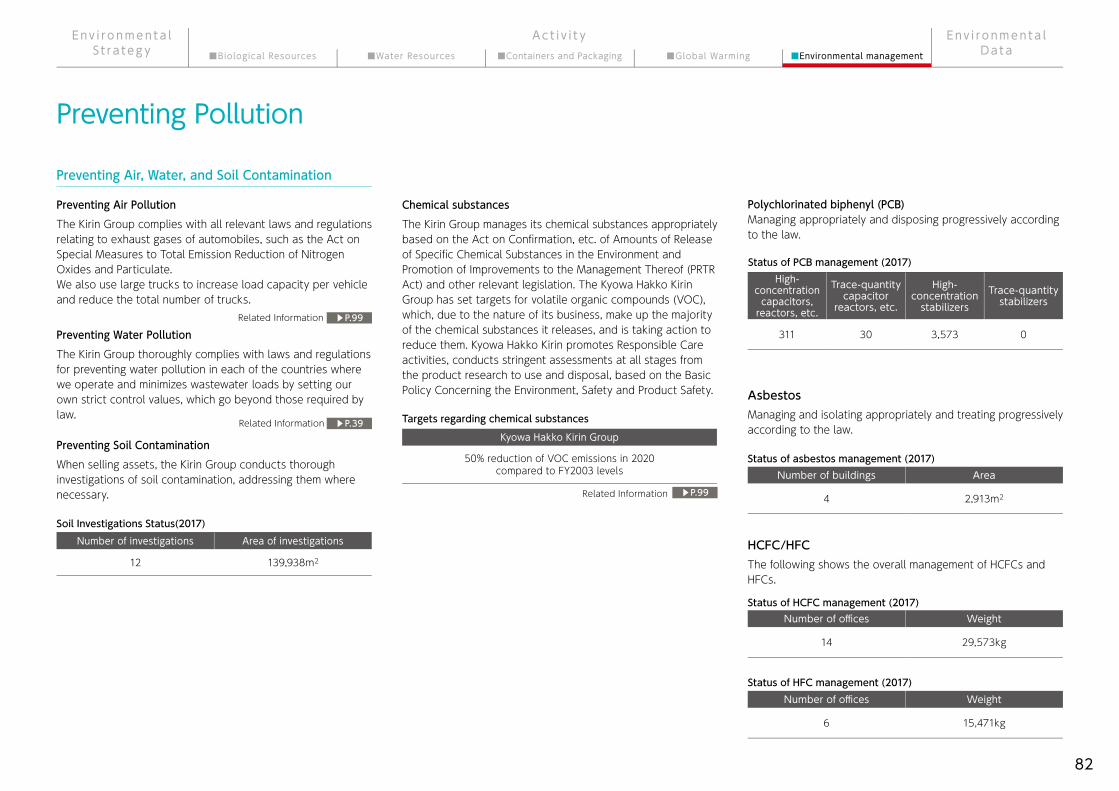
82
Preventing Pollution
Preventing Air, Water, and Soil Contamination
Preventing Air PollutionThe Kirin Group complies with all relevant laws and regulations relating to exhaust gases of automobiles, such as the Act on Special Measures to Total Emission Reduction of Nitrogen Oxides and Particulate.We also use large trucks to increase load capacity per vehicle and reduce the total number of trucks.
Preventing Water PollutionThe Kirin Group thoroughly complies with laws and regulations for preventing water pollution in each of the countries where we operate and minimizes wastewater loads by setting our own strict control values, which go beyond those required by law.
Preventing Soil ContaminationWhen selling assets, the Kirin Group conducts thorough investigations of soil contamination, addressing them where necessary.
Chemical substancesThe Kirin Group manages its chemical substances appropriately based on the Act on Confirmation, etc. of Amounts of Release of Specific Chemical Substances in the Environment and Promotion of Improvements to the Management Thereof (PRTR Act) and other relevant legislation. The Kyowa Hakko Kirin Group has set targets for volatile organic compounds (VOC), which, due to the nature of its business, make up the majority of the chemical substances it releases, and is taking action to reduce them. Kyowa Hakko Kirin promotes Responsible Care activities, conducts stringent assessments at all stages from the product research to use and disposal, based on the Basic Policy Concerning the Environment, Safety and Product Safety.
Polychlorinated biphenyl (PCB)Managing appropriately and disposing progressively according to the law.
AsbestosManaging and isolating appropriately and treating progressively according to the law.
HCFC/HFCThe following shows the overall management of HCFCs and HFCs.
Soil Investigations Status(2017)Number of investigations Area of investigations
12 139,938m2
Kyowa Hakko Kirin Group
50% reduction of VOC emissions in 2020 compared to FY2003 levels
Targets regarding chemical substances
High-concentration
capacitors, reactors, etc.
Trace-quantity capacitor
reactors, etc.
High-concentration
stabilizersTrace-quantity
stabilizers
311 30 3,573 0
Status of PCB management (2017)
Number of buildings Area
4 2,913m2
Status of asbestos management (2017)
Number of offices Weight
14 29,573kg
Number of offices Weight
6 15,471kg
Status of HCFC management (2017)
Status of HFC management (2017)
▶P.99
▶P.39
▶P.99
Related Information
Related Information
Related Information
Env i ron m e n t a lS t ra teg y
Env i ron m e n t a lDa t a
Ac t i v i t y■Biological Resources ■Water Resources ■Containers and Packaging ■Global Warming ■Environmental management

83
Sustainable Procurement
Two-way communication with suppliers
The Kirin Group promotes sustainable procurement and, to fulfill its social responsibility in all processes in the value chain, it places importance on two-way communication with its suppliers.The Japan Integrated Beverages Business asks new suppliers to submit a “Supplier CSR Confirmation” based on the six categories of the code of conduct stipulated in the Kirin Group Supplier CSR Guidelines, and requires them to comply with the Code of Conduct. Once a year, the status of existing suppliers’ approaches to our sustainable procurement is checked and assessed by Kirin procurement staff. The outcomes of those assessments are fed back to the supplier, along with the outcomes of evaluations of other categories such as
Supplier Satisfaction Survey(once a year)
Supplier assessment & feedback(once a year)
KirinSuppliers
Request for enhancement andcontinuous efforts for improvement
*Submission of CSR Confirmation by a new supplier
Kirin Group Supplier CSR GuidelinesMatters for compliance
1 System/Compliance/Risk Management2 Consideration of human rights3 Consideration of the environment ■Approaches to environmental management ■Sustainable use of biological resources ■Sustainable use of water resources ■Sustainable use of resources ■Responses to global warming ■Prevention of pollution and management of restricted substances4 Safety and security5 Approaches to alcohol-related problems6 Social contribution
quality standards, price superiority, and delivery response. If necessary, further investigations will be conducted and requests for corrections will be made. Meanwhile, to ensure fair business practices, we periodically conduct a supplier satisfaction survey to seek feedback from suppliers to the Kirin Group and obtain their opinions about the Kirin Group’s procurement activities. We reflect the comments received in
To fulfill its social responsibility, the Kirin Group established the Kirin Group Sustainable Procurement Policy in September 2017. Listening to the opinions of our suppliers and other stakeholders, we will strive to facilitate their understanding of this policy and work with them to realize it.
*1 Integrated Beverage Group, Lion, and the Kyowa Hakko Kirin Group assess their suppliers through a questionnaire, while Myanmar Brewery does the same of its major suppliers through occasional surveys and guidance.
*2 Because the Kyowa Hakko Kirin Group has been conducting its questionnaire every second year since 2015, in non-survey years, it tallies the suppliers’ self-assessment numbers from the previous year. The Japan Integrated Beverage Business’s survey rate for direct raw material suppliers is 100%.
2015 2016 2017Percentage of suppliers to which risk assessment has been applied (%)*1 47 39.6 47.8
Percentage of Procurement Department staff trained in supply chain policy (%)
100 83.8 96.1
Percentage of self-assessed suppliers(%)*2 25.4 23.3 28.2
Reported number of incidents of child labor on supply chain 0 0 0
Reported number of incidents of forced labor on supply chain 0 0 0
our procurement activities in our efforts to execute open and fair business transactions and ensure compliance. As well as encouraging our suppliers to actively make suggestions, where necessary, we cooperate with them in energy saving activities at their manufacturing plants.Kyowa Hakko Kirin has established the Kyowa Hakko Kirin Group Procurement Basic Policy and has prepared the Kyowa Hakko Kirin CSR Purchasing Guide Book. It has also established a CSR Code of Conduct with which it asks suppliers to cooperate. It has also been conducting questionnaire surveys on the state of CSR initiatives since 2012, to ascertain the current situation at its suppliers.Lion has similar systems in place, requiring its suppliers to sign the Lion Suppliers Responsible Sourcing Code. This ensures that suppliers will fulfill Lion’s procurement standards, which are based on the ethical standards of the Ethical Trading Initiative (ETI). Confirmation is carried out through Sedex.This series of activities constitutes a PDCA cycle through which we work continuously with suppliers in promoting sustainable procurement.The outcomes of the questionnaire survey are as follows.
Env i ron m e n t a lS t ra teg y
Env i ron m e n t a lDa t a
Ac t i v i t y■Biological Resources ■Water Resources ■Containers and Packaging ■Global Warming ■Environmental management

84
Biological resources
Policies on biological resources:From an early stage, the Kirin Group has been pursuing initiatives concerning biological resources, which have a high possibility of being connected to environmental and human rights issues.After making a Declaration of Support for Biodiversity Conservation in 2010, in 2013, we formulated the Kirin Group’s Guidelines on Sustainable Sourcing of Biological Resources and the Action Plan on Sustainable Use of Biological Resources. Black tea leaves, paper and printed materials, and palm oil are specified in the Guidelines and Action Plan as particularly important supplies. After the formulation and announcement of the Kirin Group CSV Commitment in February 2017, we revised the Kirin Group Action Plan on Sustainable Use of Biological Resources and accelerated our initiatives.
Kirin Group relies on the bounty of nature to make products. We utilize the power and wisdom nature has to offer in conducting its business activities. Because of that, we recognize the importance of conserving biodiversity as business challenges. Kirin Group actively pursues a broad range of activities to protect biodiversity in order to continue offering new joys of “food and well-being” into the future.
PurposeThe purpose of the Guidelines is to present the fundamental principles of the Group so that it can continue to ensure the “sustainable sourcing of biological resources” based on the Kirin Group’s Declaration of Support for Biodiversity Conservation.
Applicable scopeThe Guidelines apply to biological resources procured by the Kirin Group’s operating companies in Japan for which the Group has specified that there is risk of illegal deforestation, environmental destruction and such like based on risk assessment performed.
Guidelines on Sustainable Sourcing of Biological ResourcesKirin Group procures applicable biological resources based on the following principles.
1. Resources that the Group has confirmed;not to derive from a plantation developed illegally, to have been produced through appropriate procedures in compliance with the laws and regulations of the areas where the raw material is produced.
2. Resources deriving from plantations, forests, etc. that have been certified by credible third parties.
3. Resources that have not been produced by entities which are considered to be involved in environmental destructions.*1
1. Kirin Group promotes sustainable use of resources while ensuring conservation of biodiversityThe Kirin Group is committed to sustainable use of resources while taking biodiversity into consideration in all of its business activities so that all people around the world may continue to enjoy the bounty of nature.
2. Kirin Group makes effective use of its technologiesAs a company that offers new joys of “food and well-being,” the Kirin Group makes effective use of its technologies when conducting business activities to contribute to the sustainable use of resources and protection of biodiversity.
3. Kirin Group works in cooperation with stakeholdersKirin Group adds a biodiversity perspective to the environmental protection activities which have continuously been engaged in and works in cooperation with customers and local partners to continue conserving biodiversity.
4. Kirin Group properly complies with treaties and lawsKirin Group complies with treaties, laws and regulations concerning biodiversity and strives to help people enjoy the blessings of biodiversity worldwide.
Kirin Group’s Declaration of Support for Biodiversity Conservation
Kirin Group’s Guidelines on Sustainable Sourcing of Biological Resources
*1 Reference is currently made to the FSC’s Policy for the Association of Organization with FSC.
In order to enjoy the blessings of biodiversity worldwide, it is important to ensure proper management of genetic resources in accordance with the relevant laws and regulations agreed upon by the international community. Given the Nagoya Protocol adopted at COP 10, the Kirin Group established its Group Guidelines on the access to genetic resources and has been operating accordingly.
Kirin Group’s Principles of Managing Access to Genetic Resources1. The Group shall respect international agreements concerning biodiversity.2. Access to genetic resources shall be based on prior informed consent of the country providing such resources,
and no genetic resources whose backgrounds are unknown shall be carried in or used.3. Use of genetic resources, including fair and equitable sharing of the benefits arising out of their utilization, shall
be properly managed in accordance with international treaties.
Kirin Group’s Guidelines on Access to Genetic Resources
Env i ron m e n t a lS t ra teg y
Env i ron m e n t a lDa t a
Ac t i v i t y■Biological Resources ■Water Resources ■Containers and Packaging ■Global Warming ■Environmental management

85
1.Black TeaKirin Company, Limited conducts the following three-step survey and, through annual reviews, is raising the level of sustainability.
2.Paper and Printed MaterialsKirin Company, Limited, Kirin Brewery Company, Limited, Kirin Beverage Company, Limited and Mercian Corporation will:Office paper*2
aim to use only FSC®-certified paper or recycled paper by the end of 2020.Containers and packaging*3 *41)6-can packs: aim to use only FSC-certified paper by the end of 2017.2)Gift boxes: aim to use only FSC-certified paper by the end of 2020.3)Drink boxes: aim to use only FSC-certified paper by the end of 2020.4)Cardboard cartons for products: aim to use only FSC-certified paper by the end of 2020.OtherPriority will be given to the use of paper that is FSC-certified, paper made with wood from FSC-managed forests, paper made from recycled paper, and paper that has been confirmed through supplier surveys as not resulting in the destruction of high conservation value forests*5.
3.Palm Oil*6
Operating companies in Japan will use the Book and Claim model in their handling of palm oil used as a primary or secondary ingredient. Book and Claim is a model for the trading of certificates approved by the Roundtable on Sustainable Palm Oil (RSPO).When the identification of palm oil producers and the direct purchase of sufficient quantities of RSPO-certified palm oil becomes possible, a new, upgraded action plan will be formulated.
Kirin Group Action Plan for the Sustainable Use of Biological Resources
Step.1Step.2Step.3
Specify the tea growers from which to procure black tea leaves.Evaluate the sustainability*1 of the specified growers.Aim to use black tea leaves from those growers with a high level of sustainability.
Established on February 2013Revised on February 2017
Notes*1 Sustainability of tea in Step 2 will be evaluated according to the status of Rainforest Alliance certification.*2 “Office paper”refers to copy paper, envelopes (excluding non-standard sizes and some industrial-use envelopes),
business cards, and printed materials such as company pamphlets.*3 Includes Kirin-Tropicana Inc.*4 Excludes limited-edition products, small-lot product varieties, special shapes, imported products, etc.*5 HCVF (High Conservation Value Forest), as defined by FSC®.*6 Palm oil refers to the oil derived from the fruit of the oil palms, and includes palm kernel oil obtained from their
seeds.
Env i ron m e n t a lS t ra teg y
Env i ron m e n t a lDa t a
Ac t i v i t y■Biological Resources ■Water Resources ■Containers and Packaging ■Global Warming ■Environmental management

86
Consideration of the Environment in Product Development
Environmentally Conscious Designs for Containers and Packaging
LCA Initiatives for Containers
Responsible Care
In order to further step up conservation of resources and promote activities toward reducing environmental impact, the Kirin Group operates on its "Guidelines on Environmentally Conscious Design for Containers and Packaging." Established originally by Kirin Brewery in 1998, the Guidelines have been widely applied to the entire Japan Integrated Beverages Business since 2014. With the cooperation of our business partners, we continue to make efforts in developing containers and packaging that have minimal impact on the natural environment.
The Kirin Group performs LCA (Life Cycle Assessment)* on major containers for alcoholic beverages and non-alcoholic beverages whenever necessary. For example, in the case of a glass bottle, we make an assessment by performing calculations in consideration of raw materials used for all parts of the bottle, including the glass, paper for labels, and crown cap, energy used to produce raw materials, and energy associated with recycling after use. We also take into account the product characteristics, unit of purchase by customer at each purchase, major sales store format, projection on collection of empty containers and other relevant factors on a comprehensive basis to select containers.
Kyowa Hakko Kirin has participated in Responsible Care. In all process with each company handling chemicals, throughout development, manufacture, distribution, use, and final consumption, global chemical industry work together to improve “environment, safety and health” voluntarily, and is carrying out activity which releases results of activities and performs dialog and communication with society. This activity is called the Responsible Care.
1. PurposeThe Kirin Group aims to pass down the bounty of natural environment of our Earth in sustainable form to the future generations and continue providing value to customers and society on the whole. To this end, we comply with the relevant laws and regulations and with the Guidelines on Environmentally Conscious Design for Containers and Packaging in pursuing product development in consideration of the environment and promoting reduction and recycling of wastes in its business activities. By so doing, the Kirin Group aims to realize a society that is based on 100% recycling so as to balance the environmental impact produced by the Kirin Group's value chain with the Earth's ability to supply resources.
2. Basic Concept for Development, Design and Adoption of Containers and Packaging(1) In development and design, maintain quality, safety and hygiene of product contents, safety of containers and packaging, and appropriate
presentation of product information as prerequisites, and take into account environmental applicability, user-friendliness, transport efficiency and economic performance.
(2) In adoption, select containers and packaging that meet customers' purchasing and drinking styles, form of selling, and characteristics of product contents.
3. Concept of Caring for the Environment in Development, Design and Adoption of Containers and Packaging(1) Strive to reduce the environmental impact associated with containers and packaging throughout the lifecycle, i.e., from procurement to
recycling, and keep the impact on the natural environment to a minimum.(2) In order to make effective use of resources and contribute to the realization of society that is based on recycling, use materials that are
easy to recycle or dispose of and that have minimal environmental impact.(3) In order to contribute to realizing a low-carbon society, select materials that require low energy use and that generate minimal
greenhouse gas emissions during processes of manufacturing containers and packaging and of transporting products.(4) Select materials in consideration of preventing environmental pollution at the stage of disposal.(5) Promote the 3R (reduce, reuse, recycle) activities in accordance with the following.
4. Guidelines for Promoting the 3Rs (Reduce, Reuse, Recycle)(1) Reduce
1. Make efforts to reduce weight of containers and packaging, sales promotion tools, etc. and to reduce the amount of materials used.2. Make efforts to design containers and packaging so that the volume can be reduced as much as possible by folding or crushing them
when they are recycled or disposed of.3. Shift to simple packaging, try to eliminate individual pieces of wrapping and outer packaging, and make efforts to keep packaging
reasonable.(2) Reuse
1. Make efforts to design containers and packaging so that the number of reuses and refills can be repeated as much as possible.2. Make efforts to keep the environmental impact associated with reuse and refilling as small as possible.
(3) Recycle1. Use single material as much as possible, and when using two or more types of materials, make efforts so as to enable their easy
separation.2. Make efforts to use recycled materials and those with high recycling rates.3. Make efforts to adopt specifications and designs that facilitate separated discharge, sorted collection, and material sorting.
Revised on November 18, 2014
Guidelines on Environmentally Conscious Design for Containers and Packaging
Env i ron m e n t a lS t ra teg y
Env i ron m e n t a lDa t a
Ac t i v i t y■Biological Resources ■Water Resources ■Containers and Packaging ■Global Warming ■Environmental management

87
Environmental Education
Environmental Training Raising Environmental Awareness within the Company
Experiential Program
To mitigate environmental risk, the Kirin Group conducts an ongoing program for environmental training for its employees.This systematized training consists of training for environmental staff and training by job grade, including new employees. The training conducted at the Technical Talent Development Center has also been opened to Kirin Group companies in Japan.In 2017, nine people underwent the wastewater treatment course, and basic classes on topics such as wastewater treatment and waste management were delivered as part of new employee training.Further, the CSV Strategy Department conducts systematized industrial waste training, which 329 people underwent in 2017.
In-house communications, specifically employee newsletters and the intranet, are used to expand the depth and breadth of interest in and understanding of the environment among Kirin Group employees. At Group headquarters, videos presenting Kirin’s environmental initiatives are screened on digital signage to deepen understanding among employees.
The Kirin Group conducts a CSV Experiential Program for Confronting Social Issues, a CSV training program that gives employees the opportunity to focus on social issues.In 2017, programs were held to promote understanding of examples of the Creating Shared Value that Kirin engages in with society. These programs gave participants the change to experience first-hand actual operations and interactions with the local community in Tono in Iwate Prefecture, with which Kirin has had a connection in hops cultivation for more than fifty years, and in Ueda in Nagano Prefecture, where Mercian operates its own vineyard, Mariko Vineyard.
Employee newslettersKIRIN CSV TIMES
Fiscal Year Program Date Number of participants
2016
At Tono hops farm
6/10 Fri~11 Sat 24
At Ueda vineyard
7/8 Fri 27
10/14 Fri 35
2017
At Tono hops farm
5/26 Fri~27 Sat 36
At Ueda vineyard
9/22 Fri~23 Sat 31
Scenery of environmental training
Env i ron m e n t a lS t ra teg y
Env i ron m e n t a lDa t a
Ac t i v i t y■Biological Resources ■Water Resources ■Containers and Packaging ■Global Warming ■Environmental management

88
EnvironmentalData
Env i ron m e n t a lS t ra teg y
Env i ron m e n t a lDa t a
Ac t i v i t y■Biological Resources ■Water Resources ■Containers and Packaging ■Global Warming ■Environmental management
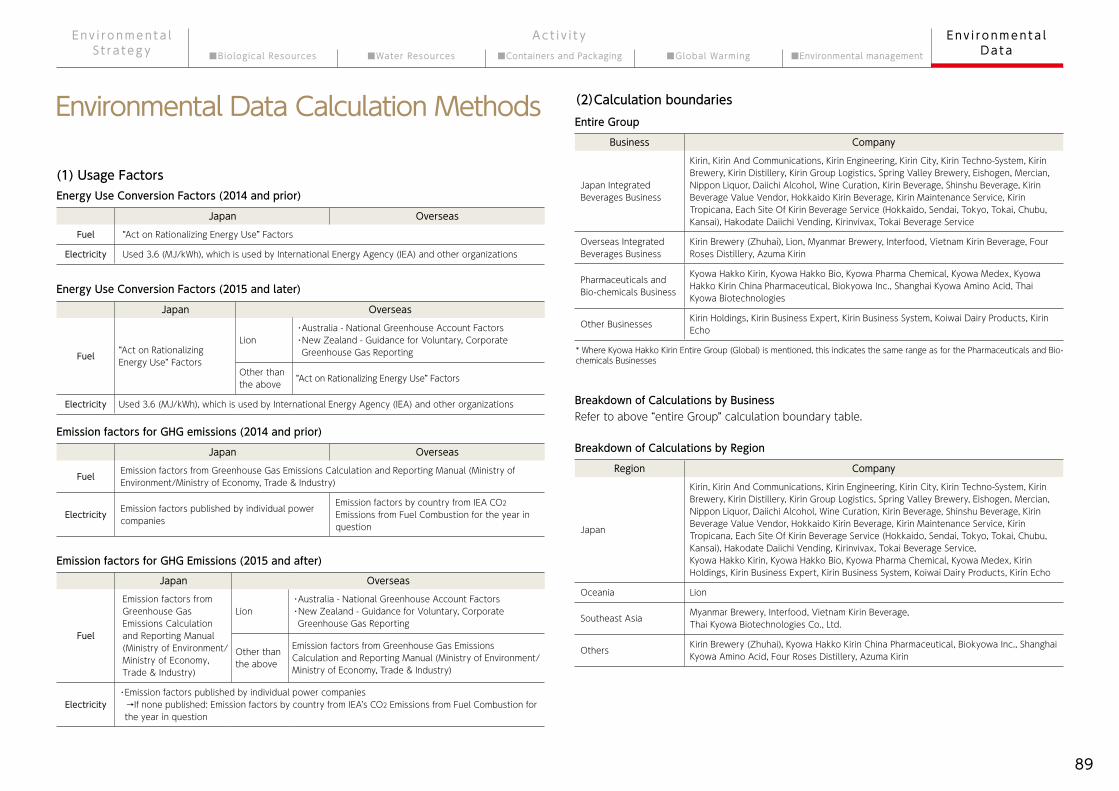
89
Energy Use Conversion Factors (2014 and prior)
Entire Group
Breakdown of Calculations by Region
Breakdown of Calculations by Business
Emission factors for GHG emissions (2014 and prior)
Energy Use Conversion Factors (2015 and later)
Emission factors for GHG Emissions (2015 and after)
(1) Usage Factors
(2)Calculation boundaries
Japan Overseas
Fuel “Act on Rationalizing Energy Use” Factors
Electricity Used 3.6 (MJ/kWh), which is used by International Energy Agency (IEA) and other organizations
Japan Overseas
Fuel Emission factors from Greenhouse Gas Emissions Calculation and Reporting Manual (Ministry of Environment/Ministry of Economy, Trade & Industry)
Electricity Emission factors published by individual power companies
Emission factors by country from IEA CO2
Emissions from Fuel Combustion for the year in question
Japan Overseas
Fuel “Act on Rationalizing Energy Use” Factors
Lion・Australia - National Greenhouse Account Factors・New Zealand - Guidance for Voluntary, Corporate
Greenhouse Gas Reporting
Other than the above “Act on Rationalizing Energy Use” Factors
Electricity Used 3.6 (MJ/kWh), which is used by International Energy Agency (IEA) and other organizations
Japan Overseas
Fuel
Emission factors from Greenhouse Gas Emissions Calculation and Reporting Manual (Ministry of Environment/Ministry of Economy, Trade & Industry)
Lion・Australia - National Greenhouse Account Factors・New Zealand - Guidance for Voluntary, Corporate
Greenhouse Gas Reporting
Other than the above
Emission factors from Greenhouse Gas Emissions Calculation and Reporting Manual (Ministry of Environment/Ministry of Economy, Trade & Industry)
Electricity・Emission factors published by individual power companies →If none published: Emission factors by country from IEA’s CO2 Emissions from Fuel Combustion for
the year in question
Environmental Data Calculation Methods
Refer to above “entire Group” calculation boundary table.
Business Company
Japan Integrated Beverages Business
Kirin, Kirin And Communications, Kirin Engineering, Kirin City, Kirin Techno-System, Kirin Brewery, Kirin Distillery, Kirin Group Logistics, Spring Valley Brewery, Eishogen, Mercian, Nippon Liquor, Daiichi Alcohol, Wine Curation, Kirin Beverage, Shinshu Beverage, Kirin Beverage Value Vendor, Hokkaido Kirin Beverage, Kirin Maintenance Service, Kirin Tropicana, Each Site Of Kirin Beverage Service (Hokkaido, Sendai, Tokyo, Tokai, Chubu, Kansai), Hakodate Daiichi Vending, Kirinvivax, Tokai Beverage Service
Overseas Integrated Beverages Business
Kirin Brewery (Zhuhai), Lion, Myanmar Brewery, Interfood, Vietnam Kirin Beverage, Four Roses Distillery, Azuma Kirin
Pharmaceuticals and Bio-chemicals Business
Kyowa Hakko Kirin, Kyowa Hakko Bio, Kyowa Pharma Chemical, Kyowa Medex, Kyowa Hakko Kirin China Pharmaceutical, Biokyowa Inc., Shanghai Kyowa Amino Acid, Thai Kyowa Biotechnologies
Other Businesses Kirin Holdings, Kirin Business Expert, Kirin Business System, Koiwai Dairy Products, Kirin Echo
Region Company
Japan
Kirin, Kirin And Communications, Kirin Engineering, Kirin City, Kirin Techno-System, Kirin Brewery, Kirin Distillery, Kirin Group Logistics, Spring Valley Brewery, Eishogen, Mercian, Nippon Liquor, Daiichi Alcohol, Wine Curation, Kirin Beverage, Shinshu Beverage, Kirin Beverage Value Vendor, Hokkaido Kirin Beverage, Kirin Maintenance Service, Kirin Tropicana, Each Site Of Kirin Beverage Service (Hokkaido, Sendai, Tokyo, Tokai, Chubu, Kansai), Hakodate Daiichi Vending, Kirinvivax, Tokai Beverage Service,Kyowa Hakko Kirin, Kyowa Hakko Bio, Kyowa Pharma Chemical, Kyowa Medex, Kirin Holdings, Kirin Business Expert, Kirin Business System, Koiwai Dairy Products, Kirin Echo
Oceania Lion
Southeast Asia Myanmar Brewery, Interfood, Vietnam Kirin Beverage, Thai Kyowa Biotechnologies Co., Ltd.
Others Kirin Brewery (Zhuhai), Kyowa Hakko Kirin China Pharmaceutical, Biokyowa Inc., Shanghai Kyowa Amino Acid, Four Roses Distillery, Azuma Kirin
* Where Kyowa Hakko Kirin Entire Group (Global) is mentioned, this indicates the same range as for the Pharmaceuticals and Bio-chemicals Businesses
Env i ron m e n t a lS t ra teg y
Env i ron m e n t a lDa t a
Ac t i v i t y■Biological Resources ■Water Resources ■Containers and Packaging ■Global Warming ■Environmental management

90
Calculation boundary of actual emissions against mid-term and long-term GHG emission targets (Scope 1, Scope 2)(P.21、P.59、P.60、P.68、P.96、P.97)
Calculation boundary of actual emissions against mid-term and long-term GHG emission targets (Scope 3)(P.21、P.59、P.60、P.97)
Calculation boundary of Scope 3 emissions(P.60、P.67、P.96、P.97)
Business CompanyJapan Integrated Beverages Business
Kirin Brewery, Kirin Distillery, Kirin Group Logistics, Mercian, Daiichi Alcohol, Kirin Beverage, Shinshu Beverage, Kirin
Overseas Integrated Beverages Business
Lion, Kirin Brewery (Zhuhai), Interfood, Vietnam Kirin Beverage,Myanmar Brewery*
Pharmaceuticals and Bio-chemicals Business
Kyowa Hakko Kirin, Kyowa Hakko Bio, Kyowa Pharma Chemical, Biokyowa Inc., Shanghai Kyowa Amino Acid, Kyowa Hakko Kirin China Pharmaceutical, Thai Kyowa Biotechnologies Co., Ltd.
Other Businesses Koiwai Dairy Products
*Myanmar Brewery calculation results have been reported since 2016.
Business CompanyJapan Integrated Beverages Business
Kirin Brewery, Kirin Distillery, Kirin Group Logistics, Mercian, Daiichi Alcohol, Kirin Beverage, Shinshu Beverage, Kirin
Overseas Integrated Beverages Business Lion
Pharmaceuticals and Bio-chemicals Business
Kyowa Hakko Kirin, Kyowa Hakko Bio, Kyowa Pharma Chemical, Biokyowa Inc., Shanghai Kyowa Amino Acid
Other Businesses Koiwai Dairy Products
Business Company
Japan Integrated Beverages Business
Kirin, Kirin And Communications, Kirin Engineering, Kirin City, Kirin Techno-System, Kirin Brewery, Kirin Distillery, Kirin Group Logistics, Spring Valley Brewery, Eishogen, Mercian, Nippon Liquor, Daiichi Alcohol, Wine Curation, Kirin Beverage, Shinshu Beverage, Kirin Beverage Value Vendor, Hokkaido Kirin Beverage, Kirin Maintenance Service, Kirin Tropicana, Each Site Of Kirin Beverage Service (Hokkaido, Sendai, Tokyo, Tokai, Chubu, Kansai), Hakodate Daiichi Vending, Kirinvivax, Tokai Beverage Service
Overseas Integrated Beverages Business
Kirin Brewery (Zhuhai), Lion, Myanmar Brewery, Interfood, Vietnam Kirin Beverage, Four Roses Distillery, Azuma Kirin
Pharmaceuticals and Bio-chemicals Business
Kyowa Hakko Kirin, Kyowa Hakko Bio, Kyowa Pharma Chemical, Kyowa Medex, Kyowa Hakko Kirin China Pharmaceutical, Biokyowa Inc., Shanghai Kyowa Amino Acid, Thai Kyowa Biotechnologies
Other Businesses Kirin Holdings, Kirin Business Expert, Kirin Business System, Koiwai Dairy Products, Kirin Echo
Calculation boundary of water consumption rate for Japan Integrated Beverages Business(P.42)
Constituent/Name of Group Company
Number of manufacturing plants Remarks
Kirin Brewery 9
Hokkaido Chitose, Sendai, Toride, Yokohama, Nagoya, Shiga, Kobe, Okayama, Fukuoka* Because Kirin Beverage Shiga Plant is attached to Kirin Brewery Shiga
Plant, it is included in Kirin Brewery Shiga Plant
Kirin Distillery 1 Gotemba
Mercian 3 Fujisawa, Yatsushiro, Chateau Mercian (Katsunuma)
Kirin Beverage 2Shonan, Maizuru* Because Kirin Beverage Shiga Plant is attached to Kirin Brewery Shiga
Plant, it is included in Kirin Brewery Shiga Plant
Shinshu Beverage 1
Env i ron m e n t a lS t ra teg y
Env i ron m e n t a lDa t a
Ac t i v i t y■Biological Resources ■Water Resources ■Containers and Packaging ■Global Warming ■Environmental management

91
Environmental Accounting
Environment conservation costs (Unit:million yen)
Category Specific detailsInvestment amounts Expense amounts
2015 2016 2017 2015 2016 2017Environmental conservation costs to control environmental impact resulting from production and service activity within the business areas (total of ①②③ below)
2,909 1,028 1,311 6,727 4,606 5,971
① Pollution prevention costs
Air and water pollution prevention activities, analysis and measurement of air and water quality, etc.
1,986 594 1,093 3,375 2,182 3,229
② Global environmental conservation costs
Solar power generation, CO2 recovery, energy saving, cogeneration, etc. 639 242 147 1,393 743 947
③ Resource circulation costs
Reduction of sludge, waste recycling, water recycling, etc. 284 191 71 1,959 1,681 1,795
Upstream / downstream costs
Containers and Packaging Recycling Act, Recycling contracting costs 1 2 0 530 532 40
Administration costsOperation of environmental management systems, environmental education, greenification in business sites, etc.
13 58 15 337 342 305
Research and development costs
Container lightweighting, R&D regarding mitigation of environmental load of byproducts, wastewater, etc.
50 0 24 157 99 105
Social activities costsEnvironmental conservation activity costs such as activities to protect the blessings of water, donations to nature conservation groups, etc.
0 1 3 86 65 95
Environmental remediation costs 0 0 0 0 0 0
Others 0 0 0 1 1 3
Total 2,973 1,088 1,353 7,838 5,645 6,520
Economic effect (Unit:million yen)
Items Details 2015 2016 2017Proceeds from sales of valuables, etc.
Waste recycling, etc. 886 777 851
Resources saving effects
Energy saving, waste reduction, resources saving, etc. 679 466 418
Calculation boundaries2015: January - December 2015 (Includes Kirin Brewery, Kirin Beverages, and certain other constituent companies), Kyowa Hakko
Kirin, Kyowa Medex, Kyowa Hakko Bio, Kyowa Pharma Chemical (former Daiichi fine chemical), Koiwai Dairy Products2016: January - December 2016 (Includes Kirin Brewery, Kirin Beverages, and certain other constituent companies), Kyowa Hakko
Kirin, Kyowa Medex, Kyowa Hakko Bio, Kyowa Pharma Chemical , Koiwai Dairy Products2017: January - December 2017 (Includes Kirin Brewery, Kirin Beverages, and certain other constituent companies), Kyowa Hakko
Kirin, Kyowa Medex, Kyowa Hakko Bio, Kyowa Pharma Chemical , Koiwai Dairy Products
Breakdown of business locations subject to water risk assessments(P.33、P.40)
Constituent/Name of Group Company Country
Number of manufacturing
plantsRemarks
Kirin Brewery Japan 8
Sendai, Toride, Yokohama, Nagoya, Shiga, Kobe, Okayama, Fukuoka* Because Kirin Beverage Shiga Plant is attached to Kirin
Brewery Shiga Plant, it is included in Kirin Brewery Shiga Plant
Kirin Distillery Japan 1 Gotemba
Mercian Japan 1 Yatsushiro
Kirin Beverage Japan 1Shonan* Because Kirin Beverage Shiga Plant is attached to Kirin
Brewery Shiga Plant, it is included in Kirin Brewery Shiga Plant
Shinshu Beverage Japan 1
Kyowa Hakko KirinJapan 2 Takasaki, Fuji
China 1 Kyowa Hakko Kirin China Pharmaceutical
Kyowa Hakko Bio Japan 2 Yamaguchi Production Center (Hofu), Yamaguchi Production Center (Ube)
Kyowa Pharma Chemical Japan 1 Head office
Koiwai Dairy Products Japan 1 Koiwai
Biokyowa Inc. America 1Shanghai Kyowa Amino Acid China 1Thai Kyowa Biotechnologies Co., Ltd. Thai 1
Kirin Brewery (Zhuhai) China 1Interfood Vietnam 1Vietnam Kirin Beverage Vietnam 1Four Roses Distillery America 2 Lawrenceburg、Cox's Creek
Myanmar Brewery Myanmar 1Azuma Kirin Brazil 1 Campinas
LionAustraria 12
Bentley Milk, Burnie, Canberra, Castlemaine Perkins Brewery, Chelsea Heights, James Boag Brewery, Little Creatures Brewery Fremantle, Morwell, Penrith, Smithfield, Tooheys Brewery, West End Brewery
Newzealand 3 Palmerston North, Pride Brewery, Speights Brewery
* Not included in the scope of the bar graph of water use by risk per major business site
Env i ron m e n t a lS t ra teg y
Env i ron m e n t a lDa t a
Ac t i v i t y■Biological Resources ■Water Resources ■Containers and Packaging ■Global Warming ■Environmental management

92
Material Flow (2017, entire Group)
Unit Japan Integrated Beverages Business
Overseas Integrated Beverages Business
Pharmaceuticals and Bio-chemicals
BusinessesOther Businesses
Total
2017 2016 2015
Substance
thousand t 698 1,516 210 30 2,453 2,505 2,894
% 28 62 9 1 100
Raw material thousand t 446 1,053 207 28 1,733 1,746 2,142
Packaging material thousand t 252 463 3 2 719 759 752
Water (fresh water only)thousand m3 18,400 8,317 52,488 440 79,644 81,685 80,695
% 23 10 66 1 100
Water recycling thousand m3 3,321 255 57,536 0 61,112 54,611 59,939
EnergyTJ 5,262 3,254 6,099 158 14,773 13,012 12,517
% 36 22 41 1 100
Production volumes
Alcoholic and non-alcoholic beverages thousand kL 3,518 2,194 0 31 5,743 5,798 5,821
Food products/Pharmaceuticals and biochemicals thousand t 8 98 73 10 189 179 216
Wastewaterthousand m3 15,979 6,010 51,230 369 73,587 73,657 73,582
% 22 8 69 1 100
Greenhouse gas emissions(Scope1+Scope2)
thousand t-CO2e 318 300 367 15 1,000 1,016 1,007
% 31 30 37 2 100
NOx t 174 226 29 1 431 442 271
SOx t 86 1 8 0.2 95 25 71
Waste products
thousand t 195 158 73 1 427 407 342
% 46 37 16 1 100
Volume disposed on site thousand t 1 0 34 0 35 27 14
Volume of recycled waste thousand t 193 145 38 1 378 368 316
Final disposed volume thousand t 0.6 13 0.2 0 14 12 12
Material Balance
Env i ron m e n t a lS t ra teg y
Env i ron m e n t a lDa t a
Ac t i v i t y■Biological Resources ■Water Resources ■Containers and Packaging ■Global Warming ■Environmental management

93
UnitWastewater volume
Sewage water Direct release into rivers, etc.
Indirect release into ocean Other* Total
2013thousand m3 7,104 28,587 41,844 506 78,041
% 9 37 54 1 100
2014thousand m3 7,452 28,934 38,067 302 74,755
% 10 39 51 0.4 100
2015thousand m3 6,273 30,534 36,768 8 73,583
% 9 41 50 0.0 100
2016thousand m3 6,645 29,005 37,898 109 73,657
% 9 39 51 0.1 100
2017thousand m3 7,248 27,679 38,559 102 73,587
% 10 38 52 0.1 100
Unit Cyclical use Recycling rate(%)Re-used water Recycled water Total
2013thousand m3 13,163 41,538 54,701
40% 24.1 75.9 100.0
2014thousand m3 13,020 43,393 56,413
39% 23.1 76.9 100.0
2015thousand m3 13,508 46,431 59,939
43% 22.5 77.5 100.0
2016thousand m3 13,386 41,225 54,611
40% 24.5 75.5 100.0
2017thousand m3 15,123 45,989 61,112
43% 24.7 75.3 100.0
Japan Oceania Southeast Asia Other Total2013 67,501 5,030 333 9,534 82,3992014 63,223 5,807 490 9,852 79,3722015 63,361 5,444 2,317 9,573 80,6952016 62,773 5,514 2,560 10,838 81,6852017 61,782 5,469 2,501 9,892 79,644
Trends in annual water use volumes by water source (entire Group)
Trend in wastewater volume by destination (entire Group)
Trend in water use volumes of Japan Integrated Beverages Business
* Because Kirin Beverage Shiga Plant is attached to Kirin Brewery Shiga Plant, it is included in Kirin Brewery Shiga Plant
* Externally supplied gray water
Trend in use of recycled water in entire Group manufacturing plants and business locations
Trend in water use volumes (by region) (Unit:thousand m3)
Trend in water use volumes (by business) (Unit:thousand m3)
Trends in water use volumes and water consumption rate (entire Group)
*Water sprayed onto forest areas
Unit Kirin Brewery Kirin Distillery Kirin Beverage Shinshu Beverage Mercian Total
2015thousand m3 11,098 1,274 1,309 1,205 5,041 19,928
m3/kL 4.9 3.3 3.4 5.4 39.3 5.92
2016thousand m3 11,006 1,324 1,359 1,297 4,317 19,303
m3/kL 4.97 3.1 2.9 5.2 32.6 5.60
2017thousand m3 11,198 1,383 968 1,374 3,391 18,313
m3/kL 5.3 3.2 2.2 5.2 25.5 5.39
Japan Integrated Beverages Business
Overseas Integrated Beverages Business
Pharmaceuticals and Bio-chemicals Businesses Other Businesses Total
2013 20,034 5,875 56,095 394 82,3992014 19,233 6,901 52,875 363 79,3722015 20,017 7,505 52,751 422 80,6952016 19,391 9,120 52,772 403 81,6852017 18,400 8,316 52,488 440 79,644
Water use volume(thousand m3)Water consumption rate (by sales revenue)(m3/million yen)
Japan standard IFRS2013 82,399 37 −2014 79,372 36 −2015 80,695 37 −2016 81,685 39 442017 79,644 − 43
Water Resources
UnitFresh water
TotalService water
Rivers (including industrial water)
Underground water Storm water Gray water*
(Reclaimed water)
2013thousand m3 8,484 42,704 29,036 482 25 80,731
% 11 53 36 1 0.0 100
2014thousand m3 9,476 39,751 28,458 1 28 87,380
% 11 45 33 0.0 0.0 89
2015thousand m3 10,158 40,374 28,461 0 30 79,023
% 13 51 36 0.0 0.0 100
2016thousand m3 9,949 41,375 29,829 2 8 81,163
% 12 51 37 0.0 0.0 100
2017thousand m3 9,768 42,150 27,725 1 0 79,644
% 12 53 35 0.0 0.0 100
Env i ron m e n t a lS t ra teg y
Env i ron m e n t a lDa t a
Ac t i v i t y■Biological Resources ■Water Resources ■Containers and Packaging ■Global Warming ■Environmental management

94
Volume of resources used in containers and packaging
Volume of resources used by container (Japan Integrated Beverages Business) (Unit:t)
State of sale and collection of returnable glass bottles (Kirin Brewery)
Sale volumes(million bottles) Collected volume(million bottles) Collection rate(%)
2013 285.7 285.5 100
2014 263.1 261.7 99
2015 248.7 247.1 99
2016 232.0 232.7 100
2017 224.6 227.8 101
* Total of major returnable bottles (large, medium, small bottles)* Kirin Brewery is engaged in the re-use of beer bottles and commercial large draft kegs. With the diversification of containers, the volume of returnable bottles used has fallen, but the collection rate is 99%.Kirin Beverage also uses returnable bottles for Kirin Lemon and other products and has a collection rate of nearly 100%.
Containers and Packaging The Kirin Group pursues initiatives in cooperation with Japanese industry organizations involved in container recycling
2012 2013 2014 2015 2016 Target*
Aluminum cans
Weight of consumed(kt) 301 304 313 332 341 ─
Recycled weight(kt) 285 255 273 299 315 ─
Recycling rate(%) 94.7 83.8 87.4 90.1 92.4 ≥90
Steel cans
Weight of consumed(kt) 664 611 571 486 463 ─
Recycled weight(kt) 603 567 525 451 435 ─
Recycling rate(%) 90.8 92.9 92.0 92.9 94.0 ≥85
PET bottles
Sales volume of specified PET bottles(kt) 583 578.706 569 563 596 ─
Recycling volume in Japan(kt) 254 258 271 262 279 ─
Recycling volume outside Japan(kt) 241 239 199 227 221 ─
Recycling volume of used PET bottle(kt) 495 497 470 489 500 ─
Recycling rate(%) 85.0 85.8 82.6 86.9 83.9 ≥85
Glass bottles
Melted weight(千t) 1693 1702 1652 1618 1606 ─
Cullet usage volume(千t) 1285 1274 1230 1228 1211 ─
Cullet usage rate(%) 75.9 74.8 74.4 75.9 75.4 ≥90
Recycling rate(%) 68.1 67.3 69.8 68.4 71.0 ─
* Recycling target of 2nd Voluntary Action Plan
(Ref.) Trends in recycling rates of other containers in Japan
Unit Japan Integrated Beverages Business
Overseas Integrated Beverages Business
Pharmaceuticals and Bio-chemicals
BusinessesOther Businesses Total
2013kt 319 358 3 3 683% 46.7 52.4 0.4 0.4 100
2014kt 326 378 3 2 709% 46.0 53.3 0.4 0.3 100
2015kt 350 398 2 2 752% 46.6 52.9 0.3 0.2 100
2016kt 259 496 3 2 759% 34.1 65.4 0.4 0.2 100
2017kt 252 463 3 2 719% 35.0 64.4 0.4 0.2 100
Aluminum cans PET bottles Glass bottles Cartons 6-can packs
2013Volume reduction 17,492 8,071 588 5,405 2,870
Volumes used 84,495 58,378 24,799 93,836 16,985
2014Volume reduction 19,295 8,771 606 5,187 2,691
Volumes used 80,040 61,165 34,328 95,707 16,075
2015Volume reduction 18,908 9,517 792 5,598 3,758
Volumes used 82,605 58,866 32,668 102,113 15,522
2016Volume reduction 18,795 11,326 960 8,012 3,564
Volumes used 80,430 63,000 33,532 111,631 14,803
2017Volume reduction 30,031 7,710 1,332 8,792 3,444
Volumes used 78,210 60,561 31,276 102,693 14,499
*Reduction volumes are totals for Kirin Brewery and Kirin Beverage, use volumes are totals for Kirin Brewery, Kirin Beverage, and Mercian.
Env i ron m e n t a lS t ra teg y
Env i ron m e n t a lDa t a
Ac t i v i t y■Biological Resources ■Water Resources ■Containers and Packaging ■Global Warming ■Environmental management

95
■Scope 1 (direct emissions) + Scope 2 (indirect emissions from energy use)Trends in greenhouse gas emissions
Trends in greenhouse gas emissions (by business) (Unit:thousand tCO2e)
Japan Integrated Beverages Business
Overseas Integrated Beverages Business
Pharmaceuticals and Bio-chemicals
BusinessesOther Businesses Total
2013 332 310 357 23 1,022
2014 325 280 341 20 966
2015 327 297 364 19 1,007
2016 329 304 367 16 1,016
2017 317 300 367 17 1,000
Greenhouse gas emissions(thousand tCO2e)Greenhouse gas emissions intensity (per unit of
sales) (tCO2e/million yen)
(of which, CO2) Japan standard IFRS
2013 1,022 (1,140) 0.45
2014 966 (1,102) 0.44 −
2015 1,007 (1,004) 0.46 −
2016 1,016 (1,013) 0.49 0.55
2017 1,000 (999) − 0.54
Trends in greenhouse gas emissions and emissions intensity (entire Group)
Japan Oceania Southeast Asia Other Total2013 622 292 6 102 1,022
2014 603 258 9 96 966
2015 601 258 32 116 1,007
2016 597 251 46 122 1,016
2017 584 247 49 120 1,000
Trends in greenhouse gas emissions (by region) (Unit:thousand tCO2e)
Global Warming
Shonan PlantGreenhouse gas emissions(thousand tCO2e) Greenhouse gas emissions intensity(kgCO2e/kL)
2013 27 76
2014 26 83
2015 28 90
2016 31 77
2017 28 64
Greenhouse gas emissions(thousand tCO2e)
2013 33
2014 25
2015 25
2016 26
2017 29
(b) Kirin Beverage
(c) Mercian
Greenhouse gas emissions(thousand tCO2e) Greenhouse gas emissions intensity(kgCO2e/kL)
2013 184 84
2014 180 83
2015 177 79
2016 174 80
2017 170 80
Trends in greenhouse gas emissions and emission intensities from manufacturing plants(a) Kirin Brewery
Trends in energy usage (entire Group)
Energy usage by type 2013 2014 2015 2016 2017Total usage(TJ) 15,636 15,479 15,607 15,581 14,773
Coal(t) 940 1,938 1,403 1,758 2,294
Gasoline(kL) 8,260 5,483 6,100 5,168 3,600
Kerosene(kL) 114 94 87 166 1,466
Diesel oil(kL) 4,837 8,107 14,882 18,515 13,790
Heavy fuel oil(kL) 21,032 19,475 16,993 16,513 12,476
LPG(t) 4,218 4,278 4,883 4,724 3,719
Town gas(thousand Nm3) 107,394 106,862 108,431 111,648 110,950
LNG(t) 1,122 0 0 0 0
Purchased electricity(MWh) 1,067,268 1,042,546 1,032,641 1,060,371 816,201
Renewable electricity(MWh) 1,026 937 815 843 937
Purchased steam(TJ) 2,120 2,144 2,100 2,084 1,925
Other(TJ) 4,280 3,241 3,187 2,941 1,761
Actual results for Fiscal 2017 marked with have received independent assurance by KPMG AZSA Sustainability Co., Ltd.in accordance with International Standard on Assurance Engagements (ISAE) 3000 and ISAE3410.
Env i ron m e n t a lS t ra teg y
Env i ron m e n t a lDa t a
Ac t i v i t y■Biological Resources ■Water Resources ■Containers and Packaging ■Global Warming ■Environmental management

96
■Scope 2 (indirect emissions from energy use)Trends in greenhouse gas emissions from electricity and steam purchases (by business) (Unit:thousand tCO2e)
Trends in greenhouse gas emissions from electricity and steam purchases (by region) (Unit:thousand tCO2e)
Japan Integrated Beverages Business
Overseas Integrated Beverages Business
Pharmaceuticals and Bio-chemicals
BusinessesOther Businesses Total
2013 115 213 284 17 629
2014 115 197 270 14 596
2015 112 191 299 13 615
2016 110 192 301 11 614
2017 92 192 298 12 594
Breakdown and Trends in Greenhouse Gas Emissions
Trends in greenhouse gas emissions from fuel use (by business) (Unit:thousand tCO2e)
Trends in CO2 emissions by other parties related to business activities (by business)See P. 90 for calculation boundaries (Unit:thousand tCO2)
Trends in CO2 emissions by other parties related to business activities (by region)See P. 90 for calculation boundaries (Unit:thousand tCO2)Trends in greenhouse gas emissions from fuel use (by region) (Unit:thousand tCO2e)
Breakdown of greenhouse gas emissions in Scope 1
Japan Integrated Beverages Business
Overseas Integrated Beverages Business
Pharmaceuticals and Bio-chemicals
BusinessesOther Businesses Total
2013 218 97 72 6 393 2014 210 83 71 6 370 2015 215 106 65 5 391 2016 219 112 65 5 402 2017 224 108 69 5 406
Japan Integrated BeveragesBusiness
Overseas Integrated Beverages Business
Pharmaceuticals and Bio-chemicals
BusinessesOther Businesses Total
2013 2,857 972 245 50 4,124 2014 2,784 921 299 126 4,130 2015 2,930 834 242 68 4,074 2016 2,966 913 246 67 4,192 2017 2,802 1,217 265 63 4,347
CO2 CH4 N2O HFCs PFCs SF6
406 <0.1 <0.1 <0.1 0 0
Japan Oceania Southeast Asia Other Total2013 264 89 3 38 393 2014 253 73 5 40 370 2015 255 82 17 37 392 2016 260 77 18 47 402 2017 267 74 21 44 406
Japan Oceania Southeast Asia Other Total2013 358 203 4 65 629 2014 350 186 4 56 596 2015 345 176 15 79 615 2016 337 174 28 75 614 2017 317 173 28 75 594
Japan Oceania Southeast Asia Other Total2013 3,129 970 1 24 4,1242014 3,172 920 1 39 4,1312015 3,203 833 0.4 39 4,0742016 3,234 800 112 44 4,1912017 3,072 1,083 133 59 4,347
■Scope 1 (direct emissions)
■Scope3 (other indirect emissions)
Business Japan Integrated Beverages Business
Pharmaceuticals and Bio-chemicals
BusinessesOther Businesses Total
2012
Transport volumes(thousand ton kilometer) 1,289,146 −*2 37,062 1,326,208
CO2 emissions(thousand tons-CO2) 107 −*2 6 113
2013
Transport volumes(thousand ton kilometer) 1,449,709 −*2 −*3 1,449,709
CO2 emissions(thousand tons-CO2) 124 −*2 −*3 124
2014
Transport volumes(thousand ton kilometer) 1,395,580 −*2 −*3 1,395,580
CO2 emissions(thousand tons-CO2) 116 −*2 −*3 116
2015
Transport volumes(thousand ton kilometer) 1,481,459 −*2 −*3 1,481,459
CO2 emissions(thousand tons-CO2) 125 −*2 −*3 125
2016
Transport volumes(thousand ton kilometer) 1,559,015 −*2 −*3 1,559,015
CO2 emissions(thousand tons-CO2) 131 −*2 −*3 131
Trends in CO2 emissions*1 accompanying transportation volumes and distances (Japan)
*1 Tally period is April to March of following year for each year. Calculated within the reporting scope of specified consigners, in line with the calculation standards of the Act on Rationalizing Energy Use.
*2 Due to the decline in CO2 emissions from transport resulting from the transfer of the chemical business in 2011, it was removed from the calculation targets from 2012.
*3 Due to the decline in CO2 emissions resulting from structural reforms in 2011, it was removed from the calculation boundaries from 2013.
Env i ron m e n t a lS t ra teg y
Env i ron m e n t a lDa t a
Ac t i v i t y■Biological Resources ■Water Resources ■Containers and Packaging ■Global Warming ■Environmental management

97
Independent AssuranceThe Kirin Group has been receiving independent assurances to ensure the reliability and transparency of information disclosed.In 2017, the Kirin Group engaged independent third parties to provide assurance on the amount of CO2 emissions in Scopes 1 and 2 from the entire Kirin Group and in Scope 3 from the Japan Integrated Beverages Business. The independent assurance report is shown on Page 103.
Calculation results of Scopes 1 and 2 for the entire Kirin Group*1 (2017) (Unit:tCO2e/year)
Calculation results of Scope 3 for Japan Integrated Beverages Business*2 (2017) (Unit:tCO2/year)
Upstream/Downstream Scope 3 Categories Calculation
results Remarks
Upstream
1 Products and services purchased 1,600,635 Calculated by multiplying the purchased volume of raw materials, etc. by
the CO2 emission factors for producing each type of raw material, etc.
2 Capital goods - Not calculated
3Fuel and energy-related activities not included in Scopes 1 and 2
50,704 Calculated by multiplying the purchased volume of fuel or electricity by CO2 emissions factors for each energy type
4 Transportation and delivery (upstream) 325,905
Calculated by multiplying the shipping volume of products as shipper and the purchased volume of raw materials, etc. by the distance of transportation and then by the CO2 emission factors for each transportation method (the amount of CO2 emissions based on shipping volume of products as shipper is calculated using FY2016 data)
5 Waste from operations 9,668 Calculated by multiplying the amount of waste discharged, etc. by the CO2 emission factors for each disposal method
6 Business travel 2,208 Calculated by multiplying the number of employees by the annual average distance of transportation and then by the CO2 emission factors for each means of transportation
7 Employee commuting 6,275 Calculated by multiplying the number of employees by the annual average distance of transportation and then by the CO2 emission factors for each means of transportation
8 Leased assets (upstream) - Included in Scopes 1 and 2
Downstream
9 Transportation and delivery (downstream) 731,276
Customer: Calculated by multiplying the product sales volume by the CO2 emission factors for selling products for each sales method
Vending machines: Calculated by multiplying the estimated power consumption of vending machines in operation by the CO2 emission factors for electricity
10 Processing of sold products - Not applicable
11 Use of sold products 21,588 Calculated by multiplying the product sales volume by the estimated power consumption per product unit amount in homes, etc. and by the CO2 emission factors for electricity
12 Disposal of sold products 53,715 Calculated by multiplying the amount of containers and packaging disposed of by the CO2 emission factors for each type of container and packaging
13 Leased assets (downstream) - Not applicable
14 Franchises - Not applicable15 Investments - Not applicable
Total 2,801,973
*1 Methods of calculating Scope 1 and 2 emissions・Fuel: Lion calculates emissions according to the calculation standards set by the Australian and New Zealand
governments.All other manufacturing sites calculate emissions according to the calculation standards in Japan’s Act on Promotion of Global Warming Countermeasures and Act on Rationalizing Energy Use.
・Electricity: Calculated by multiplying the amount of purchased electricity by the CO2 emission factors published by the individual power companies (or, if there are no published figures, by the country-specific emission factors published by the IEA).
・Greenhouse gas emissions include the greenhouse gas emissions from sold electricity.*2 Companies included in calculations: Kirin Brewery, Kirin Distillery, Kirin Group Logistics, Kirin Beverage, Shinshu Beverages,
Mercian, Daiichi Alcohol, and Kirin
Scope1 Scope2406,181 593,877
Categories 2017
Scope1 372
Scope2 575
Scope3
4,213,387
Upstream
1 Products and services purchased 2,549,052
2 Capital goods 0
3 Fuel and energy-related activities not included in Scopes 1 and 2 145,275
4 Transportation and delivery (upstream) 362,071
5 Waste from operations 37,194
6 Business travel 10,145
7 Employee commuting 10,107
8 Leased assets (upstream) 0
Downstream
9 Transportation and delivery (downstream) 941,234
10 Processing of sold products 0
11 Use of sold products 32,958
12 Disposal of sold products 125,352
13 Leased assets (downstream) 0
14 Franchises 0
15 Investments 0
Total greenhouse gas emissions from the entire value chain 5,160
Reduction rate (compared to 1990 base year) +3.3%
Progress toward Mid-Term Greenhouse Gas Emission Reduction Targets Through SBTs*3 (2017)See P. 90 for calculation boundaries (Unit:thousand tCO2e)
*3 30% reduction by 2030 compared to 2015 levels.
Env i ron m e n t a lS t ra teg y
Env i ron m e n t a lDa t a
Ac t i v i t y■Biological Resources ■Water Resources ■Containers and Packaging ■Global Warming ■Environmental management

98
Annual electricity consumption(Unit: kWh/year)
2012 873
2013 804
2014 726
2015 708
2016 724
Trend in annual electricity consumption per one can and bottle vending machine shipped
Biogas electricity generated(Unit: million kWh)
Biogas generated(Unit: thousand Nm3)
2013 20.7 9,237
2014 19.9 8,588
2015 19.6 8,967
2016 21.2 8,593
2017 16.0 7,278
Trends in biogas electricity and biogas generated at Kirin Brewery plans
Source: Japan Vending Machine Manufacturers Association
Env i ron m e n t a lS t ra teg y
Env i ron m e n t a lDa t a
Ac t i v i t y■Biological Resources ■Water Resources ■Containers and Packaging ■Global Warming ■Environmental management

99
Methanol AcetoneSubstances
subject to PRTR Act
Ethyl acetate, etc. Total
2013 338 51 41 63 494
2014 373 33 64 138 608
2015 376 32 57 105 570
2016 324 21 55 88 488
2017 417 21 62 97 596
Volume of waste generated
(thousand t)
Volume disposed on site
(thousand t)
Volume of recycled waste(thousand t)
Final disposed volume
(thousand t)
recycling rates(%)
2013 226 21 204 0.5 99.8
2014 244 20 224 0.4 99.8
2015 228 14 213 0.5 99.8
2016 237 17 219 0.4 99.8
2017 243 24 219 0.6 99.7
NOx SOx2013 341 64
2014 275 53
2015 271 71
2016 442 64
2017 431 95
Trends in emissions of VOCs (Japan Pharmaceuticals and Bio-chemicals Businesses) (Unit:t)
Trend in emissions of air pollutantsTrends in emissions of NOx and SOx (entire Group) (Unit:t)
Trends in volume of waste generated and recycling rates (Japan)
Japan Integrated Beverages Business
Overseas Integrated
Beverages Business
Pharmaceuticals and Bio-chemicals
BusinessesOther Businesses Total
195(45.7)
158(37.0)
73 (17.1)
1 (0.2)
427(100.0)
Volume of waste generated(2017) (Unit: thousand tons. Figures in brackets: %)
Reduction of waste and prevention of pollution
Env i ron m e n t a lS t ra teg y
Env i ron m e n t a lDa t a
Ac t i v i t y■Biological Resources ■Water Resources ■Containers and Packaging ■Global Warming ■Environmental management

100
Status as of June 2018
Japan*
Overseas
Number of business locations
Number of independently certified business locations 18
Number of business locations making self-declaration of conformity 17
Number of business locations with self- management 1
Number of business locations
Number of certified business locations 27
Number of certified-equivalent business locations 14
* For integrated certification, head office and manufacturing plants are calculated as one business location.
Status of Environmental Management Certifications
Env i ron m e n t a lS t ra teg y
Env i ron m e n t a lDa t a
Ac t i v i t y■Biological Resources ■Water Resources ■Containers and Packaging ■Global Warming ■Environmental management

101
GRI Contents Index Standard
Disclosure matters Page number or URL
GRI 102
102-1 P. 5
102-2 P. 5https://www.kirinholdings.co.jp/english/company/business/index.html
102-3 P. 5
102-4 P. 5https://www.kirinholdings.co.jp/english/company/organization/index.html
102-5 P. 5
102-6
P. 5KIRIN REPORT 2018 p.5-6, 53-54 https://www.kirinholdings.co.jp/english/ir/library/integrated/pdf/report2018/kirinreport2018e.pdf
102-7
P. 5ESG Data Profilehttps://www.kirinholdings.co.jp/english/csv/esg_gri/esg.htmlKIRIN REPORT 2018 p.4-6, 53-54 https://www.kirinholdings.co.jp/english/ir/library/integrated/pdf/report2018/kirinreport2018e.pdf
102-8P. 5ESG Data Profilehttps://www.kirinholdings.co.jp/english/csv/esg_gri/esg.html
102-9 P. 12, 25, 35, 47, 61
102-10P. 3, 89-91ESG Data Notes https://www.kirinholdings.co.jp/english/csv/esg_gri/esg.html
102-11P. 12https://www.kirinholdings.co.jp/english/csv/governance/risk_management.html
102-12P. 77-80https://www.kirinholdings.co.jp/english/csv/sustainability/gc.htmlhttps://www.kirinholdings.co.jp/english/csv/human_resources/promote.html
102-13P. 79https://www.kirinholdings.co.jp/english/csv/sustainability/gc.htmlhttps://www.kirinholdings.co.jp/english/csv/alcohol/policies.html
This report uses the following disclosure matters of the GRI Standard 2016 as reference.
GRI Contents Index Standard
Disclosure matters Page number or URL
GRI 102
102-14
P. 4, 6-7https://www.kirinholdings.co.jp/english/csv/story/https://www.kirinholdings.co.jp/english/ir/library/integrated/2016/message01.html
102-15P. 12, 14-15, 23, 33, 40-41, 75-76https://www.kirinholdings.co.jp/english/ir/policy/risks.htmlhttps://www.kirinholdings.co.jp/english/csv/materiality/
102-16 https://www.kirinholdings.co.jp/english/company/philosophy/https://www.kirinholdings.co.jp/english/csv/governance/compliance.html
102-18
P. 71-74ESG Data Governance https://www.kirinholdings.co.jp/english/csv/esg_gri/esg.htmlhttps://www.kirinholdings.co.jp/english/ir/policy/management.html
102-40 P. 77-80https://www.kirinholdings.co.jp/english/csv/sustainability/stakeholder.html
102-41 ESG Data Employees https://www.kirinholdings.co.jp/english/csv/esg_gri/esg.html
102-42 P. 77-80https://www.kirinholdings.co.jp/english/csv/sustainability/stakeholder.html
102-43 P. 77-80https://www.kirinholdings.co.jp/english/csv/sustainability/stakeholder.html
102-44 P. 78https://www.kirinholdings.co.jp/english/csv/sustainability/stakeholder.html
102-45 P. 3https://www.kirinholdings.co.jp/english/company/organization/index.html
102-46 P. 10-13
102-47 P. 12-13
102-49 ESG Data Notes https://www.kirinholdings.co.jp/english/csv/esg_gri/esg.html
102-50 P. 3
102-51 June 2017
GRI Contents Index
Env i ron m e n t a lS t ra teg y
Env i ron m e n t a lDa t a
Ac t i v i t y■Biological Resources ■Water Resources ■Containers and Packaging ■Global Warming ■Environmental management

102
GRI Contents Index Standard
Disclosure matters Page number or URL
GRI 102
102-52 Year
102-53 Back cover
102-54 P. 3
102-55 P. 101-102
102-56 P. 103
BiologicalResources
GRI 103
103-1 P. 12-13, 14, 22, 23, 25
103-2 P. 13, 14, 16-17, 21, 23-25
103-3 P. 21, 23-25
GRI 304
304-2 P. 6-7, 26-29
304-3 P. 30
304-4 P. 27, 30
WaterResources
GRI 103
103-1 P. 12-13, 14, 32, 33, 35
103-2 P. 13, 14, 16-17, 21, 33-35
103-3 P. 21, 33-35
GRI 303
303-1 P. 34, 42, 92, 93
303-2 P. 33, 91
303-3 P. 92, 93
ContainersandPackaging
GRI 103
103-1 P. 12-13, 15, 44, 45, 47
103-2 P. 13, 15, 16-17, 21, 45-47
103-3 P. 21, 45-47
GRI 301
301-1 P. 92, 94
301-2 P. 46, 47, 48, 51, 94
301-3 P. 94
GRI Contents Index Standard
Disclosure matters Page number or URL
GlobalWarming
GRI 103
103-1 P. 12-13, 15, 58, 59, 61
103-2 P. 13, 15, 16-17, 21, 59-61
103-3 P. 21, 59-61
GRI 302
302-1 P. 67, 92, 95
302-2 P. 98
302-4 P. 92, 95
GRI 305
305-1 P. 67-68, 89-90, 95-97
305-2 P. 67-68, 89-90, 95-97
305-3 P. 67, 90, 96-97
305-4 P. 68, 95
305-5 P. 60, 67-68, 95-96
305-6 P. 82
305-7 P. 82, 92, 99
Wasteandpreventionofpollution
GRI 103
103-1 P. 81-82
103-2 P. 81-82
103-3 P. 81-82
GRI 306306-1 P. 35, 39, 82, 92, 93
306-2 P. 81, 92, 99
GRI 307 307-1 P. 74
Supplychain
GRI 103
103-1 P. 12-13
103-2 P. 13, 16-17
103-3 P. 21
GRI 308 308-2 P. 6-7, 14, 17, 21, 22-29, 83-84
Env i ron m e n t a lS t ra teg y
Env i ron m e n t a lDa t a
Ac t i v i t y■Biological Resources ■Water Resources ■Containers and Packaging ■Global Warming ■Environmental management

103
Independent Assurance Report
Env i ron m e n t a lS t ra teg y
Env i ron m e n t a lDa t a
Ac t i v i t y■Biological Resources ■Water Resources ■Containers and Packaging ■Global Warming ■Environmental management

Contact Ushttp://www.kirinholdings.co.jp/english/customer/