environmental profile for the west bank · 2013-12-04 · bassam sha'lan tulkarm profile...
TRANSCRIPT

Environmental Profile for The West Bank Volume 8:
Tulkarm District Applied Research Institute - Jerusalem
1996
Table of Contents
• = Project Team • = Acknowledgment • = List of Tables • = List of Figures & Photographs • = List of Acronyms & Abbreviation • = Units of Measurement • = Introduction • = PART ONE: General Features of Tulkarm District
o Chapter One: Location and Landuse o Chapter Two: Topography and Climate o Chapter Three: Socio-economic Characteristics o Chapter Four: Geology and Soil o Chapter Five: Water Resources o Chapter Six: Agriculture o Chapter Seven: Historical and Archeological Sites
• = PART TWO: Environmental Concerns in Tulkarm District o Chapter Eight: Wastewater o Chapter Nine: Solid Waste o Chapter Ten: Air and Noise Pollution
• = References • = Appendices
o Appendix 1 o Appendix 2 o Appendix 3

Project Team Dr. Jad Isaac Violet Qumsieh
Project Leader Project Coordinator Bassam Sha'lan Tulkarm Profile Coordinator
Contributors to this volume Maher Owewi M.Sc., Remote Sensing Nader Hrimat M.Sc., Plant Production Walid Sabbah M.Sc., Hydrogeology Nizar Quttosh B.Sc., Biology
Deema El Hodali B.Sc., Chemistry Mohammad Abu Amrieh B.Sc.,Agricultural Engineering
Faten Al-Juneidi B.Sc., Soil and Irrigation Akram Halayka B.Sc., Geology Roubina Bassous B.Sc., Biology Faten Neiroukh B.Sc., Plant Protection
Osama Sleibi B.Sc.,Chemical Engineering Safinaz Bader B.Sc., Soil and Irrigation
Nadia Al-Dajani B.Sc., Biology Technical Support Team
Leonardo Hosh M.Sc.,International Agricultural Development Isam Ishaq M.Sc., Communication
Hanna Maoh B.Sc., Physics Issa Zboun GIS Technician
Jamil Shalaldeh GIS Technician Fuad Isaac GIS Technician
Thamin Hijawi B.Sc., Agricultural Engineering Shadi Hannuneh GIS Technician
Maurice Nur GIS, Map Analysis Nisreen Mansour Secretary
Acknowledgment The Applied Research Institute - Jerusalem (ARIJ) would like to thank the Federal Government of Austria, Department of Development Cooperation for their funding of this project through the Society for Austro-Arab Relations (SAAR). ARIJ also thanks the Palestinian officials at the municipalities, towns and village councils; the United Nations Relief and Work Agency (UNRWA); owners and managers of industrial facilities; and the officers of agricultural and weather stations for their assistance and cooperation with the project team members during the data collection phase of the project.

List of Tables • = Table 1.1: Israeli Settlements in the Tulkarm
District • = Table 1.2: Landuse Classification in the Tulkarm
District • = Table 2.1: Average Climatic Parameters for the
Tulkarm District from 1980 to 1995 Adapted from Tulkarm Meteorological Station
• = Table 3.1: Living Conditions Comparison Between the Tulkarm District and other West Bank Districts excluding Jerusalem
• = Table 3.2: The Percent Distribution of Individuals over 18 Years Old in the Tulkarm District
• = Table 3.3: Male/Female Distributions with Ages More Than 18 Years in the Tulkarm District
• = Table 3.4: Distribution of Students by Educational Level and Gender(1994/95)
• = Table 4.1: Major Soil Types and Characteristics in the Tulkarm District
• = Table 5.1: Basic Details on Municipal Wells of Tulkarm and Qalqiliya
• = Table 5.2: Water Extraction from Tulkarm and Qalqiliya Municipal Wells in 1995 (cubic meters)
• = Table 5.3: Water Supply and Demand in MCM Based on 1990 Baseline Data
• = Table 5.4: Main Reservoirs and their Capacities • = Table 5.5: Tariffs of Water in Tulkarm and
Qalqiliya Municipalities • = Table 6.1: Farm Holding Size of Irrigated Farms in
the Tulkarm District • = Table 6.2: Distribution of the Irrigated Areas under
Various Methods of Irrigation in the Tulkarm District, 1993/94
• = Table 6.3: Crop Water Requirements (CM/ha/season) for the Main Irrigated Crops in the Tulkarm District
• = Table 6.4: Crop Water Requirements for Various Crops in the Tulkarm District for the 1993/94 Growing Season
• = Table 8.1: Relative Contribution to the Total Daily Per Capita Wastewater Production
• = Table 8.2: Characteristics of Raw Wastewater for Tulkarm City

• = Table 8.3: Estimated Percentage of the Various Industrial Wastewater Disposal Methods
• = Table 9.1: Distribution of Responsibilities of Domestic Solid Waste Management
• = Table 9.2: Solid Waste Management and Estimated Generated Waste in the Tulkarm District
• = Table 9.3: Labor Work in the Solid Waste Management at Various Municipalities in the Tulkarm District
• = Table 9.4: Solid Waste Composition in the Tulkarm District
• = Table 9.5: Distribution of Surveyed Industries in the Tulkarm District
• = Table 9.6: Types of Industries, No. of Factories Surveyed, Solid Waste and Liquid Waste Generated
• = Table 9.7: Disposal Methods of Industrial Solid Waste in the Tulkarm District
• = Table 10.1: Type and Number of Transportation Vehicles in the Tulkarm District
• = Table 10.2: Transportation Air Emission Inventories

List of Figures
Maps demonstrated in this publication were produced by the Geographic Information System (GIS) Unit at the Applied Research Institute - Jerusalem (ARIJ).
• = Figure 1: West Bank Districts • = Figure 1.1: Tulkarm District Location Map • = Figure 1.2: Tulkarm District Redeployment Areas
Map • = Figure 1.3: Tulkarm District Built-up Areas • = Figure 1.4: Tulkarm District Landuse Map • = Figure 2.1: Tulkarm District Digital Elevation
Model • = Figure 2.2: Tulkarm District Topographic Map • = Figure 2.3: Tulkarm District Three Dimensional
Topographic Map • = Figure 2.4: Tulkarm District Drainage System Map • = Figure 2.5: Variation of Average Monthly Rainfall
in Tulkarm City During the Period from 1961 to 1995 and in Qalqiliya City from 1979 to 1995
• = Figure 2.6: Rainfall Isohytal Map of the Tulkarm District
• = Figure 2.7: Variation of Annual Rainfall from 1952 to 1995 for Tulkarm City and from 1978 to 1995 for Qalqiliya City
• = Figure 2.8: Variation of Average Monthly Humidity for the Tulkarm district from 1980 to 1995
• = Figure 2.9: Variation of Average Monthly Temperature from 1980 to 1995 at Tulkarm Weather Station
• = Figure 2.10: Variation of Average Wind Speed from 1992 to 1995 at Tulkarm Weather Station
• = Figure 4.1: Tulkarm District Geological Map • = Figure 4.2: Tulkarm District Soil Map • = Figure 5.1: Location Map of Groundwater Wells in
the Tulkarm District • = Figure 5.2: Presentation of Hydrochemical Data on
Wilcox Diagram for the Tulkarm District • = Figure 5.3: Electrical Conductivity (EC) Contour
Map of Groundwater in the Tulkarm District • = Figure 5.4: Chloride Concentration Contour Map of
Groundwater in the Tulkarm District • = Figure 5.5: Nitrate Concentration Contour Map of
Groundwater in the Tulkarm District

• = Figure 5.6: Total Dissolved Solids Contour Map of Groundwater in the Tulkarm District
• = Figure 5.7: Water Network in Tulkarm City • = Figure 5.8: WaNetwork in Qalqiliya City • = Figure 6.1: Total Area and Production of Various
Crops in the Tulkarm District for the 1993/94 Growing Season
• = Figure 6.2: Total Area and Production of Vegetable Crops in the Tulkarm District for the 1993/94 Growing Season
• = Figure 6.3: Distribution of the Cultivated Vegetable Crops and their Production under Various Cropping Systems in the Tulkarm District for the 1993/94 Growing Season
• = Figure 6.4: Total Area and Production of Fruit Trees in the Tulkarm District for the 1993/94 Growing Season
• = Figure 6.5: Total Area and Production of Various Field Crops and Forages for the Tulkarm District in the 1993/94 Growing Season
• = Figure 6.6: Pesticide Usage for Various Planted Crops in the Tulkarm District for the 1993/94 Growing Season
• = Figure 6.7: Number of Cattle in the Tulkarm District According to Sex and Rearing Stage for the 1994
• = Figure 8.1: Sewer Network in Tulkarm City • = Figure 8.2: Sewer Network in Qalqiliya City • = Figure 9.1: Tulkarm District Dumping Sites
List of Photographs
• = Photo 1: Wastewater Treatment Plant for Tulkarm City
• = Photo 2: Wastewater Discharged to the Wadis in the Tulkarm District
• = Photo 3: Tulkarm City Dumping Site • = Photo 4: Solid Waste in Tulkarm City Dumping Site • = Photo 5: Solid Waste Generated from Quarries near
Tulkarm City • = Photo 6: Air Pollution at Tulkarm City Dumping
Site
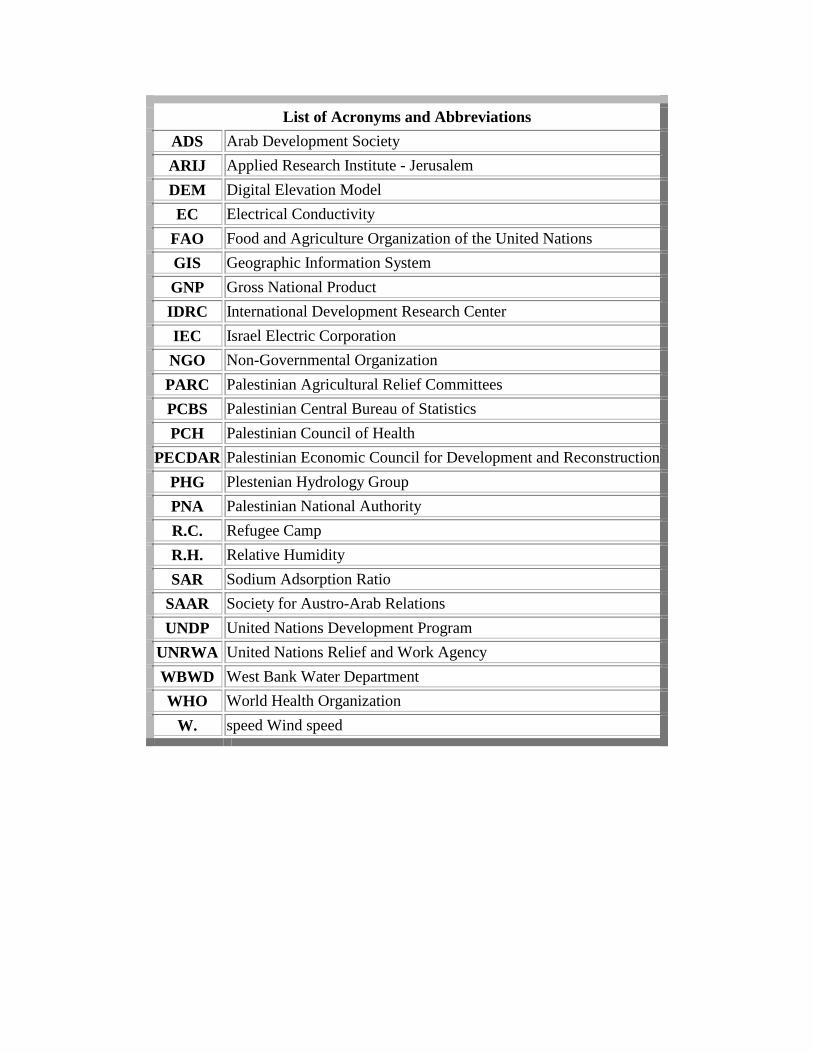
List of Acronyms and Abbreviations ADS Arab Development Society ARIJ Applied Research Institute - Jerusalem DEM Digital Elevation Model EC Electrical Conductivity
FAO Food and Agriculture Organization of the United Nations GIS Geographic Information System GNP Gross National Product IDRC International Development Research Center IEC Israel Electric Corporation NGO Non-Governmental Organization PARC Palestinian Agricultural Relief Committees PCBS Palestinian Central Bureau of Statistics PCH Palestinian Council of Health
PECDAR Palestinian Economic Council for Development and Reconstruction PHG Plestenian Hydrology Group PNA Palestinian National Authority R.C. Refugee Camp R.H. Relative Humidity SAR Sodium Adsorption Ratio
SAAR Society for Austro-Arab Relations UNDP United Nations Development Program
UNRWA United Nations Relief and Work Agency WBWD West Bank Water Department WHO World Health Organization
W. speed Wind speed

Units of Measurement oC degrees centigrade
CM cubic meter Gwh giga watt hour
m meter ha hectare kg kilograme km kilometer km2 square kilometer (100 hectares)
KWh kilowatt hour l litter
MCM Million Cubic Meters MJ Mega Joul ppm parts per million ppmv parts per million by volume
dunum 0.1 hectare watt/m2 wats per square meter
mb millibar µS/cm micromohs per centimeter

Introduction The West Bank is the part of Palestine which was occupied by Israel during the 1967 war. Until 1995, Israelis have been in full control of the natural resources in the West Bank which resulted in substantial distortion of the Palestinian social and economic bases, as well as critical physical and ideological fragmentation of the Palestinian human resource base. Following the initiation of the Middle East peace process in Madrid in 1991 and the subsequent Oslo agreements between the PLO and Israel, Palestinians are negotiating to have the right to control the natural resources in Palestine. According to these agreements, they divided the West Bank land into Palestinian urban built-up areas (area A) which represents of the main cities of the West Bank. Area B, represents Palestinian rural built-up areas and area C, which represennts the rest of the West Bank.
The Palestinian National Authority (PNA) does not enjoy full sovereignty over land, people and natural resources. This situation leads to a lack of directing and coordinating between Palestinians towards the achievement of their national goals and aspirations. The PNA has full control only on 2.7% of the West Bank land (Area A) while the rest of the land is still under Israeli control (Areas B and C). In Area B which represents about 22.91% of the West Bank, the civil administrations were transferred to the Palestinians while the land is still under Israeli control. In Area C, about 74.34% of the West Bank area is still under full control of the Israeli military forces.
Most of the Palestinian groundwater resources from the West Bank are taken up by Israel and Israeli colonies, causing water shortage for the Palestinians. In the West Bank, Israelis use 485 MCM from the Palestinian aquifers per year, while Palestinians use only 115 MCM of their own water. Israeli restrictions have drastically limited the water available to irrigate Palestinian lands and thus, today less than six percent of the land cultivated by Palestinians in the West Bank is under irrigation, the same proportion as in 1967 (Isaac, 1994). Not only that, but Israelis are restricting the expansion of Palestinian cities, towns and villages to meet the natural population growth and development, and, at the same time, confiscating Palestinian land for colonies and by-pass roads. The West Bank presently parceled into isolated cantons which are disconnected from each other; a situation similar to islands dispersed in an ocean.
Moreover, in 1993, Israeli government started confiscating large areas of the West Bank land near the greenline to construct industrial parks. Until January 1995, approximately 11,400 dunums of land had been confiscated for this purpose. Quarries were also established by the Israelis inside the West Bank area. In the Tulkarm district, 9200 dunums of land were confiscated for this purpose (LAWE, 1995).
All of these actions in addition to insufficient Palestinian environmental awareness create many environmental problems in the West Bank, starting from groundwater pollution and shortage, to wastewater collection and treatment, solid waste collection and disposal, pesticide usage and air pollution.
The Applied Research Institute-Jerusalem (ARIJ) has launched a two-year program with the support and assistance of the Federal Government of Austria, Department for Development and Cooperation, through the Society of Austro-Arab Relations (SAAR). Through surveys and field research, ARIJ has developed a database on the environmental situation in the West Bank integrated with the Geographic Information System (GIS). ARIJ is presenting its findings through "environmental profiles" for each of the districts. These profiles discuss the district's geology, soil, agricultural practices, water use, wastewater and solid waste generation and management and air and noise pollution, in addition to historical, socio-economic and demographic information. It is the desire of ARIJ that this environmental profile of Tulkarm, as well as the other profiles, will assist in future environmental planning and protection of the fragile environment of the West Bank.

Chapter One
Location
Tulkarm district is located in the north western part of the West Bank. It is bounded by the Jenin and Nablus districts in the north, west and south and by the 1948 cease-fire line in the east (See Figure 1.1). The district lies between 40 to 500 m above sea level and is entirely within a fertile zone. This explains the regional high population density in comparison with other districts. Population density in the Tulkarm district is about 583 person/km2 while in Ramallah, Hebron and Bethlehem districts it is 209, 245 and 230 person/km2 respectively.
Tulkarm is the largest city in the district and lies at one of the most accessible gateways from the Tulkarm plain to the Nablus hills. It is located at the intersection of the north-south arteries of the Haifa-Lod railroad and motor road, both running along the western edge of the hills with the west-east highway leading from the coast to Nablus. The rich farmlands of the surrounding area have contributed to its development.
Archeological finds reveal that an agglomeration has existed here at least since the Roman Period. Tulkarm's name has its roots in the Aramaic Tur Karma (Vine- yard Hill), which was used by the Samaritan inhabitants of the Middle Ages and by the Crusaders. In the past, Tulkarm has assumed the form of a small village but it has been expanding since the beginning of the 20th century with an increase in the traffic passing through. This development came to a halt in the 1930's with the construction of the Petah Tiqva-Hadera high way, which bypasses the town in the west. Despite the fact that Israel-Jordan armistice border of 1949 encircled Tulkarm in the southwest, west and north-west, the town population has increased considerably and became an administrative center while farming in its surroundings has intensified. The town has an agricultural school established since the British Mandatory Government with a monetary contribution by the philanthropist J.S. Kadoorie. Nowadays, it is recognized as a prominent community college in agriculture and training of teachers.
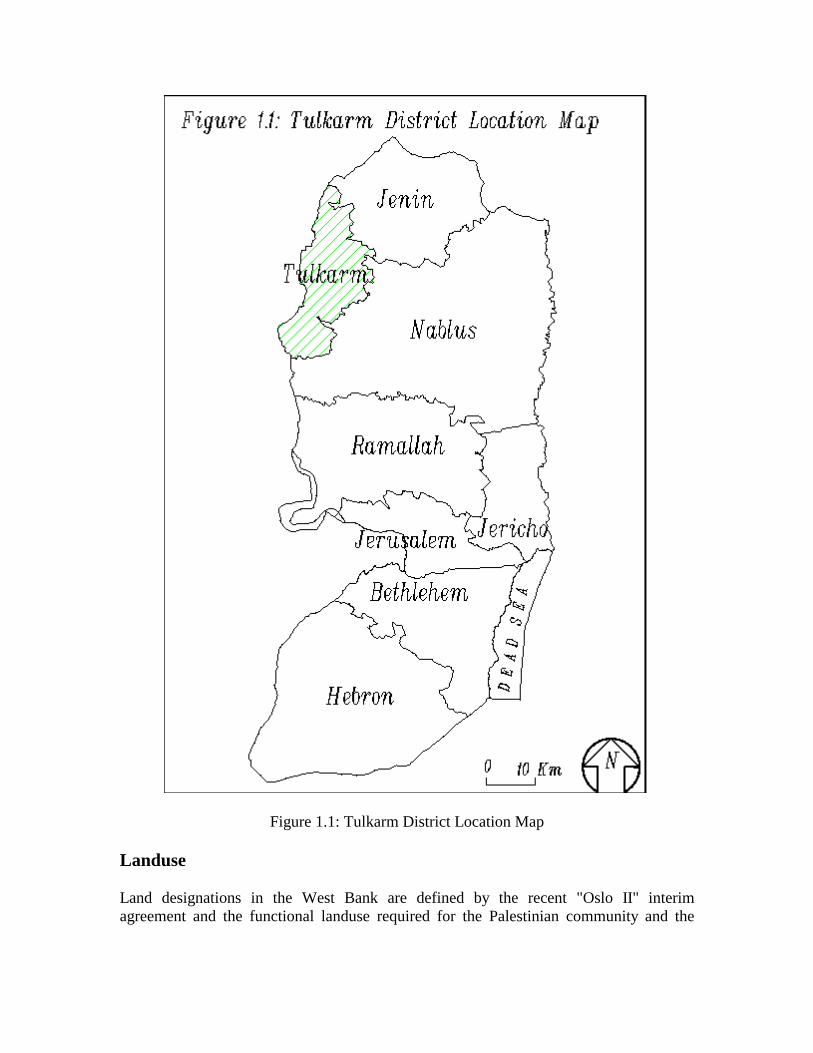
Figure 1.1: Tulkarm District Location Map
Landuse
Land designations in the West Bank are defined by the recent "Oslo II" interim agreement and the functional landuse required for the Palestinian community and the

Israelis who still occupy and control a large area in the West Bank. Land availability determines the Palestinians' potential to sustain the development of their community.
The "Oslo II" interim agreement between the Palestinians and Israelis has divided the West Bank land into three areas, A, B and C, which are differentiated by different levels of control by the Palestinians. Accordingly, the populated Palestinian cities representing 2.75% of the total area of the West Bank (15,992.45 ha), are completely under Palestinian control (Area A). Hebron City is still occupied by Israel and the Israeli redeployment faces difficulties imposed by the Israeli governments. Area B, which includes most Palestinian villages and small towns, covers 22.91% of the total area of the West Bank (133,407.2 ha). Palestinians now have full control of civil administrations except that Israel continues to have overriding responsibility for security. Area C covers the remaining land (74.34%), including some Palestinian built-up areas as well as Israeli settlements and military outposts (432,794.88 ha). In this area, Palestinians have responsibility for civil life such as economy, health and education, however, Israel retains control over security and power related to territory. During the further redeployment phases, powers and responsibilities in Area C will be gradually transferred to the Palestinians, the transfer to be completed within 18 months of the inauguration of the Palestinian Council. However, the recent changes in political leadership in Israel delayed further Israeli redeployment in the West Bank.
Presently, the Palestinian National Authority (PNA) is not able to assume complete sovereignty over Palestinian land, and the division of the Palestinian territories into A, B and C hinders the potentials of dealing with the Palestinian areas as a whole geographic integrity as an essential ingredient for sound environmental management.
The Tulkarm district covers approximately 33,453 hectares, comprising 5.7% of the West Bank and 5.4% of Palestine (Gaza Strip and West Bank). Currently, only 5.39% of the Tulkarm district contains Palestinian built-up areas, while approximately 2.73% is taken up by Israeli settlements, nature reserves, forests and military bases. The Tulkarm district area is divided by the "Oslo II" interim agreement as follows:
Area A, which includes Tulkarm and Qalqiliya cities in addition to Tulkarm Refugee Camp, covers 1,015.5 hectares (3.0%) of the district's land (See Figure 1.2). Since October 1995, the Israeli army has withdrawn from this area, and all responsibilities for internal security and public order are presently held by Palestinians.

Figure 1.2: Tulkarm District Redeployment Areas Map
Area B is the populated villages, camps and built-up area of the hamlets, as shown in Figure 1.2. It accounts for approximately 11,702.7 hectares (35.0 % of the total area of the district).
Area C, which covers 62.0 % of the district's land, includes areas of Israeli settlements, closed military areas, military bases and vacant Palestinian lands.
The landuse patterns in this district are greatly influenced by the topography, climate and the political conflict over land and natural resources. Such factors affect the distribution of nature reserves, cultivated areas, urban areas, road construction and other land uses. For simplicity, the landuse patterns in this chapter are classified into ten main categories: Palestinian builtup areas, Israeli colonies, military bases, nature reserves, forests, cultivated areas, industrial areas, dumping sites, quarries and roads (See Figures 1.3 and 1.4).

Figure 1.3: Tulkarm District Built-Up Areas

Figure 1.4: Tulkarm District Landuse Map
Palestinian Built-up Areas
There are 55 Palestinian builtup areas in the district, occupying approximately 1,082.5 hectares of the district's lands. Tulkarm, Qalqiliya, A'nabta, A'ttil, Deir El Ghusun, A'llar and Qaffin are the only communities designated as municipalities. Other built-up areas are governed either by village council or village mukhtar. In addition, Tulkarm and Nur Shams Camps are the two refugee camps located in the district. Due to the restrictions imposed by the Israelis on granting building permits to Palestinians, the Palestinian built-up areas are very limited and comprise only 5.39% of the Tulkarm district area thus leading to a subsequent living density of 10,811 person/km2. However, if the whole areas, A and B, are considered as a Palestinian built-up areas then population density will become 1,533 person/km2, which is still high in comparison with the population density in Israel which is estimated at 248.5 person/km2 (Israel Yearbook and Almanac, 1996). Figure 1.3 shows the distribution and names of the various built-up areas in the district. These areas are mainly located on more than one soil associations such as brown and pale rendzinas soils, terra rossa and grumusols soils. These soil types are considered suitable for agricultural purposes.
Israeli Colonies
There are eight Israeli colonies in the Tulkarm district, occupying approximately 317 hectares of the district's land (0.95% of the total district's area). Zofim, Alfe Menashe, Ma'ale Shamron, Avne Hafez, Saltt, E'nav, Mevo Horon and Ya'arit are Israeli colonies distributed over the entire district. During the past two years, there has been a gradual and progressive expansion in the Israeli colonies. Table 1.1 shows the name, type, establishment date, number of families and number of houses for the colonies in the Tulkarm district and Figures 1.3 and 1.4 show the distribution of these colonies.
Military Bases
There are two Israeli military bases in the district with a total area of about 7.5 hectares (0.02% of the total area). The military bases are located near Ektaba and to the west of A'nabta on the following soil associations:
1. Grumusols, which is suitablefor agricultural purposes, and 2. Terra rossa, brown and pale rendzinas, which are the most suitable soils for
agricultural purposes.

Nature Reserves
Experience has shown that many stretches of land which are confiscated for nature reserves became with time Israeli colonies. Hence, there is a serious doubt about the true environmental significance of the currently declared nature reserves. Currently, Israel has declared one nature reserve in the Tulkarm district with a total area of almost 173.5 hectares (0.52% of the Tulkarm district area).
Table 1.1: Israeli Settlements in the Tulkarm District
Name Type Establishment Date Pop. Number of
Families
Projected Number of Families
Zofim 1990 444 111 3200 Alfe Menashe Meden 1983 3000 700 3500
Ma'ale Shamron Residential 1980 400 100 260
Avne Hafez Meden 1990 100 30 4500
Saltt Residential 1979 300 85 160 E'nav Residential 1981 220 55 700 Mevo Horon 1969 240 60 105
Ya'arit - - - - - Source: Tufakji, 1994; Ester Goldberg, 1993
Forests
There are six forests in the district, with a total area of about 414.6 hectares (1.24% of the total area). Most of these forests are located on fertile soil types (terra rossa, brown rendzinas and pale rendzinas).
Cultivated Areas
These are described in more detail in Chapter 6. Table 1.2 summarizes landuse classification in the Tulkarm district according to ARIJ's definition.

Industrial Areas
There is one industrial park in the Tulkarm district. It is located in the northern part of Tulkarm City with an area of 55 ha.
Dumping Sites
There are 12 dumping sites in the district; these are described in more detail in chapter 9 and Table 9.2 in appendix 2.
Quarries
There are four quarries in the district; these are described in more detail in chapter 9.
Roads
As of 1993, there has been 70 km of main roads and 202 km of secondary roads. These include the external roads that connect the cities with the nearby villages. Another road system is currently being constructed by Israel in the West Bank area. These known as, bypass roads, are designed to link Israeli settlements in the West Bank with each other and with Israel. For this purpose, the Israeli authorities are confiscating thousands of hectares of Palestinian land. The geographical location of the bypass roads are designed in a way that will hinder the future expansion of the Palestinian builtup areas and divide Tulkarm district into cantons (Figure 1.3). The existing bypass roads passing through the Tulkarm district have a total length of nine kilometers and further 43 km of by-pass roads are proposed (ARIJ, GIS unit). In comparison with by-pass roads and Israeli roads, Tulkarm district's road network is in poor condition and has not been expanded or maintained for many years.
In brief, the landuse patterns in the Tulkarm district show inefficiency in the use of land and environmental resources. To allow optimum utilization of land resources, the PNA should enjoy full sovereignty over land and its resources. Because of the Israeli restrictions on land, both Palestinians built-up areas and Israeli settlements are built on lands of extremely rich soil for cultivation. This has led to the spread of built-up areas and industries at the cost of agricultural land, thus reducing its size. The overcrowding and lack of permits for Palestinians to build in major parts of the district have led to inefficient use of natural resources.

Table 1.2: Landuse Classification in the Tulkarm District
Landuse Area(ha) % of LandPalestinian Builtup Areas 1,802.5 5.39 Israeli Settlements 317.0 0.95 Military Bases 7.5 0.02 Industrial Park 55.0 0.16 Nature Reserves 173.5 0.52 Forests 414.6 1.24 Cultivated Areas 12,810.5 38.30 Others* 17,872.4 53.42 Total 33,453.0 100.00 * Unused land or land used for grazing
To mitigate the current situation, it is extremely urgent that Israel opens the Israeli-declared closed military areas, making them accessible to Palestinians. Restrictions imposed on building areas should be lifted and granting of building permits should be based on scientific grounds rather than on political ambitions. Negotiations about the final situation of the Palestinian areas should be started as soon as possible and Palestinians need access to what is now identified as public land and absentee land, as well as much of the land that has been closed for military purposes.

Chapter Two Topography and Climate
Topography
A digital elevation model (DEM) containing Z-value with pixel size of 100 m is created for the Tulkarm district. This model is constructed, using the finite difference technique of the Topographer Model of the Pamap GIS software version 4.2. The finite difference technique is considered to be suitable for using trend data as the input data. The data represent the overall shape of the terrain. It is usually contour lines but can also be three dimensional lines with varying elevation.
Figure 2.1 represents the produced DEM which is themed using the threshold table with an interval of 100m. Themes are colored values that give a quick and effective method for identifying features and areas that meet specified criteria. The Threshold table simply tells the GIS software which color to use when displaying certain pixels.

Figure 2.1: Tulkarm District Digital Elevation Model
A contour map based on the created digital elevation model is constructed with a contour interval of 100m (See Figure 2.2). The highest point is 500m above sea level at Ras Rashin northeast of Rummana Village while the lowest elevation is 40m above sea level one kilometer southeast of Qalqiliya City near the Israeli border.

Figure 2.2: Tulkarm District Topographic Map
A three-dimensional model for the Tulkarm district is created using the Grid model of the surfer GIS software version 5.01 (See Figure 2.3). The view face to the southwest and an

exaggeration factor of 10 is used. The basic use of this module is for landuse planning, analysis and modeling.
Figure 2.3: Tulkarm District Three Dimensional Topographic Map
The Tulkarm district lies on the western slopes of the West Bank, which are characterized by gentle slopes and have elevation ranges between 40 to 500 meters above sea level. There are many wadis located in the district such as Wadi Abu Nar, Wadi Ammar, Wadi el Burj, etc. Figure 2.4 shows the drainage system (wadis) in the district.

Figure 2.4: Tulkarm District Drainage System Map

Climate
The climate of the Tulkarm district is of a Mediterranean type with moderate summers and warm winters. Table 2.1 shows the average climatic parameters for the Tulkarm district from 1980-1995, recorded from Tulkarm Weather Station.
Precipitation
The rainy season in the Tulkarm district usually starts in October and continues through May. Between December and February, almost 70% of annual rainfall occurs, while 20% of annual rainfall occurs in October and November. December and January are normally the wettest months in the Tulkarm district. Rain in June and September is rare and comes to negligible amounts. July and August have no rain at all, except for one rainfall of 1.5mm on July 10, 1995 in Tulkarm City (Tulkarm Agricultural Department).Figure 2.5 shows the variation of average monthly rainfall in Tulkarm during the period from 1961 to 1995 and in Qalqiliya City from 1979 to 1995.
Figure 2.5: Variation of Average Monthly Rainfall in Tulkarm City During the Period from 1961 to 1995 and in Qalqiliya City from 1979 to 1995
The mean annual rainfall in the Tulkarm City is 641.7mm for the period from 1952 to 1995 (Tulkarm Agricultural Department). In Qalqiliya City, the mean annual rainfall was 570.4 mm during the period from 1978 to 1995 (Qalqiliya Agricultural Department). Figure 2.6 shows rainfall distribution in the Tulkarm district.

Figure 2.6: Rainfall Isohytal Map of the Tulkarm District
The amount of mean annual rainfall in the Tulkarm district varies from year to year and rain may fall with great intensity in wet years. For instance, in February 24, 1992, 123mm of rain was recorded in Tulkarm City and 116mm in Qalqiliya City. The winter season of 1991/1992 experienced the highest recorded rainfall, when the annual rainfall registered was 1,386mm in 78 days in Tulkarm City and 1,365.4mm distributed over 57 days in Qalqiliya City. Such rains are apt to cause erosion due to the high rainfall intensity, in comparison with 339.3 mm distributed over 46 days in 1978/1979 in Tulkarm City. Figure 2.7 shows the variation of annual rainfall from 1952 to 1995 for Tulkarm City and from 1978 to 1995 for Qalqiliya City.

Figure 2.7: Variation of the Annual Rainfall from 1952 to 1995 for Tulkarm City and from 1978 to 1995 for Qalqiliya City
There is no available data on a hail in the Tulkarm district, but hail associated with thunderstorms can occur in Tulkarm district, mostly in midwinter. This hail is liable to cause damage principally to vegetables and ripening oranges (Orni, E. 1980).
Dew
There is no available data on the amount of dew fall in the Tulkarm district. It is known, however, that dew is greater in the west, closer to the sea especially on windless nights when the soil grows colder than the air that touches its surface. In general, the coastal plain of Israel has an average of 200 nights of dew per year and the total annual dew fall in the region is estimated at 30mm (Orni, E. 1980).
Humidity
Humidity in the Tulkarm district reaches high values with an annual average of 69.6%. In winter, this value increases to an average of 75.9% in February while in May it reaches its lowest value of 62.4%. Summer months are humid with an average humidity of 70.3% from June to August. Figure 2.8 shows the variation of the average monthly humidity for the Tulkarm district from 1980 to 1995.

Figure 2.8: Variation of Average Monthly Humidity for the Tulkarm District from 1980 to 1995.
Temperature
The mean annual maximum temperature for the Tulkarm district is 22.3C and the mean annual minimum is 15.6C. Exposure to marine influences mitigates the temperature in the summer months especially at midday. The mean temperature from June to August is 25C. This value increases to an average of 26.2C in August (the hottest month). From 1992 until 1996, the highest maximum temperature measured was 41.4 °C at 2 pm on May 12, 1996.
In winter, the area is influenced by warm air from the sea. The average temperature from December to February is 11.8C. The coldest days of the year come in January with an average of 11C. Figure 2.9 shows the variation of mean monthly average temperature from 1980 to 1995 at Tulkarm Weather Station.

Figure 2.9: Variation of Average Monthly Temperature from 1980 to 1995 at Tulkarm Weather Station
Winds
In the Tulkarm district, the wind direction mainly lies between the southwest and northwest with mean annual wind speed of 3.4 km/hr. In winter, the district is influenced by the depressions passing from west to east over the Mediterranean. These depressions bring westerly rain bearing winds. The average wind speed from December to February is 4.1 km/hr.
In summer, the district is influenced by the sea breeze that comes from the west. The incoming sea breeze usually begins to be felt in the Tulkarm district in the morning. Towards noon, winds change their direction to southeast and later in the evening they turn to south and southwest. The average wind speed from June to August is 2.85 km/hr. In September and October, winds are more northerly with an average wind speed of 2.78 km/hr.
In spring, Khamaseen winds may blow over the area full of sand and dust. These winds cause rising temperatures and drop in humidity. The mean daily wind speed from April to June is 3.2 km/hr. Figure 2.10 shows the variation of average wind speed from 1992 to 1995 at Tulkarm Weather Station.

Figure 2.10: Variation of Average Wind Speed from 1992 to 1995 at Tulkarm Weather Station.
Table 2.1: Average Climatic Parameters for the Tulkarm District from 1980 to 1995 Adapted from Tulkarm Weather Station**
Month Max. Temp.
Min. Temp.
Average Temp. Humidity Wind
Speed1ý
Tulkarm
Rainfall
(1961-1995)
Qalqiliya
Rainfall
(1978-1995)
(C) (C) (C) (%) (km/hr) (mm) (mm) Jan 13.3 8.6 11.00 72.1 4.30 153.1 125.3 Feb 13.8 8.7 11.25 75.9 4.03 109.7 113.2 Mar 16.7 10.8 13.75 75.2 3.75 77.2 56.3 Apr 21.5 13.8 17.65 65.5 3.38 24.5 15.3 May 24.6 15.9 20.25 62.4 3.35 3.9 2.1 Jun 27.2 19.4 23.30 68.7 2.93 0.2 0

Jul 29.0 22.1 25.55 68.5 2.93 0.0 0 Aug 29.6 22.7 26.15 73.7 2.68 0.0 0 Sep 28.2 21.2 24.70 69.7 2.63 0.9 0 Oct 26.8 19.2 23.00 67.3 2.93 26.8 19.8 Nov 20.8 14.3 17.55 64.8 3.80 96.8 88.9 Dec 15.9 10.6 13.25 71.4 4.00 170.1 149.3 Average 22.3 15.6 18.95 69.6 3.40 Total 663.3 570.3 * Data from 1984-1992 are unavailable, the average is from 1980 to 1984 and from 1992 to 1995. 1 Average wind speed is from 1992-1995. **Source of data is the ARIJ weather data base for 1980-1984, and from Tulkarm Weather Station from 1992 to 1995.

Chapter Three Socio-Economic Characteristics
Demography and Population
At the end of the British mandate, the Tulkarm district was composed of 77 villages in addition to the cities of Tulkarm and Qalqiliya (Encyclopedia Palestina, 1984). The total area of the Tulkarm district under the British Mandate was about 835.361 km2, but this area was reduced to 333 km2 when the Israel army invaded Palestine and occupied a large part of the area during the 1948 war and incorporated it in Israel. In 1945, the total estimated population of the Tulkarm district was 86,140; however, the 1961 statistics show a decline to 83,600. This decline is due to the shrinking of the Tulkarm district's area and the high number of inhabitants who were forced to leave during the 1948 Arab Israeli-war (Encyclopedia Palestina, 1984).
The current population of the Tulkarm district is estimated at 194,934 people including the two refugee camps, Tulkarm and Nur Shams, representing 12.4% of the total population of the West Bank (PCBS, 1994 and UNRWA 1994). The number of people living in the rural areas is estimated at 102,906, representing 52.8% of the total population of the Tulkarm district. Approximately 19,493 people live in refugee camps, 64,255 live in urban areas and about 8,280 representing 4.2% of the population live in semi-urban areas. About 67% of households in this district have seven members or less, while the average household size is 6.2 compared to 6.7 in the remaining West Bank districts. Most of the people in the Tulkarm district (78%) live in privately owned houses (PCBS, 1994 and UNRWA, 1994). Table 3.1 shows a comparison between the Tulkarm district and other West Bank districts.
Tulkarm, Qalqiliya, A'nabta, A'ttil, Deir El Ghusun, A'llar and Qaffin cities are the Palestinians built-up areas in the Tulkarm district administrated by municipalities. The population of these communities comprises approximately 53.6% of the total population of the district.
Table 3.1: Living Conditions Comparison Between the Tulkarm District and other West Bank Districts, excluding Jerusalem (PCBS, 1996)
Living Conditions
Tulkarm %
Jenin %
Nablus %
Ramallah %
Bethlehem %
Hebron %
Household having 7 members or less
67.0 63.0 69.0 66.0 62.0 52.0

Living in privately owned houses
78.0 88.0 70.0 81.8 86.1 88.1
Access to tap water in the house
74.2 39.2 76.6 84.7 89.8 66.3
Moreover, it is noticed that the Crude Death Rate (CDR) in the Tulkarm district declined from 7.88 to 6.29 between the years 1992 and 1996. The growth rate has also increased from 3.947 to 5.839 during the same period. Such changes may be attributed to the establishment of a Palestinian Ministry of Health and subsequent improvements in medical services relative to the situation during the Israeli occupation in addition to proper collection of statistics through the Palestinian Central Bureau of Statistics (PCBS).
Age Composition
Preliminary census prepared by the PCBS in early 1995 showed that 83,321 of the Tulkarm district are eligible to vote. This number roughly represent the number of people over the age of 18 in the district (See Table 3.2). Out of the total number of population around 43.6% aged less than 15 years, compared to 45% in the remaining West Bank districts.
Table 3.2: The Percent Distribution of Individuals over 18 Years Old in the Tulkarm District
Sub-district Age
18-19 %
20-29 %
30-39 %
40-49 %
50-59 %
60-69 %
70+ %
Tulkarm Qalqiliya 7.9 8.6 32.8
34.4 24.3 24.0
13.1 13.3 9.1 8.5 7.5 6.8 5.4
4.4 Source: Al-Quds Annex "People and Election" Page 12, January, 1996
Sex composition
The total gender distribution for Palestinians living in the Tulkarm district has almost 50% male/female ratio. Table 3.3 shows the total number of males and females by age category in the Tulkarm district.

Table 3.3: Male/Female Distributions with Ages More Than 18 Years in the Tulkarm District
Sub-district Sex Age
18-19 20-29 30-39 40-49 50-59 60-69 70+ Male 2379 9627 7108 3610 2015 1763 1455
Tulkarm Female 2024 8744 6495 3768 3065 2446 1575
Qalqiliya Male Female
1225 1118
4940 4430
3493 3047
1851 1756
988 1330
821 1024
598 585
Source: Al-Quds Annex "People and Election" Page 12, January, 1996
Economy
After the Israeli occupation of the West Bank and Gaza Strip in 1967, social and cultural ties between the Palestinians inside Israel and those in the West Bank and Gaza Strip played a key role in enhancing commercial activities in Tulkarm City. At that time, a large number of citizens in Tulkarm and the neighboring villages moved increasingly to work inside Israel leaving behind their farms and simple ways of living. This led to a decrease in the agricultural products; however, these changes helped the enhancement of commercial activities in the city.
The Palestinian economy received harsh blows since the beginning of the Intifada, the Gulf war and the recent successive closures imposed by the Israeli authorities. Very strict limitations were imposed on the movement of Palestinian laborers working inside Israel which resulted in high rates of unemployment and low incomes. Thus, Palestinian laborers returned back to agriculture depending on the "at least not hungry" state of life.
In 1994, the unemployment rate in the Tulkarm district was approximately 31.6%. Around 66.3% of the total employed had permanent jobs, 12.1% had seasonal jobs and 21.6% had part-time jobs (PARC and Arab Thought Forum, 1994). During the closure of the West Bank by Israeli authorities many of the seasonal jobs were lost, therefore the unemployment rate went up significantly. Also many jobs inside the district are dependent on trade with Israel and are negatively affected by the Israeli closure.
Institutions, Societies and Organizations
In addition to the services provided by the governmental and civil administrations there are several charitable societies and non-governmental organizations (NGO's) that also

work in this direction to fill the gaps in the governmental institutions' services. Appendix one lists the main institutions in the Tulkarm district.
Infrastructures Services
Water Supply
Tulkarm district, as elsewhere in Palestine, suffers from water shortage. Approximately 81.6% of the population in the district has access to the water network through municipalities, which covers 49.9% of the accessible population, 41.9% is covered by village councils, 1.3% by village Mukhtar and 6.9% by Mekorot. The rest of the population (18.4%) depends upon cisterns and local springs (ARIJ, 1996).
In addition to water shortage, Tulkarm district is suffering from poor water quality. Lack of maintenance and intermittent water supply are the prevailing situations mainly in Tulkarm City, where the water supply network has been in service since 1933. Recently, the Palestinian Economic Council for Development and Reconstruction (PECDAR) has implemented water supply projects to improve and rehabilitate water networks. Designs to construct and rehabilitate water networks and water tanks in Kafr El Labad, En Nazla Esharqiah, Habla and Qaffin will be ready by December 1996.
Sewage Disposal Facilities
According to the survey conducted by ARIJ in March 1996, only 30% of the houses in the Tulkarm district are connected to the sewage network. Tulkarm and Qalqiliya are the only two cities in the district which have sewer networks in addition to the two refugee camps (Tulkarm and Nur Shams). All other villages (70% of the houses) dispose of their wastewater using cesspits, which is considered one of the main pollution sources to groundwater. There is only one wastewater treatment plant consisting of two 0.5 ha stabilization ponds in the Tulkarm district. Ponds have not been desludged since very long time.
Solid Waste Collection Services
Solid waste is one of the most serious problem in the Tulkarm district. Based on the data collected by ARIJ 1996, solid waste management is suffering from lack of labor and vehicles to collect and transport solid waste from the residential areas to the dumping sites. Approximately 87% of the solid waste is collected the Tulkarm district while the

remaining 13% is either burned in the residential areas or dumped on road sides and vacant land. Burning of the solid waste is a common scene in landfills and between residential buildings. Therefore, due to lack of engineering designed landfills, solid waste collection and disposal is becoming one of the aspects which should be given more attention by the PNA.
Electricity
The Tulkarm district is either supplied by the Nablus Municipality Electricity Undertaking (NMEU) or through the Israeli Electric Cooperation (IEC). Almost 67% of the total population in the Tulkarm district have access to 24-hour electricity supplies (Barghouthi and Ibrahim Daibes, 1993). The per capita electricity consumption in the Tulkarm district is 335 kwh/year from which the total estimated electricity consumption is estimated at 81 gwh/year. Of the total electricity consumed, 16 gwh/year is lost through lack of proper maintenance of the electricity network, old and inefficient generators (PEC, 1995).
According to officials in the Jerusalem Electrical Company (JEC) and Municipality of Nablus, the reason for the inability of Palestinian electricity companies to meet the need for electricity in the West Bank was due to their inability to purchase generators and spare parts as a result of numerous restrictions imposed by the Israeli Authority. Moreover, electric energy is bought from the IEC at higher rates than those for Israeli subscribers. Palestinians in the Tulkarm district pay about NIS 0.4 while in Israel they pay NIS 0.31.
Transportation
Roads in this district are classified into three categories, the first type is the solid surfaced roads with two lanes which connect Tulkarm and Qalqiliya cities with other districts. The second one is the one-lane solid surfaced roads which connect most of the rural communities. The third type is the unpaved roads in the rural areas. It should be mentioned here that most of the roads in the Tulkarm district lack the basic safety requirements.
Transportation services available in the Tulkarm district comprise public buses and taxis in addition to private vehicles. However, due to insufficiency of organized public transportation system, it is noticed that a high percentage of private vehicles are being used by their owners to transport passengers between communities. This kind of transportation is dangerous due to lack of safety requirements and because all drivers working in these cars are not qualified to work in public transportation cars. Added to this is the lack of insurance and licensing in most of these cars, which makes such a kind of transportation risky.

Nearly 21% of the population in the Tulkarm district have access to a limited number of lever-turned telephones in rural areas and 27% of the population have access to automatic switch boards. Hence it is concluded that 52% of the total population in this district are deprived of telephone services (Barghouthi and Daibes,1993).
The Health Sector
Despite the many restrictions imposed by the Israeli authorities on the Palestinian health sector, a number of grassroots health care organizations have been established in the West Bank districts. A large number of clinics were established in 1988 following the outbreak of the uprising when the Palestinian health structure was placed in a state of emergency due to the large number of injuries caused by the Israeli authorities. This situation has created three main types of health organizations that support this sector: private for profit, NGO's and UNRWA which is directed primarily toward Palestinian refugees.
Late in 1994, responsibility for the health department was transferred from the Israeli authorities to the Palestinian National Authority (PNA), which started to evaluate the health status in Palestine and initiated the needed emergency health projects.
The health sector in the Tulkarm district includes the following health services
Primary health care clinics: There are 68 primary health care clinics in the Tulkarm district, of which 23 are NGO's, 40 are for public sector and, five are for UNRWA (PCH, 1994).
Hospitals: There are three hospitals in the Tulkarm district. One is a general hospital owned by the public sector with 64 beds, one is a general hospital funded by UNRWA with 43 beds and one is a NGO hospital with 24 beds (PCH, 1994). The total number of beds to people is 1:1488 compared to 1:3300 in the Jenin district and 1:1700, 1:950, 1:260 in Hebron, Ramallah and Bethlehem districts respectively. However, due to lack of certain specialized departments, people are forced to go to other districts seeking medical care.
In addition, there are four rehabilitation centers. Two are for mental disabilities, one is for motor disability and one is for hearing disabilities (PCH, 1994).
In the Tulkarm district, there are five ambulance cars, three are owned by the Red Crescent Society, one is owned by the UNRWA and one is owned by the governmental hospital (PCH, 1994).
Health Care-Personnel: The 1996 statistics of the number of dentists and physicians in the Tulkarm district was compiled from information provided by related associations. There are 141 physicians representing 12% of the total number of physicians in the West
Bank and 41 dentists representing 9.6% of the dentists in the West Bank. According to the survey conducted by the Planning and Research Center in 1993, there are 118 nurses representing 5.2%, 44 dentists represent 12.7% and 86 technicians representing 6.9% of the total number of technicians in Palestine (PRC, 1993).
The Educational Sector
The structure of the current educational system consists of three main dependent school levels namely, the kindergarten, the compulsory and the secondary level. Formal education in the West Bank is supervised by three agencies: the public (government) agency, UNRWA (United Nations Relief and Work Agency), and the private sector.
Public sector schools include compulsory and secondary levels. This sector had been run and administered by the occupation authorities from June 1967 to 1994, until the Oslo interim agreement was signed between the PNA and the Israeli government. The UNRWA runs their schools at the primary and preparatory levels (compulsory cycle) as well as the teacher-training institutions and post-secondary vocational training centers of the Palestinian refugees. The private sector is represented by associations, organizations, societies or private individual schools owned, administered and run by private educational institutions at all levels. The role of this sector was most distinguished during the school-closure that was imposed by the Israeli occupation in the West Bank during the uprising period. They play an important role in keeping this sector functioning. However, presently most of the students, specially in public schools, are suffering from the effects of closure of schools during the uprising. The educational level in Palestine is in a real critical situation and the PNA should give more attention to this sector otherwise, the education of the young generation will be hindered.
At the end of the Ottoman period, the Tulkarm district witnessed a very active educational movement. It contained around 35 schools at that time. Later in 1966, this number increased to reach 100 schools, of which 8 were UNRWA schools, 10 were private schools and the rest were government schools (Encyclopedia Palestina, 1984). Currently, the total number of schools in the Tulkarm district is estimated at 230 schools. Around 122 of these schools are primary and 52 are secondary schools. The remaining 56 are kindergartens (PCBS, 1995).
There are 162 government schools, 58 private schools and ten UNRWA schools in the Tulkarm district. The total number of registered students in all schools is estimated at 58,812 students while the number of college students is around 501 (PCBS, 1995). Table 2.4 shows the distribution of students at all educational levels in the Tulkarm district.

Table 3.4: Distribution of Students by Educational Level and Gender (1994/95) (PCBS, 1)
Kindergarten Primary Secondary Colleges Male 2,663 25,869 2,199 228 Female 2,438 24,002 1,641 273 Total 5,101 49,871 3,840 501

Chapter Four Geology and Soil
Geology
The majority of the Tulkarm district rocks are comprised of carbonate sediments such as limestone, dolomite, marl and chalk. The age of these rocks ranges from Cretaceous to Quaternary. Jurassic rocks have no outcrops in the area but they are identified by bore holes.
Lithology
The general geology of the Tulkarm area is represented in Figure 4.1. Rofe and Raffety (1965) reported the following lithological formations (ranging in age from older to younger):

Figure 4.1: Tulkarm District Geological Map

1. Lower Beit Kahil Formation
It forms the lower part of the lower Cenomanian and is exposed west of the Fara'a anticline. It consists mainly of limestone, dolomite and marl. The limestone is generally massive and thick. The welljointed limestone and karsts caves in this formation create a good aquifer.
2. Upper Beit Kahil Formation
This formation refers to the upper part of the lower Cenomanian and is exposed mainly west of the Fara'a anticline, where it consists of dolomite, marly and chalky limestone. The formation is moderate to good aquiclude except in the dolomite and limestone areas where the karsts caves are active. It is considered as a good aquifer.
3. Hebron Formation
It forms the upper part of the middle Cenomanian. Outcrops exist west of the Faria'a anticline. Lithology is marked mainly by the blue-green and dolomite limestone. Limestone rocks are massive at the base and become well bedrock upwards. The high jointed limestone renders the formation of excellent aquifer.
4. Bethlehem Formation
This formation is regarded as the upper Cenomanian. Outcrops are found mainly on the flank of the A'nabta anticline. The lithology is characterized mainly by limestone and dolomite with chalk and marl. The dolomite and the limestone are well jointed, therefore, the formation is considered as moderate to good aquifer.
5. Jerusalem Formation
It refers to the Turonian age and is exposed in the A'nabta anticline. Jerusalem formation is considered as an alternation of thin bedded chalky and finely crystalline limestone with occasional dolomite. Hydrogeologically, the formation is considered as a very good aquifer.

6. Rocks of Cretaceous-Tertiary
These are composed of chalk ranging in age from the Coniacian at the bottom to Palaeocene at the top. Outcrops exist in the A'nabta anticline and on the western limb of Nablus - Beit Qad syncline. In the A'nabta area, the chalk is thin and consists of marly base and passes upwards through bedded and crystalline limestone that have few marl partings. The very low permeability of chalk makes a good aquiclude.
7. Tertiary Rocks
These rocks range in age from the Eocene to Pliocene age. They are exposed in the A'nabta area and in the Nablus-Beit Qad syncline. Lithology is marked mainly by chalk and limestone with some conglomerate. The chalk and the limestone are represented by several covers including some chalk and chert partings. The presence of the limestone and the conglomerate lenses form a good aquifer while the chalk and marl act as a good aquiclude.
8. Quaternary Rocks
They are divided into the following formations:
a. Alluvium:
It is related to the Holocene age and distributed in both low and high lands. It consists mainly of unconsolidated and laminated marl with some siliceous sand. The Alluvium is characterized by the red color and fine texture which is due to its derivation from limestone. Sometimes it trends to be sandy and white which arise particularly in the area of sandstone exposures.
b. Nari Formation:
It forms the surface crust with variable thickness over all rocks. In the areas of the chalk and impure limestone, the thickness may exceed 10m but it becomes thin over the purer limestone. This formation consists of carbonate deposits mixed with rock-remnant. It was formed as a result of bicarbonate water penetrating the exposed rocks. This water is drawn to the surface and evaporates leaving carbonate deposits mixed with insoluble residue.
Structural Patterns
1. Folds
Two main structural folds are dominant in the Tulkarm district, the A'nabta anticline and Nablus-Beit Qad syncline. The A'nabta anticline is about 25km long, trends north-south from A'nabta to Qalqiliya, where it disappears. The southern part of the anticline is broken by a number of east-western faults whereas the northern part has gentle slopes. In general, the anticline is considered as a symmetrical structure. The Nablus-Beit Qad syncline trends north-northeast and south-southwest and continues towards Biddya, where it disappears. The western limb has gentle slopes while the eastern limb has sharp dipping. The western flank of the syncline forms minor folds. One of these folds is the syncline located east of A'nabta anticline. This small syncline extends one kilometer and is considered one of the important structures that affect channeling groundwater. One of the minor folds is the east-west anticline which is located between Kafr Qaddum and Jit. This anticline extends to about 15.0 km.
2. Faults
Most of the faults trend east-west with some faults trending northwest-southeast. The normal faults are dominant in the area and have small throws. Long faults are rare and disappear soon. Slopes of these faults are generally regular.
3. Joints
Joints and karsts caves are well developed in the Bethlehem, Hebron and Jerusalem formations. All of these formations consist mainly of weathered and caved limestone and dolomite. The high number of joints and channels in these formations render them to be good aquifers.
Soil
The major soil associations found in the Tulkarm district are (See Figure 4.2 and Table 4.1):

Figure 4.2: Tulkarm District Soil Map

1.Grumusols
This type of soil association covers about 1,201 hectares of the district. It is found in an area with smooth to gentle sloping topography of Tulkarm, Zeta, A'ttara and Ibtah. The soil is originally formed from fine textured alluvial or aeolien sediments. Primary natural vegetation was destroyed. Presently segetal vegetation of the Prosopis farcata - Scolymus maculatus association appears. The usage of this soil type for production purposes is currently limited to cultivate wheat. The American great classification that represents this soil is Xererts.
2. Terra Rossa, Brown Rendzinas and Pale Rendzinas
This type of soil association occupies a total area of about 25,252 hectares, which covers about 75% of the district. Around 3050% of this soil is outcropped with rocks. The major native vegetation covers are Quercus calliprinos, Pistacia palaestina, Pistacia lentiscus, Pistacia atlantica and Amygdalus korschinskii. Cultivation of field crops mainly wheat, barley, vineyards, olive and fruit trees, particularly on valley shoulders, are the dominant land use pattern on these soils. The American great group classifications that represent this soil association are Xerochrepts and Haploxerolls.
3. Brown Rendzinas and Pale Rendzinas
This type of soil association dominates in the area of Qaffin, Nazlat I'sa, Al Nazla Esh Sharqiya, Al Nazla El Wusta, Saida, Nazlat Abu Nar, Ramin, Saffarin, Beit Leed, Kafr A'bbush, Kafr Zibad and Faro'un. This soil covers about 7,000 hectares. Similar to the previous soil types, rock outcrops in this soil forms about 3050%. Major vegetations in this association are Pinups haleness, Pistachio lentiscus, Pistacia palaestina, Quercus ithaburensis, Ceratonia siliqua and Ballotetalia undulatae. In these areas, cultivation of grapes, olives, field crops (wheat and barley) and grazing are the main landuses especially in the shallow and steep sloping areas. According to the American great group classification, this soil represents the associations of Xerorthents and Haploxerolls.

Table 4.1: Major Soil Types and Characteristics in the Tulkarm District
Soil Association
Area (ha)
American Classification
FAO-Soil Unit Classification
Location General Characteristics
Natural Vegetation
Rainfall (mm)
Mean Tem. (C)
Grumusols 1,201 Xererts Vertisols
Area with smooth to gentle sloping topography
Parent material are fine textural alluvial or aeoliensediments
Prosopis farcata - Scolymus maculatus
300-700 19-21
Terra Rossa, Brown and Pale Rendzinas
25,252 Xerochrepts Haploxerolls
Luvisols, Cambisols, Lithosols and Rendzinas
Central mountains Small plateau of the mountains
Terra rossa type, the parent materials are dolomite and hard limestone, the soil depth varies from shallow to deep (0.52m). Xeric moisture regime is deep in hilltops and shallow in sloppy mountainous areas. Soil has a reddish brown color with subangular blocky structure. Same as Xerochrepts with the exception that it has a base saturation of 75%.
Quercus calliprinos, Pistacia palaestina and Pistacia lentiscus. Pistacia atlantica, Amygdalus korschinskii and Pistacia palaestina.
400700 15-20
Brown and pale rendzinas
7,000 Xerorthents Rendzinas and Lithosols
Hilly slopes
Xeric moisture regime, it has a reddish brown color. Soil structure is crumby. Texture is loamy or clay
Pinus halepensis and Pistacia palaestina.
600700 1519
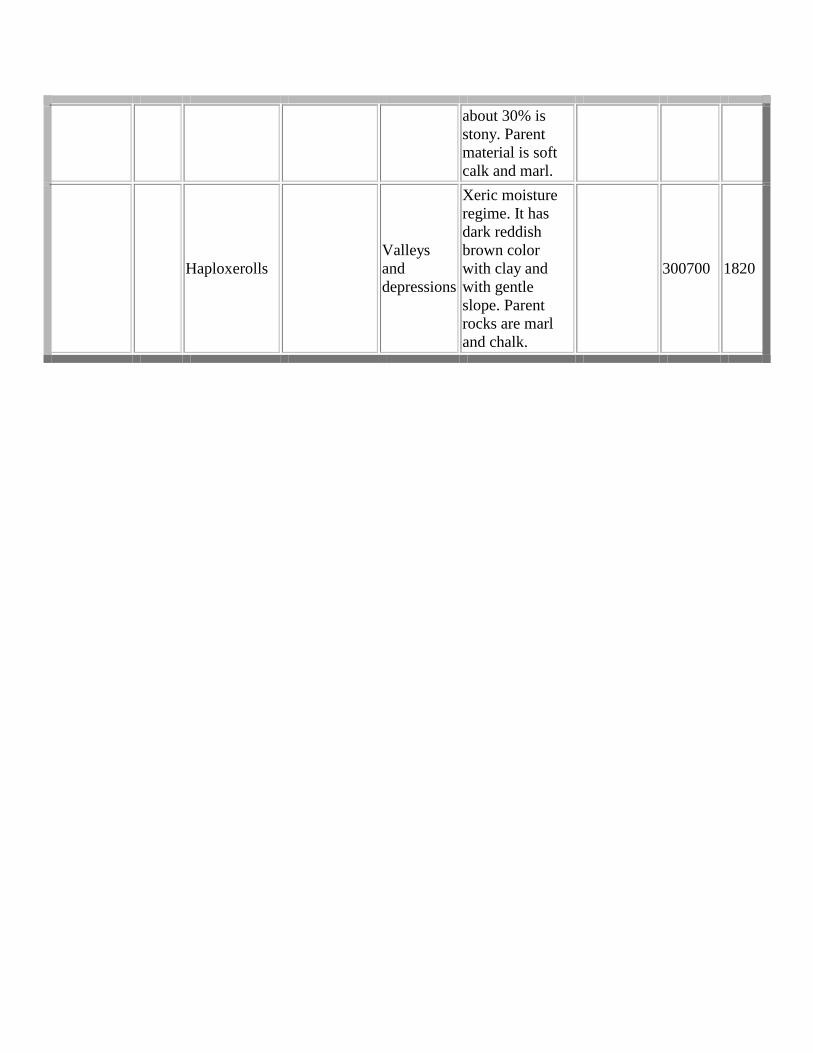
about 30% is stony. Parent material is soft calk and marl.
Haploxerolls Valleys and depressions
Xeric moisture regime. It has dark reddish brown color with clay and with gentle slope. Parent rocks are marl and chalk.
300700 1820

Chapter Five Water Resources
Water Resources
The Tulkarm district is underlined hydrologically by the northern part of the western groundwater basin within the Auja-Tamaseeh drainage basin. This basin is shared between Palestinians and Israelis, where 7% of its capacity is being utilized by Palestinians while the rest is being utilized by Israelis. It is located geographically in the semi-coastal region.
Hydrological Status
The Tulkarm aquifer constitutes the northwestern part of the West Bank aquifer to the west of regional watershed, which subdivides the Mountain Aquifer into east and west basins. Participation of this area in the water budget is significant since its long term average annual rainfall exceeds 500 mm. Groundwater flow is directed towards the west and northwest.
Groundwater Aquifer Systems
The main aquifer systems in the area are:
1. Upper Cenomanian-Turonian Aquifer system, where the majority of Palestinian wells are tapped. It is composed of limestone, dolomite and marl with joints and karsts that give its aquifer properties. It has different aquifer formations including Hebron, Jerusalem and Bethlehem, which are exposed in the study area (Rofe & Raffety, 1965).
2. Lower Cenomanian Aquifer, which underlies the upper Cenomanian Aquifer. A small number of Palestinian wells are tapping this aquifer. This system is represented by Lower Beit Kahil and Upper Beit Kahil geological formations, which form good aquifers (Rofe & Raffety, 1965).
3. Eocene Aquifer of the Tertiary chert, which consists of limestone and sandstone. Few outcrops are found in the eastern part of the study area (Rofe & Raffety, 1965).

Sources of Water
Surface Water
Surface water resources are represented by limited amounts of winter flood water. As shown in Figure 2.4, there are several drainage systems in the Tulkarm district, and the main wadis have a total annual runoff of about 8 MCM (PLO, 1990). As stated in the PLO report (1990), the main drainage systems in the Tulkarm district are:
1. Wadi Abu Nar in the northern part of the Tulkarm district with an annual discharge of 2.77 MCM.
2. Wadi Massin with an average annual discharge of 1.35 MCM. 3. Wadi Zeimar with an average annual discharge of 3.18 MCM. 4. Wadi et Tin with an average annual discharge of 0.73 MCM.
Very limited uncalculated water quantities are being utilized from these floods through cisterns and small catchment areas to harvest water in the form of agricultural ponds. Many Palestinians are using the roofs of their houses as well as plastic houses to collect water and store it in small reservoirs or cisterns.
Groundwater
As there are no springs in the area, groundwater in the Tulkarm district is being utilized through wells constructed to tap the groundwater aquifers. Groundwater wells are used to provide Palestinians with water for both domestic and irrigation purposes. Figure 5.1 shows the location map of groundwater wells in the Tulkarm district.

Figure 5.1: Location Map of Groundwater Wells in the Tulkarm District
Domestic wells
There are 16 groundwater wells used for domestic purposes in the area, 10 wells in Tulkarm sub-district and six in Qalqiliya sub-district. The basic data on the municipal wells of the two main cities (Tulkarm and Qalqiliya) are shown in table 5.1 below.
Irrigation wells
There are 131 wells used for irrigation purposes in the Tulkarm district, 72 wells in the Qalqiliya sub-district and 59 in the Tulkarm sub-district.
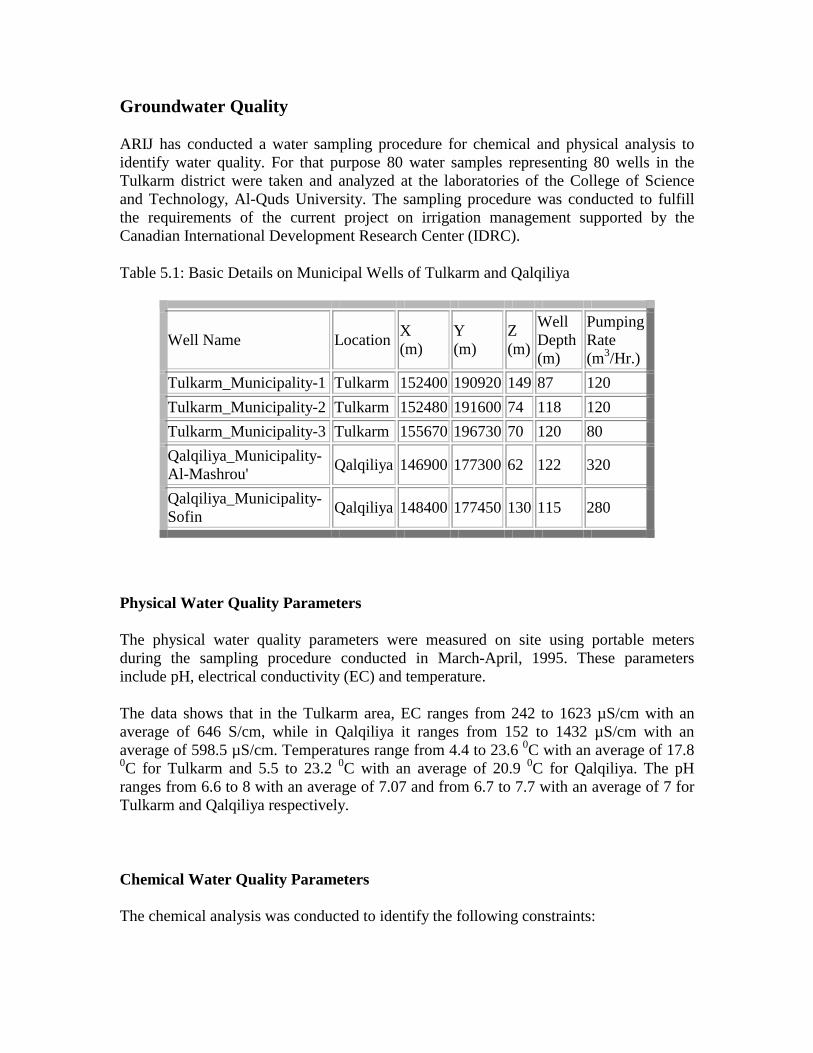
Groundwater Quality
ARIJ has conducted a water sampling procedure for chemical and physical analysis to identify water quality. For that purpose 80 water samples representing 80 wells in the Tulkarm district were taken and analyzed at the laboratories of the College of Science and Technology, Al-Quds University. The sampling procedure was conducted to fulfill the requirements of the current project on irrigation management supported by the Canadian International Development Research Center (IDRC).
Table 5.1: Basic Details on Municipal Wells of Tulkarm and Qalqiliya
Well Name Location X (m)
Y (m)
Z (m)
Well Depth (m)
Pumping Rate (m3/Hr.)
Tulkarm_Municipality-1 Tulkarm 152400 190920 149 87 120 Tulkarm_Municipality-2 Tulkarm 152480 191600 74 118 120 Tulkarm_Municipality-3 Tulkarm 155670 196730 70 120 80 Qalqiliya_Municipality-Al-Mashrou' Qalqiliya 146900 177300 62 122 320
Qalqiliya_Municipality-Sofin Qalqiliya 148400 177450 130 115 280
Physical Water Quality Parameters
The physical water quality parameters were measured on site using portable meters during the sampling procedure conducted in March-April, 1995. These parameters include pH, electrical conductivity (EC) and temperature.
The data shows that in the Tulkarm area, EC ranges from 242 to 1623 µS/cm with an average of 646 S/cm, while in Qalqiliya it ranges from 152 to 1432 µS/cm with an average of 598.5 µS/cm. Temperatures range from 4.4 to 23.6 0C with an average of 17.8 0C for Tulkarm and 5.5 to 23.2 0C with an average of 20.9 0C for Qalqiliya. The pH ranges from 6.6 to 8 with an average of 7.07 and from 6.7 to 7.7 with an average of 7 for Tulkarm and Qalqiliya respectively.
Chemical Water Quality Parameters
The chemical analysis was conducted to identify the following constraints:

• = Cations: Calcium (Ca+2), Magnesium(Mg+2), Sodium(Na+) and Potassium(K+). • = Anions: Bicarbonate (HCO3
-), Chloride(Cl-), and Nitrate(NO3-).
Calculated Water Quality Parameters
Physical and chemical results of water samples were used to calculate sodium adsorption ratio (SAR), Hardness (Hr) and Sodium percentage (%Na).
Presentation of Hydrochemical Data
The above mentioned hydrochemical data were presented using the following tools:
1. Wilcox Diagram
This diagram represents the relationship between physical and chemical results represented by electrical conductivity (EC) and sodium adsorption ratio (SAR), respectively. EC represents the salinity indicator and SAR represents the sodium hazard indicator. Figure 5.2 shows the presentation of hydrochemical data on Wilcox diagram (Wilcox, 1955). Wilcox diagram shows that water is located in the region of medium to high salinity and low sodium hazard (C2-S1) and (C3-S1).
Figure 5.2: Presentation of Hydrochemical Data on Wilcox Diagram for the Tulkarm District

2. Water Quality Distribution Contour Map
Contour maps were presented for EC, Cl-, NO3- and SAR to show the geographic
distribution of water quality in the area. Figures 5.3, 5.4, 5.5 and 5.6 show contour maps, where the changes in these parameters can be related to industrial pollutants, agricultural practices and others.
Figure 5.3: Electrical Conductivity (EC) Contour Map of Groundwater in the Tulkarm District

Figure 5.4: Chloride Concentration Contour Map of Groundwater in the Tulkarm District
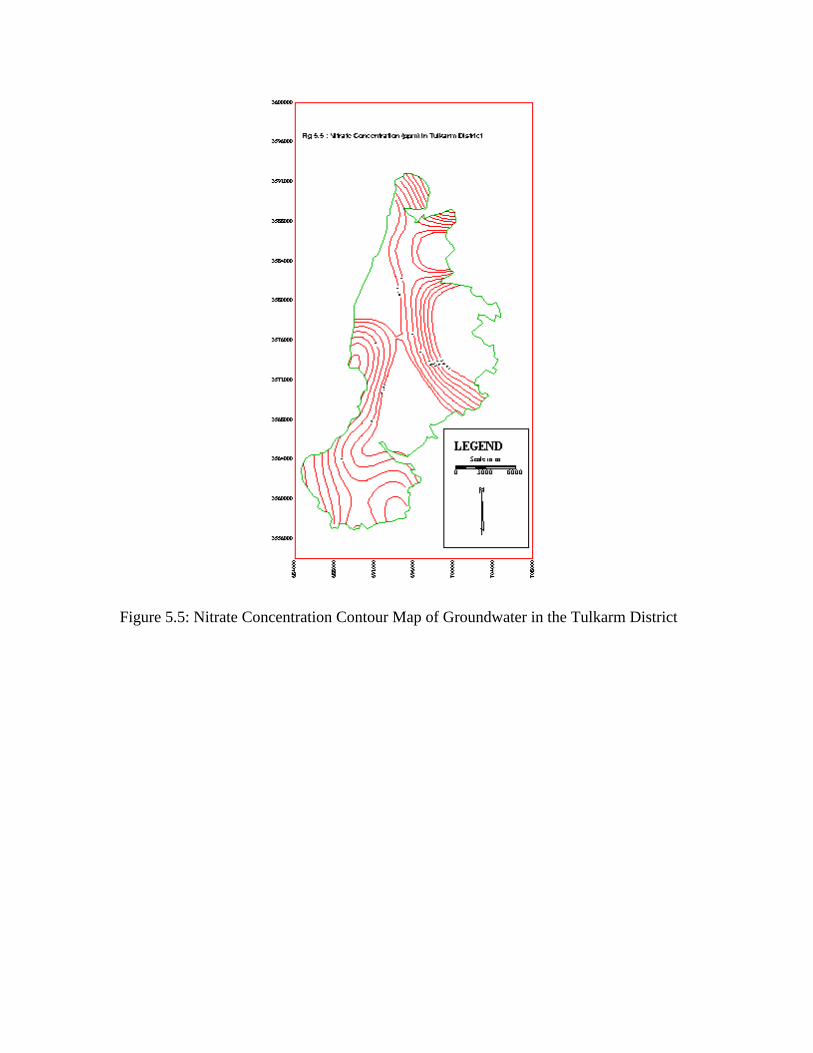
Figure 5.5: Nitrate Concentration Contour Map of Groundwater in the Tulkarm District

Figure 5.6: Total Dissolved Solids Contour Map of Groundwater in the Tulkarm District
Water Suitability
Domestic Purposes
The average concentrations of the majority of water samples taken from domestic wells are within the limits of different international standards for drinking water. Therefore, the existing Tulkarm groundwater is considered suitable for domestic use. However, overpumping and seepage of pollutants from agricultural areas (fertilizers and pesticides) and wastewater are threatening groundwater quality.

Irrigation purposes
Wilcox diagram was used to classify water for irrigation, where the representative water samples show medium to high salinity hazard and low sodium hazard.
Water Supply and Demand
As mentioned before, groundwater is the only source of water supply in the Tulkarm district. Water supply in 1994 was measured to be 16.62 MCM for agricultural purposes and 5.6 MCM for domestic purposes so that the total consumption in the Tulkarm district is estimated at 22.2 MCM (WBWD,1995).
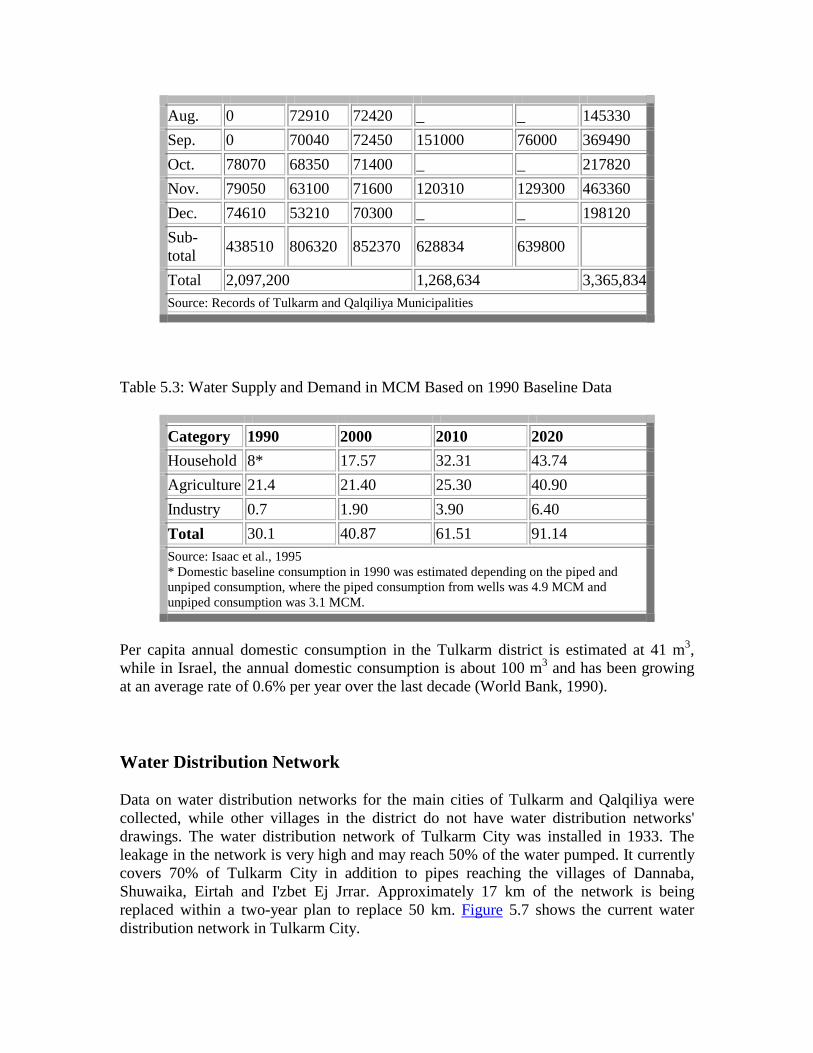
The main cities of the Tulkarm district are Tulkarm and Qalqiliya Cities. ARIJ has contacted the municipalities of Tulkarm and Qalqiliya in order to obtain monthly and annual water supply for the year 1995. Table 5.2 shows the municipal wells of Tand Qalqiliya and their pumpage per month on a monthly basis. Tulkarm Municipality has three wells while Qalqiliya Municipality has two wells.
As shown in Table 5.2, Tulkarm municipal wells provided 2,097,200 m3 while Qalqiliya municipal wells provided 1,268,634 m3 in 1995. In order to compensate for the deficit in the current needs of water for the population served by Tulkarm Municipality, 678,910 m3 were purchased from private agricultural wells. So, the total quantity of water supplied for the local inhabitants within the boundaries of Tulkarm municipality was 2,766,110 m3 in 1995. Water supply in the Tulkarm district does not reflect the actual water consumption because of leakage in the water distribution networks, which reach 25-50%. Isaac et al. (1995) conducted an updated study of water supply and demand to estimate the amount of water required in the Tulkarm district. The following scenario was published for the study area (Medium Scenario)
Table 5.2: Water Extraction from Tulkarm and Qalqiliya Municipal Wells in 1995 (CM)
Month Well No.1
Well No.2
Well No.3
Al-Mashrou' Well
Sofin Well Sub-total
Jan. 39530 70910 69000 79647 97500 356587 Feb. 34200 62060 69800 _ _ 166060 Mar. 29660 69850 70100 _ 149000 318610 Apr. 30390 66980 70200 _ _ 167570 May 30000 69550 71200 120647 94000 385397 Jun. 30000 67760 71600 _ _ 169360 Jul. 13000 71600 72300 157230 94000 408130
Aug. 0 72910 72420 _ _ 145330 Sep. 0 70040 72450 151000 76000 369490 Oct. 78070 68350 71400 _ _ 217820 Nov. 79050 63100 71600 120310 129300 463360 Dec. 74610 53210 70300 _ _ 198120 Sub-total 438510 806320 852370 628834 639800
Total 2,097,200 1,268,634 3,365,834 Source: Records of Tulkarm and Qalqiliya Municipalities
Table 5.3: Water Supply and Demand in MCM Based on 1990 Baseline Data
Category 1990 2000 2010 2020 Household 8* 17.57 32.31 43.74 Agriculture 21.4 21.40 25.30 40.90 Industry 0.7 1.90 3.90 6.40 Total 30.1 40.87 61.51 91.14 Source: Isaac et al., 1995 * Domestic baseline consumption in 1990 was estimated depending on the piped and unpiped consumption, where the piped consumption from wells was 4.9 MCM and unpiped consumption was 3.1 MCM.
Per capita annual domestic consumption in the Tulkarm district is estimated at 41 m3, while in Israel, the annual domestic consumption is about 100 m3 and has been growing at an average rate of 0.6% per year over the last decade (World Bank, 1990).
Water Distribution Network
Data on water distribution networks for the main cities of Tulkarm and Qalqiliya were collected, while other villages in the district do not have water distribution networks' drawings. The water distribution network of Tulkarm City was installed in 1933. The leakage in the network is very high and may reach 50% of the water pumped. It currently covers 70% of Tulkarm City in addition to pipes reaching the villages of Dannaba, Shuwaika, Eirtah and I'zbet Ej Jrrar. Approximately 17 km of the network is being replaced within a two-year plan to replace 50 km. Figure 5.7 shows the current water distribution network in Tulkarm City.

Figure 5.7: Water Network in Tulkarm City
The water network in Qalqiliya City covers 100% of the city with a total length of 70 to 75 km ranging from 18 to 1/2 inches with a leakage of 45%. Figure 5.8 shows the current water distribution network in Qalqiliya City.

Figure 5.8: Water Network in Qalqiliya City
Water Reservoirs
There are seven reservoirs in Tulkarm City and the nearby villages, and two reservoirs in Qalqiliya Municipality with a capacity ranging between 200 to 2,000 m3. Table 5.4 shows the names and capacities of these reservoirs.
Water Prices
Table 5.5 shows the current tariffs of water in Tulkarm and Qalqiliya Municipalities, where the unit price increases with the increase in consumption. In Israel, tariffs are 12.5 to 26 cents/m3 for agriculture, 32 to 75 cents/m3 for domestic use depending on whether the amount of water consumed is less than 16 m3 or more and 15 cents/m3 for industry (World Bank, 1990). In the Hebron and Bethlehem districts, water prices are much higher than the prices in Israel, where it is between 78 to 85 cents/m3 and $ 1.25 per m3 respectively.

Table 5.4: Main Reservoirs and their Capacities
Reservoir Name Capacity (m3)Municipal reservoir 1 450 Municipal reservoir 2 450 New Municipal reservoir 2,000 Shuwaika reservoir 300 Eirtah reservoir 200 Dannaba reservoir 200 I'zbet Ej Jrrar reservoir 250 Source: Tulkarm Municipality, 1996
Table 5.5: Tariffs of Water in Tulkarm and Qalqiliya Municipalities
Tulkarm Municipality Qalqiliya Municipality Consumption (m3/month)
Tariff Applied($/m3)
Consumption (m3/month)
Tariff Applied($/m3)
up to 5* 3.33 up to 9 4.00 >5* 0.33 10-39 0.15 up to 5** 3.33 40-69 0.25 >5** 0.5 70-99 0.50 >100 0.83 Source: Tulkarm and Qaliqliya Municipalities * within the borders of the municipality ** outside the borders of the municipality
minimum charge which the municipalities take if water consumption is less than 5 m3 in Tulkarm and 9 m3 in Qalqiliya.

Chapter Six Agriculture
Agriculture
Tulkarm district is a semi-coastal region, located in the north-western part of the West Bank. It lies between 40 to 500 meters above the mean sea level with 641 mm average annual rainfall (Tulkarm Agricultural Department, 1995).
The district has good fertile soil, suitable climate, fair amount of good water quality for irrigation and relatively high annual rainfall. These factors resulted in prosperous rainfed farming and irrigated agriculture in the district.
Agro-climatic Conditions
Considering the ecological map of the West Bank, Tulkarm district is located in two eco-zones. The largest part of the district, including the Tulkarm and Qalqiliya cities, is located on semi-coastal region while a small part is located on the highlands but at a low elevation.
It should be mentioned here that the geographical definition of the cultivated areas described in this chapter are according to the Israeli definition of the Tulkarm District and not as defined by ARIJ. Figure 1 shows the Tulkarm district according to the Israeli definition where the Tulkarm district area is estimated at 62,000 ha, while Figure 1.1 shows the Tulkarm district as defined by ARIJ where the area is estimated at 33,453 ha (ARIJ GIS unit, 1996).
Depending on the kind of cultivating patterns, the Tulkarm district can be divided into two areas:
1. The Western Area (Semi-Coastal Strip)
This strip extends along the western part of the West Bank, from Qaffin in the north to Qalqiliya City in the south. The average annual rainfall ranges between 400 and 700 mm. Rainfed and irrigated fruit trees, wide areas of covered irrigated vegetable crops (plastic houses and low tunnels), open irrigated vegetables and limited areas of rainfed field crops and vegetables are planted in this part of the district. This part also includes many of the

agricultural villages such as Qaffin, Nazlat I'sa, Nazlat abu Nar, A'ttil, Deir El Ghusun, Dannaba, Tulkarm, Faro'un, Falame and Qalqiliya (See Map of the Tulkarm Build-up Area).
2. The Eastern Area
This area extends along the eastern parts of Tulkarm and Qalqiliya cities including Bala'a, A'nabta, Kafr El Labad and Beit Leed towns. Water resources are limited in this area compared to the western area. Rainfed field crops and olive trees are the dominant cultivation in this part of the district.
Plant Production
Various types of agricultural crops are planted in the district. Warm temperatures and high rates of annual rainfall are the main factors contributing to the increased productivity and diversity of the planted crops. For instance, 27 various vegetable crops, 22 types of fruit trees and 12 types of field crops are grown through the district in 1993/94 growing season, covering an area of 36,511.9 ha. Rainfed farming represents about 92% (33,577.4 ha) of the total cultivated area while the remaining 8% is irrigated. The total plant production was approximately 141,726.7 tons of which irrigated cultivation produces 74.5% of the total production and the remaining 25.5% is from rainfed farming (Tulkarm Agricultural Department, 1995) (See Figure 6.1).
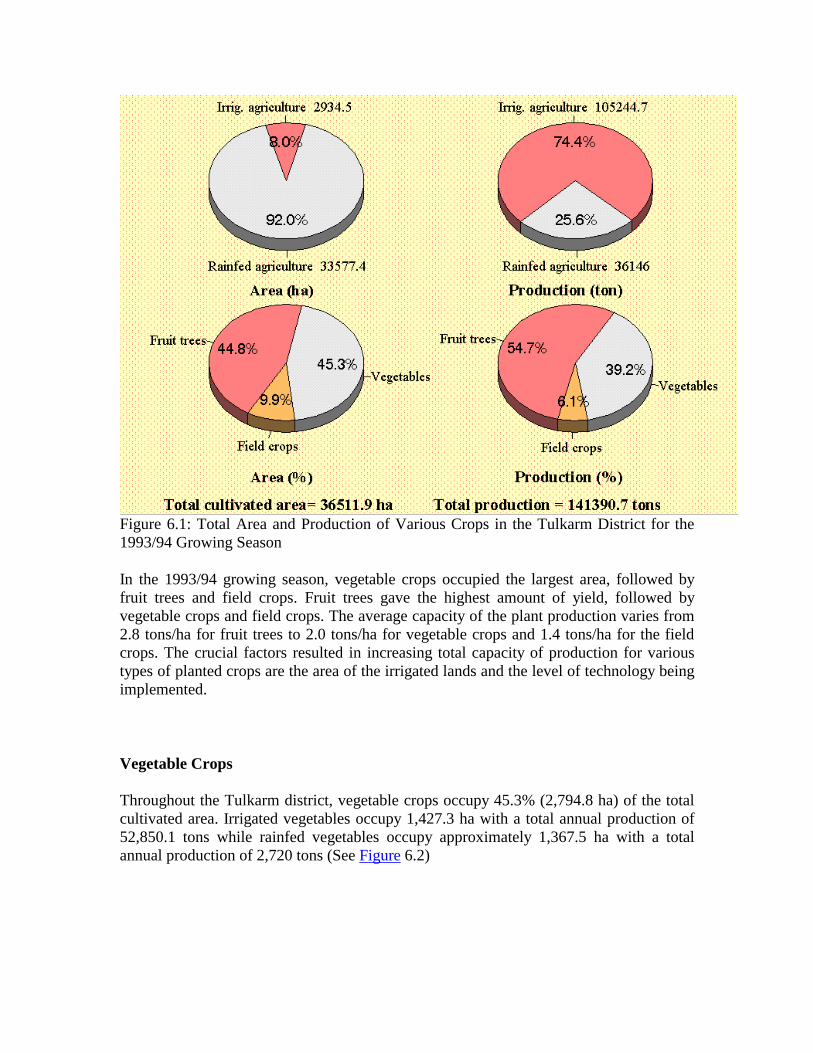
Figure 6.1: Total Area and Production of Various Crops in the Tulkarm District for the 1993/94 Growing Season
In the 1993/94 growing season, vegetable crops occupied the largest area, followed by fruit trees and field crops. Fruit trees gave the highest amount of yield, followed by vegetable crops and field crops. The average capacity of the plant production varies from 2.8 tons/ha for fruit trees to 2.0 tons/ha for vegetable crops and 1.4 tons/ha for the field crops. The crucial factors resulted in increasing total capacity of production for various types of planted crops are the area of the irrigated lands and the level of technology being implemented.
Vegetable Crops
Throughout the Tulkarm district, vegetable crops occupy 45.3% (2,794.8 ha) of the total cultivated area. Irrigated vegetables occupy 1,427.3 ha with a total annual production of 52,850.1 tons while rainfed vegetables occupy approximately 1,367.5 ha with a total annual production of 2,720 tons (See Figure 6.2)

Figure 6.2: Total Area and Production of Vegetable Crops in the Tulkarm District for the 1993/94 Growing Season
The area of irrigated vegetables is divided into open field vegetables (58%), plastic houses (32.1%), high tunnels (5.3%) and low tunnels (4.6%) ( See Figure 6.3).
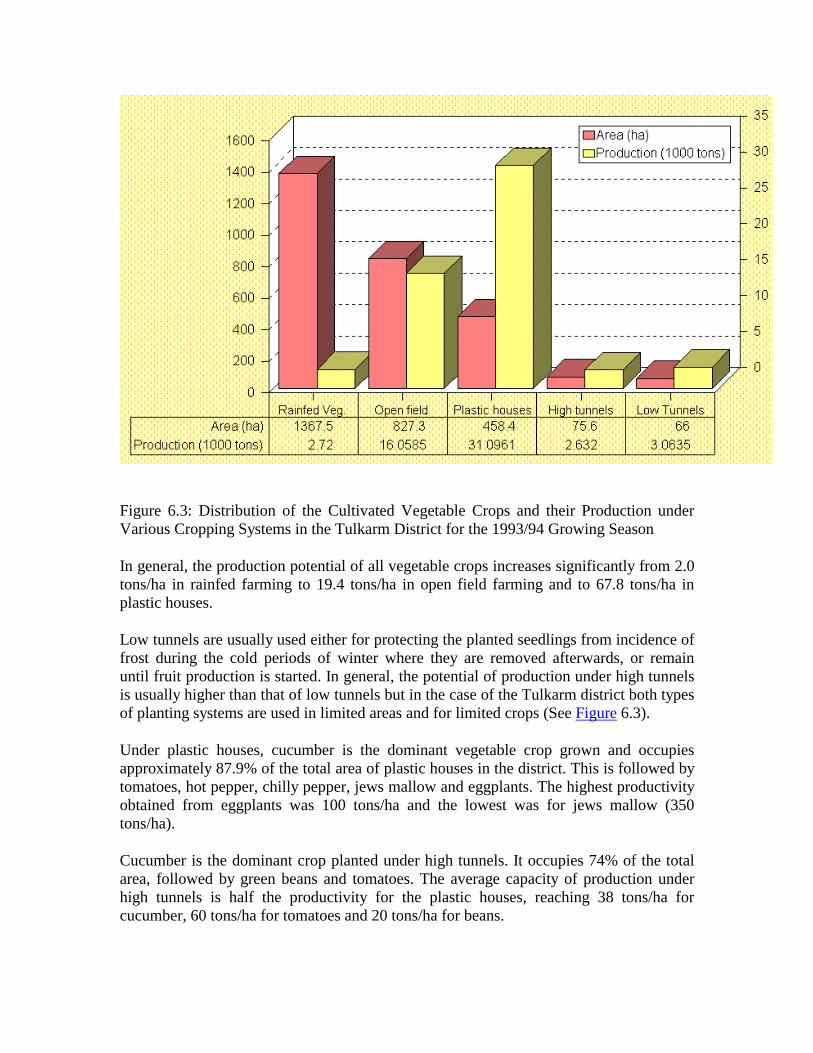
Figure 6.3: Distribution of the Cultivated Vegetable Crops and their Production under Various Cropping Systems in the Tulkarm District for the 1993/94 Growing Season
In general, the production potential of all vegetable crops increases significantly from 2.0 tons/ha in rainfed farming to 19.4 tons/ha in open field farming and to 67.8 tons/ha in plastic houses.
Low tunnels are usually used either for protecting the planted seedlings from incidence of frost during the cold periods of winter where they are removed afterwards, or remain until fruit production is started. In general, the potential of production under high tunnels is usually higher than that of low tunnels but in the case of the Tulkarm district both types of planting systems are used in limited areas and for limited crops (See Figure 6.3).
Under plastic houses, cucumber is the dominant vegetable crop grown and occupies approximately 87.9% of the total area of plastic houses in the district. This is followed by tomatoes, hot pepper, chilly pepper, jews mallow and eggplants. The highest productivity obtained from eggplants was 100 tons/ha and the lowest was for jews mallow (350 tons/ha).
Cucumber is the dominant crop planted under high tunnels. It occupies 74% of the total area, followed by green beans and tomatoes. The average capacity of production under high tunnels is half the productivity for the plastic houses, reaching 38 tons/ha for cucumber, 60 tons/ha for tomatoes and 20 tons/ha for beans.

Eggplants occupy the largest area among the vegetable crops planted under low tunnels. They occupy 34% of the total area devoted for low tunnels, followed by green beans, cucumber, hot and chilly peppers and jews mallow. The average productivity of planted crops under low tunnels is lower than that those under high tunnels and plastic houses for the same crops. The highest productivity of eggplants was 90 tons/ha and 10 tons/ha for cucumber.
In the 1993/94 growing season, about 22 various vegetable crops were grown in open irrigated fields with a total area of 827.3 ha. Cauliflower had the largest area (226 ha) followed by potatoes (201 ha), eggplants (48.7 ha) and cabbage (39.6 ha). The average productivity varies between 35 tons/ha for turnip to 10 tons/ha for cucumber, green beans, cowpeas, radish and parsley.
For the same year, around fourteen types of vegetable crops were grown under rainfed conditions, occupying a total of 1,367.5 ha (49.9% of total vegetable area). Okra occupied the largest area (298.9 ha), followed by dry onions (211.9 ha), tomatoes (185.7 ha), garlic (121.9 ha), squash (124 ha) and snake cucumber (98.9 ha). The average productivity ranges between 2.7 tons/ha for potatoes and 0.4 ton/ha for both green beans and cowpeas (See Figure 6.3).
Fruit Trees
In the 1993/94 growing season, approximately 21 types of fruit trees were planted in the district on an area of 27,620.5 ha, with an average total production of 77,519.6 tons. Rianfed fruit trees are dominant with a total area of 26,151.3 ha (94.7%) and the remaining 5.3% were irrigated (See Figure 6.4).

Figure 6.4: Total Area and Production of Fruit Trees in the Tulkarm District for the 1993/94 Growing Season
Olive trees are the dominant fruit trees planted in the Tulkarm district, holding 85% of the area devoted to fruit trees and 64.3% of the total cultivated area in the district. This area includes 711 ha of unproductive olive trees, 22,757.3 ha of productive olive trees under rainfed conditions and only 7.5 ha under irrigation. The average productivity of rainfed olive trees in 1993/94 growing season was 900 kg/ha compared to 3 tons/ha of the irrigated olive trees (Tulkarm Agricultural Department, 1995).
Stonefruit trees are the next main fruit trees with a total area of 2,297.2 ha. Almond trees occupy 83% (1,905.7 ha) of this sector with an average production of 300 kg/ha followed by apricots with an average production of 600 kg/ha then plums with an average production of 500 kg/ha. Peaches are the stonefruit trees grown under irrigation with a total area of 14.8 ha and average productivity of 2.5 tons/ha.
Irrigated fruit trees occupy 5.3% of the total fruit tree's area in the district and contribute by 67.8% of the total fruit tree's production. Various types of fruit trees are irrigated including citrus (varieties of orange, clementine, lemon and mandarin), guava, peach and very limited areas of loquat, pecan, kiwi and avocado. Citrus trees form a total area of
1,368.5 ha with a total production of 50,330 tons. Amongst the irrigated fruit trees, peaches have the lowest productivity of 2.5 tons/ha and both lemons and clementine have the highest productivity of 4 tons/ha.
In recent years, tropical trees have been introduced to the district offering a good economic opportunity for farmers to market fruits which are in great demand locally. Further expansion of the area planted with such trees should be carefully investigated in light of the high crop water requirment of these trees. The remaining area of rainfed fruit trees consists of 278.7 ha of figs, 97.1 ha of grape vines, 22.5 ha of apples and pears and 30 ha of pomegranates.
Field Crops and Forages
Field crops are totally cultivated under rainfed conditions, except for 38 ha of irrigated peanuts. Wheat has the largest area of 2,437 ha and a total production of 4,631 tons with an average productivity of 1.9 tons/ha. This is followed by barley, which occupies 1,525.1 ha and produces 3,050 tons. Both crops form 65% of the total area devoted to field crops and forage and to 88.9% of their production in the 1993/94 growing season (See Figure 6.5). Food pulses, including dry broad beans, lentils and chickpeas, are planted in limited areas with an average productivity of 400 kg/ha.

Figure 6.5: Total Area and Production of Various Field Crops and Forages in the Tulkarm District for 1993/94 Growing Season
Wheat production in the Tulkarm district accounts for nearly 15.7% and 26% of both total cultivated area and production in the West Bank, respectively. Tulkarm district ranks the first in wheat production followed by Jenin (19.2%), Hebron (18.25%), Ramallah (15.2%), and Nablus (12.7%).
The total area of seed forages comprises 529.4 ha of bitter vetch and 426.4 ha of common vetch, with an average productivity of 400 kg/ha. Sesame is usually planted in the district as a summer field crop. In the 1993/94 growing season, 313.6 ha of sesame were planted with an average productivity of 350 kg/ha. Some medicinal crops are cultivated on a limited area, such as dill, nigella and fenugreek, with an average productivity of 400 kg/ha.
Land Tenure and Farm Size
There is excessive fragmentation of land holdings in the Tulkarm district as a result of the traditional inheritance laws. Approximately 85% of the holdings have areas between 0.1
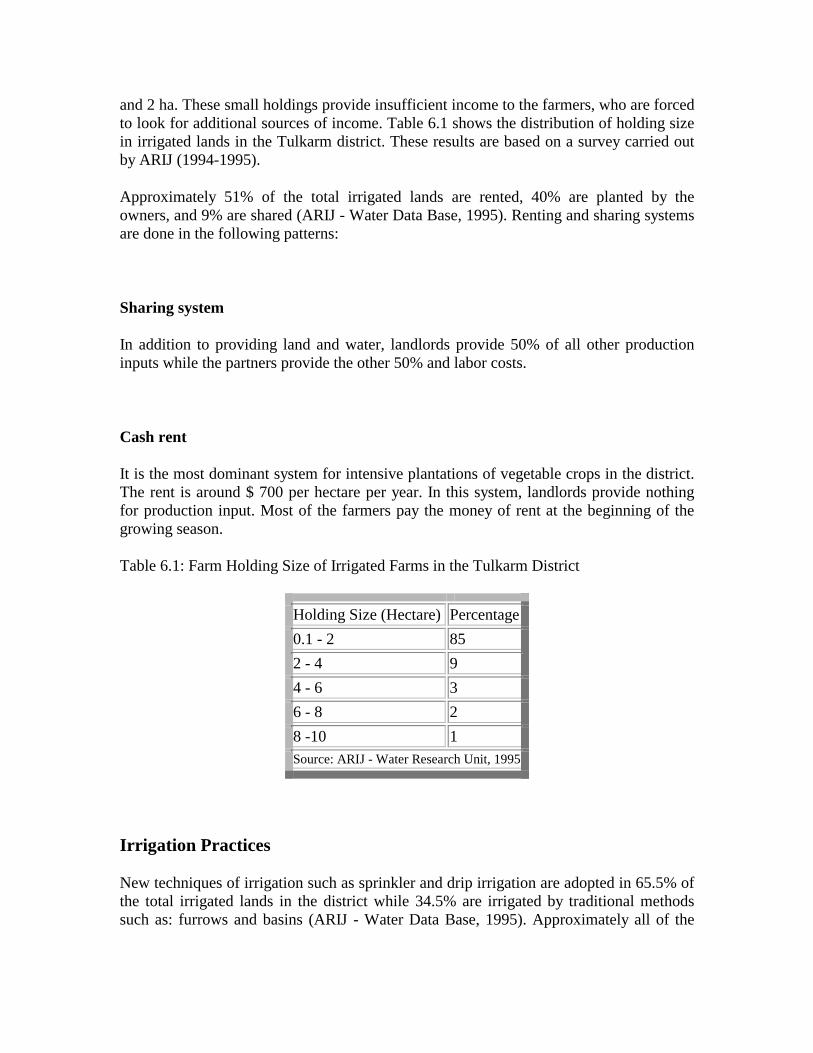
and 2 ha. These small holdings provide insufficient income to the farmers, who are forced to look for additional sources of income. Table 6.1 shows the distribution of holding size in irrigated lands in the Tulkarm district. These results are based on a survey carried out by ARIJ (1994-1995).
Approximately 51% of the total irrigated lands are rented, 40% are planted by the owners, and 9% are shared (ARIJ - Water Data Base, 1995). Renting and sharing systems are done in the following patterns:
Sharing system
In addition to providing land and water, landlords provide 50% of all other production inputs while the partners provide the other 50% and labor costs.
Cash rent
It is the most dominant system for intensive plantations of vegetable crops in the district. The rent is around $ 700 per hectare per year. In this system, landlords provide nothing for production input. Most of the farmers pay the money of rent at the beginning of the growing season.
Table 6.1: Farm Holding Size of Irrigated Farms in the Tulkarm District
Holding Size (Hectare) Percentage 0.1 - 2 85 2 - 4 9 4 - 6 3 6 - 8 2 8 -10 1 Source: ARIJ - Water Research Unit, 1995
Irrigation Practices
New techniques of irrigation such as sprinkler and drip irrigation are adopted in 65.5% of the total irrigated lands in the district while 34.5% are irrigated by traditional methods such as: furrows and basins (ARIJ - Water Data Base, 1995). Approximately all of the

irrigated vegetable crops in the district are irrigated by modern irrigation techniques (90% drip and 10% sprinkler).
Of the total area of irrigated fruit trees, 31% are irrigated by modern irrigation techniques and the remaining 69% irrigated by furrows and basins especially in citrus orchards. Table 6.2 shows the distribution of irrigated areas under various irrigation methods in the Tulkarm district.
Modern irrigation methods need to be introduced into the fruit trees' orchards especially for citrus where large amount of water is lost. Such adaptation will serve 25-30% of the water used for irrigation, providing an economic benefit for farmer as well as enable further expansion of irrigated areas.
Table 6.2: Distribution of the Irrigated Areas Under Various Methods of Irrigation in the Tulkarm District,1993/94
Irrigation Method Crop Drip
(ha) Sprinkler (ha)
Traditional (ha)
Vegetables 1,284.6 142.7 - Fruit trees 16.2 440.8 1,012.2 Forages - 38 - Total 1,300.8 621.5 1,012.2 Percentage 44.3 21.2 34.5 Source: ARIJ- Water Data Base, 1995
Crop Water Requirements
ARIJ has conducted an evaluation of the crop water requirement for the various irrigated crops in the West Bank districts as part of the Irrigation Management Project which is funded by the Canadian IDRC and conducted by the water research unit at ARIJ. A full report is expected soon but highlights of the findings for Tulkarm district will be presentd here. The Penman method has been used in estimating crop water requirements, taking into account the climatic (adapted from Tulkarm Weather Station), soil and plant factors. Table 6.3 gives an estimation of water requirements for the main cultivated crops in the open field and plastic houses in the Tulkarm district.
In order to determine the actual quantity of irrigation water required by the various irrigated crops and cropping systems, several factors should be taken into account such as

the amount of effective rainfall, irrigation method efficiency, soil texture and salinity, water required for some agricultural practices such as soil fumigation and water quality parameters including salinity, chloride and sodium content, etc.
The total amount of net water required for the various irrigated crops cultivated in the Tulkarm district in 1993/1994 growing season is found to be 20.56 MCM. Fruit trees required larger amount of water (65.2%) followed by vegetables with 33.5% and field crops with 1.3% of the total amount of irrigation water (See Table 6.4).
Table 6.3: Crop Water Requirement (CM/ha/season) for the Main Irrigated Crops in the Tulkarm District
Crop Open field Plastic houses Tomato 4,775 7,051 Egg plant 7,324 7,835 Chilly pepper 5,925 4,953 Green beans 3,575 3,613 Jews mallow 5,024 5,000 Citrus 9,255 - Olives 5,000 - Guava 7,262 - Source: ARIJ Water Data Base, 1995
Table 6.4: Crop Water Requirement for Various Crops in the Tulkarm District for the 1993/94 Growing Season
Type of crops Area (hectare)
Water Requirement (MCM)
Open Fields 827.3 3.15 Low Plastic Tunnels 66.0 0.35 Vegetables Plastic Houses and high tunnels 534.0 3.40
Fruit Trees 1469.2 13.40 Field crops 38.0 0.26 Total 2934.5 20.56 Source: ARIJ Water Data Base, 1995

Forests
Approximately 18,100 ha of natural and human-made forests exist in the Tulkarm district. Natural forests seize approximately 43.1% of the total forest areas while 13.8% are man-made forests, and the remaining 43.1% are considered as unplanteor deforested land.
Calcotome villosa, Pistacia lentiscus and Ceratonia siliqua are the most dominant and well-known species of forest trees in natural forests. Allepo pine (Pinus halepensis) is the most dominant forest tree in the human-made forests, followed by cypress trees and Cupressus spp. These areas need maintenance and development through replanting deforested areas with suitable species of forest trees (Tulkarm Agricultural Department, 1995).
Pesticide usage in the Tulkarm district
Approximately 58.8 tons of pesticide were used in the Tulkarm district in the 1993/94 growing season. The total area treated with pesticides was 9,190.3 ha (25% of the total cultivated area in the district), of which 59.4% was cultivated with fruit trees, 22% with vegetables and 18.4% with field crops. The total treated area of rainfed farming was about 6,425 ha and required 17.6 tons of pesticides, while 2,765.3 ha of irrigated lands were treated with 41.2 tons of pesticides. Figure 6.6 shows the distribution of pesticide consumption for various planted crops and cropping patterns of vegetables (Saleh et al., 1994).
Figure 6.6: Pesticide Usage for Various Planted Crops in the Tulkarm District for the 1993/94 Growing Season

Livestock, poultry and apiculture production
Cattle
There are 816 heads of the local cattle breed and 679 head of the Frisian breed in the Tulkarm district, together representing about 12.7% of the total number of cattle in the West Bank. Figure 6.7 shows the distribution of both breeds of cattle according to age and sex. The number of milk-producing cows from both breeds forms 71.6% of total cattle in the district, followed by the heifers (16.5%), calves (10.6%) and bulls (1.3%). The main target of rearing cattle is for milk production. Hence, the number of females forms 88.2% of the total number of the cattle in the district. Moreover, the strongest and most healthy bulls and calves are usually selected for studding and the rest are usually raised for meat production. Around 37% of the cows are inseminated naturally while the rest are inseminated artificially (Tulkarm Agricultural Department, 1995).
Figure 6.7: Number of Cattle in the Tulkarm District According to Sex and Rearing Stage for 1994
The average daily production of milk ranges between 27.6 liters for the Frisian cows and 4.7 liters for the local breed. Also there are hybrid cows resulting from crossing between both breeds, giving an average productivity of 15.5 liters per day each. According to the
milking method, 86% of producing cows are milked manually while 14% are milked by milking machines.
Nearly 45% of total daily produced milk is consumed as fresh milk while the rest (55%) processed into various milk products as follows: 53% for cheese, 46% for yogurt and 2.0% for producing sour cream (labaneh). About 16% of fresh milk and milk products are sold in the locations of production and 84% in the markets of the district. The women farmers are usually responsible for processing the produced milk manually at their homes (ARIJ Data base, 1995, PARC and Arab Thought Forum 1994, Vol.2, No.2).
Sheep and Goats
There are approximately 29,235 sheep and goats in the district. Sheep form about 61% of the total number of the small ruminants including 16,364 heads of local breed and 1,460 heads of the Assaf breed. The number of goats is smaller than that of sheep and forms only 39% of the total small ruminants. Most of the goats in the district are of local breed and few are Shami and hybrid goats.
The distribution of sheep and goats according to the grazing months during the year shows that 1.8% are totally fed on concentrates (confined system), 3.3% are mostly dependent on the range lands and 79.4% graze and supplemented with concentrates (PARC and Arab Thought Forum 1993, Vol. 1, No. 6.).
Poultry
There are approximately 480 farms of broilers in the Tulkarm district. The number of broiler chicken produced in the Tulkarm district was 3.5 millions in 1994 (Tulkarm Agricultural Department, 1995). Moreover, there are approximately 160 layer chicken farms with a total number of laying hens of 137,000, of which 67% are egg producers (PARC and Arab Thought Forum 1994, Vol.2, No.2).
Apiculture
There are about 3,000 modern beehives in the district, forming about 14.7% of the total number of beehives in the West Bank. Approximately 22.2% of total number of the bee- hives contain local breeds, 29.8% are of Italian breed and 48% are of hybrid breeds. The average capacity of annual production for local, Italian and hybrid breeds is estimated at 7.5 kg, 21.2 kg and 15.9 kg of honey per year respectively. The average total production in 1994 was 46.8 tons of honey.
Approximately 93.2% of existing beehives are extracted using electric extractors. About 9.3% of the total produced honey is exported to the Israeli markets, either directly and/or through marketing agents, and the rest is sold locally in the markets of the West Bank and Gaza Strip (PARC and Arab Thought Forum, 1994, Vol. 2, No. 3).
Recommendations
1. About 29% of total irrigated area in the West Bank is located in the Tulkarm district, therefore, the development of all inputs of plant production is required to improve this sector in this district.
2. Introduce and increase the cultivated areas with high quality crops to compete in local and outside markets.
3. Start new activities and encourage investment in the agricultural sector to attract both agricultural workers and business people. Establishing new projects such as grading and storage centers, exporting and introducing new methods of cultivation are essentials.
4. Establish food factories and develop the Palestinian agro-industry. 5. Improve extension activities in order to develop farmer's experience, mainly in
management and crop types. 6. Protect farmers and products during marketing crisis.

Chapter Seven Historical and Archeological Sites
Historical Background
There is no exact dating for the beginning of the human settlements in Tulkarm City. Archeological findings reveal that an agglomeration has existed there at least since the Roman period. It is believed that Tulkarm City was built on the ruins of the Roman village "Birat Soreqa", which means the well of the Mukhtar's vine. Another explanation suggests that the name originated from the Aramaic word tur karma (Vineyard Hill). This name was used by the Samaritan inhabitants of the Middle Ages and by the Crusaders. The Islamic sources, based on Far'oun documents, show that early civilization was established in Tulkarm at the time of Canaanites. In the 13th century and during the Mamluk's period, Daher Babers divided Tulkarm between two of his leaders. Ibn Khaldon reported that the famous Ajnadeen Islamic battle occurred in Tulkarm which was formerly known as Ajnadeen.
The Tulkarm district was established during the Ottoman period in 1892 and was called Bani Sa'ab district with Tulkarm City as its center. In 1910, the Tulkarm district consisted of 44 villages and two cities, Tulkarm and Qalqiliya. At the end of the British mandate, the Tulkarm district consisted of one city, Tulkarm City, and 70 villages including Qalqiliya.
Tulkarm strategic location between Nablus heights and coastal plains, gave the city a commercial and military importance. Added to this, the two railway lines, which passed through the city, made it an important commercial station. However, it had assumed the form of a small town that had been expanding with the increase in traffic passing through. This development came to a halt in the 1930's, with the construction of the Petah Tiqva-Hadera highway which bypasses the town in the west and as a result of the Arab-Israeli war in 1948 when thousands of Palestinians were forced to evacuate their cities and moved to Tulkarm as refugees. Tulkarm City was used as a base during the 1936-1939 Palestinian Revolution and by Iraqi soldiers during the 1967 war.
Historical Sites
Within Tulkarm City and its environs, tombs from the early Bronze Age and various ruins from the Roman Period such as, buildings foundations, cisterns, wine presses, rock-cut tombs, a mausoleum and a stone altar with Greek inscription were discovered.

Although Tulkarm City does not contain a lot of historical sites, there are several Khirbets nearby (historical sites):
Khirbet El Burj: Located nine kilometers west of Tulkarm, and known as Marj el 'At'oot Burj. It contains remains of an ancient tower, a pool and other ancient structures (Al-Dabbagh, 1991).
Khirbet Um Sour: A falsification for the word "Souran", the Roman village which was built there. Located around three kilometers southwest of Khirbet el Burj. It contains remains of a ruined fortress, structures, towers and water tanks (Al-Dabbagh, 1991).
Khirbet Burin: Located four kilometers west of Tulkarm. It is the site of an ancient castle "Yanouf". It contains remains of buildings, wine presses, cisterns and caves (Al-Dabbagh, 1991).
Qasr Bint Esh Shekh: Located seven kilometers southeast of Tulkarm. It contains ruins of Byzantine mausoleums (Al-Dabbagh, 1991).
Khirbet El Mudahdara: An ancient settlement ruins near Tulkarm-Qalqiliya road. Contains remains of a Crusader fortress and smaller buildings. Shards indicate occupation in Roman, Byzantine, and Mamluk periods are also found (Carta, 1993).
Khirbet Deiraban: Located on a hill seven kilometers southeast of Tulkarm. It contains remains of a structure from the early Arab Period (Carta, 1993).
Khirbet El Jauf: A hill located six kilometers northeast of Tulkarm. At its center and around there exists a large structure. On the slopes of the hill there are remains of buildings walls, stones, rock-cut caves and tombs. Shards indicate occupation in the Middle Bronze Age, Hellenistic and Roman periods and Middle Ages are found (Carta, 1993).

Khirbet El Quseir: Located 12 km northeast of Tulkarm . It contains remains of structures and an olive oil press. The remains indicate occupation in the Byzantine Period, Middle Ages and Ottoman Period (Carta, 1993).
Other historical sites within the Tulkarm district are:
��A'llar: About 20 km northeast of Tulkarm. A nearby Khirbeh called "Khirbet Sama" contains walls, ruined columns, tombs, ancient historical stone pieces and rock-cut water tanks. The following Khirbet is located nearby:
Khirbet Beit Sama: A large settlement ruin located northwest of A'llar. Remains of buildings, columns, constructed well, rock-cut cisterns and tombs are found there. It was occupied from the Middle Bronze Age until the Ottoman Period particularly in the Middle Ages (Carta, 1993).
��A'nabta: Around nine kilometers east of Tulkarm. It contains tombs and rock-cut cisterns, and within its proximity the following Khirbets are found:
Khirbet Neirbah: Contains remains of a fortress, caves and several tombs. During the years (1100-1118), king Baldaween I built a fortress on this site (Al-Dabbagh, 1991).
Khirbet Ez Zahran: It contains ruined walls, stones, rock-cut tombs and water canals (Al-Dabbagh, 1991).
��A'ttil: Located seven kilometers northeast of Tulkarm city. It contains an ancient building with a tomb, column fragments, mosaic-paved floor, rock-cut tombs and water canals (Carta, 1993).
��A'zoun: Located in the east of Qalqiliya at about 24 km of Tulkarm. Ruins of an ancient settlement from the Iron Age to Ottoman Period are found. A nearby historical site called Khirbet El Kharab is also found (Al-Dabbagh, 1991& Carta, 1993).
��Bala'a: Seven kilometers northeast of Tulkarm. It served as a base for Palestinians during the 1936-1939 revolution. It contains a historical site called Khirbet Bajjorah in the northwest of the village (Al-Dabbagh, 1991& Carta,

1993).
��Baqa Esh Sharqiya: Located 18 km northeast of Tulkarm City at about 100m above sea level. It contains remains of cisterns, column fragments and capitals (Al-Dabbagh, 1991& Carta, 1993).
��Beit Leed: It contains several ancient structures including a rock-cut pool, tombs and cisterns. The following Khirbets are located nearby:
Khirbet Ed Dweir: In the south eastern part of Beit Leed. It contains ancient lamps, structures and a rock-cut cistern site (Al-Dabbagh, 1991).
Khirbet Qarqaf: Located northeast of the village. Remains of a fortress from the Persian Period are found there. Shards indicate occupation in the Early and Middle Bronze Age, Iron Age and Persian Period are found (Al-Dabbagh, 1991).
��Deir El Ghusun: Located seven kilometers northeast of Tulkarm, known also as "Khirbet Husein". It contains ancient structures, a mill and rock-cut water tanks. A historical site called Khirbet Wasel is located in the village, where remains of buildings, cisterns, old stones and caves are found (Al-Dabbagh, 1991& Carta, 1993).
��Eirta: A Palestinian village about three kilometers south of Tulkarm. Khirbet Eirtah is located in the southern part of the village near Maqam En Nabi Y'acoub. It contains ancient structures, columns crowns, an olive oil press, tombs and a rock-cut pool (Al-Dabbagh, 1991).
��Falama: Located six kilometers northeast of Qalqiliya. It contains rock-cut tombs. Within its proximity the following Khirbets are found:
Khirbet Qar'ash: in the northwest of the village.
Khirbet Yubic: located south of the village. It contains old foundations and a cistern (Al-Dabbagh, 1991).

��Faro'un: A Palestinian village located three kilometers south of Tulkarm City. In the southeastern part of the village there is a historical site called Khirbet Nesf Ejbail (Al-Dabbagh, 1991).
��Habla: Located three kilometers south of Qalqiliya. It contains walls, rock-cut tombs, water tanks and caves (Al-Dabbagh, 1991).
��Jaiyus: Located 20 km south of Tulkarm City. Two Khirbets are located near the village, these are:
Khirbet El-Kara: in the western part of the village.
Khirbet Nasha: It contains ruins and water tanks (Al-Dabbagh, 1991).
��Jaljuliya: A Palestinian village located five kilometers south of Qalqiliya. It is built on the Canaanite village called Jiljal. In the Roman Period it was known as Galgulis. It contains remains of a mosque and a pool from Mamluk, a large Arab Khan and a mosaic floor. A tomb attributed to Shams ed Din, one of Salah El Din's commanders, is found there. In the southern part of the village there is a historical site called Khirbet Barniqia (Al-Dabbagh, 1991& Carta, 1993).
��Kafr A’bbush: Located southeast of Tulkarm. Khirbet Jaffa is located in the south western part of the village. It contains walls, a ruined dome and rock-cut tombs (Al-Dabbagh, 1991).
��Kafr El Labad: Located eight kilometers east of Tulkarm. It contains remains of buildings, water tanks and tombs excavated in the rocks (Al-Dabbagh, 1991).
��Kafr Thulth: Located three kilometers southwest of A'zoun. Within its proximity the following Khirbets are found:
Khirbet Ras El-Tira: Located in the northwest of the village. It contains walls, rock-cut cisterns and tombs.

Khirbet El-Kharab: Located in the northern part of the village.
Khirbet El-Mindar: Located northwest of the village. It contains walls and rock-cut water tanks.
Khirbet El-Zakor: It contains old stones and ruins.
Khirbet El-Dab'a: Located between Kafr Thulth and Habla (Al-Dabbagh, 1991).
��Kafr Zibad: Located 10 km northeast of Qalqiliya. Within its proximity there is a historical site called Khirbet Fahss, where there are ruins and old stones (Al-Dabbagh, 1991).
��Kh. En Nabi Elyas: Located west of A'zoun. There are two historical sites within the village, Khirbet Basona and Khirbet O'rais where rock-cut tombs and caves are found (Al-Dabbagh, 1991).
��Qaffin: Located 22 km northeast of Tulkarm. Khirbet A'freen is located in the north western part of the village and contains mosaic fragments. The following Khirbets are located nearby:
Tel A’frin: Located northwest of Qaffin. It contains remains of rocks, pottery and mosaics.
Khirbet Shamsin: Located south of Qaffin and contains remains of rocks and aqueducts stones (Al-Dabbagh, 1991).
��Qalqiliya: Situated 16 km southwest of Tulkarm with an elevation of 75m above sea level. It was known as "Calecailea" in the Roman period. Within Qalqiliya, some flint implements were found indicating prehistoric habitation. There are many historical sites nearby Qalqiliya:
Mazar Suraqa and Benjamin site or Prophet Yameen site: Both are located in the western part of the city. They contain a well and a building from the Middle Ages (AL-Dabbagh, 1991).
Khirbet Sufin: Located in the eastern part of Qalqiliya. It contains remainders of rocks, caves, rock-cut tombs, water tanks and a mosaic-paved floor (AL-Dabbagh, 1991).
Khirbet Hanota: Located three km north of Qalqiliya, and contains tombs, aqueducts carved in the rock and shredded (AL-Dabbagh, 1991).
Khirbet el Basatin: A Ruin of a large farm from the Byzantine Period located eight kilometers east of Qalqiliya. It has remains of hewn stone walls enclosing a large structure and a large courtyard with rooms inside. At its center, a large structure and a complete olive oil press exist (Carta, 1993).
Khirbet Fureihiyya: A Ruin of a Byzantine mausoleum, located six kilometers southeast of Qalqiliya. Remains of an olive oil press and a rock-cut wine press are found (Carta, 1993).
Khirbet Ras et Tira: A Palestinian village located six kilometers southeast of Qalqiliya. It is built on the ruins of a settlement from the Roman and Byzantine Periods and the Middle Ages. Remains of many buildings and a complete olive oil press are found there (Carta, 1993).
Khirbet Tannura: A Byzantine ruin located 10 km southeast Qalqiliya. Remains of structures whose walls are preserved to a height of three meters and a plastered water pool are found (Carta, 1993).
��Ramin: Located four kilometers southeast of A'nabta and 17 km east of Tulkarm . It is found on the summit of a high wall, on the ruins of an ancient settlement.
Shards found there indicate occupation in the Iron Age, Persian, Roman, Byzantine, Medieval and Ottoman Periods (Al-Dabbagh, 1991& Carta, 1993).
��Saffarin: Located 10 km southeast of Tulkarm City. Khirbet Samarh and Ras Abu El-Balat are found in the village (Al-Dabbagh, 1991).
��Shoufa: Eight kilometers southeast of Tulkarm. Believed to be the site of Shiftan mentioned in Samarian Ostraca. Within its proximity the following Khirbets are found:
Beir El Adas: Located in the southern part of the village.
Khirbet El Nasarah: Located in the northeast of the village (Al-Dabbagh, 1991).
Khirbet Deir Eban: Located in the northern part of the village. It contains remains of foundations and water tanks (Al-Dabbagh, 1991).
��Shuwaika: A Palestinian village located three kilometers north of Tulkarm. Within its proximity the following Khirbet is found:
Khirbet Shuwaikat er Ras: A large hill, located north of Shuweika village. Shards found indicate occupation from the Middle Bronze Age to the Middle Ages (Al-Dabbagh, 1991).
��Zeita: Located 14 km northeast of Tulkarm, and contains columns, carved stones in the site of Sheik Sulaiman Mosque, tombs and a rock-cut press (Al-Dabbagh, 1991& Carta, 1993).
In addition to the above historical sites, the Tulkarm district has some other Khirbets and historical sites distributed in the district. These are: Ebajil, Beer El-Abad, Tel Mas'od, Tel El-Shaqaf, Khirbet Abi Bila, Khirbet Jamin, Khirbet El-Kharija, Khirbet Dar Srour, Khirbet El-Razaz, Khirbet El-Za'nia, Khirbet El-Qumqum, Khirbet Qisoma, Dair Srour, Khirbet Masa'da, Ras Abi Luqa, Daher Um El-Haia, Daher El-Manasef, Kafrsa, Kafier, Kludia and Minah Abi Zabora.

Chapter Eight Wastewater
Wastewater
Wastewater is the spent water of a community, its liquid portion becoming a vehicle for the transport of wastes in sewers. Wastewater is a complex mixture of mineral and organic matter. It contains a variety of inorganic substances as a result of various domestic and industrial uses. Thus, the disposal of industrial, municipal and domestic wastes has to be controlled and properly planned.
Tulkarm is sharing the West Bank districts in the same miserable sanitation situation where the dumping of the generated wastewater from various sites of the community is apparently uncontrolled and ill-managed. In all the cities and villages of the Tulkarm district, the wastewater is either collected or disposed of into the wadis or dumped in cesspits. Such methods of disposal increase chances of sewage infiltration into the groundwater, along with its contents of pollutants, bacteria and viruses resulting in dangerous environmental health problems.
Domestic Wastewater
Domestic wastewater is generated in households, commercial and public institutions by human beings. Commonly, the waste flow is divided into that originating from toilets (black water) and that originating from kitchens or bathrooms (grey water). Each of black and grey water contributes in its own way to the composition of domestic wastewater as can be seen in Table 8.1, which indicates the relative contribution to the total daily per capita wastewater production. The typical domestic sewage is composed of some 99.9% water and 0.1% impurities mainly suspended, colloidal and dissolved solids in addition to the gases, micro-organisms and other materials (WHO,1987).
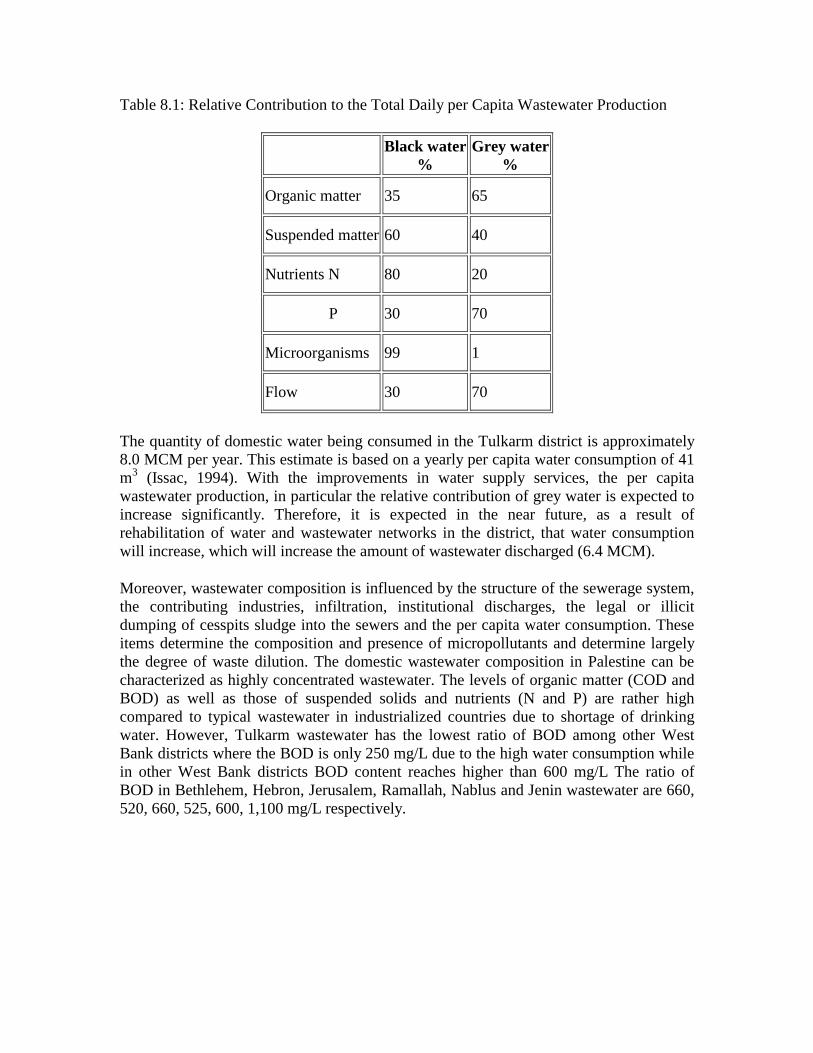
Table 8.1: Relative Contribution to the Total Daily per Capita Wastewater Production
Black water%
Grey water%
Organic matter 35 65
Suspended matter 60 40
Nutrients N 80 20
P 30 70
Microorganisms 99 1
Flow 30 70
The quantity of domestic water being consumed in the Tulkarm district is approximately 8.0 MCM per year. This estimate is based on a yearly per capita water consumption of 41 m3 (Issac, 1994). With the improvements in water supply services, the per capita wastewater production, in particular the relative contribution of grey water is expected to increase significantly. Therefore, it is expected in the near future, as a result of rehabilitation of water and wastewater networks in the district, that water consumption will increase, which will increase the amount of wastewater discharged (6.4 MCM).
Moreover, wastewater composition is influenced by the structure of the sewerage system, the contributing industries, infiltration, institutional discharges, the legal or illicit dumping of cesspits sludge into the sewers and the per capita water consumption. These items determine the composition and presence of micropollutants and determine largely the degree of waste dilution. The domestic wastewater composition in Palestine can be characterized as highly concentrated wastewater. The levels of organic matter (COD and BOD) as well as those of suspended solids and nutrients (N and P) are rather high compared to typical wastewater in industrialized countries due to shortage of drinking water. However, Tulkarm wastewater has the lowest ratio of BOD among other West Bank districts where the BOD is only 250 mg/L due to the high water consumption while in other West Bank districts BOD content reaches higher than 600 mg/L The ratio of BOD in Bethlehem, Hebron, Jerusalem, Ramallah, Nablus and Jenin wastewater are 660, 520, 660, 525, 600, 1,100 mg/L respectively.
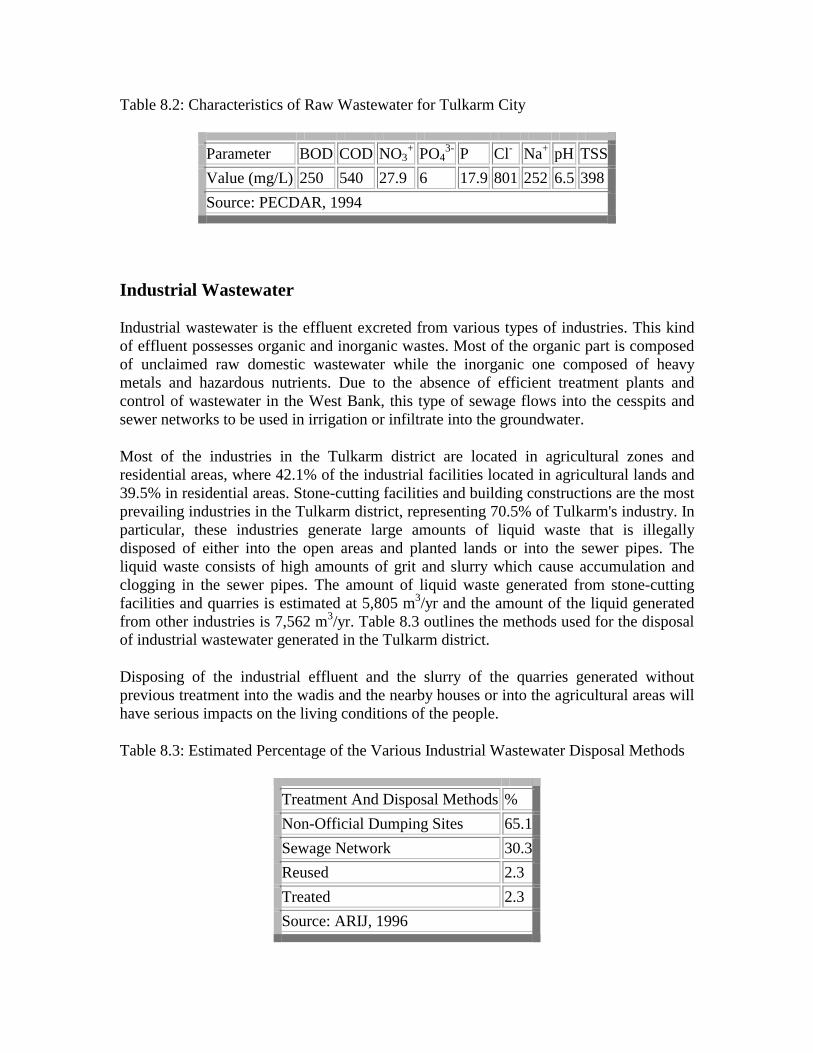
Table 8.2: Characteristics of Raw Wastewater for Tulkarm City
Parameter BOD COD NO3+ PO4
3- P Cl- Na+ pH TSS Value (mg/L) 250 540 27.9 6 17.9 801 252 6.5 398 Source: PECDAR, 1994
Industrial Wastewater
Industrial wastewater is the effluent excreted from various types of industries. This kind of effluent possesses organic and inorganic wastes. Most of the organic part is composed of unclaimed raw domestic wastewater while the inorganic one composed of heavy metals and hazardous nutrients. Due to the absence of efficient treatment plants and control of wastewater in the West Bank, this type of sewage flows into the cesspits and sewer networks to be used in irrigation or infiltrate into the groundwater.
Most of the industries in the Tulkarm district are located in agricultural zones and residential areas, where 42.1% of the industrial facilities located in agricultural lands and 39.5% in residential areas. Stone-cutting facilities and building constructions are the most prevailing industries in the Tulkarm district, representing 70.5% of Tulkarm's industry. In particular, these industries generate large amounts of liquid waste that is illegally disposed of either into the open areas and planted lands or into the sewer pipes. The liquid waste consists of high amounts of grit and slurry which cause accumulation and clogging in the sewer pipes. The amount of liquid waste generated from stone-cutting facilities and quarries is estimated at 5,805 m3/yr and the amount of the liquid generated from other industries is 7,562 m3/yr. Table 8.3 outlines the methods used for the disposal of industrial wastewater generated in the Tulkarm district.
Disposing of the industrial effluent and the slurry of the quarries generated without previous treatment into the wadis and the nearby houses or into the agricultural areas will have serious impacts on the living conditions of the people.
Table 8.3: Estimated Percentage of the Various Industrial Wastewater Disposal Methods
Treatment And Disposal Methods % Non-Official Dumping Sites 65.1 Sewage Network 30.3 Reused 2.3 Treated 2.3 Source: ARIJ, 1996

Wastewater Disposal Methods
Wastewater generated by households is either transported by sewers to central facilities for treatment and disposal or disposed of on-site by some type of cesspits. Similar to all West Bank districts, domestic wastewater disposal in the Tulkarm district is largely handled by an on-site system like cesspits. A survey conducted by ARIJ (1996), which covered 95% of the Tulkarm district, shows that 70% of the population depend on cesspools as a wastewater disposal method and only 30% benefit from the sewerage system. Wastewater disposal services (sewage networks) are not available except in localities within the borders of the Tulkarm and Qalqiliya municipalities and refugee camps which are directed by the UNRWA. Therefore, most of the wastewater in the Tulkarm district eliminated from various sites flows into the wadis, open areas and solid wastes dumping sites, accompanied by large ratios of harmful bacteria, viruses and undesired microorganisms causing environmental and health hazards to the people, crops and drinking water.
1. Sewage Network
As mentioned before, sewerage collection networks are only serving the localities under municipality supervision. However, even when sewer pipelines exist, they do not serve all locations. Qalqiliya City, Tulkarm City, Nour Shams and Tulkarm refugee camps are not completely connected to the sewerage network. Approximately 60 to 70% of Tulkarm City, excluding the new building areas around it, has sewage network with a length of 25 km (See Figure 8.1). There is a need to an extra 40 km of sewer pipes to cover the whole city. Moreover, approximately 50% of the wastewater leaks from the network in Qalqiliya and Tulkarm Cities (ARIJ Survey, 1996). Only 50% of the collected wastewater is drained into the stabilization ponds owned by the municipality then flows into wadi El-Burj, while the other 50% flows to Israel to be treated and reused in irrigation.

Figure 8.1: Sewer Network in the Tulkarm City
In Qalqiliya City, 75% of the city is covered by sewer network with a length of 40 km. Recently, Qalqiliya municipality, in cooperation with PECDAR, plans to construct new sewer pipes to cover another 10 to 15% of the city. People connected to the sewage network pay an annual rate of NIS 40 per flat in addition to 75% of the connecting costs (See Figure 8.2). About 25 laborers are working in this department to maintain and connect new flats and buildings. Nitrate concentration in the wis measured weekly. The wastewater flows in Qalqiliya sewers lines mixed with the wastewater flows from the nearby Kibbutz "Alfeh Menasheh" to form a stream and is then sent to a treatment plant near Kfar Saba (ARIJ Survey, 1996). What is noticeable here is that the untreated wastewater flows from the kibbutz mentioned before passes through Habla village. Villagers there use this flow mainly in irrigation. Cattle grazing on pasture irrigated with raw wastewater is a common scene in some areas in the district. Such kinds of practices should be prevented because cattle may become infected with Cysticercuse bovis (the larval stage of the beef tapeworm Taenia Saginata), but there is little evidence for actual risk of human infection (Mara et al., 1989).

Figure 8.2: Sewer Network in Qalqiliya City
Moreover, during 1980's, the Israeli government constructed a big wastewater pool to the West of Qalqiliya City to collect the wastewater generated from the Israeli kibbutzim to be used in irrigation. The pool is located to the East of these kibbutzim in order to prevent any kind of nuisance that might reach the Israelis as the wind blows from the West. This wastewater pool creates many problems to the people and farmers living there. People living in Al-Naqar neighborhood are suffering from bad smells and insects (mosquitoes and flies). Many diseases arise in the area as a result of this pool. Farmers noticed the appearance of white fly which affect their crops. Groundwater pollution was noticed in the wells located few hundred meters away. This environmental dilemma endangers Palestinian peoples, agriculture and environment in the whole area (contradiction with the peace agreement article 12) (See Appendix 3).
2. Cesspits
Cesspits are considered to be the most widespread wastewater disposal method in the Tulkarm district, similar to all West Bank districts. Cesspits are designed to serve single or multiple apartment buildings. Most of the cesspits in the Tulkarm district are built
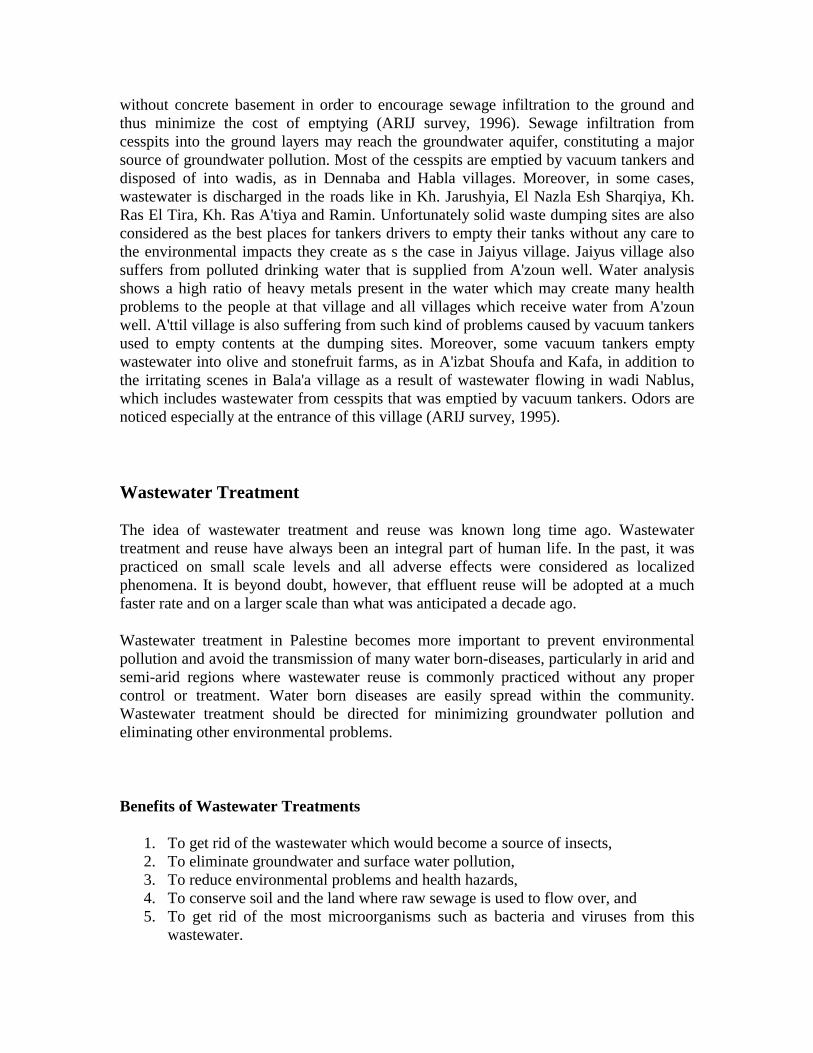
without concrete basement in order to encourage sewage infiltration to the ground and thus minimize the cost of emptying (ARIJ survey, 1996). Sewage infiltration from cesspits into the ground layers may reach the groundwater aquifer, constituting a major source of groundwater pollution. Most of the cesspits are emptied by vacuum tankers and disposed of into wadis, as in Dennaba and Habla villages. Moreover, in some cases, wastewater is discharged in the roads like in Kh. Jarushyia, El Nazla Esh Sharqiya, Kh. Ras El Tira, Kh. Ras A'tiya and Ramin. Unfortunately solid waste dumping sites are also considered as the best places for tankers drivers to empty their tanks without any care to the environmental impacts they create as s the case in Jaiyus village. Jaiyus village also suffers from polluted drinking water that is supplied from A'zoun well. Water analysis shows a high ratio of heavy metals present in the water which may create many health problems to the people at that village and all villages which receive water from A'zoun well. A'ttil village is also suffering from such kind of problems caused by vacuum tankers used to empty contents at the dumping sites. Moreover, some vacuum tankers empty wastewater into olive and stonefruit farms, as in A'izbat Shoufa and Kafa, in addition to the irritating scenes in Bala'a village as a result of wastewater flowing in wadi Nablus, which includes wastewater from cesspits that was emptied by vacuum tankers. Odors are noticed especially at the entrance of this village (ARIJ survey, 1995).
Wastewater Treatment
The idea of wastewater treatment and reuse was known long time ago. Wastewater treatment and reuse have always been an integral part of human life. In the past, it was practiced on small scale levels and all adverse effects were considered as localized phenomena. It is beyond doubt, however, that effluent reuse will be adopted at a much faster rate and on a larger scale than what was anticipated a decade ago.
Wastewater treatment in Palestine becomes more important to prevent environmental pollution and avoid the transmission of many water born-diseases, particularly in arid and semi-arid regions where wastewater reuse is commonly practiced without any proper control or treatment. Water born diseases are easily spread within the community. Wastewater treatment should be directed for minimizing groundwater pollution and eliminating other environmental problems.
Benefits of Wastewater Treatments
1. To get rid of the wastewater which would become a source of insects, 2. To eliminate groundwater and surface water pollution, 3. To reduce environmental problems and health hazards, 4. To conserve soil and the land where raw sewage is used to flow over, and 5. To get rid of the most microorganisms such as bacteria and viruses from this
wastewater.

Wastewater Treatment Plant in Tulkarm City
The wastewater treatment tragedy is also repeated in the Tulkarm treatment plant as in all treatment plants in the other West Bank districts. The present treatment plant was built in 1975 for a designed flow of 200 m3/day. This small treatment plant with a completely deficient stabilization ponds is incapable of running as a qualified treatment plant. The Tulkarm treatment plant consists of two 0.5 ha lagoons that receives the unclassified wastewater stream. The total site is a source of both health and occupational health hazards. Moreover, both ponds are septic with sulfide odors emitted (PECDAR, 1995). Currently, the effluent from the overloaded system is drained across the borders to a storage pond treatment system in Israel in order to be treated and used in irrigation (See Photo 1).
Photo 1: Wastewater Treatment Plant for Tulkarm City
Presently, there are plans to build a new wastewater treatment plant to treat the wastewater generated from Qalqiliya City. However, this project might have some resistance from the Israeli Kfar Saba municipality for political reasons.
The Palestinian Economic Council for Development and Reconstruction (PECDAR) has recently started to construct and to design sewage networks in some of the towns and

villages in the Tulkarm district. By December 1997, design plans will be ready for some wastewater projects. The total cost of these projects will be $ 13.9 million. These projects are:
1. Wastewater collection, treatment and reuse in Zeita, A'ttil and Deir El Ghusun. 2. Wastewater collection system in An'abta, Bala'a and Kafr El Labad. 3. Upgrading and expansion of the wastewater treatment plant, effluent reuse and
irrigation reservoir in Tulkarm City. 4. Sewage networks (stage II) in Tulkarm and Qalqiliya cities.
Wastewater Impacts
1. Surface Water Overflow
The disposal of industrial, municipal and domestic wastes directly into streams has been a major source of water pollution. This phenomenon arises clearly in the Tulkarm district, as in all West Bank districts that include surface overflow or flooding and running off on roads or adjacent lands (See Photo 2). These scenes are repeated in several villages due to either small cesspit size, emptying or due to leakage at the sewage network. In Qalqiliya, surface overflow is present in the sewers and increases in winter, which pollutes groundwater wells and springs (ARIJ survey, 1995).

Photo 2: Wastewater Discharged to the Wadis in the Tulkarm District
2. Groundwater Pollution
Groundwater pollution problems exist but they are not common. The major cause of groundwater pollution is probably the seepage of wastewater from cesspits. Groundwater wells degraded by wastewater are likely to contain high concentrations of nitrate, sulfate, dissolved solids, detergents and bacteria.
For the Tulkarm district, wells are distributed among large numbers of villages. These are either polluted by the infiltration of wastewater from a polluted fill around wells or by leachate. Leachate originate from solid waste dumping sites which are used as a disposal site for wastewater which is mixed with solid wastes.
In conclusion, the reclamation of waand its reuse for the myriad non-domestic purposes that can be met by water of less than potable quality has proven to be an environmentally and economically attractive option for addressing local and regional shortages throughout the West Bank. Wastewater disposal system technical requirements should be considered seriously, public perception and education should be properly improved especially toward managing water supplies such as wells and springs.

Recommendations
1. In view of the present rapid shortage in water resources in Palestine, there is a need to formulate an overall water resources management plan at the district level which includes reuse of wastewater as an essential additional source of water.
2. To ensure a long term sustainability of water resources there is an urgent need to formulate national wastewater reuse regulations based on local environmental implications.
3. Design and construction criteria in respect to selected type of treatment should be based upon local experiences and conditions.
4. For irrigation, the needed effluents should be applied in amounts just sufficient for plant growth leaving no excessive effluent to percolate into the groundwater.
5. During reuse of treated domestic wastewater in irrigation schemes, research and monitoring should be carried out to extend and improve the existing knowledge on agricultural, health and environmental aspects.
6. A technical committee needs to be established at district level to give guidance, implement policies, establish standards and develop codes of practice and design criteria of wastewater.
7. Attention and supervision should be highlighted to prevent the frequent flooding of wastewater cesspits particularly during winter seasons, which causes hazardous living conditions.
8. Completing and improving the existing sewer networks is necessary to preserve surface, groundwater, environment and enable treated wastewater to be used for agriculture.
9. Attention should be directed toward groundwater wells located between villages and towns in the Tulkarm district which should be checked regularly.
10. Most of the Tulkarm district villages are complaining from surface runoff of the sewage water and sludge to streets and nearby lands thus care has to be taken to prevent such incidents.
11. Public awareness of the existing environmental problems and participation in the preventive measures should be encouraged in Palestine.
Chapter Nine Solid Wastes
Solid Waste
Introduction Solid waste refers to the useless, unwanted or discarded materials resulting from society activities. In the last few years, solid waste management has become one of the most obvious environmental problem throughout the West Bank as there is no established strategy for solid waste disposal. Most waste is dumped randomly in uncontrolled dumping sites. This problem is becoming more apparent with the growth in population, consumption practices and industrialization.
Sources of Solid Waste There are no standard or typical solid waste. It is, therefore, difficult to compare waste from different areas or sources, since the sampling and analysis methods used to obtain the original data are not always known. Some waste may contain similar materials but they tend to differ significantly in the size range and proportions of the various components. Generally, they contain larger, bulkier items and a higher proportion of light combustible materials of relatively low moisture content.
A knowledge of the sources and types of solid waste, along with data on the composition and rates of generation are essential to the design and operation of all elements of the management of solid waste. The term solid waste is all inclusive and encompasses all sources, classifications, composition and properties. Wastes that are for disposal in one setting might be of significant value in another and may, therefore, be considered as a resource.
There are no separation systems of the various types of waste in the West Bank. Therefore, the waste includes domestic, industrial, agricultural and medical waste. This chapter includes a discussion of each type for the Tulkarm district.
Domestic Waste
Information on the composition of domestic solid waste is important in evaluating alternative systems as well as management programs and plans. For example, the proportion of paper products may determine if special equipment such as balers and shredders may be appropriate and a separate collection of specific items may be considered if the city or collection agency is involved in the recycling program.
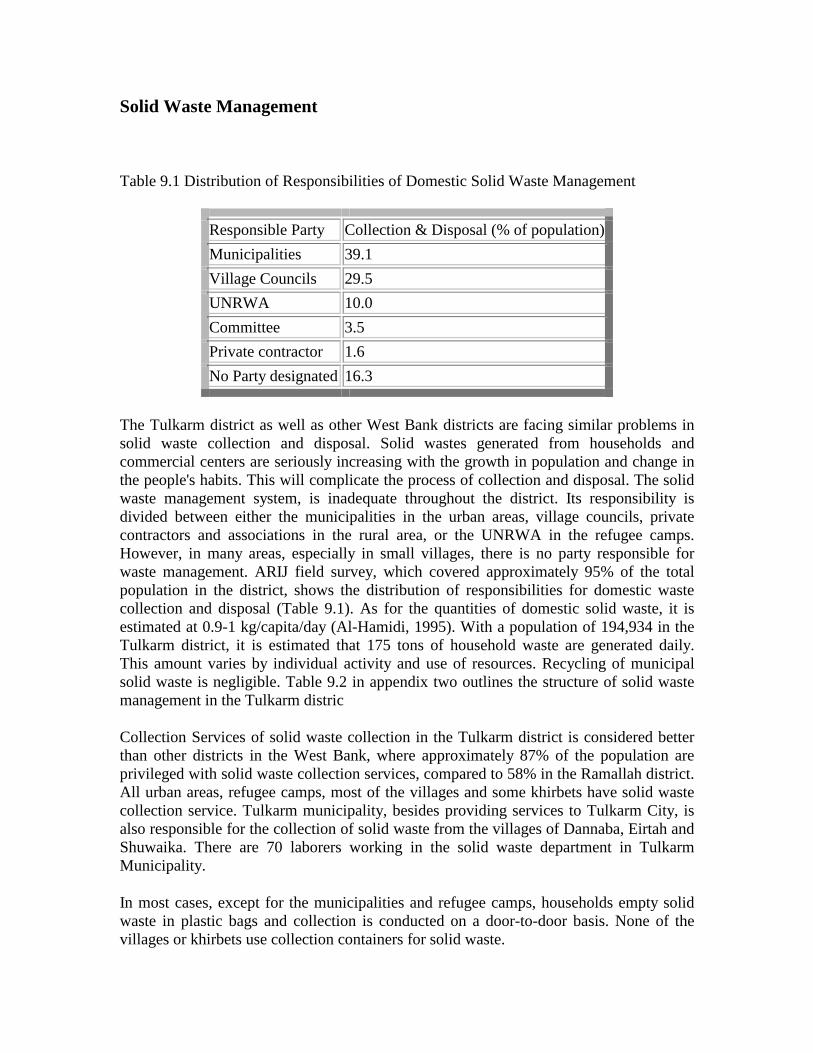
Solid Waste Management
Table 9.1 Distribution of Responsibilities of Domestic Solid Waste Management
Responsible Party Collection & Disposal (% of population) Municipalities 39.1 Village Councils 29.5 UNRWA 10.0 Committee 3.5 Private contractor 1.6 No Party designated 16.3
The Tulkarm district as well as other West Bank districts are facing similar problems in solid waste collection and disposal. Solid wastes generated from households and commercial centers are seriously increasing with the growth in population and change in the people's habits. This will complicate the process of collection and disposal. The solid waste management system, is inadequate throughout the district. Its responsibility is divided between either the municipalities in the urban areas, village councils, private contractors and associations in the rural area, or the UNRWA in the refugee camps. However, in many areas, especially in small villages, there is no party responsible for waste management. ARIJ field survey, which covered approximately 95% of the total population in the district, shows the distribution of responsibilities for domestic waste collection and disposal (Table 9.1). As for the quantities of domestic solid waste, it is estimated at 0.9-1 kg/capita/day (Al-Hamidi, 1995). With a population of 194,934 in the Tulkarm district, it is estimated that 175 tons of household waste are generated daily. This amount varies by individual activity and use of resources. Recycling of municipal solid waste is negligible. Table 9.2 in appendix two outlines the structure of solid waste management in the Tulkarm distric
Collection Services of solid waste collection in the Tulkarm district is considered better than other districts in the West Bank, where approximately 87% of the population are privileged with solid waste collection services, compared to 58% in the Ramallah district. All urban areas, refugee camps, most of the villages and some khirbets have solid waste collection service. Tulkarm municipality, besides providing services to Tulkarm City, is also responsible for the collection of solid waste from the villages of Dannaba, Eirtah and Shuwaika. There are 70 laborers working in the solid waste department in Tulkarm Municipality.
In most cases, except for the municipalities and refugee camps, households empty solid waste in plastic bags and collection is conducted on a door-to-door basis. None of the villages or khirbets use collection containers for solid waste.

Collection containers that are currently used in the municipalities and refugee camps vary in number and size. There are approximately 760 containers, of which 700 containers are of 1.1 m3, 35 of 2.5 m3 and 25 containers of 5 m3. Tulkarm municipality owns approximately 200 containers. The rest are distributed between Qalqiliya, A'nabta and Tulkarm and Nor Shams refugee camps. Most of the present containers are old and many are no longer useful.
The total number of laborers working in the management of solid waste in the Tulkarm, Qalqiliya and A'nabta cities are shown in Table 9.3. The number of workers is below the recommended standards. The WHO recommendations call for 2 to 5 manual workers per 1000 population. The World Bank mission has recommended 1 to 2 manual workers per 1000 population. The situation in the villages who have a solid waste management program is bad. In best cases the laborers working are the driver and the garbage collector.
Table 9.3: Laborers Work in the Solid Waste Management at Various Municipalities in the Tulkarm District
City Driver Worker &Sweeper
Reco. No. of Workers
Superv. Mechanical Technician
Mechanical Engineer Total people/
worker
Tulkarm 9 48 76 2 9 2 70 794 Qalqiliya 4 40 52 3 4 0 51 654 A'nabta 2 6 18 1 1 0 10 1554 Source: ARIJ, 1996
Some villages and khirbets in the district lack any collection system, and solid waste is dumped in the nearby fields, abandoned plots and streets, creating bad smells and inducing various types of insects, mosquitoes and rats especially in the summer time.
Transportation
The collection vehicles available in the various Palestinians built-up areas in the Tulkarm district include 18 hand carts in Tulkarm and Nor Shams refugee camps, one animal cart at Kh. Ras A'tiya, 19 agricultural tractors and 11 trucks of various types and capacities. Hand carts are mainly provided by UNRWA to be used in the refugee camps. This is due to the existing narrow streets in refugee camps, which hinders the passage of trucks. Agricultural tractors are used in the villages of the Tulkarm district. Nine of them are owned by village councils and 10 are rented from the private sector. Compacting roto-press vehicles and hydraulic lift containers have been adopted in Tulkarm and Qalqiliya

cities (See Table 9.2). Two trucks were brought during the 1970's, five during the 1980's and four during the 1990's (ARIJ, 1995). The number of available collection vehicles is far below what is required to handle the generated waste. Furthermore, many of these vehicles are old and frequently out of service, resulting in an irregular and infrequent collection schedule in addition to the solid waste accumulation at open areas near houses.
Waste Disposal System
Uncontrolled dumping is the prevalent waste disposal method in both urban and rural areas. There are approximately 20 known dumping sites in the Tulkarm district besides many informal locations used by residents who do not have collection systems. Dumping sites are usually located in agricultural land, few kilometers away and sometimes very close to residential areas. Selection of dumping site locations is arbitrarily without any consideration to the soil characteristics, topography, climate, or future planning. Dumping sites also lack sanitary requirements. None of them are internally isolated or have a leachate collection system, thereby allowing leato percolate through the soil endangering the groundwater. Also, they are not fenced or guarded, where scavengers and children walk through the solid waste piles in search of usable items (See Photo 3). Figure 9.1 shows the location of the scattered solid waste dumping sites throughout the Tulkarm district.

Photo 3: Tulkarm City Dumping Site

Figure 9.1: Tulkarm District Dumping Sites
The existing dumping site for Tulkarm City is located 3 km to the south of the city along the Tulkarm-Qalqiliya road. It has an area of 5 dunums which belong to the Municipality. The dumped solid waste is either burned or left to decompose on land. Methane gas which is produced from the fermentation of organic waste generates fire leading the burning of the accumulated solid waste. It is estimated that one ton of solid waste burned,
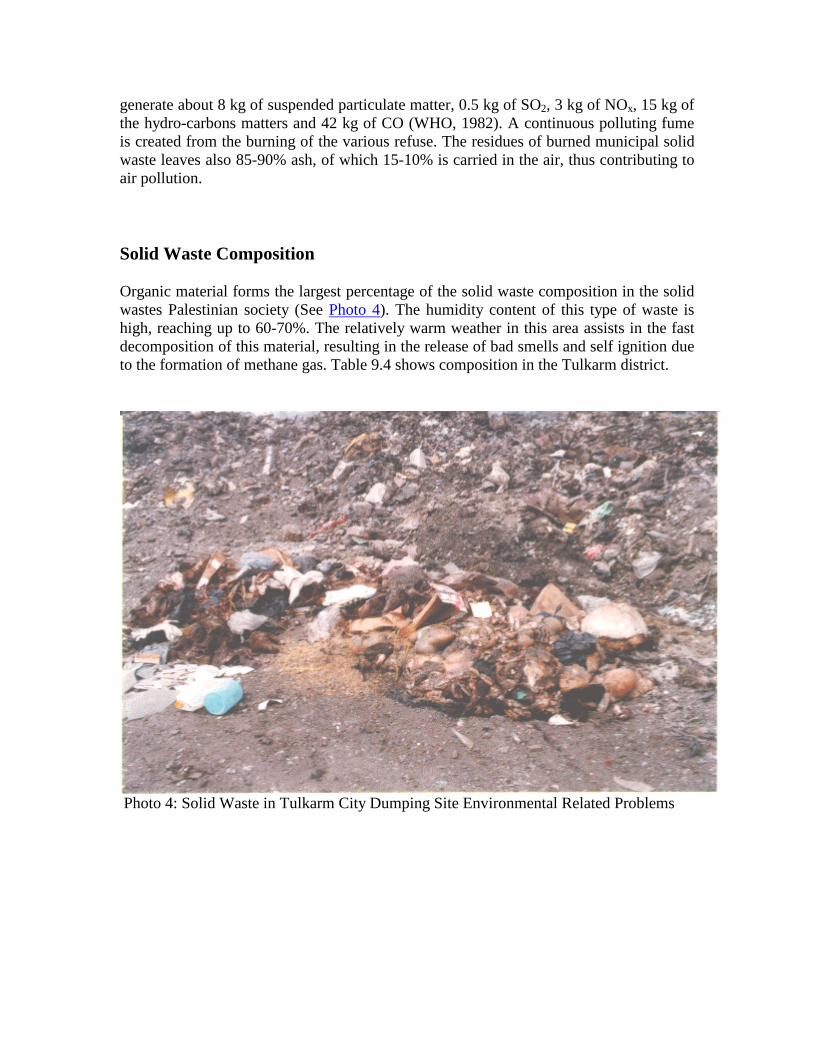
generate about 8 kg of suspended particulate matter, 0.5 kg of SO2, 3 kg of NOx, 15 kg of the hydro-carbons matters and 42 kg of CO (WHO, 1982). A continuous polluting fume is created from the burning of the various refuse. The residues of burned municipal solid waste leaves also 85-90% ash, of which 15-10% is carried in the air, thus contributing to air pollution.
Solid Waste Composition
Organic material forms the largest percentage of the solid waste composition in the solid wastes Palestinian society (See Photo 4). The humidity content of this type of waste is high, reaching up to 60-70%. The relatively warm weather in this area assists in the fast decomposition of this material, resulting in the release of bad smells and self ignition due to the formation of methane gas. Table 9.4 shows composition in the Tulkarm district.
Photo 4: Solid Waste in Tulkarm City Dumping Site Environmental Related Problems

Table 9.4: Solid Waste Composition in the Tulkarm District
Contents Organic Materials Paper Plastic Glass Metals Sand & Wood % 67 10 7 4 5 7 Source: Qalqiliya Municipality, 1996
A large percentage of the limited budget of the municipalities and village councils is spent on solid waste management. In communities administered by municipalities such as Tulkarm City, the municipality provides this service free to its residents. A'nabta municipality charges 3 J.D./year/house and Qalqiliya 6 J.D./year/house. The municipalities are providing this service to the all residents. However, in the villages, the financial situation of solid waste management is much better where people pay higher yearly fees. This is due to the participation of the private sector in the collection services.
Land degradation: The presence of several scattered dumping sites in the Tulkarm district (more than 17 dumping sites) has led to land degradation and reduction in the aesthetic quality of such a small area. Even a shut down dumping site cannot be reused for other purposes for many years due to the emission of harmful gases.
Groundwater Pollution
As none of the existing dumping sites is designed to collect leachate produced from solid waste degradation, the leachate always finds its way through the soil to the groundwater, increasing nitrates concentration and other pollutants in the water.
People nuisance and hygienic problems: The presence of dumping sites near residential areas leads to nuisance and hygienic problems from the generated bad odors, the insects gathering in the area and the fumes generated from open burning. The distances between residential areas and dumping sites in some localities of the Tulkarm district such as Zeita, Kh. Ras A'tiya, Habla, A'ttil and Baqa Esh Sharqiya, are not more than 100 and 500 meters (ARIJ, 1996).
Industrial Waste
There are no heavy industries in the Tulkarm district. However, there are light industries, and the most common is stone-processing. This industry, considered the leading industry in the West Bank, includes tiles manufacturing, building stones, quarries and cement industries. All together representing about 70% of the total industries in the Tulkarm district. Moreover, 42.1% of this industry is located in the agricultural zones, 39.5 % in

the residential zones, 9.2 % in the commercial zones and only 9.2 % of the industry is located in the industrial zones (See Photo 5).
Photo 5: Solid Waste Generated from Quarries near Tulkarm City
Factories are distributed all over the Tulkarm district. However, the number of factories in the Tulkarm and Qalqiliya Cities alone are represents 52% of the total number of factories in the district.
Enormous amounts of dust and suspended particles matter are generated from stone processing industries and released into the air, thus causing potential harm to the nearby residential areas and agricultural lands. Also a tremendous amount of industrial solid waste is produced in the district. According to ARIJ's survey, about 19,647 tons/yr. of solid waste is generated from 76 industrial facilities. Most of the waste is non-hazardous (See Tables 9.5 and 9.6). Approximately 53% of the waste is contributed by the building and construction facilities, and 44% is generated by stone cutting factories. The solid waste produced is reused mainly as a raw material for stone crushing machines, building of hand-made stone walls and only few is dumped on nearby road sides or vacant land and almost none is treated before being discharged into the environment. Table 9.7 shows the industrial solid waste disposal methods in the Tulkarm district.

Table 9.5: Distribution of Surveyed Industries in the Tulkarm District
Number of Factories Surveyed Percentage Commercial Zone 7 9.2 Industrial Zone 7 9.2 Residential Zone 30 39.5 Agricultural Zone 32 42.1 Source: ARIJ, 1995
Moreover, it should be mentioned here that during the last few years, an increase in the amount of agricultural waste has been noticed. Plastic covers used in agriculture are dumped near agricultural lands and roads. Approximately 635 tons/year of plastic covers are generated in the Tulkarm district (Al-Hamaidi, 1993). Lack of programs to reuse or recycle agricultural plastic waste creates a serious threat to the environment and to animals. Plastic is mostly non-decomosable matter. Therefore, it stays for a long time, damaging the beauty of the nature and lead to the death of many animals which chew it.
Table 9.6: Types of Industries, No. of Factories Surveyed, Solid Waste and Liquid Waste Generated
Industrial Branch
Total no. of Factories
No. of Factories Surveyed
Solid Waste from those Surveyed tons/year
Liquid Waste from those Surveyed m3 /year
Food & Beverage 205 2 4 0
Textile 24 3 25 0 Leather 7 1 36 3600 Plastic & Rubber 6 1 12 0
Non-metallic 143 7 143 210 Metal 238 4 55 0 Building Construction 25 23 11728 3596
Painting 6 2 4 0 Stone Processing 46 32 9748 2740
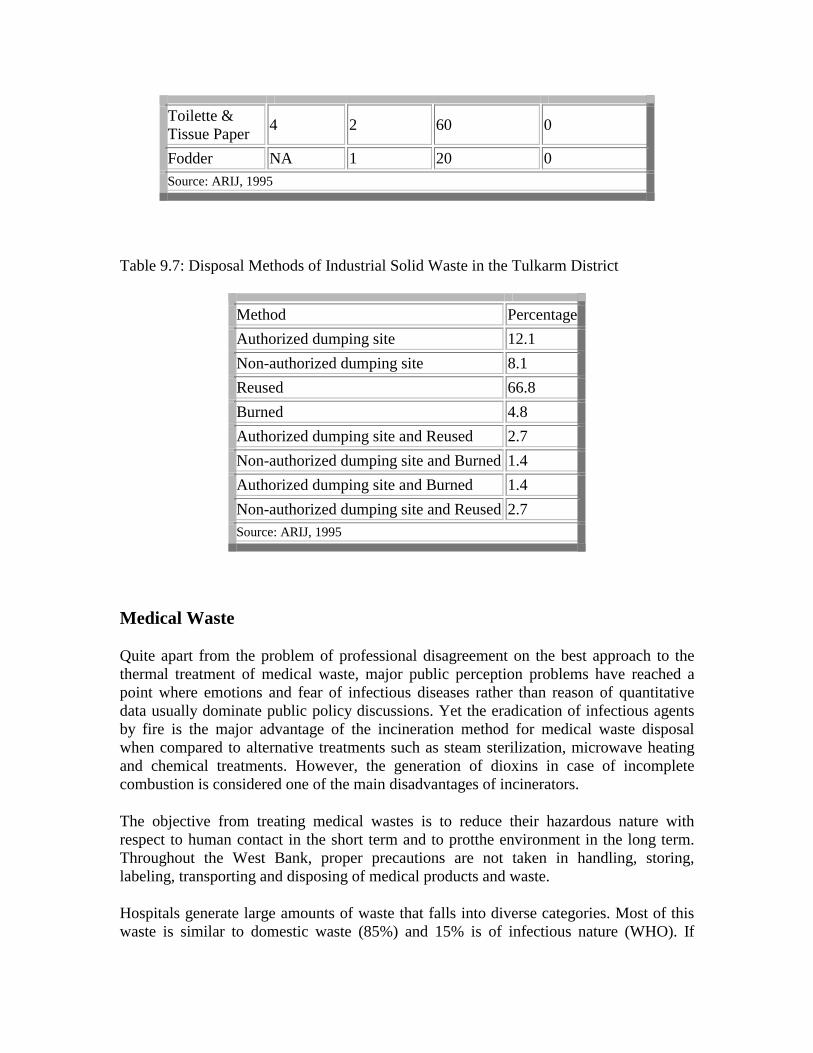
Toilette & Tissue Paper 4 2 60 0
Fodder NA 1 20 0 Source: ARIJ, 1995
Table 9.7: Disposal Methods of Industrial Solid Waste in the Tulkarm District
Method Percentage Authorized dumping site 12.1 Non-authorized dumping site 8.1 Reused 66.8 Burned 4.8 Authorized dumping site and Reused 2.7 Non-authorized dumping site and Burned 1.4 Authorized dumping site and Burned 1.4 Non-authorized dumping site and Reused 2.7 Source: ARIJ, 1995
Medical Waste
Quite apart from the problem of professional disagreement on the best approach to the thermal treatment of medical waste, major public perception problems have reached a point where emotions and fear of infectious diseases rather than reason of quantitative data usually dominate public policy discussions. Yet the eradication of infectious agents by fire is the major advantage of the incineration method for medical waste disposal when compared to alternative treatments such as steam sterilization, microwave heating and chemical treatments. However, the generation of dioxins in case of incomplete combustion is considered one of the main disadvantages of incinerators.
The objective from treating medical wastes is to reduce their hazardous nature with respect to human contact in the short term and to protthe environment in the long term. Throughout the West Bank, proper precautions are not taken in handling, storing, labeling, transporting and disposing of medical products and waste.
Hospitals generate large amounts of waste that falls into diverse categories. Most of this waste is similar to domestic waste (85%) and 15% is of infectious nature (WHO). If

safety recommendations are followed, hospitals wastes are probably safer to handle than urban wastes.
Three hospitals, one maternity house, and fifteen laboratories were surveyed in the Tulkarm district by ARIJ staff (1996). The survey showed that the location of the medical institutions is determined randomly where many of these institutions are found in residential and commercial areas. Around 53% of the surveyed medical centers are located in commercial areas and 47% in residential areas.
Most of the medical wastes in the Tulkarm district are disposed of in domestic wastes containers. For example, 68% of the surveyed medical facilities dispose of blood samples directly into the garbage. All medical wastes are collected daily in plastic bags and dumped together with other domestic wastes without any treatment. Later, the municipality's sanitation workers gather these wastes and burn them. This malpractice usually leads to air pollution and increases the danger of viral and bacterial widespread. On the other hand, 16% of the medical institutions sterilize blood samples by chlorination, 11% autoclave blood samples and 5% of the medical facilities burn blood samples (ARIJ Survey, 1996).
ARIJ survey shows that nearly 37% of the medical facilities dispose of urine samples directly without treatment into the municipal garbage while 63% pour the urine samples into the sewerage network. Around 53% of the medical facilities in the Tulkarm district use septic solution to treat sharp objects before disposal while 26% of these medical facilities dispose of these sharp objects directly into the municipal garbage without treatment and the rest (21%) either burn or autoclave them (ARIJ Survey, 1996).
The only medical item that is properly treated before disposal is petri dishes which contain the media needed for bacterial culture. Around 73% of medical facilities in the Tulkarm district sterilize these dishes by autoclaving and 27% of the medical facilities dispose of them directly into the municipal garbage bins.
All the wastes produced by surgery and maternity wards are held in plastic bags and disposed of directly into the municipal garbage bins. Most of the lab technicians in hospitals, clinics and laboratories do not use any safety tools such as gloves or masks while performing medical tests and examinations.
The previous health department did not perform any periodical inspection of the medical and health facilities in the Tulkarm district. For example, 68% of the medical facilities were never subjected to any kind of inspection by the health department of the Israeli civil administration.
The results of ARIJ's survey of medical wastes generated by hospitals, laboratories and medical centers show that several medical facilities have adopted medical waste disposal practices such as burning, autoclaving and chlorinating but none of these facilities has an official incinerator. Moreover, most of these medical facilities lack special collection and disposal practices to prevent any danger associated with medical wastes.

Recommendations
1. Design large landfill in the Tulkarm district for proper disposal of solid waste (one per district), which serve as large communities as possible. Monitoring of this landfill should be done regularly.
2. Landfill location must be away from residential areas to prevent bad odor and health risks.
3. Develop and improve the solid waste collection system. New compacting vehicles and hydraulic lift containers should be brought to replace the old open trucks and agricultural tractors. Number of workers and trucks should be enough to provide acceptable service.
4. Cost recovery concept should be introduced to sustain financial resources to operate and maintain the solid waste management system.
5. Optimize the ratio of supervisory personnel, to direct labor and provide equipment and facilities.
6. Adopt a system of record keeping on equipment and maintenance supplies so that an adequate supply of spare parts and materials is available at all times.
7. Establish city ordinances that spell out citizen participation in the solid waste management system by outlining methods of household storage, placement of wastes for pickup, payment of charges, source separation of recyclable matter and responsibilities for keeping their curbside property clean for pedestrians and traffic.
8. Locate disposal facilities so that hauling time from the collection service area to the point of dumping can be minimized.
9. One disincentive to poor cooperation of residents with the refuse management system is legislation. Laws, ordinances, regulations coupled with inspection and enforcement are the chief deterrents to wide-spread littering and illegal dumping.
10. National and regional laws and policies to promote recycling practices and resource recovery.

Chapter Ten Air And Noise Pollution
Air Pollution
Air pollution is the presence of substances in the ambient atmosphere resulting from the activity of human or nature, causing adverse effects for both people and the environment. More than 90% of the air pollution is the result of human activities. For a thousand years before the Industrial Revolution, atmospheric concentrations of CO2 remained steady at the level of about 280 ppmv; as ice core measurements show, that was the highest level in 160,000 years. Since the early 1800s, however, concentrations have increased by 30% as humans have burned fossil fuels and cut down forests. Marked rises have also been noted in other greenhouse gases such as methane, nitrous oxides and the halocarbons. The combined effect is equivalent to a 50% jump in CO2 levels (Bruce, 1996).
Among the most common and most virulent of air pollutants are sulfur dioxides (SO2), suspended particulate matter (SPM), nitrogen oxides (NOx), carbon monoxide (CO) and lead (Pb). In addition, there is evidence of growing threat to human health from indoor pollutants such as radon, formaldehyde, asbestos, mercury and organic substances.
Exposure to air pollutants can result in a variety of severe human health effects as well as impact on ecosystems. The possible human health effects may include cancer and many other acute diseases. Carbon monoxide enters the bloodstream and reduces oxygen delivery to the body's organs and tissues. Lead accumulates in the body in blood, bone and soft tissue. Because it is not readily excreted, lead also affects the kidneys, the liver, the nervous system and blood-forming organs. Nitrogen oxides can irritate the lungs and lower the resistance to respiratory infections such as influenza. The reactivity of ozone with humans causes health problems as it damages lung tissue, reduces lung function and sensitizes the lung to other irritants. SPM has bad effects on breathing and respiratory symptoms. It causes aggravation of existing respiratory and cardiovascular diseases, alterations in the body's defense systems against foreign material, damage to lunge tissue, and carcinogenesis and premature mortality. Sulfur dioxide has serious effects on breathing, causing respiratory illness, alterations in the lungs' defenses and aggravation of existing respiratory and cardiovascular diseases. Moreover, sulfur dioxide and nitrogen oxides are the major precursors to acidic deposition (acid rain). These gases are associated with a number of effects including acidification of lakes and streams, accelerated corrosion of buildings and monuments and visibility impairment (U.S. Environmental Protection Agency, 1994).
In almost all Palestinian districts, urban air pollution is worsening. Rapidly growing cities, more traffic on roads, use of dirty fuels, reliance on outdated industrial processes,
growing energy consumption, increasing the number of quarries and stone-cutting factories and lack of industrial zoning and environmental regulations are all contributing in reducing urban air quality and deteriorating public health.
Sources of Air Pollution
The main sources of air pollution are energy production, transportation and industry. Most of the energy-producing facilities are located in Israel and then electricity is imported to Palestine. This means that air pollution from power stations is negligible in Palestine, at least during the next few years. However, after the peace process and the establishment of the Palestinian state, it might be essential for the Palestinians to construct their own power stations which will emit pollutants into the air.
The rapid emergence of industrial plants in the vicinity of urban centers has exacerbated air pollution problems in Palestine. Pollution sources include quarries, chemical, textile, leather, plastic, painting, building construction and several other industries.
Dense vehicular traffic is also a major contributor to air pollution, causing high nitrogen oxide (NOx) concentrations, especially in the heavily populated urban centers. The problem is irritated by the operation of diesel-power buses and trucks. Increased motorization has had a major impact on the deterioration of air quality.
In 1990, the energy sector, including transportation, was responsible for over half of all global greenhouse gas emissions. Transportation alone accounted for about 25% of the world's primary energy use, or 50% of oil products consumed. Those figures are expected to rise sharply as transportation sector continues its rapid growth (Bruce, 1996).
The amount of carbon cycling from naturally occurring processes each year through the biosphere as CO2 is enormous -- some 700 billion tons. As evidenced by the general long-term stability of the global climate, the amounts generated by natural processes have been about equal to the amounts absorbed by natural processes. Human activity, mostly in the form of burning fossil fuels, is now generating some 24 billion tons of CO2 per year. Available evidence shows that only about half this amount is being absorbed by natural processes, where as atmospheric CO2 concentrations are increasing steadily, and are now about 26% higher than they were 100 years ago.
Factors affecting air quality in the Tulkarm district are nearly similar to those in other Palestinian districts. High population growth rates that are concentrate in small land areas, increase in the number of private cars escalating and increase vehicular emissions in addition to industries like stone-cutting are the main sources of air pollution.
There are various types of industries in the Tulkarm district; however, most of them are in the early stages and contribute little to the deterioration air quality except for stone-
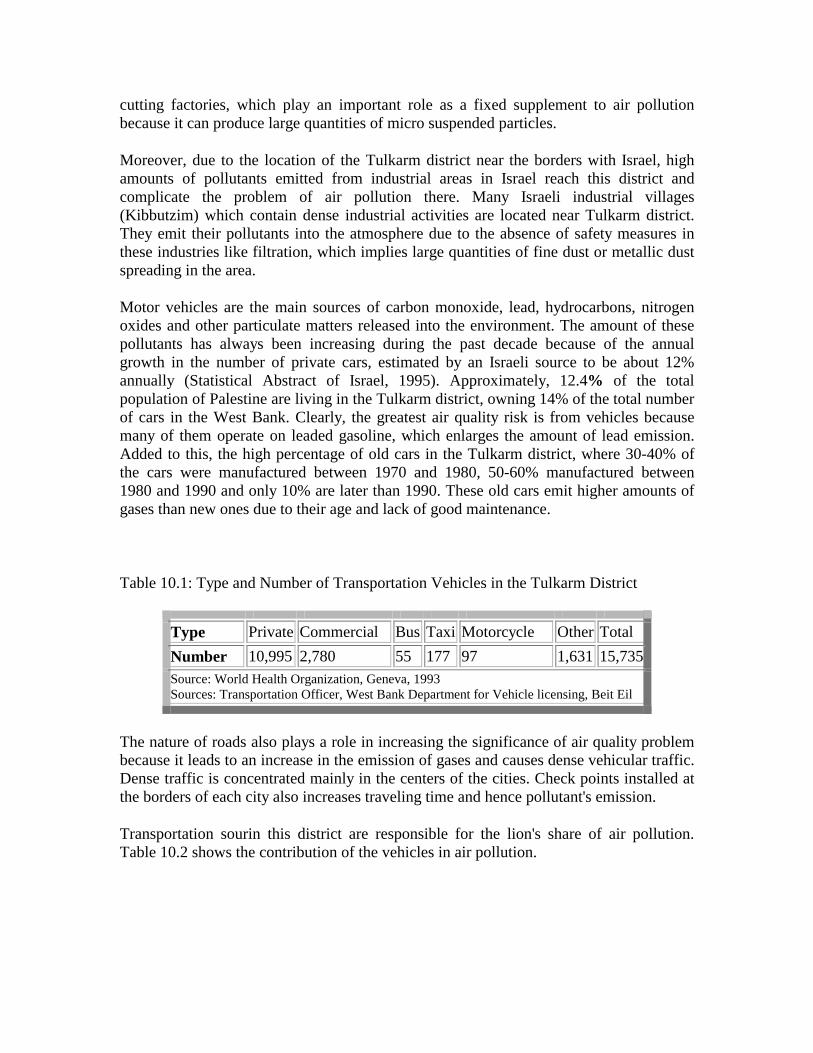
cutting factories, which play an important role as a fixed supplement to air pollution because it can produce large quantities of micro suspended particles.
Moreover, due to the location of the Tulkarm district near the borders with Israel, high amounts of pollutants emitted from industrial areas in Israel reach this district and complicate the problem of air pollution there. Many Israeli industrial villages (Kibbutzim) which contain dense industrial activities are located near Tulkarm district. They emit their pollutants into the atmosphere due to the absence of safety measures in these industries like filtration, which implies large quantities of fine dust or metallic dust spreading in the area.
Motor vehicles are the main sources of carbon monoxide, lead, hydrocarbons, nitrogen oxides and other particulate matters released into the environment. The amount of these pollutants has always been increasing during the past decade because of the annual growth in the number of private cars, estimated by an Israeli source to be about 12% annually (Statistical Abstract of Israel, 1995). Approximately, 12.4% of the total population of Palestine are living in the Tulkarm district, owning 14% of the total number of cars in the West Bank. Clearly, the greatest air quality risk is from vehicles because many of them operate on leaded gasoline, which enlarges the amount of lead emission. Added to this, the high percentage of old cars in the Tulkarm district, where 30-40% of the cars were manufactured between 1970 and 1980, 50-60% manufactured between 1980 and 1990 and only 10% are later than 1990. These old cars emit higher amounts of gases than new ones due to their age and lack of good maintenance.
Table 10.1: Type and Number of Transportation Vehicles in the Tulkarm District
Type Private Commercial Bus Taxi Motorcycle Other Total Number 10,995 2,780 55 177 97 1,631 15,735 Source: World Health Organization, Geneva, 1993 Sources: Transportation Officer, West Bank Department for Vehicle licensing, Beit Eil
The nature of roads also plays a role in increasing the significance of air quality problem because it leads to an increase in the emission of gases and causes dense vehicular traffic. Dense traffic is concentrated mainly in the centers of the cities. Check points installed at the borders of each city also increases traveling time and hence pollutant's emission.
Transportation sourin this district are responsible for the lion's share of air pollution. Table 10.2 shows the contribution of the vehicles in air pollution.
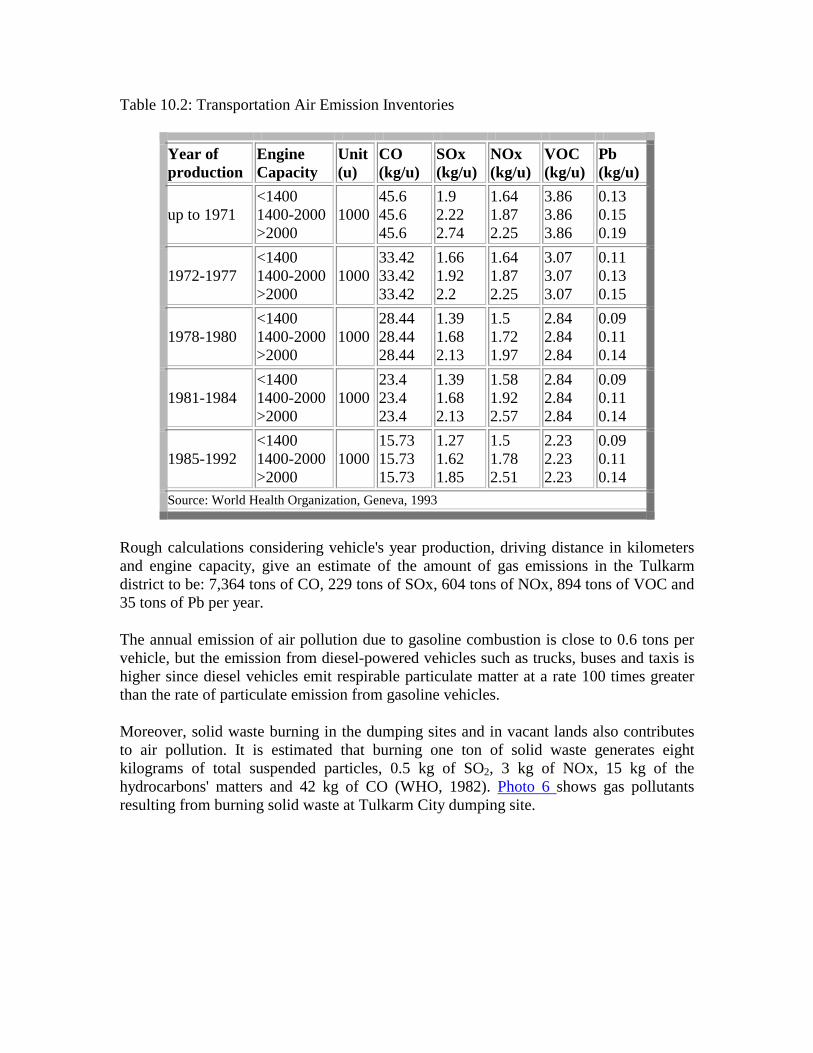
Table 10.2: Transportation Air Emission Inventories
Year of production
Engine Capacity
Unit (u)
CO (kg/u)
SOx (kg/u)
NOx (kg/u)
VOC (kg/u)
Pb (kg/u)
up to 1971 <1400 1400-2000 >2000
1000 45.6 45.6 45.6
1.9 2.22 2.74
1.64 1.87 2.25
3.86 3.86 3.86
0.13 0.15 0.19
1972-1977 <1400 1400-2000 >2000
1000 33.42 33.42 33.42
1.66 1.92 2.2
1.64 1.87 2.25
3.07 3.07 3.07
0.11 0.13 0.15
1978-1980 <1400 1400-2000 >2000
1000 28.44 28.44 28.44
1.39 1.68 2.13
1.5 1.72 1.97
2.84 2.84 2.84
0.09 0.11 0.14
1981-1984 <1400 1400-2000 >2000
1000 23.4 23.4 23.4
1.39 1.68 2.13
1.58 1.92 2.57
2.84 2.84 2.84
0.09 0.11 0.14
1985-1992 <1400 1400-2000 >2000
1000 15.73 15.73 15.73
1.27 1.62 1.85
1.5 1.78 2.51
2.23 2.23 2.23
0.09 0.11 0.14
Source: World Health Organization, Geneva, 1993
Rough calculations considering vehicle's year production, driving distance in kilometers and engine capacity, give an estimate of the amount of gas emissions in the Tulkarm district to be: 7,364 tons of CO, 229 tons of SOx, 604 tons of NOx, 894 tons of VOC and 35 tons of Pb per year.
The annual emission of air pollution due to gasoline combustion is close to 0.6 tons per vehicle, but the emission from diesel-powered vehicles such as trucks, buses and taxis is higher since diesel vehicles emit respirable particulate matter at a rate 100 times greater than the rate of particulate emission from gasoline vehicles.
Moreover, solid waste burning in the dumping sites and in vacant lands also contributes to air pollution. It is estimated that burning one ton of solid waste generates eight kilograms of total suspended particles, 0.5 kg of SO2, 3 kg of NOx, 15 kg of the hydrocarbons' matters and 42 kg of CO (WHO, 1982). Photo 6 shows gas pollutants resulting from burning solid waste at Tulkarm City dumping site.

Photo 6: Air pollution at Tulkarm City Dumping Site
Air pollution has a negative impact on both humans and the environment, causing instability of the respiratory system. Vegetation areas also can be affected as a result of the formulation of acid rain. In general, the lack of raw data on air quality in the West Bank districts due to lack of monitoring systems increases the difficulty of a full study of the air pollution problem.
Noise Pollution
The word "noise" is derived from the Latin word "nausea" meaning seasickness. Noise is unwanted sound and is among the most pervasive pollutants today. Noise from road traffic, jet planes, garbage trucks, construction equipment, manufacturing processes, lawn mowers, leaf blowers and boom boxes are among the unwanted sounds that are routinely broadcast into the air.
The problem with noise is not only that it is unwanted, but also that it negatively affects human health and the well-being. Problems related to noise include hearing loss, stress, high blood pressure, sleep loss, distraction and lost productivity and a general reduction in the quality of life and opportunities for tranquillity.
The scientific measurement of noise level in the West Bank in general is unavailable but field observation shows that there are many sources of noise pollution. Tulkarm City, which lies close to the Israeli border acts as a corridor for both Israelis and Palestinians. This city is subjected to excessive noise due to its location.
This problem will continue as the number of cars is increasing continuously. Also, urban density, which is 31% of the total population in this district is going to increase due to the political situation which restricts the area where Palestinian people are allowed to build homes.
Recommendations
1. Cars older than 20 years should be stopped as the emissions of old cars rarely meet emission standards.
2. Establishment of modern automatic and in real-time air pollution monitoring networks in the West Bank districts.
3. Adopting air pollution emission standards. 4. Closing all dumping sites and designing new locations for all districts based on
scientific procedure and standards. Designed landfills should be the final step in the solid waste disposal system and burning of solid waste in open areas should be prevented.
5. Encouraging the use of unleaded gasoline by reducing its price and importing cars which use such kind of fuel.
6. Adding taxes in proportion to the amount of gases emitted by factories. 7. Administrative measures to strengthen enforcement of air pollution legislation,
and regulations should be carried out. 8. Raise awareness about noise pollution. 9. Create, collect, and distribute information and resources regarding noise pollution. 10. Strengthen laws and governmental efforts to control noise pollution.

References
1. Abu-Libdeh, H. (1993), "The Human Resources in Healths Interim Report No.2, A Summary of Main Findings", PRC, East Jerusalem.
2. Agricultural Department of Tulkarm district, "Statistical Data about Areas, Productivity and Production of Different Cultivated Crops in the 1993/1994 Growing Season.
3. Al-Dabbagh, M. (1991), "Beladana Phalastin", Vol. 3, Dar Al-Huda, Kufr Qari' (Arabic).
4. Al-Hamidi, M., Van Duijl, B. and Jouda, A. (1995), "Solid Waste Collection and Disposal Strategies for the Future", a paper in "A Strategy for Water Sector Capacity Building in Palestine", Proceedings of the Symposium, Birzeit University.
5. Applied Research Institute - Jerusalem (ARIJ) (1995), "Medical Waste Disposal Survey", Bethlehem -West Bank.
6. Applied Research Institute of Jerusalem (1995), The computerized Water Data Base.
7. Applied Research Institute-Jerusalem (ARIJ) (1995), "Water Database", Bethlehem.
8. Applied Research Institute-Jerusalem (ARIJ) (1996), "Energy Database", West Bank.

9. Barghougthi, M. and Daibes, I. (1993), "Infrastructure and Health Services in the West Bank: Guidelines for Health Care Planning", The Health Development Information Project in Cooperation with the World Health Organization (WHO), Ramallah - West Bank.
10. Bruce, James P. (1996), "Rethinking Transportation in a Warmer World", ECODECISON, Environmental and Policy Magazine, Vol. 21, pp. 23-26.
11. Center for Engineering and Planning, (1993), "The Palestinian Electricity Sector, Guid lines for Construction and Development", Ramallah - West Bank.
12. Dan, J. et al., (1976), "The soils of Israel (with map 1:50,000), Division of Scientific Publications", The Volcani Center, Bet Dagen, Israel.
13. Encyclopedia Palestine (1984), Vol 3, Encyclopedia Palestina Corporation, Damascus, (Arabic).
14. Husary, Samar et al., (1995), "Analysis of Secondary Source Rainfall Data from the Northern West Bank", Palestinian Hydrology Group, Jerusalem, West Bank, Palestine.
15. Institute for Solid Wastes of the American Public Works Association (1975), "Solid Waste Collection Practice", 4th edition, Slavik Printing Company, Chicago, Illinois.
16. Isaac, J. et al. (1995), "Water Supply and Demand in Palestine: 1990 Baseline Estimates and Projections for 2000, 2010, and 2020, Up-dated Version", Applied Research Institute - Jerusalem and Harvard Institute for International Development for Harvard Middle East Water Project.
17. Israel Yearbook and Almanac (1996), Vol. 50, IBRT Translation/Documentation Ltd., Jerusalem, Israel.
18. Israeli Ministry of Defence Publishing House and Carta (1993), "Carta Official Guide to Israel, Jerusalem".
19. Israeli-Palestinian Interim Agreement on the West Bank and the Gaza Strip (1995) Washington D.C.
20. Kessler, Y. (1994), "Climatic Characteristics of Judea and Samaria", Report from the Civil Administration of Judea and Samaria.
21. Lesch, Ann Mosely (1992), "Transition to Palestinian Self-Government: Practical Steps Toward Israeli-Palestinian Peace", Report of a Study Group Convened by the American Academy of Arts and Sciences, Indiana University Press, USA.
22. Mara, Duncan and Cairncross, Sandy (1989), "Guidelines for the Safe Use of Wastewater and Excreta in Agriculture and Aquaculture", World Health Organization in collaboration with the United Nations Environment Programme, Geneva.
23. Nuseibeh, M. and Nasser Eddin, T. (1995), "Palestinian Fresh Water Springs - Springs Palestinian Bureau of Statistics (1994), "Small Area Population in the West Bank and Gaza Strip", Ramallah - West Bank.
24. Orni, E. and Efrat, E. (1980), "Geographic of Israel", Fourth Revised Edition, Keter Press, Jerusalem. Israel.

25. Palestinian Agricultural Relief Committees (PARC) and Arab Thought Forum (1944). "Final Report on Dairy Cows and Poultry Random Sample Survey in the West Bank and Gaza Strip", Volume 2, No. 2.
26. Palestinian Agricultural Relief Committees (PARC) and Arab Thought Forum (1993), "Final Report on Sheep and Goat Herds Survey in the West Bank and Gaza Strip". Vol. 1, No. 6, (Arabic).
27. Palestinian Agricultural Relief Committees (PARC) and Arab Thought Forum (1994), "Final report on Population and Labor Income and Expenditure in the West Bank and Gaza Strip", Vol. 2, No.5 (Arabic).
28. Palestinian Agricultural Relief Committees (PARC) and Arab Thought Forum (1994), "Final Report on Beehives; A Comprehensive Survey in the West Bank and Gaza Strip", Vol. 2, No. 3 (Arabic).
29. Palestinian Agricultural Relief Committees (PARC) and Arab Thought Forum, (1994), "Final Report on Dairy Cows and Poultry; Random Sample Survey in the West Bank and Gaza Strip", Vol. 2, No. 2 (Arabic).
30. Palestinian Bureau of Statistics and Ministry of Education and Higher Education (1995), "Education Statistics Yearbook, 1994/1995", No.1, Ramallah - West Bank.
31. Palestinian Council of health (PCH) (1994), "The Palestinian Health Services in the West Bank and Gaza Strip, Facts and Figures", Planning and Research Center (PRC), East Jerusalem.
32. Palestinian Economic Council for Development and Reconstruction (PECDAR) (1996), "West Bank and Gaza Projects for Roads, Water and Wastewater", East Jerusalem.
33. Palestinian Energy Research Center (1995), "The Present Status of Electricity Services in the West Bank", Jerusalem.
34. Palestinian Hydrology Group (1995), "Analysis of Secondary Source Rainfall Data from the Northern West Bank, Jerusalem.
35. Palestinian Liberation Organization (PLO) (1993), "Water in Palestine" , Tunisia
36. Rofe and Raffety Consulting Engineers (1965), "Nablus District Water Resources Survey", Geological and Hydrogeological Report, Submitted for the Central Water Authority of Jordan, Westminister, London.
37. Saleh, A., F Neiroukh, O. Ayyash, S. Gasteyer (1995), "Pesticide Usage in the West Bank", Applied Research Institute-Jerusalem (ARIJ).
38. Sawyer, C.N. and McCarty, P.L. (1967), "Chemistry for Sanitary Engineers, 2nd ed., McGraw-Hill, New York, 518 pp.
39. The European Palestinian Chamber of Commerce (1995), "Palestinian Directory for Industry, Commerce and Services", Jerusalem - West Bank.
40. Transportation Officer, West Bank Department for Vehicle Lcensing, Beit Eil (1995).
41. Tufekgy, K. (1994), "Israeli Settlements in the West Bank", Arab Studies Society, Jerusalem (Arabic).

42. UNRWA in the West Bank (1994), "Fact Sheet Revision. Public Information Office.
43. West Bank Water Department (WBWD) (1995), " Records of the West Bank Water Department Files".
44. Wilcox, L. V. (1955), "Classification and Use of Irrigation Waters", US Department of Agriculture Circ. 969, Washington, D. C., 19 pp.
45. World Bank (1990), "Israel Water Sector Study, Past Achievements, Current Problems and Future Options, Tel Aviv.
46. World Bank (1993), "Developing the Occupied Territories, An Investment in Peace, Volume 1: Overview, Washington, D.C.
47. World Health Organization (WHO) (1993), "Assessment of Sources of Air, Water and Land Pollution", Geneva.

Appendix I Institutions in the Tulkarm District
• = Hospitals, Clinics and Medical Centers
o Qalqiliya UNRWA Hospital o Tulkarm Government Hospital o Tulkarm Red Crescent Hospital o Society for the Blind in Tulkarm
• = Religious Forum
o Islamic Waqf o Islamic Court o Zaka' Committees o Charity Alms Tax
• = Universities, Colleges and Training Centers
o Khaduri College o Scientific College for Islamic Studies
• = Associations and Non Governmental Organizations
o The Chamber of Commerce, Industry and Agriculture o National Institute of Fine Art o Agricultural Cooperative Society o A'nabta Women's Society o Al o Morabitat Charitable Society o Arab Orphanage Society o General Union of Palestinian Women's Committees for Social
Work o Jordan Family Planning and Protection Association

Appendix II
Table 9.2: Solid Waste Management and Estimated Generated Waste in the Tulkarm District
Name (zone) Population Quantity
(Ton/day)
Number of vehicles
Labor Disposal site
Distance (km)
Annual fee(JD)
A'izbat El Mudawwar 100* 0.1 0 0 Randomly - -
A'izbat Salman 500* 0.5 0 0 Randomly - -
A'izbat Et Tabeeb 75 0.1 0 0 Randomly - -
A'izbat Shoufa 444 0.4 0 0 Randomly - -
A'llar 5799 5.2 1AT 2 A'llar 2 6
A'nabta 9325 8.4 1T 10 A'nabta 4 R=3
C=6 A'ttil 9372 8.4 1AT 2 in valley 0.5 15 A'zoun 5269 4.7 1AT 3 Jaiyus 1.5 9 Bala'a 6203 5.6 1AT 2 Bala'a 1.5 9 Baqa Esh Sharqiya 3477 3.1 1AT 2 Baqa Esh
Sharqiya 0.1 11
Beit Amin 872 0.8 0 0 Randomly - - Beit Leed 5080 4.6 0 0 Randomly - - Dannaba 3814 3.4 0 0 Tulkarm 3.5 15 Deir El Ghusun 8635 7.8 1AT 2 Deir El
Ghusun 2.5 12
Eirtah 2625 2.4 0 0 Eirtah 2.5 15 En Nazla El Gharbiya
743 0.7 0 0 Randomly - -
En Nazla 498 0.4 0 0 Randomly - -

El Wusta En Nazla Esh- 1706 1.5 0 0 Randomly - -
Er Ras 594 0.5 0 0 Randomly - - Falame 522 0.5 0 0 Randomly - - Faro'un 3007 2.7 1AT 3 Faro'un 0.15 12 Habla 4349 3.9 1T 3 Tulkarm 12 30 Jaiyus 2704 2.4 1AT 2 Jaiyus 1.5 15 Kafa 524 0.2 0 0 Randomly - - Kafr A'bbush 1457 1.3 1AT 2 Kafr
A'bbush - 30
Kafr El Labad 3483 3.1 1AT 2 Tulkarm 4 9
Kafr Jammal 2225 2.0 1AT 2 Salfit 3 30
Kafr Sur 1125 1.0 1AT 2 Salfit 2 30
Kafr Zibad 1280 1.1 1AT 2 Kafr Zibad - 30
Kh. Ed Dab'a 120 0.1 0 0 Randomly - -
Kh. El Ashqar 208 0.2 0 0 Randomly - -
Kh. En Nabi Elyas 909 0.8 0 0 Randomly - -
Kh. Jabara 168 0.2 1AT 0 Randomly - - Kh. Jarushyia 696 0.6 0 0 Randomly - -
Kh.Esheikh Ahmed 52 0.1 0 0 Randomly - -
Kh.Ras A'tiya 933 0.8 Animal
Cart 1 Kh.Ras A'tiya 0.5 30
Kh.Ras El Tira 439 0.4 0 0 Randomly - -
Kour 411 0.4 0 0 Randomly - - Nazlat Abu Nar 142 0.1 0 0 Baqa Esh
Sharqiya 1 11
Nazlat I'sa 2056 1.8 1AT 1 Nazlat I'sa 4 9
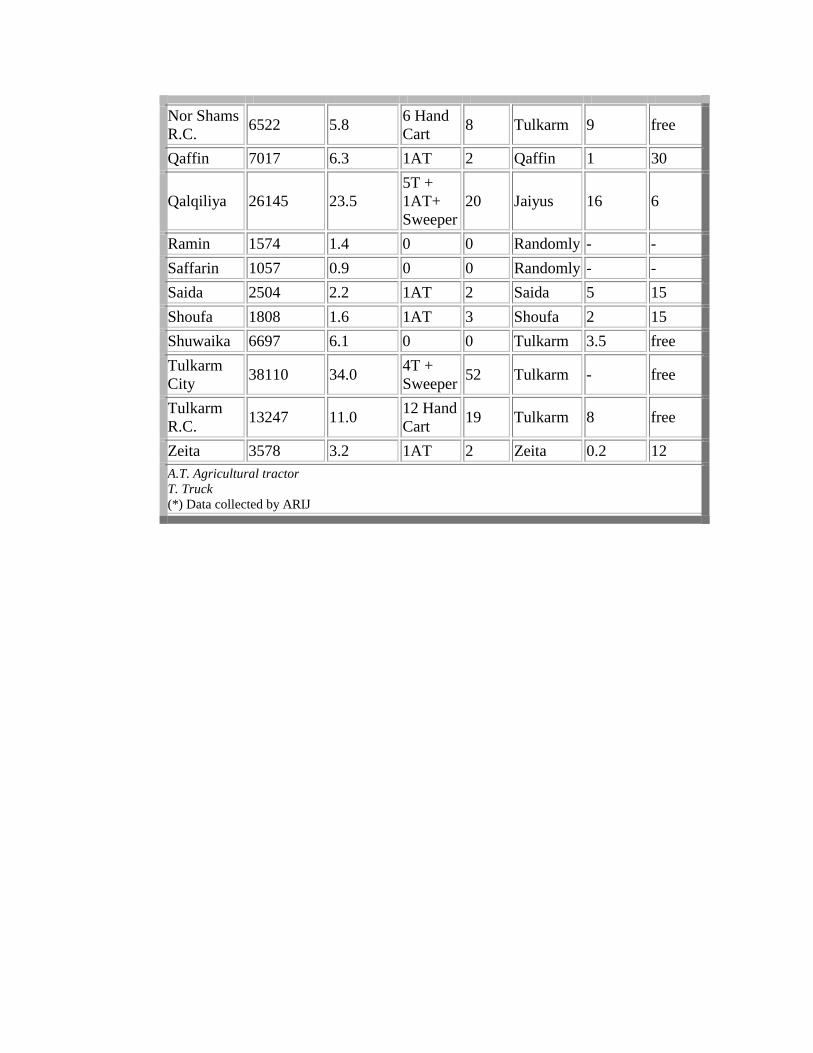
Nor Shams R.C. 6522 5.8 6 Hand
Cart 8 Tulkarm 9 free
Qaffin 7017 6.3 1AT 2 Qaffin 1 30
Qalqiliya 26145 23.5 5T + 1AT+ Sweeper
20 Jaiyus 16 6
Ramin 1574 1.4 0 0 Randomly - - Saffarin 1057 0.9 0 0 Randomly - - Saida 2504 2.2 1AT 2 Saida 5 15 Shoufa 1808 1.6 1AT 3 Shoufa 2 15 Shuwaika 6697 6.1 0 0 Tulkarm 3.5 free Tulkarm City 38110 34.0 4T +
Sweeper 52 Tulkarm - free
Tulkarm R.C. 13247 11.0 12 Hand
Cart 19 Tulkarm 8 free
Zeita 3578 3.2 1AT 2 Zeita 0.2 12 A.T. Agricultural tractor T. Truck (*) Data collected by ARIJ
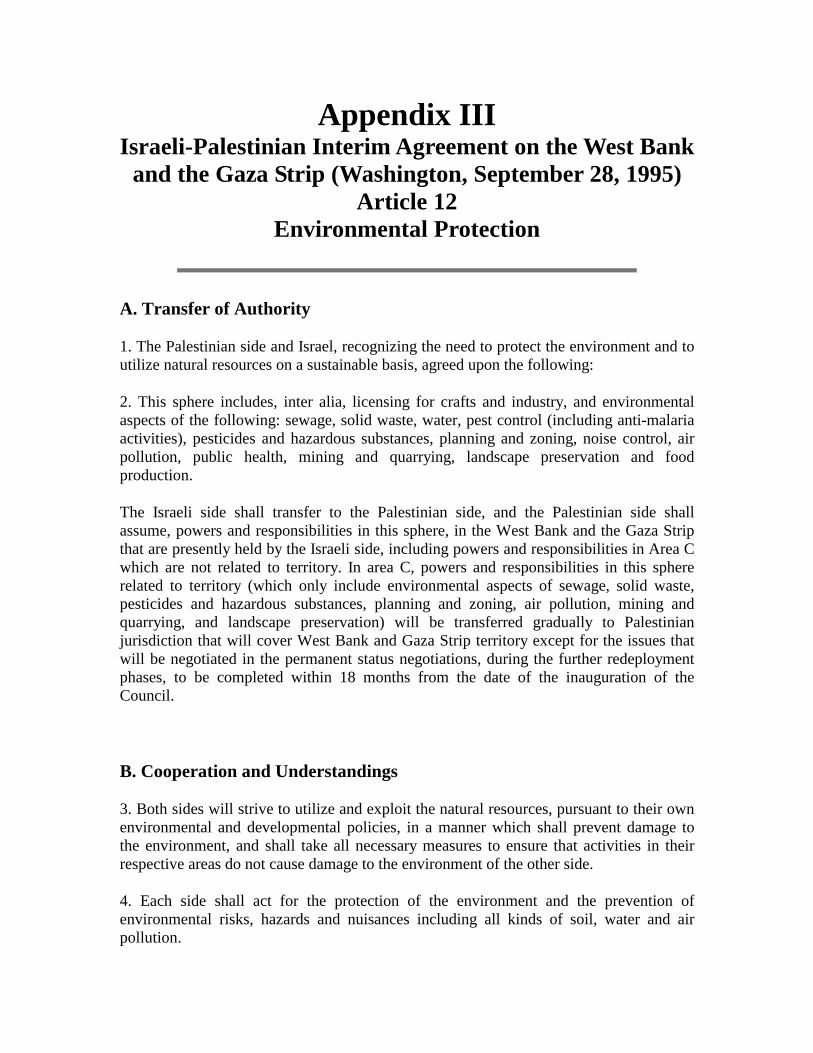
Appendix III Israeli-Palestinian Interim Agreement on the West Bank
and the Gaza Strip (Washington, September 28, 1995) Article 12
Environmental Protection
A. Transfer of Authority
1. The Palestinian side and Israel, recognizing the need to protect the environment and to utilize natural resources on a sustainable basis, agreed upon the following:
2. This sphere includes, inter alia, licensing for crafts and industry, and environmental aspects of the following: sewage, solid waste, water, pest control (including anti-malaria activities), pesticides and hazardous substances, planning and zoning, noise control, air pollution, public health, mining and quarrying, landscape preservation and food production.
The Israeli side shall transfer to the Palestinian side, and the Palestinian side shall assume, powers and responsibilities in this sphere, in the West Bank and the Gaza Strip that are presently held by the Israeli side, including powers and responsibilities in Area C which are not related to territory. In area C, powers and responsibilities in this sphere related to territory (which only include environmental aspects of sewage, solid waste, pesticides and hazardous substances, planning and zoning, air pollution, mining and quarrying, and landscape preservation) will be transferred gradually to Palestinian jurisdiction that will cover West Bank and Gaza Strip territory except for the issues that will be negotiated in the permanent status negotiations, during the further redeployment phases, to be completed within 18 months from the date of the inauguration of the Council.
B. Cooperation and Understandings
3. Both sides will strive to utilize and exploit the natural resources, pursuant to their own environmental and developmental policies, in a manner which shall prevent damage to the environment, and shall take all necessary measures to ensure that activities in their respective areas do not cause damage to the environment of the other side.
4. Each side shall act for the protection of the environment and the prevention of environmental risks, hazards and nuisances including all kinds of soil, water and air pollution.
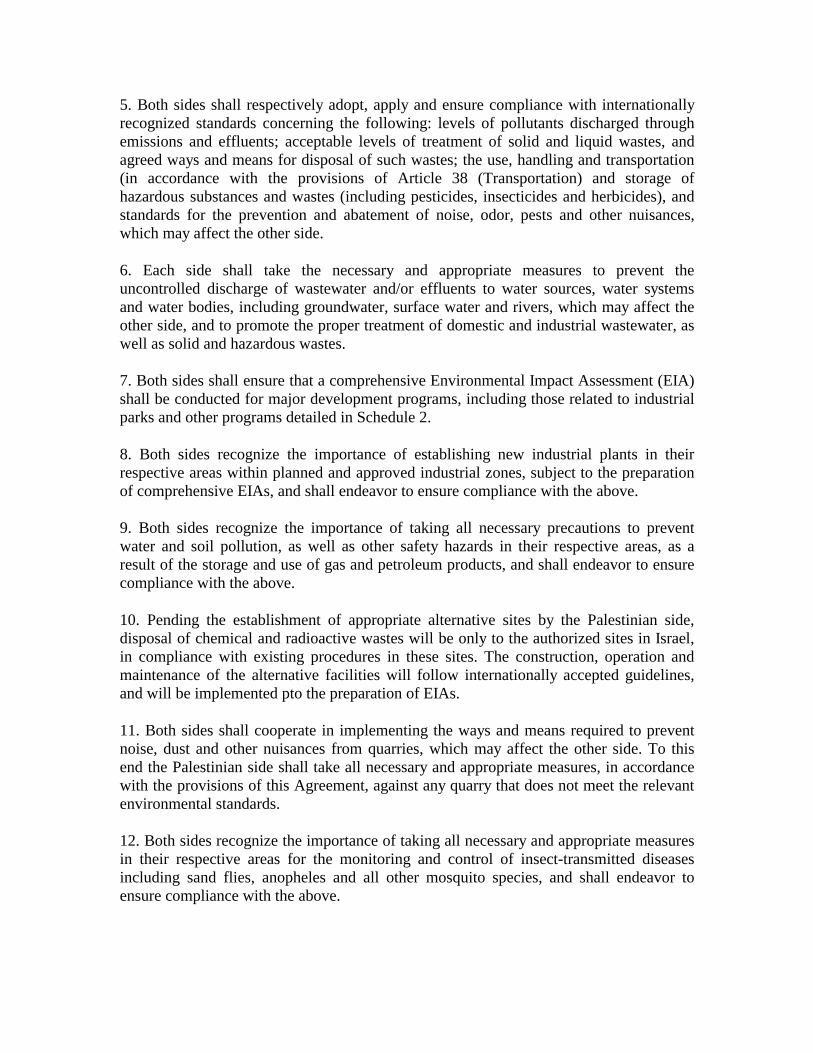
5. Both sides shall respectively adopt, apply and ensure compliance with internationally recognized standards concerning the following: levels of pollutants discharged through emissions and effluents; acceptable levels of treatment of solid and liquid wastes, and agreed ways and means for disposal of such wastes; the use, handling and transportation (in accordance with the provisions of Article 38 (Transportation) and storage of hazardous substances and wastes (including pesticides, insecticides and herbicides), and standards for the prevention and abatement of noise, odor, pests and other nuisances, which may affect the other side.
6. Each side shall take the necessary and appropriate measures to prevent the uncontrolled discharge of wastewater and/or effluents to water sources, water systems and water bodies, including groundwater, surface water and rivers, which may affect the other side, and to promote the proper treatment of domestic and industrial wastewater, as well as solid and hazardous wastes.
7. Both sides shall ensure that a comprehensive Environmental Impact Assessment (EIA) shall be conducted for major development programs, including those related to industrial parks and other programs detailed in Schedule 2.
8. Both sides recognize the importance of establishing new industrial plants in their respective areas within planned and approved industrial zones, subject to the preparation of comprehensive EIAs, and shall endeavor to ensure compliance with the above.
9. Both sides recognize the importance of taking all necessary precautions to prevent water and soil pollution, as well as other safety hazards in their respective areas, as a result of the storage and use of gas and petroleum products, and shall endeavor to ensure compliance with the above.
10. Pending the establishment of appropriate alternative sites by the Palestinian side, disposal of chemical and radioactive wastes will be only to the authorized sites in Israel, in compliance with existing procedures in these sites. The construction, operation and maintenance of the alternative facilities will follow internationally accepted guidelines, and will be implemented pto the preparation of EIAs.
11. Both sides shall cooperate in implementing the ways and means required to prevent noise, dust and other nuisances from quarries, which may affect the other side. To this end the Palestinian side shall take all necessary and appropriate measures, in accordance with the provisions of this Agreement, against any quarry that does not meet the relevant environmental standards.
12. Both sides recognize the importance of taking all necessary and appropriate measures in their respective areas for the monitoring and control of insect-transmitted diseases including sand flies, anopheles and all other mosquito species, and shall endeavor to ensure compliance with the above.

13. Both sides shall cooperate in implementing internationally accepted principles and standards relating to environmental issues of global concern, such as the protection of the ozone layer.
14. Israel and the Palestinian side shall cooperate in implementing principles and standards, which shall conform with internationally accepted principles and standards, concerning the protection of endangered species and of wild fauna and flora, including restriction of trade, conservation of migratory species of wildlife and preservation of existing forests and nature reserves.
15. Israel and the Palestinian side shall respectively operate an emergency warning system in order to respond to events or accidents which may generate environmental pollution, damage or hazards. A mechanism for mutual notification and coordination in cases of such events or accidents will be established.
16. Recognizing the unsatisfactory situation of the environment in the West Bank, and further recognizing the mutual interest in improving this situation, Israel shall actively assist the Palestinian side, on an ongoing basis, in attaining this goal.
17. Each side shall promote public awareness on environmental issues.
18. Both sides shall work on appropriate measures to combat desertification.
19. Each side shall control and monitor the transfer of pesticides and any internationally banned and restricted chemicals in their respective areas.
20. Each side shall reimburse the other for environmental services granted in the framework of mutually agreed programs.
21. Both sides shall cooperate in the carrying out of environmental studies, including a profile, in the West Bank.
22. For the mutual benefit of both sides, the relevant Israeli authorities and the Palestinian Environmental Protection Authority and/or other relevant Palestinian authorities shall cooperate in different fields in the future.
Both sides will establish an Environmental Experts Committee for environmental cooperation and understandings.
Additional environmental provisions are included in Article 14 (Forests), Article 25 (Nature Reserves), Article 26 (Parks), Article 27 (Planning and Zoning), Article 31 (Quarries and Mines), Article 40 (Water and Sewage).
Annex VI, the Protocol Concerning Israeli-Palestinian Cooperation Programs relates, inter alia, to cooperation in the protection of the environment.