environmental product declaration for various ready mix
TRANSCRIPT

1
Environmental Product Declaration for various ready mix concrete products
produced by Holcim México Operaciones, S.A. de C.V. at their Dulces Nombres
Concrete Plant facility in Apodaca
AUGUST 16, 2021
2
Administrative information
International Certified Environmental Product Declaration

3
Company Description
Holcim Mexico produces and markets cement, ready-mix concrete, and other products and
services for construction. The company has a nationwide presence through 7 cement plants
with a current installed capacity to produce 12.6 million tons per year, 23 cement
distribution centers, two maritime terminals, 1 Corporate Office, plus 35 ready-mix concrete
plants, seven platforms, and a Geocycle transfer center, 26 commercial partners with more
than 90 ready-mix concrete plants, more than 500 mixing pots, one aggregates plant and a
Technological Innovation Center for Construction (CITEC).
Sustainable Development is an integral part of LafargeHolcim’s strategy around the world.
Holcim Mexico has a clear vision of the future it wants for our country, which contributes to
its development. Holcim Mexico’s main objective is to create value. Creating value ensures
long-term business success in covering the triple bottom line (i.e., social, economic,
environmental values). Finally, good operating performance and a solid return on invested
capital go hand in hand with sustainable development.
Holcim continues to invest in research and development. They have the Innovation and
Development Center, located in Lyon (France), with satellite locations in various regions
developing a comprehensive portfolio of innovators and sustainable solutions. These include
different categories: inclusive business models, water management solutions, urban mining
solutions (recycled aggregates), waste treatment services, energy-efficient solutions
(insulating building materials), resource-efficient solutions (high recycled content, bags
soluble cement), and low CO2 building materials.
Holcim operates with the belief that they can gain an advantage by developing knowledge
and brand equity in the green building segment.
Study Goal

4
The intended application of this life cycle assessment (LCA) is to comply with the procedures
for creating a Type III environmental product declaration (EPD) and publish the EPD for
public review on the website, http://labelingsustainability.com/ . This level of study is in
accordance with EPD Product Category Rule (PCR) for Cement published by NSF (2020) and
is a PCR in accordance with ISO 21930 for Preparing an Environmental Product Declaration
for Portland, Blended Hydraulic, Masonry, Mortar, and Plastic (Stucco) Cements. EPDs for
cements that follow other PCRs may not be comparable.; International Standards
Organization (ISO) 14025:2006 Environmental labels and declarations, Type III
environmental declarations-Principles and procedures; ISO 14044:2006 Environmental
management, Life cycle assessment- Requirements and guidelines; and ISO 14040:2006
Environmental management, Life cycle assessment-Principles and framework. The
performance of this study and its subsequent publishing is in alignment with the business-to-
business (B2B) communication requirements for the environmental assessment of building
products. The study does not intend to support comparative assertions and is intended to be
disclosed to the public.
This project report was commissioned to differentiate Holcim Apasco SA de CV from their
competition for the following reasons: generate an advantage for the organization; offer
customers information to help them make informed product decisions; improve the
environmental performance of Holcim Apasco SA de CV by continuously measuring,
controlling and reducing the environmental impacts of their products; help project
facilitators working on Leadership in Energy and Environmental Design (LEED) projects
achieve their credit goal; and to strengthen Holcim Apasco SA de CV’s license to operate in
the community. The intended audience for this LCA report is Holcim Apasco SA de CV’s
employees, their suppliers, project specifiers of their products, architects, and engineers. The
EPD report is also available for policy makers, government officials interested in
sustainability, academic professors, and LCA professionals. This LCA report does not include
product comparisons from other facilities.
Only EPDs prepared from cradle-to-grave life-cycle results and based on the same function,
reference service life, and quantified by the same functional unit, can be used to assist
purchasers and users in making informed comparisons between products. Since EPDs
developed under these PCR only cover the cradle-to-gate impacts of portland, blended
hydraulic, masonry, mortar, or plastic (stucco) cements, using a declared unit, the results
cannot be used to compare products used in different mixtures and construction products.
The results from a Portland, blended hydraulic, masonry, mortar, or plastic (stucco) cements

5
EPD must be integrated into a comprehensive cradle-to-grave, ISO 14044-compliant LCA in
order to compare between different products. The basis of a comparison, where applicable,
shall include the product application in accordance with ISO 21930. ASTM (2014)
Description of product and scope
This EPD is primary reported Holcim data from the reference year 2020. It reports on the
four Portland cement mixes produced at the Ramos Azripe cement plant, made from
primarily limestone. These four cement mixes make up 100% of yearly production at the
Ramos Azripe cement plant. Cement from the Ramos Azripe cement plant is used in the
EPDs for concrete mixes for the following plants: Dulces Nombes, Escobedo, Mitras, Obispo,
Pesqueria, Santa Catarina, Artega, Ramos Azripe, and Derramadero which cover both the
Monterrey and Saltillo regions of Mexico.
Product standard definitions
This EPD reports the impacts for different cement products in accordance with the following
standards depending on the final product and region:
• CPC 30: Portland Blended Cement, Resistance Class 30; For all types of work or
concrete elements that must receive protection against moisture and its effects;
Roof slabs, slabs and walls for cisterns, pools, cisterns, water tanks.
• CPC 40: Portland Blended Cement, Resistance Class 40 ; Ideal for structural
elements and prefabricated parts in which the acquisition of initial and / or final
strength is important; Precast: blocks, joists, vaults, partitions and pavers.
Buildings, floors, pavements, posts and structural elements.
• CPC 40 R: For concrete elements and structures that require high initial and final
strengths; Structural elements of high-rise buildings, prestressed and post-
tensioned elements and repair of elements or works for rapid commissioning.
• CPMM: CPMM is a Portland Cement used for non-structural masonry work. The
work types include flattening of walls, entrance slopes and releasing, joining
masonry elements together, and as a glue for foundations and joints.
This LCA assumes the impacts from products manufactured in accordance with the standards
outlined in this report. This LCA is a cradle-to-gate study , and therefore, stages extending

6
beyond the plant gate are not included in this LCA. Excluded stages include transportation of
the manufactured material to the construction site; on-site construction processes and
components; building (infrastructure) use and maintenance; and “end-of-life” effects.
Cement design summary
The following tables provide a list of the cement products considered in this EPD along with
key performance parameters.
All declared products Table 1: Declared products with All declared products considered in this environmental product
declaration
Mix#
Unique
name/ID Short description
Product
type
Clinker
content,
wt% UUID
1 CPC 30 Portland Blended Cement, Resistance Class 30; For all types of work or concrete elements
that must receive protection against moisture and its effects; Roof slabs, slabs and walls
for cisterns, pools, cisterns, water tanks.
Ordinary
Portland
63.34 518a6f32-9fc2-4c5f-
9e65-aec7f2d952bb
2 CPC 40 Portland Blended Cement, Resistance Class 40 ; Ideal for structural elements and
prefabricated parts in which the acquisition of initial and / or final strength is important;
Precast: blocks, joists, vaults, partitions and pavers. Buildings, floors, pavements, posts
and structural elements.
Ordinary
Portland
85.22 8298f9e9-8fcd-498a-
b58b-d7a5a58c2db6
3 CPC 40 R For concrete elements and structures that require high initial and final strengths; Structural
elements of high-rise buildings, prestressed and post-tensioned elements and repair of
elements or works for rapid commissioning.
Ordinary
Portland
91.00 625fe40a-672c-435b-
96de-c4a8584d9db2
4 CPMM CPMM is a Portland Cement used for non-structural masonry work. The work types
include flattening of walls, entrance slopes and releasing, joining masonry elements
together, and as a glue for foundations and joints.
Ordinary
Portland
34.44 60423004-f2f9-47df-
820c-1d6d24521613
Cement design composition
The following figures provide mass breakdown (kg per functional unit) of the material
composition of each cement design considered. Please note that the presented breakdown
has been randomly altered by +/-10% and is therefore only an approximation; this
manipulation is to ensure confidentiality.
All declared products

7
Figure 1: Approximate material composition - All declared products per 1 tonne of cement.
Note: presented breakdown is approximate to ensure confidentiality.
A1 raw material recycled content and material losses
The following table provides a list of the raw material inputs (module A1) across all products
considered, their recyclability content and assumed material losses.
Table 2: Module A1 raw material inputs, the recyclability content and assumed material losses (dry basis)
product.name mix.category primary.content post.industrial.content post.consumer.content material.losses
Petroleum coke Fuel 1 0 0 0.02
Coal Fuel 1 0 0 0.02
Heavy Fuel Oil Fuel 1 0 0 0.02
Industrial Solvents otherEcoinvent 0 0 1 0.02
Liquid Solvents otherEcoinvent 0 0 1 0.02
Sludge SCMs 1 0 0 0.02
Limestone Limestone 0 0 1 0.02
Clay otherEcoinvent 1 0 0 0.02

8
product.name mix.category primary.content post.industrial.content post.consumer.content material.losses
Shale otherEcoinvent 1 0 0 0.02
Fluorspar otherEcoinvent 1 0 0 0.02
Biomass otherEcoinvent 1 NA NA 0.02
Tar otherEcoinvent 0 NA 1 0.002
Natural gas Fuel 1 NA NA 0.001
Clinker Clinker 1 0 0 0
Gypsum Gypsum 1 0 0 0.02
Limestone Limestone 1 0 0 0.02
Fly Ash SCMs 0 0 1 0.02
Cement packing otherEcoinvent 0.2 0 0.8 0.02
Propane otherEcoinvent 1 0 0 0
Diesel otherEcoinvent 1 NA NA 0
Natural gas otherEcoinvent 1 NA NA 0
Cement Kiln Dust SCMs 1 0 1 0
System boundaries
The following figure depicts the cradle-to-gate system boundary considered in this study:

9
Figure 2: General life cycle phases for consideration in a construction works system
This is a Cradle-to-gate life cycle assessment and the following life cycle stages are included
in the study:
• A1: Raw material supply (upstream processes) - Extraction, handling, and
processing of the materials used in manufacturing the declared products in this
LCA.
• A2: Transportation - Transportation of A1 materials from the supplier to the
“gate” of the manufacturing facility (i.e. A3).
• A3: Manufacturing (core processes)- The energy and other utility inputs used to
store, move, and manufacturer the declared products and to operate the facility.
As according to the PCR, the following figure illustrates the general activities and input
requirements for producing cement products and is not necessarily exhaustive.

10
Figure 3: General system inputs considered in the product system and categorized by
modules in scope

11
Figure 4: Manufacturing process of Holcim cement.
In addition, as according to the relevant PCR, the following requirements are excluded from
this study:
• Production, manufacture and construction of A3 building/capital goods and
infrastructure;
• Production and manufacture of steel production equipment, steel delivery
vehicles, earthmoving equipment, and laboratory equipment;
• Personnel-related activities (travel, furniture, office supplies);
• Energy use related to company management and sales activities.
For this LCA the manufacturing plant, owned and operated by Holcim Apasco SA de CV, is
located at their Ramos Arizpe Cement Plant facility in Mexico. All operating data is
formulated using the actual data from Holcim Apasco SA de CV’s plant at the above location,
including water, energy consumption and waste generation. All inputs for this system
boundary are calculated for the plant.

12
This life cycle inventory was organized in a spreadsheet and was then input into an RStudio
environment where pre-calculated LCIA results for relevant products/activies stemming
from the ecoinvent v3.6 database and a local EPD database in combination with primary data
from Holcim Apasco SA de CV were utilized. Explanations of the contribution of each data
source to this study are outlined in the section ‘Data Sources and Quality’. Further LCI
details for each declared product are provided in the sections ‘Detailed LCI tables’ and
‘Transport tables’ of the detailed LCA report. A parameter uncertainty analysis was also
performed where key statistical results (e.g. min/mean/max etc.) are provided in the detailed
LCA report.
Cut-off criteria
ISO 14044:2006 and the focus PCR requires the LCA model to contain a minimum of 95% of
the total inflows (mass and energy) to the upstream and core modules be included in this
study. The cut-off criteria were applied to all other processes unless otherwise noted above as
follows. A 1% cut-off is considered for all renewable and non-renewable primary energy
consumption and the total mass of inputs within a unit process where the total of the
neglected inputs does not exceed 5%.
Data Sources and Data Quality Assessment
The following table summarizes the facility’s (i.e. A3) electricity consumption and
generation (if applicable), process/space heating requirements, fuel inputs for on-site
machinery, and waste generation.
Table 3: Inputs required by facility from 2020-01-01 to 2020-12-31 (365 days) to produce 1711487 tonne
of cement
Activity Value Units
Electricity consumption and generation (if applicable)
Gross grid electricity: 49608846 kWh
Waste generation
Wash water 0 m3
Hazardous waste 228660 kg
Non-hazardous waste 310200 kg
High-level radioactive waste 0 kg
No recovered on-site energy occurs at this facility.
13
No re-used or recycled material for utilization on-site or off-site was reported at this facility.
The following statements explain how the above facility requirements/generation were
derived:
• Raw material transport: A combination of actual mode/distance combinations
were assumed for key bulk materials whereas ecoinvent default multi-modal
market mix distances were assumed for other inputs where no original data could
be provided.
• Electricity: Electricity generation and consumption values were based on monthly
utility bills and Holcim’s 2020 GHG emissions reports. This facility uses both CFE,
Mexico’s main utility and Iberdrola, an alternate energy provider that does not use
oil or coal as part of their energy mix. An Iberdrol- specific process was created
with Iberdrola’s unique mix. Since they would not release information about their
exact energy mix transmitted to the cement plant location, assumptions were
made based on available data on nominal capacities of each generation technology
and average annual capacity factors for each energy production type. Further
information can be found in the section Additional Information.
• Process/space heating: All fuel consumed for process/space heating was accounted
for. For direct emissions as a result of accounting see A3 emissions explanation.
• Fuel required for machinery: For all onsite machinery emission values were
determined by a combination of direct Holcim reporting of carbon dioxide (CO2),
methane (CH4), and nitrous oxide (N2O), and ecoinvent 3.4 unit processes.
Holcim reports yearly on only three (3) of the six (6) main greenhouse gases
(GHG). To obtain a full list of emissions from direct emissions for fuel combustion,
Holcim direct reporting was supplemented with ecoinvent 3.4 unit processes for
the combustion of fuels onsite in their machinery. The list of fuels burned in
various onsite machinery includes gasoline, diesel, and propane.
• Waste generation: Waste values were based on waste management receipts for
2020.
• Recovered energy: All the waste fly ash from the cement processing is used as
input to other Holcim products and/or processes. Holcim does not create waste
from this process to send to a landfill.
• Recycled/reused material/components: Due to lack of data, default loss factors
were assumed.
14
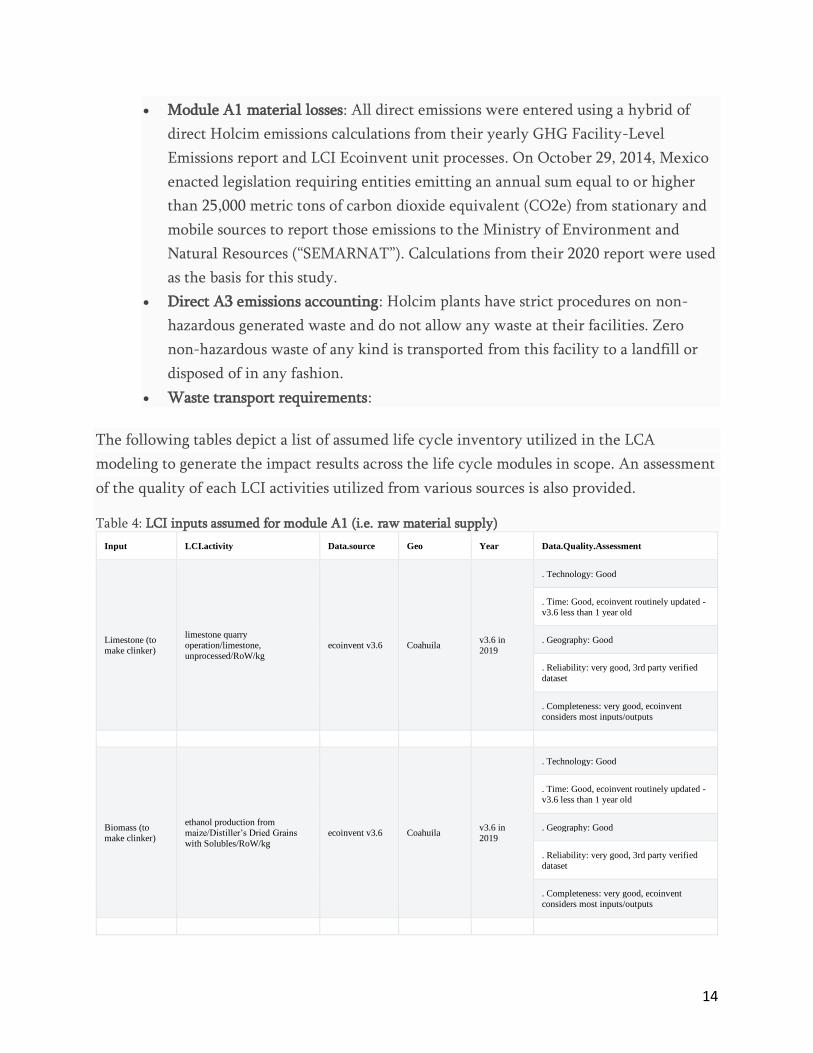
• Module A1 material losses: All direct emissions were entered using a hybrid of
direct Holcim emissions calculations from their yearly GHG Facility-Level
Emissions report and LCI Ecoinvent unit processes. On October 29, 2014, Mexico
enacted legislation requiring entities emitting an annual sum equal to or higher
than 25,000 metric tons of carbon dioxide equivalent (CO2e) from stationary and
mobile sources to report those emissions to the Ministry of Environment and
Natural Resources (“SEMARNAT”). Calculations from their 2020 report were used
as the basis for this study.
• Direct A3 emissions accounting: Holcim plants have strict procedures on non-
hazardous generated waste and do not allow any waste at their facilities. Zero
non-hazardous waste of any kind is transported from this facility to a landfill or
disposed of in any fashion.
• Waste transport requirements:
The following tables depict a list of assumed life cycle inventory utilized in the LCA
modeling to generate the impact results across the life cycle modules in scope. An assessment
of the quality of each LCI activities utilized from various sources is also provided.
Table 4: LCI inputs assumed for module A1 (i.e. raw material supply)
Input LCI.activity Data.source Geo Year Data.Quality.Assessment
Limestone (to
make clinker)
limestone quarry
operation/limestone,
unprocessed/RoW/kg
ecoinvent v3.6 Coahuila v3.6 in
2019
. Technology: Good
. Time: Good, ecoinvent routinely updated -
v3.6 less than 1 year old
. Geography: Good
. Reliability: very good, 3rd party verified
dataset
. Completeness: very good, ecoinvent
considers most inputs/outputs
Biomass (to
make clinker)
ethanol production from
maize/Distiller’s Dried Grains
with Solubles/RoW/kg
ecoinvent v3.6 Coahuila v3.6 in
2019
. Technology: Good
. Time: Good, ecoinvent routinely updated -
v3.6 less than 1 year old
. Geography: Good
. Reliability: very good, 3rd party verified
dataset
. Completeness: very good, ecoinvent
considers most inputs/outputs

15
Input LCI.activity Data.source Geo Year Data.Quality.Assessment
Coal (to make
clinker)
market for hard coal/hard
coal/RoW/kg ecoinvent v3.6
NA
v3.6 in
2019
. Technology: Good
NA . Time: Good, ecoinvent routinely updated -
v3.6 less than 1 year old
NA . Geography: Good
NA . Reliability: very good, 3rd party verified
dataset
NA . Completeness: very good, ecoinvent
considers most inputs/outputs
Tar (to make
clinker)
market for waste bitumen/waste
bitumen/RoW/kg ecoinvent v3.6 Coahuila
v3.6 in
2019
. Technology: Fair
. Time: Good, ecoinvent routinely updated -
v3.6 less than 1 year old
. Geography: Fair
. Reliability: very good, 3rd party verified
dataset
. Completeness: very good, ecoinvent
considers most inputs/outputs
Clay (to make
clinker) market for clay/clay/RoW/kg ecoinvent v3.6 Coahuila
v3.6 in
2019
. Technology: Good
. Time: Good, ecoinvent routinely updated -
v3.6 less than 1 year old
. Geography: Good
. Reliability: very good, 3rd party verified
dataset
. Completeness: very good, ecoinvent
considers most inputs/outputs
Natural gas (to
make clinker)
market for natural gas, high
pressure/natural gas, high
pressure/US/m3
ecoinvent v3.6 Coahuila v3.6 in
2019
. Technology: Good
. Time: Good, ecoinvent routinely updated -
v3.6 less than 1 year old
. Geography: Good
. Reliability: very good, 3rd party verified
dataset
. Completeness: very good, ecoinvent
considers most inputs/outputs
Industrial
Solvents (to
make clinker)
market for spent solvent
mixture/spent solvent
mixture/RoW/kg
ecoinvent v3.6
NA
v3.6 in
2019
. Technology: Good
NA . Time: Good, ecoinvent routinely updated -
v3.6 less than 1 year old
16
Input LCI.activity Data.source Geo Year Data.Quality.Assessment
NA . Geography: Good
NA . Reliability: very good, 3rd party verified
dataset
NA . Completeness: very good, ecoinvent
considers most inputs/outputs
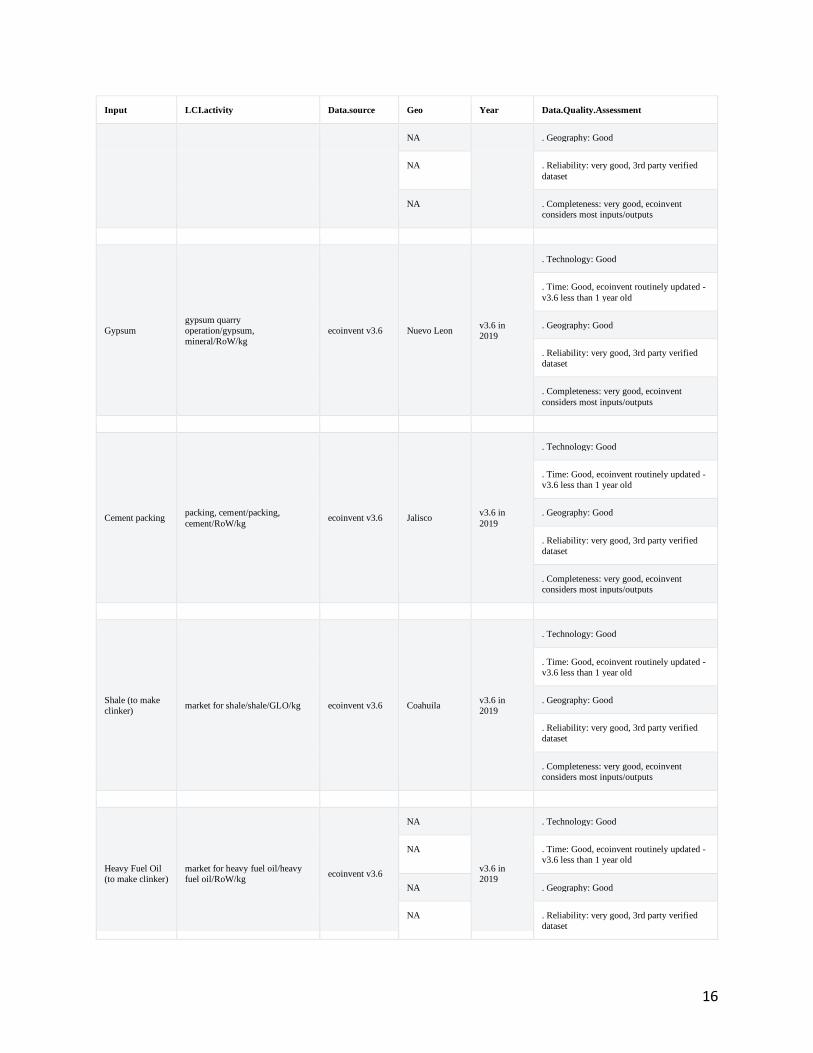
Gypsum
gypsum quarry
operation/gypsum,
mineral/RoW/kg
ecoinvent v3.6 Nuevo Leon v3.6 in
2019
. Technology: Good
. Time: Good, ecoinvent routinely updated -
v3.6 less than 1 year old
. Geography: Good
. Reliability: very good, 3rd party verified
dataset
. Completeness: very good, ecoinvent
considers most inputs/outputs
Cement packing packing, cement/packing,
cement/RoW/kg ecoinvent v3.6 Jalisco
v3.6 in
2019
. Technology: Good
. Time: Good, ecoinvent routinely updated -
v3.6 less than 1 year old
. Geography: Good
. Reliability: very good, 3rd party verified
dataset
. Completeness: very good, ecoinvent
considers most inputs/outputs
Shale (to make
clinker) market for shale/shale/GLO/kg ecoinvent v3.6 Coahuila
v3.6 in
2019
. Technology: Good
. Time: Good, ecoinvent routinely updated -
v3.6 less than 1 year old
. Geography: Good
. Reliability: very good, 3rd party verified
dataset
. Completeness: very good, ecoinvent
considers most inputs/outputs
Heavy Fuel Oil
(to make clinker)
market for heavy fuel oil/heavy
fuel oil/RoW/kg ecoinvent v3.6
NA
v3.6 in
2019
. Technology: Good
NA . Time: Good, ecoinvent routinely updated -
v3.6 less than 1 year old
NA . Geography: Good
NA . Reliability: very good, 3rd party verified
dataset

17
Input LCI.activity Data.source Geo Year Data.Quality.Assessment
NA . Completeness: very good, ecoinvent
considers most inputs/outputs
Sludge (to make
clinker)
market for fly ash and scrubber
sludge/fly ash and scrubber
sludge/RoW/kg
ecoinvent v3.6 Coahuila v3.6 in
2019
. Technology: Good
. Time: Good, ecoinvent routinely updated -
v3.6 less than 1 year old
. Geography: Good
. Reliability: very good, 3rd party verified
dataset
. Completeness: very good, ecoinvent
considers most inputs/outputs
Fluorspar (to
make clinker)
market for fluorspar, 97%
purity/fluorspar, 97%
purity/GLO/kg
ecoinvent v3.6 Coahuila v3.6 in
2019
. Technology: Good
. Time: Good, ecoinvent routinely updated -
v3.6 less than 1 year old
. Geography: Good
. Reliability: very good, 3rd party verified
dataset
. Completeness: very good, ecoinvent
considers most inputs/outputs
Diesel market for diesel/diesel/CO/kg ecoinvent v3.6 Neuvo Leon v3.6 in
2019
. Technology: Good
. Time: Good, ecoinvent routinely updated -
v3.6 less than 1 year old
. Geography: Good
. Reliability: very good, 3rd party verified
dataset
. Completeness: very good, ecoinvent
considers most inputs/outputs
Petroleum coke
(to make clinker)
market for petroleum
coke/petroleum coke/GLO/kg ecoinvent v3.6 average
v3.6 in
2019
. Technology: Good
. Time: Good, ecoinvent routinely updated -
v3.6 less than 1 year old
. Geography: Good
. Reliability: very good, 3rd party verified
dataset
. Completeness: very good, ecoinvent
considers most inputs/outputs
Propane ecoinvent v3.6 NA . Technology: Good

18
Input LCI.activity Data.source Geo Year Data.Quality.Assessment
market for
propane/propane/GLO/kg
NA
v3.6 in
2019
. Time: Good, ecoinvent routinely updated -
v3.6 less than 1 year old
NA . Geography: Good
NA . Reliability: very good, 3rd party verified
dataset
NA . Completeness: very good, ecoinvent
considers most inputs/outputs
Cement Kiln
Dust Produced on-site (A3)
Original facility
data
NA
4321940-
06-07 to
4408283-
01-25
. Technology: Very good
NA . Time: Very good, original facility data
NA . Geography: Very good
NA . Reliability: Very good, original facility
data
NA . Completeness: Very good, original facility
data
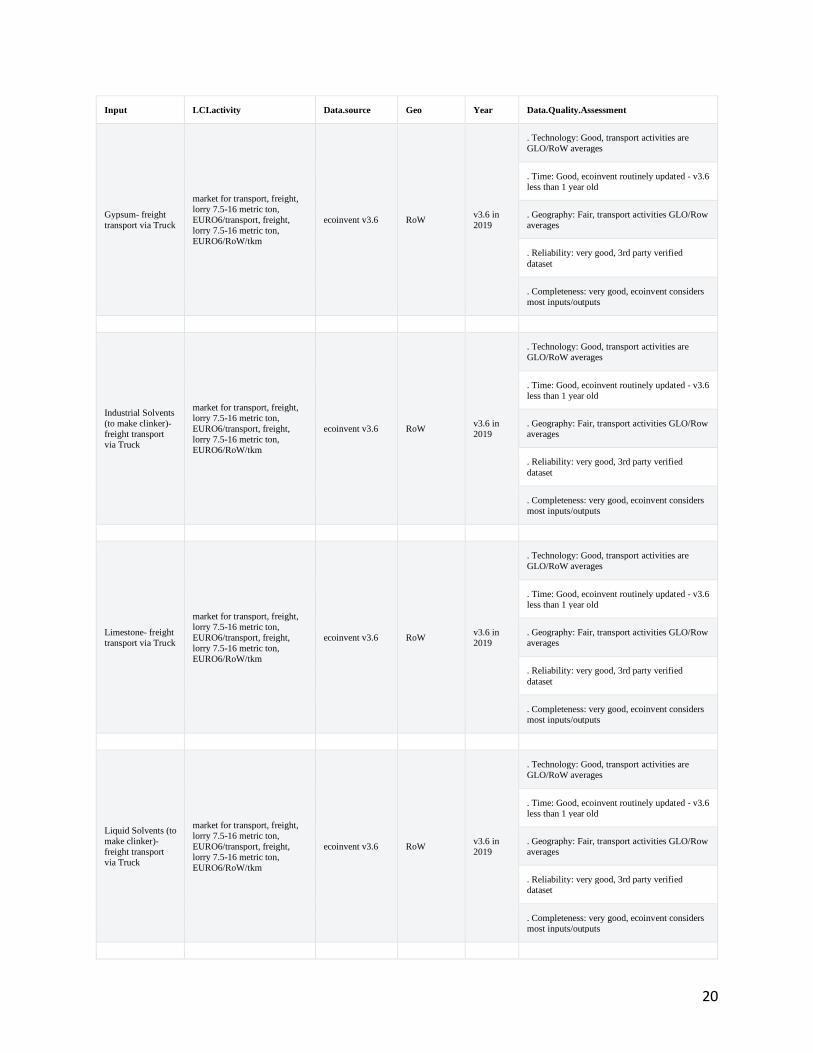
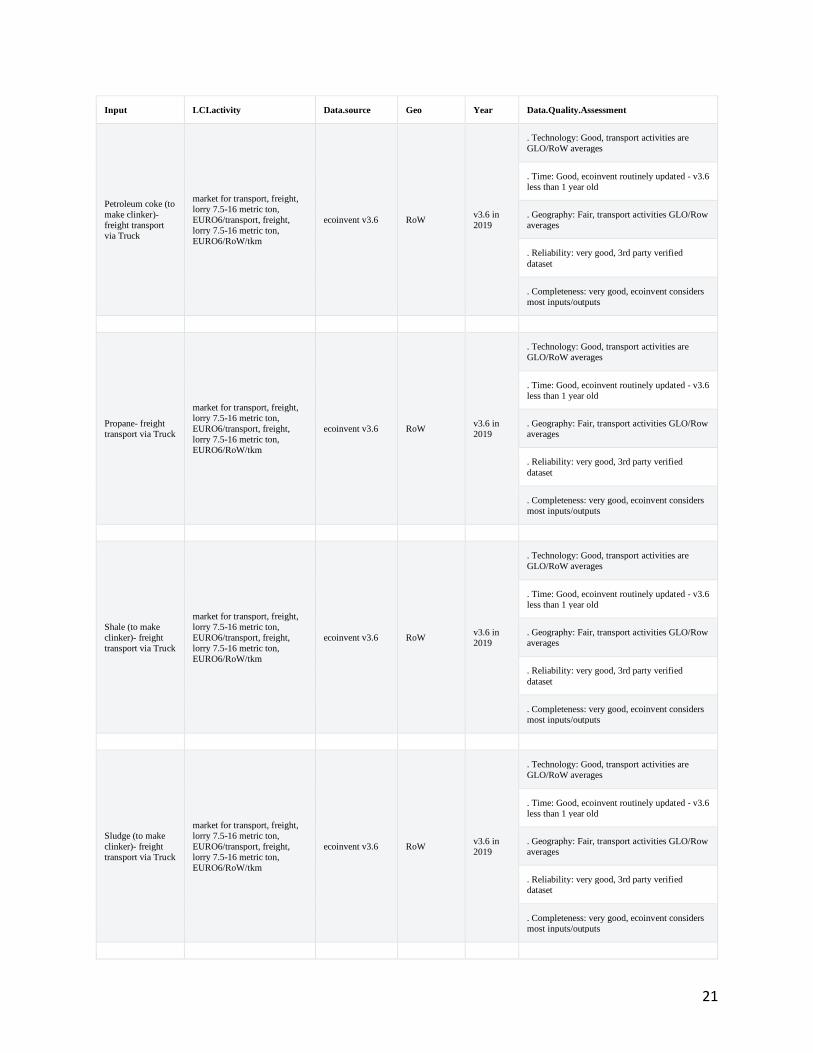
Table 5: LCI inputs assumed for module A2 (i.e. transport of A1 inputs)
Input LCI.activity Data.source Geo Year Data.Quality.Assessment
Biomass (to make
clinker)- freight
transport via Truck
market for transport, freight,
lorry 7.5-16 metric ton,
EURO6/transport, freight,
lorry 7.5-16 metric ton,
EURO6/RoW/tkm
ecoinvent v3.6 RoW v3.6 in
2019
. Technology: Good, transport activities are
GLO/RoW averages
. Time: Good, ecoinvent routinely updated - v3.6
less than 1 year old
. Geography: Fair, transport activities GLO/Row
averages
. Reliability: very good, 3rd party verified
dataset
. Completeness: very good, ecoinvent considers
most inputs/outputs
Cement packing-
freight transport
via Truck
market for transport, freight,
lorry 3.5-7.5 metric ton,
EURO6/transport, freight,
lorry 3.5-7.5 metric ton,
EURO6/RoW/tkm
ecoinvent v3.6 RoW v3.6 in
2019
. Technology: Good, transport activities are
GLO/RoW averages
. Time: Good, ecoinvent routinely updated - v3.6
less than 1 year old
. Geography: Fair, transport activities GLO/Row
averages
. Reliability: very good, 3rd party verified
dataset
. Completeness: very good, ecoinvent considers
most inputs/outputs

19
Input LCI.activity Data.source Geo Year Data.Quality.Assessment
Coal (to make
clinker)- freight
transport via Truck
market for transport, freight,
lorry 7.5-16 metric ton,
EURO6/transport, freight,
lorry 7.5-16 metric ton,
EURO6/RoW/tkm
ecoinvent v3.6 RoW v3.6 in
2019
. Technology: Good, transport activities are
GLO/RoW averages
. Time: Good, ecoinvent routinely updated - v3.6
less than 1 year old
. Geography: Fair, transport activities GLO/Row
averages
. Reliability: very good, 3rd party verified
dataset
. Completeness: very good, ecoinvent considers
most inputs/outputs
Diesel- freight
transport via Truck
market for transport, freight,
lorry 7.5-16 metric ton,
EURO6/transport, freight,
lorry 7.5-16 metric ton,
EURO6/RoW/tkm
ecoinvent v3.6 RoW v3.6 in
2019
. Technology: Good, transport activities are
GLO/RoW averages
. Time: Good, ecoinvent routinely updated - v3.6
less than 1 year old
. Geography: Fair, transport activities GLO/Row
averages
. Reliability: very good, 3rd party verified
dataset
. Completeness: very good, ecoinvent considers
most inputs/outputs
Fluorspar (to make
clinker)- freight
transport via Truck
market for transport, freight,
lorry 7.5-16 metric ton,
EURO6/transport, freight,
lorry 7.5-16 metric ton,
EURO6/RoW/tkm
ecoinvent v3.6 RoW v3.6 in
2019
. Technology: Good, transport activities are
GLO/RoW averages
. Time: Good, ecoinvent routinely updated - v3.6
less than 1 year old
. Geography: Fair, transport activities GLO/Row
averages
. Reliability: very good, 3rd party verified
dataset
. Completeness: very good, ecoinvent considers
most inputs/outputs
Fly Ash- freight
transport via Truck
market for transport, freight,
lorry 7.5-16 metric ton,
EURO6/transport, freight,
lorry 7.5-16 metric ton,
EURO6/RoW/tkm
ecoinvent v3.6 RoW v3.6 in
2019
. Technology: Good, transport activities are
GLO/RoW averages
. Time: Good, ecoinvent routinely updated - v3.6
less than 1 year old
. Geography: Fair, transport activities GLO/Row
averages
. Reliability: very good, 3rd party verified
dataset
. Completeness: very good, ecoinvent considers
most inputs/outputs
20
Input LCI.activity Data.source Geo Year Data.Quality.Assessment
Gypsum- freight
transport via Truck
market for transport, freight,
lorry 7.5-16 metric ton,
EURO6/transport, freight,
lorry 7.5-16 metric ton,
EURO6/RoW/tkm
ecoinvent v3.6 RoW v3.6 in
2019
. Technology: Good, transport activities are
GLO/RoW averages
. Time: Good, ecoinvent routinely updated - v3.6
less than 1 year old
. Geography: Fair, transport activities GLO/Row
averages
. Reliability: very good, 3rd party verified
dataset
. Completeness: very good, ecoinvent considers
most inputs/outputs
Industrial Solvents
(to make clinker)-
freight transport
via Truck
market for transport, freight,
lorry 7.5-16 metric ton,
EURO6/transport, freight,
lorry 7.5-16 metric ton,
EURO6/RoW/tkm
ecoinvent v3.6 RoW v3.6 in
2019
. Technology: Good, transport activities are
GLO/RoW averages
. Time: Good, ecoinvent routinely updated - v3.6
less than 1 year old
. Geography: Fair, transport activities GLO/Row
averages
. Reliability: very good, 3rd party verified
dataset
. Completeness: very good, ecoinvent considers
most inputs/outputs
Limestone- freight
transport via Truck
market for transport, freight,
lorry 7.5-16 metric ton,
EURO6/transport, freight,
lorry 7.5-16 metric ton,
EURO6/RoW/tkm
ecoinvent v3.6 RoW v3.6 in
2019
. Technology: Good, transport activities are
GLO/RoW averages
. Time: Good, ecoinvent routinely updated - v3.6
less than 1 year old
. Geography: Fair, transport activities GLO/Row
averages
. Reliability: very good, 3rd party verified
dataset
. Completeness: very good, ecoinvent considers
most inputs/outputs
Liquid Solvents (to
make clinker)-
freight transport
via Truck
market for transport, freight,
lorry 7.5-16 metric ton,
EURO6/transport, freight,
lorry 7.5-16 metric ton,
EURO6/RoW/tkm
ecoinvent v3.6 RoW v3.6 in
2019
. Technology: Good, transport activities are
GLO/RoW averages
. Time: Good, ecoinvent routinely updated - v3.6
less than 1 year old
. Geography: Fair, transport activities GLO/Row
averages
. Reliability: very good, 3rd party verified
dataset
. Completeness: very good, ecoinvent considers
most inputs/outputs
21
Input LCI.activity Data.source Geo Year Data.Quality.Assessment
Petroleum coke (to
make clinker)-
freight transport
via Truck
market for transport, freight,
lorry 7.5-16 metric ton,
EURO6/transport, freight,
lorry 7.5-16 metric ton,
EURO6/RoW/tkm
ecoinvent v3.6 RoW v3.6 in
2019
. Technology: Good, transport activities are
GLO/RoW averages
. Time: Good, ecoinvent routinely updated - v3.6
less than 1 year old
. Geography: Fair, transport activities GLO/Row
averages
. Reliability: very good, 3rd party verified
dataset
. Completeness: very good, ecoinvent considers
most inputs/outputs
Propane- freight
transport via Truck
market for transport, freight,
lorry 7.5-16 metric ton,
EURO6/transport, freight,
lorry 7.5-16 metric ton,
EURO6/RoW/tkm
ecoinvent v3.6 RoW v3.6 in
2019
. Technology: Good, transport activities are
GLO/RoW averages
. Time: Good, ecoinvent routinely updated - v3.6
less than 1 year old
. Geography: Fair, transport activities GLO/Row
averages
. Reliability: very good, 3rd party verified
dataset
. Completeness: very good, ecoinvent considers
most inputs/outputs
Shale (to make
clinker)- freight
transport via Truck
market for transport, freight,
lorry 7.5-16 metric ton,
EURO6/transport, freight,
lorry 7.5-16 metric ton,
EURO6/RoW/tkm
ecoinvent v3.6 RoW v3.6 in
2019
. Technology: Good, transport activities are
GLO/RoW averages
. Time: Good, ecoinvent routinely updated - v3.6
less than 1 year old
. Geography: Fair, transport activities GLO/Row
averages
. Reliability: very good, 3rd party verified
dataset
. Completeness: very good, ecoinvent considers
most inputs/outputs
Sludge (to make
clinker)- freight
transport via Truck
market for transport, freight,
lorry 7.5-16 metric ton,
EURO6/transport, freight,
lorry 7.5-16 metric ton,
EURO6/RoW/tkm
ecoinvent v3.6 RoW v3.6 in
2019
. Technology: Good, transport activities are
GLO/RoW averages
. Time: Good, ecoinvent routinely updated - v3.6
less than 1 year old
. Geography: Fair, transport activities GLO/Row
averages
. Reliability: very good, 3rd party verified
dataset
. Completeness: very good, ecoinvent considers
most inputs/outputs

22
Table 6: LCI inputs assumed for module A3
Input LCI.activity Data.source Geo Year Data.Quality.Assessment
Grid electricity
market for electricity, medium
voltage/electricity, medium
voltage/MX/kWh; Note:
modifications made (see
ecoinvent activity changes table)
ecoinvent v3.6 MX v3.6 in
2019
. Technology: Very good
. Time: Good, ecoinvent routinely updated -
v3.6 less than 1 year old
. Geography: Very good
. Reliability: very good, 3rd party verified
dataset
. Completeness: very good, ecoinvent considers
most inputs/outputs
Hazardous waste
treatment of hazardous waste,
hazardous waste
incineration/hazardous waste, for
incineration/RoW/kg
ecoinvent v3.6 RoW v3.6 in
2019
. Technology: Good
. Time: Good, ecoinvent routinely updated -
v3.6 less than 1 year old
. Geography: Fair
. Reliability: very good, 3rd party verified
dataset
. Completeness: very good, ecoinvent considers
most inputs/outputs
Non-hazardous
waste
treatment of municipal solid
waste, sanitary
landfill/municipal solid
waste/RoW/kg
ecoinvent v3.6 RoW v3.6 in
2019
. Technology: Fair
. Time: Good, ecoinvent routinely updated -
v3.6 less than 1 year old
. Geography: Fair
. Reliability: very good, 3rd party verified
dataset
. Completeness: very good, ecoinvent considers
most inputs/outputs
Transport of
Hazardous waste
transport, freight, lorry, all sizes,
EURO4 to generic market for
transport, freight, lorry,
unspecified/transport, freight,
lorry, unspecified/RoW/tkm
ecoinvent v3.6 RoW v3.6 in
2019
. Technology: Good
. Time: Good, ecoinvent routinely updated -
v3.6 less than 1 year old
. Geography: Good
. Reliability: very good, 3rd party verified
dataset
. Completeness: very good, ecoinvent considers
most inputs/outputs
The following table depicts every modifcation undertaken to the ecoinvent activities assumed in the tables
above:
Table 7: All technosphere input changes made to any ecoinvent activities used in the system model

23
ID product updateType activityNameToChange name_inputActivity value units explanation
7 Electricity Remove market for electricity,
medium voltage/electricity,
medium voltage/MX/kWh
market for electricity,
high voltage/electricity,
high voltage/MX/kWh
0.6919245 kWh Regarding activity ‘market for
electricity, medium
voltage/electricity, medium
voltage/MX/kWh’, the input
‘market for electricity, high
voltage/electricity, high
voltage/MX/kWh’, was
removed assuming 6.92E-1
kWh
8 Electricity Add market for electricity,
medium voltage/electricity,
medium voltage/MX/kWh
electricity production,
photovoltaic, 570kWp
open ground installation,
multi-Si/electricity, low
voltage/MX/kWh
0.0131784 kWh Regarding activity ‘market for
electricity, medium
voltage/electricity, medium
voltage/MX/kWh’, the input
‘electricity production,
photovoltaic, 570kWp open
ground installation, multi-
Si/electricity, low
voltage/MX/kWh’, was added
assuming 1.32E-2 kWh
9 Electricity Add market for electricity,
medium voltage/electricity,
medium voltage/MX/kWh
electricity production,
wind, 1-3MW turbine,
onshore/electricity, high
voltage/MX/kWh
0.0930416 kWh Regarding activity ‘market for
electricity, medium
voltage/electricity, medium
voltage/MX/kWh’, the input
‘electricity production, wind,
1-3MW turbine,
onshore/electricity, high
voltage/MX/kWh’, was added
assuming 9.30E-2 kWh
10 Electricity Add market for electricity,
medium voltage/electricity,
medium voltage/MX/kWh
electricity production,
natural gas, combined
cycle power
plant/electricity, high
voltage/MX/kWh
0.5857045 kWh Regarding activity ‘market for
electricity, medium
voltage/electricity, medium
voltage/MX/kWh’, the input
‘electricity production, natural
gas, combined cycle power
plant/electricity, high
voltage/MX/kWh’, was added
assuming 5.86E-1 kWh
Data Quality Assessment
Data quality/variability requirements, as specified in the PCR, are applied. This section
describes the achieved data quality relative to the ISO 14044:2006 requirements. Data quality
is judged based on its precision (measured, calculated or estimated), completeness (e.g.,
unreported emissions), consistency (degree of uniformity of the methodology applied within
a study serving as a data source) and representativeness (geographical, temporal, and
technological).
Precision: Through measurement and calculation, the manufacturers collected and provided
primary data on their annual production. For accuracy, the LCA practitioner and 3rd Party
Verifier validated the plant gate-to-gate data.
Completeness: All relevant specific processes, including inputs (raw materials, energy and
ancillary materials) and outputs (emissions and production volume) were considered and

24
modeled to represent the specified and declared products. The majority of relevant
background materials and processes were taken from ecoinvent v3.6 LCI datasets where
relatively recent region-specific electricity inputs were utilized. The most relevant EPDs
requiring key A1 inputs were also utilized where readily available.
Consistency: To ensure consistency, the same modeling structure across the respective
product systems was utilized for all inputs, which consisted of raw material inputs and
ancillary material, energy flows, water resource inputs, product and co-products outputs,
returned and recovered Cement materials, emissions to air, water and soil, and waste
recycling and treatment. The same background LCI datasets from the ecoinvent v3.6
database were used across all product systems. Crosschecks concerning the plausibility of
mass and energy flows were continuously conducted. The LCA team conducted mass and
energy balances at the plant and selected process level to maintain a high level of
consistency.
Reproducibility: Internal reproducibility is possible since the data and the models are stored
and available in a machine-readable project file for all foreground and background processes,
and in Eco-Purpose’s proprietary Cement LCA calculator* for all production facility and
product-specific calculations. A considerable level of transparency is provided throughout
the detailed LCA report as the specifications and material quantity make-up for the declared
products are presented and key primary and secondary LCI data sources are summarized. The
provision of more detailed publicly accessible data to allow full external reproducibility was
not possible due to reasons of confidentiality.
*Eco-Purpose has developed a proprietary tool that allows the calculation of PCR-compliant
LCA results for Cement product designs. The tool auto-calculates results by scaling base-unit
technosphere inputs (i.e. 1 kg sand, 1 kWh electricity, etc.) to replicate the reference flow
conversions that take place in any typical LCA software like openLCA or SimaPro. The tool
was tested against several LCAs performed in openLCA and the tool generated identical
results to those realized in openLCA across every impact category and inventory metric
(where comparisons could be readily made).
Representativeness: The representativeness of the data is summarized as follows.
• Time related coverage of the manufacturing processes’ primary collected data
from 2020-01-01 to 2020-12-31.

25
• Upstream (background) LCI data was either the PCR specified default (if
applicable) or more appropriate LCI datasets as found in the country-adjusted
ecoinvent v3.6 database.
• Geographical coverage for inputs required by the A3 facility(ies) is representative
of its region of focus; other upstream and background processes are based on US,
North American, or global average data and adjusted to regional electricity mixes
when relevant.
• Technological coverage is typical or average and specific to the participating
facilities for all primary data.
Environmental Indicators and Inventory Metrics
Per the PCR, this EPD supports the life cycle impact assessment indicators and inventory
metrics as listed in the tables below. As specified in the PCR, the most recent US EPA Tool
for the Reduction and Assessment of Chemical and Other Environmental Impacts (TRACI),
impact categories were utilized as they provide a North American context for the mandatory
category indicators to be included in the EPD. Additionally, the PCR requires a set of
inventory metrics to be reported with the LCIA indicators (see tables below).
Table 8: Life cycle impact categories and life cycle inventory metrics
ID LCIA.indicators Abbreviations Units
1 environmental impact: acidification AP kg SO2eq
2 environmental impact: ecotoxicity ETP kg 2,4-D-.
3 environmental impact: global warming GWP kg CO2-Eq
4 environmental impact: ozone depletion ODP kg CFC-11.
5 environmental impact: photochemical oxidation PCOP kg O3eq
6 Abiotic Depletion-elements ADPe kg Sbeq
7 Abiotic Depletion-fossil fuels ADPf kg Sbeq
Inventory metrics
8 Total primary energy TPE MJ-Eq

26
ID LCIA.indicators Abbreviations Units
9 Non-Renewable Resources NRR kg
10 Renewable energy RE MJ-Eq
11 environmental impact: land filling, bulk waste LFW kg waste
12 environmental impact: land filling, hazardous waste LFHW kg waste
13 water depletion: WDP WDP m3 water-.
A summary description of each of the impact categories and inventory metrics is provided in
the following table:
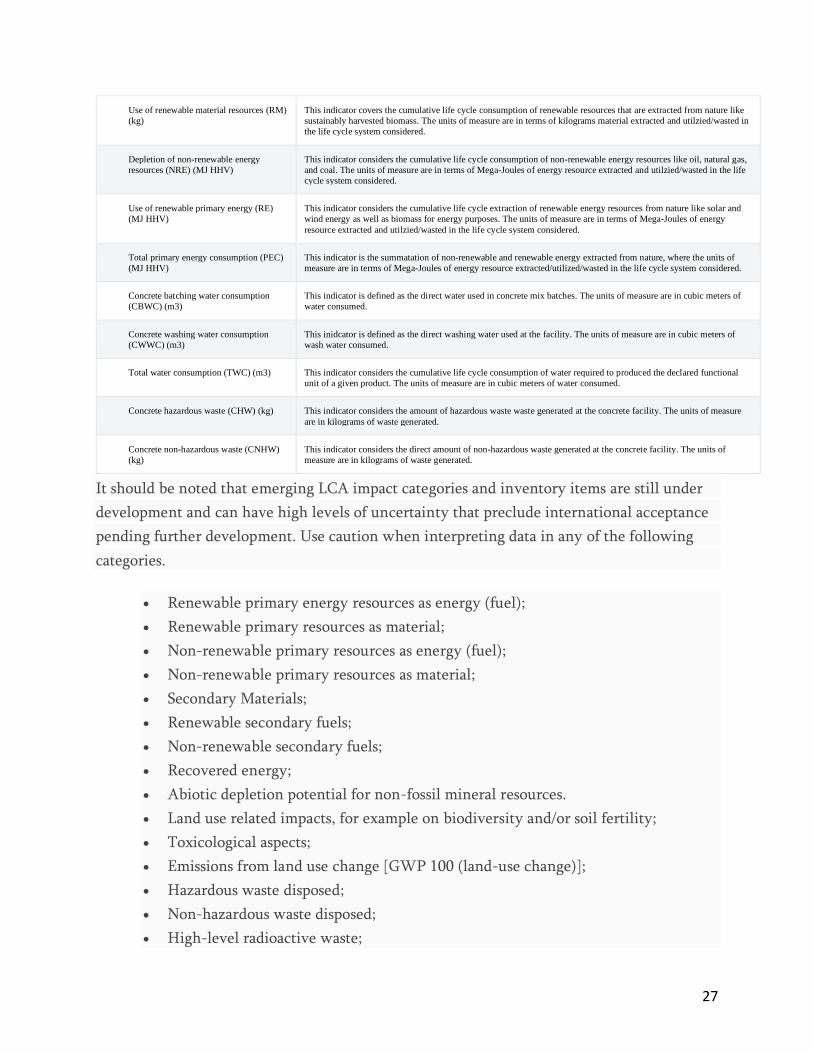
Table 9: Definitions of life cycle impact categories and life cycle inventory metrics
Midpoint impact categories
Global Warming Potential (GWP) (units:
kg CO2-eq)
Global Warming Potential or climate change can be defined as the change in global temperature caused by the
greenhouse effect that the release of greenhouse gases by human activity creates. The Environmental Profiles
characterization model is based on factors developed by the United Nations Intergovernmental Panel on Climate
Change (IPCC). Factors are expressed as Global Warming Potential over the time horizon of different years, being the
most common 100 years (GWP100), measured in the reference unit, kg CO2 equivalent.
Ozone Depletion Potential (ODP) (kg
CFC-11-eq)
Ozone-depleting gases cause damage to stratospheric ozone or the ozone layer. CFCs, halons and HCFCs are the major
causes of ozone depletion. The characterization model has been developed by the World Meteorological Organization
(WMO) and defines the ozone depletion potential of different gases relative to the reference substance
chlorofluorocarbon-11 (CFC-11), expressed in kg CFC-11 equivalent.
Acidification Potential (AP) (kg SO2-eq) Acidic gases such as Sulphur dioxide (SO2) react with water in the atmosphere to form acid rain, a process known as
acid deposition. Acidification potential is expressed using the reference unit, kg SO2 equivalent. The model does not
take account of regional differences in terms of which areas are more or less susceptible to acidification. It accounts
only for acidification caused by SO2 and NOx. This includes acidification due to fertilizer use, according to the method
developed by the Intergovernmental Panel on Climate Change (IPCC). CML has based the characterization factor on
the RAINS model developed by the University of Amsterdam.
Eutrophication Potential (EP) (PO4 3- -eq) Eutrophication is the build-up of a concentration of chemical nutrients in an ecosystem which leads to abnormal
productivity. This causes excessive plant growth like algae in rivers which causes severe reductions in water quality
and animal populations. This category is based on the work of Heijungs, and is expressed using the reference unit, kg
PO4 3- equivalents. Direct and indirect impacts of fertilizers are included in the method. The direct impacts are from
production of the fertilizers and the indirect ones are calculated using the IPCC method to estimate emissions to water
causing eutrophication.
Photochemical Ozone Creation/Smog
Potential (POCP) (kg O3-eq)
Ozone is protective in the stratosphere, but on the ground-level, it is toxic to humans in high concentration.
Photochemical ozone, also called ground-level ozone, is formed by the reaction of volatile organic compounds and
nitrogen oxides in the presence of heat and sunlight. The impact category depends largely on the amounts of carbon
monoxide (CO), Sulphur dioxide (SO2), nitrogen oxide (NO), ammonium and NMVOC (non-methane volatile organic
compounds). Photochemical ozone creation potential (also known as summer smog) for emission of substances to air is
calculated with the United Nations Economic Commission for 22 Europe (UNECE) trajectory model (including fate)
and expressed using the reference unit, kg ethylene (C2H4) equivalent.
Abiotic Depletion Potential (ADPel and
ADPff) (kg Sb-eq)
The main concern of this category is the health of humans and the ecosystem and how it is affected by the extraction of
minerals and fossil fuels, which are inputs into the system. For each extraction of minerals and fossil fuels, the abiotic
depletion factor is determined. This indicator is on a global scale and is based on the concentration reserves and rate of
deaccumulation. The results are presented in units of the reference element strontium (i.e. Sb). For the purposes of this
EPD, this impact category is split between mineral elements (i.e. ADPel) and fossil fuels (i.e. ADPff).
Inventory metrics
Depletion of non-renewable material
resources (NRM) (kg)
This indicator covers the cumulative life cycle consumption of non-renewable resources that are extracted from the
ground but not including energy resources like coal, oil and natural gas. This indicator includes the consumption of
metallic ores, aggregates and other minerals. The units of measure are in terms of kilograms material extracted and
utilzied/wasted in the life cycle system considered.
27
Use of renewable material resources (RM)
(kg)
This indicator covers the cumulative life cycle consumption of renewable resources that are extracted from nature like
sustainably harvested biomass. The units of measure are in terms of kilograms material extracted and utilzied/wasted in
the life cycle system considered.
Depletion of non-renewable energy
resources (NRE) (MJ HHV)
This indicator considers the cumulative life cycle consumption of non-renewable energy resources like oil, natural gas,
and coal. The units of measure are in terms of Mega-Joules of energy resource extracted and utilzied/wasted in the life
cycle system considered.
Use of renewable primary energy (RE)
(MJ HHV)
This indicator considers the cumulative life cycle extraction of renewable energy resources from nature like solar and
wind energy as well as biomass for energy purposes. The units of measure are in terms of Mega-Joules of energy
resource extracted and utilzied/wasted in the life cycle system considered.
Total primary energy consumption (PEC)
(MJ HHV)
This indicator is the summatation of non-renewable and renewable energy extracted from nature, where the units of
measure are in terms of Mega-Joules of energy resource extracted/utilized/wasted in the life cycle system considered.
Concrete batching water consumption
(CBWC) (m3)
This indicator is defined as the direct water used in concrete mix batches. The units of measure are in cubic meters of
water consumed.
Concrete washing water consumption
(CWWC) (m3)
This inidcator is defined as the direct washing water used at the facility. The units of measure are in cubic meters of
wash water consumed.
Total water consumption (TWC) (m3) This indicator considers the cumulative life cycle consumption of water required to produced the declared functional
unit of a given product. The units of measure are in cubic meters of water consumed.
Concrete hazardous waste (CHW) (kg) This indicator considers the amount of hazardous waste waste generated at the concrete facility. The units of measure
are in kilograms of waste generated.
Concrete non-hazardous waste (CNHW)
(kg)
This indicator considers the direct amount of non-hazardous waste generated at the concrete facility. The units of
measure are in kilograms of waste generated.
It should be noted that emerging LCA impact categories and inventory items are still under
development and can have high levels of uncertainty that preclude international acceptance
pending further development. Use caution when interpreting data in any of the following
categories.
• Renewable primary energy resources as energy (fuel);
• Renewable primary resources as material;
• Non-renewable primary resources as energy (fuel);
• Non-renewable primary resources as material;
• Secondary Materials;
• Renewable secondary fuels;
• Non-renewable secondary fuels;
• Recovered energy;
• Abiotic depletion potential for non-fossil mineral resources.
• Land use related impacts, for example on biodiversity and/or soil fertility;
• Toxicological aspects;
• Emissions from land use change [GWP 100 (land-use change)];
• Hazardous waste disposed;
• Non-hazardous waste disposed;
• High-level radioactive waste;

28
• Intermediate and low-level radioactive waste;
• Components for reuse;
• Materials for recycling;
• Materials for energy recovery;
• Recovered energy exported from the product system.
Total impact summary
The following table reports the total LCA results for each product produced at the given
cement facility on a per 1 tonne of cement basis. This EPD was created using industry-
average data for upstream materials.
All declared products
Table 10: Total life cycle (across modules in scope) impact results for All declared products,
assuming the geometric mean point values on a per 1 tonne of cement basis
Indicator/LCI
Metric
AP EP GWP ODP PCOP TPE RE NRE NRR RR ADPe ADPf WDP LFW LFHW
Unit kg
SO2eq
kg N kg
CO2-
Eq
kg CFC-
11.
kg
O3eq
MJ-
Eq
MJ-
Eq
MJ-
Eq
kg kg kg Sbeq kg
Sbeq
m3
water-
.
kg
waste
kg waste

29
Minimum 1.38 0.0552 378 2.09e-
05
0.609 2140 188 1940 1110 0.0163 0.00252 0.929 0.257 11.7 0.00141
Maximum 4.06 0.126 922 4.78e-
05
1.58 5730 349 5360 1370 0.0293 0.00442 2.93 0.673 32.8 0.00399
Mean 2.87 0.103 768 3.86e-
05
1.22 4120 236 3870 1230 0.02 0.0037 1.94 0.407 20.9 0.00259
Median 3.01 0.115 887 4.28e-
05
1.34 4320 204 4100 1220 0.0172 0.00392 1.96 0.349 19.6 0.00248
CPC 30 4.06 0.112 911 4.08e-
05
1.58 5730 349 5360 1140 0.0293 0.00442 2.93 0.673 32.8 0.00399
CPC 40 2.92 0.118 863 4.49e-
05
1.3 4190 203 3970 1310 0.0171 0.00387 1.9 0.343 19.2 0.00242
CPC 40 R 3.11 0.126 922 4.78e-
05
1.39 4440 204 4220 1370 0.0172 0.00397 2.02 0.354 20 0.00254
CPMM 1.38 0.0552 378 2.09e-
05
0.609 2140 188 1940 1110 0.0163 0.00252 0.929 0.257 11.7 0.00141
The following pie charts provide aggregated life cycle module breakdowns across all life
cycle indicators considered for each product. First click on a desired impact category, and
then a specific product range or type for specific product comparisons across each
category/indicator for a given product range or type.
Impact breakdown plots by modules
• environmental impact
• environmental impact: eutrophication
• environmental impact: global warming
• environmental impact: ozone depletion
• environmental impact: photochemical oxidation
• Total primary energy
• Renewable energy
• Non-renewable energy
• Non-Renewable Resources
• Renewable Resources
• Abiotic Depletion-elements
• Abiotic Depletion-fossil fuels

30
• water depletion: WDP
• environmental impact: land filling, bulk waste
• environmental impact: land filling, hazardous waste
All declared products
Figure 5: Breakdown of total impacts aggregated by modules across All declared products.
Assumes geometric mean. Impact category: environmental impact: acidification (AP), impact
units = kg SO2eq per 1 tonne of cement. Outer values are relative.
Impact breakdown tables by modules
• environmental impact: acidification
• environmental impact: eutrophication
• environmental impact: global warming
• environmental impact: ozone depletion
• environmental impact: photochemical oxidation
• Total primary energy
• Renewable energy
• Non-renewable energy
• Non-Renewable Resources
• Renewable Resources

31
• Abiotic Depletion-elements
• Abiotic Depletion-fossil fuels
• water depletion: WDP
• environmental impact: land filling, bulk waste
• environmental impact: land filling, hazardous waste
Table 11: Percentage impact breakdown by modules across all declared products:
environmental impact: acidification (AP), kg SO2eq note: neg.= negligible
Module A1 A2 A3
Minimum 29.8 3.04 35.1
Maximum 61.9 4.79 66.9
Mean 38.2 3.64 58.1
Median 30.6 3.36 65.2
CPC 30 61.9 3.04 35.1
CPC 40 29.8 3.41 66.8
CPC 40 R 29.8 3.32 66.9
CPMM 31.5 4.79 63.7
Additional Environmental Info
No regulated substances of very high concern are utilized on site.
The Holcim Acapulco Cement plant uses both CFE and Iberdrola for electricity. The main
utility, CFE, has a different energy mix than Iberdrola; therefore, both were modeled with
their respective consumption amounts. Iberdrola would not disclose the exact energy mix
delivered by the plant near Acapulco in Guerrero, Mexico; when questioned, they recited
the available data on their website. From this data, standard capacity factors were used to
calculate the MW generation based on that information. The assumptions appear in the
companion table.
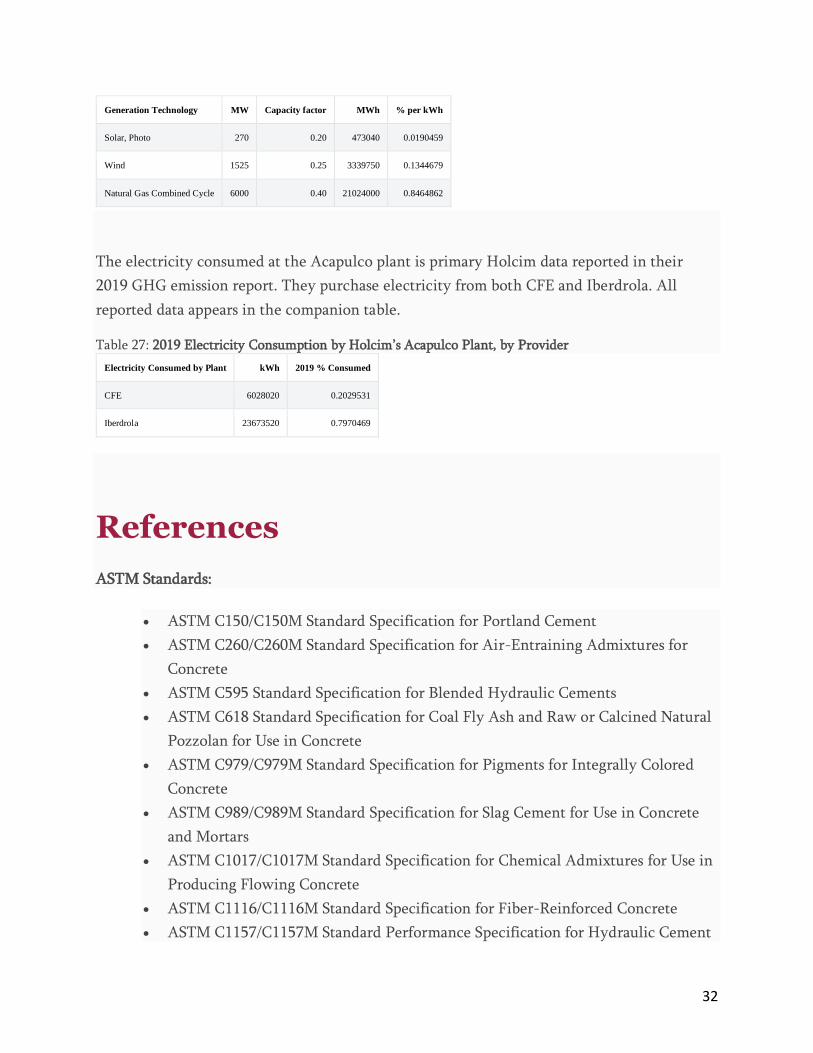
Table 26: Iberdrola Electricity Mix Assumptions
32
Generation Technology MW Capacity factor MWh % per kWh
Solar, Photo 270 0.20 473040 0.0190459
Wind 1525 0.25 3339750 0.1344679
Natural Gas Combined Cycle 6000 0.40 21024000 0.8464862
The electricity consumed at the Acapulco plant is primary Holcim data reported in their
2019 GHG emission report. They purchase electricity from both CFE and Iberdrola. All
reported data appears in the companion table.
Table 27: 2019 Electricity Consumption by Holcim’s Acapulco Plant, by Provider
Electricity Consumed by Plant kWh 2019 % Consumed
CFE 6028020 0.2029531
Iberdrola 23673520 0.7970469
References
ASTM Standards:
• ASTM C150/C150M Standard Specification for Portland Cement
• ASTM C260/C260M Standard Specification for Air-Entraining Admixtures for
Concrete
• ASTM C595 Standard Specification for Blended Hydraulic Cements
• ASTM C618 Standard Specification for Coal Fly Ash and Raw or Calcined Natural
Pozzolan for Use in Concrete
• ASTM C979/C979M Standard Specification for Pigments for Integrally Colored
Concrete
• ASTM C989/C989M Standard Specification for Slag Cement for Use in Concrete
and Mortars
• ASTM C1017/C1017M Standard Specification for Chemical Admixtures for Use in
Producing Flowing Concrete
• ASTM C1116/C1116M Standard Specification for Fiber-Reinforced Concrete
• ASTM C1157/C1157M Standard Performance Specification for Hydraulic Cement
33
• ASTM C1240 Standard Specification for Silica Fume Used in Cementitious
Mixtures
• ASTM C1602/C1602M Standard Specification for Mixing Water Used in the
Production of Hydraulic Cement Concrete
• ASTM G109 Standard Test Method for Determining Effects of Chemical
Admixtures on Corrosion of Embedded Steel Reinforcement in Concrete Exposed
to Chloride Environments
CSA Standards:
• CAN/CSA A3000 Cementitious Materials Compendium
• CAN/CSA G40.20/G40.21 General requirements for rolled or welded structural
quality steel / Structural quality steel
ISO Standards:
• ISO 6707-1: 2014 Buildings and Civil Engineering Works - Vocabulary - Part 1:
General Terms
• ISO 14021:1999 Environmental Labels and Declarations - Self-declared
Environmental Claims (Type II Environmental Labeling)
• ISO 14025:2006 Environmental Labels and Declarations - Type III Environmental
Declarations - Principles and Procedures
• ISO 14040:2006 Environmental Management - Life Cycle Assessment - Principles
and Framework
• ISO 14044:2006 Environmental Management - Life Cycle Assessment -
Requirements and Guidelines
• ISO 14067:2018 Greenhouse Gases - Carbon Footprint of Products - Requirements
and Guidelines for Quantification
• ISO 14050:2009 Environmental Management - Vocabulary
• ISO 21930:2017 Sustainability in Building Construction - Environmental
Declaration of Building Products
EN Standards:
• EN 16757 Sustainability of construction works - Environmental product
declarations - Product Category Rules for concrete and concrete elements

34
• EN 15804 Sustainability of construction works - Environmental product
declarations - Core rules for the product category of construction products
Other References:
• US EPA Waste Reduction Model (WARM), Fly Ash
Chapter: http://epa.gov/climatechange/wycd/waste/downloads/fly-ash-chapter10-
28-10.pdf
• USGBC LEED v4 for Building Design and Construction, 11 Jan 2019 available
at https://www.usgbc.org/resources/pcr-committee-process-resources-part-b
• USGBC PCR Committee Process & Resources: Part B, USGBC, 7 July 2017
available at https://www.usgbc.org/resources/pcr-committee-process-resources-
part-b.