environmental pillar submision to the regional waste...
TRANSCRIPT
Environmental Pillar Submission to the Public Consultation on the Regional Waste
Management Plan January 2015
Page 1 of 44
ENVIRONMENTAL PILLAR
SUBMISSION TO THE
REGIONAL WASTE
MANAGEMENT PLAN
January 2015
Environmental Pillar Submission to the Public Consultation on the Regional Waste
Management Plan January 2015
Page 2 of 44
Contents
1. Introduction 3
2. Recommendations 5
3. Reduce Landfilling to only residual waste 7
4. Zero Waste 8
5. Prevention 9
6. Source segregation 11
7. Energy Recovery is limited to non-recyclables 13
8. Inefficiency 14
9. Alternatives, job creation and market risks 15
10. Environmental and health impacts 17
11. Recycled Waste is used as a reliable source of raw material 18
12. Industrial symbiosis 19
13. Monitoring and Enforcement 22
14. Food Waste is reduced 22
15. Biowaste treatment 22
16. AD plants internationally 24
17. Reviews of existing product and waste legislation 24
18. Increase public information campaigns to stimulate a change in behaviou 25
Appendix A ZERO WASTE PROPOSAL 27
Appendix B Proposal for a Pilot Deposit Refund Scheme (DRS) in Ireland 30

Environmental Pillar Submission to the Public Consultation on the Regional Waste
Management Plan January 2015
Page 3 of 44
1. Introduction
Ireland has made great strides in collection and recycling of waste since the mid-1990s,
where there was no kerbside collection on the Island. Since then, 72% of the country has
kerbside collections to support the management of household waste and most of this is
done through private waste management companies. However, rural areas, primarily in the
Southern Region and the Connacht Ulster Region, have no kerbside service. Because of the
population variances and the unknown number of households in each region, we cannot
extrapolate a proper national figure. The chart below outlines the current waste service
levels within each waste management region in 2012:
Region % households
with kerbside
service
% households
without
kerbside service
% kerbside
services with 2
bin collection
% kerbside
services with 3
bin collection
Eastern
Midlands
81% 29% 49% 46%
Southern 67% 33% 71% 27%
Connacht Ulster 58% 42% 70% 22%
Because there are still so many households not covered by kerbside collection, the residual
amount of waste is still high. And since there is no adequate reporting of how much of the
‘recovered’ waste is burned or recycled, it is difficult to determine how to change behaviour
and where contamination of the recyclates is done.
The EU has proposed a new waste and circular economy package, Towards a circular
economy: A zero waste programme for Europe, which has among its initiatives:
• the elimination of landfilling of recyclable waste by 2025 and an overall ban on
landfilling by 2030;
• achieving a recycling and preparation for re-use of municipal waste of 70% by 2030;
• a packaging waste recycling rate of 80%, with interim targets of 60% by 2020 and
70% by 2025;
• separate collection of biowaste by 2025;
• reduction of food waste by 30% by 2025;
• reduction in the use of plastic bags; and
• the establishment of a national data base for all waste statistics.1
The EU’s 7th Environmental Action Programme (7EAP), adopted by the European Parliament
and Council, also sets out the outline for future European environmental policy until 2020.
In terms of waste management and the circular economy, Member States should
“fully implement[ing] Union waste legislation. Such implementation will include
applying the waste hierarchy in accordance with the Waste Framework Directive and
1 European Commission Communication: ‘Towards a circular economy: a zero waste programme for Europe’,
http://eur-lex.europa.eu/legal-content/EN/TXT/?uri=CELEX:52014DC0398
Environmental Pillar Submission to the Public Consultation on the Regional Waste
Management Plan January 2015
Page 4 of 44
the effective use of market-based instruments and other measures to ensure that:
(1) landfilling is limited to residual (i.e. non-recyclable and non-recoverable) waste,
having regard to the postponements provided for in Article 5(2) of the Landfill
Directive; (2) energy recovery is limited to non-recyclable materials, having regard to
Article 4(2) of the Waste Framework Directive; (3) recycled waste is used as a major,
reliable source of raw material for the Union, through the development of non-toxic
material cycles; (4) hazardous waste is safely managed and its generation is reduced;
(5) illegal waste shipments are eradicated, with the support of stringent monitoring;
and (6) food waste is reduced. Reviews of existing product and waste legislation are
carried out, including a review of the main targets of the relevant waste directives,
informed by the Roadmap to a Resource Efficient Europe, so as to move towards a
circular economy; and internal market barriers for environmentally-sound recycling
activities in the Union are removed. Public information campaigns are required to
build awareness and understanding of waste policy and to stimulate a change in
behaviour.”2
Contact information:
For further details please contact Michael Ewing, Coordinator of The Environmental Pillar.
Postal Address: Environmental Pillar of Social Partnership. Knockvicar, Boyle, Co
Roscommon
Telephone: 00353 (0)71 9667373
Mobile: 00353 (0)86 8672153
Email: [email protected]
This submission was developed using the Environmental Pillar processes but is not
necessarily the policy of each member group in the pillar.
Environmental Pillar members: An Taisce. Bat Conservation Ireland, BirdWatch Ireland. CELT
- Centre for Ecological Living and Training. Coast Watch. Coomhola Salmon Trust. Crann.
ECO UNESCO. Feasta. Forest Friends. Friends of the Earth. Good Energies Alliance Ireland.
Global Action Plan Ireland, Gluaiseacht. Hedge Laying Association of Ireland. Irish Doctors
Environment Association. Irish Natural Forestry Foundation. Irish Peatland Conservation
Council. Irish Seal Sanctuary. Irish Seed Saver Association. Irish Whale and Dolphin Group.
Irish Wildlife Trust. The Native Woodland Trust. The Organic Centre. Sonairte. Sustainable
Ireland Cooperative. VOICE. Zero Waste Alliance Ireland
2 EU 7
th Environmental Action Programme, http://eur-lex.europa.eu/legal-
content/EN/TXT/?uri=CELEX:32013D1386

Environmental Pillar Submission to the Public Consultation on the Regional Waste
Management Plan January 2015
Page 5 of 44
2. Recommendations
1: To create an effective database, the ultimate treatment of waste streams
should be properly categorised as 1) reused; 2) recycled; 3) used for thermal
treatment; 4) incinerated without energy recovery and 5) landfilled. The term
recovery which refers to recycling and energy recovery should be discarded as
an over-arching definition.
2: To create an effective database, the ultimate treatment of waste streams
should be properly categorised as 1) reused; 2) recycled; 3) used for thermal
treatment; 4) incinerated without energy recovery and 5) landfilled. The term
recovery which refers to recycling and energy recovery should be discarded as
an over-arching definition.
3: We propose that the target for waste prevention be increased to 2% per
capita per year and funding for prevention activities, public awareness.
4: We also propose the adoption of the economic instruments detailed above.
5: The adoption of a kerbside sorted system of collecting recyclable materials
to guarantee a higher quality of feedstock. However, if trucks are not easily
retrofitted to add more compartments, we recommend a 2-stream
commingled system of dry recyclate over a single stream. Separating paper
and card from metal and plastic containers would yield a higher quality of
paper material. Additionally, all households and food businesses must have an
additional bio-waste bin for separate collection.
6: A change in waste policy to move away from incineration/waste to energy as
a waste treatment technology and to move towards the adoption of ‘zero
waste’ principles.
7: Develop closed loop policies for all materials streams, with labour intensive
recycling as a priority.
8: Introduce deposit-and-refund schemes on all recyclable drinks containers on
a pilot basis to test the validity of extending the scheme nationally. See
Appendix B.

Environmental Pillar Submission to the Public Consultation on the Regional Waste
Management Plan January 2015
Page 6 of 44
9: Prioritise the implementation of the Food waste regulations and to
investigate the use of surplus edible foods currently discarded as waste.
10: Promote the development of anaerobic digestion of biowaste streams at
community level to deliver combined heat and power and to recycle nutrients
to the soils from whence they came.
11: We propose the establishment of regional and/or national symbiosis
programmes to foster and assist in the development of industrial symbiosis
networks.
12: There must be adequate and sufficient funding for local and regional
authorities to monitor and enforce the proper management and treatment of
waste to ensure that the waste hierarchy is properly enshrined in the ultimate
use of valuable waste resources.
13: Increase the REFIT rate for anaerobic digestion to encourage the
development of this industry and provide government assistance in terms of
grants, loans or guarantees.
14: We propose that the regional authorities investigate possible financing
mechanisms through the packaging PRI to fund the management of packaging
waste found in street cleanings, litter collections and street bins. Such funding
could also be used to provide increased number of separate recycling bins on
streets.
15: We encourage the regions to increase the amount of money available for
local waste prevention programmes, similar to that adopted by Zero Waste
Scotland. We also advocate for a more bottom-up public
awareness/community involvement to assist in behavioural change in how we
manage our waste.

Environmental Pillar Submission to the Public Consultation on the Regional Waste
Management Plan January 2015
Page 7 of 44
3. Reduce Landfilling to only residual waste
Historically, Ireland has relied heavily on the use of landfills to manage most of its waste
needs. Since 2012, the country has landfilled less than 50% of its waste, which is a huge
improvement. However, we must not substitute one disposal technology for another one,
namely incineration or waste-to-energy (WtE) plants. Currently, Ireland is burning over
321,000 tonnes of municipal waste domestically in the Meath WtE plant, cement kilns and
industrial incinerators and is exporting 842,635 tonnes (35% of managed municipal waste)
of which 300,000 tonnes (or 20% of our residual waste market) is send for ‘energy recovery’
or ‘thermal treatment’. Most of this exported waste is being burned in WtE plants
throughout Europe in Denmark, Germany and the UK, among other countries. As much of
the reported ‘recovered’ waste does not differentiate between recycling and thermal
treatment, it is difficult to calculate the hard numbers.
Instead of increasing our recycling rate, Ireland seems to be sending waste as Separated
Derived Fuel (SRF) or Refuse Derived Fuel (RDF) to WtE plants. Worrying statistics from the
plans show that the amount of Mixed Dry Recyclables (MDR) decreased by 3.2% between
2011 and 2012. Additionally, the plan states that the 15% increase in plastic packaging
recovered primarily reflects strong growth in Refuse Derived Fuel (RDF) as feedstock in
thermal treatment plants. The plan further reveals that subsidies for over 87,000 tonnes of
RDF were funded by Repak from contaminated paper and plastic, representing an increase
of 56% in 2012 vs. 2011. Of the 669,000 tonnes of packaging waste recovered by Repak in
2012, 87,000 tonnes went into RDF from contaminated paper and plastic (13% of packaging
collected).
There was a 2.5 increase in the amount of RDF and SFR diverted to energy recovery from
2010 to 2012 (94,174 – 230,399 tonnes) and an 11 times increase in the amount of residual
municipal waste going to energy recovery from 2010-2012 (19,293 – 244,334 tonnes) The
total amount going towards energy recovery for 2012 is 474,733 tonnes.
Future data must determine 1) what is the quality of the recyclables reclaimed from residual
waste and how much is reclaimed; 2) how much of the waste collected through street
cleaning and bin collection is recycled and how much is sent for energy recovery, 3) what
percentage of the MDR sent to Mechanical Recovery Facilities (MRFs) is contaminated and
ultimately sent on to incineration.
Recommendation 1: To create an effective database, the ultimate treatment of waste
streams should be properly categorised as 1) reused; 2) recycled; 3) used for thermal
treatment; 4) incinerated without energy recovery and 5) landfilled. The term recovery
which refers to recycling and energy recovery should be discarded as an over-arching
definition.
The key element to reducing residual waste is managing it through separate collection and
treatment of waste, reusing and recycling as much as is feasible and investing in technology
Environmental Pillar Submission to the Public Consultation on the Regional Waste
Management Plan January 2015
Page 8 of 44
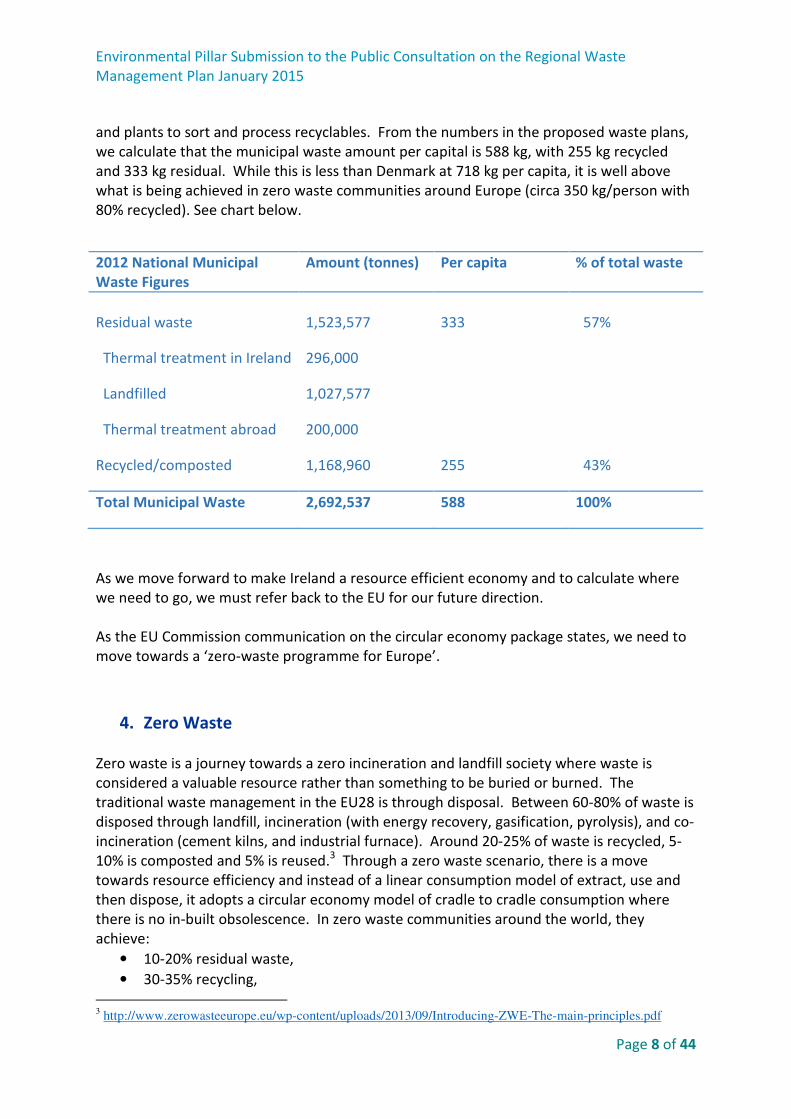
and plants to sort and process recyclables. From the numbers in the proposed waste plans,
we calculate that the municipal waste amount per capital is 588 kg, with 255 kg recycled
and 333 kg residual. While this is less than Denmark at 718 kg per capita, it is well above
what is being achieved in zero waste communities around Europe (circa 350 kg/person with
80% recycled). See chart below.
2012 National Municipal
Waste Figures
Amount (tonnes) Per capita % of total waste
Residual waste 1,523,577 333 57%
Thermal treatment in Ireland 296,000
Landfilled 1,027,577
Thermal treatment abroad 200,000
Recycled/composted 1,168,960 255 43%
Total Municipal Waste 2,692,537 588 100%
As we move forward to make Ireland a resource efficient economy and to calculate where
we need to go, we must refer back to the EU for our future direction.
As the EU Commission communication on the circular economy package states, we need to
move towards a ‘zero-waste programme for Europe’.
4. Zero Waste
Zero waste is a journey towards a zero incineration and landfill society where waste is
considered a valuable resource rather than something to be buried or burned. The
traditional waste management in the EU28 is through disposal. Between 60-80% of waste is
disposed through landfill, incineration (with energy recovery, gasification, pyrolysis), and co-
incineration (cement kilns, and industrial furnace). Around 20-25% of waste is recycled, 5-
10% is composted and 5% is reused.3 Through a zero waste scenario, there is a move
towards resource efficiency and instead of a linear consumption model of extract, use and
then dispose, it adopts a circular economy model of cradle to cradle consumption where
there is no in-built obsolescence. In zero waste communities around the world, they
achieve:
• 10-20% residual waste,
• 30-35% recycling,
3 http://www.zerowasteeurope.eu/wp-content/uploads/2013/09/Introducing-ZWE-The-main-principles.pdf

Environmental Pillar Submission to the Public Consultation on the Regional Waste
Management Plan January 2015
Page 9 of 44
• 30-35% composting,
• 10-20% repair and reuse and
• 10-20% waste prevention
Communities such as Capannori and Priula in Italy, Gipuzkoa in the Basque Country in Spain
and San Francisco, CA in the US have adopted zero waste programmes by increasing their
recycling and composting collections and treatments, adopting ambitious waste prevention
actions, promoting economic incentives and investing in research and innovation.
In Ireland, our municipal waste per capita in 2012 was 588 kg. With zero waste initiatives in
place, it is feasible to reduce the per capita amount to less than 100 kg within ten years. In
Priula, Italy with 554,000 inhabitants and 50 municipalities, they reduced their per capita
rate of residual waste from 321 kg in 2000 to 58 kg in 2012 with an 80% recycling rate and a
80% reduction in its residual waste.4
Recommendation 2: We ask each region to support the development of a zero waste pilot
community to illustrate what can be done to prevent the generation of waste and to
reduce residual waste. See appendix A.
5. Prevention
The regional waste plans call for a 1% per capita reduction of waste generated for the next
five years. We believe that this reduction is too modest. In food waste alone, which
accounts for 33% of the household waste stream, Stop Food Waste calculates that 60% of
this waste is avoidable.5 If we achieve the goal of reducing food waste by 30% by 2025, this
action alone would reduce the amount of waste generated by 10%. Prevention of waste
must be relevant to all streams of waste.
Waste prevention can be achieved through the following actions:
• Increase investment in public awareness, infrastructure development, research and
support for waste prevention actions. Currently in the three regions, around 70% of
the waste funding is allocated towards the ‘lower order’ waste management
activities such as landfill aftercare, street cleaning and litter management and 30% of
the funding goes towards the ‘higher order’ activities such as waste prevention,
reuse, recovery and recycling
• Support businesses in developing new business models that adopt a life-cycle
assessment approach. Provide grants or other financial incentives
• Advance the Green Procurement initiative for all local and national public bodies.
• Encourage a shift in manufacturing and consumption, delinking material
consumption from economic growth. We can learn from policies and programmes
4 http://www.zerowasteeurope.eu/2013/07/europan-champion-districts-of-priula-and-treviso-join-the-zero-
waste-europe-network/ 5 www.stopfoodwaste.ie

Environmental Pillar Submission to the Public Consultation on the Regional Waste
Management Plan January 2015
Page 10 of 44
adopted in other countries and build on Ireland’s current waste prevention
initiatives.
• Adopt a series of economic instruments to invoke behavioural change amongst
consumers and producers to manage resources wisely. Such incentives include
o VAT reduction for recycled products,
o Differential taxes between use of primary material and secondary material in
manufacturing –
� There are two ways to differentiate taxes between use of primary
material and secondary material in manufacturing.
• The first option is taxing the use of primary material.
According to European Commission, “Taxes on primary
materials may act to reduce the consumption of materials,
encourage re-use and preparation for re-use, and increase the
use of recycled materials.”6
• The second option is setting a lower VAT rate on secondary
material used in manufacturing.
• Both these options are able to make secondary more
economically attractive and increase their demand. In terms of
acceptability to companies, the second option is more positive
than the first one.
o Impose deposit/refund schemes for take-back programmes (such as a
container deposit/refund schemes which are hugely successful in many US
States, Germany, Scandinavian countries and other countries to capture
plastic, glass, tetra pack and aluminium drinks containers). See Recycling
Section.
o Increase the landfill levy progressively. The Irish landfill levy is one of the
highest in European Union and it is an important factor for internalising
environmental externalities of landfills. In the name of continuous
improvement, the levy should be progressively increased to reflect the
performance that is possible to achieve with all the prevention programmes
and recycling technologies available.
o Impose a levy on WtE plants. As there are at least two MSW incinerators in
project or operational, it is time to implement an incineration tax as well, to
make incineration or WtE less favourable than reuse and recycling. The basic
rate should be the same as the landfill levy with a reduction of tax for energy
efficient facilities (under the WFD), to match with European waste hierarchy.
o Tax use of natural resources rather than labour
o Levy on excess residual household waste -- In order to reduce residual
household waste and promote recycling at the same time, the European
Commission recommended that municipalities introduce a levy on excess
residual household waste (with refunds to those whose residual waste is
6 Bio Intelligence service for European Commission (DG Env) “Use of economic instruments and waste
management performance”, April 2012, p. 12:
http://ec.europa.eu/environment/waste/pdf/final_report_10042012.pdf
Environmental Pillar Submission to the Public Consultation on the Regional Waste
Management Plan January 2015
Page 11 of 44
below the average level )7. Indeed, the quantity of residual waste per
inhabitant is a good indicator for the effectiveness of sustainable
consumption and restraining it would help to achieve resource efficiency.
o Extend the tax on plastic bags to disposable products that have reusable
equivalent. Consumers have an important role to play in achieving resource
efficiency. To modify their habits, they need to have a clear price-signal on
what product is more resource efficient and what product is not. The tax on
plastic bags has shown its effectiveness and should be extended to other
disposable products that have reusable equivalent, as disposable tableware,
plastic films, etc (see the Belgium picnic tax).8
Recommendation 3: We propose that the target for waste prevention be increased to 2%
per capita per year and funding for prevention activities, public awareness.
Recommendation 4: We also propose the adoption of the economic instruments detailed
above.
6. Source segregation
As detailed in the proposed waste management plan, most of the households with kerbside
service have at least two bins and a minority with three bins.
There is a trade-off in the methodology of collecting dry recyclables…contamination versus
ease of use. On the one hand, food stuff caked on tins or remnants of fizzy drinks in
collected cans can contaminate paper/card. However, on the other hand, if there are too
many collection streams, it may become confusing and frustrating for the consumer.
Ideally, it would be preferable to collect recyclables in separate streams as the quality of the
material would be much higher and ultimate processing much easier.
According to a June 2009 study conducted by WRAP in the UK, “Choosing the Right
Recycling Collections System,” the greatest benefit for recapturing valuable resources is
achieved through a closed loop recycling “where materials are put back into the same or
equivalent application.” They state that the best method of recovering high quality
recyclable material is through a kerbside sorting system where materials are sorted by the
household for collection. 9
The Department for the Environment, Food and Rural Affairs (DEFRA) in the UK has advised
local authorities that “source separation of materials is the first step to maximising the value
7 Bio Intelligence service for European Commission (DG Env) “Use of economic instruments and waste
management performance”, April 2012, p. 12:
http://ec.europa.eu/environment/waste/pdf/final_report_10042012.pdf 8 http://www.prewaste.eu/index.php?option=com_k2&view=item&id=288:26-ibge-ecotaxation-plastic-
bags&Itemid=94 9 http://www.wrap.org.uk/sites/files/wrap/Choosing%20the%20right%20recycling%20collection%20system.pdf

Environmental Pillar Submission to the Public Consultation on the Regional Waste
Management Plan January 2015
Page 12 of 44
of recycling,” and that “the earlier in the collection chain a recyclate is separated the lower
the likely costs and environmental impact of the collection scheme.”10
The benefits of source separating at the kerb are manifold. Such benefits include:
• Less contamination of recyclable material. According to a WRAP study of MRFs in
the UK, US and EU, there was a contamination rate of up to 20 percent.11 Less than
1 percent of source separated recyclate is wasted.
• Increased revenue for sales of the materials.
• Staff collecting separated materials can give immediate feedback to households who
have improperly put out unrecyclable items with a note of what can be accepted.
• Trucks can be retrofitted with extra compartments to collect various recyclable
material streams.
• There is more trust on behalf of households on the collected material being recycled.
Many individuals don’t believe that commingled recyclate is actually being recycled.
In fact, they are right as up to 20% is contaminated and thus wasted.
• Total cost of collection and processing together are lower in source separated
systems than in commingled systems.12
• The trend in recyclates markets is likely to be towards higher quality material.13
Recommendation 5: The Environmental Pillar recommends the adoption of a kerbside
sorted system of collecting recyclable materials to guarantee a higher quality of feedstock.
However, if trucks are not easily retrofitted to add more compartments, we recommend a
2-stream commingled system of dry recyclate over a single stream. Separating paper and
card from metal and plastic containers would yield a higher quality of paper material.
Additionally, all households and food businesses must have an additional bio-waste bin
for separate collection.
As mentioned in the plans, there is an over-capacity of pre-treatment facilities in Ireland and
in the future, there needs to be better coordination between the local authorities, regional
waste authorities and EPA when certifying new facilities. Additionally, we agree with the
plan that additional biowaste treatment facilities are needed, especially with the national
roll-out of the brown bins and the enforcement of the Commercial and Household Food
Waste regulations.
10
DEFRA (2005), “Guidance for Waste Collection Authorities on the Household Waste Recycling Act 2003”,
www.defra.gov.uk/ENVIRONMENT/waste/legislation/hwra/hwra-guidance.pdf 11
Friends of the Earth (UK) Briefing (September 2009), “Recycling collections—source separated or
commingled?”; Dougherty Group LLC for WRAP (2006), “Materials Recovery Facilities,”
www.wrap.org.uk/document.m?id=3528 12
WRAP (2008), “Kerbside recycling: indicative costs and performance.”
www.wrap.org.uk/downloads/Kerbside_collection_report_160608.41243a68.5504.pdf; Friends of the Earth
(UK) Briefing (September 2009), “Recycling collections—source separated or commingled?” 13
Friends of the Earth (UK) Briefing (September 2009), “Recycling collections—source separated or
commingled?”
Environmental Pillar Submission to the Public Consultation on the Regional Waste
Management Plan January 2015
Page 13 of 44
We question the need for the Poolbeg WtE plant as well as a further proposed 300,000
tonne WTE facility. Further detailed rationale is contained in the Energy Recovery section
below.
7. Energy Recovery is limited to non-recyclables
Export figures
Ireland exports its waste mainly to Germany, the Netherlands, Denmark, Sweden and the
UK. The estimated cost of this, including all packaging and shipping, has been put at 80-100
euro per tonne by an Irish study14 and 46-174 euro per tonne, for international export, by a
European study15. The planned facility in Dublin is proposing a gate fee in excess of the
lower bound of this range in its optimistic estimations, approximately 110 euro per tonne
and on par with this figure in its most pessimistic projections, at 80 euro per tonne16. Thus
there appears to remain risk of competition from international incinerators in the most
pessimistic of financial projections. This is particularly true at the moment due to the
undersupply of waste in many incinerators across Europe, which has led to very competitive
gate fees in receiving plants, as low as less than 50 euro in countries like Germany and
Denmark, and a lack of taxes on incineration across the EU, currently only six member states
have incineration taxes, and in many cases taxation is as low as 1 or 2 euro per tonne17
Overcapacity
There are currently 406 incinerators operating across Europe. These comprise an estimated
total capacity of 54 million tonnes, as of 2010.18 Many of these plants are already struggling
to reach capacity and thus are relying on a Europe wide export market for waste. Despite
declining waste levels and undersupply of waste to existing plants, there are plans for
continued expansion in the sector, with 48 new plants planned. This would constitute an
14
Dublin waste to energy, waste market assessment, RPS pg.39 2014
15 http://ec.europa.eu/environment/waste/pdf/final_report_10042012.pdf
16
Dublin waste to energy cost benefit analysis PWC pg.13
17
[vii] Incineration overcapacity and waste shipping in Europe, the end of the proximity principle?
GAIA pg 18, 2013
18 Incineration overcapacity and waste shipping in Europe, the end of the proximity principle? GAIA
pg.6, 2013.

Environmental Pillar Submission to the Public Consultation on the Regional Waste
Management Plan January 2015
Page 14 of 44
increase in capacity of 13 million tonnes up to 202019 as well as an increase in the capacity
of some existing incinerators, including in Ireland, with a proposed 10% increase in capacity
planned for the Indaver incinerator in Co. Meath, an incinerator with a current capacity of
200,000 tonnes.20
There is currently more incinerator capacity than residual waste in many member states,
and if Ireland is to meet its EU obligations to recycle 50% of its MSW by 2020 and 70% by
2030 as well as provide needed feedstock to WtE facilities, it will be relying on an increase
in waste generation to ensure it can maintain a residual waste stream so as to reach
capacity in its national incinerators. This is especially true if trends continue in Europe, and
gate fees in other countries decrease further. According to a report on the Irish waste
market this growth in waste is expected to be an increase of 1,211,381 tonnes up to
2030.21 Much of this projected increase is attributed to population growth as well as a
stronger economy. However 2012 EPA figures put municipal waste generated at 4.6% less
than the previous year and Irish household waste generation per capita at 344 kg, below the
EU27 average, despite consistent population growth, and improved economic indicators.22
8. Inefficiency
This increased investment in incineration is at odds with the Europe wide commitment to
decreasing waste generation, given its reliance on residual waste streams. According to the
EU Commission’s ‘Roadmap to a Resource Efficient Europe’, key milestones include having
waste generation per capita in absolute decline, as well as energy recovery limited solely to
non-recyclable materials.23Increased investment in incineration, which is reliant on residual
waste streams, undermines the goal of declining waste generation and the scientific
evidence on the energy recovery limitations of solely non-recyclable materials and the
necessity of highly calorific materials for the incineration process is at odds with EU
commitments to limit energy recovery to these materials alone. A scientific study carried
out showed that recycling materials conserves three to four times more energy than
incineration, and that the only waste streams that produced energy at a rate close to
19
Incineration overcapacity and waste shipping in Europe, the end of the proximity principle? GAIA pg.12, 2013. 20
Dublin waste to energy, waste market assessment, RPS, pg.34, 2014.
21 Dublin waste to energy, waste market assessment, RPS, pg.17, 2014.
22 http://www.epa.ie/pubs/reports/waste/stats/EPA_NWR12_Complete_to_web_5Aug14.pdf
23 http://ec.europa.eu/environment/resource_efficiency/pdf/com2011_571.pdf
Environmental Pillar Submission to the Public Consultation on the Regional Waste
Management Plan January 2015
Page 15 of 44
recycling were food, wood and yard waste24This leaves investment in a process which is
either diverting recyclable and biodegradable materials from more energy efficient and
environmentally sound recycling practices, contradicting the EU’s own goals in its
framework for resource efficiency in europe, or alternatively in an inefficient process which
recovers little actual energy.
9. Alternatives, job creation and market risks
In Ireland’s ‘Strategy for Renewable Energy 2012-2020’ the government outlined five main
areas of importance for Ireland’s future renewable energy sector. Of these, wind, tidal and
bioenergy were targeted as areas for development and potential economic gains.25The gains
to be made in the bioenergy sector included boosting job creation in rural areas through
bioenergy enterprises and their refit3 scheme for biomass technologies. It is under this
same scheme that the proposed incineration facility in Dublin is to receive subsidies for 57%
of its electricity output, at a guaranteed price 20% over market electricity price of 71.2 euros
per MWh, for the first 14 years of operation.26 An alternative treatment for the biomass
element of municipal waste is anaerobic digestion, which the government outlined in a 2011
report as being an important area of ongoing investment and development. According to
this report investment costs for a 380kw anaerobic digestion plant stand at approximately
1.5 million euro and capital investment is put at 4,000 euro per kilowatt27. The report also
estimated that development in this area could see the creation of nearly 8,000 jobs per
1,000 plants built as well as constitute a boost to the farming sector and rural
development.28
Expansion of the waste to energy sector seems at odds with their previous proposals on
renewable energy given the inefficiency of the technology, the available alternatives, as well
as the risky returns to the project in a competitive EU market. Investment would be better
served developing new energy sectors, given our abundance of natural resources, as
24 http://www.ewp.rpi.edu/hartford/~ernesto/S2014/SHWPCE/Papers/SW-Preprocessing-Separation-
Recycling/Morris1996-Recycling-vs-Incineration-Energy.pdf pg.292
25 [xv] http://www.dcenr.gov.ie/NR/rdonlyres/9472D68A-40F4-41B8-B8FD-
F5F788D4207A/0/RenewableEnergyStrategy2012_2020.pdf pg.9
26 http://www.dcenr.gov.ie/NR/rdonlyres/9472D68A-40F4-41B8-B8FD-
F5F788D4207A/0/RenewableEnergyStrategy2012_2020.pdf
27
The development of anaerobic digestion in Ireland, joint committee on communications, energy and natural
resources, 2011. Pg. 4 28
The development of anaerobic digestion in Ireland, joint committee on communications, energy and natural
resources, 2011. Pg. 9
Environmental Pillar Submission to the Public Consultation on the Regional Waste
Management Plan January 2015
Page 16 of 44
outlined in the government’s own energy strategy.29The potential for job creation in the
WtE project is limited, with many of these jobs being temporary, being only available during
the building of the project whereas 19,000 jobs have already been created in the green
sector with a potential for an additional 10,000.30 There is opportunity for sustained job
creation and sector wide development in newer, green technologies as well as in developing
recycling facilities. In many towns and cities across Europe, local authorities have found an
economic opportunity in developing their circular economy, by creating strong recycling
networks and focusing on local production they have boosted their local economies, created
jobs and saved money. An Italian town council saved 2 million euros when they engaged on
a zero waste strategy and others like it have been similarly successful.31
As well as our current WtE capacity of 200,000 tonnes, there are other treatment options
available for municipal waste, among them three cement kiln facilities operating in the
country which accept waste. The total consented capacity of these facilities was 342,875
tonnes in 2012 with 121,214 tonnes actually being recovered in the same year.32According
to a 2012 EPA report there is a national capacity for biological treatment of waste of
550,000 tonnes.33 Given our current export rate of over 800,000 tonnes, if waste projections
are incorrect and recycling efforts improve in line with EU directives, there is a potential for
incineration overcapacity, particularly if waste exports continue as they have been due to
market competition. The UK has a potential overcapacity of 6.9 million tonnes of waste if
current expansion plans go ahead and despite this there has been a growth in the export of
residual waste from the UK to other countries in Europe, one British study estimated an
export market for waste of 2 million tonnes in 2020, despite over capacity risks.34 Other
European countries, such as Belgium and the Netherlands also have strong import and
export markets for their waste. The Netherlands is a prominent exporter of waste despite
running an overcapacity of 600,000 tonnes a year.35 Expanding incinerator capacity in a
country is no guarantee that waste will stay in it. The waste framework directive has opened
up a Europe wide market for waste,36 which waste operators across the continent are taking
advantage of. Incinerators run at extremely high operating costs and on very tight profit
margins, in such a competitive market, there is a real threat that the proposed facility in
Dublin will simply not be able to compete.
29 Dublin waste to energy, waste market assessment RPS pg.26 2014.
30
http://www.dcenr.gov.ie/NR/rdonlyres/9472D68A-40F4-41B8-B8FD-
F5F788D4207A/0/RenewableEnergyStrategy2012_2020.pdf pg 8 31
Zero waste Europe, case study, the story of Capannori, pg.4 32
http://www.epa.ie/pubs/reports/indicators/00061_EPA_SoE_2012.pdf Table 5.1 33
http://www.greeninvestmentbank.com/media/25376/gib-residual-waste-report-july-2014-final.pdf 34
http://www.greeninvestmentbank.com/media/25376/gib-residual-waste-report-july-2014-final.pdf pg 16 35
http://www.iswa.org/uploads/tx_iswaknowledgebase/Berthoud.pdf pg 2 36
1 Directive 2008/98/EC of the European Parliament and of the Council of 19 November 2008 on waste and
repealing certain Directives

Environmental Pillar Submission to the Public Consultation on the Regional Waste
Management Plan January 2015
Page 17 of 44
10. Environmental and health impacts
According to the Regional Plans, the current amount of waste landfilled in Ireland is in the
order of 1,027,577 tonnes per anum. Given that 20% of waste from incinerators needs to be
disposed of after treatment, this is not the best technology to substantially bring this figure
down, and in line with EU targets. The only municipal waste incinerator operating in the
state currently generates 40,000 tonnes per annum of bottom ash. Of this only 5,000 tonnes
of ferrous metals are extracted and 1,500 tonnes of non-ferrous metals are extracted for
recycling. The rest is used an engineering material on landfills. 11,000 tonnes of boiler and
flue gas treatment residue are exported for underground stowage. This is a substantial
amount of the original 200,000 tonne capacity not diverted from landfill or fully recovered,
not to mention the much more difficult to manage and highly toxic fly ash which remains a
health hazard and air pollutant. The detrimental environmental effects of incineration are
well known, a 2000 public health report outlined the health risks to people living near an
incineration plant and to the plant workers themselves from dioxins and other dangerous
contaminants37 and a 2009 report on a planned incineration facility here in Ireland outlined
a number of public health concerns regarding fine particle emissions, including respiratory
and cardiovascular illness and premature mortality.38
Despite efforts to filter and reduce emissions as much as possible, studies have found that
these ultrafine particles may actually be more dangerous than the larger particles which are
being removed. Excess deaths from particle inhalation in the EU have been put at 370,000 a
year.39 There are further environmental and public health concerns regarding not only the
toxicity of the incineration residue, but the precarious nature of the process itself. One
paper from the University of Cork outlined the potential health and environmental hazards
posed under a scenario where insufficient waste is available to keep the process operating
at maximum levels. The process requires a fine balance of waste, oxygen and heat, and a
constant supply of feedstock. A threat exists if not all dangerous substances are destroyed
during the process or in a situation where incomplete combustion has the potential to
create new, even more dangerous substances such as dioxins and ferans, known
carcinogens.40 There have been calls over recent years from the scientific community here
for more in depth analysis of the potential health risks of these facilities to the local
community, and more worrying still criticism of those that were carried out as inadequate.41
In fact, the initial environmental impact assessment which was carried out, and under which
37
Waste Incineration and Public Health (2000), Committee on Health Effects of Waste Incineration, Board on
Environmental Studies and Toxicology,
Commission on Life Sciences, National Research Council, National Academy Press, pp. 6-7.
38
http://www.durhamenvironmentwatch.org/Incinerator%20Health/CVHRingaskiddyEvidenceFinal1.pdf pg.4 39
http://www.durhamenvironmentwatch.org/Incinerator%20Health/CVHRingaskiddyEvidenceFinal1.pdf pg.4 40
http://www.ucc.ie/en/appsoc/researchconference/conf/cstj/cstjournalvolume32011/robertcorrigan/RobertCorriga
n.pdf pg 106 41
http://fiasco.ie/incinerator/resources/Critique_of_Health_Assessment_in_EIS_-_Dr_Anthony_Staines.pdf
Environmental Pillar Submission to the Public Consultation on the Regional Waste
Management Plan January 2015
Page 18 of 44
the license was granted, has come under heavy criticism for failing to adequately assess any
of the potential health implications for local communities.42
Lastly, if Ireland pushes more towards WtE to ‘recover’ its waste, there will be a loss of
confidence with the public. They will question the need to recycle at all since they have the
impression that it will be burned anyway.
Recommendation 6: The Environmental Pillar recommends a change in waste policy to
move away from incineration/waste to energy as a waste treatment technology and to
move towards the adoption of ‘zero waste’ principles.
11. Recycled Waste is used as a reliable source of raw material
Globally electronic waste represents a $130 billion opportunity. Mobile phones contain
more gold than the ore dug out of mines.43 Rare earths are as their name implies rare, and
are only to be found in certain parts of the planet, where their export may be restricted, or
the location is one of continuing wars and civil strife. These rare earths are essential to the
high tech tools we rely on for our clean-tech and other industries.
The collection for the recycling of Waste Electronic and Electrical Equipment (WEEE) is very
important and should be the first priority for WEEE. The government should focus on
methods to increase the repair and reuse of various types of WEEE, including computers,
printers, copying machines, appliances and other types of electronics. This focus will not
only reduce energy and resource usage, but it will also encourage the development of new
businesses and jobs.
Recommendation 7: Develop closed loop policies for all materials streams, with labour
intensive recycling as a priority.
Along with a tax on all one way packaging the government should support the introduction
of a deposit-and-refund scheme for recyclable containers, including glass bottles, plastic
bottles, aluminium cans. Ireland currently only recycles just above 55% of our aluminium
cans, which is one of the most recyclable products. If a deposit/refund scheme were in
place, up to 97% could be recovered (amount recovered in the State of Michigan). Many
drinks containers are lost in the waste stream because they are bought while away from
home. Most individuals do not keep the cans or bottles until they return home or reach a
recycling bank. However, if there were a deposit of around 10 cents on each drinks
container, people would either keep the can or bottle, return it to a local shop or
organisations will collect them for fundraising causes.
42
http://www.ucc.ie/en/appsoc/researchconference/conf/cstj/cstjournalvolume32011/robertcorrigan/RobertCorriga
n.pdf 43
http://www.ellenmacarthurfoundation.org/circular-economy/circular-economy
Environmental Pillar Submission to the Public Consultation on the Regional Waste
Management Plan January 2015
Page 19 of 44
Recommendation 8: Introduce deposit-and-refund schemes on all recyclable drinks
containers on a pilot basis to test the validity of extending the scheme nationally. See
Appendix B.
1st July 2010 is the date the Food Waste Regulations (SI 508 of 2009) entered into force in
Ireland. The Regulations require major producers of food waste to source segregate food
waste, ensure that it is not mixed with other waste and make it available for a brown bin
collection service where it is recycled in a food waste recycling plant (e.g. composting plant
or anaerobic digestor). Alternatively, waste producers can bring the food waste directly to a
food waste recycling plant; or the food waste can be treated by composting it on the
premises where it is generated. Similar regulations were adopted in 2012 for household
food waste separation and collection.
It is estimated that there are at least 250,000 tonnes of food waste disposed of by
commercial businesses in Ireland each year44, as well as large volumes of food waste
generated by individuals throughout the country. While not all of this is reusable, it is
estimated that at least 60% of food waste is avoidable.45
Recommendation 9: Prioritise the implementation of the Food waste regulations and to
investigate the use of surplus edible foods currently discarded as waste.
Recommendation 10: Promote the development of anaerobic digestion of biowaste
streams at community level to deliver combined heat and power and to recycle nutrients
to the soils from whence they came.
Hazardous waste is safely managed and generation is reduced
The waste plan calls for a 50,000 tonne WtE incinerator to burn hazardous waste. The
Environmental Pillar recommends that instead of looking at hazardous waste to be burned
investigate other types of management techniques. Firstly, we call on the regions to
organise more household hazardous waste collections, new extended producer
responsibility initiatives for hazardous waste streams and the establishment of a more
innovative and effective symbiosis programme.
12. Industrial symbiosis
Industrial symbiosis is simply the idea that waste and by-products of one company can
become the resources of another, thus reducing the use of raw materials. It involves three
key components, namely, the exchange of by-product resources, utility and infrastructure
sharing, and joint provision of services.46 It has become an integral part of the circular
economy goals of waste reduction and decoupling resource use from economic growth.
Through coming together to create an integrated network of shared resources, by-products
44
National Waste Database 2011 45
http://www.wrap.org.uk/content/facts-and-figures 46
Uncovering industrial symbiosis, Chertow, Marian R. 2007, pg. 12

Environmental Pillar Submission to the Public Consultation on the Regional Waste
Management Plan January 2015
Page 20 of 44
and utilities, companies have reaped many benefits, they have cut costs, created and
safeguarded jobs as well as improved their environmental performance. These networks
have become so successful that there are now widespread governmental efforts to fund and
support these processes.
The United Kingdom in particular is leading the way in supporting such networks, through
their ‘National Industrial Symbiosis Programme’. The programme is a voluntary instrument
which assists businesses in redirecting their waste from landfill by helping them find
businesses to connect with, allowing them to exchange their waste as a resource, creating
substantial savings and realizing significant environmental gains. The programme began as a
private collaborative effort between businesses and evolved into a nationwide programme
funded by the business resource efficiency and waste programme.47The programme now
comprises of over 15,000 businesses and has seen significant economic gains for the regions
in which it has been implemented. Each region in the UK in which the programme is active
has seen gains of over 60 million pounds, over a five year period, as well as seeing 10,000
tonnes of waste diverted from landfill, the creation of 100 new jobs and substantial
reduction in water and energy use.48
Nationwide the benefits have been significant, saving the companies involved 1 billion
pounds and generating a further 1 billion pounds in additional sales, it is also credited with
creating or safeguarding 10,000 jobs across the UK.49 The environmental impacts have been
just as impressive, the programme has allowed 47 million tonnes of waste to be recovered
or reused as of 2013, industrial carbon emissions have been reduced by 39 million tonnes,
1.8 million tonnes of hazardous waste have been reused, there has been a 73 million tonne
industrial water savings made, as well as 60 million tonnes of virgin material.50 Northern
Ireland has seen similar success figures from its participation in industrial symbiosis
programmes, allowing businesses to cut costs by 5.5 million pounds, generate 12 million
pounds in new sales as well as create or safeguard 71 jobs. Environmentally they have been
able to divert 139,000 tonnes of industrial waste from landfill, reduce carbon emission by
247,000 tonnes and save 130,000 tonnes of virgin material.51
Other European countries such as Denmark and Switzerland have also seen success with
similar networks, and the EU, impressed with the success of these enterprises in other
countries, has begun supporting fledgling projects in countries such as Romania and
Hungary through its Life+ programme. These nascent projects are already reaping the
economic and environmental benefits. In Romania, the 178 companies involved have
already reused half a million tonnes of waste and saved 135,000 tonnes of CO2. Through the
reuse of wood and sawdust 2,500 hectares of forest have been saved.52
47
Waste management policies for industrial symbiosis development, case studies in Europe, Journal of cleaner
production, 2010, pg. 818 48
The Industrial Symbiosis Research Symposium at Yale:Advancing the Study of Industry and Environment,
2004,pg.11 49
http://www.international-synergies.com/projects/national-industrial-symbiosis-programme-nisp 50
http://www.international-synergies.com/projects/national-industrial-symbiosis-programme-nisp 51
http://www.international-synergies.com/projects/maximising-efficiencies-energy-waste-industrial-symbiosis-
service-for-invest-northern-ireland 52
European Commission, Eco-innovation Action Plan
Environmental Pillar Submission to the Public Consultation on the Regional Waste
Management Plan January 2015
Page 21 of 44
These industrial symbiosis networks have been recognized on a supranational level as
having the potential for enormous economic as well as environmental benefits. The national
industrial symbiosis programme in the UK in particular has been pinpointed by the European
Commission as providing the “highest economic benefit to the companies involved”53 and
suggested that a Europe-wide network would prove even more successful, recommending
that similar programmes be rolled out in all 28 member states.54 In 2010 the organization
for economic-cooperative development (OECD) recognized industrial symbiosis as “vital for
future green growth.55
Governments can help foster such important networks by creating a policy landscape
conducive to environmental progress. In the United Kingdom, for example, the government
introduced a mix of economic, regulatory and voluntary instruments which have helped
shape the policy context for industrial symbiosis development. As well as the national
industrial symbiosis programme, the earlier landfill tax and waste protocol project helped
foster the development and growth of the networks.56 In Portugal mandatory electronic
information reporting on waste, landfill and incineration taxes as well as a voluntary
instrument, the ‘organized waste market’, which facilities transactions of waste materials
and promotes recycling, have helped created a context that supports the development of
industrial symbiosis networks in the country.57On a subnational level, Geneva, Switzerland
introduced the concept of industrial ecology into law, with article 12, which stipulates that
the state “facilitate the possible synergies between economic activities in order to maximise
their environmental impact” and also established an advisory board for industrial symbiosis
implementation.58
By using economic and legislative instruments as a disincentive to overuse resources and by
creating economic advantages to recycling and reuse governments can help to foster a
landscape that allows for the development of these symbiotic networks. Through direct
national and sub-national funding these networks can be developed and expanded, bringing
huge economic and environmental benefits to both the companies involved and also to the
country as a whole. Countries within the EU should see industrial symbiosis as an integral
part of the EU’s plan for a circular economy, allowing businesses to cut costs and improve
sales, decouple resource use from economic growth, and provide essential environmental
progress at low cost. Industrial symbiosis is being seen globally as a vital component of a
new economic paradigm and countries should take advantage of the potential gains it can
bring through the use of economic instruments that incentivise environmentally progressive
53
http://pprc.org/wp-content/uploads/2012/05/ISL_report.pdf pg.2 54
http://pprc.org/wp-content/uploads/2012/05/ISL_report.pdf pg.2 55
http://pprc.org/wp-content/uploads/2012/05/ISL_report.pdf pg. 2 56
Waste management policies for industrial symbiosis development, case studies in Europe, Journal of cleaner
production, 2010, pg. 818
57
Waste management policies for industrial symbiosis development, case studies in Europe, Journal of cleaner
production, 2010, pg. 818
58
Waste management policies for industrial symbiosis development, case studies in Europe, Journal of cleaner
production, 2010, pg. 819

Environmental Pillar Submission to the Public Consultation on the Regional Waste
Management Plan January 2015
Page 22 of 44
business practices and by creating a policy landscape that fosters these innovative
programmes.
Recommendation 11: We propose the establishment of regional and/or national
symbiosis programmes to foster and assist in the development of industrial symbiosis
networks.
13. Monitoring and Enforcement
The plans outline the current funding mechanism for monitoring and enforcing waste
permits and actions. Currently, local authority enforcement teams are granted money from
the Department of Environment, Community and Local Government from the
Environmental Fund through to the end of 2014. How will permits and actions be
monitored and enforced from 2015 and onwards? The number of inspections by local
authorities of the packaging waste regulations has reduced significantly between 2007 and
2011, from 3,104 to 1,187 inspections. From 1997 until 2010, there were 50 prosecutions,
mostly before 1997 and 64% by the Dublin City Council.
In 2012, the Eastern Midlands Region conducted nearly 50,000 inspections, many in relation
to the enforcement of the food waste regulations with 157 prosecutions.
Unlike all other EU member states, Ireland’s waste collection and treatment is done through
the private sector. There must be adequate and effective monitoring and enforcement of
their activities to ensure that the waste streams are responsibly managed and treated and
that there is not a race to the bottom in terms of waste management as waste companies
vie for both residential and commercial business.
Recommendation 12: There must be adequate and sufficient funding for local and
regional authorities to monitor and enforce the proper management and treatment of
waste to ensure that the waste hierarchy is properly enshrined in the ultimate use of
valuable waste resources.
14. Food Waste is reduced
EPA’s Office of Waste Prevention has supported Stop Food Waste programme and its
various initiatives listed in the plans. The Pillar supports the work being done by this
programme and urges an increase in funding to continue its work with households,
communities, food businesses and the hospitality sector. The reduction in food waste will
only occur with a significant change in individual and corporate behaviour which requires a
considerable increase in funding.
15. Biowaste treatment
As detailed earlier in this submission, an Oireachtas committee in 2011 recommended the
investment in anaerobic digestion as an efficient treatment technology for food waste (one
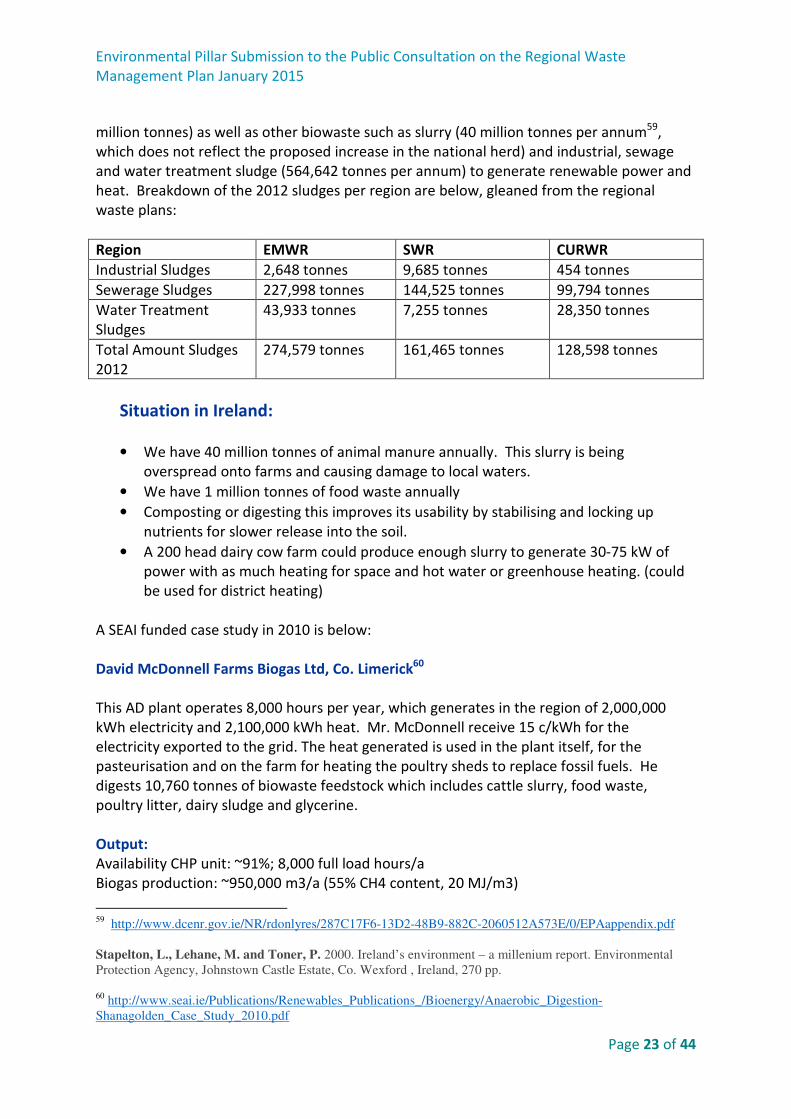
Environmental Pillar Submission to the Public Consultation on the Regional Waste
Management Plan January 2015
Page 23 of 44
million tonnes) as well as other biowaste such as slurry (40 million tonnes per annum59,
which does not reflect the proposed increase in the national herd) and industrial, sewage
and water treatment sludge (564,642 tonnes per annum) to generate renewable power and
heat. Breakdown of the 2012 sludges per region are below, gleaned from the regional
waste plans:
Region EMWR SWR CURWR
Industrial Sludges 2,648 tonnes 9,685 tonnes 454 tonnes
Sewerage Sludges 227,998 tonnes 144,525 tonnes 99,794 tonnes
Water Treatment
Sludges
43,933 tonnes 7,255 tonnes 28,350 tonnes
Total Amount Sludges
2012
274,579 tonnes 161,465 tonnes 128,598 tonnes
Situation in Ireland:
• We have 40 million tonnes of animal manure annually. This slurry is being
overspread onto farms and causing damage to local waters.
• We have 1 million tonnes of food waste annually
• Composting or digesting this improves its usability by stabilising and locking up
nutrients for slower release into the soil.
• A 200 head dairy cow farm could produce enough slurry to generate 30-75 kW of
power with as much heating for space and hot water or greenhouse heating. (could
be used for district heating)
A SEAI funded case study in 2010 is below:
David McDonnell Farms Biogas Ltd, Co. Limerick60
This AD plant operates 8,000 hours per year, which generates in the region of 2,000,000
kWh electricity and 2,100,000 kWh heat. Mr. McDonnell receive 15 c/kWh for the
electricity exported to the grid. The heat generated is used in the plant itself, for the
pasteurisation and on the farm for heating the poultry sheds to replace fossil fuels. He
digests 10,760 tonnes of biowaste feedstock which includes cattle slurry, food waste,
poultry litter, dairy sludge and glycerine.
Output:
Availability CHP unit: ~91%; 8,000 full load hours/a
Biogas production: ~950,000 m3/a (55% CH4 content, 20 MJ/m3)
59
http://www.dcenr.gov.ie/NR/rdonlyres/287C17F6-13D2-48B9-882C-2060512A573E/0/EPAappendix.pdf
Stapelton, L., Lehane, M. and Toner, P. 2000. Ireland’s environment – a millenium report. Environmental
Protection Agency, Johnstown Castle Estate, Co. Wexford , Ireland, 270 pp.
60
http://www.seai.ie/Publications/Renewables_Publications_/Bioenergy/Anaerobic_Digestion-
Shanagolden_Case_Study_2010.pdf
Environmental Pillar Submission to the Public Consultation on the Regional Waste
Management Plan January 2015
Page 24 of 44
Electricity production: ~2,000,000 kWh/a, mostly exported to the national grid
Heat production: ~2,100,000 kWh/a, heat exported for heating the plant, for pasteurisation
and for heating the poultry sheds
Primary energy savings: ~1,200 MWh/a
CO2 savings: ~1,500 t CO2/a
Total capital cost: ~ €1.5m
SEAI CHP grant: €108.000
Payback time: approx. 10 years
REFIT: 15 ct/kWh exported electricity indexed linked for 15 year
An average Irish Household uses 5,300 kWh annually. This farm produces enough electricity
to serve nearly 400 households annually. If Ireland produces over 41.5 million of biowaste
each year (food waste, sludges and slurry), this could provide enough electricity to power
over 1.5 million households and provide heat to pump into district heating systems.
16. AD plants internationally
Germany has 7,000+ on-farm biogas facilities producing 2-3 times the energy of the
country’s nuclear power plants. Unfortunately, these are currently being fed maize.
However, with the constant supply of sludges and slurry, Ireland has a ready renewable
feedstock for anaerobic digestion, although the development of this industry to treat
biowaste has been slow in the uptake due to the low refit rates in Ireland (15c/kWh in
Ireland vs. 28c/kWh in UK, Italy, Germany, France and Hungary).
Recommendation 13: Increase the REFIT rate for anaerobic digestion to encourage the
development of this industry and provide government assistance in terms of grants, loans
or guarantees.
17. Reviews of existing product and waste legislation
Currently, there are 6 streams of waste with extended producer responsibility initiatives
(PRI) schemes: packaging waste, WEEE, End of Life Vehicles, batteries and accumulators,
used tyres, farm plastics and construction and demolition waste. However, as the report
states, this scheme should be extended to paints, medicines, bulky wastes, chemicals and
oils, newspapers and magazines.
Each waste region spends a significant amount of its budget, sometimes as much as 45% (in
the EMWR) on litter clean up and street cleanings, which includes the servicing of street
bins. Much of the waste is packaging although the cost of managing this waste is born by
the municipalities and the taxpayers, rather than the producers. The regional waste plans
state that €103.34 million was spent on litter and street sweeping as well as the
management of street bins and that the counties were facing a financial shortfall in
providing these services in the region of €93.68 million.

Environmental Pillar Submission to the Public Consultation on the Regional Waste
Management Plan January 2015
Page 25 of 44
Region EMWR (€M)
(%budget)
SWR (€M)
(%budget)
CURWR (€M)
(%budget)
Litter 11.69 (38%) 6.42 (8%) 4.28 (16%)
Street Cleaning 60.71 (7%) 16.77 (21%) 3.47 (13%)
Total Expenditure 72.4 (45%) 23 (29%) 7.74 (29%)
Total Income 2.1 `1.5 1.93
Total Shortfall 70 21.5 2.18
Recommendation 14: We propose that the regional authorities investigate possible
financing mechanisms through the packaging PRI to fund the management of packaging
waste found in street cleanings, litter collections and street bins. Such funding could also
be used to provide increased number of separate recycling bins on streets.
18. Increase public information campaigns to stimulate a change in
behaviour
The only way to prevent the creation of waste and to recycle properly is to change the
behaviour of businesses and individuals. The plans earmark €0.15 c/inhabitant to spend on
local prevention projects, which amounts to around €690,000 per annum for local projects.
This amount must be increased significantly as research indicates that a bottom up
approach to changing behaviour is much more effective than a top down advertising
campaign or policy initiatives alone. They must go hand in hand. For instance, Scotland has
adopted a Zero Waste regime and has set up a £10 million zero waste fund to assist local
communities in their zero waste programmes.61
While the development of responsible waste management policy and actions are essential,
the government must ensure the buy-in of local government, community groups, businesses
and individuals. Behavioural change does not happen overnight or through education alone
or huge advertising campaigns such as the Race Against Waste or the Power of One. Change
will happen by engaging with communities and individuals and motivating them to change
their behaviour by changing the social norms.62 A study demonstrated that if individuals
believed that most people engage in a certain behaviour, they would as well. This survey
showed that there was a 36% increase in the number of people reusing their hotel towels
when they read a card in the hotel room that said that most people reuse their towels.63
The desired behaviour must have relevance to the individual’s value system because this
way the behaviour will be sustained over time. Purely monetary incentives will change
behaviour until that incentive is removed.
61
http://www.zerowastescotland.org.uk/category/what-we-offer/funding 62
http://www.theguardian.com/sustainable-business/communicating-sustainability-behaviour-change-public-
health 63
http://www.theguardian.com/sustainable-business/behavioural-insights/behaviour-change-sustainability-
debate

Environmental Pillar Submission to the Public Consultation on the Regional Waste
Management Plan January 2015
Page 26 of 44
Education and door to door assistance must also be encouraged and resourced. REPAK
conducted research into the recycling habits of households and found that while most of us
(98%) are recycling, 7 out of 10 of us are using the wrong bin.64 This is a huge concern as
improper waste management and recycling habits will contaminate other material in the
same collection vessel, thus directing such material out of the recycling loop and into energy
recovery, a lower waste management technology.
There is a huge field of research and ongoing work on how to change individual behaviour.
It is a huge challenge, but one thing is certain, change will not happen over-night and
resources must be invested into this field and into local communities to facilitate their work.
Recommendation 15: We encourage the regions to increase the amount of money
available for local waste prevention programmes, similar to that adopted by Zero Waste
Scotland. We also advocate for a more bottom-up public awareness/community
involvement to assist in behavioural change in how we manage our waste.
64
http://www.businessandleadership.com/sustainability/item/47957-ireland-moves-up-from-fourt
Environmental Pillar Submission to the Public Consultation on the Regional Waste
Management Plan January 2015
Page 27 of 44
Appendix A
ZERO WASTE PROPOSAL
Towns, villages and cities which have implemented zero waste strategies have enjoyed
significant fiscal as well environmental advantages. The plans focus on proper source
separation, household collection techniques, recycling, composting of organic waste and
reuse. This can be achieved through changing attitudes to waste through community wide
education, as well as changing consumption habits. Ultimately the plan focuses on reduction
of waste, with as little residual waste as possible, eliminating the need for environmentally
harmful and costly disposal techniques such as landfilling and incineration. This will
incorporate a focus on community wide re-use schemes, and research on eco-design and
manufacturing. Such an approach would provide more green jobs in recycling collection and
processing industries. Increasing the amount of quality recyclates would provide consistent
supply of feedstock for businesses wishing to develop recycling technology. Additionally, a
change in individual and corporate behaviour would advance the repair and reuse industry
as well as promote industrial symbiosis relationships.
San Francisco, which has 850,000 inhabitants, planned to build an incinerator in 1985, but it
was never built. Instead, they adopted a ‘zero waste’ approach in 2002 and by 2012, it was
able to divert 80% of its waste from landfill. It did this through the complete buy-in from
government officials and the public. It organised compost collections, passed numerous
ordinances to recycle 65% of C&D waste, ban polystyrene food packs in favour of
compostable containers, adopt green policies at all public offices, reduce waste at food
service businesses, impose mandatory recycling and composting, charge a fee on all plastic
bags and ban the selling and use of plastic water bottles in public spaces.
Recently, Slovenia’s capital, Ljubljana has adopted zero waste. “Ljubljana is already the EU
capital with best performance regarding waste separation and waste avoidance; it
separately collects 60 % of municipal waste and generates less than 150kg of residual waste
–what is not recycled or composted- per person yearly. Until 2025 they commit to increase
separate collection to 78 % and decrease the amount of residual waste to 60 kg per person
per year. With this commitment for zero waste, Ljubljana officially rules out building any
incinerator in order to have the flexibility to continue reducing the non-recyclable waste and
push for prevention and recycling (emphasis added).65
If Ireland were to adopt a zero waste paradigm, the waste scenario predicting the amount of
waste to be managed in the future would change significantly. Assuming residual waste of
1,523,577 tonne (2012 figure), an 80% reduction would result in 304,715 tonnes of residual
waste in 2022 or 67 kg per capita. This calculation assumes a stable population. Like many
zero waste communities, an 80% recycling rate is readily achievable given the development
of necessary infrastructure. Ireland generated 2,154,029 tonnes of municipal waste in 2012.
If we were able to recycle 80%, the resulting residual waste would be 538,507 tonnes or 118
kg per capita of residual waste. Given both factors together, a per capita residual waste
amount by 2022 could be between 67 – 118 kg annually. These calculations illustrate that
further thermal treatment in Ireland is not needed.
65
http://www.zerowasteeurope.eu/2014/09/ljubljana-first-eu-capital-to-adopt-a-zero-waste-strategy/

Environmental Pillar Submission to the Public Consultation on the Regional Waste
Management Plan January 2015
Page 28 of 44
Financial impact of zero waste strategy
• Schemes in other towns have become self-funding
• Savings are borne from the elimination of expensive landfilling fees as well as
earnings from the sale of recycling material
• These savings can then be reinvested into the scheme ultimately saving households
money on tariffs
• Boost to employment through new zero-waste sectors
• Waste service tax, such as pay-as-you-throw, and money made from recyclables
have also helped to make other schemes self-funding
Initial steps to adopting zero waste:
• Setting goals and targets for regions/towns
• Engaging with town councils and local authorities to encourage them to sign up for
zero waste plans whereby these targets would be met
• Educating the public and getting local groups/businesses/schools/households on
board for a zero waste plan
• Town meetings/school assemblies to instil the importance of zero waste compliance
• Literature released detailing how households can comply and what they can do to
help
Steps to implement plan:
• Door to door collection was paramount in other successful schemes
• Separate waste bins sent to each household
• kerbside collection for source separated materials…the earlier the material is
separated, the higher the quality that is achieved
• Compliance with source separation helped through pay-as-you throw schemes which
uses microchips in stickers on residual waste bags which are read by a reader in the
collection vehicle
• Brown bins sent to each house with kerbside collection of organic waste streams, for
diversion of organic waste streams
• Home composting encouraged with education regarding composting techniques
• Composting kits sent to homes
• Home composting has been encouraged in other towns through an incentive
whereby homes that compost get a reduced waste collection tariff.
• Public canteens supplied with composting machines
• ‘Recycle as you go’ public recycling bins, to increase recycling and also reduce street
litter, this was introduced successfully in Scotland
• Short-supply chain scheme initiated in Italy, for example, with local farming co-ops
where milk bottles can be refilled
Environmental Pillar Submission to the Public Consultation on the Regional Waste
Management Plan January 2015
Page 29 of 44
• Tax incentives for shops which sell supplies loosely or with minimal packaging
• Textile collection through social enterprises
• Subsidized reusable nappy scheme
• No more plastic cutlery in public canteens/schools etc
• Other collection schemes such as door to door collection of household hazardous
waste, for example twice a year has been a sufficient level for other areas.
Ultimate focus on waste reduction
• Ultimate focus on eco-design
• Opening of research centres to look at ways to reduce packaging waste
• Pinpointing problem areas regarding unrecyclables specific to certain regions, e.g. in
Italian towns it was noticed that there was a problem with unrecyclable coffee filters
which was a focus of the research centre’s consultation about changes in design and
materials.
• Consulting with manufacturers regarding redesign of unrecyclable products
• Opening of re-use centres to make reuse easier for the community
• Community reuse and recycle events
• Workshops teaching upcycling skills
Success figures from other pilot schemes
• The use of pay-as-you throw schemes increased source separation in Italy by 90%
• The overall volume of waste in the Italian zero-waste town of Capannori dropped by
39% per capita over a 9 year period.
• Residual waste per capita was down 57%
• In the Spanish zero waste town of Argentona a pay-as-you throw system has
decreased residual waste in the collection are by 60%
• In Spain the introduction of brown bins meant just a 2% contamination figure for
organic waste streams in 2009.
• In a Slovenian zero waste town, Vrhnika, which implemented similar schemes,
residual waste per capita is down to 87kg per person with a target of overall waste
per capita of 300kg by 2021
• The Capannori town council saved 2 million euros in 2007, which allowed them to
reduce waste tariffs for households by 20%

Environmental Pillar Submission to the Public Consultation on the Regional Waste
Management Plan January 2015
Page 30 of 44
Appendix B
Proposal for a Pilot Deposit Refund Scheme (DRS) in Ireland
Introduction
In the 1950s and 60s, single-use beverage containers began replacing refillable bottles at an
accelerated rate and the use of one-way beverage containers soared. According to the
National Waste Report 2011, by the EPA, only 40% of the municipal waste generated in
Ireland in 2011 was recycled. Regarding packaging waste, only 47.5% of plastics, 38% of
aluminium and around 81% of glass packaging were recycled, the rest ended up in landfill,
or littering streets and the environment.
We send more waste to the landfill than any other nation in the EU 15 and our container
recycling rates are half the rates of our neighbours with deposit and refund systems.
Waste is a significant issue that Ireland cannot ignore. It is costly in many ways, including,
among others, the price of sending the waste to landfill, the damage litter does to Ireland’s
tourism industry, and the cost of producing and importing new materials. Furthermore, if
we continue our current disposal rates, 16 of the 29 available landfills will reach capacity
within the next three years.
Many counties within Ireland have kerbside collections for metal, paper and plastics and
there are also amenity centres and bottle banks (the number of which has reduced by 67
Environmental Pillar Submission to the Public Consultation on the Regional Waste
Management Plan January 2015
Page 31 of 44
since its high in of 1989 bottle banks in 2008). However, according to the US Container
Recycling Institute’s report in 2012, kerbside programmes at best recover 40-45% recycling
rate for all beverage containers as 50-70% drinks containers are consumed at home while
30-50% are consumed away from home.66 It is difficult to capture drinks containers that are
consumed ‘on the go’ or by tourists. A container deposit/refund scheme will help retrieve
these single-use containers.
Container Deposit Refund Scheme (DRS)
In Countries where a deposit system has been implemented results have been always
positive. That is the case of the Netherlands, where the government charges a 25c deposit
on all PET bottles which has resulted in a 95% return. In Sweden, they have an 84% return
for their PET bottles and Finland boasts a 92% return for PET bottles as a result of their
deposit/refund system.67
A 2011 Michigan Department of Treasury study found the enactment of a 10 cent deposit
on plastic bottles in Michigan, which began in 1976, has created a 95.9 percent bottle return
rate – the highest in the nation.68 This is applicable to all the states in US where a deposit
system has been implemented, As shown in Figure 1, recycling rates for traditional beverage
container types were more than twice as high in deposit states in 2010 compared to non-
deposit states. PET has a lower recycling rate than aluminium and glass in deposit states
because only three states include most PET beverages in their deposit laws (California,
Hawaii and Maine).
66
http://www.container-recycling.org/index.php/component/content/article/91-outsidenews/354-container-
recycling-institute-releases-special-2013-vermont-bottle-bill-report- 67
http://www.bottlebill.org/legislation/world.htm 68
http://www.cm-life.com/2013/11/04/advocates-fight-to-reform-michigan-can-deposit-laws/
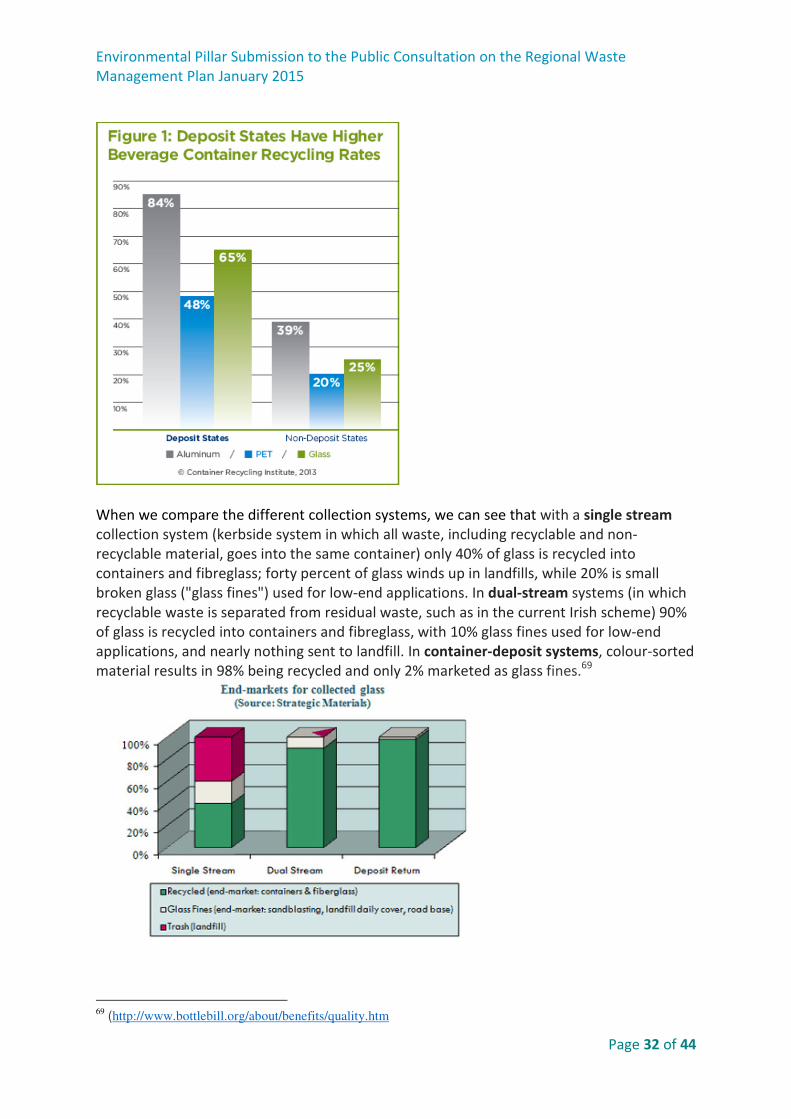
Environmental Pillar Submission to the Public Consultation on the Regional Waste
Management Plan January 2015
Page 32 of 44
When we compare the different collection systems, we can see that with a single stream
collection system (kerbside system in which all waste, including recyclable and non-
recyclable material, goes into the same container) only 40% of glass is recycled into
containers and fibreglass; forty percent of glass winds up in landfills, while 20% is small
broken glass ("glass fines") used for low-end applications. In dual-stream systems (in which
recyclable waste is separated from residual waste, such as in the current Irish scheme) 90%
of glass is recycled into containers and fibreglass, with 10% glass fines used for low-end
applications, and nearly nothing sent to landfill. In container-deposit systems, colour-sorted
material results in 98% being recycled and only 2% marketed as glass fines.69
69
(http://www.bottlebill.org/about/benefits/quality.htm

Environmental Pillar Submission to the Public Consultation on the Regional Waste
Management Plan January 2015
Page 33 of 44
In the US, access to kerbside recycling has been rising for years, nevertheless, it has not
meant an increase in the beverage container recycling rate. 30-50% of beverages are
consumed away-from-home, at bars, restaurants, offices, parks, educational institutions and
on-the-go. Furthermore, kerbside recycling often is not provided to multi-family residences.
At best, kerbside recycling can deliver a 40-45% recycling rate for beverage containers, as
experienced in the Provinces of Ontario and Quebec, Canada.70
Independent research from the Congressional Research Service (CRS) avers that both
deposit return schemes and kerbside recycling programmes are necessary to achieve high
recycling rates and that having both programmes results in less cost for kerbside recycling.
Specifically,
“Both systems can serve as elements of comprehensive recycling programs. Neither
constitutes a comprehensive program by itself. Neither excludes the use of the other.”
“Deposit systems skim potential sources of revenue
from kerbside programs, but they also reduce the
operating costs of kerbside programs. Local
governments would appear to achieve greater
diversion of solid waste from disposal at a lower cost
per ton if both a bottle bill and a kerbside collection
program were in place.”71
70
http://www.bottlebill.org/assets/pdfs/Curbside%20vs%20Beverage%20Fact%20Sheet.pdf 71
http://www.bottlebill.org/assets/pdfs/Curbside%20vs%20Beverage%20Fact%20Sheet.pdf
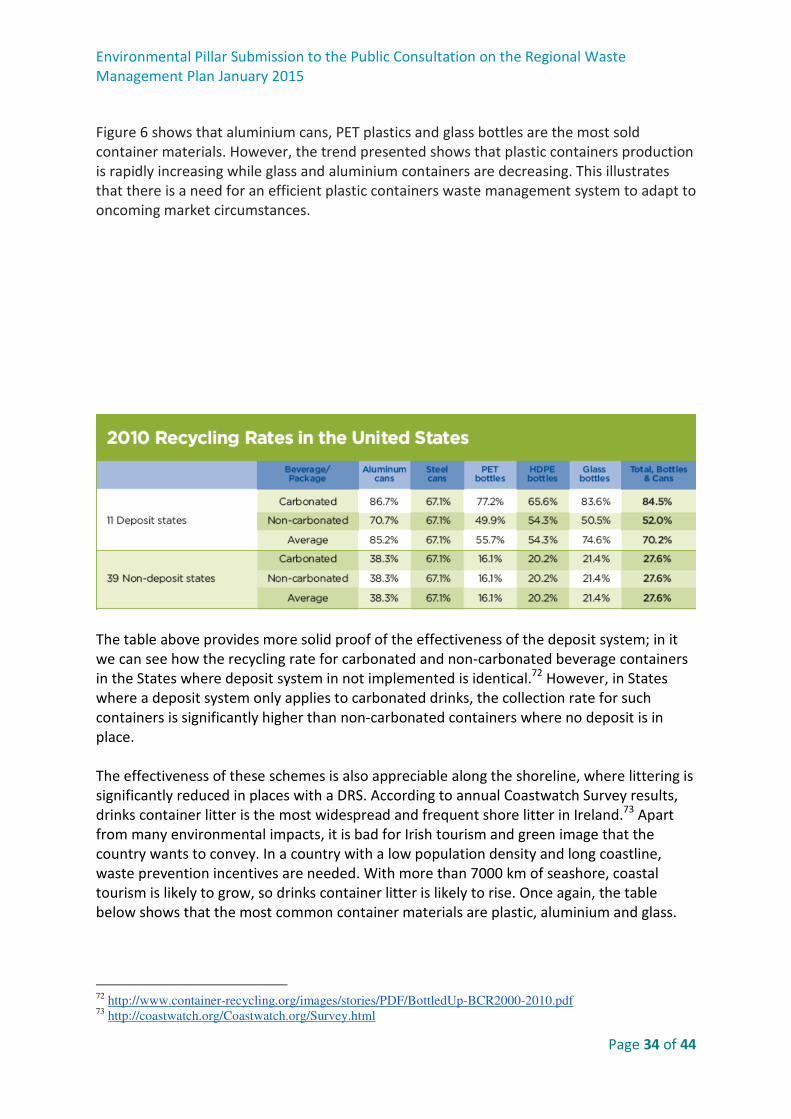
Environmental Pillar Submission to the Public Consultation on the Regional Waste
Management Plan January 2015
Page 34 of 44
Figure 6 shows that aluminium cans, PET plastics and glass bottles are the most sold
container materials. However, the trend presented shows that plastic containers production
is rapidly increasing while glass and aluminium containers are decreasing. This illustrates
that there is a need for an efficient plastic containers waste management system to adapt to
oncoming market circumstances.
The table above provides more solid proof of the effectiveness of the deposit system; in it
we can see how the recycling rate for carbonated and non-carbonated beverage containers
in the States where deposit system in not implemented is identical.72 However, in States
where a deposit system only applies to carbonated drinks, the collection rate for such
containers is significantly higher than non-carbonated containers where no deposit is in
place.
The effectiveness of these schemes is also appreciable along the shoreline, where littering is
significantly reduced in places with a DRS. According to annual Coastwatch Survey results,
drinks container litter is the most widespread and frequent shore litter in Ireland.73 Apart
from many environmental impacts, it is bad for Irish tourism and green image that the
country wants to convey. In a country with a low population density and long coastline,
waste prevention incentives are needed. With more than 7000 km of seashore, coastal
tourism is likely to grow, so drinks container litter is likely to rise. Once again, the table
below shows that the most common container materials are plastic, aluminium and glass.
72
http://www.container-recycling.org/images/stories/PDF/BottledUp-BCR2000-2010.pdf 73
http://coastwatch.org/Coastwatch.org/Survey.html

Environmental Pillar Submission to the Public Consultation on the Regional Waste
Management Plan January 2015
Page 35 of 44
Resource Efficiency and EU Waste Management Priorities
Failure to capture these single-use containers spoils the natural and built environment as
well as wastes valuable resources. One of the EU’s priorities for the foreseeable future is
resource efficiency to capture valuable resources through effective governmental policies
and innovative business practices. The Deposit and Refund System is a proven economic
tool to recover valuable resources.
The Deposit and Refund System (DRS) places a monetary value on beverage containers in
order to encourage users to return them, thus increasing the recovery rate. The
implementation of a DRS would go a long way in meeting the new standards proposed by
the European Environmental Bureau (EEB) for the EC consultation on the Review of the
European Waste
Management Targets. The EEB suggests the following targets:
• Paper and Cardboard: >80 %
• Glass >90 %
• Metals >90 %
• Plastic: >80 %
• Wood: >70 %
• All Packaging >80 %
• Polystyrene and similar type of protective material (if not considered plastic) >60%
EEB suggests the following as implementation dates: as soon as posible for glass, metals and
paper, and 2025 for plastic, wood, all packaging and others. If we compare Ireland’s 2011
recycling data with the EEB’s 2020 proposed targets, we get the following outcome:

Environmental Pillar Submission to the Public Consultation on the Regional Waste
Management Plan January 2015
Page 36 of 44
Material 2011 rates 2020/2025 targets
Paper and Cardboards 91.5% 80%
Glass 81.2% 90%
Plastics 47.5% 80%
Metal (Ferrous) 74.0% 90%
Metal (Aluminium) 38.8% 90%
Wood 92.8% 70%
All Packing 70.9% 80%
In this table we can see how only paper and cardboards and wood containers are already
meeting the recycling target proposed by the EEB. Note that plastic and aluminium
containers are furthest away from these proposed targets. Our proposed DRS pilot will
allow Ireland to meet future recycling targets.
Proposed DRS Pilot Programme in Ireland
This report will analyze the DRS pilot programmes recently implemented in Cadaques
(Spain) and eight different places across Scotland to illustrate the benefits of developing a
similar programme in Ireland, as well as propose a DRS pilot that could work in Ireland.
The Spanish pilot programme is located in the Catalonian town of Cadaques, geographically
isolated and with a small population which made the pilot suitable. It was run by Retorna, a
non-profit association grouping NGOs, recyclers, trade unions and users. Its aims were to
show the viability of the DRS, to analyze the environmental and economic impacts, to be an
example for politicians, business, retailers and population and to evaluate the return rate.
In February 2013, Zero Waste Scotland launched eight Deposit and Return pilot programmes
with the help of the Scottish Government’s Environment Secretary. They spent £900,000 on
its implementation. The goal of the programme was to evaluate the public acceptance, the
volume and quality of material captured, whether the material has been diverted from
kerbside collections or landfill, the impact on litter and litter management, increased
footfall, visitors, use of facilities, visitor spend, and the impact on greenhouse gas emissions.
Results from these separate pilots are expected to be released in March 2014.
Technical development
DRS process

Environmental Pillar Submission to the Public Consultation on the Regional Waste
Management Plan January 2015
Page 37 of 44
In the proposed DRS pilot, each purchaser would be charged a deposit on every beverage
container included. To be reimbursed, the user must return the empty container to any of
the retailers participating in the pilot. Retailers are responsible for returning the deposit and
storing the empty containers. When retailers send the empty containers back to the system
operator, they get the corresponding amount of money plus a compensation for the
management. After this, the system operator sells the high quality raw materials to the
recyclers. The system is financed through this money and the non-reclaimed deposits. The
Deposit and Refund Systems will co-habit with the current kerbside system.
Consumers return
empty containers
Retailers deliver
containers to
system operator
Retailers buy
beverages from
bottlers
Consumers buy
beverages
SYSTEM OPERATOR
BOTTLERS
BUSINESS (Supermarkets/Retailers)
COMSUMERS
Business pays price of
the beverage plus a 25
cent deposit per unit to
the bottlers
Bottlers deliver to system
operator all the deposits
Consumers pay the
product price plus
deposit
Business refunds
deposit to consumer
when empty containers
are returned
System operator returns
deposits paid by business
plus a management fee.
*Non-returned deposits
help finance the system
Materials and money flow inside the DRS
Source: Report on the temporal implementation of a DRS in
Cadaqués, RETORNA

Environmental Pillar Submission to the Public Consultation on the Regional Waste
Management Plan January 2015
Page 38 of 44
Location
In the Spanish scheme, Cadaques was chosen because of its isolated position. It is a small
town located on a peninsula, only reached by a small mountain road. This is an advantage in
order to prevent people from neighbouring towns from bringing their containers to the pilot
project places, since retailers accepted all labelled and unlabeled containers. Its small
population, about 3,000 inhabitants, made it easily workable, and its reputation for tourism
and a culture gave it a bigger public participation in the project. Lastly, the low cost of the
project attracted the local Mayor’s support, which was a key factor for its viability.
In the Scottish case many different locations where chosen including shops, universities,
schools and a festival, which created closed environments to develop the programme.
Setting the pilot in a campus or a festival provides a micro economy that can work as micro
model for a national system. The rates of return for participating containers and non-
participating containers were easily measured (i.e. diverted from other systems). Also,
because of the limited basis, these pilots provided the opportunity to measure behavioural
change.
In Ireland, the location of the project should be either an isolated place such as an island or
mountain town, or a closed-system economy such a University or festival, with a workable
dimension (around 3000 inhabitants), and where the project could count on political
support.
Duration
The Spanish pilot lasted two and a half months, from 15th April to the 30th June. During the
pilot, the recovery rates increased each week with more and more of the residents
returning their single-use containers. During the last week, the pilot had not reached the
maximum return rate because the trend was still growing. In fact, the introduction of a
deposit system has a growth curve that does not stabilize until after at least one year. The
Scottish pilot programme lasted from February until September 2013.
Deposit amount
In the Cadaques pilot there was a 5 cent deposit of which the retailers received 3 cent
compensation per container returned. In the Scottish programs the deposits ranged from 3
to 10 pence, the type of refund varied from cash money to discount vouchers, charitable
donation or even a raffle ticket.
The graphic below shows that the bigger the deposit is the bigger the recovery rate.
International experience has determined that the deposit must be big enough to encourage
returns while small enough to discourage massive fraud (i.e. people bringing containers
from outside and getting the refund without having paid the deposit). According to a
research carried out by Eunomia for Retorna, a five cents deposit would be enough to
ensure a recovery rate of 70 to 90% of the containers.
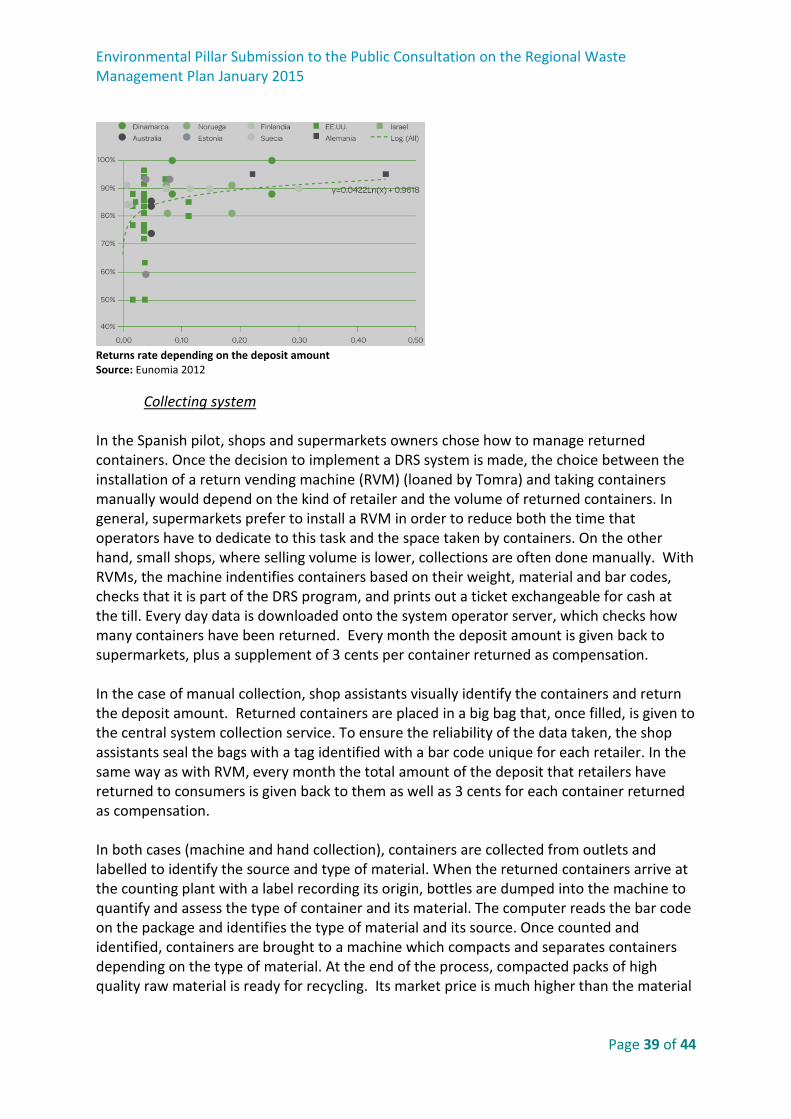
Environmental Pillar Submission to the Public Consultation on the Regional Waste
Management Plan January 2015
Page 39 of 44
Returns rate depending on the deposit amount
Source: Eunomia 2012
Collecting system
In the Spanish pilot, shops and supermarkets owners chose how to manage returned
containers. Once the decision to implement a DRS system is made, the choice between the
installation of a return vending machine (RVM) (loaned by Tomra) and taking containers
manually would depend on the kind of retailer and the volume of returned containers. In
general, supermarkets prefer to install a RVM in order to reduce both the time that
operators have to dedicate to this task and the space taken by containers. On the other
hand, small shops, where selling volume is lower, collections are often done manually. With
RVMs, the machine indentifies containers based on their weight, material and bar codes,
checks that it is part of the DRS program, and prints out a ticket exchangeable for cash at
the till. Every day data is downloaded onto the system operator server, which checks how
many containers have been returned. Every month the deposit amount is given back to
supermarkets, plus a supplement of 3 cents per container returned as compensation.
In the case of manual collection, shop assistants visually identify the containers and return
the deposit amount. Returned containers are placed in a big bag that, once filled, is given to
the central system collection service. To ensure the reliability of the data taken, the shop
assistants seal the bags with a tag identified with a bar code unique for each retailer. In the
same way as with RVM, every month the total amount of the deposit that retailers have
returned to consumers is given back to them as well as 3 cents for each container returned
as compensation.
In both cases (machine and hand collection), containers are collected from outlets and
labelled to identify the source and type of material. When the returned containers arrive at
the counting plant with a label recording its origin, bottles are dumped into the machine to
quantify and assess the type of container and its material. The computer reads the bar code
on the package and identifies the type of material and its source. Once counted and
identified, containers are brought to a machine which compacts and separates containers
depending on the type of material. At the end of the process, compacted packs of high
quality raw material is ready for recycling. Its market price is much higher than the material

Environmental Pillar Submission to the Public Consultation on the Regional Waste
Management Plan January 2015
Page 40 of 44
obtained from kerbside collection because its quality is far superior, due to the lack of
contamination.
For the pilot project in Ireland, it would be best to implement both systems: RVM in
supermarkets and manual collection in smaller retailers in order to evaluate the different
methodology. They could be implemented either in different pilots or together in the same
one as it was done in Cadaques.
Containers to be included in the pilot
Different DRS programmes accept different kinds of containers. The most popular
containers collected include single use plastic (PET) and aluminium containers smaller than
3L, such as in the Spanish, University of Dundee or North Ayrshire Council cases. Others like
IKEA, Glasgow University or the organic farm in Whitmuir also included glass bottles and
coffee cups.
Historically, Tetrapak has been excluded from these programmes due to the technical
incapability of RVM to recognise them. However, Tomra has recently developed a new
machine able to recognise Tetrapaks, so they are now suitable to be included in the project.
If Ireland includes them during the pilot, it would be the pioneer in collecting Tetrapaks
through a DRS.
Other materials such as coffee cups are suitable to be included in the programme as they
were in Glasgow Caledonian University. James Cropper, an English company, recently
developed the technology needed to recycle this material.
The advantage of a DRS over others is that the materials collected are already separated so
its value in the recycling market is much higher than materials recollected by a kerbside
system.
The chart below indicates the price differences between poor quality mixed materials versus
separately sorted high-quality materials.
Brown
glass
Clear
glass
Green
glass
Mixed
glass
Aluminium
can
Clear and
light blue PET
Plastic bottle
Coloured PET
Plastic bottle
HDPE natural
Plastic bottle
HDPE mixed
colour
Plastic bottle
Mixed
34.17 37.11 28.89 18.61 775.28 245 41.9 309.2 144.4 64.4 Wasted materials average price, from last 9 months (Jan 2013 to Sep 2013), in £ per tonne (Source:
http://www.letsrecycle.com/prices)
Stakeholders
To create the most inclusive and effective DRS pilot, stakeholders should include:
Promoters: Environmental organisations, VOICE and CoastWatch, would be the primary
promoters and organisers of this pilot programme. In Spain, Reterna and in Scotland, Zero
Waste Scotland were the responsible promoters.

Environmental Pillar Submission to the Public Consultation on the Regional Waste
Management Plan January 2015
Page 41 of 44
Technological partners: Tomra provided the expertise for the reverse vending machines and
Rhenuse were responsible for central counting machines in Spain and Scotland. We
envision their involvement in the Irish pilot as well.
Local retailers: it is essential that we get buy in from as many retailers as possible to create
an effective programme. Retailers must agree to take back the containers and store them
until collected by recyclers.
Political stakeholders: political support is a key point to the success of this programme. In
both cases, Spain and Scotland, the project succeeded through the support of local mayors
and regional environmental departments.
Supports and actors against
These successful pilots have thrived because of the support of local authorities, i.e. the
mayor of the town, local council, university president, etc. The sector companies have also
supported the programmes by loaning the needed equipment and expertise. In the case of
Cadaques, many volunteers were involved in the pilot pulling it through the various hiccups.
In some cases, these programmes have had to cope with the opposition of big beverages
bottlers and distributors such as Coca-cola. Also kerbside collectors and REPAK consider DRS
programmes as competing with their activities.
Results
As a DRS programme has never been in place in Ireland, we must look to the results yielded
in Spain to understand the potential results in Ireland. (Results of the Scottish pilot
programme will not be available until March 2014).
Returns rate
Although Cadaques is fairly isolated, the DRS pilot was not a closed system and retailers
received drinks containers originally purchased from other shops that were not part of the
project. In order to gather accurate data on return rates, containers sold within the pilot
programme were labelled before they were sold with the deposit. The programme
promoters evaluated the returns rate of containers using two indicators.
• Global containers return: during the pilot programme, 105,901 deposits were
charged on beverages containers by the collaborating retailers, and 81,183 of them
were returned. Therefore, returned containers were 76.6% of the total containers
sold. However, the collection rate dramatically increased in the last month of the
trial. During the last month, the percentage collected increased to 82.03%, and
reached 91.23% in the last week. These return rates illustrate that returns rate never
stopped increasing throughout the whole pilot time.

Environmental Pillar Submission to the Public Consultation on the Regional Waste
Management Plan January 2015
Page 42 of 44
• Labelled containers return: during the two last weeks, an increase in the return rate
reached 66.83% of labelled containers in the last week. This increase shows that the
return level had not yet reached its potential and that returns were anticipated to
increase had the pilot lasted for a longer period of time.
Environmental indicators
A positive effect of a DRS is the reduction in the volume of recyclables and value recoverable
material being disposed in landfills. The Cadaques pilot estimated a reduction of between
18 and 25% in volume in the green bin and between 4.7 and 6.6% in the black bin.
According to the survey carried out among the citizens, most of the people recorded a
reduction in littering in the municipality, especially in streets but also on beaches, the sea
and in natural parks.
Economic facts (Cost)
Deposit and Refund pilot programmes launched in Scotland by Zero Waste Scotland with
the help of the Scottish Government’s Environment Secretary spent £900,000 on the
development of 8 different programmes throughout the country, averaging cost of around
£112,500 each, or €130,000.
The implementation of the pilot DRS in Spain had a positive economic impact in the local
economy. An evaluation was carried out regarding three indicators: variation of the
collection service costs, variation of the collection system incomes and variation of the
treatment costs.
• The reduction of the collection system expenses showed a decrease of between
€24,242 and €35,372 annually, which is 6.5-9.5% of the annual collection cost.
• Under the current system, these collection system operators received money from
recyclables sorted out of the black bin. Taking drinks containers out of the waste
stream reduced their sale of raw materials to recycling companies (between €1,240
and €1,767 annually). However, even with loss of this revenue, the net savings
realised by such collectors still yielded around €23,000 to €33,606 annually.
• Treatment costs would reduce between €1,742 and €2,420 annually, given that
1.91% in weight (6.62% in volume) of the waste would stop going to landfill.
Because a large volume of drinks containers would be recovered through DRS, littering
would decrease and associated cleanup costs would reduce correspondingly. The DRS pilot
quintupled the drinks container collection; it grew from 21% to 66.58% in three months.
Additionally, further investigation found that only 1 out of 10 beverage containers found in
the regular rubbish bin were charged with the deposit. Compared to the black bin and the
green bin, materials collected through DRS had the highest quality standards for the

Environmental Pillar Submission to the Public Consultation on the Regional Waste
Management Plan January 2015
Page 43 of 44
recycling industry in Spain. This better quality means an increase in materials price of
between 20 and 40% -depending on the materials- compared with the current collection
system rates.
Social response
In order to measure the social impact of the pilot programme, two surveys were conducted
-- one before the beginning of the pilot and another after it. These surveys revealed that
61% of respondents found the town cleaner after the pilot and 85% of them agreed with the
implementation of a real DRS program. The surveys concluded that there was a healthy
social acceptance to the programme.
Interviews with retailers, after the pilot, revealed that previous concerns about the lack of
space in shops and more workload had been avoided. Fears regarding a decrease in sales
were not realised and public image of participating shops improved. It is significant that all
participating shops owners now support the idea of implanting a DRS throughout the whole
country.
Conclusions and proposed scheme
Taking into account the Spanish and Scottish experience, we suggest the development of
three different pilot programmes in Ireland, in order to be able to evaluate different
methods and characteristics:
• Location: Trinity College, as a closed community with a micro economy that can
work as a micro model for national system; Croke Park Stadium, which has adopted
the three pillars of sustainability and has pursued green initiatives since 2008, has
the advantage of providing a close economic system; and a small town such as
Wexford or Dingle, with a population of 20,000 and 1,900 respectively, would
provide a better understanding of how a DRS might fare if implemented nationally.
• Deposit amount: A deposit of ten to twenty cents would be enough to ensure a
recovery rate of 70 to 90% of the containers, being small enough to discourage
fraud.
• Duration: The duration of the project would depend on the amount of money
available. Nevertheless, the longer the pilot, the more reliable the data would be,
given that the curve of recycling stabilises after one year of the project. However, 3-
6 months should be enough to get an idea of the success of such a project in the
community.
• Collecting system: it would be important to implement both RVM and manual
collection systems in each pilot to evaluate all the different possibilities.
• Containers taken: In the first stage, containers included in the programme should be
single use plastic (PET) and aluminium containers smaller than 3L, which are the
Environmental Pillar Submission to the Public Consultation on the Regional Waste
Management Plan January 2015
Page 44 of 44
most common containers used for take away drinks. In the future other kind of
containers such as glass bottles, Tetrapaks and coffee cups can be included.
• Stakeholders: Promoters (VOICE); Technological partners (Tomra can provide the
RVM and Rhenuse the central counting machines); Retailers (Local shops and super
markets in the case of the town, and the café and drinks shops in the Croke Park and
Trinity case); Political stakeholders (The support of the relevant authorities is
needed for the success of the programme in each case, i.e. the CEO of Croke Park
Stadium, the university president of Trinity College, and the local mayor of Wexford
or Dingle).
Container deposit and refund schemes have proven to be extremely successful in recovering
valuable and high quality material in other countries. These systems reduce waste, raise
recovery rates, save money, create jobs, and enjoy high public support. While a deposit and
refund system will be expensive to implement, its benefits greatly outweigh these costs. It is
estimated that these systems have net benefits of over €100 million.
According to the results of VOICE’s research and the findings of reports from the EU and all
over the world, VOICE recommends that Ireland implement a nation-wide beverage
container deposit and refund system.