environmental monitoring of dioxin like compounds in the united states commission for environmental...
TRANSCRIPT

ENVIRONMENTAL MONITORING ENVIRONMENTAL MONITORING OF DIOXIN LIKE COMPOUNDS OF DIOXIN LIKE COMPOUNDS
IN THE UNITED STATESIN THE UNITED STATES
Commission for Environmental Cooperation of North America
Fourth Workshop on Sources and Measurements of Dioxins, Furans and Hexachlorobenzene
October 28-29, 2010
Dwain WintersWinters EnvironmentalBethesda, Maryland

CRITICAL AREASCRITICAL AREAS FOR ENVIRONMENTAL FOR ENVIRONMENTAL
MONITORINGMONITORING
DIOXIN IN LAKE SEDIMENT
DIOXIN IN AMBIANT AIR DIOXIN IN SOIL

LAKE SEDIMENT CORE LAKE SEDIMENT CORE INVENTORYINVENTORY
ID number Site Relative location No.Sam ples
range (years)
N E-4 Canandaigua Lake Finger lake, N Y 12 1728 - 1991
N E-5 Skaneateles Lake Finger lake, N Y 8 1914 - 1991
N E-11 Sacandaga Res. Johnstown, N Y 5 1929 - 1983
SE-2 Santeetlah Res. Robbinsville, NC 5 1935 - 1983
SE-4 Blue Ridge Res. Blue Ridge, G A 5 1934 - 1983
RM-7 Deer Creek Heber City, UT 4 1946 - 1982
RM-11 Echo Lake Coalsville, UT 4 1941 - 1982
RM-12 Panguitch Lake Panguitch, UT 10 1882 - 1985
W-14 Ozette Lake Olympic Penn, WA 11 1720 - 1985
W-15 Beaver Lake Olympic Penn, WA 9 1884 - 1985
A-4 Chandler Lake North Slope, AK 4 1117 - 1993

TEMPORAL TRENDS IN TEMPORAL TRENDS IN SEDIMENT DIOXIN SEDIMENT DIOXIN CONCENTRATIONCONCENTRATION
Sediment Levels, Beaver Lake, Olympic Peninsula, WANon-detects = zero
0
20
40
60
80
100
120
140
160
180
200
1974.419641955194619321921190918971884
Year
Residue Levels (pg/g, dw)
Total CDD/Fs

NATIONAL DIOXIN NATIONAL DIOXIN AIR MONITORING NETWORKAIR MONITORING NETWORK
((NDAMN)NDAMN)
A nationally based ambient air monitoring network
The target analytes are vapor and particulate phases of dioxin-like compounds
32 stations operated in rural and non-impacted sites
Network started in 1999 and ended in 2004

Establishing background levels Determining temporal and geographical variability
Investigating long-range transport and transboundary movement
Verify/calibrating EPA’s air modelsProviding data to determine exposures
\
WHY WAS NDAMN CREATED?WHY WAS NDAMN CREATED?

MeasuredMeasured AnalytesAnalytes
CDD Congener CDF Congener Coplanar PCB(IUPAC #)
2378-TCDD12378-PeCDD123478-HxCDD123678-HxCDD123789-HxCDD1234678-HpCDD12346789-OCDD
2378-TCDF12378-PeCDF23478-PeCDF123478-HxCDF123678-HxCDF123789-HxCDF234678-HxCDF1234678-HpCDF1234789-HpCDF12346789-OCDF
(77) 3,3',4,4'-TCB(126)3,3',4,4',5-PeCB(169)3,3',4,4',5,5'-HxCB(105)2,3,3',4,4'-PeCB(118)2,3',4,4',5-PeCB(156)2,3,3',4,4',5-HxCB(167)2,3,3',4,4'5-HxCB
.
Total TetraCDDTotal PentaCDDTotal HexaCDDTotal HeptaCDD
Total PCDD
Total TetraCDFTotal PentaCDFTotal HexaCDFTotal HeptaCDF
Total PCDF

Locations of NDAMN Stations
= Rural Site
= Remote Site

Dioxin Air SamplerDioxin Air Sampler
Quartz Fiber Filter for particle bound dioxin
PUF plug for vapor-phase dioxin

Sampling FrameSampling Frame
Sampling period:24 hrs/d; 7 d/wk 28 days
All stations operate simultaneously with 4 sampling periods/year
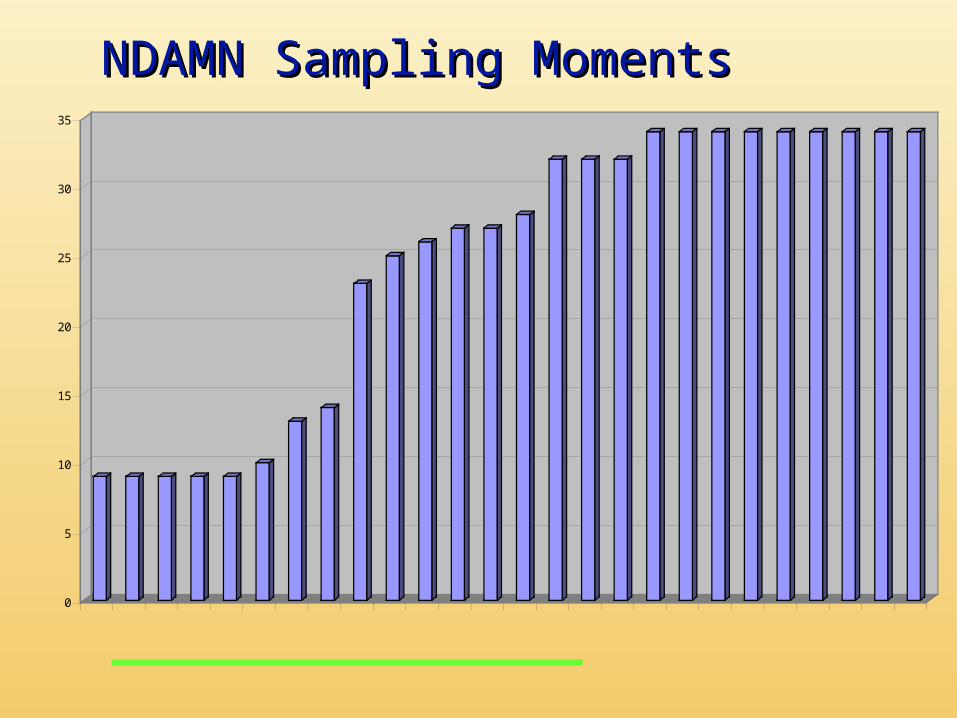
NDAMN Sampling MomentsNDAMN Sampling Moments
0
5
10
15
20
25
30
35
Number of NDAMN Stations Nationwide
1998 1999 2000 2001 2002 2003 2004

2000 NDAM Annual Average

General increase observed in CDD/F General increase observed in CDD/F TEQ in Late Fall/ Early Winter vs TEQ in Late Fall/ Early Winter vs SummerSummer
0
5
10
15
20
25
30
35
40
45
50
1998199819991999200020002001200119991999200020001998199819991999200020002001200119981998199919992000200020012001199819982000200020012001
S W S W S W S W S W S W S W S W S W S W S W S W S W S W S W S W S W
1 1 1 1 1 1 1 1 3 3 3 3 5 5 5 5 5 5 5 5 7 7 7 7 7 7 7 7 10 10 10 10 10 10
TEQ (WHO) femtogram/m3
Year
SeasonSite
(S) Summer(W) Winter

COMPARING 2001 RESULTS WITH COMPARING 2001 RESULTS WITH POPULATION DENSITYPOPULATION DENSITY
Figure 4-3. Illustration of 2001 Annual Average Total TEQ -- DRAFT
NDAMN 2001 Population Density 2000
General Observations for NDAMN General Observations for NDAMN from 1999 - 2001from 1999 - 2001
The dominant CDD/F congeners in ambient air were the OCDD>1,2,3,4,6,7,8-HpCDD> 1,2,3,4,6,7,8-HpCDF> OCDF.
This profile was constant over all NDAMN sites.
The 1,2,3,7,8-PCDD contributes over 40% of the dioxin TEQ.
General Observations for NDAMN General Observations for NDAMN from 1999 – 2001, continuedfrom 1999 – 2001, continued
PCB-118 dominates coplanar PCBs in ambient air followed by PCB-105, PCB-77 and PCB-156.
PCB-126 dominates the TEQ.

NDAMN conclusionsNDAMN conclusions
22 rural sites: Annual mean dioxin TEQ (WHO
method) air concentrations• Range: 2 fg m3 to 28 fg/ m3; • Overall mean: 12 fg m3.
Mean annual PCB TEQ air concentrations
• Range: 0.15 – 9 fg/ m3. • Overall mean: 1 fg/ m3.
These values are consistent with other studies of rural areas.

NDAMN CONCLUSIONS,NDAMN CONCLUSIONS, continuedcontinued
8 Remote SitesAnnual mean dioxin TEQ (WHO
method) air concentrations•Range: 0.5 to 3 fg/ m3
•Overall mean: 1.05 fg/ m3
Mean annual PCB TEQ air concentrations•Range: 0.05 – 1.0 fg/ m3
•Overall mean: 0.23 fg/ m3

NDAMN CONCLUSIONSNDAMN CONCLUSIONS, , continuedcontinued
Dioxin concentrations at remote sites were on average one order of magnitude lower than what was measured at rural sites.
Although not statistically significant, PCBs were approximately 5-times lower in remote sites as compared to rural sites.

NDAMN CONCLUSIONSNDAMN CONCLUSIONS, , continuedcontinued
CDDs and CDFs air concentrations have generally remained about the same from 1999 – 2001 when all NDAMN locations are considered.
CDD and CDF air concentrations have decreased from 1999 to 2001 at a few specific locations.

NATIONAL DIOXIN SOIL SURVEYNATIONAL DIOXIN SOIL SURVEY
QuickTime™ and a decompressor
are needed to see this picture.
NDAMN air sampling stations. Circles indicate stations included in soil survey and triangles are excluded stations.

Soil Soil Survey Survey ResultsResults

HRMS CDD/CDF TEQs for all 27 HRMS CDD/CDF TEQs for all 27 sites.sites.
QuickTime™ and a decompressor
are needed to see this picture.

HRMS PCB TEQs for all 27 sitesHRMS PCB TEQs for all 27 sites
QuickTime™ and a decompressor
are needed to see this picture.

AIR COMPARED TO SOILAIR COMPARED TO SOIL