environmental impacts variability of aggregates … · variability in the environmental impacts of...
TRANSCRIPT

Variability in the environmental impacts of aggregate
production
Agnes Jullien, Chantal Proust, Thomas Martaud, Erwann Rayssac, C. Ropert
To cite this version:
Agnes Jullien, Chantal Proust, Thomas Martaud, Erwann Rayssac, C. Ropert. Variability inthe environmental impacts of aggregate production. Resources, Conservation and Recycling,Elsevier, 2012, 62, pp.1-13. <10.1016/j.resconrec.2012.02.002>. <insu-00684494>
HAL Id: insu-00684494
https://hal-insu.archives-ouvertes.fr/insu-00684494
Submitted on 29 May 2013
HAL is a multi-disciplinary open accessarchive for the deposit and dissemination of sci-entific research documents, whether they are pub-lished or not. The documents may come fromteaching and research institutions in France orabroad, or from public or private research centers.
L’archive ouverte pluridisciplinaire HAL, estdestinee au depot et a la diffusion de documentsscientifiques de niveau recherche, publies ou non,emanant des etablissements d’enseignement et derecherche francais ou etrangers, des laboratoirespublics ou prives.

1
Variability in the environmental impacts of aggregate production
A. Jullien1, C. Proust
2, T. Martaud
1,2, E. Rayssac
3, C. Ropert
1
1 LUNAM Université, IFSTTAR, IM, EASE, route de Bouaye CS 4, 44344 Bouguenais Cedex, France
2Univ d’Orléans, ISTO, UMR 7327, 45071, Orléans, CNRS/INSU, ISTO, UMR 7327, 45071 Orléans,
France, Polytech’Orléans, 8 rue Léonard de Vinci, 45072 Orléans Cedex 2, France.
3
LUNAM Université, IFSTTAR, GER, GETOT, route de Bouaye CS 4, 44344 Bouguenais Cedex,
France
Corresponding author: [email protected]
ABSTRACT: While LCA (Life Cycle Assessment) is considered to yield either generic or
regionally/technologically specific data on products, this method's implementation can reveal a
certain variability due to the nature of the local industrial process as well as to heterogeneous site
characteristics in the case of natural aggregate production. Energy consumption and the release of
atmospheric emissions from aggregate production processes have been investigated in this study at
three quarry sites, which encompass two types of rock (and include explosives). This paper describes
the methodology adopted for the specific local production investigation and offers results for the three
quarry sites using seven indicators derived from the LCA framework. Site characteristics and
differences have been assessed in terms of plant equipment and off-road vehicles, and a detailed
description is provided of the grading conducted onsite. It is found that fine grading consumes more
energy for production, given the fact this type of grading is recycled inside the plant.
This assessment has been performed for one ton of aggregate produced during one year and with
distinction in grading category. Results indicate that the discrepancy in local energy consumption due
to site differences lies within an interval between -9.5% and +13.7%, while the interval for impacts is
situated at -24.5% to +27.5% whereas for global warming potential the range is from -15.4% to
+12.9% as a maximum. Explosives are assumed to contribute less than 1% to the total impacts. Both
the electrical energy and fossil fuel consumption ratios are displayed. The upstream processes specific
to electricity production significantly contribute to human toxicity potential and ecotoxic potential
indicators, as for other indicators and also diesel production (all indicators) the contribution is in
proportion close to site results ones. However, this study indicates that an environmental load
decrease may be investigated with respect to quarry processes as well as equipment age and use.

2
Keywords: environmental assessment, impacts, quarry, LCA, hard rocks, soft rocks, aggregates,
environmental impacts
1. Introduction
1.1 General background
The level of construction activity is inextricably linked with a given country's concept of a
development process. Such a concept is based on a number of human activities, and these depend in
part on the kinds of infrastructure already built. The construction methods that best meet society's
current expectations incorporate the use of aggregates; these materials all stem from a nearly universal
resource and give rise to relatively simple production processes. Moreover, they are easy to transport
and allow for rapid implementation. Today's granular mixtures, i.e. concretes, mortars, stabilized and
unbound gravels, and bituminous mixes, offer the most rational and economical solution when it
comes to building infrastructure.
France consumes a quantity of aggregate that has been estimated at approximately 400 million tons
annually (UNPG, 2006). At a time when environmental conservation is imposed upon society, the use
of natural aggregates from quarries requires ensuring a durable supply. Preserving the environment
can therefore be associated with: i) reducing both the use of natural raw materials and energy
consumption; ii) extracting and processing raw materials under a minimum waste production scenario;
and iii) minimizing pollutant release into the air, water and soil during processing. The energy
consumption decrease associated with aggregate production or use, can thus significantly improve
environmental practices as regards the amount of aggregates being consumed, which in turn makes it
highly valuable to study production process inside a quarry in great detail.
1.2 Environmental assessment framework
Life Cycle Assessment (SETAC, 1993) serves as the basic method for conducting an environmental
assessment of manufactured products; its scope is known to be limited to environmental issues, even
though Miettinen et al. (1997) recalled that LCA should be perceived, from a broader perspective, as a
method that yields information on a product's environmental impacts as input into the decision-making
process. Today's international context favors LCA when conducting an environmental assessment of
products used in the field of civil engineering, yet the protocol according to which an LCA is
performed depends on the specific field of application (roads or buildings). In Quebec (Canada), both
LCA (Life Cycle Assessment) and LCCA (Life Cycle Cost Analysis) methods have been recognized
by the Ministry of Transport as basic tools (Cormier and Thébeau, 2003) for selecting pavement type.
In Europe, the Integrated Product Policy (IPP) reveals a preference for the use of LCA in carrying out
environmental assessments on all kinds of products. As for the French situation, a national standard
(AFNOR, 2004) has been adopted for the purpose of introducing LCI (Life Cycle Inventory)
techniques applicable to building industry materials.
A significant body of literature relative to road pavements and materials has, until now, been devoted
to either Life Cycle Assessments for environmental load determinations or Life Cycle Cost
Assessments for the economic optimization of road service life (Horvath et al., 1998; Tighe, 2001;
Zimmerman et al., 2000). As a consequence, all French studies (Chappat et al., 2003; Peuportier et al.,
2003; Ventura et al., 2008) focusing on aggregates in road-based environmental assessments have
relied upon quarry data obtained from Stripple's European LCA (2001). When considering aggregate

3
production LCA in the literature, only a few references could therefore be found, and some of these
merely discuss partial LCI data (e.g. Flower et al., 2007), while others focus on fine grading and
aggregate size differentiation (e.g. Schuurmans et al., 2005). Stripple (2001), on the other hand,
provided a Northern European aggregate LCI as a mean generic set of inventory data. Examining
Stripple's results (2001) in detail reveals that though many quarry sites have been studied throughout
Sweden, no distinctions were drawn either between massive rock (crushed) and soft (round
aggregates) quarry sites or between the kinds of grading produced across the various sites. The mean
available LCI in the literature thus includes various types of aggregates and provides a generic
assessment for a country's entire set of quarries, without discussing site-specific data variability.
Besides, international databases like ELCD or Ecoinvent provide also generic data for aggregates
production with refinements on upstream processes related to energy production (diesel and
electricity). In such databases, the energy profile can be chosen, namely electricity LCI for France or
Europe for instance.
An investigation into the differences existing among several quarry sites has therefore been chosen as
the key emphasis of the present paper.
2. Presentation of this study
2.1 Study scope
Aggregates are produced with respect to their potential use, so as to match the required grading and
thereby ensure marketability. Moreover, the requirements associated with aggregate mechanical
properties will generally undergo investigation as well by applying standards (EN 12620, EN 13040,
EN 13242, EN 13450, EN 13383-1, EN 13383-2 and EN 13139). Rock hardness is one of the
geological properties that lead to a raw material classification, provided aggregate use properties are
determined through laboratory testing.
As regards the environment and depending on the types of operations performed, a quarry site is
capable of generating various impacts as a result of raw material transformation. Such impacts are
directly correlated with electricity consumption, emission releases into the air and water, and waste
production, all of which are assumed to represent global environmental loads. In contrast, a quarry can
also be responsible for degradation to the landscape, as studied by Schuurmans et al. (2005), and
generate biodiversity modifications (whether negative or positive) both during operations and
following shutdown. Moreover, other potential impacts on local population through noise pollution,
vibrations, dust or even visual blight must not be overlooked. In this context, the present article is
intended to describe a methodology capable of quantifying environmental loads at the scale of a quarry
site. Such a methodology takes into account, over a reasonable time scale, a mix of quarry production
scenarios directly tied to grading ratios, yet only the global environmental loads associated with
extraction will be analyzed herein.
The number of production scenarios can typically be considered to vary from one to four at any given
quarry site during a full year of production, depending on market conditions and specific onsite
equipment (Nouvion et al., 2009). Transitioning from one scenario to the next is a topic not covered in
the present study, as the objective here is to investigate one year of production for each site. This study
is therefore focused on the method introduced to perform a detailed environmental assessment of
aggregate production; the procedure considered a wide range of production conditions and various
types of rocks and potential uses. For this purpose, a massive rock site was chosen (denoted Site 1) as

4
being typical for aggregates dedicated to road construction. Two additional soft aggregate sites (2 and
3) were then studied so as to expand the analysis. Various production conditions and products
(grading) were evaluated as well. The range of quarry production extends from 70,000 tons a year for
the soft aggregates at Site 3 to a mean of 150,000 - 180,000 tons a year for the hard aggregates at Site
1 and the soft aggregates at Site 2.
According to the LCA framework, the main component of this work program focused on in situ quarry
processes at all sites, which in fact are secondary processes, while the primary processes (energy
production, explosives production) were assessed by entering data only from the literature into the
discussion. This study has included the following steps involved in a local analysis: i) assessment of
various grading output at the plant; ii) development of a method to calculate energy indicators from
quarry data relative to the specific grading; and iii) use of the literature to obtain empirical data on
airborne emissions for non-road diesel equipment, which requires a model to determine the local
release amounts. All models used to assess secondary processes are described in this paper.
2.2 Site characteristics
The grading output produced at a given quarry site depends on both the owner's strategy and raw
material quality. Table 1 presents the grading produced and then studied for the three selected sites in
2004. According to this table, the grading range ratios vary significantly from one site to the next. It
can be noted that the main grading production sold (Table 1) is as follows: 10/14 (approx. 24%) for
Site 1, and 0/4 for Site 2 (64%) and Site 3 (73%). The origin and use properties of the targeted
aggregates are discussed below.
Site 1 is composed of a set of formations that have undergone extensive metamorphosis in the North
Armoricain (French rock) field, which is extremely complex and contains units with ages ranging
from 540 million to 2 billion years. This quarry mines relatively homogeneous rocks: amphibolites
from Roselier (Egal et al., 1996). The geotechnical characteristics of the quarried rock allow for
various potential aggregate uses: a roadway wearing course, or a civil engineering structure. The
results of laboratory tests designed to identify mechanical properties indicate values of the Los
Angeles abrasion test , the results being given in accordance with the AFNOR NF EN 1097-2 (2010)
and lying between 14 and 16, while those of the Micro DEval (MDE) test range from 14 to 22, with a
PSV (Polished Stone Value) equal to 0.54. For Sites 2 and 3, aggregates are produced from alluvial
deposits (Fz and Fy), which are composed of beige and clear brown sands and gravels. This
composition results for Sites 2 and 3 respectively in LA values of 20 and 24 and MDE results of 4 and
11.
Table 2 lists the non-road vehicles counted on each quarry site. The non-road equipment used at Sites
1 and 3 (as shown in Table 2) is older, i.e. dating on average from 1988 to 1988, than the equipment at
Site 2 (introduced on average in 2003).
3. Models
3.1 System description
A quarry may be considered as a system physically bounded by its limits, in accordance with the Life
Cycle Assessment standard (AFNOR, 2006). Various matter and energy exchanges, both entering and
exiting this system, pertain to aggregate production; these flows are typically indexed according to:

5
raw material and energy consumption, atmospheric and aqueous emissions, and waste. The
environmental system chosen to perform the aggregate grading LCI was based on the path followed by
raw materials inside the quarry as part of the aggregate production process (see Fig. 1). In this figure,
the various areas typically found inside a quarry are depicted by a rectangle. For production purposes,
aggregates are transported between these areas by dumpers or continuously channeled via a conveyor
belt or else moved all at once by quarry vehicles. These flows entering the system generate
environmental loads, i.e. at the extraction site, non-road vehicles: consume energy (diesel fuel),
generate airborne emissions (combustion gas, dust and noise), and produce waste such as oils.
3.2 Input/output flows
At any given quarry site, three types of input flows need to be considered in order to perform an
aggregate LCI: soil consumption (mass), energy consumption (MJ), and water consumption (m3). Soil
consumption is indirectly taken into account through the total mass of aggregates produced over the
year, since the residual mass of all extracted soil is deposited locally once quarry operations have
ceased. The water used onsite is in fact not consumed given that it is pumped and released directly into
the soil, meaning that it must be considered as recycled onsite. Hence, only the energy consumed to
pump water for aggregate production has actually been taken into account. Moreover, as regards LCI,
all input flows relate to energy consumption, which is viewed as the key parameter in the LCI process.
The system therefore does not take water consumption directly into account because the water cannot
be considered as consumed (as was explained above). Among the emissions that typify aggregate
production, two sources of particulate matter can be identified in connection with raw material
extraction. One source pertains to the dumpers carrying material on the tracks, while the other is
specific to crushing and screening inside the plant. The first source was not investigated since it was
considered that water is spread on the tracks in order to prevent dust emissions, which are still
believed to be negligible according to a state of the art dealing with natural resources
(http://ofrir.ifsttar.fr, see the text entitled “reference”). On the other hand, the second source of dust
remains confined inside the plant and, consequently, is not released into the air. Regarding unit
emissions for these engines, a set of generic data correlated with engine power and year of production
are given in Table 3. The Roman Numerals given in table 3 correspond to periods of time according to
the Directive 97/68/CE (1997). Lastly, the study has not considered waste and worn parts, since the
focus is on site optimization relative to input flows.
3.3 Hypotheses adopted for each site LCA
The study focuses on local variations in local quarry processes and more specifically on input flows. A
specific indicator was first developed for investigating energy consumption, which takes the
contributions from quarry vehicles and plant equipment into account separately. The vehicles release
atmospheric emissions onsite, and these were taken into account, whereas the equipment only
consumes electricity at the quarry site.
The selected functional unit is 1 ton of aggregate produced during a year considered to be of average
grading output. The results expressed in tons always refer to metric tons throughout the paper.
All production scenario variations are thus implicitly set on a 1-year scale. A dataset was then
collected within a given one-year period for each production site.
Since this LCA study was performed by taking secondary site processes into account, no indirect
airborne emissions were considered either for the energy and material production capacities, in

6
particular with respect to electricity and fuel extraction, or for refineries and explosives production. To
more effectively discuss the aforementioned site variations, detailed calculations were evaluated
before considering any of the upstream processes tied to:
- indirect impacts of electricity production and explosives production;
- indirect impacts of fuel production.
In respecting the aforementioned restrictions, several models were devised to quantify the LCI and
impacts due to quarry operations. For the various grading runs, the purpose of this modeling exercise
was to consider the production lines inside the plant as well as associated equipment. This task was
accomplished by:
- performing measurements at Site 1 in order to determine aggregate paths;
- developing a method based on several energy assessment models for application on the aggregate
paths derived from the Site 1 analysis;
- applying this same method to Sites 2 and 3.
The chosen impact categories (and indicators for quarry site assessment) derived from classical LCA
comprise:
- Energy consumption: the specific energy consumption of each equipment (named CESP, as it is the
French acronym for Specific Production-related Energy Consumption),
- Global Warming Potential (GWP), from IPCC (2001),
- Acidification Potential (AP), from Goedkoop(2001),
- Photochemical Ozone creation potential (POCP), from Goedkoop (2001),
- Eutrophication Index (EI), from Goedkoop (2001),
- Human toxicity potential and Ecotoxic Potentials (TP and EP), from Huijbregts et al. (2000).
Since all the raw materials extracted from the earth within the extraction zone (Fig. 1) are either sold
or placed in stockpiles with no possible industrial use, all consumption and impact determinations are
thus allocated to the category of sold aggregates. Finally, the energy content for explosives blasting is
not included as it is not a consumed energy.
3.4 Data implementation
The methodology's detailed steps are described as follows.
The main difference between these study sites is the use of explosives for Site 1; in general, the site
equipment characteristics both at the plant and specific to quarry vehicles (which include dumpers,
loaders and wheelers, as shown in Table 2) are implemented in the model. The vehicles are described
by their type, year the engine was manufactured, horsepower and running-in operation time every day,
hence allowing the use of Table 3 as a database. As regards the plant, a number of modeling
considerations could be based on theoretical aspects or on crusher characteristics, as exposed by Csoke
et al. (1996), who extensively detailed the grading process and determined the set of optimal
technological parameters that meet market demand. Only an empirical ratio however has been
determined for aggregate path identification inside the plant, which has necessitated verifying the type
of equipment used for crushing, screening and maintaining electrical intensity. Used explosives are

7
considered as well. Hence, this method allows assessing energy use and impacts at any quarry site
over a one-year period, in taking into account all monthly variations in the mass produced. Besides
data for the full year, monthly production figures are recorded for each quarry site investigated.
Details on site processes are introduced into the model using quantified values provided by the site
owner, for the purpose of performing aggregate production assessments. These details include defining
a production line around the installed equipment, along which aggregates flow during their production
process paths inside the plant, while respecting the production line layout and corresponding mass
ratio of grading produced inside each plant. 100% of each grading output is controlled relative to the
total produced mass of grading on a given line. An example of such a path is provided in Figure 2 for
Site 1. According to the quarry owner, the grading output from sold aggregates has been identified so
as to implement data that usually remain confidential otherwise.
All these assessments are based on energy calculations. For quarry operations, the energy consumption
is determined as follows:
i) Fuel consumption is governed by use of the various quarry vehicles; their consumption is either
directly available from the owner or determined during the measurement campaign by means of a
daily recording of the number of liters consumed and the amount of vehicle operating time. By
inputting this consumption back into the daily productions, it then becomes possible to determine the
quantities of fuel necessary to produce a ton of aggregate.
ii) With electrical energy consumption, two sets of data appear to be essential: actual consumption of
the various electrical motors and material flows crossing the processing plant. The first can be
obtained by direct measurement of the intensity crossing each engine. On the other hand, material
flows can be estimated by: crossing speeds on the conveyor belts (m.s-1
) (as calculated using a
tachometer), material weight over one meter of conveyor belt (in the output direction, according to
AFNOR, 1996), and a sieve analysis (AFNOR, 1997) conducted on each sample. The method chosen
to calculate energy consumption per ton of aggregate produced consists of: summing the daily
consumption at the various stations considered, entering the engine operating time, and then
transferring the quantities that passed through this station.
4. Environmental assessment
4.1 Energy consumption
As explained above, the machines used for extraction at all sites are wheel loaders, dumpers, shovels
and drills (see Table 2); their average annual fuel consumption (in liters/year) is converted into
liters/ton by dividing the amount of fuel by the quantity of mass extracted, for the given year of
production.
Depending on the type and configuration of the quarry being considered, electricity demands may be
associated with all 3 stations (as shown in Fig. 1): the plant (i.e. the treatment plant for crushing and
screening, as well as the recombination plant for grading mixes) and internal transport (involving the
use of conveyor belts and vehicles) between the extraction area and the treatment plant or washing
plant.

8
In order to write the equations governing electricity consumption for each piece of equipment, two
types of data are essential: the actual electricity consumed by each machine, and the quantities of
material being processed through these machines. The latter is managed in the model via the
production line concept, which relates to a certain number of machines constituting a path and yielding
a material with a known particle grading (Martaud, 2008). Each machine can then be associated with
one or more production lines. Once the production lines have been defined, the amount of material
processed through each machine is determined. The masses per production line are obtained by
starting from the owner's production parameters.
The specific energy consumption of each machine can therefore be given by evaluating the
consumption of the considered machine per quantity passing through on an hourly basis. The average
power used by these machines is determined from both the operating periods and active energy at the
plant (P = UI √3 cos ), where U denotes the voltage (380 V) and the intensity I is measured in (A) for
many machines taken together. The rated power ranges between 80% up to 90% of the maximum
power available as indicated by quarry equipment engineers; the value used herein has been set at
0.81. From the power supply U, CESP can then be derived by a division operation using the mass
produced (as shown in Equation 1):
CESP = U × (√3 × I × 0.81 × x × y ) / M (MJ/t) (1)
Where, U, voltage in V (U = 380 V); with cos φ= 0.81; I, measured intensity (A); x, number of days
of production; y, number of hours worked per day; and M, aggregate production output in metric tons.
The model is able to determine the specific consumption per production line (CESPline) by applying
the following formula for n equipments:
n
j
jline CESPCESPi
1
(2)
Where: CESPj, specific consumption of equipment j, which has been defined in production line i.
The method then assigns to each product a value of specific electricity consumption (CESPd/D) by the
following for n lines:
)( /
1
/ ilineDd
n
i
lineDd PCESPCESPi
(3)
where: CESPline I, specific consumption of production line i; Pd/D linei, proportion of the d/D fraction
produced by line i.
The quantity of electricity necessary for the overall production of the considered quarry is then
obtained from for n fractions:
n
Dd
DdDd QCESPE/
// (4)
Where: E, specific energy consumption of the product; Qd/D, production of the d/D fraction.
4.2 Atmospheric emissions
The pollutants released into the air at a quarry site stem from emissions produced during explosions
(should explosives be used) as well as from operating quarry vehicles, as described below:

9
i) The emissions generated when using explosives are variable in both quantity and nature and
moreover depend on the type of explosive introduced. A quantity (Fi) of detonation gas released per
ton of blasted rock may be given by applying the following formula:
Fi = (qi × Mi × Si) / (V × Mνr) (g/t) (5)
where: Fi, emissions factor for gas I, qi the gas emission (mol.kgexplosive-1
); Mi, molar mass of gas i
(g.mol-1
); Si, quantity of explosives used (kgexplosive); V, theoretical volume of blasted rock (m3); and
Mvr, rock density (t.m-3
).
The types of explosives used as well as the shot-firing patterns can be collected from the actual
operating site. The data on gas volumes, as an ideal theoretical composition, are obtained from
explosives manufacturers.
ii) Engine emissions can be estimated based on quarry vehicle consumption, in knowing that these
parameters are correlated with the type of fuel consumed, type and power of machines, engine age,
etc. Emissions (HC, CO, VOC, NOx and PM) from quarry operating machines are based on various
factors. The factors included in calculations would thus be the emission limiting values suggested in
European regulations for engines manufactured before 1999, or the emission limiting values indicated
by the U.S. Environmental Protection Agency (EPA, 2004).
The emissions for each pollutant considered (Eji) are given by the following expression:
Eji = (Fji × Pi) / Q (g/t) (6)
Where: Fji: gas emission factor; j, a function of the engine manufacturing year for machine i and its
power (g.kWh-1
); Pi, power of machine i (kW); and Q, aggregate production output (t.hr-1
).
The emissions of both SO2 (g.t-1
) and CO2 (g.t-1
) may be directly evaluated from the level of fuel
consumption. Beardsley and Lindhjem (1998) proposed the following calculation method:
SO2i = [(Cfi × a × b × c - b × c HC) ] × Pi / Q (g/t) (7)
Where: Cfi is the fuel consumption (in g.kWh-1
); a an adjustment factor corresponding to the
proportion of sulfur emitted in particulate form = 1-0.022; HC the emission factor (g.kWh-1
); b the
default value of sulfur in diesel = 0.0033; c the number of grams of SO2 formed from one gram of
sulfur = 2; Pi ,the machine power (kW); and Q, the aggregate production rate (t.hr-1
).
With a known vehicle consumption and in order to calculate CO2 emissions, Beardsley and Lindhjem
(1998) forwarded the hypothesis that all carbon contained in consumed fuel will be emitted as CO2.
However, since combustion is never 100% efficient, the values obtained must be drawn from results of
CO, VOC and HC. The quantities of CO2 emitted by each machine can thus be estimated using the
following formula:
CO2i =[(0.87 × (44 / 12) × Cfi × 0.85 ×10³) / Q ] - COi - VOCi - CH4i (g/t) (8)
with: 0.87, the mass content of carbon in fuel oil; Cfi, the fuel consumption (l.hr-1
); 44, the molecular
mass of CO2; 12, the atomic mass of C; 0.85, the FOD density, in kg.l-1
; Q, aggregate production rate
(t.hr-1
); COi, VOCi (non methanic) and CH4i, estimated machine i discharges taken from Equation 3.

10
The quantities of gas i emitted by machines at the given quarry and then simplified into ton per
aggregate produced may be estimated by summing the quantities discharged by each of the machines
listed in Table 3. The unit emission rates, which depend on engine age, are also given in Table 3.
4.3 Impact assessment
The calculation of impact indicators, according to a model dedicated to site impacts assessment as
explained in a previous work by Sayagh et al. (2010), is described as:
Ind j = Σi αi
j × Ci
j × mi (9)
with: Ind j, indicator associated with impact category j; mi, mass of inventory flow i (kg); Ci
j,
contribution coefficient of inventory flow i to impact category j; and αij: classification coefficient.
Each indicator is expressed in specific units per kg or t.
The list of indicators given in section 3.3 from the literature and implemented for the impact
calculations in this study use both Eq (9) formula and the associated contributions coefficients
recommended by Sayagh et al. (2010). The local flows that are determined for quarry sites study are
detailed in section 4.2. As for the classification coefficients, usually equal to 1 in impacts literature
models (i.e. CML 2001), they are considered to be site dependent in our approach as presented in
Sayagh et al. (2010) and to range between 0.33 and 1. When compared to CML 2001 results there
must be some difference.
5 Results
5.1 Energy consumption results
Table 4 presents the CESP results for all study sites. CESP values range between 6.30 and 12.38 MJ
per ton of aggregate for electricity consumption (a threefold range) and between 15.08 and 20.70 MJ
per ton of aggregate for fuel (twofold). Regardless of the site, the CESP indicator for fuel consumption
is always greater than the CESP for electricity consumption. Total CESP for 2004 varies from 25.59
MJ per ton of aggregate to 32.18 MJ per ton of aggregate, displaying a 23% indicator variation interval
for all three sites.
5.2 Airborne emissions results
Some emissions results relate to the use of explosives (data from Site 1 only). For Site 1, which
produces 180,000 tons a year, the explosives consumption is as follows, 4.32 tons of dynamite, 3.22
tons of emulsion, and 13.54 tons of fuel nitrate. Table 5 gives the corresponding emissions due to
explosives use on Site 1. The data on emissions related to dynamite could not however be verified
from the literature; therefore, only the fuel nitrate and emulsion emissions were taken into account.
In the plant, only electricity is consumed and therefore no emissions to air are locally considered.
Hence, dust emissions from crushing or cribling could be considered from plant machinery, but dust is
neglected as it is produced within the plant building which provides air confinement.

11
When not obtained from measured consumptions, equipment engine emissions (regarding data from
all sites) can be estimated from the empirical information found in Table 3. In other words, when
engine emission measurements are not available, they may be estimated using emission factors. Such
factors, selected from the literature, have been proposed by EU regulations (in the 1997 and 2004
Directives) (EMEP/CORINAIR, 2003). For engines built before 1999, the factors proposed by the
U.S. Environmental Protection Agency (Beardsley and Lindhjem, 1998) have been adopted. The data
for major pollutants, heavy metals and organic pollutants were only identified for Stages I and II (see
table 3). Given that they exhibit a constant value during both stages, these factors were considered
identical regardless of the year the engine was built.
LCI data for the three sites are shown in Figure 3 for all quarry vehicles (engines). According to
calculation hypotheses, the variations from one site to the next depend mainly on: the number of
vehicles (Table 2), i.e. 5 vehicles for Site 1 and 6 for Sites 2 and 3; and the type of vehicles (indirectly
defined from their engine power rating).
5.3 Site impacts for the three quarries and the effect of upstream processes
The data given in the international literature about aggregates LCA (i.e. Ecoinvent, ELCD) are often
strongly aggregated, and include: site production, upstream processes and extended systems so that it
is difficult to only investigate the quarry local processes which was the main aim of this study. The
site indicators obtained in the present study are detailed below taking into account both local and
upstream processes for site impacts assessment.
Impacts from local processes
The total energy consumptions and impacts values from Eq (9) for one ton of aggregate produced are
summarized in Table 6 for the sites data. The type of energy consumed (diesel fuel and electricity) on
each site is also given in table 6 . Then, the impacts of all the sites are compared on figure 4, that is,
GWP, EI, AP, POCP, TP and EP while table 6 gives mean values and variations considering the three
sites. For all sites (Table 6), the variations of each indicator are expressed in terms of mean values and
minimum and maximum values. The variations maximum range including all indicators ranges
between -35.7% and +27.5%. Table 6 displays differences in result ranges for energy consumption and
impacts of sites separately.
Impacts from upstream processes linked to energy production
The upstream processes to be considered here are linked to energy production (diesel fuel and
electricity) as well as to explosives production. To perform the assessment of the upstream processes
part, Figure 5 indicates for each site the ratio of primary energy consumption to consider (fuel ratio
and electricity ratio). As shown, this ratio significantly varies from one site to another (i.e. 23% up to
41% for the electricity part) whereas the mean ratio is of 35% for electricity (that is 9.8 MJ/t) and 65%
for diesel fuel (that is 18.5 MJ/t) as indicated in table 6 (column “mean site values”) for a mean total
amount of 28.3 MJ/t consumed on the site. The part of indirect impacts due to these upstream
processes as regards the local impacts of the quarry site production is then investigated, using
literature additional data. Fig 6 to 8 present upstream impacts ratios together with site impacts ratios.
Upstream impacts are precisely obtained according to the available literature data derived from ELCD
and Ecoinvent data bases and from the FD P 01-15 technical notice (AFNOR, 2006) considering either
French or European electricity production. Figures 6 and 7 examine the primary diesel and electricity
impacts related to the mean energy ratios (table 6 column “mean site values”) for all indicators
(CESP, GWP, EI, AP, POCP, TP and EP) using French electricity production data, whereas Figure 8

12
considers European energy production. More, the relative importance of each indicator when
compared to site impacts ranges between several% and 80% for European electricity while this values
are lower for French electricity.
Impacts from upstream processes linked to system boundaries
As for the upstream energy linked to explosives production, it was neglected in the upstream processes
analysis as no data were found during the study. However, the mass of explosives consumed during
2004 on site 1 represents a ratio of 10-4
of total aggregate production, which suggests that the
contribution of this upstream process, even if highly impacting can be considered as negligible. More
some other impacts linked to the production of raw materials inputted on the quarry site were
neglected, that is, wear pieces of equipment namely and of course installation construction and general
maintenance.
Sensivity to quarry grading
This kind of results linked to grading influence has been recognized in the literature to be of interest
(Schuurmans et al., 2005). According to the sites studied here, the influence of grading on indicators is
only linked to the electricity consumption inside the plant, while the local impacts due to diesel fuel
consumption are the same whatever the grading is.
The CESP for each grading produced inside the plants was evaluated at each site, after identification
of the production lines along with the mass ratio of each grading produced inside the plant. The
detailed results are shown in Table 1. As the grading becomes finer, production time increases and the
path inside the plant lengthens, thus requiring recycling loops and greater energy consumption as
shown in Table 1. The range of electrical CESP variations from the mean values of table 6 lies
between -71.4 % for primary aggregates (0/31.5) and tertiary aggregates (+29.8%) indicating that for
refined studies grading specific data should be chosen.
As for the impacts of grading related to upstream processes, they are given in table 1 as well,
according to Ecoinvent data base and grading energy consumption on each site. The results
significantly vary for the range of grading that are elaborated in the quarries. Therefore, a set of data is
now available for both energy consumption and impacts of various aggregates grading for future
assessment.
6 Discussion
The goal of this section is to evaluate the utility of local quarry assessment with respect to future LCA
efforts for environmental load decrease, namely the idea of considering a set of site data, country data
(using Ecoinvent as a basis of analysis) and data corresponding to specific grading is analyzed below.
6.1 Comparison with generic data from literature
The results are discussed below within the international Framework, that is, Stripple‟s data (2001) that
are generic data for a quarry in Sweden (Europe), and Ecoinvent and ELCD databases that give either
European or international data for aggregates LCA.
The mean values of on-site emitted pollutants obtained in this study (Fig. 3) are first compared to
Stripple‟s LCI data (2001) that include both extraction and on site-transport. It then comes for

13
Stripple‟s results versus mean site 1 to 3 results: 1,420 g/t of CO2 vs 1000 g/t ; 12.3 g/t of NOx vs
50 g/t; 0.48 g/t of dust vs around 3g/t of PM2.5; 1.49 g/t of CO, and 0.873 g/t of HC (no equivalent
here). Energy consumption equals 16.99 MJ/t for diesel fuel vs 18.5 MJ/t. Hence all these values
indicate the same order of magnitude for results, yet with some significant differences.
The mean values of the total impacts obtained from Ecoinvent are given for one ton of aggregates
produced in table 6 for comparison and validation with the site results obtained herein, whereas table 1
allows to compare the indirect impacts of the various grading (only on upstream processes). These
values were finally extracted from an Ecoinvent base as follows : base N°589 for French electricity,
N° 1540 for fuel , N°465 for non specified aggregates (mix of both crushed and round aggregates).
The differences highlighted are significant for some impacts and the trends observed can be due to :
difference of equipment energy supply, and engines emissions calculations. No further detailed
comments can be given about Ecoinvent or ELCD database variability as the data origin is neither
discussed in details by the Authors of databases nor in Stripple‟s study.
One explanation of the significant differences between this study and the Ecoinvent data on aggregates
production (table 6) could be that the quarry sites considered in the Ecoinvent study are strongly
different in terms of i) quarry buildings and equipments ii) site distances between the plant and the
extraction area. Another explanation would be that a set of only 3 quarries to study site variations is
not an enough big sample to obtain real variations between quarry sites, leading to underestimate site
variations given in table 6. Finally, in France quarry sites use electricity plants, may be the plants
considered by Ecoinvent provide different technologies using diesel rather than electricity that are
more energy consuming. However the main idea is that the huge difference between our results
including upstream production impacts is due to the fact that in Ecoinvent results all upstream
processes are included and these are very influent on mainly ecotoxicity and human toxic potential.
Therefore Ecoinvent gives maximum impacts, except for POCP because of the VOC flux for engines
from table 3 which is much higher then Ecoinvent one.
It is indeed believed from these considerations, that aggregates production improvement from
environmental criteria is strongly dependent on site equipment, site organization and site geography
(distances between extraction and plant).Although the results of direct impacts calculations are not
obtained with the same allocation models as upstream processes (see section 4.3), the trends obtained
adding upstream processes impacts to local quarry impacts do not change the fact that site
optimization should be investigated working on processes and equipment performances. Finally one of
the purposes of this paper was to distinguish crushed and round aggregates as it is done in
Encoinvent.. At present, the collected site data do not really allow to ensure that and grading
importance is finally one of the main findings here.
6.2 Quarry site characteristics and variability of impacts
Energy consumption
In the present study, site analyses have been performed by considering the extraction zone, the mixing
plant and washing/stockpile areas (Fig. 1). When initiating these studies with energy consumption
data, all onsite processes were included (involving electricity and fuel). Only pollutant releases caused
by running engine equipment on each site were taken into account, as regards airborne emissions.
These emissions were correlated with engine consumption through the emissions assessment model;
when considering the ratios in Table 3. Considering the total CESP at Site 1 as the reference for roads

14
aggregates use; CESP values for Sites 2 and 3 can be compared to Site 1 (table 6). Such differences
cannot be explained using total aggregate production (in tons) at the quarry, since these data are close
for Sites 1 and 2. This focuses attention on quarry owner practices and possibly on site organization
(i.e. distance between extraction area and plant, i.e. not among the investigated parameters). The mean
CESP is 28.3 MJ per ton and the relative variability with respect to this mean value is evaluated at: -
9.5% for Site 1, +13.7% for Site 2, and -4.5% for Site 3. This value however can be interpreted as an
initial figure relative to aggregate production LCI. Further air pollution assessments should be based
on the uncertainty for each emission and on the dates of engine manufacturing (see description in
Table 3). The ratio of consumed energy at each quarry site varies from 23% (Site 3) to 41% (Site 1), as
shown in Figure 5 whereas the electricity consumption ratio is always lower than the fuel consumption
ratio. This could be investigated from other sites in future work. Finally, besides plant equipment that
are different for each quarry, and engines age and equipment quantity which are also site dependent,
the distances between the extraction area and the plant could be another explanation of variations
between the three sites to investigate.
Grading and production
As regards grading, the contribution of fuel site emissions and upstream production is the same for a
given site, while only the indirect impacts linked to electricity production change with grading. Table
1 gives refined results from Ecoinvent (base N° 465) of the upstream impacts of each grading linked to
electricity production. These values are to be considered for LCA studies considering amounts of with
either coarse or fine aggregates as the range of variations is very wide. Besides all the international
generic data from databases, the differences of grading results obtained in this paper (table 1) indicate
that is it useful to check the grading specific consumptions and associated impacts for civil
engineering or infrastructure design for which resources consumption is a significant load. The data
set produced in this study (table 1 and 6) can be extrapolated for future work.
A large environmental dataset was collected at the quarry sites in order to accurately characterize local
aggregate processing and production practices. After collecting some data of two consecutive years at
only two sites (site 2 and 3) and analyzing significant changes in production, the production
repeatability at France scale using data collected at each department scale (UNPG, 2009) was
investigated. About 1640 producers extract aggregates in France spread on 95 departments for a global
production of 430 106 tons within a year (2009, source UNPG) : a global decrease of the country
production of 12.7% between two years is noticed. Hence, an investigation of production variability
within a range of years can not be investigated seriously considering only 3 sites spread on different
departments and considering only two years of production (site 1, 2 and 3 of the study are not in the
same department).
Besides, one has to say that the grading ratios production as given in table 1 for the three sites also
result of economics needs. So finally, year data linked to the quarries production variations were not
integrated in the environmental quarry variations analysis provided in this paper because of their
incomplete characterization that should be performed on several years and not only two years as done
in the data collection .
Hence, the differences observed between sites suggest therefore a possible impact reduction linked to
local process optimization based on site results. Equipment characteristics were detailed (e.g. year of
production, power rating) for input into the energy consumption model. According to the emissions
model (Tables 2 and 3), the emissions levels depend on engines age.
Rock type

15
The main result is that no significant trend can be highlighted from this LCA site assessment, covering
both hard and soft rocks. Moreover, the total production output, ranging from 70,000 to 180,000 tons
of aggregate per year, could not be found to induce any differences either. These results therefore lead
to the conclusion that a greater amount of quarry data would be necessary to distinguish differences
from statistical analyses drawn from rock type and quarry production capacity, as initially thought
possible. This trend is however considered to be sound but not discussed by Ecoinvent that provides
data sets (based on about 8 quarries) differentiating round and crushed aggregates. In addition a mix
called „non specified aggregates „(base N°465) was used here for comparisons and validation of site
results mean data in table 6 using the hypothesis of 33% crushed (like site 1) and 67 % round (site 2 +
site 3). By now this study indicates that taking into account aggregates grading is a significant output
of site investigation performed mainly for energy consumption assessment, rather than year variations
or rock type characteristics deriving from table 1 and 6 results.
New emissions data on explosives used in quarries
For the explosives, a specific data collection effort was undertaken, given the lack of other literature
data on the topic when our study got underway in 2005. Emission factors for explosive CO2 emissions
are presented in Flower and Sanjayan (2007) for emulsions; these factors are less than those
introduced in this research (10 times lower), yet both studies do not actually concentrate on explosives
data and moreover both emulsions cannot be compared reliably. Hence, it is thought that explosives
emissions should be added to the aggregates LCI when used.
6.3 Towards impact reduction
When considering the data for France, in the framework of all the presented results (Section 5) as well
as the direct and indirect processes (Fig. 6 and 7 for French electricity, Fig. 8 for European electricity),
it is shown that under the given assumptions: 10% of GWP is due to electricity production and 8% due
to diesel production. On the other hand, for EI, AP and POCP, the contribution of primary processes
lies below 5%; explosives production is estimated at 1% of the secondary process energy
consumption. Lastly, the main contribution of energy production is revealed on the TP, EP indicators
(maximum of 60%).
In order to clarify the methods to add upstream processes into the analysis, one has to say that
upstream processes impacts (fig 6 to 8) are not obtained with exactly the same methods. It can be then
acceptable to use a model for impact calculations which does not necessarily account for impact
localization as given by Sayagh et al (2010) for Ecoinvent data and ELCD instead of our local model.
Hence, at this step of the study the impacts calculations related to the electricity production and fuel
production do not distinguish CML 2001 method, and our method (Sayagh et al., 2010). These
impacts as given in figure 6 to 8 (percentage compared to site impacts) exhibit trends as follows.
Electricity impacts are either higher or lower than the impacts generated by diesel fuel production,
according to all the literature data sets considered (ELCD, Ecoinvent and FD P 01-15), depending on
the indicator considered.
Based on all these findings, it can be concluded from this study that the range of site data variations is
significant in comparison with the amount of impacts of upstream processes. Regarding international
data on energy production and various energy contents (from the ELCD and Ecoinvent databases), the
same trend is observed for upstream process impacts but with higher upstream processes contributions
(figures. 7 and 8). The contributions to impacts of electricity production processes (as derived from
both databases considered) are higher than those of diesel production from several calculated

16
indicators, as compared to French energy production data. This indicates that in France at least site
data collection is pertinent for local impacts improvement.
Depending on the magnitude of aggregate consumption around the world, a key issue in pursuit of
decreasing the environmental loads of quarry activity lies in reducing onsite energy consumption,
which happens to be the most significant LCI input quantity for quarry processes. Besides, the impact
assessment from engine emissions leads to the conclusion that a major effort is required on the fluxes
introduced in the impact calculations to use reliable models for aggregates production assessment. As
data are based on Table 3, one should verify this data set according to the use conditions inside
quarries through emissions measurements. Before such improvement engines emissions should be
accurately measured by dedicated experiments. It can be stated that accurate and reliable data
measurements, as derived from engine emissions, should be investigated in future work rather than
using generic data obtained from empirical results like those in Table 3.
According to the above observations, the mean onsite fuel (diesel) consumption is roughly twice the
electricity consumption, whereas the primary impacts of both types of energy sources are similar,
when considering French data from ELCD (2011) and FD P 01-15 (AFNOR, 2006). Lastly, it can be
stated that the range of CESP and impact variations among the three study sites, when looking at
French energy production (Fig. 6), are all of the same order of magnitude as the variations between
quarry sites. This supports the fact that significant reduction of environmental impacts can be achieved
on-site through process optimization (changing non road vehicles and engines, changing equipments).
The results combined in Table 6 with inter-site variations show also significant differences between
the present study and Ecoinvent results for aggregates assessment. The observed trend is that the
values given by Ecoinvent are for some of them much higher or lower than those of the present study,.
May be this trend would be the same regarding site emissions alone, but they cannot be uncoupled
from upstream emissions looking at Ecoinvent results.
7 Conclusion
Environmental impact mitigation does not entail just a single input, but rather a whole array of aspects
combined under a single heading. Their consequences target the environmental component as well as all
other sustainable development components (i.e. economic and social). The objectives of this paper have
been to assess the energy and impacts due to aggregate production within the LCA framework. Towards
this end, a methodology has been presented specific to the impacts of aggregate production for various
quarries. One year was deemed to be the appropriate time scale to study a given production run.
Upstream processes (i.e. electricity production, diesel fuel production and explosives production) have
therefore not been initially included for site comparisons. A range of indicators have been finally
provided, including refined energy consumption (fuel and electricity) and local impacts obtained from
LCA. For these impacts, the study has proposed an analysis of global warming potential, acidification,
eutrophication, atmospheric ozone contribution, ecotoxicity and toxicity.
Awareness of the importance of environmental protection thus necessitates developing comprehensive
methods to evaluate the pressures generated and their ensuing impacts, in order to identify potential
process improvements. A model was developed for this specific purpose. The present study has mainly
consisted of building an environmental model of the aggregate production process. Moreover, an
environmental assessment of aggregates was performed at three selected quarry sites featuring several

17
typical production scenarios (grading output ranging between 0/2 and 0/31.5), with each changing
within a one-year period. The model was based on empirical correlations between engine characteristics
and emissions. The main results indicate that the impacts are linked to the quarry equipment and
organization rather than to the rock nature which means that for such material a local approach seems
more valuables than a generic approach.
The Life Cycle Inventory and impacts for a ton of aggregate for each site were then determined using
the model coupled with the chosen hypothesis. The rules for impact calculations and their data
sensitivity derived from the three quarry sites were studied and expressed as a range of mean CESP and
impact values. The study's limitation has been found to depend on engine model, though the need has
also been observed to refine both the pollutant emission measurements and the impact model.
Though known to exert an influence, the grading difference, with respect to CESP and impacts, was
deeply explored within the scope of this study, although it was principally devoted to overall site
comparisons. Along these lines, the CESP values implicitly integrated various production scenarios
over a one-year period. A data range was determined from the mean CESP and impacts to equal:
arrange of [+ 13.7%,-9.5 %] regarding energy and [+27.5 %, - 24.5 %] for impacts. A more detailed
investigation of engine pollutant emissions should be conducted to extend such an assessment to a
larger number of quarries. As shown, the energy characteristics (countries of production being France
or Europe) do not influence the general observed trends for proportions between global and local
impacts, suggesting that local decrease is the best way to reduce environmental loads when quarrying.
Some other data were finally proposed and discussed to analyze quarry production time variability at
the scale of France regarding the different departments of the country comparing one year and the next
year. It seems to us that this kind of variations is rather governed by economy than by environment so
no year data were finally included in our analysis.
The correlation between quarry geography, namely slopes and track surface, and its consequences on
vehicle consumption might be an interesting avenue of investigation during subsequent research, as
this category of consumption would also influence the impacts on resultant engine emissions.
Acknowledgements
The authors wish to thank quarry owners and producers for their support : Conseil Général 22, CEMEX and UNICEM as well as LCPC colleagues Annick Lalloret for data collection, Anne Ventura and Bogdan Muresan for scientific discussion.
References
AFNOR EN 932-1, 1996. Essai pour déterminer les caractéristiques géométriques des granulats –
Partie 1: Méthodes d‟échantillonnage, pp 32
AFNOR EN 933-1, 1997. Essai pour déterminer les propriétés générales des granulats –Partie 1:
détermination de la granularité. Analyse granulométrique par tamisage, pp 16
AFNOR NF P01-010, 2004. Qualité environnementale des produits de construction - Déclaration
environnementale et sanitaire des produits de construction, pp 47

18
AFNOR ISO 14040, 2006. Management environnemental – Analyse du cycle de vie – Principes et
cadres , pp 33.
AFNOR, FD P 01-15, 2006. Qualité environnementale des produits de construction - Fascicule de
données énergie et transport, pp 39.
AFNOR NF EN 1097-2, 2010, Essais pour déterminer les caractéristiques mécaniques et physiques de
granulats - Partie 2 : méthodes pour la détermination de la résistance à la fragmentation pp 36.
Beardsley M. and Lindhjem C., 1998. Exhaust Emission Factors for Nonroad Engine Modeling –
Compression - Ignition, United States Environmental Protection Agency (EPA), pp.11.
Chappat M. and Bilal J., 2003. La route écologique du futur. Consommation d‟énergie et émission de
gaz à effet de serre. Report from COLAS, pp 40.
Cormier B. and Thébeau D., 2003. Processus d‟élaboration de l‟orientation ministérielle sur le choix
des types de chaussées de Transports Québec. Annual congress of transports association of
Canada, St John‟s (Canada), September 21st-24th.
Csoke B., Petho S., Foldesi J. and Mészaros L., 1996. Optimization of stone-quarry technologies.
International Journal of Mineral Processing , 44-45, 447-459.
Directive 97/68/CE du 16 décembre 1997 sur le rapprochement des législations des Etats membres
relatives aux mesures contre les émissions de gaz et de particules polluants provenant des moteurs
à combustion interne destinés aux engins mobiles non routiers
Directive 2004/26/CE du 21 avril 2004, modifiant la directive n°97/68/CE sur le rapprochement des
législations des Etats membres relatives aux mesures contre les émissions de gaz et de particules
polluants provenant des moteurs à combustion interne destinés aux engins mobiles non routiers
Ecoinvent database, march 2011, base n°1540 - CML 2001
,http://db.ecoinvent.org/ecoquery/processdetail.php.
Egal E., Guennoc P., Le Goff E., Thiéblemont D., Houlgatte E., Augris C., Hamon D., Lebret P. and
Hallégouët B.,1996. Carte géologique France (1/50 000), feuille Pontrieux-Etables-sur-mer (204),
BRGM, Orléans.
ELCD database, march 2011, http://lca.jrc.ec.europa.eu/lcainfohub/datasets/html/processes.
EMEP/CORINAIR, 2003. Atmospheric Emission Inventory Guidebook. European Environment
Agency : 3ème edition.
EPA, 2004. Report n° NR009c, Exhaust and Crankcase Emission Factors for Nonroad Engine
Modeling – Compression – Ignition, United States Environmental Protection Agency.
Flower D., Sanjayan J.G., 2007. Green house gas emissions due to concrete manufacture.
International Journal of Life Cycle Assessment, 12(5), 282-288.
Goedkoop M. and Spriensma R., 2001 The Eco-indicator 99, a damage oriented method for Life Cycle
Impact Assessment, methodology report. Pré Consultants B.V. pp.132.
Horvath A. and Hendrickson C., 1998, “A Comparison of environmental implications of asphalt and
steel-reinforced concrete pavements”, Transportation Research Board, 1626, 105-113.
Huijbregts M.A.J., Thissen U., Guinée J.B., Jager T., Kalf D., Van de Meent D., et al., 2000, Priority
assessment of toxic substances in life cycle assessment. Part I. Calculation of toxicity potentials
for 181 substances with the nested multimedia fate exposure and effects model USES-LCA.
Chemosphere, 41, 541–573.

19
IPPC, Integrated Pollution Prevention and Control. 2001, Reference Document on Best Available
Techniques in the Cement and Lime Manufacturing Industries. European commission report, pp
127.
Martaud T. Évaluation environnementale de la production de granulats naturels en exploitation de
carrière – Indicateurs, Modèles et Outils - Thèse de l‟Université d‟Orléans ; soutenue le 22 octobre
2008, 212 p.
Nouvion S., Jullien A., Sommier M. and Basuyau V., 2009, Environmental modelling of blast furnace
slag aggregates production -, RMPD, 10(4), 715-745.
Miettinen P. and Hämäläinen R.P., 1997, “How to benefit from decision analysis in environmental life
cycle assessment”, European journal of operational research, 102, 279-294.
Peuportier, B., 2003, Analyse de vie d‟un kilomètre de route et comparaison de six variantes. Report
from Centre Energétique de l’Ecole de Mines de Paris pour CIM béton, pp. 48.
Sayagh S., Ventura A., Hoang T., François D. and Jullien A., 2010, Sensitivity of the LCA allocation
procedure for BFS recycled into pavement structures, Resources Conservation and Recycling , 54,
348-358.
Schuurmans A., Rouwette R., Vonk N., Broers J., Rijnsburger H. and Pietersen H., 2005, "LCA of
Finer Sand in Concrete." The International Journal of Life Cycle Assessment 10(2) 131-135.
SETAC, 1993, Guidelines for Life-Cycle Assessment : a code of practise, Ed. Society of
Environmental Toxicology and Chemistry and SETAC Foundation for Environmental Education
(Pensacola, USA), pp. 73.
Stripple H., 2001, Life cycle assessment of road. A pilot study for inventory analysis. Rapport IVL
Swedish Environmental Research Institute, pp. 96 and appendix.
Tighe S, 2001, “Guidelines for Probabilistic pavement life cycle cost analysis”, Transportation
research record, 1769, 28-38.
Union des Producteurs de Chaux (UPC) (2010). Analyse du cycle de vie de la chaux vive et la chaux
éteinte produites en France métropolitaine, 7pp. http://upchaux.fr/wp-
content/uploads/2010/06/chaux_vive_conforme_NF.pdf (accessed on December 10, 2010).
UNPG, 2006, Les granulats – Géologie, Industrie, Environnement, UNPG, Paris.
UNPG, 2009 Le marché des granulats en 2009, Union National des Producteurs de Granulats, UNPG,
Paris.
Ventura A., Monéron P. and Jullien A.,2008, Environmental impact of a binding course pavement
section, with asphalt recycled at varying rates – use of Life Cycle Methodology, Road Materials
and Pavement Design, Special Issue EATA, 9, 319-338.
Zimmerman K.A., Smith K.D. and Grogg M.G., 2000, “Applying economic concepts from lifecycle
cost analysis to pavement management analysis”, Transportation research record, 1699, 58-65.

List of figures:
Figure 1: System and environmental loads.
Figure 2: Aggregate paths inside the plant (Site 1).
Figure 3: Life cycle inventory (Sites 1 through 3).
Figure 4: Site impacts (Sites 1 through 3).
Figure 5: Energy results distribution by source.
Figure 6: Indirect impacts for diesel and electricity production based on ELCD and FD P01015 data for
France using the methods of calculation of Sayagh et al (2010) for all impacts local contribution using
pollutant fluxes.
Figure 7: Indirect impacts for diesel and electricity production based on Ecoinvent data for France using for
quarry site data the model of Sayagh et al (2010) and the impacts results directly from Ecoinvent for
upstream processes (CML 2001).
Figure 8: Indirect impacts from diesel and electricity production using based on ELCD and FD P01015 for
European data using the methods of calculation of Sayagh et al (2010) for all impacts local contribution
using pollutant fluxes.

Figure 1:
With RM (raw material = rock); E1: electricity; E2: fuel; Air: atmospheric emissions; W: waste;
N: noise; V: vibration; D: dust; Mud: fines from decantation of treatment water
Water in the washing circuit for aggregates
: Boundary of operations
: External boundary
Explosives Fuel Equipment Oils Electricity Vehicles water
Extraction Area
RM + E2 + Air + W + N + V + D
W N+ V+ DWater AirAgregates Mud
Soil + by-product
Plant
E1 + W + N + D
Washing plant
E1 + W + water
Water treatment E1 + M
Stockpile
stock
Conveyor Belt
Vehicles

Figure 2:
CR: Crushing; CB: Screening
Primary
CR, CB
Secondary
CR, CB
Tertiary
CR, CB
0 / 31.5 mm < 6.3 mm
> 14 mm 0 / 4 mm
4 / 6.3 mm
6.3 / 10 mm
10 / 14 mm

Figure 3:
1,E-09
1,E-08
1,E-07
1,E-06
1,E-05
1,E-04
1,E-03
1,E-02
1,E-01
1,E+00
1,E+01
site 1 site 2 site 3
Kg/t
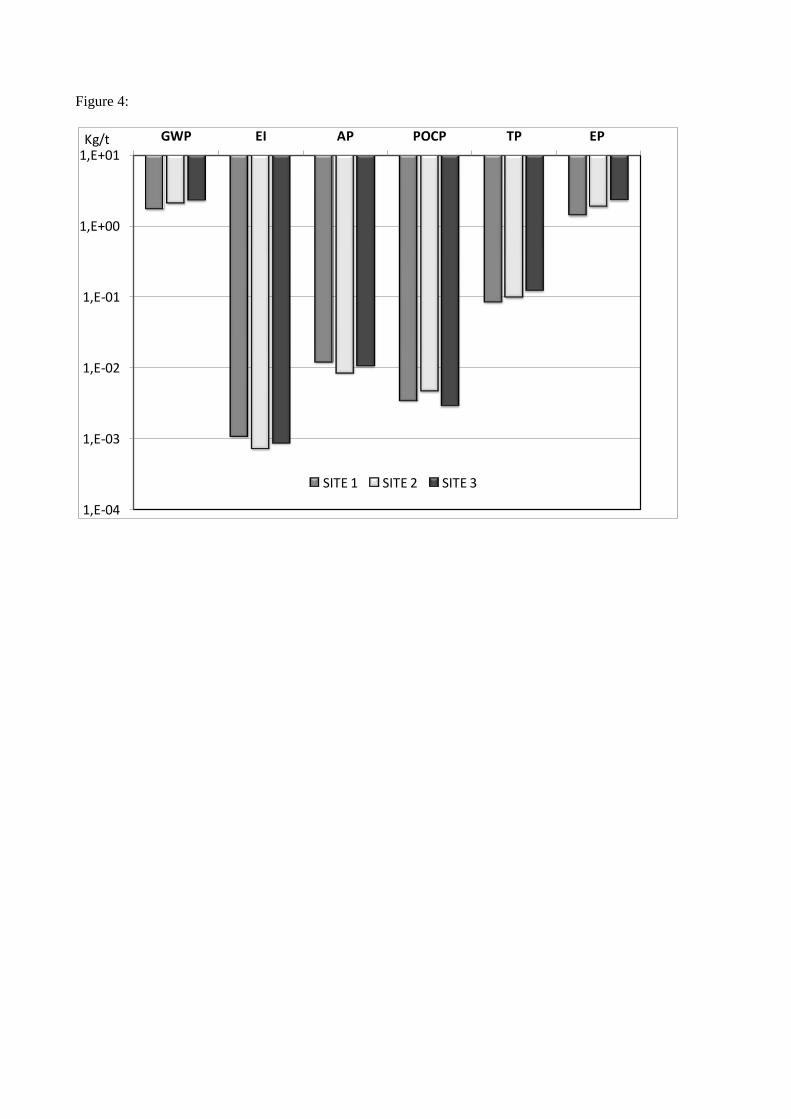
Figure 4:
1,E-04
1,E-03
1,E-02
1,E-01
1,E+00
1,E+01
GWP EI AP POCP TP EP
SITE 1 SITE 2 SITE 3
Kg/t

Figure 5:
electricity
41%fuel 59%
Site 1
fuel 62%
electricity
38%
Site 2
electricity
23%
fuel 77%
Site 3

Figure 6:
0%
10%
20%
30%
40%
50%
60%
70%
80%
90%
100%
GWP EI AP POCP TP EP
Quarry
Diesel production based on ELCD
Electricity production in France based
on FD P 01-015

Figure 7:
0%
20%
40%
60%
80%
100%
GWP EI AP POCP TP EP
Quarry
Diesel production based on ecoinvent
Electricity production in France based
on ecoinvent

Figure 8:
0%
10%
20%
30%
40%
50%
60%
70%
80%
90%
100%
GWP EI AP POCP TP EP
Quarry
Diesel production based on
ELCD
Electricity production in
Europe based on FD P 01-
015

1
List of tables:
Table 1: Quarry output for the three study sites ordered by grading ratio for year 2004 the grading
notations d/D (i.e. 10/14) are given according to the European standards for road materials use.
Table 2: Equipment and off-road vehicle characteristics for all quarry sites for diesel fuel
consumptions.
Table 3: Unit emissions factors for vehicles vs. year of vehicle construction( Beardsley M. and
Lindhjem C., 1998).
Table 4: Details of energy indicator results (Year 2005 is not available for site 1).
Table 5: Atmospheric emissions from mining at Site 1.
Table 6: Energy and impact indicators for all sites vs Ecoinvent data (data base : N°589 for French
electricity, N° 1540 for fuel , N°465 for non specified aggregates (mix of both 33% crushed and 67
round aggregates).
1EPi = FAETPi + MAETPi + FSETPi + MSETPi + MTETEPi
with FAETP : fresh water Aquatic EcoToxicity Potential ; MAETP : marine EcoToxicity Potential ;
FSETP : fresh water Sediment EcoToxicity Potential; MSETP : marine Sediment EcoToxicity
Potential; TETP : Terrestrial EcoToxicity Potential

2
Table 1:
Upstream
impact
Grading
(mm)
Production
(%)
CESP - electricity GWP EI AP POCP HTP EP
MJ/t / average Eq CO2/t Eq PO4/t eq SO2/t Eq
ethylene/t
kg 1.4
DCB/t
kg 1.4
DCB/t
Site 1
Massive
rock
(10.51
MJ.t-1
)
10/14 24 11.0 +4.8 % 0.28 5.0E-04 1.5E-03 5.9E-05 0.37 643.29
0/31.5 20 3.0 -71.4 0.08 1.4E-04 4.2E-04 1.6E-05 0.10 175.44
6.3/10 19 13.6 29.8 0.34 6.2E-04 1.9E-03 7.3E-05 0.46 795.34
0/4 19 13.6 29.8 0.34 6.2E-04 1.9E-03 7.3E-05 0.46 795.34
4/6.3 13 13.6 29.8 0.34 6.2E-04 1.9E-03 7.3E-05 0.46 795.34
< 6.3 5 8.1 -22.9 0.20 3.7E-04 1.1E-03 4.4E-05 0.28 473.69
Fuel production 0.23 1.7E-04 7.4E-04 7.3E-05 0.07 89.29
Fuel emission on site 1.76 1.1E-03 1.2E-02 3.5E-03 0.09 1.44
Site 2
Soft
aggregate
(12.38
MJ.t-1
)
0/4 semi-
crushed 33
20.2 63.1 0.51 9.3E-04 2.8E-03 1.1E-04 0.69 1181.31
0/4 31 11.2 -9.5 0.28 5.1E-04 1.6E-03 6.0E-05 0.38 654.98
8/20 14 12.8 3.4 0.32 5.9E-04 1.8E-03 6.9E-05 0.44 748.55
4/12.5 11 9.5 -23.1 0.24 4.4E-04 1.3E-03 5.1E-05 0.32 555.56
2/6 6 4.9 -60.4 0.12 2.2E-04 6.9E-04 2.6E-05 0.17 286.55
0/2 5 15.7 26.6 0.39 7.2E-04 2.2E-03 8.5E-05 0.53 918.14
Fuel production 0.30 2.3E-04 9.8E-04 9.7E-05 0.09 118.36
Fuel emission on site 2.13 7.3E-04 8.6E-03 4.8E-03 0.10 1.90
Site 3
Soft
aggregate
(6.3 MJ.t-
1)
0/4 73 4.1 -34.6 2.79 0.00 0.01 0.00 0.67 942.14
4/22.4 16 4.7 -24.7 0.10 1.9E-04 5.8E-04 2.2E-05 0.14 239.77
4/12.5 9 5.9 -7.0 0.12 2.2E-04 6.6E-04 2.5E-05 0.16 274.86
0/2 2 10.7 69.1 0.15 2.7E-04 8.3E-04 3.2E-05 0.20 345.04
Fuel production 0.38 2.9E-04 1.2E-03 1.2E-04 0.11 147.26
Fuel emission on site 2.37 8.8E-04 1.1E-02 3.0E-03 0.12 2.37

3
Table 2:
Sites and
equipment
Off-road diesel-
powered vehicles
Year Engine power
(kW)
Consumption
(liters/hour)
Site 1
(5 vehicles.
average year of
construction:
1998)
Drill 2002 220 55
Dumper 2001 238 11.8
Shovels 1999 169 17
Loaders 1997 134 14.5
Dumper 1990 179 5.8
Site 2
(6 vehicles.
average year of
construction:
2003)
Wheel loaders 2005 235 20
Wheel loaders 1998 197 23
Shovel 2004 67 13
Shovel 2004 184 20
Dumper 2002 248 15
Other 2007 149 15
Site 3
(6 vehicles.
average year of
construction:
1988)
Wheel loaders 2002 195 29
Wheel loaders 1992 130 19
Other 1972 90 14
Dumper 1985 135 22
Shovel 1990 100 15
Wheel loaders 1982 150 30

4
Table 3:
CO VOCNM* NOx PM N2O CH4 POP Cd Cu Ni Se Zn
37-75 4.68 1.33 11.13 0.97 0.35 0.05 3.32 0.01 1.7 0.07 0.01 1
75-130 3.62 0.91 11.24 0.54 0.35 0.05 3.32 0.01 1.7 0.07 0.01 1
130-560 3.62 0.91 11.24 0.54 0.35 0.05 3.32 0.01 1.7 0.07 0.01 1
>560 3.62 0.91 11.24 0.54 0.35 0.05 3.32 0.01 1.7 0.07 0.01 1
37-75 6.5 1.3 9.2 0.85 0.35 0.05 3.32 0.01 1.7 0.07 0.01 1
75-130 5 1.3 9.2 0.7 0.35 0.05 3.32 0.01 1.7 0.07 0.01 1
130-560 5 1.3 9.2 0.54 0.35 0.05 3.32 0.01 1.7 0.07 0.01 1
18-37 5.5 1.5 8 0.8 0.35 0.05 3.32 0.01 1.7 0.07 0.01 1
37-75 5 1.3 7 0.4 0.35 0.05 3.32 0.01 1.7 0.07 0.01 1
75-130 5 1 6 0.3 0.35 0.05 3.32 0.01 1.7 0.07 0.01 1
130-560 3.5 1 6 0.2 0.35 0.05 3.32 0.01 1.7 0.07 0.01 1
19-37 5.5 0.6 0.35 0.05 3.32 0.01 1.7 0.07 0.01 1
37-75 5 0.4 0.35 0.05 3.32 0.01 1.7 0.07 0.01 1
75-130 5 0.3 0.35 0.05 3.32 0.01 1.7 0.07 0.01 1
130-560 3.5 0.2 0.35 0.05 3.32 0.01 1.7 0.07 0.01 1
37-56 5 0.025 0.35 0.05 3.32 0.01 1.7 0.07 0.01 1
56-75 5 0.19 3.3 0.025 0.35 0.05 3.32 0.01 1.7 0.07 0.01 1
75-130 5 0.19 3.3 0.025 0.35 0.05 3.32 0.01 1.7 0.07 0.01 1
130-560 3.5 0.19 2 0.025 0.35 0.05 3.32 0.01 1.7 0.07 0.01 1
56-130 5 0.19 0.4 0.025 0.35 0.05 3.32 0.01 1.7 0.07 0.01 1
130-560 3.5 0.19 0.4 0.025 0.35 0.05 3.32 0.01 1.7 0.07 0.01 1
IIIB
(2011/2013)
IV (≥ 2014)
Unitary emisson factor (g.kWh-1
) Unitary emission factor (mg.kgfuel-1
)Power
(kW)
7.5
4.7
4
4
4.7
Year
1988-1999
I(1999)
II
(2000/2005)
IIIA
(2006/2010)
*VOCNM : VOC non methanic

5
Table 4:
Site Production
(t)
CESP - electricity CESP - fuel CESP - total
kWh.t-1
MJ.t-1
kWh.t-1
MJ.t-1
kWh.t-1
MJ.t-1
1 180.000 2.92 10. 51 4.19 15.08 7.11 25.59
2 177.720 3.44 12.38 5.50 19.80 8.94 32.18
3 84.825 1.75 6.30 5.75 20.70 7.50 27.00
Table 5:
Explosive
content
CO2
(g.t-1
)
NO
(g.t-1
)
CO
(g.t-1
)
NH3
(g.t-1
)
H2
(g.t-1
)
H2O
(g.t-1
)
O2
(g.t-1
)
N2
(g.t-1
)
Aluminum Oxide
(g.t-1
)
Emulsion 1.89 0 0.75 0.11 0.08 8.19 0 4.41 1.91
Fuel
nitrate 10.84 0.12 0.27 0.03 0.02 36.49 0.05 24.61 2.61
Total 12.73 0.12 1.02 0.14 0.10 44.68 0.05 29.02 4.52

6
Table 6:
Indicator
Ecoinvent value
(CML 2001
database N°465.
v2.2- 33%
crushed
aggregates and
67 % round
aggregates)
All upstream
processes
Mean sites with
upstream
processes
database N° 589
for French
electricity
production and
N°1540 for fuel
production
upstream
processes
Mean sites
values
% variation
to mean calculated value
Site 1 Site 2 Site 3
CESP (MJ/t) 31.5 28.3 28.3 -9.5% +13.7% -4.5%
CESP -
electricity (MJ/t) 17.2 9.8
9.8
(35% of total
CESP)
+7.2% +26.3% -35.7%
CESP - fuel
(MJ/t) 14.3 18.5
18.5
(65 % of total
CESP)
-18.5% +7% +11.9%
GWP (kg
eq.CO2 /t)
2.9 2.63
2.1 -15.4% +2.5% +12.9%
- 9 %
EI (kg eq.PO4 /t)
3.8 10-3
1.6 10-3
9 10-4
+20.8% -18.9% -1.9%
- 58 %
AP (kg
eq.SO2/t)
1.83 10-2
1.3 10-2
1 10-2
+15.8% -18.3% +2.5%
- 29 %
POCP (kg
eq.ethylen/t)
7.1 10-4
3.9 10-3
3.7 10-3
-6.2% +27.5% -21.3%
+ 449 %
HTP (kg 1.4
DCB/t)
3.1 0.52
0.103 -17.3% -3% +20.3%
- 83%
EP ( kg 1.4
DCB/t) 1
2602 689
1.9 -24.5% +0.1% +24.5%
-74 %

7