environmental impact of vinegrowing and winemaking …
TRANSCRIPT
TRIOLI ET AL., ENVIRONMENTAL IMPACT OF VINEGROWING AND WINEMAKING INPUTS: AN EUROPEAN SURVEY, PAGE 1
WWW.INFOWINE.COM – INTERNET JOURNAL OF VITICULTURE AND ENOLOGY, 2015, N. 7/2
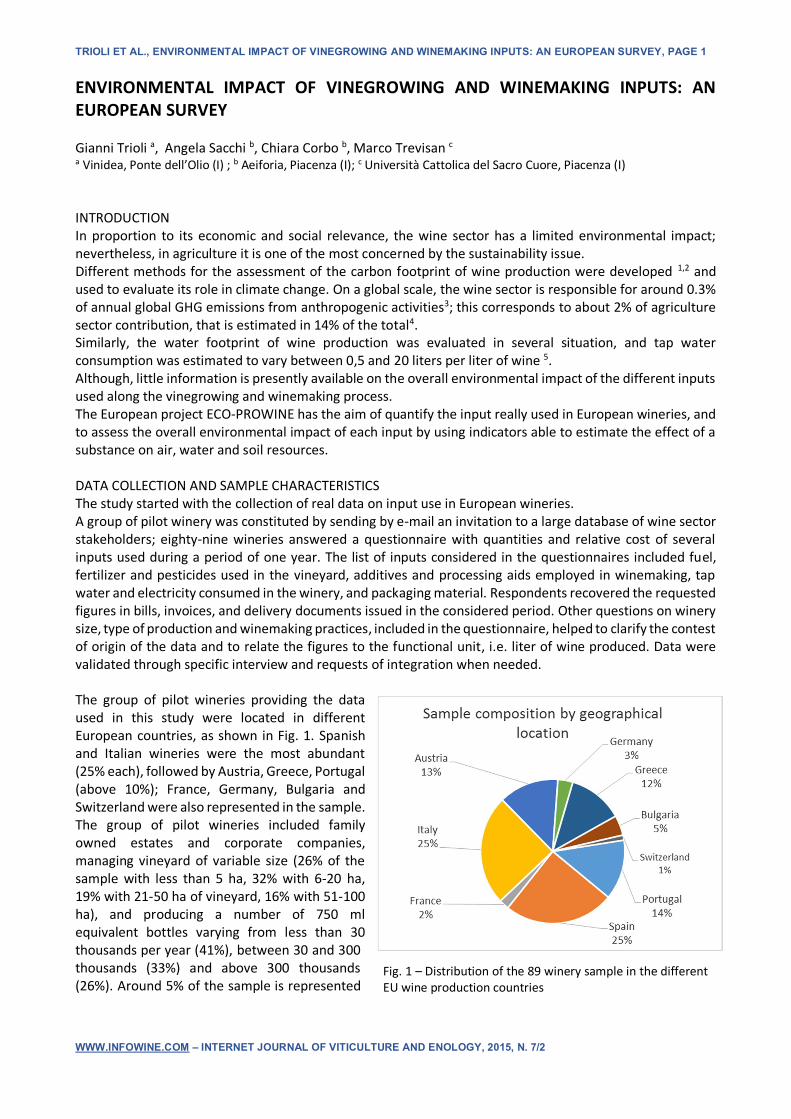
ENVIRONMENTAL IMPACT OF VINEGROWING AND WINEMAKING INPUTS: AN EUROPEAN SURVEY Gianni Trioli a, Angela Sacchi b, Chiara Corbo b, Marco Trevisan c a Vinidea, Ponte dell’Olio (I) ; b Aeiforia, Piacenza (I); c Università Cattolica del Sacro Cuore, Piacenza (I) INTRODUCTION In proportion to its economic and social relevance, the wine sector has a limited environmental impact; nevertheless, in agriculture it is one of the most concerned by the sustainability issue. Different methods for the assessment of the carbon footprint of wine production were developed 1,2 and used to evaluate its role in climate change. On a global scale, the wine sector is responsible for around 0.3% of annual global GHG emissions from anthropogenic activities3; this corresponds to about 2% of agriculture sector contribution, that is estimated in 14% of the total4. Similarly, the water footprint of wine production was evaluated in several situation, and tap water consumption was estimated to vary between 0,5 and 20 liters per liter of wine 5. Although, little information is presently available on the overall environmental impact of the different inputs used along the vinegrowing and winemaking process. The European project ECO-PROWINE has the aim of quantify the input really used in European wineries, and to assess the overall environmental impact of each input by using indicators able to estimate the effect of a substance on air, water and soil resources. DATA COLLECTION AND SAMPLE CHARACTERISTICS The study started with the collection of real data on input use in European wineries. A group of pilot winery was constituted by sending by e-mail an invitation to a large database of wine sector stakeholders; eighty-nine wineries answered a questionnaire with quantities and relative cost of several inputs used during a period of one year. The list of inputs considered in the questionnaires included fuel, fertilizer and pesticides used in the vineyard, additives and processing aids employed in winemaking, tap water and electricity consumed in the winery, and packaging material. Respondents recovered the requested figures in bills, invoices, and delivery documents issued in the considered period. Other questions on winery size, type of production and winemaking practices, included in the questionnaire, helped to clarify the contest of origin of the data and to relate the figures to the functional unit, i.e. liter of wine produced. Data were validated through specific interview and requests of integration when needed. The group of pilot wineries providing the data used in this study were located in different European countries, as shown in Fig. 1. Spanish and Italian wineries were the most abundant (25% each), followed by Austria, Greece, Portugal (above 10%); France, Germany, Bulgaria and Switzerland were also represented in the sample. The group of pilot wineries included family owned estates and corporate companies, managing vineyard of variable size (26% of the sample with less than 5 ha, 32% with 6-20 ha, 19% with 21-50 ha of vineyard, 16% with 51-100 ha), and producing a number of 750 ml equivalent bottles varying from less than 30 thousands per year (41%), between 30 and 300 thousands (33%) and above 300 thousands (26%). Around 5% of the sample is represented
Fig. 1 – Distribution of the 89 winery sample in the different EU wine production countries

TRIOLI ET AL., ENVIRONMENTAL IMPACT OF VINEGROWING AND WINEMAKING INPUTS: AN EUROPEAN SURVEY, PAGE 2
WWW.INFOWINE.COM – INTERNET JOURNAL OF VITICULTURE AND ENOLOGY, 2015, N. 7/2
by the extremes: more than 3 million bottles and less than 3 thousand bottles. Overall, the sample has a good representativeness of the variable structure of wine producers in Europe. QUANTIFICATION OF INPUTS USED BY THE WINERIES Data collected from the wineries were elaborated in order to express them in units per liter of wine. In case of inputs used in the vineyard, the declared quantities were divided by the volume of wine obtained from in-house grown grapes; for inputs related to winemaking, including electricity and tap water consumption, the incidence per liter was calculated using the total volume of wine processed in the winery, taking in account also the purchased grapes and bulk wine; in case of material for packaging, the quantities were divided by the volume of wine bottled in glass containers, excluding the products sold in bulk or with alternative packaging. The overall data of the European winery sample are shown in Tab. 1, that reports the average quantity and the standard deviation for each item. Some items were grouped in order to obtain figures with more significance: that is the case of inorganic fertilizers (including N based, but also K, P and other fertilizers), of pesticides (including fungicides, insecticides and herbicides), protein processing aids (gelatin, albumin, casein etc.) and metal capsules (independently from the composing alloy). The data of inputs show a very large variability, among them and among wineries. Some inputs are used on average in low amount per liter (i.e. sulphur dioxide, yeasts and in general additives and processing aids), other in much larger quantities, like for instance glass bottles, cardboard, sulphur for vineyard treatment and organic fertilizers. Also, the data document a very significant variability among wineries, with standard deviation often greater than the average. This can be due in part to occasional purchase of goods in the considered year, like in case of inorganic and organic fertilization, or of wood barrels, that might not constant every year; although, significant standard deviations such as for fuel, glass, cardboard, electricity etc. suggest large difference in the applied practices, and consequently wide margin for improvement in the cases with biggest figures. ENVIRONMENTAL INDICATORS One of the goal of this study was to evaluate the relative impact of the different winery consumables on the environment. Therefore, the quantities were multiplied by factors derived by international databases5 in order to obtain indicators related to different environment impact categories, listed in Fig. 2 (mid-point indicators). Division of these values by the overall Europe contribution to the specific impact category allows the normalization of the data6. The pure numbers thus obtained are first grouped into three resource indicators (air, water, soil), then merged in a global indicator; indicator grouping is done through weighting factors derived from previous experience of the academic authors, and under fuzzy logic. The application of the algorithm allows to express a quantity of an input, for instance liters of fuel used in one year in the farm, into a value of global environmental impact, without units and therefore combinable with the indexes obtained for other substances of the same winery. Thus, we can compare the weight of the
unit Average STDFeul / gasoil mL 57,32 37,26Electricity KWh 0,35 0,27Water (tap water) L 5,20 4,24Inorganic fertilizers g 9,80 20,78Organic fertilizers g 16,60 32,24Pesticides Total g 3,07 7,33Copper g 1,07 1,43Sulphur g 10,93 15,41Sulphur dioxide g 0,12 0,60Yeasts g 0,10 0,23Diammonium phosphate g 0,17 0,23Protein processing aids g 0,19 0,41Bentonite g 0,53 0,63Wood barrels cm 3 7,50 22,50Detergents g 0,91 0,45Glass bottles g 650,00 188,70Plastic closures g 1,16 2,39Cork closures g 3,89 3,38Plastic capsules g 0,72 1,80Metal capsules g 2,05 2,99Cardboard boxes g 50,70 28,01Plastic waste (recycling) g 3,58 4,39
per liter of wine
Tab. 1 – Quantification of some inputs used by EU wineries. Data are expressed per liter of wine.

TRIOLI ET AL., ENVIRONMENTAL IMPACT OF VINEGROWING AND WINEMAKING INPUTS: AN EUROPEAN SURVEY, PAGE 3
WWW.INFOWINE.COM – INTERNET JOURNAL OF VITICULTURE AND ENOLOGY, 2015, N. 7/2
different inputs of a winery, and evaluate the overall environmental impact of a winery in comparison with the benchmark issued from the European database constituted through the questionnaire.
RELATIVE WEIGHT OF THE DIFFERENT INPUTS ON ENVIRONMENTAL IMPACT The resource indicators calculated on the average use of different inputs in the European sample of wineries are represented in fig. 3. These indexes, merged through weighting factors (0,65/0,2/0,15 respectively for air/water/soil), bring to the global environmental indicator shown in fig. 4. The graphs allows the evaluation of the relative weight of each consumable on environmental impact.
Fig.2 – Diagram of the calculation of global indicator value for each input.
Fig.3 – Relative contribution of winery inputs to resource indicators for air, water and soil
Fig.4 – Relative contribution to global environmental indicator of the consumables used in wine production.
TRIOLI ET AL., ENVIRONMENTAL IMPACT OF VINEGROWING AND WINEMAKING INPUTS: AN EUROPEAN SURVEY, PAGE 4
WWW.INFOWINE.COM – INTERNET JOURNAL OF VITICULTURE AND ENOLOGY, 2015, N. 7/2
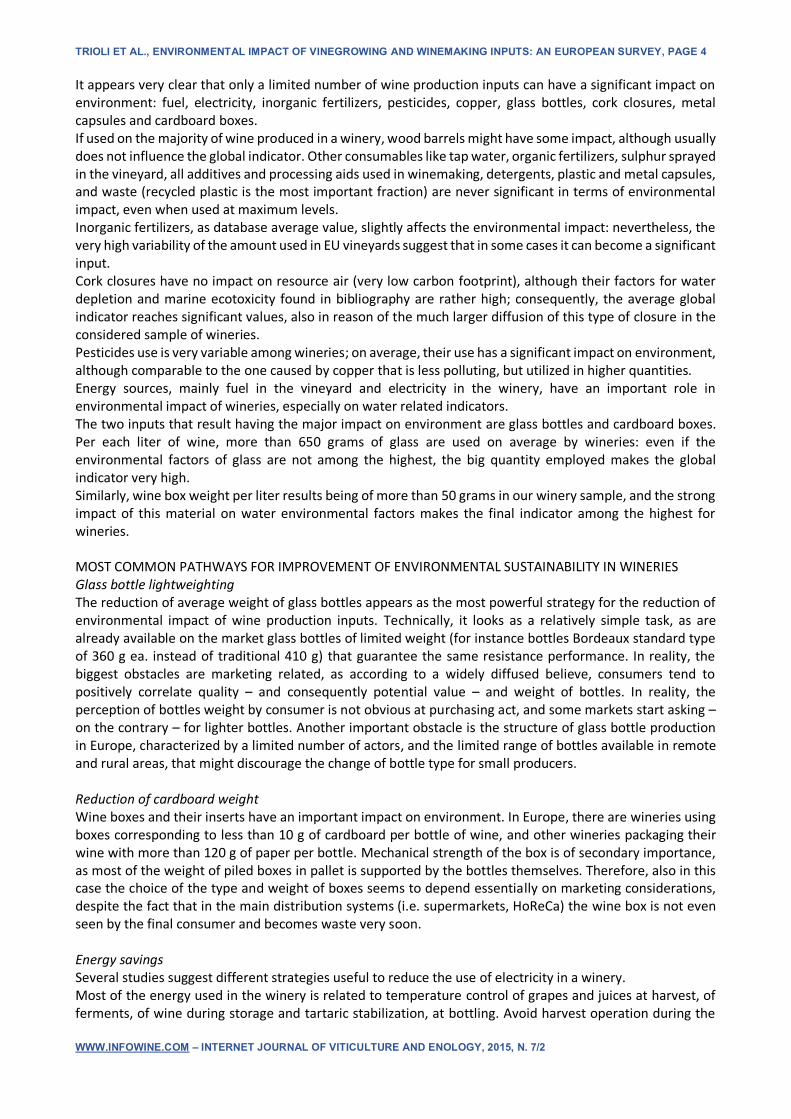
It appears very clear that only a limited number of wine production inputs can have a significant impact on environment: fuel, electricity, inorganic fertilizers, pesticides, copper, glass bottles, cork closures, metal capsules and cardboard boxes. If used on the majority of wine produced in a winery, wood barrels might have some impact, although usually does not influence the global indicator. Other consumables like tap water, organic fertilizers, sulphur sprayed in the vineyard, all additives and processing aids used in winemaking, detergents, plastic and metal capsules, and waste (recycled plastic is the most important fraction) are never significant in terms of environmental impact, even when used at maximum levels. Inorganic fertilizers, as database average value, slightly affects the environmental impact: nevertheless, the very high variability of the amount used in EU vineyards suggest that in some cases it can become a significant input. Cork closures have no impact on resource air (very low carbon footprint), although their factors for water depletion and marine ecotoxicity found in bibliography are rather high; consequently, the average global indicator reaches significant values, also in reason of the much larger diffusion of this type of closure in the considered sample of wineries. Pesticides use is very variable among wineries; on average, their use has a significant impact on environment, although comparable to the one caused by copper that is less polluting, but utilized in higher quantities. Energy sources, mainly fuel in the vineyard and electricity in the winery, have an important role in environmental impact of wineries, especially on water related indicators. The two inputs that result having the major impact on environment are glass bottles and cardboard boxes. Per each liter of wine, more than 650 grams of glass are used on average by wineries: even if the environmental factors of glass are not among the highest, the big quantity employed makes the global indicator very high. Similarly, wine box weight per liter results being of more than 50 grams in our winery sample, and the strong impact of this material on water environmental factors makes the final indicator among the highest for wineries. MOST COMMON PATHWAYS FOR IMPROVEMENT OF ENVIRONMENTAL SUSTAINABILITY IN WINERIES Glass bottle lightweighting The reduction of average weight of glass bottles appears as the most powerful strategy for the reduction of environmental impact of wine production inputs. Technically, it looks as a relatively simple task, as are already available on the market glass bottles of limited weight (for instance bottles Bordeaux standard type of 360 g ea. instead of traditional 410 g) that guarantee the same resistance performance. In reality, the biggest obstacles are marketing related, as according to a widely diffused believe, consumers tend to positively correlate quality – and consequently potential value – and weight of bottles. In reality, the perception of bottles weight by consumer is not obvious at purchasing act, and some markets start asking – on the contrary – for lighter bottles. Another important obstacle is the structure of glass bottle production in Europe, characterized by a limited number of actors, and the limited range of bottles available in remote and rural areas, that might discourage the change of bottle type for small producers. Reduction of cardboard weight Wine boxes and their inserts have an important impact on environment. In Europe, there are wineries using boxes corresponding to less than 10 g of cardboard per bottle of wine, and other wineries packaging their wine with more than 120 g of paper per bottle. Mechanical strength of the box is of secondary importance, as most of the weight of piled boxes in pallet is supported by the bottles themselves. Therefore, also in this case the choice of the type and weight of boxes seems to depend essentially on marketing considerations, despite the fact that in the main distribution systems (i.e. supermarkets, HoReCa) the wine box is not even seen by the final consumer and becomes waste very soon. Energy savings Several studies suggest different strategies useful to reduce the use of electricity in a winery. Most of the energy used in the winery is related to temperature control of grapes and juices at harvest, of ferments, of wine during storage and tartaric stabilization, at bottling. Avoid harvest operation during the
TRIOLI ET AL., ENVIRONMENTAL IMPACT OF VINEGROWING AND WINEMAKING INPUTS: AN EUROPEAN SURVEY, PAGE 5
WWW.INFOWINE.COM – INTERNET JOURNAL OF VITICULTURE AND ENOLOGY, 2015, N. 7/2
hottest hours of the day, prefer flotation, centrifugation and other cleaning techniques on cold settling, use insulated tanks, prefer additive addition to physical treatment for tartaric stabilization etc. are well established winemaking practices whose adoption can help in reducing the employment of energy in winemaking. Reduction of fuel use in vineyard Fuel is essentially correlated to the distance travelled by tractors and other equipment for the cultivation of vineyard, indeed to the number of pesticide application, soil and canopy management intervention that are applied in any specific vineyard plot. Multiple row treatments, combined functions in the same passage (for instance thinning coupled with pesticide spraying), and optimization of defense strategy against pathogens through adoption of DSS instruments, can be successfully implemented with environmental advantages. Also, an improved organization of the estate activity schedule, able to limit as much as possible the displacements between distant vineyard lots of the same property, can have a significant impact on fuel consumption, as well as on labor cost. WINERY IMPROVEMENT PLANNING An important advantage of the assessment approach used in ECO-PROWINE, stay in the possibility to analyze the situation of the single winery and to identify for each case the priority axis of improvement.
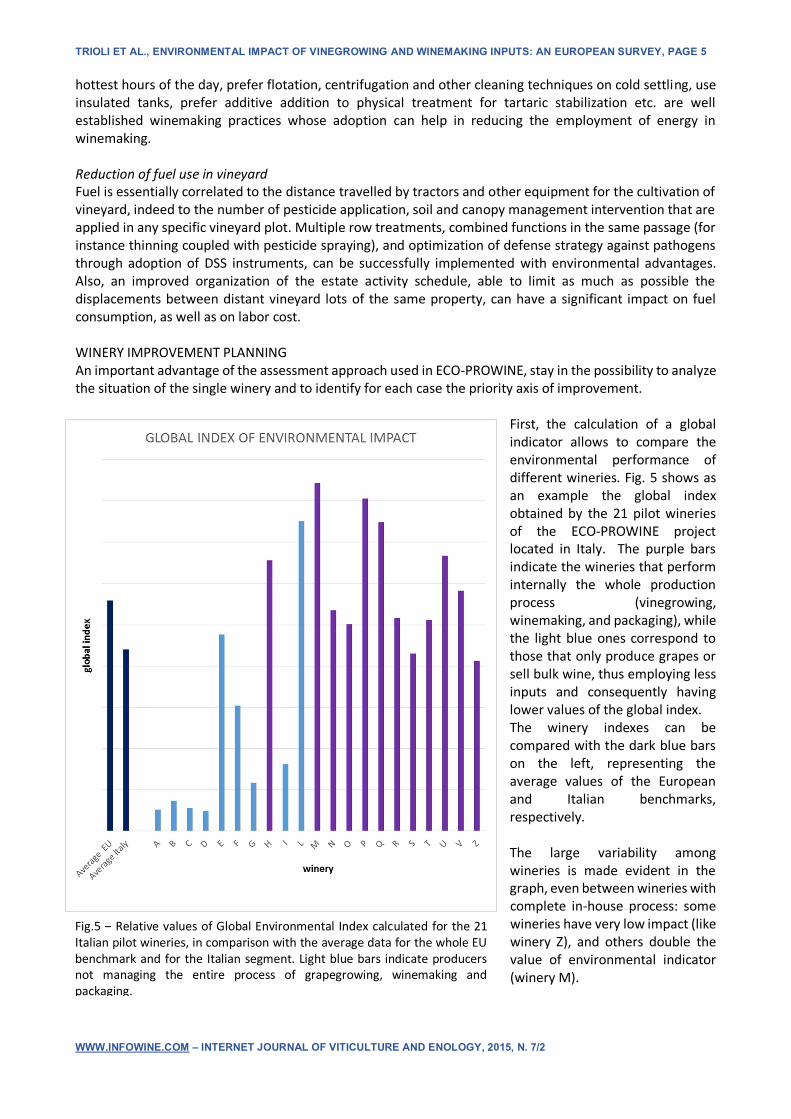
First, the calculation of a global indicator allows to compare the environmental performance of different wineries. Fig. 5 shows as an example the global index obtained by the 21 pilot wineries of the ECO-PROWINE project located in Italy. The purple bars indicate the wineries that perform internally the whole production process (vinegrowing, winemaking, and packaging), while the light blue ones correspond to those that only produce grapes or sell bulk wine, thus employing less inputs and consequently having lower values of the global index. The winery indexes can be compared with the dark blue bars on the left, representing the average values of the European and Italian benchmarks, respectively. The large variability among wineries is made evident in the graph, even between wineries with complete in-house process: some wineries have very low impact (like winery Z), and others double the value of environmental indicator (winery M).
Fig.5 – Relative values of Global Environmental Index calculated for the 21 Italian pilot wineries, in comparison with the average data for the whole EU benchmark and for the Italian segment. Light blue bars indicate producers not managing the entire process of grapegrowing, winemaking and packaging.
TRIOLI ET AL., ENVIRONMENTAL IMPACT OF VINEGROWING AND WINEMAKING INPUTS: AN EUROPEAN SURVEY, PAGE 6
WWW.INFOWINE.COM – INTERNET JOURNAL OF VITICULTURE AND ENOLOGY, 2015, N. 7/2
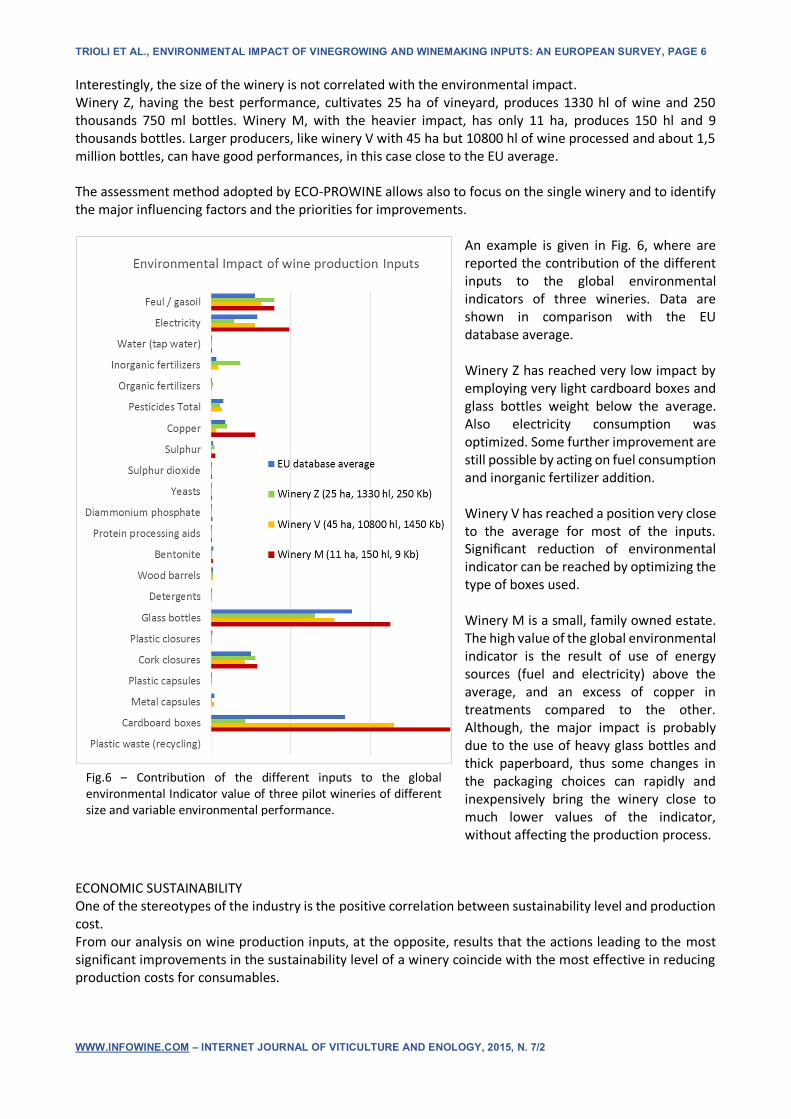
Interestingly, the size of the winery is not correlated with the environmental impact. Winery Z, having the best performance, cultivates 25 ha of vineyard, produces 1330 hl of wine and 250 thousands 750 ml bottles. Winery M, with the heavier impact, has only 11 ha, produces 150 hl and 9 thousands bottles. Larger producers, like winery V with 45 ha but 10800 hl of wine processed and about 1,5 million bottles, can have good performances, in this case close to the EU average. The assessment method adopted by ECO-PROWINE allows also to focus on the single winery and to identify the major influencing factors and the priorities for improvements.
An example is given in Fig. 6, where are reported the contribution of the different inputs to the global environmental indicators of three wineries. Data are shown in comparison with the EU database average. Winery Z has reached very low impact by employing very light cardboard boxes and glass bottles weight below the average. Also electricity consumption was optimized. Some further improvement are still possible by acting on fuel consumption and inorganic fertilizer addition. Winery V has reached a position very close to the average for most of the inputs. Significant reduction of environmental indicator can be reached by optimizing the type of boxes used. Winery M is a small, family owned estate. The high value of the global environmental indicator is the result of use of energy sources (fuel and electricity) above the average, and an excess of copper in treatments compared to the other. Although, the major impact is probably due to the use of heavy glass bottles and thick paperboard, thus some changes in the packaging choices can rapidly and inexpensively bring the winery close to much lower values of the indicator, without affecting the production process.
ECONOMIC SUSTAINABILITY One of the stereotypes of the industry is the positive correlation between sustainability level and production cost. From our analysis on wine production inputs, at the opposite, results that the actions leading to the most significant improvements in the sustainability level of a winery coincide with the most effective in reducing production costs for consumables.
Fig.6 – Contribution of the different inputs to the global environmental Indicator value of three pilot wineries of different size and variable environmental performance.

TRIOLI ET AL., ENVIRONMENTAL IMPACT OF VINEGROWING AND WINEMAKING INPUTS: AN EUROPEAN SURVEY, PAGE 7
WWW.INFOWINE.COM – INTERNET JOURNAL OF VITICULTURE AND ENOLOGY, 2015, N. 7/2
The pilot wineries provided also data related to the cost of the different inputs, originated from the bills and invoiced paid during the reference period. Fig. 7 graphically represents relative incidence of the considered consumables on the production cost per bottle. It can be observed that – apart for wood aging in barrel, although regarding a limited portion of the wine – the great majority of consumable costs for wine are related to the packaging materials. On average, in wines without wood aging, glass bottles account for almost 50% of the production cost related to inputs; closures, capsules and boxes make up an additional 30%. Input used in the vineyard (fuel, fertilizers, pesticides) account together for less than 15% of the consumable costs. Electricity represents on average about 7%. Additives, processing aids, active dried yeasts and nutrients, altogether do not reach 2% of the total spent for consumable: that is to say, presently wineries tend to devote to all these technical means - that can play an essential role in determining the final quality of wine – about 15% of what they usually spend for boxes, and only 3% of the normal expenditure in glass bottles.
A positive consideration raising from these observation is that the most common and effective levers to increase the sustainability level of a winery (reduce glass and cardboard weights, save fuel and electricity) are also those allowing the most significant reductions in cost for consumable purchasing. CONCLUSIONS The data provided by a representative sample of wine European producer has allowed to analyze with new perspective the real use of inputs, and to raise elements on their impact on environment and on production costs. Within an LCA-LCC approach, the adoption of indicators allowed to estimate the global environmental impact of the different technical means used in the winery, and to identify those responsible of the biggest effects; on average, and in decreasing order, they are glass bottles, cardboard boxes, fuel, electricity, closures, pesticides, fertilizers. For each single input, variability among wineries of the quantity used is extremely high, suggesting large margins of improvements in the less virtuous production sites. Interestingly, the most effective actions to improve environmental performance, i.e. changes of the packaging material, are not significantly affecting production process and consequently wine quality, and are accompanied by potential reduction of costs. The approach allows a deeper analysis of each winery, the identification of the specific critical points and the development of a tailored improvement plan. Also, it is possible to simulate the effect of solution adopted and to estimate beforehand the cost/benefit of the improvements.
Fig.7 – Average cost of consumables used in wine production. Data are expressed in € per bottle of 750 ml.
TRIOLI ET AL., ENVIRONMENTAL IMPACT OF VINEGROWING AND WINEMAKING INPUTS: AN EUROPEAN SURVEY, PAGE 8
WWW.INFOWINE.COM – INTERNET JOURNAL OF VITICULTURE AND ENOLOGY, 2015, N. 7/2
The tool developed by the project provided EU wineries an useful instrument that helps in assessing their sustainability and in planning the best possible improvement. It can be further ameliorate by including in the scope other items that might very significantly influence the overall environmental and economic performance of a winery, such as: vineyard planting, winery buildings, machinery and equipment, personnel, marketing and promotional activities etc. ACKNOWLEDGES The project ECO-PROWINE was funded by the European Commission through the EASME (European Agency for Small and Medium Entreprises) under the program CIP - EcoInnovation (G.A. ECO/11/304386) REFERENCES 1 Bilan Carbone ®ADEME Agence de l’Environnement et de Maitrise de l’Energie, France 2 IWCC, International Wine Carbon Calculator, Provisor Pty Ltd 3 Rugani, B., Vázquez-Rowe, I., Benedetto, G., Benedetto, E., 2013. A comprehensive review of carbon footprint analysis as an extended environmental indicator in the wine sector. J. Clean. Prod. 54, 61-77. 4 Fifth IPCC Assessment Report, 2014 5 Elisa Novelli, Lucrezia Lamastra, Gianni Trioli. Sostenibilità in cantina: la gestione dell’acqua. L’Informatore Agrario 11/2014 5 Ecoinvent, SimaPro 8.0 6 Anneke Wegener Sleeswijka, Lauran F.C.M. van Oersc, Jeroen B. Guinéec, Jaap Struijsd, Mark A.J. Huijbregtsb. Normalisation in product life cycle assessment: An LCA of the global and European economic systems in the year 2000. Science of the total environment 390(2008) 227-240.