environmental drivers of growth and predicted effects of
TRANSCRIPT

MARINE ECOLOGY PROGRESS SERIESMar Ecol Prog Ser
Advance Viewdoi: 10.3354/meps12234
Available online:September 5, 2017
INTRODUCTION
Coastal areas are dynamic and complex environ-ments that support valuable fisheries around theworld (FAO 2016). Occurring at the interface of landand sea, they are naturally affected by both terrestrialand marine processes that together play a fundamen-tal role in driving variation in abiotic conditions(Alongi 1998). Coastal waters are, however, heavilyaffected by human activity (Halpern et al. 2008) andclimate change (Harley et al. 2006). The growth infor-mation naturally archived in fish otoliths provides aunique opportunity to recreate multi-decadal time se-ries in regions where monitoring data does not exist
(Morrongiello et al. 2012, Poloczanska et al. 2016).This valuable longer-term perspective is vital to un-derstanding and managing the impacts of natural andanthropogenic change on fisheries productivity.
Habitat forming species such as seagrass play afundamental role in underpinning the productivity ofcoastal fisheries (Butler & Jernakoff 1999, Ellison etal. 2005). For example, seagrass provides protectionand resources for newly settled larvae and juvenilefishes (Jenkins et al. 1997, Ford et al. 2010), as well asfeeding and spawning opportunities for adults(Klumpp & Nichols 1983). The health and productiv-ity of seagrass itself is driven by both terrestrial andmarine processes that are increasingly being modi-
© The authors 2017. Open Access under Creative Commons byAttribution Licence. Use, distribution and reproduction are un -restricted. Authors and original publication must be credited.
Publisher: Inter-Research · www.int-res.com
*Corresponding author: [email protected]
Environmental drivers of growth and predictedeffects of climate change on a commercially
important fish, Platycephalus laevigatus
Joshua Barrow1,*, John Ford1,2, Rob Day1, John Morrongiello1
1School of BioSciences, University of Melbourne, Parkville 3010, Victoria, Australia2Mezo Research, 28 Freshwater Place, Southbank, Melbourne 3006, Victoria, Australia
ABSTRACT: Human-driven climate change and habitat modification are negatively impactingcoastal ecosystems and the species that reside within them. Uncovering how individuals of keyspecies respond to environmental influences is crucial for effective and responsive coastalresource and fisheries management. Here, using an otolith based analysis, we recreated thegrowth history of rock flathead Platycephalus laevigatus from Corner Inlet, Victoria, Australia,over a 32 yr timeframe and related growth variation to changes in key environmental variables.Growth increased with higher temperatures during the fish growing season (December−May) andalso increased with higher freshwater flow during the period important for seagrass growth (July−February). We hypothesise that fish are responding to enhanced productivity in the seagrass foodweb, driven by increased nutrient input from freshwater flows. Fish also appear to be respondingto higher temperatures via a direct physiological pathway. We then predicted fish growth under 3plausible climate change scenarios. Growth is predicted to increase across all our projections,because any predicted decrease in river flow will likely be offset by rapid predicted increases intemperature. Our results highlight the value of understanding the drivers of long-term growthvariation in harvested fishes as this allows for the prediction of future productivity under a rangeof environmental and management scenarios.
KEY WORDS: Climate change · Coastal ecosystems · Ecosystem resilience · Fisheries productivity ·Fish growth · Variable growth · Otolith · Sclerochronology
Contribution to the Theme Section ‘Innovative use of sclerochronology in marine resource management’ OPENPEN ACCESSCCESS

Mar Ecol Prog Ser · Theme Section · Advance View
fied by humans (Orth et al. 2006). Terrestrial runoff,marine currents, and wind-driven mixing providenutrients that fertilise seagrass beds. However, inurbanised and agricultural catchments, nutrientloads can exceed natural levels and result in phyto-plankton blooms and excessive algal growth thatreduce light penetration or smother seagrass (Thom-sen et al. 2012). Likewise, catchment erosion in -creases water turbidity which can also retard sea-grass growth. Globally, seagrasses are declining atan accelerating rate (Waycott et al. 2009) with conse-quent detrimental impacts to many species thatdepend on them.
Coastal fishery productivity is also directly affectedby freshwater inflows. For example, Morrongiello etal. (2014) found that recruitment success and growthrate of an estuarine fish was strongly related to highfreshwater flows during the spawning season andduring the growing year. These results suggest thatflows play an important role in providing both aspawning cue and favourable conditions for larvalsurvival and juvenile and adult growth. Increasedrecruitment success and somatic growth subsequent -ly impacts the biomass of adults, and therefore fish-ery productivity (Bardos et al. 2006, Whitten et al.2013). While increased nutrients often positivelyinfluence ecosystem productivity, excessive nutrientinputs can promote harmful algal blooms (McCombet al. 1995). Further, sediment and phytoplankton-related increases in turbidity can negatively affectthe foraging success of visual predators (Abrahams &Kattenfeld 1997, Sohel et al. 2017). Reduced preyencounter rates and food acquisition can subse-quently affect individual growth and fitness. Riverflow can therefore affect the primary productivity ofthe foundation species, and drive the abundancesand reproductive success of all trophic levels, includ-ing key fisheries species.
Fishes have physiological tolerances that allowthem to live within a specific range of variation inenvironmental factors (Barton et al. 2002). Changesin environmental conditions, such as temperature,beyond this range can influence abundances and dis-tributions, and can be stressful or even fatal to fish(Roessig et al. 2004). In many species, a slight tem-perature increase may be initially beneficial as itresults in increased energy and therefore increasedgrowth (Takasuka & Aoki 2006). However, if temper-ature exceeds the optimal range for a particular spe-cies, it can be deleterious to growth (Wang & Over-gaard 2007). In coastal environments many fishesmay also be completely dependent on specific habi-tat, so their persistence in that ecosystem will depend
on the response of that habitat to fluctuations in tem-perature. Rainfall, nutrient upwelling and tempera-ture will all vary with wind patterns and ocean circu-lation, so average wind direction and oceanic indicescan also be important predictors of these 3 key envi-ronmental parameters affecting fish growth.
The effects of environmental change on coastalecosystem productivity, and in particular the growthrates and production of commercial resources incoastal ecosystems, have seldom been examined atlonger time-scales, probably due to the lack of goodlong-term monitoring in most such systems. Simi-larly, the importance of juvenile growth rates for fish-eries dynamics is increasingly understood (Cowan etal. 2000, Whitten et al. 2013), but the factors control-ling it have seldom been investigated at the timescales relevant to both fishery management and pre-dicting future climate change effects. A novel way toovercome the lack of longer term monitoring is to usefish otoliths as records of growth rates (Thresher etal. 2007, Black 2009, Matta et al. 2010, Morrongiello& Thresher 2015), and then relate these to availableenvironmental data records.
This study investigates the influence of 4 environ-mental factors — freshwater flows, temperature, wind,and the Southern Oscillation Index (SOI) — on thegrowth of the commercially important fish, rock flat-head Platycephalus laevigatus, in Corner Inlet, Vic-toria, Australia. We explore the environmental driv-ers of growth variation in this species using mixedeffects models to analyse otolith samples from 1982to 2014. We recreate a 32 yr growth biochronologyand partition growth into its intrinsic and extrinsiccomponents (Weisberg et al. 2010 Morrongiello &Thresher 2015). We then use these models to predictfish growth under a range of plausible future climatescenarios.
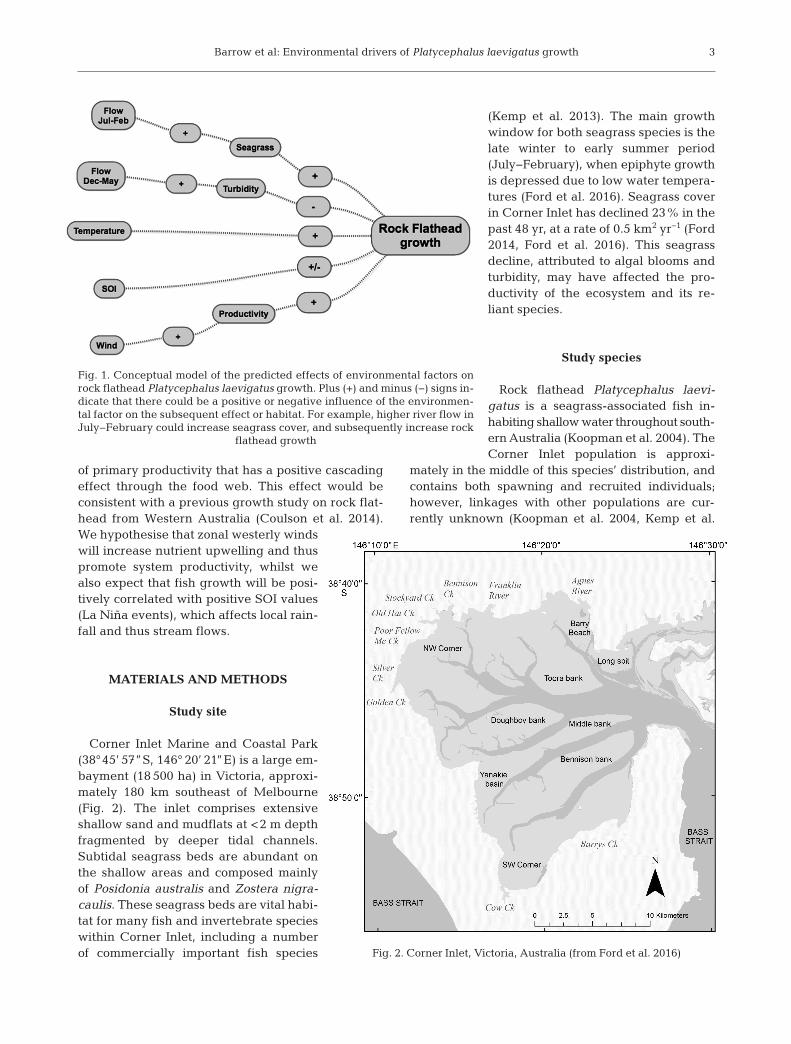
We expect that the growth of flathead will reflect acomplex integration of different physical processesand causal pathways (Fig. 1). We predict that fresh-water flow can affect growth via 2 distinct and oppos-ing mechanisms: increased flow during the periodJuly−February will provide critical nutrients for sea-grass and thus result in habitat expansion, which inturn will promote flathead growth. Conversely,higher flows during the period December−May (thefish growing period) will increase turbidity and limitthe efficacy of feeding, as flathead are ambush pred-ators. We expect that increased temperatures duringthe growing season will promote fish growth via adirect physio logical pathway (this population isapproximately in the middle of its range, so should befavoured by warming), or via an indirect promotion
2
Barrow et al: Environmental drivers of Platycephalus laevigatus growth
of primary productivity that has a positive cascadingeffect through the food web. This effect would beconsistent with a previous growth study on rock flat-head from Western Australia (Coulson et al. 2014).We hypothesise that zonal westerly windswill increase nutrient upwelling and thuspromote system productivity, whilst wealso expect that fish growth will be posi-tively correlated with positive SOI values(La Niña events), which affects local rain-fall and thus stream flows.
MATERIALS AND METHODS
Study site
Corner Inlet Marine and Coastal Park(38°45’ 57”S, 146° 20’ 21”E) is a large em -bayment (18 500 ha) in Victoria, approxi-mately 180 km southeast of Melbourne(Fig. 2). The inlet comprises extensiveshallow sand and mudflats at <2 m depthfragmented by deeper tidal channels.Subtidal seagrass beds are abundant onthe shallow areas and composed mainlyof Posidonia australis and Zostera nigra-caulis. These seagrass beds are vital habi-tat for many fish and invertebrate specieswithin Corner Inlet, including a numberof commercially important fish species
(Kemp et al. 2013). The main growthwindow for both seagrass species is thelate winter to early summer period(July−February), when epiphyte growthis de pressed due to low water tempera-tures (Ford et al. 2016). Seagrass coverin Corner Inlet has declined 23% in thepast 48 yr, at a rate of 0.5 km2 yr−1 (Ford2014, Ford et al. 2016). This seagrassdecline, at tributed to algal blooms andturbidity, may have affected the pro-ductivity of the ecosystem and its re -liant species.
Study species
Rock flathead Platycephalus laevi -gatus is a seagrass-associated fish in -habiting shallow water throughout south-ern Australia (Koopman et al. 2004). TheCorner Inlet population is approxi-
mately in the middle of this species’ distribution, andcontains both spawning and recruited individuals;however, linkages with other populations are cur-rently unknown (Koop man et al. 2004, Kemp et al.
3
Fig. 1. Conceptual model of the predicted effects of environmental factors onrock flathead Platycephalus laevigatus growth. Plus (+) and minus (−) signs in-dicate that there could be a positive or negative influence of the environmen-tal factor on the subsequent effect or habitat. For example, higher river flow inJuly− February could increase seagrass cover, and subsequently increase rock
flathead growth
Fig. 2. Corner Inlet, Victoria, Australia (from Ford et al. 2016)

Mar Ecol Prog Ser · Theme Section · Advance View
2013). Newly settled P. laevigatus spend the first partof their life on bare sand flats before moving into theseagrass beds as older juveniles and remaining thereas adults (Jenkins et al. 1993). In Corner Inlet, rockflathead constitutes approximately 23% by weight ofthe total fishery, and is one of the most valuable spe-cies along with King George whiting Sillaginodespunctatus and southern calamari Sepioteuthis aus-tralis (Kemp et al. 2013). Rock flathead, King Georgewhiting and southern calamari together contributeover AU$1.6 million of the total ‘off the boat’ value ofthe fishery, and are also important recreationally tar-geted species (Department of Primary Industries 2012).
Sample collection and estimation of ageand growth
Otoliths from 526 fish were collected from the com-mercial fishery over the period 1994−2014. One oto -lith from each fish was embedded in clear epoxyresin (EpoFix) in embedding moulds (14 × 5 × 6 mm).Using a low speed diamond saw (South Bay Technol-ogy Model 650) we cut a transverse section (~0.3 mm)through the core of the otolith (previously markedwith pencil under a microscope). The sections wereground and polished (using a South Bay TechnologyModel 920 lapping and polishing machine), thenmounted on a microscope slide. Digital images ofeach section were captured using a Canon EOS 60Ddigital camera attached to a compound microscope at×40 magnification.
Coulson et al. (2014) used marginal increment ana -lysis to show that a single opaque zone is laid downannually in otoliths of P. laevigatus throughout itslife. Therefore, opaque zones can be used to deter-mine the age of fish from this species. Using thesame method, Koopman et al. (2004) established thatopaque zones are laid down in December in Corner
Inlet rock flathead. We counted the opaque zones onthe dorsal side of the otolith to determine the age ofeach fish, taking into consideration the date that thefish were caught and the birth date of the species. De-spite individuals being found in spawning conditionin most months throughout the year, the main spawn-ing period of P. laevigatus in Victoria is be tween Sep-tember and February (Koopman et al. 2004). Thereforean arbitrary birthdate of December 1 was chosen tocorrespond with the middle of the spawning periodand the period of new increment formation.
We used Image Pro Plus software (v.6.3, Media -cybernetics) to measure growth increments on thesectioned otoliths. Measurements were taken of thedistances between the outer edges of each opaquezone, to determine the width of each consecutivegrowth increment (Fig. 3). We also measured the dis-tance between the otolith core and the periphery(outermost edge of the otolith). We used this meas-urement to compare otolith size and total fish length,ensuring that otolith growth is an appropriate proxyfor fish somatic growth (Fig. S1 in the Supplementat www.int-res. com/ articles/ suppl/ m12234_ supp. pdf).Measurements were restricted to increments afterthe second growth ring because the location of thefirst growth ring can reflect 8−14 mo of growthdepending on when an individual was spawned.
Statistical analyses
We investigated the sources of variation in annualgrowth of rock flathead (increment width in mm)using a mixed effects modelling framework. Modelscontained different combinations of fixed intrinsicpredictors (within-individual), fixed extrinsic predic-tors (environmental), and their interactions. Eachincrement width was treated as a separate responsesample, which resulted in 2145 total increment meas-
4
Fig. 3. Sectioned Platy-cephalus laevigatus oto -lith with 7 opaque zones,taken with transmittedlight. The white lineidentifies the axis alongwhich the age of theotolith was estimated,and the circles identifywhere measurements be -tween opaque zones were
taken

Barrow et al: Environmental drivers of Platycephalus laevigatus growth
urements. The issue of non-independence of incre-ments from the same fish was dealt with in the modelstructure as described below.
Intrinsic predictors
Fixed intrinsic predictors were sex, age of the fishat the time the growth increment was formed(AOG), and age at capture (AAC) (Table 1). Age atcapture was included in the data to test for any biasassociated with age selectivity in the samples(Morron giello et al. 2012). We introduced a randomintercept for FishID to induce a correlation amongincrement measurements and allow each fish tohave higher or lower growth than the model’sintercept, and to account for non-independence ofthe response data (Morrongiello & Thresher 2015).Similarly, increments formed by different fish in agiven year are also non-independent as the sam-pled fish were exposed to the same environmentalconditions. We included a random intercept forYear to induce a correlation among increments atthis level. We also investigated whether including arandom age slope for FishID (AOG|FishID) andYear (AOG|Year), would improve the fit of themodel (Table 2). These random slopes allow forindividual-specific differences in the growth−agerelationship, and year-dependent differences inage-specific growth.
Extrinsic predictors
We developed 4 environmental variables to test ourhypotheses about the drivers of variation in fishgrowth (Fig. 1). These fixed extrinsic factors includedthe temperature in that year (Temperature), nutrientinput from freshwater flows in the corresponding yearand the months leading up to that year (Flow), windstrength and direction in that year (Wind), and thesouthern oscillation index for that year (SOI) (Table 1;Figs. S2 & S3 in the Supplement). Mean maximumtemperature was available from a nearby weather sta-tion for the period between December and May, from1982−2014 (Bureau of Meteorology 2017). Air temper-ature was used as a proxy for sea temperature as the
5
Parameter Description Range Mean
Intrinsic factorsAOG Age at which the year of growth occurred 2−17 yr 4.5 yrAAC Age at which the fish was captured 2−17 yr 6.9 yrSex Male or female
Extrinsic factorsTemperature Average maximum temperature during the main 20.9−25.3°C 23.2°C
growth period (Dec−May)Flow River flow from the Agnes and Franklin rivers
during seagrass growth (Jul−Feb) and flathead July−Feb highest 10%: 100.8−1912.3 Ml 646.9 Mlgrowth (Dec−May) of the previous year. July−Feb median: 18.8−125.1 Ml 74.8 MlCalculated as mean of highest 10% of flows Dec−May highest 10%: 44.7−1173.5 Ml 341.94 Mlper year, and median flow. Dec−May median: 8.1−29.7 Ml 29.7 Ml
Wind Zonal westerly wind index, based on direction −70.4−465.4 184.7and strength of winds
SOI Monthly Southern Oscillation Index −1.2−19.7 −1.2
Random factors1|Year Year that the increment was formed1|FishID Unique code which identifies each fishAOG|X Random age slope for X (FishID and Year random intercepts)
Table 1. Descriptions of intrinsic (within-individual), extrinsic (environmental) and random factors used in rock flathead Platy-cephalus laevigatus growth analysis, with ranges and means of measured values (where applicable)
Random effects models df ΔAIC AIC LLweight
AOG|FishID + AOG|Year 11 0 1 753.49AOG|FishID + 1|Year 9 82.16 0 710.391|FishID + 1|Year 9 127.23 0 687.861|FishID + AOG|Year 7 199.76 0 649.58
Table 2. Model selection results for random effects struc-tures of rock flathead Platycephalus laevigatus annualgrowth. Models included the maximal fixed effect structureof AOG × Sex. Columns are: degrees of freedom (df), differ-ence in Akaike’s information criterion (AIC) value (ΔAIC),
AIC weight, and restricted log likelihood (LL)

Mar Ecol Prog Ser · Theme Section · Advance View
latter data were not available (correlation between airtemperature and sea surface temperature in nearbyPort Phillip Bay; r = 0.71) (NOAA 2015). Daily temper-ature data were then averaged over the fish growingseason (December−May).
Daily river flows (Ml) were available for theFranklin River and Agnes River, the main tributariesinto Corner Inlet (Department of Environment, Land,Water and Planning 2015). Higher freshwater flowsdeliver nutrients to estuaries and coastal waters usedby seagrasses, encouraging frond rejuvenation. Sea-grass growth typically occurs when the temperaturebegins to warm in spring (Ford et al. 2016). The meanof the top 10% of river flows per year (representingthe quantity of water during large flow events), andthe median flows (representing annual variation inaverage flow conditions) were calculated for 2 timeperiods: from July when the seagrass has declinedover the winter until the end of February when theseagrass is typically rejuvenated, and also over themain fish growing period (December−May). We usedthe mean of the top 10% as an arbitrary high per-centage of flows instead of a Q10 value (flow which isexceeded 10% of the time), as it was a more accuraterepresentation of the extent of large flow events thatwere not as well captured by the Q10 value.
Wind can have an important influence on oceancurrent patterns off the Victorian coast, and thereforethe ocean input into bays and inlets along the south-ern coast (Hamer et al. 2010). The methods for devel-oping a zonal westerly wind (ZWW) index are out-lined in Hamer et al. (2010). In this study, we usedaverage ZWW from the main fish growing period(December−May) as the environmental indicator.
The Southern Oscillation Index (SOI) is a measureof El Niño Southern Oscillation events that repre-sents regional climate variability by quantifying ElNiño and La Niña events in the Pacific Ocean (Bu -reau of Meteorology 2017). Negative values (El Niñoevents) are typically associated with warmer sea sur-face temperatures and drier regional conditions. Pos-itive values (La Niña events) are typically associatedwith cooler sea surface temperatures and higherprobability of rainfall (Bureau of Meteorology 2017).
Model comparisons
To satisfy model assumptions, we log-transformedthe growth (increment width), AOG and AAC data.The predictor variables were centered to facilitatemodel convergence and interpretation of interactionand polynomial terms (Morrongiello & Thresher
2015). Firstly, we created a base model includingAOG and AAC and explored different random effectstructures (using restricted maximum likelihood esti-mation, REML). We then compared models with andwithout AAC using maximum likelihood (ML). Com-peting random effect and then intrinsic effect modelswere then ranked using Akaike’s information crite-rion corrected for small sample size (AICc), and thedifference between the best model (lowest AICc) andeach other model (ΔAIC) (Morrongiello & Thresher2015). The best fitting of these models would becomethe base model for introducing the fixed extrinsic fac-tors (Morrongiello et al. 2014).
Building on this base model, we fitted a series ofmodels with different combinations of extrinsic fac-tors and their interactions with AOG. These inter -action terms allow for age-dependent growth res -ponses to environmental variables. Competingmodels were fit using ML and ranked using AICc andΔAICc values. The best model was then refitted withREML to produce unbiased parameter estimates(Zuur et al. 2009). In addition, we calculated condi-tional (all factors) R2 values for the best models. ThisR2 value describes the proportion of variation ingrowth described by all factors in the model (Naka-gawa & Schielzeth 2013). Models were fit using thelme4 package (Bates et al. 2015) in the program R(v. 0.98.977) (R Core Team 2014). Models were com-pared using the AICcmodavg package (Mazerolle2015), and predictions and confidence intervals gen-erated using the arm and Effects packages (Fox 2003,Gelman & Hill 2006).
Climate change scenarios
We predicted rock flathead growth, using the bestfitting model under 3 possible climate change scenar-ios: 2030, 2055/70 (high emissions), 2055/70 (lowemissions) (Stocker 2014). Projections were esti-mated as a change relative to the baseline period1986−2005. We used the median values of predictedtemperature change for Gippsland, Victoria, for2030, 2070 (high emissions) and 2070 (low emis-sions). The ranges exclude the upper and lower 10%of results (CSIRO & Bureau of Meteorology 2015).Changes to river flow were estimated using the meanof our flow parameter values (top 10% July−Febru-ary) from between 1986−2005 as a baseline. We usedthe flow estimation model for South Gippsland, Vic-toria, from Jones & Durack (2005) to estimate themedian percentage change to mean flows for 2030and 2055. We used the third lowest and third highest
6

Barrow et al: Environmental drivers of Platycephalus laevigatus growth
values of 10 climate model predic-tions for 2030 and 2055 to indicate therange of values (Jones & Durack2005). We converted the percentagechange in flows predicted by themodel to estimate actual changes toflow relative to our 1986−2005 base-line flow.
RESULTS
Intrinsic and random factors
The increment widths on a total of526 otoliths were measured, resultingin 2145 individual increment meas-urements, dating from 1982 to 2014.The best intrinsic effect model in -cluded an AOG × Sex interaction,with random AOG slopes for Yearand FishID (Table 2). Growth de -clined with age, with females havingfaster growth later in life than males(>5 yr old) (Fig. 4). We plotted theYear random intercepts from the bestmodel to visualise temporal patternsin growth (Fig. 5). Rock flathead dis-played a high variation in growthover time. There was a period ofstrong growth from 1995 to 2001, thena poor growth period between 2002and 2006. 2010 was a strong growthyear, but it was immediately followedby a poor growing year in 2011.
Extrinsic factors
The best extrinsic effects modelincluded additive effects of tempera-ture in the fish growing seasons(December−May) and high flow dur-ing the seagrass growing season(highest 10% flows in July−February)(Table 3). This model had an AICweight of 0.41, compared to weightsof 0.11, 0.06 and 0.05 of the next bestfitting models (Table 4). The best fit-ting model reflects that rock flatheadgrowth increased as freshwater in -flows increased in the months that theseagrass rejuvenates with rising tem-
7
Parameter Estimate SE 5% CI 95% CI t
Intrinsic factorsIntercept −2.672 0.0129 −2.694 −2.651 −206.28Age −1.004 0.0286 −1.051 −0.958 −35.07Sex (F) 0.0889 0.0127 0.068 0.110 6.99Age × Sex 0.124 0.0225 0.086 0.163 5.51
Extrinsic factorsTemperature 0.0298 0.0111 0.011 0.049 2.68Flow (Highest 10% Jul−Feb) 0.00008 0.00003 0.00003 0.0001 2.83
Table 3. Parameter estimates (with SE), 95% confidence intervals and test statistic (t ) from the best-fit model of rock flathead Platycephalus laevigatus
annual growth
Fig. 4. Predicted growth of male (dark grey) and female (light grey) rock flat-head Platycephalus laevigatus otolith increments (mm) at each age of growth
(years). Shaded areas are 95% confidence intervals
Fig. 5. Variation in predicted annual growth (accounting for intrinsic effects)of rock flathead Platycephalus laevigatus, represented by year random effect

Mar Ecol Prog Ser · Theme Section · Advance View
peratures (July− February) (Fig. 6). Rock flatheadgrowth also in creased in warmer fish growing sea-sons (December−May) (Fig. 7). Temperature andriver flow were negatively correlated (r = −0.63), yetgrowth appears to be enhanced by increases in bothfactors, which suggests that any correlation has notobscured the influence of either factor.
Climate change scenarios
We predict that mean annual growth of2 yr old rock flathead in 2030 will in -crease by 2.46% as temperature in -creases and river flow decreases. In 2070under a low emissions scenario, we pre-dict that growth will increase by 3.58%.In 2070 under a high emissions scenario,we predict that growth will in crease by6.67% (Fig. 8).
DISCUSSION
Annual growth of rock flathead in Corner Inletwas significantly influenced by environmental fac-tors. Growth was higher in periods following largerriver flows and likely represents a response tonutrient-rich river flow stimulating productivitythrough the seagrass food web. High temperaturesduring summer and autumn also increased thegrowth of all individuals in the population. Ourmodel explicitly incorporates both intrinsic and ex -trinsic sources of growth variation and allows man-agers to identify whether changes in fish stocksare likely to be related to environmental or fishingfactors.
Intrinsic factors
Age (AOG) explained a substantial amount of thevariation in growth and reflects the commonly ob -served pattern of fish growth decreasing when indi-viduals get older. The significant interactionbetween age and sex was also expected. There wasno effect of sex on growth in young individuals(<5 yr), but in older fish (>5 yr) females exhibitedsignificantly larger growth than males. This is con-sistent with previous studies on P. laevigatus andtiger flathead P. richardsoni (Koopman et al. 2004,Morrongiello & Thresher 2015). It is beneficial forfemale fish to grow faster and larger than male fishso that they can accommodate more eggs during thespawning period (Koopman et al. 2004). In most fishthe growth of males and their growth efficiencydeclines more than females after maturity, perhapsbecause they are more active in finding and dis-playing to mates (Henderson et al. 2003, Pauly2010). These behaviours have been observed inother related species in the Platycephalidae family(Shinomiya et al. 2003).
8
Model’s extrinsic factors df ΔAIC AIC LL R2
weight
Temperature + Flow 13 0 0.41 770.39 0.938(highest 10% Jul−Feb)
Flow (highest 10% Jul−Feb) + Wind 13 2.70 0.11 769.04 0.938Wind 12 3.89 0.06 767.44 0.938Flow (highest 10% Jul−Feb) 12 4.07 0.05 767.34 0.938
Table 4. Overall best fitting models of rock flathead Platycephalus laevigatusannual growth including intrinsic, random and extrinsic factors, after a com-parison of AICc values. Columns are degrees of freedom (df), difference inAIC value (ΔAIC), AIC weight, maximised log likelihood (LL) and the R2 value
500
0.085
0.080
0.075
0.070
0.065
0.060
1000 1500
River flow (Ml)
Pre
dic
ted
gro
wth
(mm
)
21 22 23 24 25Temperature (°C)
0.080
0.075
0.070
0.065
Pre
dic
ted
gro
wth
(mm
)
Fig. 6. Predicted otolith incremental growth (mm) and con -fidence intervals of rock flathead Platycephalus laevigatus
with fresh-water river flows
Fig. 7. Predicted otolith incremental growth (mm) and confi-dence intervals of rock flathead Platycephalus laevigatus
in increasing temperatures (°C)

Barrow et al: Environmental drivers of Platycephalus laevigatus growth
Environmental influences on fish growth
Rock flathead growth was positively influencedby increased river flow which we hypothesise stim-ulates productivity in the seagrass ecosystem. It iswell understood that estuarine and coastal ecosys-tems are more productive than areas distant fromthe coast (Whitfield 1996). This productivity is oftendriven by the availability of nutrients from nutrient-rich river flows (Caddy & Bakun 1994) and subse-quently cascades up the food web to predators suchas rock flathead (Edgar & Shaw 1995). Corner Inletis a seagrass dominated environment. This seagrasspredominantly grows during spring and summer, soincreased nutrient input from the rivers at this timemay especially enhance productivity of the seagrassecosystem and increase abundances of prey. Exces-sive nutrient input from river inflows, however, issuspected to lead to algal blooms and thus seagrassdecline (Ford et al. 2016). In spite of this, we foundno evidence of a negative impact of higher flow lev-els on rock flathead growth, and thus a hump-shaped relation of growth to flow. One possibility isthat the fishery catches were focused on areas that
retained good seagrass habitat. The impacts of highnutrients on the health of seagrass and consequentlyon species inhabiting the seagrass deserve furtherinvestigation.
Increased temperatures during the main growthperiod (December−May) resulted in increased fishgrowth. As fish are ectothermic, their metabolic ratevaries with the external water temperature. Withinthe range of temperatures that fish are exposed to,species will have an optimal range in which theirmetabolism is enhanced (Christie & Regier 1988).Increases in temperature (within the optimal range)can result in a direct increase in growth, throughallocation of enhanced energy (Fry 1971). Our resultsare consistent with those from a previous growthstudy on rock flathead (Coulson et al. 2014). As Cor-ner Inlet is in the middle of rock flathead’s distribu-tion, we expect that warming water will promote fishgrowth. Similar patterns have been observed in amulti-population analysis of the related tiger flatheadP. richarsoni (Morrongiello & Thresher 2015). In -reased temperatures can also improve the productiv-ity of the seagrass ecosystem (Masini et al. 1995), andthus indirectly promote rock flathead growth via
9
Flow (Ml)
Tem
per
atur
e (°
C)
Pre
dic
ted
gro
wth
(mm
)
23
24
25
26
27
400 600 800
0.064
0.062
0.0660.068
0.070
0.072
0.074
0.076
0.060
0.065
0.070
0.075
0.080
Fig. 8. Predicted otolith incremental growth (mm) and confidence intervals of rock flathead Platycephalus laevigatus in cur-rent temperatures and productivity (1986−2005) and under 3 climate change scenarios: current baseline (black), 2030 (red),
2070 + low emissions (green), 2070 + high emissions (blue)

Mar Ecol Prog Ser · Theme Section · Advance View
increases in food. It is possible that increases in rockflathead growth with warming water represents acombination of both direct metabolic and indirectfood web mechanisms.
Climate change scenarios
We predict that rock flathead growth rates willincrease in the future. Warmer temperatures associ-ated with climate change may be slightly offset by asimultaneous decrease in flow, though in general themagnitude of the temperature effect is greater andwould be expected to have a stronger impact ongrowth (Fig. 8) (Jones & Durack 2005, CSIRO &Bureau of Meteorology 2015). While the future pro-ductivity of the fishery may be enhanced by in -creased fish growth, it is important to remember thatrock flathead are reliant on the seagrass ecosystemfor both habitat and nutrition. Future seagrass de -clines that occur due to changes in flow or even inde-pendently of climate (Ford et al. 2016), will likelyhave strong impact on fish growth. Further study isrequired to understand the cumulative impacts thatanthropogenic and climate driven environmentalchange have on the seagrass ecosystem.
Whilst we think our predictions of enhancedgrowth with warming are robust, they do not accountfor changed frequency and intensity of extremeevents (e.g. marine heatwaves and unpredictableflooding events; Hobday et al. 2016) that can impactbiological systems (Wernberg et al. 2013). Predictedchanges in mean temperature for 2030 and 2070 (lowemissions) are both within the observed temperaturerange of the study, while the predicted temperaturefor 2070 (high emissions) exceeds the highest yearlymean temperature by 0.82°C. Nonetheless, dailytemperatures often exceed this value, so that we areconfident that predicted temperatures will not ex -ceed physiological tolerances for rock flathead. Thevalues for predicted changes in river flow, and there-fore nutrient input into Corner Inlet, are well withinthe observed range of river flows. Rock flathead havetherefore already been exposed to all of the pre-dicted temperatures and river flow scenarios.
Implications for the fishery and ecosystem management
Our study indicates that freshwater flows thatenhance the productivity of the seagrass ecosystemstimulate the growth of rock flathead. This informa-
tion is important for fisheries and ecosystem man-agers because it provides clear empirical evidencefor the need to appropriately manage catchmentproces ses and water extraction to ensure fisheriesproduction is maintained. Such an ecosystem-basedmanagement approach is increasingly being em -ployed to ensure the ongoing sustainable manage-ment of fisheries worldwide. Future work needs tofocus on understanding the drivers of poor waterquality, seagrass declines and how seagrass-inhabit-ing species are impacted, so that practical strategiescan be put in place to promote recovery (e.g. manag-ing the terrestrial impacts on the content of freshwater flows, seagrass transplantation). We also needto understand the mechanisms driving growth andsuccessful recruitment of other commercially impor-tant species in Corner Inlet, to make informed deci-sions that will benefit all major species within thefishery.
Acknowledgements. All collection of specimens and fieldsurvey methods were carried out with the permission of theDepartment of Environment, Land, Water and PlanningNational Parks Act 1975 Research Permit (permit no.10007406) and the Department of Environment and PrimaryIndustries Fisheries Act 1995 Permit (permit no. RP1135).We thank Fisheries Victoria for their help supplying us withhistorical samples. We thank Gary Cripps and Ray Dunstonefor boating support and providing some recent samples. Wealso thank Neville Clarke, Brett Cripps, Wayne Cripps, andLachie and Alice from Foster Seafood for providing addi-tional recent samples for this project.
LITERATURE CITED
Abrahams MV, Kattenfeld MG (1997) The role of turbidity asa constraint on predator−prey interactions in aquaticenvironments. Behav Ecol Sociobiol 40: 169−174
Alongi DM (1998) Coastal ecosystems processes. CRC Press,Boca Raton, FL
Bardos DC, Day RW, Lawson NT, Linacre NA (2006) Dynam-ical response to fishing varies with compensatory mech-anism: an abalone population model. Ecol Model 192: 523−542
Barton BA, Morgan JD, Vijayan MM (2002) Physiologicaland condition related indicators of environmental stressin fish. In: Adams SM (ed) Biological indicators of eco -system stress. American Fisheries Society, Bethesda,MD, p 111−148
Bates D, Maechler M, Bolker B, Walker S (2015) Fitting linear mixed-effects models using lme4. J Stat Softw 67: 1−48
Black BA (2009) Climate-driven synchrony across tree,bivalve, and rockfish growth-increment chronologies ofthe northeast Pacific. Mar Ecol Prog Ser 378: 37−46
Bureau of Meteorology (2017) Climate data online. Bureauof Meteorology. www.bom.gov.au/climate/data/ (acces -sed 25 May 2017)
Butler A, Jernakoff P (1999) Seagrass in Australia. Strategic
10

Barrow et al: Environmental drivers of Platycephalus laevigatus growth
review and development of an R&D plan. CSIRO Pub-lishing, Collingwood
Caddy JF, Bakun A (1994) A tentative classification ofcoastal marine ecosystems based on dominant processesof nutrient supply. Ocean Coast Manage 23: 201−211
Christie GC, Regier HA (1988) Measures of optimal thermalhabitat and their relationship to yields for four commer-cial fish species. Can J Fish Aquat Sci 45: 301−314
Coulson PG, Black BA, Potter IC, Hall NG (2014) Scle-rochronological studies reveal that patterns of otolithgrowth of adults of two co-occurring species of Platy-cephalidae are synchronized by water temperature vari-ations. Mar Biol 161: 383−393
Cowan JH Jr, Rose KA, De Vries DR (2000) Is density-dependent growth of young-of-the-year fishes a questionof critical weight? Rev Fish Biol Fish 10: 61−89
CSIRO and Bureau of Meteorology (2015) Climate changein Australia: information for Australia’s Natural Re -source Management Regions. Technical Report, CSIROand Bureau of Meteorology. https:// www. environment.gov. au/ system/ files/pages/61971ba0-0847-4fef-846e-36d6b706a7a5/ files/corner-inlet-fishery-corner-inlet-nooramunga-fishery-assessment.pdf
Department of Environment, Land, Water and Planning(2015) Water Measurement Information System, De -partment of Environment, Land, Water and Planning,Melbourne. http: //data.water.vic.gov.au/monitoring. htm(ac cessed 1 August 2015)
Department of Primary Industries (2012) Fisheries Victoriacommercial fish production information bulletin 2012.Fisheries Victoria, Queenscliff
Edgar GJ, Shaw C (1995) The production and trophic ecol-ogy of shallow-water fish assemblages in southern Aus-tralia II. Diets of fishes and trophic relationships betweenfishes and benthos at Western Port, Victoria. J Exp MarBiol Ecol 194: 83−106
Ellison AM, Bank MS, Clinton BD, Colburn EA and others(2005) Loss of foundation species: consequences for thestructure and dynamics of forested ecosystems. FrontEcol Environ 3: 479−486
FAO (2016) The state of world fisheries and aquaculture2016. FAO, Rome
Ford JR (2014) A review of the chemical toxicant threats toseagrass in Corner Inlettoria. Report to the West Gipps-land Catchment Management Authority, as part of Fish-eries Research Development Corporation Project 13/021,Melbourne
Ford JR, Williams RJ, Fowler AM, Cox DR, Suthers IM(2010) Identifying critical estuarine seagrass habitat forsettlement of coastally spawned fish. Mar Ecol Prog Ser408: 181−193
Ford JR, Barclay K, Day RW (2016) Using local knowledge tounderstand and manage ecosystem-related decline infisheries productivity. Fisheries Research and Develop-ment Corporation Final Project Report, Melbourne. http://frdc.com.au/research/Final_reports/2013-021-DLD. pdf
Fox J (2003) Effect displays in R for generalised linear mod-els. J Stat Softw 8: 1−27
Fry FEJ (1971) 1 —The effect of environmental factors onthe physiology of fish. Fish Physiol 6: 1−98
Gelman A, Hill J (2006) Data analysis using regression andmultilevel/hierarchical models. Cambridge UniversityPress, New York, NY
Halpern BS, Walbridge S, Selkoe KA, Kappel CV and others(2008) A global map of human impact on marine ecosys-
tems. Science 319: 948−952Hamer P, Jenkins G, Kemp J (2010) Linking key environ-
mental and life history indicators for monitoring andassessment of bay and inlet fisheries in Victoria. Fish-eries Victoria Research Report Series No. 44, Melbourne
Harley CD, Randall Hughes A, Hultgren KM, Miner BG andothers (2006) The impacts of climate change in coastalmarine systems. Ecol Lett 9: 228−241
Henderson BA, Collins N, Morgan GE, Vaillancourt A (2003)Sexual size dimorphism of walleye (Stizostedion vitreumvitreum). Can J Fish Aquat Sci 60: 1345−1352
Hobday AJ, Alexander LV, Perkins SE, Smale DA and others(2016) A hierarchical approach to defining marine heat-waves. Prog Oceanogr 141: 227−238
Jenkins GP, Hammond LS, Watson GF (1993) Patterns ofutilisation of seagrass (Heterozostera) dominated habi-tats as nursery areas by commercially important fish.Victorian Institute of Marine Sciences, Report No. 19.Queenscliff
Jenkins GP, May HMA, Wheatley MJ, Holloway MG (1997)Comparison of fish assemblages associated with sea-grass and adjacent unvegetated habitats of Port PhillipBay and Corner Inlet, Victoria, Australia, with emphasison commercial species. Estuar Coast Shelf Sci 44: 569−588
Jones RN, Durack PJ (2005) Estimating the impacts of cli-mate change on Victoria’s runoff using a hydrologicalsensitivity model. CSIRO Atmospheric Research, Mel-bourne
Kemp J, Brown L, Bruce T, Bridge N, Conron S (2013) Cor-ner Inlet and Nooramunga Fishery Assessment 2012.Fisheries Victoria Assessment Report Series No. 68.Department of Primary Industries, Queenscliff
Klumpp DW, Nichols PD (1983) A study of food chains inseagrass communities II. Food of the rock flathead, Platycephalus laevigatus Cuvier, a major predator in aPosi donia australis seagrass bed. Mar Freshw Res 34: 745−754
Koopman M, Morison AK, Troynikov VS (2004) Populationdynamics and assessment of sand and rock flathead inVictorian waters. FRDC Report 2000/120. Department ofPrimary Industries, Queenscliff
Masini RJ, Cary JL, Simpson CJ, McComb AJ (1995) Effectsof light and temperature on the photosynthesis of tem-perate meadow-forming seagrasses in Western Aus-tralia. Aquat Bot 49: 239−254
Matta ME, Black BA, Wilderbuer TK (2010) Climate-drivensynchrony in otolith growth-increment chronologies forthree Bering Sea flatfish species. Mar Ecol Prog Ser 413: 137−145
Mazerolle MJ (2015) AICcmodavg: Model selection andmultimodel inference based on (Q)AIC(c). R packageversion 2.0-3. https://cran.r-project.org/web/packages/AICcmodavg/ AICcmodavg.pdf
McComb AJ, Atkins RP, Birch PB, Gordon DM, LukatelichRJ (1995) The Peel−Harvey estuarine system, WesternAustralia. In: McComb AJ (ed) Eutrophic shallow estuar-ies and lagoons. CRC Press, London, p 5−17
Morrongiello JR, Thresher RE (2015) A statistical frameworkto explore ontogenetic growth variation among individu-als and populations: a marine fish example. Ecol Monogr85: 93−115
Morrongiello JR, Thresher RE, Smith DC (2012) Aquaticbiochronologies and climate change. Nat Clim Chang 2: 849−857
Morrongiello JR, Walsh CT, Gray CA, Stocks JR, Crook DA
11

Mar Ecol Prog Ser · Theme Section · Advance View
(2014) Environmental change drives long term recruit-ment and growth variation in an estuarine fish. GlobChange Biol 20: 1844−1860
Nakagawa S, Schielzeth H (2013) A general and simplemethod for obtaining R2 from generalized linear mixedeffects models. Methods Ecol Evol 4: 133−142
NOAA (2015) NOAA high resolution SST data. NOAA/OAT/ ESRL PSD, Boulder, CO. http:// www. esrl.noaa.gov/ psd/
Orth RJ, Carruthers TJ, Dennison WC, Duarte CM and oth-ers (2006) A global crisis for seagrass ecosystems. Bio-science 56: 987−996
Pauly D (2010) Gasping fish and panting squids: oxygen,temperature and the growth of water-breathing animals.In: Kinne O (ed) Excellence in ecology, Book 22. Interna-tional Ecology Institute, Oldendorf/Luhe
Poloczanska ES, Burrows MT, Brown CJ, García Molinos Jand others (2016) Responses of marine organisms to cli-mate change across oceans. Front Mar Sci 3: 62
R Core Team (2014) R: A language and environment for statistical computing. R Foundation for Statistical Com-puting, Vienna
Roessig JM, Woodley CM, Cech JJ Jr, Hansen LJ (2004)Effects of global climate change on marine and estuarinefishes and fisheries. Rev Fish Biol Fish 14: 251−275
Shinomiya A, Yamada M, Sunobe T (2003) Mating systemand protandrous sex change in the lizard flathead,Inegocia japonica (Platycephalidae). Ichthyol Res 50: 383−386
Sohel S, Mattila J, Lindström K (2017) Effects of turbidity onprey choice of three-spined stickleback Gasterosteusaculeatus. Mar Ecol Prog Ser 566: 159−167
Stocker T (ed) (2014) Climate change 2013: the physical sci-ence basis: Working Group I contribution to the Fifth
assessment report of the Intergovernmental Panel on Cli-mate Change. Cambridge University Press, Cambridge
Takasuka A, Aoki I (2006) Environmental determinants ofgrowth rates for larval Japanese anchovy Engraulisjaponicus in different waters. Fish Oceanogr 15: 139−149
Thomsen MS, Wernberg T, Engelen AH, Tuya F and others(2012) A meta-analysis of seaweed impacts on sea-grasses: generalities and knowledge gaps. PLOS ONE 7: e28595
Thresher RE, Koslow JA, Morison AK, Smith DC (2007)Depth-mediated reversal of the effects of climate changeon long-term growth rates of exploited marine fish. ProcNatl Acad Sci USA 104: 7461−7465
Wang T, Overgaard J (2007) The heartbreak of adapting toglobal warming. Science 315: 49−50
Waycott M, Duarte CM, Carruthers TJ, Orth RJ and others(2009) Accelerating loss of seagrasses across the globethreatens coastal ecosystems. Proc Natl Acad Sci USA106: 12377−12381
Weisberg S, Spangler G, Richmond LS (2010) Mixed effectsmodels for fish growth. Can J Fish Aquat Sci 67: 269−277
Wernberg T, Smale DA, Tuya F, Thomsen MS and others(2013) An extreme climatic event alters marine eco -system structure in a global biodiversity hotspot. NatClim Chang 3: 78−82
Whitfield AK (1996) Fishes and the environmental status ofSouth African estuaries. Fish Manag Ecol 3: 45−57
Whitten AR, Klaer NL, Tuck GN, Day RW (2013) Accountingfor cohort-specific variable growth in fisheries stockassessments: a case study from south-eastern Australia.Fish Res 142: 27−36
Zuur AF, Ieno EN, Walker NJ, Saveliev AA, Smith GM(2009) Mixed effects models and extensions in ecologywith R. Springer, New York, NY
12
Editorial responsibility: Stylianos Somarakis, Heraklion, Greece
Submitted: March 17, 2017; Accepted: June 21, 2017Proofs received from author(s): August 25, 2017