environmental burden of cancer in ontario - public health … · executive summary overview...
TRANSCRIPT
Environmental Burden of Cancer in Ontario

Published by Cancer Care Ontario and Public Health OntarioCancer Care Ontario 620 University Avenue Toronto, Ontario M5G 2L7 Telephone: 416 971 9800 www.cancercare.on.ca
Public Health Ontario 480 University Avenue, Suite 300 Toronto, Ontario M5G 1V2 Telephone: 647 260 7100 www.publichealthontario.ca
© Queen’s Printer for Ontario, 2016 ISBN 978-1-4606-8366-8 Print ISBN 978-1-4606-8367-5 PDF
Permission to reproduceExcept as otherwise specifically noted, the information in this publication may be reproduced, in part or in whole and by any means, without charge or further permission for non-commercial purposes, provided that due diligence is exercised in ensuring the accuracy of the information reproduced; that Cancer Care Ontario and Public Health Ontario are identified as the source institutions; and that the reproduction is not represented as an official version of the information reproduced, nor as having been made in affiliation with, or with the endorsement of, Cancer Care Ontario and Public Health Ontario.
For permission to reproduce the information in this publication for commercial redistribution, please email [email protected] or [email protected].
How to cite this publicationCancer Care Ontario, Ontario Agency for Health Protection and Promotion (Public Health Ontario). Environmental Burden of Cancer in Ontario. Toronto: Queen’s Printer for Ontario; 2016.
This report and other associated supplemental materials are available at www.cancercare.on.ca/environmentreport or www.publichealthontario.ca/environmentalcancer.
Need this information in an accessible format? 1-855-460-2647 / TTY (416) 217-1815 [email protected] 647-260-7100 [email protected]

This report was prepared by:
Population Health and Prevention, Cancer Care OntarioStephanie Young, MPH
Elisa Candido, MPH
Penney Kirby, MISt
Julie Klein-Geltink, MHSc
Sandrene Chin Cheong, BA
Alice Peter, MA, MBA
Environmental and Occupational Health, Public Health OntarioElaina MacIntyre, PhD
Sue Greco, ScD
Stanley Ing, MPH
Nicole Somers, MPH
Jin Hee Kim, MD, MPH
Jia Hu, MD
Ray Copes, MD, MSc
Occupational Cancer Research Centre, Cancer Care OntarioPaul Demers, PhD
The authors thank the following members of the Scientific Advisory Committee for providing guidance on the analytical approach and interpretation of the findings:
Rick Burnett, PhD Health Canada
Perry Hystad, PhD Oregon State University
Chris McLeod, PhD University of British Columbia
Eleanor Setton, PhD University of Victoria
Paul Villeneuve, PhD Carleton University
The authors thank the following individuals for providing comments on earlier drafts or specific sections of this report:
Maria Chu, Shelley Harris, Loraine Marrett, Steven Savvaidis Cancer Care Ontario
Robert Dabeka, Pat Rasmussen Health Canada
Daniel Krewski McLaughlin Centre for Population Health Risk Assessment, University of Ottawa
Robert Blenkinsop, Bruce Keown Ontario Ministry of Agriculture, Food and Rural Affairs
Brittany Milton Risk Sciences International
Ronald MacFarlane Toronto Public Health
Nicholas Birkett University of Ottawa
Helen Doyle York Region Public Health
The authors thank Jenny Lass of Prevention and Cancer Control, Cancer Care Ontario for copy editing this report. Additional thanks to medical residents in Environmental and Occupational Health, Public Health Ontario who assisted with various aspects of the analysis.
1Environmental Burden of Cancer in Ontario

Environmental Burden of Cancer in Ontario, jointly produced by Cancer Care Ontario and Public Health Ontario, is the fifth report in Cancer Care Ontario’s Cancer Risk Factors in Ontario series.
The first report in the series summarized the epidemiologic evidence for a wide range of cancer risk factors, while the next three reports provided information on the prevalence, distribution and related cancer risk of several behavioural risk modifiers (tobacco; alcohol; and healthy weights, healthy eating and active living).
Environmental Burden of Cancer in Ontario examines exposure to environmental carcinogens in Ontario and the associated burden of cancer. The term “environmental carcinogens” can encompass all non-genetic carcinogens, such as lifestyle risk factors and biological agents. This report, however, focuses only on chemical carcinogens and carcinogenic
radiation that Ontarians are exposed to daily in their homes and communities. Exposures to carcinogens in the workplace will be the subject of a separate report.
This report aims to provide a comprehensive assessment of the environmental burden of cancer in Ontario from 23 environmental carcinogens in five environmental sources (outdoor and indoor air, indoor dust, drinking water and food). Each of the 23 environmental carcinogens addressed has been classified as “carcinogenic” or “probably carcinogenic” to humans by the International Agency for Research on Cancer, a specialized cancer agency of the World Health Organization that works to identify causes of cancer.
The Ontario-specific estimates of the annual environmental burden of cancer presented in this report provide decision-makers with information to support evidence-based priority-setting. This report also identifies gaps in the availability and utility of exposure data on environmental carcinogens in Ontario. Finally, it highlights policy opportunities for reducing population-level exposure to environmental carcinogens.
Linda Rabeneck, MD MPH FRCPC Vice-President, Prevention and Cancer Control Cancer Care Ontario
Ray Copes, MD MScChief, Environmental and Occupational Health Public Health Ontario
Foreword
„Environmental Burden of Cancer in Ontario examines exposure to environmental carcinogens in Ontario and the associated burden of cancer.
2 Foreword

Key messages
What was done § This report estimates the annual number of cancer cases from 23 environmental carcinogens that Ontarians are exposed to by being in the sun, breathing indoor and outdoor air, eating food, drinking water and ingesting indoor dust.
§ This is termed the "environmental burden of cancer."
§ The analysis accounted for a plausible range in each of the inputs where possible.
§ The results are presented as a plausible range of annual cancer cases for each carcinogen.
What was found § There are between 3,540 and 6,510 new cancer cases each year in Ontario from exposure to these 23 carcinogens.
§ Three carcinogens are associated with over 90 per cent of the environmental burden of cancer in Ontario:
- solar ultraviolet radiation (2,090 to 2,990 cancer cases per year);
- radon, a naturally occurring gas that can build up in lower levels of buildings (1,080 to 1,550 cancer cases per year); and
- fine particulate matter, an air pollutant that arises from combustion sources (290 to 900 cancer cases per year).
§ Eight other carcinogens have an estimated burden of 10 or more cancer cases per year: arsenic, acrylamide, diesel particulate matter, asbestos, formaldehyde, second-hand smoke, dioxins and chromium.
§ The 12 remaining carcinogens have an estimated burden of less than 10 cancer cases per year.
Why this is important § The estimated environmental burden of cancer is significant, particularly when compared to other known risk factors for cancer, and falls between Cancer Care Ontario's previously estimated cancer burdens from alcohol and smoking.1,2
§ These results allow for a comparative assessment across carcinogens and offer insights into effective strategies to reduce the environmental burden of cancer.
Next steps § This report highlights the environmental carcinogens that are responsible for the highest burden of cancer in Ontario, and may inform policy and legislative priorities.
§ All levels of government, the private sector, non-governmental organizations and individuals can take action to reduce exposure to environmental carcinogens. It is hoped that this report provides insight on how to focus exposure reduction efforts.
„Solar ultraviolet radiation, radon and PM
2.5 account for over
90 per cent of the total estimated environmental burden of cancer in Ontario.
Environmental Burden of Cancer in Ontario 3

Executive summary
Overview
Environmental Burden of Cancer in Ontario estimates how many new cancer cases, diagnosed each year in Ontario, are a result of exposure to cancer-causing agents that exist in our environment.
For the purposes of this report, sources of environmental carcinogens are air, food, drinking water, dust and radiation. As such, this report focuses on cancer-causing agents that Ontarians are exposed to in their daily lives simply by breathing, eating, drinking and being in the sun. There is also a discussion of several policy and personal protective measures that may be effective in reducing the number of cancer cases caused by exposure to environmental carcinogens (i.e., the environmental burden of cancer). This is the fifth report in Cancer Care Ontario’s Cancer Risk Factors in Ontario series, and the first produced jointly by Cancer Care Ontario and Public Health Ontario.
Context and approachUnderstanding the amount of cancer caused by specific carcinogens, such as those in our environment, is an important first step in improving the health of Ontarians and can be useful in informing exposure reduction strategies, policy interventions and the evaluation of these interventions. This report assesses 23 environmental carcinogens that Ontarians are exposed to through their daily activities. These
carcinogens may enter the environment through natural sources (e.g., solar ultraviolet [UV] radiation), human activity (e.g., second-hand smoke) or a combination of both (e.g., fine particulate matter [PM
2.5] air pollution).
The best available data were used to estimate the environmental burden of cancer. It was not possible to completely assess the environmental burden of cancer for certain environmental carcinogens due to lack of data. Furthermore, due to the nature of the available carcinogen data, it was necessary to use two different models to estimate the environmental burden of cancer: risk assessment and population attributable fraction. All results are presented as a plausible range of annual cancer cases resulting from exposure to specified carcinogens.
FindingsCompared to the carcinogens examined by Cancer Care Ontario in previous reports, environmental carcinogens are responsible for a significant number of new cancer cases in Ontario.1,2 This report estimates that between 3,540 and 6,510 new cancer cases each year result from exposure to environmental carcinogens, which represents approximately twice the cancer burden from alcohol consumption, and approximately one-half the cancer burden from smoking.
Of the 23 environmental carcinogens assessed in this report, three account for over 90 per cent of the total estimated environmental burden of cancer in Ontario: solar UV radiation (2,090 to 2,990 cancer cases per year), radon (1,080 to 1,550 cancer cases per year) and PM
2.5 (290 to 900 cancer cases per year). Eight other environmental
carcinogens have an estimated burden of 10 or more new cancer cases per year and the remaining 12 have an estimated burden of less than 10 cancer cases per year. A summary of the estimated environmental burden of cancer by carcinogen is presented in Figure ES-1.
4 Executive summary
Dioxins
Second-hand smoke (SHS)†
Formaldehyde
Asbestos
Acrylamide
Arsenic
0 500 1,000 1,500 2,000 2,500 3,000 3,500 Estimated annual number of cancer cases
Diesel particulate matter (DPM)†
Fine particulate matter (PM2.5)†
Radon†
Solar ultraviolet (UV) radiation†
ChromiumRepresents the range in estimated annual number of cancer cases
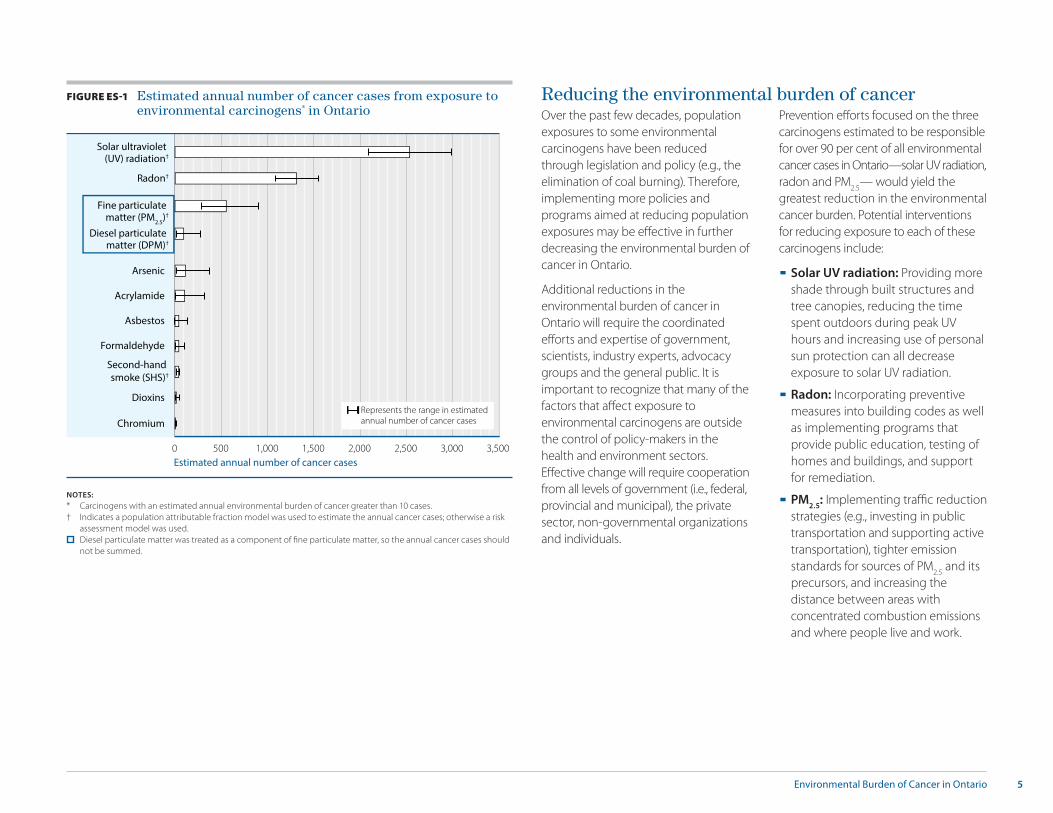
FIGURE ES-1 Estimated annual number of cancer cases from exposure to environmental carcinogens* in Ontario
NOTES:* Carcinogens with an estimated annual environmental burden of cancer greater than 10 cases.† Indicates a population attributable fraction model was used to estimate the annual cancer cases; otherwise a risk
assessment model was used. Diesel particulate matter was treated as a component of fine particulate matter, so the annual cancer cases should
not be summed.
Reducing the environmental burden of cancerOver the past few decades, population exposures to some environmental carcinogens have been reduced through legislation and policy (e.g., the elimination of coal burning). Therefore, implementing more policies and programs aimed at reducing population exposures may be effective in further decreasing the environmental burden of cancer in Ontario.
Additional reductions in the environmental burden of cancer in Ontario will require the coordinated efforts and expertise of government, scientists, industry experts, advocacy groups and the general public. It is important to recognize that many of the factors that affect exposure to environmental carcinogens are outside the control of policy-makers in the health and environment sectors. Effective change will require cooperation from all levels of government (i.e., federal, provincial and municipal), the private sector, non-governmental organizations and individuals.
Prevention efforts focused on the three carcinogens estimated to be responsible for over 90 per cent of all environmental cancer cases in Ontario—solar UV radiation, radon and PM
2.5— would yield the
greatest reduction in the environmental cancer burden. Potential interventions for reducing exposure to each of these carcinogens include:
§ Solar UV radiation: Providing more shade through built structures and tree canopies, reducing the time spent outdoors during peak UV hours and increasing use of personal sun protection can all decrease exposure to solar UV radiation.
§ Radon: Incorporating preventive measures into building codes as well as implementing programs that provide public education, testing of homes and buildings, and support for remediation.
§ PM2.5
: Implementing traffic reduction strategies (e.g., investing in public transportation and supporting active transportation), tighter emission standards for sources of PM
2.5 and its
precursors, and increasing the distance between areas with concentrated combustion emissions and where people live and work.
5Environmental Burden of Cancer in Ontario
2Foreword
3Key messages
4Executive summary
7List of tables and figures
8List of carcinogen names and abbreviations
8Objectives
9Context
12Approach 12 Identifying relevant environmental carcinogens
13 Selecting routes of exposure
13 Identifying available data sources
14 Estimating environmental burden of cancer
15Guidance for understanding the findings
16Findings16 Overview
20 Radiation
21 Combustion by-products
22 Metals
22 Volatile organic compounds
22 Other
Table of contents
6 Table of contents
23Reducing the environmental burden of cancer
27Conclusion
28References
30Glossary
31Appendix A Potency and concentration summary information (central estimates)
36Appendix B Additional details on estimation approach and mathematical models
39Appendix C Background information on carcinogens with less than 10 estimated cancer cases per year from selected environmental exposures
List of figuresFigure 110 Cancer sites associated with the environmental
carcinogens addressed in this report
Figure 211 Environmental routes of exposure and sources of
carcinogens assessed in this report
Figure 3 12 Selection process for carcinogens included in
this report
Figure 417 Estimated annual number of cancer cases from
exposure to environmental carcinogens in Ontario
Figure 5 18 Estimated annual number of cancer cases from
exposure to environmental carcinogens in Ontario by chemical group
List of tablesTable 1 14 Comparison of two models used to estimate
environmental burden of cancer in Ontario
Table 2 17 Range in estimated annual number of cancer
cases from exposure to environmental carcinogens in Ontario
Table 319 Mean estimated annual number of cancer cases
by carcinogen and route of exposure
7Environmental Burden of Cancer in Ontario

List of carcinogen names and abbreviations
CARCINOGEN NAME IN THIS REPORT ABBREVIATION COMPLETE AGENT NAME BASED ON THE INTERNATIONAL AGENCY FOR RESEARCH ON CANCER MONOGRAPHa
1,2-dichloropropane - 1,2-dichloropropane
1,3-butadiene - 1,3-butadiene
Acrylamide - Acrylamide
Arsenic - Arsenic and inorganic arsenic compounds
Asbestos - Asbestosb
Benzene - Benzene
Cadmium - Cadmium and cadmium compounds
Chlorinated toluenes - Alpha-chlorinated toluenesc and benzoyl chloride (combined exposures)
Chromium - Chromium (VI) compounds
Dichloromethane - Dichloromethane (methylene chloride)
Diesel particulate matter DPM Engine exhaust, diesel
Dioxins - 2,3,7,8-tetrachlorodibenzo-para-dioxin
Fine particulate matter PM2.5
Outdoor air pollution, particulate matter in
Formaldehyde - Formaldehyde
Nickel - Nickel compounds
Polychlorinated biphenyls PCBs Polychlorinated biphenyls
Polycyclic aromatic hydrocarbons PAHs benzo[a]pyrene, cyclopenta[cd]pyrene, dibenz[a,j]acridine, dibenz[a,h]anthracene, dibenzo[a,l]pyrene
Radon - Radon-222 and its decay products
Second-hand smoke SHS Tobacco smoke, second-hand
Solar ultraviolet radiation UV Solar radiationd
Tetrachloroethylene PCE Tetrachloroethylene (perchloroethylene)
Trichloroethylene TCE Trichloroethylene
Vinyl chloride - Vinyl chloride
NOTES:a. The International Agency for Research on Cancer monographs programme identifies and evaluates causes of cancer in humans.b. All forms, including actinolite, amosite, anthophyllite, chrysotile, crocidolite and tremolite.c. Benzal chloride, benzotrichloride and benzyl chloride.d. Includes ultraviolet radiation (wavelengths 100–400 nm, encompassing UVA, UVB and UVC).
The primary objective of this work is to estimate the burden of cancer from environmental carcinogens in Ontario.
Secondary objectives are to:
§ identify priority routes of exposure based on their contribution to environmental burden of cancer for the Ontario population;
§ identify gaps in the availability of environmental data on carcinogens in Ontario; and
§ highlight opportunities for reducing population-level exposure to environmental carcinogens.
Objectives
8 Objectives

What does this report include?This report estimates how many new cancer cases are diagnosed each year in Ontario as a result of cancer-causing agents that exist in our environment. The environmental carcinogens assessed were selected from substances classified as “carcinogenic” or
“probably carcinogenic” to humans by the International Agency for Research on Cancer (IARC), an international cancer authority. The carcinogens described are also ones with available data on population exposure and that the general public in Ontario are exposed to regularly by breathing, eating, drinking and being in the sun. The report presents the annual environmental burden of cancer as a range of plausible estimates, rather than a single value, in an effort to provide a more realistic picture of what is known about the environmental burden of cancer in Ontario.
This document presents the first in-depth and comprehensive examination of environmental carcinogens that affect the Ontario population and their associated cancer burdens across several environmental sources of exposure.
What does this report exclude?Environmental Burden of Cancer in Ontario does not consider exposures that occur primarily through occupation,i specific behaviours (e.g., actively smoking cigarettes) or hobbies. The report estimates the environmental burden of cancer for the provincial population as a whole and does not consider the distribution of the cancer burden that may fall more heavily on some groups than others. It is likely that certain people may be exposed to higher or lower levels of a carcinogen, or be more or less susceptible to the effects of a carcinogen than the average Ontarian.
Why is a focus on the environment important for cancer prevention?Environmental Burden of Cancer in Ontario is the fifth report in Cancer Care Ontario’s Cancer Risk Factors in Ontario series and the first jointly produced by Cancer Care Ontario and Public Health Ontario. The last three Cancer Risk Factors in Ontario reports provided cancer burden estimates for smoking, alcohol and unhealthy weights, which are all influenced by individual behaviours.
Previous studies have estimated that environmental carcinogens may be responsible for as few as two per cent or as much as 19 per cent of all new cancer cases.ii
To prevent cancers from environmental carcinogen exposure, it is important to first understand the total environmental burden of cancer for the province. While some carcinogens are associated with cancer in only one area of the body (or cancer site), there are others that are associated with multiple cancer sites (Figure 1; also see Tables A-1 and A-2 in Appendix A).
Context
i Cancer Care Ontario is planning a future risk factor report on occupational cancer.ii These percentages reflect different geographic locations and different definitions of environment: Doll R, Peto R. The causes of cancer: quantitative estimates of avoidable risks of cancer in the United States today. JNCI. 1981;66(6):1191-308.
Prüss-Üstün A, Corvalán C. Preventing disease through healthy environments. Geneva: World Health Organization; 2006.
Environmental Burden of Cancer in Ontario 9

FIGURE 1 Cancer sites associated with the environmental carcinogens addressed in this report
NOTES: Cancer sites with sufficient (standard black font) and limited (italicized blue font) evidence, as classified by the International Agency for Research on Cancer, are shown.DPM: diesel particulate matter; PCBs: polychlorinated biphenyls; PM
2.5: fine particulate matter; SHS: second-hand smoke; UV: ultraviolet.
Residents of Ontario are exposed to environmental carcinogens through sources that they come into contact with via their respiratory tract (inhalation of indoor and outdoor air), digestive tract (ingestion of food, water and dust indoors) and skin (dermal exposure to sunlight). Figure 2 shows the routes of exposure and environmental sources considered in this report.
For people to come into contact with environmental carcinogens, there must be an exposure pathway that allows hazardous substances to move through the environment from a source to a point of contact with humans. For example, arsenic may be present in groundwater that is used as a source of drinking or irrigation water, and exposure may occur through water or food. Some carcinogens are naturally occurring (e.g., arsenic in groundwater), while others are generated by human activity (e.g., dioxins); many have both natural and human sources (e.g., fine particulate matter).
How can the results of this report be used?The comprehensive information in this report will help decision-makers better understand the risk of cancer from environmental carcinogens that residents of Ontario are exposed to on a daily basis. It can be used inform the allocation of resources and efforts to reduce the risk of cancer from environmental carcinogens in Ontario.
Lungarsenic, asbestos, cadmium, chromium,
DPM, nickel, PM2.5
, radon, SHS, chlorinated toluenes, dioxins
Head and neckasbestos, formaldehyde, nickel, chromium, SHS, solar UV radiation
Soft-tissue sarcomadioxins
Prostatearsenic, cadmium
KidneyTCE, arsenic, cadmium
Liver1-2-dichloropropane, vinyl chloride,
arsenic, dichloromethane, TCE
Mesotheliomaasbestos
Stomach, colon, rectumasbestos
Ovaryasbestos
Bladderarsenic, DPM, PCE
BreastPCBs
Skinarsenic, PCBs, solar UV radiation
All sites combineddioxins
Leukemia, lymphomabenzene, 1,3-butadiene, formaldehyde, dichloromethane, dioxins, PCBs, radon, TCE
10 Context

INHALATION
Indoor dust
Outdoor air
Drinking water
INGESTION
Indoor air Food
SunlightDERMAL EXPOSURE
FIGURE 2 Environmental routes of exposure and sources of carcinogens assessed in this report
11Environmental Burden of Cancer in Ontario

23 environmental carcinogens assessed in this report
STEP 5 Carcinogens with available data sources (n = 23) 1 carcinogen excluded
STEP 4 Carcinogens relevant for Ontarians (n = 24) 14 carcinogens excluded
Approach
Identifying relevant environmental carcinogensThe authors of this report followed several steps to select the 23 environmental carcinogens addressed in Environmental Burden of Cancer in Ontario:
1. The authors gathered a list of 188 substances classified as “carcinogenic” to humans (Group 1)iii or “probably carcinogenic” to humans (Group 2A)iv by the International Agency for Research on Cancer (IARC), a specialized agency of the World Health Organization that identifies substances that can increase the risk of cancer based on an expert assessment of current evidence.v
2. They identified 52 environmental carcinogens (excluding 136 carcinogens, such as those in medications, those found at work and those resulting from specific behaviours, including actively smoking cigarettes).
3. They grouped related carcinogens (e.g., different wavelengths of ultraviolet [UV] radiation), reducing the number of carcinogens to 38.
4. Based on expert opinion, they determined that the average Ontarian would be unlikely to be exposed to 14 carcinogens outside of work or hobbies (e.g., wood dust), leaving 24 carcinogens.
5. They found one carcinogen (silica dust) to have insufficient exposure information for the general public, which left 23 carcinogens for inclusion in the assessment (see Figure 3).
The full listing of the carcinogens screened is provided in the Technical Supplement (available on the CCO and PHO websites).
STEP 1Agents identified by the International Agency for Research
on Cancer as carcinogenic (n = 118) or probably carcinogenic (n = 70)
STEP 3 Grouped carcinogens (n = 38) 14 carcinogens excluded
STEP 2 Environmental carcinogens (n = 52) 136 carcinogens excluded
FIGURE 3 Selection process for carcinogens included in this report
12 Approach

iii IARC Group 1 substances are carcinogenic to humans. There is sufficient evidence in humans and a causal relationship.iv IARC Group 2A substances are probably carcinogenic to humans. They demonstrate limited evidence in humans and sufficient evidence in animals.v Listed on the IARC website on March 10, 2015.vi The full carcinogen names, as classified in the International Agency for Research on Cancer monographs, can be found on page 8.
Selecting routes of exposureFor each of the 23 carcinogens in the report, the authors examined all relevant routes of exposure that had sufficient data. Ontarians can be exposed to 22 of the carcinogens through breathing air (indoors and outdoors), eating food, drinking water and ingesting indoor dust. Solar ultraviolet radiation exposure occurs outdoors through dermal exposure to sunlight.
Identifying available data sourcesTo estimate the annual burden of cancer from each of the 23 environmental carcinogens, several pieces of information were required:
§ Potency is a measure of how toxic a carcinogen is. It relates the risk of cancer at a given level of exposure to the carcinogen.
§ Concentration is an estimate of how much of a carcinogen is present in air, food, drinking water or dust. This concentration is used to estimate what people are exposed to, based on how much of the environmental source they eat, breathe or drink.
§ Other information was required depending on the estimation approach used.
PotencyAvailable potency information was collected for each carcinogen from Health Canada, the U.S. Environmental Protection Agency (EPA), the California EPA and scientific literature. The potency information could take the form of an inhalation unit risk (IUR), an oral slope factor (OSF) or a relative risk (RR).
A summary of the potency information for each carcinogen is presented in Table A-1 and Table A-2 in Appendix A. For the analysis, ranges were employed; the ranges are available in the Technical Supplement.
ConcentrationConcentration estimates were developed for each carcinogen across all relevant routes of exposure and environmental sources (where environmental data were available). The concentration estimates used in the analysis are distributions that reflect a plausible range of values, rather than a single number. To develop the estimates, concentration data from national inventories, monitoring programs, research projects, published studies and population-based surveys were used. Where possible, concentration data that were representative of population exposure (e.g., large number of samples) were used from the year 2010 for Ontario. A summary of the concentration data is provided in Table A-3 in Appendix A.
The concentration data sources are listed in Table A-4 in Appendix A. Exposure could not be estimated for every route of exposure corresponding to each carcinogen because some pathways were deemed not applicable and others lacked concentration data.
The complete concentration distributions used in the analysis are provided in the Technical Supplement.
The authors categorized the carcinogens into five chemical groupings for ease of presentation:vi
§ Radiation: Radon and solar UV radiation
§ Combustion by-products: Diesel particulate matter (DPM), dioxins, fine particulate matter (PM
2.5),
polycyclic aromatic hydrocarbons (PAHs) and second-hand smoke (SHS)
§ Metals: Arsenic, cadmium, chromium and nickel
§ Volatile organic compounds: Benzene, 1,3-butadiene, chlorinated toluenes, dichloromethane, 1,2-dichloropropane, formaldehyde, tetrachloroethylene (PCE), trichloroethylene (TCE) and vinyl chloride
§ Other: Acrylamide, asbestos and polychlorinated biphenyls (PCBs)
13Environmental Burden of Cancer in Ontario

TABLE 1 Comparison of two models used to estimate environmental burden of cancer in Ontario
MODEL DESCRIPTION KEY INPUTS CARCINOGENS APPLIED TO
Risk assessment (RA)
RA approaches are widely used by agencies like Health Canada and the U.S. Environmental Protection Agency to estimate the incremental excess lifetime cancer risk due to continuous exposure to a carcinogen over a lifetime
§ Concentration
§ Potency (e.g., oral slope factor developed by fitting a model to experimental and epidemiologic study data)
§ Population
Dioxins, PAHs, arsenic, cadmium, chromium, nickel, benzene, 1,3-butadiene, chlorinated toluenes, dichloromethane, 1,2-dichloropropane, formaldehyde, PCE, TCE, vinyl chloride, acrylamide, asbestos and PCBs
Population attributable fraction (PAF)
The PAF represents the proportion of new cancer cases, or attributable cancers, in Ontario that could be prevented if exposure to the carcinogen were eliminated
§ Concentration (e.g., population prevalence of exposure)
§ Potency (e.g., relative risk developed by fitting a model to epidemiologic study data)
§ Cancer incidence
Radon, solar UV radiation, DPM, PM2.5
and SHS
NOTES: PAHs: polycyclic aromatic hydrocarbons; PCE: tetrachloroethylene; TCE: trichloroethylene; PCBs: polychlorinated biphenyls; UV: ultraviolet; DPM: diesel particulate matter; PM
2.5: fine particulate matter; SHS: second-hand smoke.
Other informationThe following additional information was necessary to complete the calculations: the number of Ontario residents under age 80 (census year 2011), specific cancer incidence counts (2011), body weights, drinking water intake rates, dust ingestion rates, the amount of time Canadians spend indoors and select carcinogen-specific information (e.g., proportion of arsenic in food that is inorganic vs. organic). These elements came from various sources and are listed in the Technical Supplement.
Estimating environmental burden of cancerPotency and concentration of carcinogens were used to estimate the environmental burden of cancer in Ontario. Plausible ranges were used for these inputs whenever possible to more accurately reflect real life scenarios; this approach is also known as “probabilistic.” Therefore, the estimated burden results reflect plausible ranges, rather than a single number.
Two models were used to estimate the annual number of cancer cases from environmental carcinogens in Ontario. Due to differences in the nature of the available environmental data, it was not possible to apply a single model to all of the carcinogens. The models and the carcinogens to which each are applied to are outlined in Table 1.
The general equations for the risk assessment (RA) model and the population attributable fraction (PAF) model, as well as an example calculation and probabilistic simulation, are shown in Appendix B. A full description of the probabilistic approach, as well as the RA and PAF equations, are available in the Technical Supplement.
14 Approach

There are several considerations that should be kept in mind when reviewing the results of this report.
§ It was not possible to assess the burden of all environmental carcinogens and all routes of exposure. While the authors of this report did a comprehensive analysis of 23 environmental carcinogens, silica was not included due to data limitations. Even for the 23 environmental carcinogens that were assessed, not all relevant routes of exposure could be evaluated. In particular, there was insufficient information available for drinking water and food, and the dermal route of exposure was considered for only one environmental carcinogen, solar ultraviolet radiation. It is therefore possible that some results underestimate the true environmental burden of cancer.
Guidance for understanding the findings
§ Two different models were used to generate these estimates. Depending on the nature of the data available for each carcinogen, a risk assessment model or a population attributable fraction model was used to estimate environmental burden of cancer. Both models have been widely applied in other studies that have estimated the burden of disease, but estimates using these two models are not directly comparable.
§ There is no one “single” burden estimate. It is not possible to calculate an exact number of cancer cases associated with exposure to a particular carcinogen. To account for this uncertainty, a probabilistic approach was used for all estimates, which first involved incorporating a range of plausible values in the concentration and potency information, and then estimating a range of plausible values for the burden of cancer.
§ Assumptions were made about future exposures to produce these estimates. Consistent with any such analysis, the authors of this report made assumptions to create a model that estimated Ontario’s environmental burden of cancer. The assumptions associated with the application of the risk assessment and population attributable fraction models are provided in the Technical Supplement. Most importantly, the authors assumed that all Ontarians are exposed to environmental carcinogens for their entire life and at levels measured in (or close to) 2010.
§ There are individual- and group-level differences in exposure and susceptibility that are not captured in the results. The goal of this report was to estimate the environmental burden of cancer for the province as a whole. Many of the exposure data sources reflect average exposure to a carcinogen, and not a potentially high exposure of one person or a specific group of people. Similarly, some of the potency estimates used may not accurately reflect the susceptibility to a carcinogen of individuals or groups of people.
Environmental Burden of Cancer in Ontario 15
Overview
Environmental carcinogens are responsible for a significant number of new cancer cases in Ontario.
Based on the analyses conducted, it is estimated that between 3,540 and 6,510 new cancer cases each year in Ontario result from exposure to 23 environmental carcinogens. Compared to the carcinogens examined by Cancer Care Ontario in previous reports, this represents approximately twice the cancer burden from alcohol consumption, and approximately one-half the cancer burden from smoking.1,2
The following section presents estimates of the annual number of cancer cases in Ontario from exposure to environmental carcinogens. Only carcinogens that were responsible for more than 10 cases per year are discussed in this section.
For each carcinogen, a central estimate (mean or average) is presented in Figure 4 and Table 2 along with a range of plausible estimates for annual cancer burden, based on available data. The central estimate for 11 carcinogens is 10 or more annual cancer cases; these carcinogens are discussed in detail in the latter part of this section. The remaining 12 carcinogens that have an estimated burden of less than 10 cancer cases per year; these carcinogens are discussed in Appendix C.
Findings
„It is estimated that between 3,540 and 6,510 new cancer cases each year in Ontario result from exposure to 23 environmental carcinogens.
16 Findings

TABLE 2 Range in estimated annual number of cancer cases from exposure to environmental carcinogens* in Ontario
CARCINOGEN RANGE
Mean Lower estimate Upper estimate
Solar ultraviolet (UV) radiation† 2,540 2,090 2,990
Radon† 1,310 1,080 1,550
Fine particulate matter (PM2.5
)† 560 290 900
Arsenic 120 20 370
Acrylamide 110 10 320
Diesel particulate matter (DPM)†‡ 100 20 280
Asbestos 40 0 130
Formaldehyde 40 10 100
Second-hand smoke (SHS)† 40 20 50
Dioxins 20 10 50
Chromium 10 0 20Dioxins
Second-hand smoke (SHS)†
Formaldehyde
Asbestos
Acrylamide
Arsenic
0 500 1,000 1,500 2,000 2,500 3,000 3,500 Estimated annual number of cancer cases
Diesel particulate matter (DPM)†
Fine particulate matter (PM2.5)†
Radon†
Solar ultraviolet (UV) radiation†
ChromiumRepresents the range in estimated annual number of cancer cases
FIGURE 4 Estimated annual number of cancer cases from exposure to environmental carcinogens* in Ontario
NOTES:* Carcinogens with an estimated annual environmental burden of cancer greater than 10 cases.† Indicates a population attributable fraction model was used to estimate the annual cancer cases; otherwise a risk
assessment model was used. Diesel particulate matter was treated as a component of fine particulate matter, so the annual cancer cases should
not be summed.
NOTES:* Carcinogens with an estimated annual environmental burden of cancer greater than 10 cases.† Indicates a population attributable fraction model was used to estimate the annual cancer cases; otherwise a risk
assessment model was used. ‡ Diesel particulate matter was treated as a component of fine particulate matter, so the annual cancer cases should
not be summed.
17Environmental Burden of Cancer in Ontario

0 500 1,000 1,500 2,000 2,500 3,000 3,500 Estimated annual number of cancer cases
Represents the range in estimated annual number of cancer cases
Radiation
Combustion by-products
Metals
Volatile organic compounds
Other
Asbestos
Acrylamide
Formaldehyde
Chromium
Arsenic
Dioxins
Second-hand smoke (SHS)†
Diesel particulate matter (DPM)†
Fine particulate matter (PM
2.5)†
Radon†
Solar ultraviolet (UV) radiation†
FIGURE 5 Estimated annual number of cancer cases from exposure to environmental carcinogens* in Ontario by chemical group
NOTES:* Carcinogens with an estimated annual environmental burden of cancer greater than 10 cases.† Indicates a population attributable fraction model was used to estimate the annual cancer cases; otherwise a risk assessment model was used.
Diesel particulate matter was treated as a component of fine particulate matter, so the annual cancer cases should not be summed.
Figure 5 presents the estimated annual number of cancer cases by chemical group (radiation, combustion by-products, metals, volatile organic compounds and other). The three environmental carcinogens with the greatest estimated burden of cancer—solar UV radiation, radon and PM
2.5 (including diesel particulate matter)—make up
over 90 per cent of all cancer cases from exposure to environmental carcinogens. Radiation is the largest contributor; followed by combustion by-products, other, metals and volatile organic compounds.
18 Findings

Examining the environmental burden of cancer by route of exposure (Table 3), there are some carcinogen-route of exposure combinations where burdens were not estimated because they are not relevant to Ontario or because of insufficient data. The combinations where the burden is less than 10 cancer cases a year are also apparent. The highest burdens are from solar UV radiation, radon (indoor air) and PM
2.5
(outdoor air). Notable burdens are from diesel particulate matter in outdoor air and acrylamide and arsenic in food.
TABLE 3 Mean estimated annual cancer cases by carcinogen and route of exposure
GROUP CARCINOGEN INDOOR AIR
OUTDOOR AIR
FOOD DRINKING WATER
DUST SUNLIGHT
RadiationSolar ultraviolet (UV) radiation*
Radon†
Combustion by-products
Fine particulate matter (PM2.5
)*
Diesel particulate matter (DPM)*†
Second-hand smoke (SHS)*
Dioxins
Polycyclic aromatic hydrocarbons (PAHs)
Metals
Arsenic
Chromium
Cadmium
Nickel
Volatile organic compounds
Formaldehyde
1,2-dichloropropane
1,3-butadiene
Benzene
Chlorinated toluenes
Dichloromethane
Tetrachloroethylene (PCE)
Trichloroethylene (TCE)
Vinyl chloride
Other
Acrylamide
Asbestos
Polychlorinated biphenyls (PCBs)
NOTES: * Indicates a population attributable fraction model was used to estimate the annual cancer cases; otherwise a risk assessment model was used.† Diesel particulate matter was treated as a component of fine particulate matter, so the annual cancer cases should not be summed.
500 or more cancer cases per year 100 to 499 cancer cases per year 10 to 99 cancer cases per year
Less than 10 cancer cases per year Insufficient data Not relevant
19Environmental Burden of Cancer in Ontario

Radiation
Solar ultraviolet (UV) radiationSolar UV radiationvii causes all major skin cancer types, including melanoma, squamous cell carcinoma and basal cell carcinoma.3 People with certain characteristics (i.e., fair skin, light eyes, light or red hair and a tendency to sunburn) are at an increased risk of all types of skin cancer.4 While total lifetime sun exposure increases cancer risk, the pattern of exposure may play a role in the development of different types of skin cancer. Melanoma, the most fatal type of skin cancer, is related to a history of sunburns and intermittent sun exposure characterized by bursts of sun-intensive activities, such as sunbathing and outdoor recreational activities, especially if exposure occurs during childhood or adolescence.5,6 The estimated number of cancer cases (specifically, cases of melanoma) attributable to solar UV radiation exposure in Ontario is 2,540 per year (range 2,090 to 2,990), which represents about 80 per cent of Ontario’s melanoma cases.
The estimated number of melanoma cases attributable to solar UV radiation exposure presented in this report is a significant underestimate of the complete burden of skin cancer from solar UV radiation. The Ontario Cancer Registry does not contain information about basal cell carcinoma and squamous cell carcinoma skin cancers diagnosed in Ontario and no other data source on non-melanoma skin cancers was available for the province. While less fatal than melanoma, non-melanoma skin cancers can cause substantial morbidity and result in a significant economic burden on health services.7 In Canada, non-melanoma skin cancers are estimated to be about 12 times as common as melanoma,8 which means that if this report had assessed all skin cancers, the estimated burden from solar UV radiation exposure would be much greater.
While exposure from specific behaviours, such as the use of tanning equipment, was not considered in this report, the approach used to estimate the number of cancer cases from solar UV radiation exposure does not distinguish between exposure to UV radiation from the sun and exposure from artificial sources.
RadonRadon is a naturally-occurring radioactive gas that is released from the decay of uranium in soil.3,9 In air, radon most commonly decays into radon-222.9 Radon-222 and its decay products cause lung cancer.3 While radon is a gas, its decay products are electrically charged and can become attached to dust particles in the air.3 The primary route of human exposure is inhaling indoor air.9 The number of cancer cases (specifically, cases of lung cancer) attributable to environmental exposure to radon through inhaling indoor air in Ontario is estimated to be 1,310 per year (range 1,080 to 1,550), which represents about 10 per cent of Ontario’s lung cancer cases.
vii Solar ultraviolet (UV) radiation covers the portion of the electromagnetic spectrum with wavelengths of 100 to 400 nm.
„In Canada, non-melanoma skin cancers are estimated to be about 12 times as common as melanoma,8 which means that if this report had assessed all skin cancers, the estimated burden from solar UV radiation exposure would be much greater.
20 Findings

viii DPM includes nitrogen oxides, carbon monoxide, nitroarenes (including 1-nitropyrene, which has been classified as a separate human carcinogen), polycyclic aromatic hydrocarbons, benzene, formaldehyde and metals.
Combustion by-products
Fine particulate matter (PM2.5
)Outdoor air pollution and PM
2.5, a common component of outdoor air pollution,
have been classified separately as carcinogens and both cause lung cancer.10 PM2.5
, defined as particles less than 2.5 micrometers in diameter, is capable of being inhaled deeply into the lungs due to its small size.11,12 Exposure occurs through inhalation.11 PM
2.5 sources include motor vehicles, industrial facilities (e.g., smelters),
power plants, residential fireplaces and wood stoves, agricultural burning and forest fires.11 An estimated 560 cancer cases (specifically, lung cancer cases) per year (range 290 to 900) are attributable to environmental exposure to PM
2.5 via inhaling outdoor
air in Ontario.
Diesel particulate matter (DPM)DPM is a subset of fine particulate matter, which has been classified separately as a carcinogen that causes lung cancer.13 Similar to PM
2.5, DPM is a complex mixtureviii and
inhalation is the main route of exposure.13 The estimated number of cancer cases (specifically, lung cancer cases) attributable to environmental DPM exposure via inhaling outdoor air is 100 per year (range 20 to 280), which represents a subset of the estimated annual number of cancer cases attributable to PM
2.5 exposure.
Second-hand smoke (SHS)SHS (also known as environmental tobacco smoke, involuntary smoking or passive smoking) causes lung cancer.14 SHS consists of sidestream smoke (released from the burning tip of a cigarette between puffs) and exhaled mainstream smoke (cigarette smoke exhaled by a smoker).14 The primary route of exposure is inhalation and exposure can occur in any setting where smoking is present.9,14 This report examined SHS exposure in the home. The estimated number of cancer cases (specifically, lung cancer cases) attributable to environmental exposure to SHS through inhaling indoor air in Ontario is 40 per year (range 20 to 50).
This partially reflects the progress made over the past decade in reducing exposure to SHS among non-smokers. There would be a substantially larger number of cancer cases if exposure to SHS had continued at levels seen 10 years ago (see Technical Supplement). Over the past few decades, declines in SHS exposure have likely resulted from a combination of factors, including the implementation of legislation at the municipal and provincial levels, increased awareness of the health hazards associated with tobacco exposure, and changes in smoking behaviour in homes, vehicles and public places.2,15
DioxinsDioxins are chemicals formed during low-temperature combustion of materials that contain chlorine. They are persistent in the environment and accumulate in the food chain in fatty foods; therefore, eating certain foods, particularly meat, fish and dairy products, is the primary route of environmental dioxin exposure for the general population.16 In Ontario, the estimated number of cancer cases from environmental exposure to dioxins is 20 per year (range 10 to 50).
Less than 10 casesPolycyclic aromatic hydrocarbons (PAHs) are responsible for fewer than 10 cancer cases per year in Ontario. More information on PAHs can be found in Appendix C.
21Environmental Burden of Cancer in Ontario

Metals
ArsenicArsenic is a naturally occurring semi-metal that has been used commercially in pharmaceuticals, wood preservatives, agricultural chemicals and the mining industry.17 Arsenic can be divided into inorganic and organic forms; it is inorganic arsenic specifically that causes cancer of the lung, urinary bladder and skin.17 Environmental exposure occurs mainly through eating certain foods (e.g., rice and poultry) or drinking water containing inorganic arsenic.17 An estimated 120 cancer cases per year (range 20 to 370) are from environmental exposure to inorganic arsenic in Ontario. The dominant environmental source of inorganic arsenic is food (Table 3).
ChromiumChromium (specifically chromium [VI] or hexavalent chromium) is a naturally occurring metal that has been used commercially in pigments for textile dyes, inks, plastics, corrosion inhibitors, wood preservatives, metal finishing and leather tanning.17 Chromium causes lung cancer and environmental exposure occurs mainly through inhaling air and ingesting food or water.9,17 In Ontario, the estimated annual number of cancer cases from environmental chromium exposure is 10 (range 0 to 20).
Less than 10 casesCadmium and nickel are each responsible for fewer than 10 cancer cases per year in Ontario. More information on these carcinogens can be found in Appendix C.
Volatile organic compounds
FormaldehydeFormaldehyde is used in the production and manufacture of goods and industrial chemicals and in solution as a disinfectant and preservative.16 It causes cancer of the nasopharynx and leukemia. The general population is exposed to formaldehyde primarily from combustion sources, cigarette smoke and off-gassing of building products and furniture.9 In Ontario, the estimated number of cancer cases from environmental exposure to formaldehyde is 40 per year (range 10 to 100). The main environmental source is indoor air (Table 3).
Less than 10 cases1,2-dichloropropane, 1,3-butadiene, chlorinated toluenes, benzene, dichloromethane, tetrachloroethylene, trichloroethylene and vinyl chloride are each responsible for fewer than 10 cancer cases per year in Ontario. More information on these carcinogens can be found in Appendix C.
Other
AcrylamideThe general population is exposed to acrylamide primarily through eating foods heated to high temperatures during cooking or processing (e.g., deep fat-fried foods). Exposure may also occur through ingesting water. Acrylamide is found in many types of commonly eaten foods, such as french fries, breads, cereals, potato chips and coffee.18 Acrylamide is also used in the production of polyacrylamides that are used as additives in many applications, including oil recovery, water treatment, paper production and mineral processing.9 The estimated number of cancer cases from environmental exposure to acrylamide in Ontario is about 110 per year (range 10 to 320). The main environmental source is food (Table 3).
AsbestosAsbestos is the commercial term for a group of six naturally occurring mineral fibres that are found in rocks and soil, including the serpentine mineral chrysotile and five amphibole minerals (actinolite, amosite, anthophyllite, crocidolite and tremolite).17 All forms of asbestos cause mesothelioma (a cancer affecting the membrane lining of the lungs and abdomen), and cancer of the lungs, larynx and ovaries.17 Because of its strength, flexibility and other properties, asbestos has been used in a wide range of manufactured goods, including building materials (e.g., roofing and insulation) and friction materials (e.g., brake pads and shoes).17 Ontarians are exposed to asbestos through inhaling fibres released into the air when building materials containing asbestos deteriorate, or are disturbed or damaged.17 Environmental asbestos exposure in Ontario is lower than in jurisdictions where asbestos has been mined (e.g., Quebec) and may be falling over time as new building stock replaces older buildings (pre-1980) that contain asbestos. An estimated 40 cancer cases per year (range 0 to 130) are from environmental exposure to asbestos in Ontario. The main environmental source is indoor air.
Less than 10 casesPolychlorinated biphenyls (PCBs) are responsible for fewer than 10 cancer cases per year in Ontario. More information on PCBs can be found in Appendix C.
22 Findings

Changes in the last few decades demonstrate that levels of exposure to hazards in the environment can be reduced through legislation and public policy, such as setting vehicle emission standards and implementing smoking bans in public places.
These actions have reduced exposures to harmful substances, and prevented many illnesses and premature deaths.
Reducing the environmental burden of cancer often requires coordinated efforts among complex technical, environmental, health and social systems. In Canada, all levels of government have a role to play; solutions demand an integrated whole-of-government approach, as well as cooperation by the private sector, non-governmental organizations and individual citizens.
The following discussion provides an overview of approaches for decreasing the environmental burden of cancer from environmental carcinogens that, based on this report, are responsible for more than 100 cancer cases annually.
Solar ultraviolet (UV) radiation Over 2,000 new melanoma cases diagnosed in Ontario each year are attributable to exposure to solar UV radiation, which represents about 80 per cent of Ontario’s melanoma cases. Exposure to solar UV radiation also causes basal cell carcinoma and squamous cell carcinoma of the skin.3 Reducing exposure to solar UV radiation has the potential to have a large impact on Ontario’s environmental burden of cancer, but will be challenging because Ontario residents have been spending more time in the sun without improving their sun protection behaviours.19
Shade protectionShade provided by built structures and tree canopies can protect people from solar UV radiation more effectively than sunscreen and provide an alternative form of sun protection when protective clothing, such as long-sleeved shirts, pants and hats, may not be practical. A national survey in the United States showed that people who sought shade reported fewer sunburns than those who used sunscreen,20 possibly due to failure to follow the recommended sunscreen instructions.21
Provision of shade in areas where people spend extended time outdoors, such as public parks and bus stops, can reduce UV exposure. In Ontario, shade may be addressed in municipal planning policies that establish guidelines for evaluating plans submitted to the municipality for approval to develop or redevelop a site. For example, the City of Waterloo Official Plan considers the provision of shade to be essential when planning new or refurbishing existing city-owned facilities.22
Reducing the environmental burden of cancer
23Environmental Burden of Cancer in Ontario

Public educationSustained, multi-component, community-wide public education strategies that reach a broad audience have been shown to improve solar UV radiation protective behaviours in the general population.23 Tactics may include a combination of information materials or small media, such as posters or brochures, and mass media, such as television advertising.
Information provided to the public about sun protection practices, such as the importance of protective clothing, can be delivered in a way that is easy to remember and supported by organizations working in the field. Jurisdictions such as Australia have reduced their population’s solar UV radiation exposure through an integrated, multi-component public education campaign that uses branding, a mascot and slogans to target the country as a whole.24 This type of campaign has not been implemented in Canada or Ontario, but could potentially be adopted.25 To set the foundation for integrated public education, the Ontario Sun Safety Working Group (partnered with Cancer Care Ontario), the Canadian Cancer Society and the Canadian Dermatology Association have recently led a national consensus process to develop a set of agreed-upon sun protection messages to appear in public education materials.
Public education around the harms of solar UV radiation exposure can be complicated by messages on vitamin D. Brief exposure to a portion of the UV spectrum can stimulate vitamin D synthesis in the skin, which is important for bone health. Taking supplements and consuming fortified foods, however, are safer options for ensuring sufficient levels of vitamin D. In late spring, summer and early autumn, incidental exposure to sunlight for up to 15 minutes around midday can be adequate to maintain sufficient vitamin D levels.26
RadonMore than 1,000 new cancer cases diagnosed in Ontario per year are attributable to exposure to radon in indoor air. Radon concentrations vary across geographic regions and may be higher in areas that have a high concentration of uranium in soil and rock.27 Radon is diluted in outdoor air, but when it escapes from the ground into buildings it can accumulate to high concentrations, usually in basements and on ground floors.28 Smokers exposed to radon are more likely to develop lung cancer than smokers who have not been exposed.4
Radon is colourless, odourless and tasteless; therefore, the only way to detect radon is to measure its concentration in indoor air. Radon is measured in units of becquerels per cubic metre of air (Bq/m³). Typical outdoor levels of radon usually range between 10 and 30 Bq/m³.29 The Government of Canada Radon Guideline recommends that if the average annual radon concentration in a dwelling is higher than 200 Bq/m³, remedial action should be taken to lower the concentration.30
Health Canada’s Cross-Canada Survey of Radon Concentrations in Homes measured radon in 3,954 homes in Ontario.31 The population-weighted percentage of Ontarians living in homes with radon concentrations above the Government of Canada Radon Guideline (200 Bq/m³) was 4.6 per cent.
There is no threshold for the carcinogenic effect of ionizing radiation, and most lung cancers caused by radon occur due to exposure to radon concentrations below the Canadian guidelines.29 The World Health Organization recommends remedial action at an average annual radon concentration of 100 Bq/m³.32 The difference in the recommended levels for remedial action is significant; a 2014 study concluded that 233 lung cancer deaths could be prevented each year in Ontario if all homes above 100 Bq/m³ were remediated, compared to 91 deaths prevented if remediation was performed in homes that were above 200 Bq/m³.29
„Jurisdictions such as Australia have reduced their population’s solar UV radiation exposure through an integrated, multi-component public education campaign that uses branding, a mascot and slogans to target the country as a whole.
„A 2014 study concluded that 233 lung cancer deaths could be prevented each year in Ontario if all homes with radon concentrations above 100 Bq/m³ were remediated.
24 Reducing the environmental burden of cancer

Prevention and remediation of radonThe World Health Organization recommends that a radon reduction system called active soil depressurization be installed in new and existing buildings. This system uses exhaust piping to direct radon gas from a building’s foundation to the outdoors. Active soil depressurization has the best radon reduction potential and long-term performance.32 According to Health Canada, this system can be inexpensively built into new construction or added to existing buildings at an approximate cost of $1,500 to $3,000 per home.33
The National Building Code of Canada addresses the design and construction of new buildings and substantial renovations to existing buildings. The code has radon prevention provisions. However, the National Building Code is a “model” code; it becomes legally binding only if it is incorporated into provincial/territorial law. Most provinces have at least partially adopted the National Building Code’s radon provisions; Ontario has not adopted them.34 The Ontario Building Code requires only three areas in the province to consider radon when new buildings are constructed: the City of Elliot Lake, the Township of Faraday and the Township of Hyman.35 These three areas have a history of mining operations and the designation of these areas does not reflect an up-to-date assessment of radon levels across Ontario. Including radon prevention provisions as part of a mandatory building code has the potential to be an effective radon prevention strategy over the long term as new housing stock is created or renovated. Incorporating radon prevention into building codes is less expensive than later mitigation and does not require the permission of the property owner. An Ontario study estimated that if new buildings and renovations to existing buildings were required to install radon prevention systems, in 37 years, half of the homes in Ontario would be protected from radon.29 Some Ontario municipalities, such as Guelph and Thunder Bay, now require that builders incorporate radon prevention measures into certain types of new construction.36,37
Consistent with other provinces, Ontario does not require homeowners to test for radon or to mitigate if high levels are discovered. Radon tests are not registered centrally, so the number of homes in Ontario tested is unknown. A 2015 survey of 1,000 Ontario households with finished basements found that only five per cent of participants reported having tested for radon.38 Ontario residents have been encouraged to test their homes through campaigns by the Canadian Cancer Society, the Lung Association and some public health units.
According to the Ontario Public Health Standards, public health units have a role in increasing public awareness and supporting the development of healthy policies around health hazards in indoor air and exposure to radiation, including radon.39 Windsor-Essex County and Thunder Bay District public health units have distributed
radon test kits to encourage testing and raise public awareness.40,41 Some jurisdictions in the United States are using innovative approaches to increase radon testing, such as financial incentives or mandatory testing in social housing and rental homes.42,43
Wider incorporation of radon mitigation requirements into the Ontario Building Code has the potential to reduce exposure in newly constructed homes. Incentives to increase testing and mitigation of existing buildings also have the potential to reduce exposure.
Fine particulate matter (PM2.5)Exposure to PM
2.5 continues to be a significant public health concern in Ontario, as
illustrated by the estimated 560 (range 290 to 900) new cancer cases attributable to PM
2.5 exposure. In addition to cancer, PM
2.5 also contributes to other chronic diseases,
including cardiovascular and respiratory diseases.44 PM2.5
is a common component of air pollution; it is a by-product of fuel combustion and is also formed through chemical reactions in the air.11 The Air Quality in Ontario 2014 Report identified motor vehicle traffic, industrial sources, and residential fireplaces and woodstoves as key contributors to outdoor or ambient PM
2.5 in Ontario.11 These sources of PM
2.5
have a substantial impact on human exposure due to their proximity to populated areas.45 Other major sources of PM
2.5 in Ontario include smelters, power plants,
agricultural burning and forest fires,11 and trans-boundary air pollution originating in the United States.11
Reducing PM2.5
concentration in ambient airActions to reduce exposure to PM
2.5 include reduction in burning of carbon-based
fuels, tighter emission standards, and increasing the separation distance between areas of elevated combustion emissions (e.g., around major roads or some industrial sites) and residences.46-48
„Some Ontario municipalities, such as Guelph and Thunder Bay, now require that builders incorporate radon prevention measures into certain types of new construction.
25Environmental Burden of Cancer in Ontario

In Ontario, several policies and programs could potentially reduce traffic-related PM2.5
, such as investment in public transit, supports for active transportation, anti-idling policies, the Drive Clean vehicle emission testing program, cleaner-burning diesel fuel requirements and the Ontario Electric Vehicle Incentive Program. For more information about traffic-related air pollution in Ontario, see Public Health Ontario’s Traffic-Related Air Pollution: Avoiding the TRAP Zone.
The Canadian Council of Ministers of the Environment have developed a Code of Practice for Residential Wood Burning Appliances to help governments develop policy, by-law and program approaches to decreasing wood burning emissions.49 Some jurisdictions in Canada have begun to encourage or enforce the use of lower-emitting fireplaces and wood stoves.50,51 It is challenging to address residential wood-burning because some of the factors that contribute to emissions are individual, such as the type of fuel used and appliance maintenance.
The level of PM2.5
in the air has been decreasing in Ontario.11 Additional measures that reduce PM
2.5 from motor vehicles, industrial sources, residential fireplaces and
woodstoves, and other sources should result in continued improvement in PM2.5
levels in Ontario communities.
ArsenicArsenic is present in many common foods, including grains, meats, fish and seafood, fruits and vegetables. It enters the food system through plants that absorb it from soil and water. Arsenic in soil and water can be naturally occurring or be released into the environment through human activities.17
There are two types of arsenic compounds: organic and inorganic. Together, the two types are referred to as “total arsenic.” Inorganic arsenic is the form that has been most closely linked with cancer.17
Foods vary both in terms of their total arsenic levels, and the proportion of inorganic and organic arsenic. For example, fish have high total arsenic levels, but almost all of it is organic.52 By contrast, rice also contains arsenic, but most it is inorganic. Inorganic arsenic is the predominant form in meats, poultry, dairy products, cereal, and some fruits and vegetables.53,54
Canada currently has tolerances or maximum allowable levels for arsenic in fish protein, edible bone meal, fruit juice, fruit nectar, ready-to-serve beverages and water in sealed containers other than mineral water or spring water.55 Health Canada is proposing to lower the maximum allowable levels for arsenic in apple juice and
water in sealed containers.56 Maximum levels for arsenic may play a role in ensuring that foods with high levels of arsenic are kept out of the food supply.
In addition to considering absolute arsenic levels in food, it is also important to understand patterns of food consumption. Foods that are eaten less frequently, although high in arsenic, may contribute less to the total arsenic intake than foods low in arsenic that are eaten more frequently. In the Canadian diet, cereal, rice and fish have been identified as important sources of total arsenic.57
More research is needed on exposure to arsenic in the Canadian diet to help identify additional measures that may be effective in reducing exposures through food.
Although arsenic levels in Ontario drinking water are generally low, well water can contribute to arsenic exposure in some areas.
AcrylamideThe Canadian Food and Drug Regulations do not have a maximum level for acrylamide in food.55 More research is needed on acrylamide in the Canadian diet to determine whether setting maximum levels of this carcinogen are required and whether there are sub-populations who are at higher risk due to consumption patterns. Canada’s Food Guide does not specifically address acrylamide or protective cooking techniques.58
26 Reducing the environmental burden of cancer
Exposure to environmental carcinogens are estimated to be responsible for a large number of cancer cases in Ontario.
The relative impact of each carcinogen on the total environmental burden of cancer, however, depends on potency and estimated population exposures. Three carcinogens—solar ultraviolet (UV) radiation, radon and fine particulate matter (PM
2.5)—account for
the majority of the burden of cancer in Ontario resulting from environmental exposures. The environmental burden of cancer estimates presented in this report provide a reasonable ranking of 23 carcinogens in terms of the number of cancer cases they are responsible for in the Ontario population. Exposure to many of these carcinogens also occurs in occupational settings, which was not considered in this report but would impact the overall cancer burden from these carcinogens.
Because these estimates are based on current exposures, they reflect the successes of cancer prevention measures to date and provide some guidance as to which carcinogens merit consideration for additional prevention initiatives. Second-hand smoke (SHS) is one example of a carcinogen that has experienced reduced exposure as a result of prevention initiatives. The number of cancer cases caused by SHS would have been much higher without the progress that has been made in exposure reduction in the last two decades. Similarly, the relatively small number of cancer cases from chemicals such as benzene and 1,3-butadiene is, to a large extent, a reflection of successful measures that have been implemented by environmental regulators nationally and provincially. From the estimates in this report, new initiatives for reducing solar UV radiation, radon and PM
2.5 exposure appear to have
the potential to prevent a significant portion of the environmental burden of cancer.
Ranking the burden of cancer associated with environmental carcinogens can help guide policy-makers in setting priorities; however, other factors are also important. Ensuring that interventions are effective in reducing exposure is key. To be implementable in a practical sense, effective interventions need to be socially, politically and economically acceptable to a diverse set of stakeholders. The authors of this report hope that this document will help stimulate discussion and further action to reduce exposures to carcinogens in our environment.
This report also demonstrates the importance of exposure data to inform effective policy and intervention. The best available data were used to estimate the burden of cancer in Ontario from environmental carcinogens, but gaps in environmental concentration data contribute to uncertainty in the estimates and may result in some degree of under- or over-estimation. Lack of available data for a potentially important pathway would likely lead to underestimating the burden of cancer.
Many of the factors that affect exposure to environmental carcinogens are outside the control of policy-makers in the health and environment sectors. Actions to reduce exposure to environmental carcinogens in Ontario will require not only cross-sectoral collaboration at all levels of government, but also active involvement and action by the private sector, non-government organizations and individuals.
Conclusion
Environmental Burden of Cancer in Ontario 27

References
1. Cancer Care Ontario. Cancer Risk Factors in Ontario: Alcohol. Toronto, ON: 2014.
2. Cancer Care Ontario. Cancer Risk Factors in Ontario: Tobacco. Toronto, ON: 2014.
3. International Agency for Research on Cancer. IARC monographs on the evaluation of carcinogenic risks to humans. Volume 100D. A review of human carcinogens. Part D: Radiation. Lyon, FR: International Agency for Research on Cancer; 2012.
4. Cancer Care Ontario. Cancer Risk Factors in Ontario: Evidence Summary. Toronto, Canada: 2013.
5. Mancebo SE, Wang SQ. Skin cancer: role of ultraviolet radiation in carcinogenesis. Rev Environ Health. 2014;29(3):265–73.
6. Greinert R, de Vries E, Erdmann F, Espina C, Auvinen A, Kesminiene A, et al. European Code against Cancer 4th edition: Ultraviolet radiation and cancer. Cancer Epidemiol. 2015;39(Suppl 1):S75–S83.
7. Lomas A, Leonardi-Bee J, Bath-Hextall F. A systematic review of worldwide incidence of nonmelanoma skin cancer. Br J Dermatol. 2012;166(5):1069–80.
8. Canadian Cancer Society's Advisory Committee on Cancer Statistics. Canadian Cancer Statistics 2015. Toronto, ON: Canadian Cancer Society, 2015.
9. National Toxicology Program (NTP). Report on Carcinogens, 13th ed. R esearch Triangle Park, NC: U.S. Department of Health and Human Services, Public Health Service; 2014.
10. International Agency for Research on Cancer. IARC monographs on the evaluation of carcinogenic risks to humans. Volume 109. Outdoor air pollution. Lyon, FR: International Agency for Research on Cancer; 2015.
11. Ontario Ministry of the Environment and Climate Change. Air Quality in Ontario 2014 Report. Toronto: Queen's Printer for Ontario; 2015.
12. World Health Organization. Ambient (outdoor) air quality and health. Geneva: World Health Organization; 2014.
13. International Agency for Research on Cancer. IARC monographs on the evaluation of carcinogenic risks to humans. Volume 105. Diesel and gasoline engine exhausts and some nitroarenes. Lyon, FR: International Agency for Research on Cancer; 2013.
14. International Agency for Research on Cancer. IARC monographs on the evaluation of carcinogenic risks to humans. Volume 100E. A review of human carcinogens. Part E: Personal habits and indoor combustions. Lyon, FR: International Agency for Research on Cancer; 2012.
15. The Ontario Tobacco Research Unit. 2015 Smoke-Free Ontario Strategy Monitoring Report. Toronto, ON: February 2016.
16. International Agency for Research on Cancer. IARC monographs on the evaluation of carcinogenic risks to humans. Volume 100F. A review of human carcinogens. Part F: Chemical agents and related occupations. Lyon, FR: International Agency for Research on Cancer; 2012.
17. International Agency for Research on Cancer. IARC monographs on the evaluation of carcinogenic risks to humans. Volume 100C. A review of human carcinogens. Part C: Arsenic, metals, fibres, and dusts. Lyon, FR: International Agency for Research on Cancer; 2012.
18. Pedreschi F, Mariotti MS, Granby K. Current issues in dietary acrylamide: formation, mitigation and risk assessment. J Sci Food Agric. 2014;94(1):9–20.
19. The Ontario Sun Safety Working Group. Insight on Cancer: Sun exposure and protective behaviours in Ontario: an Ontario report based on the 2006 Second National Sun Survey. Toronto, ON: Canadian Cancer Society (Ontario Division); 2010.
20. Linos E, Keiser E, Fu T, Colditz G, Chen S, Tang JY. Hat, shade, long sleeves, or sunscreen? Rethinking US sun protection messages based on their relative effectiveness. Cancer Causes Control. 2011;22(7):1067–71.
21. Petersen B, Wulf HC. Application of sunscreen − theory and reality. Photodermatology, Photoimmunology & Photomedicine. 2014;30(1-2):96–101.
22. City of Waterloo. Official Plan: Office Consolidation. Waterloo, ON. 2014.
23. Guide to Community Preventive Services. Preventing Skin Cancer: Multicomponent Community-wide Interventions [Internet]. [Atlanta, GA]: U.S. Department of Health & Human Services; 2014 [updated May 22, 2014; cited 2016 March 3]. Available from: http://www.thecommunityguide.org/cancer/skin/community-wide/multicomponent.html.
24. Dobbinson SJ, Volkov A, Wakefield MA. Continued Impact of SunSmart Advertising on Youth and Adults’ Behaviors. Am J Prev Med. 2015;49(1):20–8.
25. Joshua AM. Melanoma prevention: are we doing enough? A Canadian perspective. Curr Oncol. 2012;19(6):e462–7.
26. Holick MF. Sunlight and vitamin D for bone health and prevention of autoimmune diseases, cancers, and cardiovascular disease. Am J Clin Nutr. 2004;80(6 Suppl): 1678S–88S.
27. Health Canada. Radon Frequently Asked Questions [Internet]. [Ottawa, ON]: Government of Canada; 2014 [updated July 30, 2014; cited 2016 April 29]. Available from: http://www.hc-sc.gc.ca/ewh-semt/radiation/radon/faq_fq-eng.php.
28. El Ghissassi F, Baan R, Straif K, Grosse Y, Secretan B, Bouvard V, et al. Special Report: Policy. A review of human carcinogens – Part D: radiation. Lancet Oncol. 2009;10(8):751–2.
28 References

29. Peterson E, Aker A, Kim JH, Li Y, Brand K, Copes R. Lung cancer risk from radon in Ontario, Canada: how many lung cancers can we prevent? Cancer Causes Control. 2013;24(11):2013–20.
30. Health Canada. Government of Canada Radon Guideline [Internet]. [Ottawa, ON]: Government of Canada; 2009 [updated November 24, 2009; cited 2016 April 29]. Available from: http://www.hc-sc.gc.ca/ewh-semt/radiation/radon/guidelines_lignes_directrice-eng.php.
31. Health Canada. Cross-Canada survey of radon concentration in homes: final report [Internet]. [Ottawa, ON]: Health Canada; 2012 [updated September 17, 2012; cited 2016 March 3]. Available from: http://www.hc-sc.gc.ca/ewh-semt/radiation/radon/survey-sondage-eng.php.
32. World Health Organization. WHO handbook on indoor radon: a public health perspective. Geneva: World Health Organization; 2009.
33. Health Canada. Environmental and Workplace Health - Radon Frequently Asked Questions (How can I reduce the amount of radon in my house?) [Internet]. [Ottawa, ON]: Health Canada; 2014 [updated July 30, 2014; cited 2016 March 3]. Available from: http://www.hc-sc.gc.ca/ewh-semt/radiation/radon/faq_fq-eng.php#reduce.
34. Dunn B, Cooper K. Radon in Indoor Air: A Review of Policy and Law in Canada. Toronto, ON: Canadian Environmental Law Association; November 2014.
35. Ontario Ministry of Municipal Affairs and Housing. Ontario Building Code [Internet]. [Toronto, ON]: Queen's Printer for Ontario, 2008-2016; [updated October 29, 2015; cited 2016 April 29]. Available from: http://www.mah.gov.on.ca/Page7393.aspx.
36. City of Guelph. Radon Gas Mitigation Program [Internet]. [Guelph, ON]: City of Guelph; 2016 [updated December 11, 2015; cited 2016 March 3]. Available from: http://guelph.ca/living/house-and-home/buildingpermits/radon/.
37. City of Thunder Bay BD. Bulletin 2014 – 01 Soil Gas Control Measures: OBC 9.13.4 and SB-9. (2014).
38. Canadian Cancer Society. Ontario families at risk with 1 in 20 homes in province containing deadly levels of radon gas. [Internet]. [Toronto, ON]: Canadian Cancer Society; 2016 [updated October 22, 2015; cited 2016 March 3]. Available from: https://www.cancer.ca/en/about-us/for-media/media-releases/ontario/2015/october/radon-release/?region=on.
39. Ontario Ministry of Health and Long-Term Care. Ontario Public Health Standards 2008 (Revised October, 2015). Toronto, ON: Queen's Printer for Ontario, 2009–2010; 2015.
40. Waddell D. Health unit to distribute free radon gas test kits. Windsor Star. November 6, 2015.
41. Thunder Bay District Health Unit. Testing for Radon in Thunder Bay [Internet]. [Thunder Bay, ON. 2014 [updated October 2, 2014; cited 2016 April 29]. Available from: http://www.tbdhu.com/Resources/News/2014/October/TestingforRadon.htm.
42. Maine Housing. Landlord Obligations and Information [Internet]. [Augusta, Maine]: Maine State Housing Authority; [updated 2013; cited 2016 March 3]. Available from: http://www.mainehousing.org/programs-services/rental/landlords.
43. U.S. Department of Housing and Urban Development, HUD Office of Multifamily Development Radon Policy (January 31, 2013).
44. Chen H, Goldberg MS. The effects of outdoor air pollution on chronic illnesses. McGill J Med. 2009;12(1):58–64.
45. Toronto Public Health. Path to Healthier Air: Toronto Air Pollution Burden of Illness Update. Technical supplement. Toronto, ON: April 2014.
46. Brauer M, Reynolds C, Hystad P. Traffic-Related Air Pollution and Health: A Canadian Perspective on Scientific Evidence and Potential Exposure-Mitigation Strategies: Final Report, March 1, 2012. Prepared for Health Canada - Water, Air and climate Change Bureau. British Columbia, CA: University of British Columbia, 2012.
47. van Erp AM, Kelly FJ, Demerjian KL, Pope III CA, Cohen AJ. Progress in research to assess the effectiveness of air quality interventions towards improving public health. Air Quality, Atmosphere & Health. 2011;5(2):217–30.
48. Public Health Ontario. Traffic-Related Air Pollution: Avoiding the TRAP Zone [Internet]. [Toronto, ON]: Ontario Agency for Health Protection and Promotion; 2016 [cited 2016 April 29]. Available from: https://www.publichealthontario.ca/en/DataAndAnalytics/OntarioHealthProfile/Pages/OHP-IWR-TRAP.aspx.
49. Canadian Council of Ministers of the Environment. Code of Practice for Residential Wood Burning Appliances (2012).
50. BC Air Quality - Provincial Wood Stove Exchange Program [Internet]. [Vancouver, B.C.]: Province of British Columbia; 2016 [cited 2016 April 29]. Available from: http://www.bcairquality.ca/topics/wood-stove-exchange-program/.
51. City of Montreal, by-law 09-012, By-law Concerning Solid-Fuel-Burning Equipment (April 27, 2009)
52. Duxbury JM, Zavala YJ. What are Safe Levels of Arsenic in Food and Soils? International Symposium on Behaviour of Arsenic in Aquifers, Soils and Plants: implications for management; 2005 Jan 16-18; Dhaka, BD. College Station, TX: The Texas A&M University Department of Soil & Crop Science; 2005.
53. World Health Organization. Arsenic and arsenic compounds (Environmental Health Criteria 224), 2nd ed. Geneva: World Health Organization, International Programme on Chemical Safety, 2001.
54. Agency for Toxic Substances and Disease Registry (ATSDR). Toxicological Profile for Arsenic [Internet]. [Atlanta, GA]: U.S. Department of Health and Human Services, Public Health Service; 2007 [updated January 21, 2015; cited 2016 March 3]. Available from: http://www.atsdr.cdc.gov/toxprofiles/TP.asp?id=22&tid=3.
55. Food and Drug Regulations, C.R.C., c. 870, Division 15: Adulteration of Food (2016).
56. Health Canada. Summary of Comments and Responses to Health Canada's Proposed Amendments to the Regulatory Tolerances for arsenic and Lead in a Variety of Beverages [Internet]. [Ottawa, CA]: Health Canada; 2016 [updated January 2016; cited 2016 March 3]. Available from: http://www.hc-sc.gc.ca/fn-an/alt_formats/pdf/consult/2016-tolerance-arsenic-lead-plomb-eng.pdf.
57. Dabeka RW, McKenzie AD, Lacroix GM, Cleroux C, Bowe S, Graham RA, et al. Survey of arsenic in total diet food composites and estimation of the dietary intake of arsenic by Canadian adults and children. J AOAC Int. 1993;76(1):14–25.
58. Health Canada. Eating well with Canada's Food Guide [Internet]. [Ottawa, ON]: Health Canada; 2011 [updated September 1, 2011; cited 2016 March 3]. Available from: http://www.hc-sc.gc.ca/fn-an/food-guide-aliment/index-eng.php.
29Environmental Burden of Cancer in Ontario
Burden of cancerThe number of cancer cases from exposure to cancer-causing agents (e.g., environmental exposures).
Carcinogen, carcinogenicA carcinogen is any substance that can cause cancer. Carcinogens are termed carcinogenic, or able to cause cancer.
ConcentrationHow much of a carcinogen is present in air, food, drinking water or dust.
Deterministic approachAn analytical approach to modelling that uses point estimates of input and output parameters and does not address uncertainty or variability in the parameters.
DistributionA range of possible numerical values and which values in the range are most likely to occur. This is used to represent variability in a parameter.
Human health risk assessment (HHRA)An HHRA uses scientific information on the hazardous properties of environmental agents, the dose-response relationship and the extent of human exposure to those agents in a systematic and transparent manner to estimate risks to human health. The output of a risk assessment is a characterization of the risk to populations or individuals under the conditions of exposure used in the risk assessment; it includes a description of the sources of uncertainty.
Inhalation unit risk (IUR)An estimate of the excess lifetime cancer risk from continuous inhalation exposure to an agent at a concentration of 1 mg/m3.
Oral slope factor (OSF)An estimate of the excess lifetime cancer risk from continuous oral exposure to an agent at a dose of 1 mg/kg-day.
Population attributable fraction (PAF)The proportional reduction in population disease or mortality that would occur if exposure to a carcinogen were reduced to an alternative ideal exposure scenario.
PotencyA measure of how much the risk of cancer increases for a given increase in exposure. Examples of measures that summarize the potency of a carcinogen include inhalation unit risks, oral slope factors and relative risks.
Probabilistic approachAn analytical modelling approach that uses probability distribution functions to describe input and output parameters to characterize uncertainty and variability in the parameters.
Relative risk (RR)The ratio of the risk of disease or death among a group of people exposed to a given carcinogen, compared to the risk among an unexposed group.
Route of exposureThe means by which hazardous substances move through the environment from a source to a point of contact with people.
Glossary
30 Glossary

Appendix A Potency and concentration summary information (central estimates)
TABLE A-1 Mean inhalation unit risks and oral slope factors by carcinogen when the risk assessment model was applied (n=18), along with the International Agency for Research on Cancer (IARC) cancer site determination
CHEMICAL GROUP / CARCINOGEN INHALATION UNIT RISK*
ORAL SLOPE FACTOR*
CARCINOGENIC AGENTS WITH EVIDENCE IN HUMANS BY CANCER SITE (IARC)†
(per µg/m3) (per mg/kg • day) S: Sufficient evidence L: Limited evidence
Combustion by-products
Diesel particulate matter (DPM) (part of fine particulate matter [PM
2.5])‡
3.0E-04 S: Lung L: Bladder
Dioxins3.8E+01 1.3E+05 S: All cancer sites (combined) L: Lung, soft tissue, leukaemia
and/or lymphoma
Polycyclic aromatic hydrocarbons (PAHs) Surrogate chemical: benzo[a]pyrene
5.7E-04 4.2E+00 At the time of the IARC assessment, there were no epidemiological data on benzo[a]pyrene.
Metals
Arsenic 4.7E-03 4.3E+00 S: Lung, bladder, skin L: Liver and bile duct, prostate, kidney
Cadmium 5.3E-03 S: Lung L: Prostate, kidney
Chromium 7.9E-02 5.0E-01 S: Lung L: Nasal cavity
Nickel 2.6E-04 S: Nasal cavity, lung
Volatile organic compounds
1,2-dichloropropane 1.0E-05 3.6E-02 S: Liver and bile duct
1,3-butadiene 1.0E-04 6.0E-01 S: Leukaemia and/or lymphoma
Chlorinated toluenes 4.9E-05 1.7E-01 L: Lung
Benzene§ 1.3E-05 7.9E-02 S: Leukaemia and/or lymphoma
Dichloromethane 3.4E-07 5.4E-03 L: Liver and bile duct, leukaemia and/or lymphoma
Formaldehyde 9.5E-06 S: Nasopharynx, leukaemia and/or lymphoma
L: Nasal cavity
Tetrachloroethylene (PCE) 3.1E-06 2.7E-01 L: Esophagus (dry cleaning), bladder
Trichloroethylene (TCE) 2.2E-06 1.8E-02 S: Kidney L: Liver and bile duct, leukaemia and/or lymphoma
Vinyl chlorideII 4.3E-05 6.8E-01 S: Liver and bile duct
Environmental Burden of Cancer in Ontario 31

TABLE A-1 (Cont'd) Mean inhalation unit risks and oral slope factors by carcinogen when the risk assessment model was applied (n=18), along with the International Agency for Research on Cancer (IARC) cancer site determination
CHEMICAL GROUP / CARCINOGEN INHALATION UNIT RISK*
ORAL SLOPE FACTOR*
CARCINOGENIC AGENTS WITH EVIDENCE IN HUMANS BY CANCER SITE (IARC)†
(per µg/m3) (per mg/kg • day) S: Sufficient evidence L: Limited evidence
Other
Acrylamide7.0E-04 2.5E+00 At the time of the IARC assessment, there was inadequate evidence in for the
carcinogenicity of acrylamide in humans, but sufficient evidence in experimental animals.
Asbestos¶ 1.1E+00 S: Larynx, lung, mesothelium (pleura and peritoneum), ovary
L: Pharynx, stomach, colon
Polychlorinated biphenyls (PCBs)** 3.4E-04 2.0E+00 S: Skin L: Breast, leukaemia and/or lymphoma
NOTES:* The average of the Health Canada, U.S. Environmental Protection Agency and California Environmental Protection Agency values (when available) are presented here.† Source: http://monographs.iarc.fr/ENG/Classification/Table4.pdf‡ Diesel particulate matter was evaluated by applying the population attributable fraction model, but compared to applying the risk assessment model.§ Where one agency presented a range for the inhalation unit risk or oral slope factor, the high value of that range was used. II The "from birth" value was selected from the U.S. Environmental Protection Agency Integrated Risk Information System.¶ The inhalation unit risk units for asbestos are per fibres/mL.** For PCBs, the toxic equivalents (TEQ) for concentration were determined, so the dioxin inhalation unit risk and oral slope factor were applied instead of those for PCBs. Dark grey boxes indicate that no estimate was available or developed.
TABLE A-2 Mean population attributable fraction (PAF) by carcinogen when the PAF model was applied (n=5), along with the International Agency for Research on Cancer (IARC) cancer site determination
CHEMICAL GROUP / CARCINOGEN PAF CARCINOGENIC AGENTS WITH EVIDENCE IN HUMANS BY CANCER SITE (IARC)*
S: Sufficient evidence L: Limited evidence
Radiation
Solar ultraviolet (UV) 0.64–0.95 S: Skin L: Lip, eye
Radon 0.136 S: Nasal cavity (radium), lung, bone (radium) L: Leukaemia and/or lymphoma
Combustion by-products
Fine particulate matter (PM2.5
) 0.059 S: Lung
Diesel particulate matter (DPM) (part of PM
2.5)†
0.059 S: Lung L: Bladder
Second-hand smoke (SHS) 0.006 S: Liver and bile duct (in smokers’ children), lung L: Pharynx, larynx, leukaemia and/or lymphoma (in smokers’ children)
NOTES:* Source: http://monographs.iarc.fr/ENG/Classification/Table4.pdf† Diesel particulate matter was evaluated by applying the population attributable fraction model, but compared to applying the risk assessment model.
32 Appendix A

TABLE A-3 Mean exposure concentrations by carcinogen and environmental source used to estimate environmental burden of cancer in Ontario*
CHEMICAL GROUP / CARCINOGEN ENVIRONMENTAL SOURCE
Outdoor air Indoor air Drinking water Food Dust
Combustion by-products
Fine particulate matter (PM2.5
) 5.737 ug/m3
Diesel particulate matter (DPM) (part of PM2.5
) 1.206 ug/m3
Dioxins 0.010 pg/m3 0.670 pg/kg • d
Polycyclic aromatic hydrocarbons (PAHs) 0.038 ng/m3 0.200 ng/m3 1.000 ng/L 55.400 ng/d 0.963 ug/g
Metals
Arsenic 0.458 ng/m3 0.125 ng/m3 0.393 ug/L 0.568 ug/kg • day 13.100 μg/g
Cadmium 0.081 ng/m3 0.025 ng/m3 0.112 ug/L 0.223 ug/kg • day 6.000 μg/g
Chromium 0.314 ng/m3 0.830 ng/m3 0.204 ug/L 117.000 μg/g
Nickel 0.349 ng/m3 0.385 ng/m3
Volatile organic compounds
1,2-dichloropropane 0.015 ug/m3 0.010 ug/m3 0.050 ug/L
1,3-butadiene 0.019 ug/m3 0.141 ug/m3
Chlorinated toluenes 0.009 ug/m3 0.004 ug/m3
Benzene 0.389 ug/m3 1.040 ug/m3 0.050 ug/L
Dichloromethane 0.319 ug/m3 5.997 ug/m3 0.200 ug/L
Formaldehyde 1.337 ug/m3 26.692 ug/m3
Tetrachloroethylene (PCE) 0.063 ug/m3 1.940 ug/m3 0.051 ug/L
Trichloroethylene (TCE) 0.022 ug/m3 0.210 ug/m3 0.052 ug/L
Vinyl chloride 0.002 ug/m3 0.010 ug/m3 0.050 ug/L
Other
Acrylamide 0.281 ug/kg • d
Asbestos 2.0E-05 fibres/mL 8.0E-05 fibres/mL
Polychlorinated biphenyls (PCBs) 0.002 pg TEQ/m3 6900.000 pg ΣPCB/m3 2.290 ng/kg • d 290.000 ng ΣPCB/g
NOTES:* Chemical concentrations were not used for solar ultraviolet radiation, radon or second-hand smoke. Data sources are listed in Table A-4. Dark grey boxes indicate that no estimate was available or developed.
33Environmental Burden of Cancer in Ontario

TABLE A-4 Data sources for concentration for each carcinogen and route of exposure/environmental sourcea
CHEMICAL GROUP / CARCINOGEN (see note a)
ROUTE OF EXPOSURE / ENVIRONMENTAL SOURCE
Via inhalation Via ingestion
Outdoor air Indoor air Indoor dust Drinking water Food
Combustion by-products
Fine particulate matter (PM2.5
) OAMS1
Diesel particulate matter (DPM) CARB2
Polycyclic aromatic hydrocarbons (PAHs) NAPS3 Li (2005)4 Maertens (2008)5 DWSP6 Kazerouni (2001)7
Dioxins NAPS3 CTDS8
Metals
Arsenic NAPS3 Bari (2015)9 CHDS10 DWSP6 CTDS8
Cadmium NAPS3 Bari (2015)9 CHDS10 (see note b) DWSP6 (see note b) CTDS8 (see note b)
Chromium NAPS3 Bari (2015)9 CHDS10 DSWP6
Nickel NAPS3 Bari (2015)9 CHDS10 (see note c) DWSP6 (see note c) CTDS8 (see note c)
Volatile organic compounds
Chlorinated toluenes NAPS3 Health Canada (2010)11 (see note d) (see note d)
Benzene NAPS3 Zhu (2013)12 DWSP6
1,3-butadiene NAPS3 Health Canada (2010)11 (see note d) (see note d)
Dichloromethane NAPS3 Health Canada (2010)11 DWSP6
1,2-dichloropropane NAPS3 Zhu (2013)12 DSWP6
Formaldehyde NAPS3 Heroux (2010)13
Tetrachloroethylene (PCE) NAPS3 Zhu (2013)12 DWSP6
Trichloroethylene (TCE) NAPS3 Zhu (2013)12 DWSP6 (see note d)
Vinyl chloride NAPS3 Health Canada (2010)11 DWSP6
Other
Acrylamide (see note d) AMP14
Asbestos Lee (2008)15 Lee (2008)15 (see note d) (see note d)
Polychlorinated biphenyls (PCBs) NAPS3 Harrad (2009)16 Harrad (2009)16 (see note d) CTDS8
NOTES:a. Concentration data were not collected for radon (results of a published article were used) or UV (since the estimation model is not based on concentration), so these are not shown in the table. For second-hand smoke, concentration data
were also not used, but prevalence estimates from the Canadian Community Health Survey were employed.b. Although cadmium concentration data were located for the ingestion route of exposure (food, drinking water, and dust), most agencies (other than Cal EPA) did not classify cadmium to be carcinogenic by the ingestion route of exposure.
Therefore, cancer burden estimates for cadmium via ingestion are not provided.c. Although nickel concentration data were located through the ingestion route of exposure (food, drinking water, and dust), none of the agencies consulted for potency estimates provided one for nickel via ingestion. Therefore, cancer burden
estimates for nickel via ingestion are not provided.d. No data were available to characterize this route of exposure; other dark grey boxes represent routes of exposure that were not deemed relevant for the general population of Ontario. AMP: Acrylamide Monitoring Program; CARB: California Air Resources Board; CHDS: Canadian House Dust Study; CTDS: Canadian Total Diet Study; DWSP: Drinking Water Surveillance Program; NAPS: National Air Pollution Surveillance Program;
OAMS: Ontario Air Monitoring Stations.
34 Appendix A

Appendix A references1. Ontario Ministry of the Environment and Climate Change.
Ontario Air Monitoring Station Data [cited 2016 Jun 24]. Available from: http://www.airqualityontario.com/history/
2. California Environmental Protection Agency Air Resources Board. Report to the Air Resources Board on the proposed identification of diesel exhaust as a toxic air contaminant. Part A: Exposure assessment [Internet]. Sacramento, CA: California Environmental Protection Agency Air Resources Board; 1998 [cited 2016 Jun 24]. Available from: http://www.arb.ca.gov/toxics/dieseltac/part_a.pdf
3. Environment and Climate Change Canada. National Air Pollution Surveillance Program Data [cited 2016 Jun 24]. Available from: http://www.ec.gc.ca/rnspa-naps/default.asp?lang=En&n=8BA86647-1
4. Li A, Schoonover TM, Zou Q, Norlock F, Conroy LM, Scheff PA, et al. Polycyclic aromatic hydrocarbons in residential air of ten Chicago area homes: concentrations and influencing factors. Atmos Environ. 2005;39(19):3491–501.
5. Maertens RM, Yang X, Zhu J, Gagne RW, Douglas GR, White PA. Mutagenic and carcinogenic hazards of settled house dust I: Polycyclic aromatic hydrocarbon content and excess lifetime cancer risk from preschool exposure. Environ Sci Technol. 2008;42(5):1747–53.
6. Ontario Ministry of Environment and Climate Change. Drinking Water Surveillance Program Data [cited 2016 Jun 24]. Available from: https://www.ontario.ca/data/drinking-water-surveillance-program.
7. Kazerouni N, Sinha R, Hsu CH, Greenberg A, Rothman N. Analysis of 200 food items for benzo[a]pyrene and estimation of its intake in an epidemiologic study. Food Chem Toxicol. 2001;39:423–36.
8. Health Canada. Canadian Total Diet Study Data [cited 2016 Jun 24]. Available from: http://www.hc-sc.gc.ca/fn-an/surveill/total-diet/concentration/index-eng.php
9. Bari MA, Kindzierski WB, Wallace LA, Wheeler AJ, MacNeill M, Héroux MÈ. Indoor and Outdoor Levels and Sources of Submicron Particles (PM1) at Homes in Edmonton, Canada. Environ Sci & Technol. 2015;49(11):6419–29.
10. Rasmussen PE, Levesque C, Chenier M, Gardner HD, Jones-Otazo H, Petrovic S. Canadian House Dust Study: Population-based concentrations, loads and loading rates of arsenic, cadmium, chromium, copper, nickel, lead, and zinc inside urban homes. Sci Total Environ. 2013; 443:520–9.
11. Health Canada. Windsor Exposure Assessment Study (2005–2006): Data Summary for Volatile Organic Compound Sampling [Internet]. Ottawa, ON: Her Majesty the Queen in Right of Canada, represented by the Minister of Health; 2010 [cited 2016 Jun 24]. Available from: http://publications.gc.ca/collections/collection_2012/sc-hc/H128-1-10-618-eng.pdf.
12. Zhu J, Wong SL, Cakmak S. Nationally Representative levels of Selected Volatile Organic Compounds in Canadian Residential Indoor Air: Population-Based Survey. Environ Sci Technol. 2013;47(23):13276–83.
13. Héroux ME, Clark N, Van Ryswyk K, Mallick R, Gilbert NL, Harrison I, et al. Predictors of indoor air concentrations in smoking and non-smoking residences. Int J Environ Res Public Health. 2010;7(8):3080–99.
14. Health Canada. Acrylamide Monitoring Program. Ottawa, ON: Her Majesty the Queen in Right of Canada, represented by the Minister of Health; 2012 [cited 2016 Jun 24]. Available from: http://www.hc-sc.gc.ca/fn-an/securit/chem-chim/food-aliment/acrylamide/monitoring-prog-surveillance-eng.php.
15. Lee RJ, Van Orden DR. Airborne asbestos in buildings. Regul Toxicol Pharmacol. 2008;50:218–25.
16. Harrad S, Ibarra C, Robson M, Melymuk L, Zhang X, Diamond M, et al. Polychlorinated biphenyls in domestic dust from Canada, New Zealand, United Kingdom and United States: Implications for human exposure. Chemosphere. 2009;76: 232–8.
35Environmental Burden of Cancer in Ontario

Risk assessment modelA human health risk assessment is generally made up of four steps: hazard identification, dose-response (potency) assessment, exposure (concentration) assessment and risk characterization.
This framework is employed by Health Canada and the U.S. Environmental Protection Agency to assess risk associated with environmental carcinogens. In this report, the authors of this report identified hazards by selecting carcinogens using the International Agency for Research on Cancer’s classifications and then combined potencies (dose-response) developed by select regulatory agencies with estimates of exposure in Ontario to estimate excess cancer cases (i.e., risk characterization).
By following the steps of a risk assessment, it is possible to estimate the excess lifetime cancer risk resulting from continuous exposure to an agent over a lifetime. The authors first estimated the excess lifetime cancer risk (units of risk, which is a probability) from the concentration and potency. Then they estimated the excess lifetime cancer cases by applying the probabilities to the exposed population (units of lifetime cases). Finally, they estimated the annual cancer cases by dividing by the lifetime of 80 years. See the results from the annual excess cancer cases as applied to 18 carcinogens in Equation A-1.
Appendix B Additional details on estimation approach and mathematical models
EQUATION A-1 Risk assessment (RA) model
Annual excess cancers = Concentration ∙ Potency ∙ Population
Lifetime
Where
Concentration = Estimate derived from data sources listed in Table A-4
Potency = Estimate of inhalation unit risk or oral slope factor from Health Canada, the U.S. Environmental Protection Agency or the California Environmental Protection Agency (additional factors such as body weight applied as necessary)
Population = Ontario population aged 80 and under in the year 2011
Lifetime = 80 years
The RA model was applied to the following carcinogens: dioxins, polycyclic aromatic hydrocarbons, arsenic, cadmium, chromium, nickel, benzene, 1,3-butadiene, chlorinated toluenes, dichloromethane, 1,2-dichloropropane, formaldehyde, tetrachloroethylene, trichloroethylene, vinyl chloride, acrylamide, asbestos and polychlorinated biphenyls.
36 Appendix B
Population attributable fraction (PAF) model
The PAF represents the proportion of new cancer cases in Ontario that could be reduced if carcinogen exposure through the environment were eliminated. The PAF model was applied to five carcinogens in the analysis: solar ultraviolet (UV) radiation, radon, fine particulate matter (PM
2.5), diesel particulate matter (DPM; subset of PM
2.5) and
second-hand smoke (SHS). In each case, the determination of the PAF was specific to the carcinogen and is described in the Technical Supplement. The PAF incorporates exposure and potency within the measure.
The PAF is applied to cancer incidence to reflect the proportion of new cancer cases that occur due to carcinogen exposure. In the PAF model, the authors of this report followed the framework for estimating burden consistent with agencies, such as the Institute for Health Metrics and Evaluation in their Global Burden of Disease study.1 The authors relied on studies that were published in peer-reviewed journals to estimate the PAF. The conceptual PAF model is shown in Equation A-2.
EQUATION A-2 Population attributable fraction (PAF) model
Annual attributable cancers = PAF ∙ Annual cancer incidence
Where
PAF = Population Attributable Fraction
Annual cancer incidence = annual number of new cancer cases (of a specific site) diagnosed in Ontario
The PAF model was applied to the following five carcinogens: radon, solar UV radiation, DPM, PM
2.5 and SHS.
Detailed information on both of these models, including the exact equations, is available in the Technical Supplement.
Probabilistic approach
One estimation approach involves selecting a single value (point estimate) for each of the inputs, performing the calculation and providing a single value (point estimate) for the result. This is called a deterministic approach, but it has limitations because the inputs often cannot be described by just a single value. For example, body weights vary across Ontario, so using a point estimate of 70 kilograms is clearly not representative. Inputs in this report that exhibit variability that is able to be characterized include exposure, potencies, body weights, drinking water intake rates and dust ingestion rates.
Variability exists when there are true differences, or diversity, across a population. Variability can be quantified by collecting good quality data that are representative of populations, but it can never be reduced or eliminated.
In the same vein, inputs are often not precisely known. As a potency measure associated with the PAF estimate for PM
2.5, the relative risk (RR) has associated statistical uncertainty.
It is summarized by a mean RR estimate, along with a range reflecting this uncertainty (e.g., the 95 per cent confidence interval). All inputs in this report have uncertainty, but it was only possible to characterize the uncertainty for some of the PAF inputs.
Uncertainty exists when there is lack of knowledge about an input parameter. Uncertainty can often be reduced by collecting good quality data that are representative of populations.
To estimate the excess or attributable cancer cases caused by environmental exposures in Ontario, the authors of this report took a probabilistic approach. That is, whenever possible, the authors characterized the variability and uncertainty in their inputs and summarized them using distributions. (A distribution describes a range of possible values as well as which values in the range are most likely to occur.) The authors then repeated their calculation many times over, using different potential values for each of the inputs. The authors estimated a distribution of estimated cancer cases (a series of values that are possible) and summarized them using a mean (or central) estimate, along with upper and lower bounds, such as the 5th and 95th percentile estimates. Probabilistic approaches offer many advantages over deterministic approaches, including characterizing the variability and uncertainty in the inputs, displaying a range of potential results, and allowing identification of influential inputs and inputs where having better data would improve the estimates.2
37Environmental Burden of Cancer in Ontario

Box A-1 illustrates the difference between deterministic and probabilistic approaches using PM2.5
. The deterministic approach has just one value for each input to determine the result of 560 annual cases (in one iteration). The probabilistic approach characterizes the slope (the potency component of the RR, uncertain) using a normal distribution and the concentration (variable) using a lognormal distribution. The Ontario lung cancer incidence (year 2011) in both approaches is just one value. The probabilistic analysis calculates the result 10,000 times, using different sampled values from the input distributions. The final result is also a distribution, the mean value of which is identical to the deterministic approach (560 annual cases), but it also shows the range in this value, from 290 to 900 annual cases. The range reflects the variability and uncertainty in the inputs it was possible to characterize. The actual range may be greater.
Appendix B references1. Lim SS, Vos T, Flaxman AD, Danaei G, Shibuya K, Adair-Rohani H,
et al. A comparative risk assessment of burden of disease and injury attributable to 67 risk factors and risk factor clusters in 21 regions, 1990-2010: a systematic analysis for the Global Burden of Disease Study 2010. Lancet. 2012;380(9859):2224-60.
2. Morgan MG, Henrion M. Uncertainty: A Guide to Dealing with Uncertainty in Quantitative Risk and Policy Analysis. Cambridge, NY: Cambridge University Press; 1990.
BOX A-1 Illustration of deterministic vs. probabilistic approach for the population attributable fraction (PAF) model for fine particulate matter
Annual attributable cancers = 1 - e -Slope∙Concentration ∙ Lung cancer incidence*
INPUT DETERMINISTIC PROBABILISTIC
Slope (uncertain) Units: per µg/m3
0.0104 Normal distribution AM = 0.0104 ASD= 0.0025
Concentration (variable) Units: µg/m3
5.7 Lognormal distribution GM= 5.7
GSD= 1.2
Lung cancer incidence for 2011 (point) Units: cases
9,663 9,663
Iterations (repetitions) 1 10,000
Result(s) Estimated annual cancers Units: cases
560 Mean = 560 5th pct = 290
95th pct =900
AM: arithmetic mean; ASD: arithmetic standard deviation; GM: geometric mean; GSD: geometric standard deviation; pct: percentile; RR: relative risk* This equation is obtained by substituting PAF = (RR-1)/RR where RR = eslope x concentration into Equation A-2.
Additional details on the probabilistic approach are available in the Technical Supplement.
0 1,600
140
0.0200
38 Appendix B

Appendix C Background information on carcinogens with less than 10 estimated cancer cases per year from selected environmental exposures
Polycyclic aromatic hydrocarbons (PAHs) comprise a large class of compounds, some of which are established or probable carcinogens (e.g., benzo[a]pyrene).1-3 These compounds are formed during incomplete combustion and sources include forest fires, volcanoes, industrial emissions, residential and commercial heating with biomass fuels, motor vehicle exhaust (especially from diesel), indoor cooking and tobacco smoke.4 Exposure of the general population occurs through inhaling ambient air and tobacco smoke, ingesting water and food, contact with soil and consumption of pharmaceutical products.4
Cadmium is a naturally occurring metal that has been used commercially in battery electrodes, pigments, coatings and platings.5 Exposure to cadmium and cadmium compounds cause lung cancer.6 Population exposure to cadmium and cadmium compounds occurs mainly through diet and smoking.6
Nickel is a naturally occurring metal that has been used commercially to form alloys and in other applications, such as electroplating, ceramics and batteries.5 Exposure to nickel and nickel compounds cause cancers of the lungs, nasal cavities and paranasal sinuses.5 Environmental exposure to nickel compounds occurs mainly through diet.5
Chlorinated toluenes (benzal chloride, benzotrichloride and benzyl chloride) often exist together in industrial settings along with benzoyl chloride.6 They are mainly used as intermediates in the production of other chemicals (e.g., benzyl chloride is used in the manufacture of butyl benzyl phthalate, a plasticizer commonly found in vinyl flooring and food packaging).7
Benzene is naturally found in petroleum products (e.g., crude oil and gasoline) and can be added to gasoline.1 Exposure to benzene causes leukaemia.1 Benzene enters the environment through industrial sources, fuel evaporation from gasoline stations and automobile exhaust. The general population is primarily exposed through inhaling indoor air.1
1,3-butadiene is a gas used to produce synthetic rubbers and polymers for industrial and consumer products (e.g., automobiles, construction materials, appliance parts, computers and household articles).1 Exposure to 1,3-butadiene causes cancer of the haematolymphatic organs.1 Populations are primarily exposed through the inhaling ambient air.1
Dichloromethane is used as a solvent in paint strippers, pharmaceutical manufacturing and metal cleaning, in adhesives and as a propellant in aerosols.3 The general population is exposed mainly through inhalation.3
1,2-dichloropropane is used as a paint stripper and to produce organic chemicals.8,9 Exposure to 1,2-dichloropropane causes cancer of the bile duct.8 It is released into the environment through industrial emissions and human exposure occurs primarily through inhaling contaminated air and drinking contaminated water, as well as through skin contact.9
Tetrachloroethylene (perchloroethylene) is used as a cleaning solvent and to produce fluorocarbons; historically, it has also been widely used as a dry-cleaning solvent.10 Exposure in the general population and in occupational settings occurs primarily through inhaling indoor air and personal exposure on dry-cleaned clothes.3
Trichloroethylene has been used as a solvent for cleaning and degreasing metal parts and is used to produce hydrofluorocarbons.3,10 Exposure to trichloroethylene causes kidney cancer.10
Vinyl chloride is used in plastic piping, floor coverings, consumer goods and electronic applications.1 Exposure to vinyl chloride causes liver cancer.1 The general population is primarily exposed to vinyl chloride through inhaling contaminated air.1
Polychlorinated biphenyls (PCBs) are a class of more than 200 chemical compounds that are produced commercially by industrial processes.3 Exposure to PCBs causes melanoma.11 PCBs are found in the earth’s air, soil, water and living material.11 Exposure of the general population occurs primarily through the eating contaminated food.10
39Environmental Burden of Cancer in Ontario

Appendix C references1. International Agency for Research on Cancer. IARC
monographs on the evaluation of carcinogenic risks to humans. Volume 100F. A review of human carcinogens. Part F: Chemical agents and related occupations. Lyon, FR: International Agency for Research on Cancer; 2012.
2. International Agency for Research on Cancer. IARC monographs on the evaluation of carcinogenic risks to humans. Volume 103. Bitumens and bitumen emissions, and some N- and S-heterocyclic polycyclic aromatic hydrocarbons. Lyon, FR: International Agency for Research on Cancer; 2013.
3. National Toxicology Program (NTP). Report on Carcinogens, 13th ed. Research Triangle Park, NC: U.S. Department of Health and Human Services, Public Health Service, 2014.
4. International Agency for Research on Cancer. IARC monographs on the evaluation of carcinogenic risks to humans. Volume 92. Some non-heterocyclic polycyclic aromatic hydrocarbons and some related exposures. Lyon, FR: International Agency for Research on Cancer; 2010.
5. International Agency for Research on Cancer. IARC monographs on the evaluation of carcinogenic risks to humans. Volume 100C. A review of human carcinogens. Part C: Arsenic, metals, fibres, and dusts. Lyon, FR: International Agency for Research on Cancer; 2012.
6. a-Chlorinated Toluenes [MAK Value Documentation, 1993]. The MAK Collection for Occupational Health and Safety. 2012. p. 80–103.
7. International Agency for Research on Cancer. IARC monographs on the evaluation of carcinogenic risks to humans. Volume 71. Re-evaluation of some organic chemicals, hydrazine and hydrogen peroxide. Lyon, FR: International Agency for Research on Cancer; 1999.
8. Benbrahim-Tallaa L, Lauby-Secretan B, Loomis D, Guyton KZ, Grosse Y, El GF, et al. Carcinogenicity of perfluorooctanoic acid, tetrafluoroethylene, dichloromethane, 1,2-dichloropropane, and 1,3-propane sultone. Lancet Oncol 2014 Aug;15(9):924–5.
9. Agency for Toxic Substances and Disease Registry (ATSDR). Toxicological profile for 1,2-dichloropropane. Atlanta (GA): U.S. Department of Health and Human Services, Public Health Service; 1989.
10. International Agency for Research on Cancer. IARC monographs on the evaluation of carcinogenic risks to humans. Volume 106. Trichloroethylene, tetrachloroethylene and some other chlorinated agents. 2014. Lyon, International Agency for Research on Cancer.
11. International Agency for Research on Cancer. IARC monographs on the evaluation of carcinogenic risks to humans. Volume 107. Polychlorinated Biphenyls and Polybrominated Biphenyls. Lyon, FR: International Agency for Research on Cancer; 2015.
40 Appendix C


620 University Avenue Toronto, ON M5G [email protected]
480 University Avenue, Suite 300 Toronto, Ontario M5G [email protected] publichealthontario.ca