environmental assessment for implementation of the area ......space, 902 igloos (bunker-like...
TRANSCRIPT

Environmental Assessment for Implementation of the Area
Development Plan
Letterkenny Munitions Center (LEMC)
Letterkenny Army Depot, Pennsylvania
Prepared for:
U. S. Corps of Engineers, Baltimore District
Prepared by:
Burns & McDonnell Engineering Company, Inc. Alpharetta, Georgia
4/15/2020

Environmental Assessment Table of Contents
TOC-1
TABLE OF CONTENTS
Page No.
1.0 INTRODUCTION ............................................................................................... 1-1 1.1 Background .......................................................................................................... 1-1 1.2 Purpose, Need, and Scope .................................................................................... 1-2
1.2.1 Purpose .................................................................................................. 1-2 1.2.2 Need ...................................................................................................... 1-3 1.2.3 Applicable Regulations Considered ...................................................... 1-4 1.2.4 Scope of Environmental Analysis ......................................................... 1-5 1.2.5 Decision to be Made ............................................................................. 1-5 1.2.6 Public Involvement ............................................................................... 1-6
2.0 DESCRIPTION OF PROPOSED ACTION AND ALTERNATIVES ................... 2-1 2.1 Proposed Action ................................................................................................... 2-1 2.2 Screening Criteria ................................................................................................ 2-2
2.2.1 Operational Constraints ........................................................................ 2-2 2.2.2 Environmental Constraints.................................................................... 2-2 2.2.3 Developable Areas ................................................................................ 2-2 2.2.4 Logistics Accessibility and Operational Efficiency .............................. 2-2
2.3 Alternatives Considered but Eliminated from Further Consideration ................. 2-3 2.3.1 Alternative 1 – Limited Growth Scenario ............................................. 2-3 2.3.2 Alternative 2 – Moderate Growth Scenario .......................................... 2-4
2.4 No Action Alternative .......................................................................................... 2-5
3.0 AFFECTED ENVIRONMENT AND ENVIRONMENTAL CONSEQUENCES .... 3-6 3.1 Land Use .............................................................................................................. 3-9
3.1.1 Affected Environment ........................................................................... 3-9 3.1.2 Environmental Consequences ............................................................. 3-10
3.2 Aesthetics and Visual Resources ....................................................................... 3-14 3.2.1 Affected Environment ......................................................................... 3-14 3.2.2 Environmental Consequences ............................................................. 3-14
3.3 Geology, Topography, and Soils ....................................................................... 3-15 3.3.1 Affected Environment ......................................................................... 3-15 3.3.2 Environmental Consequences ............................................................. 3-16
3.4 Biological Resources ......................................................................................... 3-17 3.4.1 Vegetation ........................................................................................... 3-17 3.4.2 Fish and Wildlife................................................................................. 3-19 3.4.3 Threatened and Endangered Species .................................................. 3-21
3.5 Water Resources ................................................................................................ 3-23 3.5.1 Surface Water ...................................................................................... 3-23 3.5.2 Groundwater ....................................................................................... 3-27
3.6 Air Quality, GHGs, and Climate Change .......................................................... 3-27 3.6.1 Affected Environment ......................................................................... 3-27
Environmental Assessment Table of Contents
TOC-2
3.6.2 Environmental Consequences ............................................................. 3-30 3.7 Hazardous and Toxic Substances....................................................................... 3-36
3.7.1 Affected Environment ......................................................................... 3-36 3.7.2 Environmental Consequences ............................................................. 3-38
3.8 Noise .................................................................................................................. 3-39 3.8.1 Affected Environment ......................................................................... 3-39 3.8.2 Environmental Consequences ............................................................. 3-39
3.9 Cultural Resources ............................................................................................. 3-40 3.9.1 Affected Environment ......................................................................... 3-40 3.9.2 Environmental Consequences ............................................................. 3-41
3.10 Socioeconomics ................................................................................................. 3-41 3.10.1 Affected Environment ......................................................................... 3-41 3.10.2 Environmental Consequences ............................................................. 3-44
3.11 Traffic and Transportation ................................................................................. 3-45 3.11.1 Affected Environment ......................................................................... 3-45 3.11.2 Environmental Consequences ............................................................. 3-45
3.12 Utilities ............................................................................................................... 3-46 3.12.1 Affected Environment ......................................................................... 3-46 3.12.2 Environmental Consequences ............................................................. 3-47
3.13 Recreation .......................................................................................................... 3-48 3.13.1 Affected Environment ......................................................................... 3-48 3.13.2 Environmental Consequences ............................................................. 3-49
3.14 Human Health and Safety .................................................................................. 3-50 3.14.1 Affected Environment ......................................................................... 3-50 3.14.2 Environmental Consequences ............................................................. 3-50
3.15 Cumulative Effects ............................................................................................. 3-51 3.15.1 Environmental Resources with Potential Cumulative Impacts ........... 3-56
3.16 Mitigation Measures .......................................................................................... 3-60
4.0 REFERENCES .................................................................................................. 4-1
5.0 AGENCIES AND PERSONS CONTACTED ..................................................... 5-1
6.0 LIST OF PREPARERS ..................................................................................... 6-1
7.0 DISTRIBUTION LIST ........................................................................................ 7-1
APPENDIX A – AGENCY CONSULTATIONS ............................................................ 7-1
APPENDIX B – AIR QUALITY CALCULATIONS ....................................................... 7-2
Environmental Assessment Table of Contents
TOC-3
LIST OF TABLES Page No.
Table 2.2-1: Letterkenny Munitions Center Project List ........................................................... 2-4
Table 3.0-1 Summary of Environmental Consequences for the Proposed Action and No Action Alternative ............................................................................................ 3-7
Table 3.4-1. Federal and State Protected Animals with Potential to Occur on the Subject Property ................................................................................................... 3-21
Table 3.6-1 Ambient Air Quality Monitored Values near the Letterkenny Facility .............. 3-29
Table 3.6-2: Construction Emissions Calculations for Projects at LEMC .............................. 3-32
Table 3.10-1 Existing population and Demographic Conditions .............................................. 3-42
Table 3.10-2 Temporary Housing Units Available in the Project Vicinity ............................... 3-42
Table 3.10-3 Existing Income and Employment conditions in the Project Area ....................... 3-43
Table 3.10-4 Public Service Data for the Project Vicinity ........................................................ 3-43
Table 3.10-5 Minority Populations and Low-Income Population Information for the Census Blockgroups Within 2 Miles of the Project ............................................. 3-44
Table 3.15-1 Resource-Specific Geographic Regions for Determining Cumulative Impacts of the Project ........................................................................................... 3-53
Table 3.15-2 Letterkenny Munitions Center Proposed Projects List ...................................... 3-54
Table 3.15-3 Past, Present, and Reasonably Foreseeable Future Project within the same Geographic Scope as the LEMC Projects. ........................................................... 3-55
Table 3.15-4 Summary of Cumulative Effects ......................................................................... 3-56
Table 3.15-5 Franklin County Emissions (2017) Compared to Facility Emissions (2017) and Project Emissions ............................................................................... 3-59
LIST OF FIGURES Page No.
Figure 1-1: Location Map for Letterkenny Munitions Center .................................................. 1-2
Figure 2-1: Proposed Action (Preferred Alternative) ................................................................ 2-2
Figure 2-2: Project Index Map for Letterkenny Ammunitions Center ..................................... 2-1
Figure 2-3: Alternative 1 – Limited Growth Scenario .............................................................. 2-4
Figure 2-4: Alternative 2 – Moderate Growth Scenario ........................................................... 2-5
Figure 3-1 LEAD Layout Map ............................................................................................... 3-11
Figure 3-2 Land Use Map ...................................................................................................... 3-12
Figure 3-3 LEAD Agricultural Outlease Program Map ......................................................... 3-13
Figure 3-4 Water Resources Map .......................................................................................... 3-26
Figure 3-5: Location of AEDBR Sites at LEAD .................................................................... 3-37
Environmental Assessment List of Abbreviations
TOC-4
LIST OF ABBREVIATIONS
Abbreviation Term/Phrase/Name
ACHP Advisory Council on Historic Preservation
ADP Area Development Plan
AMC Army Materiel Command
AP Allegheny Power
ARMD Rocket Motor Destruction
Burns & McDonnell Burns & McDonnell Engineering Company, Inc.
CEQ Council on Environmental Quality
CFR Code of Federal Regulations
CITE Center of Industrial and Technical Excellence
DoD Department of Defense
EA Environmental Assessment
EIS Environmental Impact Statement
ESQD Explosive Safety Quantity-Distance
FNSI Finding of No Significant Impact
gpm gallons per minute
GSF Gross square feet
ICRMP Integrated Cultural Resources Management Plan
ICUZ Installation Compatible Use Zone
IPaC Information, Planning, and Consultation System
ITV Internally Transportable Vehicle
LEAD Letterkenny Army Depot
LEMC Letterkenny Munitions Center
LIDA Letterkenny Industrial Development Authority
LTL Less than Truck Load
NAAQS National Ambient Air Quality Standards
NEPA National Environmental Policy Act
Environmental Assessment List of Abbreviations
TOC-5
Abbreviation Term/Phrase/Name
NEW Net Explosive Weight
NOA Notice of Availability
NOI Notice of Intent
NRHP National Register of Historic Places
PGC Pennsylvania Game Commission
POV Privately Owned Vehicle
PPE Personal Protective Equipment
RCRA Resource Conservation and Recovery Act
SGL State Game Lands
TEU Twenty-foot Equivalent Units
TTC Thermal Treatment Chamber
USEPA U.S. Environmental Protection Agency
USFWS U.S. Fish and Wildlife Service
USMC U.S. Marine Corps
VOC volatile organic compound
Environmental Assessment DRAFT Letterkenny Munitions Center
1-1
1.0 INTRODUCTION
1.1 Background
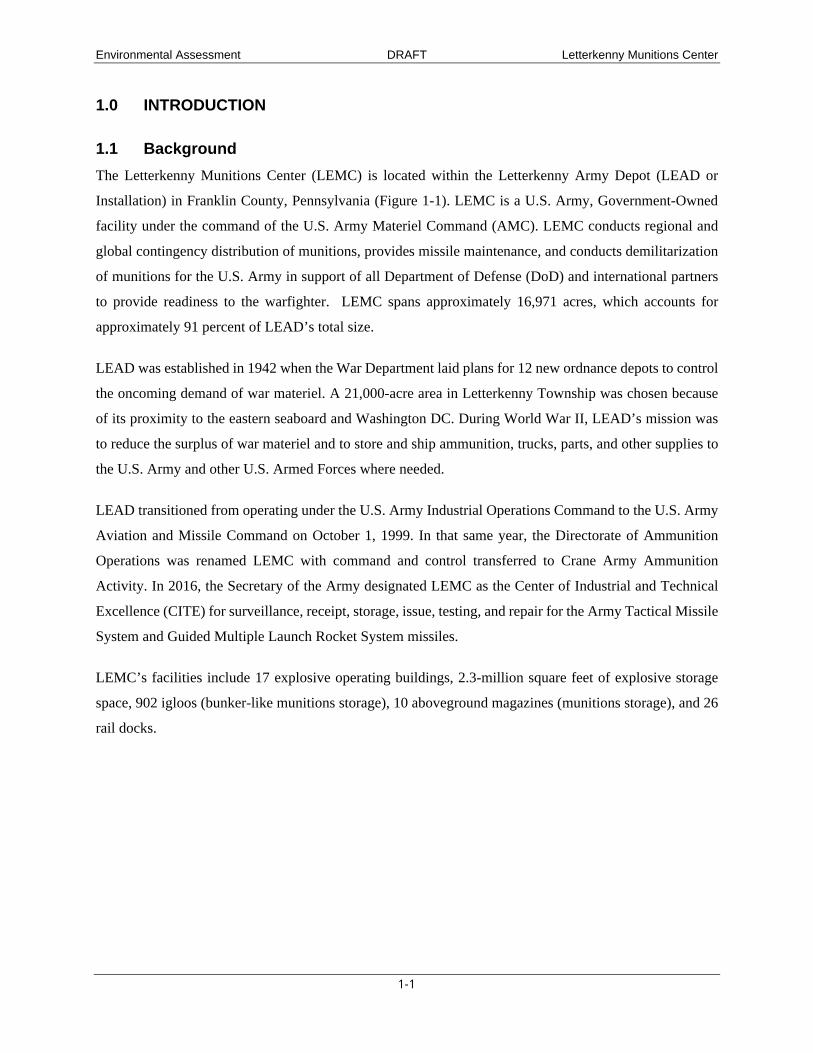
The Letterkenny Munitions Center (LEMC) is located within the Letterkenny Army Depot (LEAD or
Installation) in Franklin County, Pennsylvania (Figure 1-1). LEMC is a U.S. Army, Government-Owned
facility under the command of the U.S. Army Materiel Command (AMC). LEMC conducts regional and
global contingency distribution of munitions, provides missile maintenance, and conducts demilitarization
of munitions for the U.S. Army in support of all Department of Defense (DoD) and international partners
to provide readiness to the warfighter. LEMC spans approximately 16,971 acres, which accounts for
approximately 91 percent of LEAD’s total size.
LEAD was established in 1942 when the War Department laid plans for 12 new ordnance depots to control
the oncoming demand of war materiel. A 21,000-acre area in Letterkenny Township was chosen because
of its proximity to the eastern seaboard and Washington DC. During World War II, LEAD’s mission was
to reduce the surplus of war materiel and to store and ship ammunition, trucks, parts, and other supplies to
the U.S. Army and other U.S. Armed Forces where needed.
LEAD transitioned from operating under the U.S. Army Industrial Operations Command to the U.S. Army
Aviation and Missile Command on October 1, 1999. In that same year, the Directorate of Ammunition
Operations was renamed LEMC with command and control transferred to Crane Army Ammunition
Activity. In 2016, the Secretary of the Army designated LEMC as the Center of Industrial and Technical
Excellence (CITE) for surveillance, receipt, storage, issue, testing, and repair for the Army Tactical Missile
System and Guided Multiple Launch Rocket System missiles.
LEMC’s facilities include 17 explosive operating buildings, 2.3-million square feet of explosive storage
space, 902 igloos (bunker-like munitions storage), 10 aboveground magazines (munitions storage), and 26
rail docks.
Environmental Assessment DRAFT Letterkenny Munitions Center
1-2
Figure 1-1: Location Map for Letterkenny Munitions Center
In November 2018, LEMC and various stakeholders participated in an Area Development Plan (ADP)
Workshop. During the workshop, participants analyzed existing conditions at LEMC, formed a vision, and
developed a plan that provides for short (0-5 years), mid (6-10 years), long-range (10+ years), and capacity
real property projects within a defined planning area. From the workshop exercises and direct participant
input, the LEMC ADP was compiled. The ADP would replace the current modernization approach at
LEMC, which has reflected an inefficient piecemeal approach to siting and improving facilities based on
the most “developable” land available. The current approach offers the fewest operational constraints but
may not enhance the long-term functionality or flexibility of LEMC to accommodate various future
missions.
1.2 Purpose, Need, and Scope
1.2.1 Purpose
LEMC proposes to implement its current ADP to consolidate and modernize existing facilities, upgrade
supporting infrastructure, and provide a plan for preserving the future capacity through sustainable growth
to support ongoing and future missions with as little negative impact on the environment as possible.
Environmental Assessment DRAFT Letterkenny Munitions Center
1-3
1.2.2 Need
Modern facilities and infrastructure are needed to support the short-, mid-, and long-range operational goals
of the LEMC District. By developing a new approach to consolidate or collocate production facilities and
storage functions (as well as parking and equipment staging areas), operations would become more
streamlined. By properly siting future facilities in the most efficient and environmentally friendly layout, a
proposed series of projects would optimize production flow into the future while best protecting
environmental resources.
The following aging facilities and infrastructure need to be improved, removed, and/or replaced to support
the ongoing mission:
Munitions Storage – Nearly all the igloos need repair and modernization. The D- and G- area Igloos,
and the aboveground magazines are obsolete and in disrepair. Most of the aboveground magazines
are not being used for their intended purposes. Consolidation and strategic relocation of the igloos
is also needed to condense munition storage.
Buildings/Facilities – there are numerous buildings and facilities at LEMC that need modernization,
demolition, relocation, and/or consolidation to optimize operations, allow for adaption of multiple
uses to serve future missions, and preserve the Installation’s capacity for future missions.
Water Distribution System - The capacity of the existing water distribution system is inadequate
for the current mission and not suitable to serve LEMC’s fire protection needs. The existing
facilities do not meet the current fire protection codes; and continue to operate under a waiver.
Because of the number of facilities as well as the overall area within LEMC, additional capacity in
the form of a new 12-inch (or greater) water line is needed to comply with current fire protection
codes.
Natural Gas System - A full evaluation of the natural gas system which serves the LEMC is
recommended before any additional facilities can be connected. There are current projects
underway at LEMC which will convert the Installation over to natural gas from propane. As new
facilities are added, they would need new infrastructure to receive natural gas. A reliable and
redundant supply of natural gas is needed to modernize the current mission.
Wastewater System - The existing LEMC wastewater system is an aging collection of privatized
holding tanks that must be routinely pumped out. Due to the topography of the area, the new sewer
system will also need combinations of lift stations, force mains, and gravity flow pipes. The LEMC
district needs a new sewer system that is connected to a public sanitary sewer system that can serve
the Installation efficiently within the existing topographic constraints.
Environmental Assessment DRAFT Letterkenny Munitions Center
1-4
Electrical Distribution System - The overall condition of the existing electrical distribution lines is
considered reliable, but insufficient due to inadequate electrical system layouts. A handful of
LEMC facilities operate on a generator as they are not connected to the overall electrical
distribution system. Further, the entire complex has only one electrical meter which prohibits
analysis of individual facility consumption demand. LEMC needs an upgraded electrical
distribution center that provides a reliable and redundant source of power to all facilities.
Fiber Communications Lines - The height of the overhead fiber communication lines above certain
roadways is a concern for larger trucking operations. Communication lines need to be extended to
allow for a redundant supply between the east and west ends of LEMC.
Roadways and Gate Systems - Many of the existing roadways and gate systems have not been
adequately maintained and are failing. LEMC includes 123 miles of paved roadways and additional
unpaved roadways. The unpaved roadway network includes direct connections between storage
areas. The Voelz Gate, which is heavily utilized, lacks adequate space for overnight, queuing, and
exiting truck traffic. Trucks are frequently required to queue in non-designated space, creating
security issues. Virginia Avenue from Massachusetts Avenue to Pennsylvania Avenue, Wyoming
Avenue, part of Massachusetts Avenue along the K-area, Georgia Avenue from Massachusetts
Avenue to Bazooka Road, the southeast perimeter section of the C-area, and two areas within the
A-area are in poor condition and present immediate problems to the mission viability. Currently,
each of these are paved roadways but are not sufficient in condition and need immediate repair.
1.2.3 Applicable Regulations Considered
The intent of the National Environmental Policy Act (NEPA) is to protect, restore, and enhance the
environment by considering the environmental consequences of proposed actions during the decision-
making process. The Council on Environmental Quality (CEQ) was established under NEPA to oversee
federal policy in that process by issuing regulations [40 Code of Federal Regulations (CFR) parts 1500 –
1508]. The EA was prepared in compliance with:
AR 200-1, 28 Sep 2007, Environmental Protection and Enhancement
Clean Air Act [42 United States Code (U.S.C.) 7401 et seq.]
Clean Water Act (3 U.S.C. 1251 et seq.)
Department of Defense Pest Management Program (DoDI 4150.07)
Endangered Species Act (16 U.S.C. 1531 et seq.)
EO 11990, Protection of Wetlands
Environmental Assessment DRAFT Letterkenny Munitions Center
1-5
EO 13112, Invasive Species, as amended by EO 13751
EO 13693, Planning for Federal Sustainability In the Next Decade
EO 13751, Safeguarding the Nation from Impacts of Invasive Species (amendment to EO 13112)
Federal Insecticide, Fungicide, and Rodenticide Act (7 U.S.C. 136 et seq.)
Noxious Weed Control and Eradication Act of 2004 (Public Law 93-629) (amendment to the Plant
Protection Act [7 U.S.C. 7701 et seq.])
The Sikes Act (16 U.S.C. 670 et seq.)
1.2.4 Scope of Environmental Analysis
This environmental assessment (EA) identifies and evaluates the potential environmental, cultural, and
socioeconomic effects of implementing the LEMC ADP. Short-, mid-, and long-range projects have been
identified in the ADP and are presented in Section 2.1. This EA evaluates the short- and long-term direct,
indirect, and cumulative effects from the proposed projects and potential environmental consequences.
However, many details are not available to fully analyze the effects of each project, but the projects are
included for real property planning and capacity for future development. LEMC will conduct additional
NEPA analysis (either a Record of Environmental Condition [REC], EA, or Environmental Impact
Statement [EIS]) when project details become available. These analyses may be tiered from this EA in
accordance with 40 CFR Part 1502.20 and 32 CFR Part 651.14(c).
Additionally, LEAD has proposed to implement a separate ADP for the Industrial Core District, which
supports the main mission of the installation. The LEAD Industrial Core District ADP identifies additional
short-, mid-, and long-term installation-wide projects. A separate EA is being prepared for the Industrial
Core District ADP, and LEAD is conducting follow-on planning to implement the prioritized short-term
projects from both ADPs. The LEAD Industrial Core District ADP will include a template REC that can
also be used for RECs tiering from the LEMC ADP EA.
1.2.5 Decision to be Made
Based on the information and environmental impact analysis presented in this EA, the LEMC Commander
will decide whether the proposed action outlined in the LEAD ADP is in the best interest of the
environment, socioeconomic conditions, and the mission. If the action is deemed appropriate, the LEMC
Commander must then decide whether the impacts noted warrant a Finding of No Significant Impact
(FNSI), require the publication of a Notice of Intent (NOI) to prepare an EIS, or require other actions
consistent with NEPA and its implementing regulations.
Environmental Assessment DRAFT Letterkenny Munitions Center
1-6
1.2.6 Public Involvement
Public involvement is guided by 32 CFR part 651.36-37 and 32 CFR 651 Subpart G. This EA will be made
available to the public for review for 30 days. A Notice of Availability (NOA) of the EA will be published
in the Chambersburg Public Opinion newspaper. At the end of the 30-day public review period, LEMC
will consider the comments that individuals, agencies, or organizations submit. As appropriate, LEMC will
either execute a final EA, issue a decision document, and proceed with implementing the proposed action,
publish an NOI to prepare an EIS, or take other actions consistent with NEPA and its regulations.
Consideration of the views and information of all interested parties promotes better decision-making.
Agencies, organizations, Native American Tribes, and members of the public (including minority, low-
income, and disadvantaged persons) can participate in the decision-making process through review of the
EA and submitting comments. The U.S. Fish and Wildlife Service (USFWS) and Pennsylvania State natural
and cultural resources agencies were contacted at the outset of the EA concerning the proposed actions
(Appendix A).
Environmental Assessment Letterkenny Munitions Center
2-1
2.0 DESCRIPTION OF PROPOSED ACTION AND ALTERNATIVES
2.1 Proposed Action
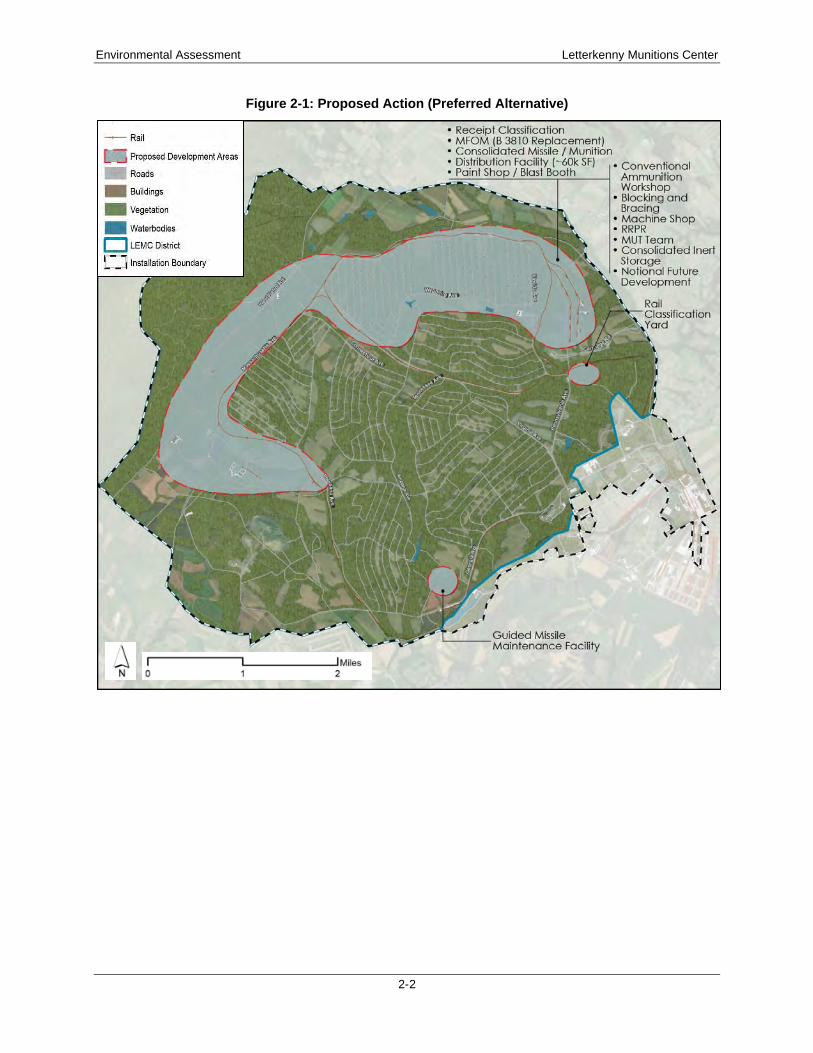
The Proposed Action is the implementation of the LEMC ADP. The Preferred Alternative is the High
Growth Scenario identified in the LEMC ADP and would consolidate future growth into the northeast
quadrant of the LEMC District. Aging igloo areas would be targeted for demolition and others strategically
relocated. The Preferred Alternative would support the following: increased mission capabilities through
the creation of modern facilities, strategic relocation of aboveground magazines into the modern facilities,
demolition and replacement of Igloo Areas D & G, and replacement of the aging and nearly obsolete igloo
facilities at the western quadrant locations. Further, the Preferred Alternative would eliminate the existing
sprawling development pattern of operations facilities by consolidating future developments to the
northeast quadrant of the LEMC. The Preferred Alternative would require implementation of a long-range
(approximately 25 years) strategy. However, the Preferred Alternative was selected because it prioritizes
logistics accessibility and operational efficiency over operational “developable” areas while creating
minimal impacts to the environment. The Preferred Alternative is the idealistic long-range vision for LEMC
(Figure 2-1).
Implementation of this scenario would take place over time in a phased manner by the projects listed by
priority in Table 2.2-1. The projects would be strategically prioritized to capitalize on previous
modernization efforts to the greatest extent possible. Approximately 26 improvement/modernization
projects have been identified that would enhance the long-term growth opportunities at LEMC by
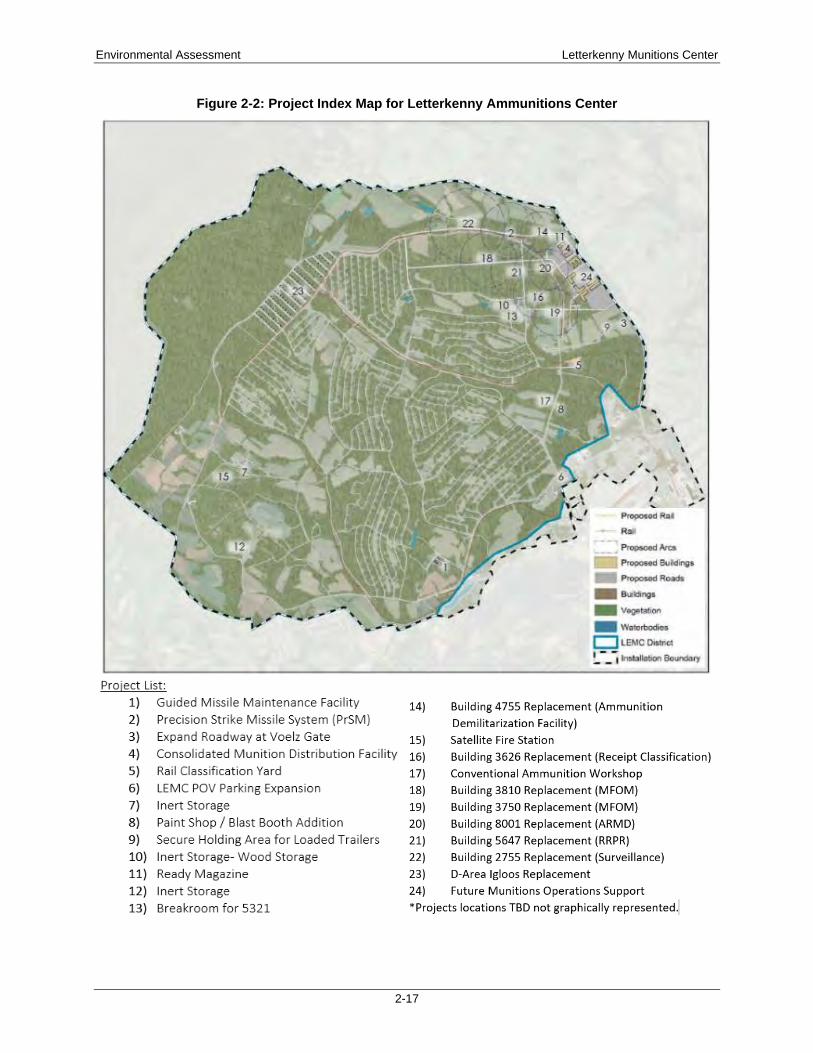
developing a more consolidated layout of operations facilities. The 4th column in Table 2.2-1 includes the
corresponding illustration reference IDs for each project, as available, and these IDs are shown on Figure
2-2.
Environmental Assessment Letterkenny Munitions Center
2-2
Figure 2-1: Proposed Action (Preferred Alternative)

Environmental Assessment Letterkenny Munitions Center
2-3
Table 2.2-1: Letterkenny Munitions Center Project List
Project Project Category Project Number
Illustrative Reference Description
SHORT-RANGE (0 – 5 YEARS)
Guided Missile Maintenance Facility
New Construction
66632 1
LEMC conducts missile maintenance for two missile compatibility types. Operations are conducted in two undersized and poorly configured facilities: Buildings 5300 and 5311 (originally designed for Small Arms storage). The two missile types cannot be collocated due to their explosive components requiring operations on one missile type to stop and be removed from the facility entirely before work on the other missile type can begin. This “facility changeover,” due to incompatibility, can create a maintenance backlog in excess of 1,000 missiles requiring certification. This backlog adversely impacts system readiness and fielding of contingency operations. Future workload projections from two of the Air Force teams could increase the facility changeover frequency by approximately 50%, further impacting LEMC’s mission readiness.
Precision Strike Missile System (PrSM)
New Construction
94216 2
Due to current capacity and existing building configuration at LEMC, there is an immediate need for an operational facility space to support certain expanding missile strike programs. Readiness requirements of the U.S. Army and U.S. Marine Corps (USMC) mean LEMC must execute two sustainment programs simultaneously. Certain expanding missile strike programs are scheduled for production in FY22, if not sooner, with an immediate requirement to maintain readiness. Production line capability is needed to support customer requirements for the U.S. Army’s production increase demand of 150% in FY20 and beyond. This organic production line will alleviate the current constraints with the prime vendor and increase production capacity to support realized warfighting requirements for Partner Nation’s operations (Foreign Military Sales (FMS)). These requirements have been identified, however LEMC does not currently have adequate facilities to support these future U.S. Army, USMC, and National Security readiness requirements.

Environmental Assessment Letterkenny Munitions Center
2-4
Table 2.2-1: Letterkenny Munitions Center Project List
Project Project Category Project Number
Illustrative Reference Description
Rail Modernization Infrastructure Upgrade
91782 N/A
This project is required to upgrade 22 miles of the rail network located in the LEMC’s ammunition storage area from the 80-lb rail (circa 1942) to 136-lb rail to accommodate increased weight of locomotives and materiel. A complete inspection and repair of the main rail line and sidings will be performed. Ties, tie plates, switches, joint bars, bolts, and other accessories will be replaced as needed.
Expand Roadway at Voelz Gate
Infrastructure Upgrade/New Construction
LEAD 532415
3
This project would result in the construction of a compressed stone lot for staging of incoming trucks in the area of the Voelz Gate. This upgrade is needed to streamline and queue incoming trucks in order to allow for separation of scheduled trucks versus dropped trucks. As LEMC's workload will be continuing to increase over the next 5 years, expansion of the current area will allow a smoother transition of incoming and outgoing trucks to meet scheduled shipments and deliveries. LEMC will not change the future scope or purpose of this interchange.
Consolidated Munition Distribution Facility
New Construction
86433 4
Currently, there is no facility at LEMC designed to load both full truck loads and Less than Truck Load (LTL) shipments. LEMC utilizes an LTL building which was designed based on the LTL shipping demands of the 1980s. LEMC attempts to consolidate loads whenever possible using the LTL facility. This process has resulted in congested aisleways and inefficient workflow. The current measures being implemented to mitigate the issue are not enough to keep up with current and future demand. A new consolidated munition distribution facility is needed.
Environmental Assessment DRAFT Letterkenny Munitions Center
2-6
Table 2.2-1: Letterkenny Munitions Center Project List
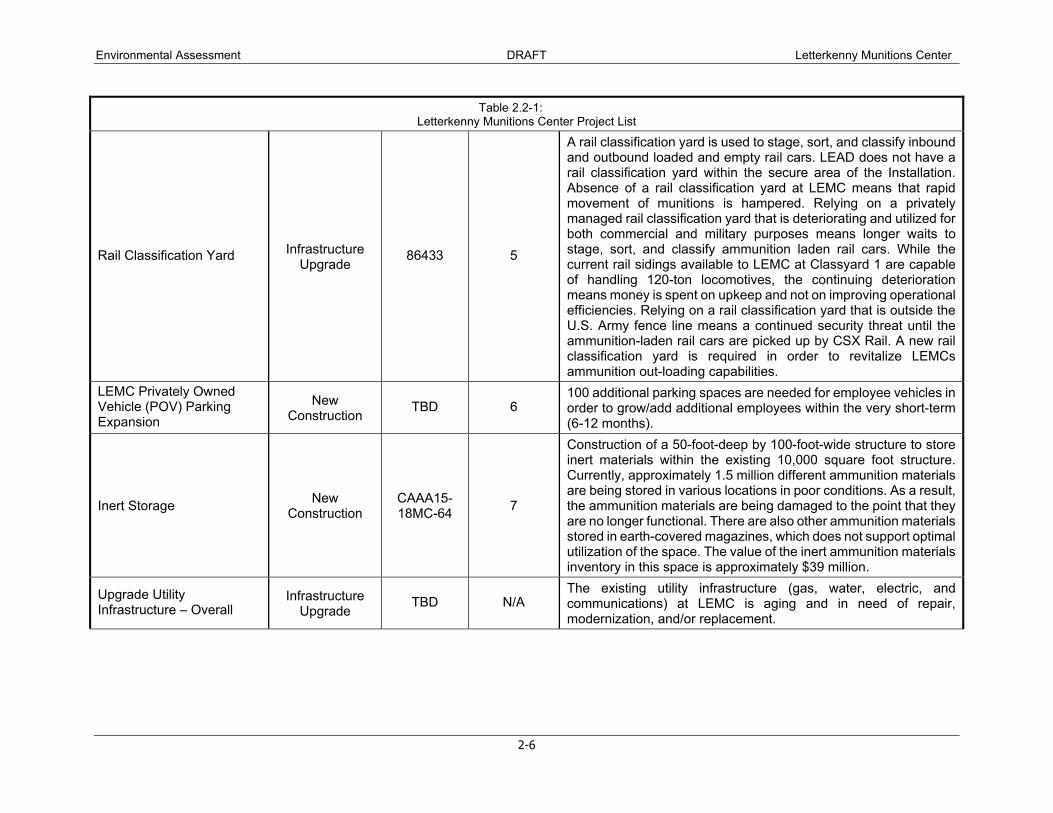
Rail Classification Yard Infrastructure Upgrade 86433 5
A rail classification yard is used to stage, sort, and classify inbound and outbound loaded and empty rail cars. LEAD does not have a rail classification yard within the secure area of the Installation. Absence of a rail classification yard at LEMC means that rapid movement of munitions is hampered. Relying on a privately managed rail classification yard that is deteriorating and utilized for both commercial and military purposes means longer waits to stage, sort, and classify ammunition laden rail cars. While the current rail sidings available to LEMC at Classyard 1 are capable of handling 120-ton locomotives, the continuing deterioration means money is spent on upkeep and not on improving operational efficiencies. Relying on a rail classification yard that is outside the U.S. Army fence line means a continued security threat until the ammunition-laden rail cars are picked up by CSX Rail. A new rail classification yard is required in order to revitalize LEMCs ammunition out-loading capabilities.
LEMC Privately Owned Vehicle (POV) Parking Expansion
New Construction TBD 6
100 additional parking spaces are needed for employee vehicles in order to grow/add additional employees within the very short-term (6-12 months).
Inert Storage New Construction
CAAA15-18MC-64 7
Construction of a 50-foot-deep by 100-foot-wide structure to store inert materials within the existing 10,000 square foot structure. Currently, approximately 1.5 million different ammunition materials are being stored in various locations in poor conditions. As a result, the ammunition materials are being damaged to the point that they are no longer functional. There are also other ammunition materials stored in earth-covered magazines, which does not support optimal utilization of the space. The value of the inert ammunition materials inventory in this space is approximately $39 million.
Upgrade Utility Infrastructure – Overall
Infrastructure Upgrade TBD N/A
The existing utility infrastructure (gas, water, electric, and communications) at LEMC is aging and in need of repair, modernization, and/or replacement.
Environmental Assessment Letterkenny Munitions Center
2-6
Table 2.2-1: Letterkenny Munitions Center Project List
Project Project Category Project Number
Illustrative Reference Description
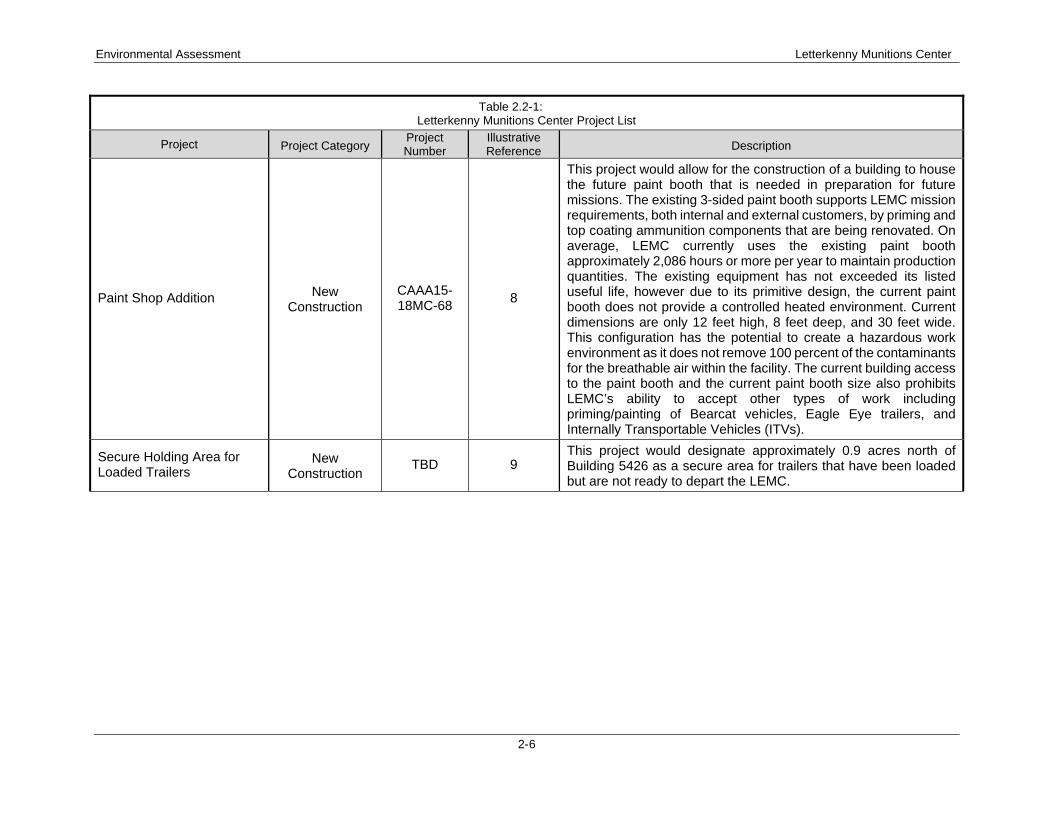
Paint Shop Addition New Construction
CAAA15-18MC-68
8
This project would allow for the construction of a building to house the future paint booth that is needed in preparation for future missions. The existing 3-sided paint booth supports LEMC mission requirements, both internal and external customers, by priming and top coating ammunition components that are being renovated. On average, LEMC currently uses the existing paint booth approximately 2,086 hours or more per year to maintain production quantities. The existing equipment has not exceeded its listed useful life, however due to its primitive design, the current paint booth does not provide a controlled heated environment. Current dimensions are only 12 feet high, 8 feet deep, and 30 feet wide. This configuration has the potential to create a hazardous work environment as it does not remove 100 percent of the contaminants for the breathable air within the facility. The current building access to the paint booth and the current paint booth size also prohibits LEMC’s ability to accept other types of work including priming/painting of Bearcat vehicles, Eagle Eye trailers, and Internally Transportable Vehicles (ITVs).
Secure Holding Area for Loaded Trailers
New Construction
TBD 9 This project would designate approximately 0.9 acres north of Building 5426 as a secure area for trailers that have been loaded but are not ready to depart the LEMC.
Environmental Assessment Letterkenny Munitions Center
2-7
Table 2.2-1: Letterkenny Munitions Center Project List
Project Project Category Project Number
Illustrative Reference Description
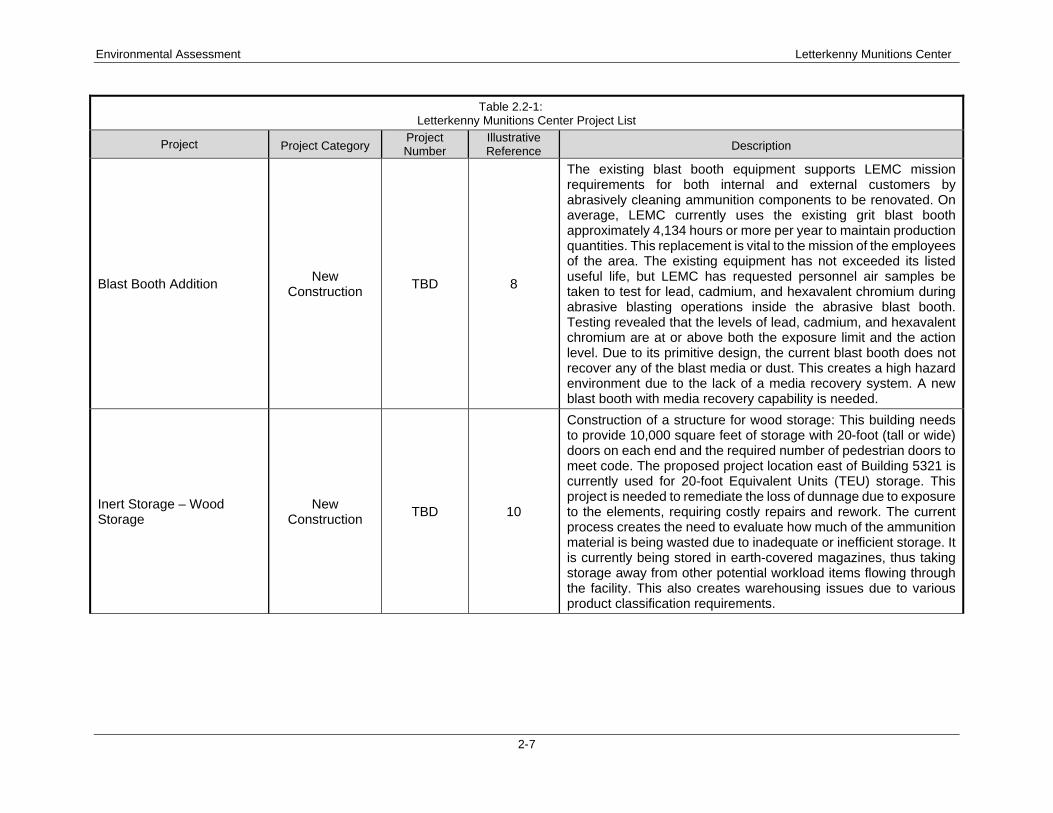
Blast Booth Addition New
Construction TBD 8
The existing blast booth equipment supports LEMC mission requirements for both internal and external customers by abrasively cleaning ammunition components to be renovated. On average, LEMC currently uses the existing grit blast booth approximately 4,134 hours or more per year to maintain production quantities. This replacement is vital to the mission of the employees of the area. The existing equipment has not exceeded its listed useful life, but LEMC has requested personnel air samples be taken to test for lead, cadmium, and hexavalent chromium during abrasive blasting operations inside the abrasive blast booth. Testing revealed that the levels of lead, cadmium, and hexavalent chromium are at or above both the exposure limit and the action level. Due to its primitive design, the current blast booth does not recover any of the blast media or dust. This creates a high hazard environment due to the lack of a media recovery system. A new blast booth with media recovery capability is needed.
Inert Storage – Wood Storage
New Construction
TBD 10
Construction of a structure for wood storage: This building needs to provide 10,000 square feet of storage with 20-foot (tall or wide) doors on each end and the required number of pedestrian doors to meet code. The proposed project location east of Building 5321 is currently used for 20-foot Equivalent Units (TEU) storage. This project is needed to remediate the loss of dunnage due to exposure to the elements, requiring costly repairs and rework. The current process creates the need to evaluate how much of the ammunition material is being wasted due to inadequate or inefficient storage. It is currently being stored in earth-covered magazines, thus taking storage away from other potential workload items flowing through the facility. This also creates warehousing issues due to various product classification requirements.
Environmental Assessment Letterkenny Munitions Center
2-8
Table 2.2-1: Letterkenny Munitions Center Project List
Project Project Category Project Number
Illustrative Reference Description
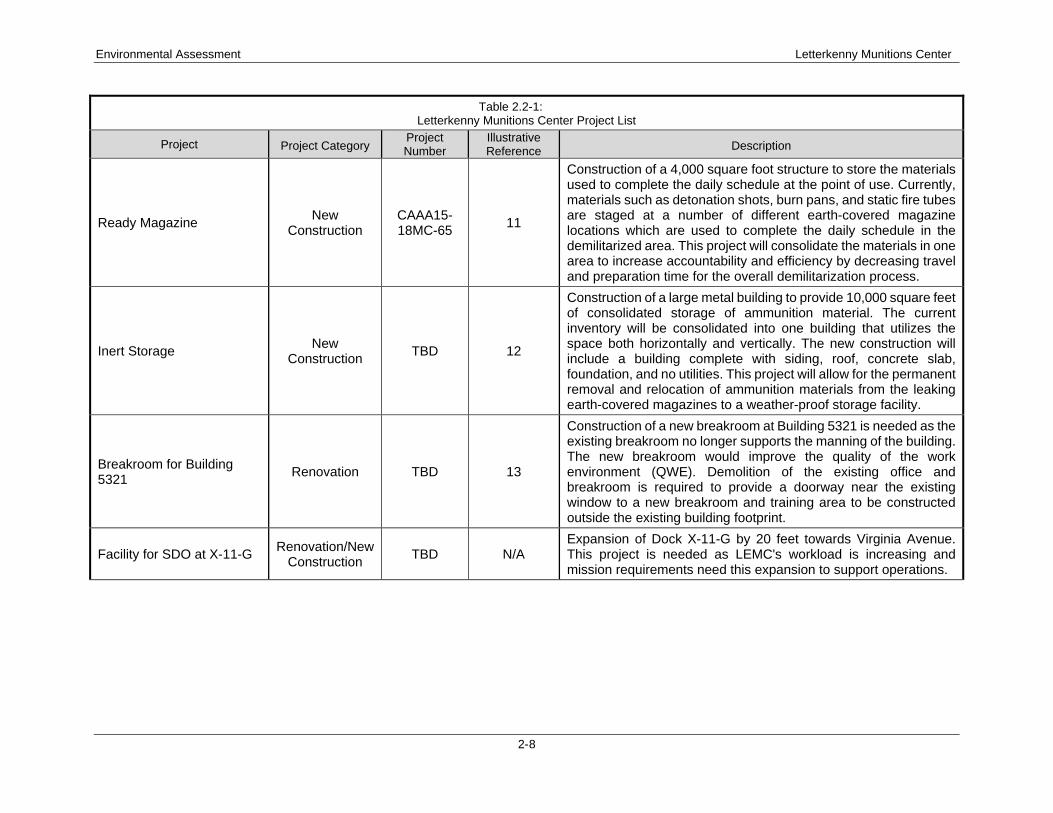
Ready Magazine New
Construction CAAA15-18MC-65
11
Construction of a 4,000 square foot structure to store the materials used to complete the daily schedule at the point of use. Currently, materials such as detonation shots, burn pans, and static fire tubes are staged at a number of different earth-covered magazine locations which are used to complete the daily schedule in the demilitarized area. This project will consolidate the materials in one area to increase accountability and efficiency by decreasing travel and preparation time for the overall demilitarization process.
Inert Storage New
Construction TBD 12
Construction of a large metal building to provide 10,000 square feet of consolidated storage of ammunition material. The current inventory will be consolidated into one building that utilizes the space both horizontally and vertically. The new construction will include a building complete with siding, roof, concrete slab, foundation, and no utilities. This project will allow for the permanent removal and relocation of ammunition materials from the leaking earth-covered magazines to a weather-proof storage facility.
Breakroom for Building 5321
Renovation TBD 13
Construction of a new breakroom at Building 5321 is needed as the existing breakroom no longer supports the manning of the building. The new breakroom would improve the quality of the work environment (QWE). Demolition of the existing office and breakroom is required to provide a doorway near the existing window to a new breakroom and training area to be constructed outside the existing building footprint.
Facility for SDO at X-11-G Renovation/New
Construction TBD N/A
Expansion of Dock X-11-G by 20 feet towards Virginia Avenue. This project is needed as LEMC's workload is increasing and mission requirements need this expansion to support operations.

Environmental Assessment Letterkenny Munitions Center
2-9
Table 2.2-1: Letterkenny Munitions Center Project List
Project Project Category Project Number
Illustrative Reference Description
Restoration of Transportation Infrastructure (Rail)
Infrastructure Upgrade
TBD N/A
This project is required to repair 4 miles of the rail network located in the southern section of LEMC’s ammunition storage area. A complete inspection and repair of the south rail section will be performed including replacement of ties, tie plates, switches, joint bars, bolts, and rail segments. Completion of this project will result in a fully functional rail network for LEMC to provide safe and efficient transportation of munitions, material, and equipment via rail at LEAD. LEMC, a Tier 1 facility for the U.S. Army Strategic Mobility Program, is responsible for receiving munitions for recertification and/or storage, as well as shipping munitions in support of the joint warfighter. LEMC is the CITE for surveillance, receipt, storage, issue, testing, and repair for the U.S. Army Tactical Missile System and Guided Multiple Launch Rocket System missiles.
Environmental Assessment Letterkenny Munitions Center
2-10
Table 2.2-1: Letterkenny Munitions Center Project List
Project Project Category Project Number
Illustrative Reference Description
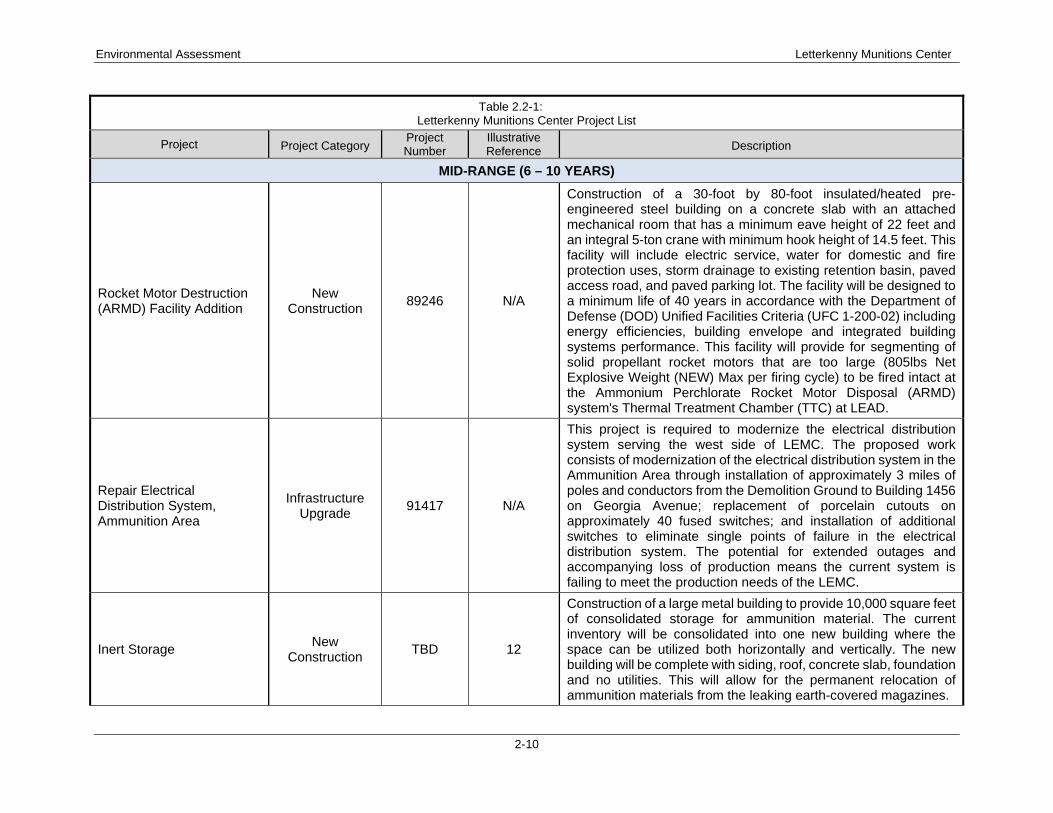
MID-RANGE (6 – 10 YEARS)
Rocket Motor Destruction (ARMD) Facility Addition
New Construction
89246 N/A
Construction of a 30-foot by 80-foot insulated/heated pre-engineered steel building on a concrete slab with an attached mechanical room that has a minimum eave height of 22 feet and an integral 5-ton crane with minimum hook height of 14.5 feet. This facility will include electric service, water for domestic and fire protection uses, storm drainage to existing retention basin, paved access road, and paved parking lot. The facility will be designed to a minimum life of 40 years in accordance with the Department of Defense (DOD) Unified Facilities Criteria (UFC 1-200-02) including energy efficiencies, building envelope and integrated building systems performance. This facility will provide for segmenting of solid propellant rocket motors that are too large (805lbs Net Explosive Weight (NEW) Max per firing cycle) to be fired intact at the Ammonium Perchlorate Rocket Motor Disposal (ARMD) system's Thermal Treatment Chamber (TTC) at LEAD.
Repair Electrical Distribution System, Ammunition Area
Infrastructure Upgrade
91417 N/A
This project is required to modernize the electrical distribution system serving the west side of LEMC. The proposed work consists of modernization of the electrical distribution system in the Ammunition Area through installation of approximately 3 miles of poles and conductors from the Demolition Ground to Building 1456 on Georgia Avenue; replacement of porcelain cutouts on approximately 40 fused switches; and installation of additional switches to eliminate single points of failure in the electrical distribution system. The potential for extended outages and accompanying loss of production means the current system is failing to meet the production needs of the LEMC.
Inert Storage New
Construction TBD 12
Construction of a large metal building to provide 10,000 square feet of consolidated storage for ammunition material. The current inventory will be consolidated into one new building where the space can be utilized both horizontally and vertically. The new building will be complete with siding, roof, concrete slab, foundation and no utilities. This will allow for the permanent relocation of ammunition materials from the leaking earth-covered magazines.
Environmental Assessment Letterkenny Munitions Center
2-11
Table 2.2-1: Letterkenny Munitions Center Project List
Project Project Category Project Number
Illustrative Reference Description
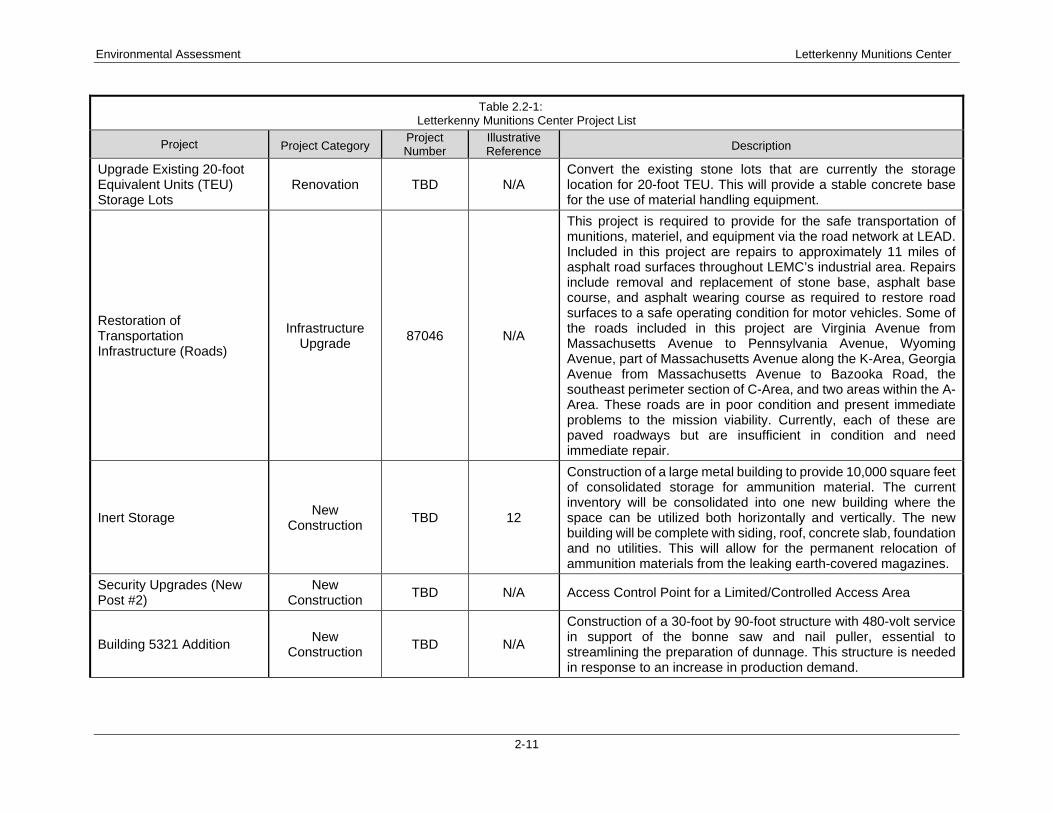
Upgrade Existing 20-foot Equivalent Units (TEU) Storage Lots
Renovation TBD N/A Convert the existing stone lots that are currently the storage location for 20-foot TEU. This will provide a stable concrete base for the use of material handling equipment.
Restoration of Transportation Infrastructure (Roads)
Infrastructure Upgrade
87046 N/A
This project is required to provide for the safe transportation of munitions, materiel, and equipment via the road network at LEAD. Included in this project are repairs to approximately 11 miles of asphalt road surfaces throughout LEMC’s industrial area. Repairs include removal and replacement of stone base, asphalt base course, and asphalt wearing course as required to restore road surfaces to a safe operating condition for motor vehicles. Some of the roads included in this project are Virginia Avenue from Massachusetts Avenue to Pennsylvania Avenue, Wyoming Avenue, part of Massachusetts Avenue along the K-Area, Georgia Avenue from Massachusetts Avenue to Bazooka Road, the southeast perimeter section of C-Area, and two areas within the A-Area. These roads are in poor condition and present immediate problems to the mission viability. Currently, each of these are paved roadways but are insufficient in condition and need immediate repair.
Inert Storage New
Construction TBD 12
Construction of a large metal building to provide 10,000 square feet of consolidated storage for ammunition material. The current inventory will be consolidated into one new building where the space can be utilized both horizontally and vertically. The new building will be complete with siding, roof, concrete slab, foundation and no utilities. This will allow for the permanent relocation of ammunition materials from the leaking earth-covered magazines.
Security Upgrades (New Post #2)
New Construction
TBD N/A Access Control Point for a Limited/Controlled Access Area
Building 5321 Addition New
Construction TBD N/A
Construction of a 30-foot by 90-foot structure with 480-volt service in support of the bonne saw and nail puller, essential to streamlining the preparation of dunnage. This structure is needed in response to an increase in production demand.

Environmental Assessment Letterkenny Munitions Center
2-12
Table 2.2-1: Letterkenny Munitions Center Project List
Project Project Category Project Number
Illustrative Reference Description
Inert Storage New
Construction TBD N/A
Construction of a large metal building to provide 10,000 square feet of consolidated storage for ammunition material. The current inventory will be consolidated into one new building where the space can be utilized both horizontally and vertically. The new building will be complete with siding, roof, concrete slab, foundation and no utilities. This will allow for the permanent relocation of ammunition materials from the leaking earth-covered magazines.
Project for Modernization of Building 3700
Renovation 94432 N/A
This project will provide upgrades to the building exterior envelope, superstructure, site, and interior configuration and finishes, and code compliant building improvements for HVAC, electrical, communications, and fire systems. Building exterior and envelope improvements include installing site and dock lighting; installing canopy above overhead doors; installing lightning protection system; replacing overhead doors; and replacing exterior windows. Superstructure improvements include replacing the roof system. Interior construction includes repairing concrete floors; installing a static grounding system in production areas; installing interior doors; improving interior lighting fixtures; and painting interior walls.
Inert Storage New
Construction TBD N/A
Construction of a large metal building to provide 10,000 square feet of consolidated storage for ammunition material. The current inventory will be consolidated into one new building where the space can be utilized both horizontally and vertically. The new building will be complete with siding, roof, concrete slab, foundation and no utilities. This will allow for the permanent relocation of ammunition materials from the leaking earth-covered magazines.
Environmental Assessment Letterkenny Munitions Center
2-13
Table 2.2-1: Letterkenny Munitions Center Project List
Project Project Category Project Number
Illustrative Reference Description
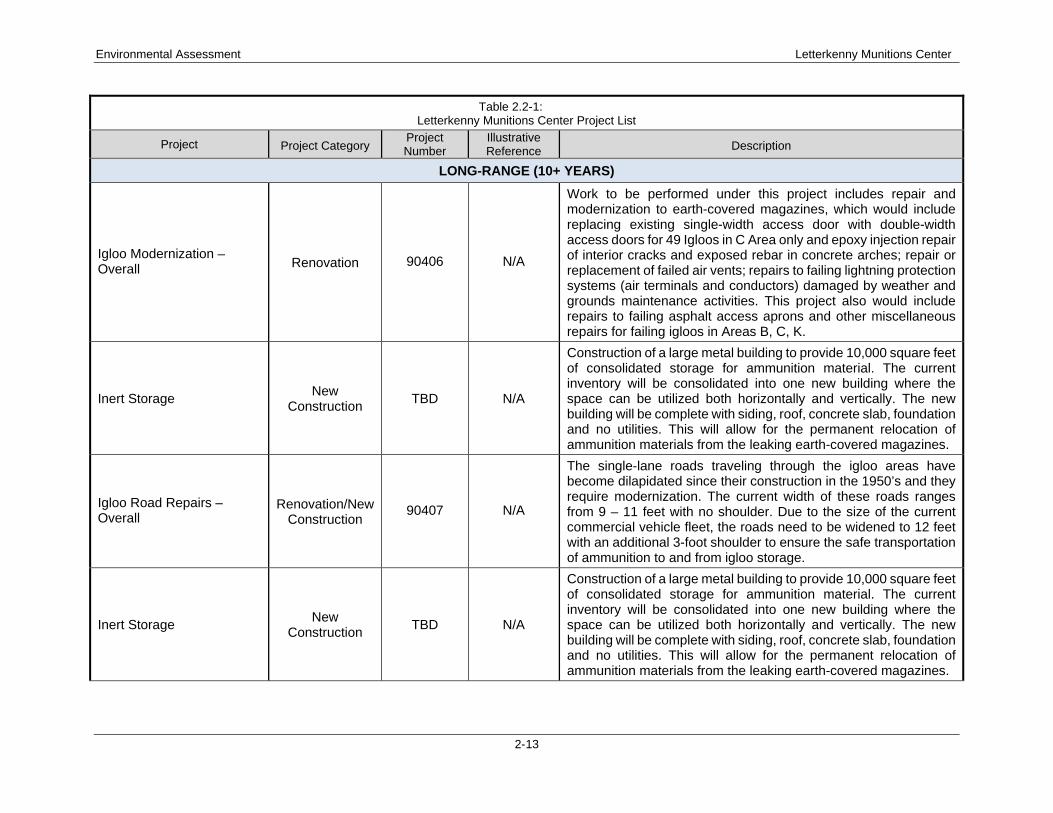
LONG-RANGE (10+ YEARS)
Igloo Modernization – Overall Renovation 90406 N/A
Work to be performed under this project includes repair and modernization to earth-covered magazines, which would include replacing existing single-width access door with double-width access doors for 49 Igloos in C Area only and epoxy injection repair of interior cracks and exposed rebar in concrete arches; repair or replacement of failed air vents; repairs to failing lightning protection systems (air terminals and conductors) damaged by weather and grounds maintenance activities. This project also would include repairs to failing asphalt access aprons and other miscellaneous repairs for failing igloos in Areas B, C, K.
Inert Storage New
Construction TBD N/A
Construction of a large metal building to provide 10,000 square feet of consolidated storage for ammunition material. The current inventory will be consolidated into one new building where the space can be utilized both horizontally and vertically. The new building will be complete with siding, roof, concrete slab, foundation and no utilities. This will allow for the permanent relocation of ammunition materials from the leaking earth-covered magazines.
Igloo Road Repairs – Overall
Renovation/New Construction
90407 N/A
The single-lane roads traveling through the igloo areas have become dilapidated since their construction in the 1950’s and they require modernization. The current width of these roads ranges from 9 – 11 feet with no shoulder. Due to the size of the current commercial vehicle fleet, the roads need to be widened to 12 feet with an additional 3-foot shoulder to ensure the safe transportation of ammunition to and from igloo storage.
Inert Storage New
Construction TBD N/A
Construction of a large metal building to provide 10,000 square feet of consolidated storage for ammunition material. The current inventory will be consolidated into one new building where the space can be utilized both horizontally and vertically. The new building will be complete with siding, roof, concrete slab, foundation and no utilities. This will allow for the permanent relocation of ammunition materials from the leaking earth-covered magazines.
Environmental Assessment Letterkenny Munitions Center
2-14
Table 2.2-1: Letterkenny Munitions Center Project List
Project Project Category Project Number
Illustrative Reference Description
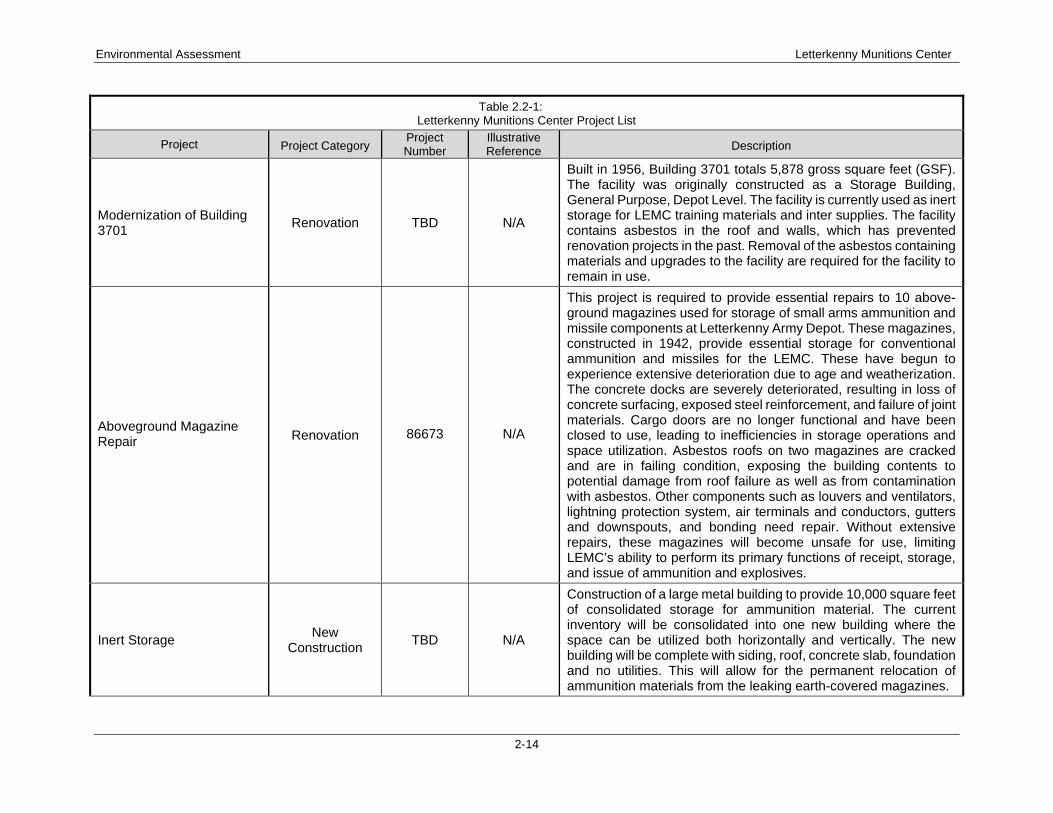
Modernization of Building 3701
Renovation TBD N/A
Built in 1956, Building 3701 totals 5,878 gross square feet (GSF). The facility was originally constructed as a Storage Building, General Purpose, Depot Level. The facility is currently used as inert storage for LEMC training materials and inter supplies. The facility contains asbestos in the roof and walls, which has prevented renovation projects in the past. Removal of the asbestos containing materials and upgrades to the facility are required for the facility to remain in use.
Aboveground Magazine Repair Renovation 86673 N/A
This project is required to provide essential repairs to 10 above-ground magazines used for storage of small arms ammunition and missile components at Letterkenny Army Depot. These magazines, constructed in 1942, provide essential storage for conventional ammunition and missiles for the LEMC. These have begun to experience extensive deterioration due to age and weatherization. The concrete docks are severely deteriorated, resulting in loss of concrete surfacing, exposed steel reinforcement, and failure of joint materials. Cargo doors are no longer functional and have been closed to use, leading to inefficiencies in storage operations and space utilization. Asbestos roofs on two magazines are cracked and are in failing condition, exposing the building contents to potential damage from roof failure as well as from contamination with asbestos. Other components such as louvers and ventilators, lightning protection system, air terminals and conductors, gutters and downspouts, and bonding need repair. Without extensive repairs, these magazines will become unsafe for use, limiting LEMC’s ability to perform its primary functions of receipt, storage, and issue of ammunition and explosives.
Inert Storage New
Construction TBD N/A
Construction of a large metal building to provide 10,000 square feet of consolidated storage for ammunition material. The current inventory will be consolidated into one new building where the space can be utilized both horizontally and vertically. The new building will be complete with siding, roof, concrete slab, foundation and no utilities. This will allow for the permanent relocation of ammunition materials from the leaking earth-covered magazines.
Environmental Assessment Letterkenny Munitions Center
2-15
Table 2.2-1: Letterkenny Munitions Center Project List
Project Project Category Project Number
Illustrative Reference Description
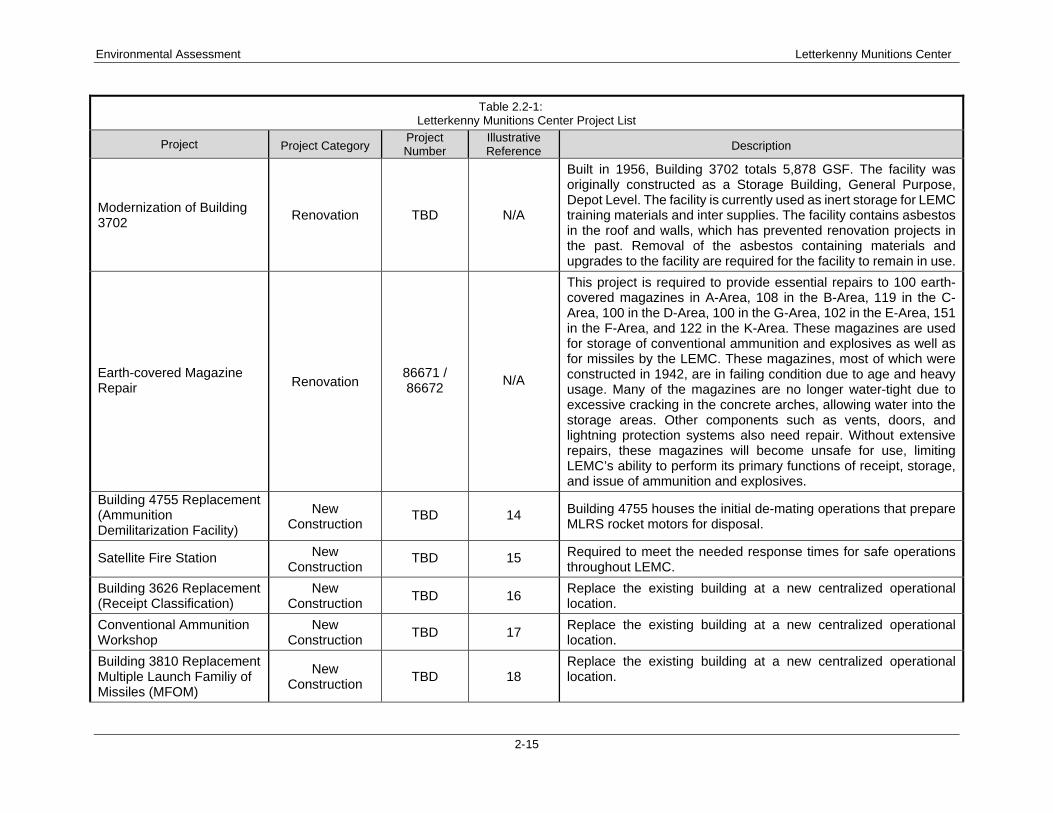
Modernization of Building 3702
Renovation TBD N/A
Built in 1956, Building 3702 totals 5,878 GSF. The facility was originally constructed as a Storage Building, General Purpose, Depot Level. The facility is currently used as inert storage for LEMC training materials and inter supplies. The facility contains asbestos in the roof and walls, which has prevented renovation projects in the past. Removal of the asbestos containing materials and upgrades to the facility are required for the facility to remain in use.
Earth-covered Magazine Repair Renovation
86671 / 86672
N/A
This project is required to provide essential repairs to 100 earth-covered magazines in A-Area, 108 in the B-Area, 119 in the C-Area, 100 in the D-Area, 100 in the G-Area, 102 in the E-Area, 151 in the F-Area, and 122 in the K-Area. These magazines are used for storage of conventional ammunition and explosives as well as for missiles by the LEMC. These magazines, most of which were constructed in 1942, are in failing condition due to age and heavy usage. Many of the magazines are no longer water-tight due to excessive cracking in the concrete arches, allowing water into the storage areas. Other components such as vents, doors, and lightning protection systems also need repair. Without extensive repairs, these magazines will become unsafe for use, limiting LEMC’s ability to perform its primary functions of receipt, storage, and issue of ammunition and explosives.
Building 4755 Replacement (Ammunition Demilitarization Facility)
New Construction
TBD 14 Building 4755 houses the initial de-mating operations that prepare MLRS rocket motors for disposal.
Satellite Fire Station New Construction
TBD 15 Required to meet the needed response times for safe operations throughout LEMC.
Building 3626 Replacement (Receipt Classification)
New Construction
TBD 16 Replace the existing building at a new centralized operational location.
Conventional Ammunition Workshop
New Construction
TBD 17 Replace the existing building at a new centralized operational location.
Building 3810 Replacement Multiple Launch Familiy of Missiles (MFOM)
New Construction
TBD 18 Replace the existing building at a new centralized operational location.
Environmental Assessment Letterkenny Munitions Center
2-16
Table 2.2-1: Letterkenny Munitions Center Project List
Project Project Category Project Number
Illustrative Reference Description
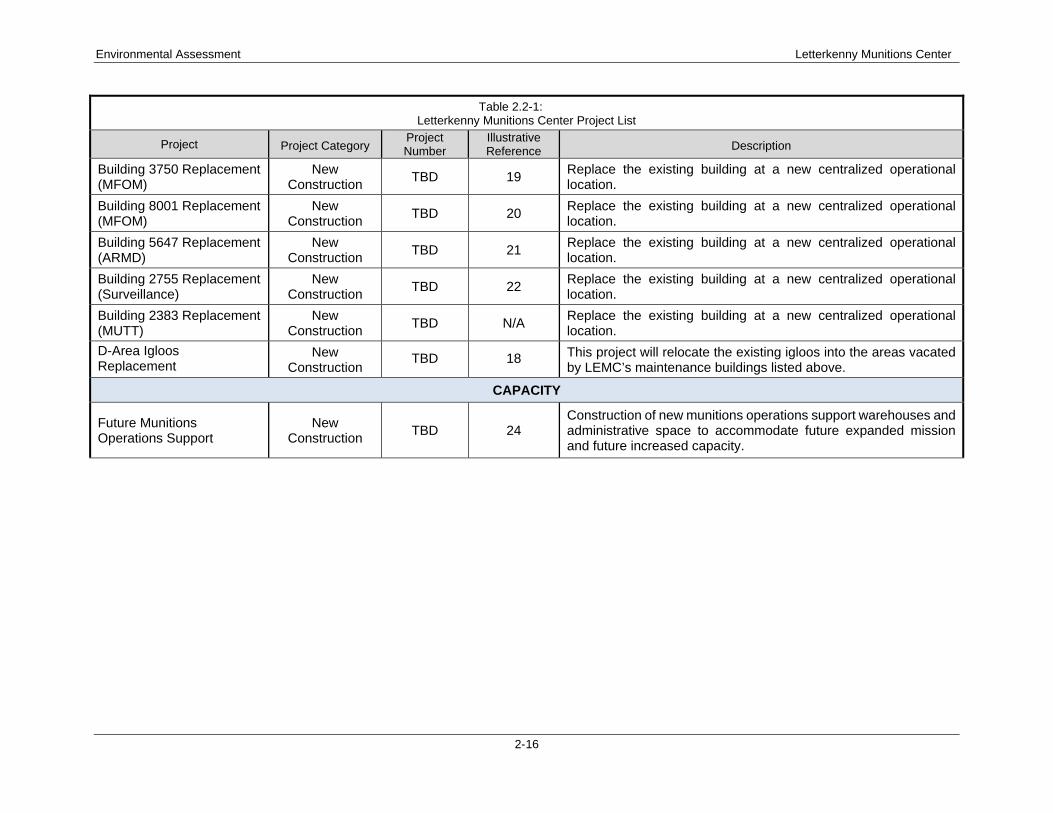
Building 3750 Replacement (MFOM)
New Construction
TBD 19 Replace the existing building at a new centralized operational location.
Building 8001 Replacement (MFOM)
New Construction
TBD 20 Replace the existing building at a new centralized operational location.
Building 5647 Replacement (ARMD)
New Construction
TBD 21 Replace the existing building at a new centralized operational location.
Building 2755 Replacement (Surveillance)
New Construction
TBD 22 Replace the existing building at a new centralized operational location.
Building 2383 Replacement (MUTT)
New Construction
TBD N/A Replace the existing building at a new centralized operational location.
D-Area Igloos Replacement
New Construction
TBD 18 This project will relocate the existing igloos into the areas vacated by LEMC’s maintenance buildings listed above.
CAPACITY
Future Munitions Operations Support
New Construction
TBD 24 Construction of new munitions operations support warehouses and administrative space to accommodate future expanded mission and future increased capacity.
Environmental Assessment Letterkenny Munitions Center
2-17
Figure 2-2: Project Index Map for Letterkenny Ammunitions Center
Environmental Assessment Letterkenny Munitions Center
2-18
2.2 Screening Criteria
The four most significant screening criteria considered when analyzing possible project and alternative
scenarios included:
• Operational constraints;
• Environmental constraints;
• Developable areas; and
• Logistics accessibility and operational efficiency
2.2.1 Operational Constraints
Explosive Safety Quantity-Distance (ESQD) Arcs are safety buffers intended to protect explosive mission
functions from encroaching on development while protecting life and property from explosive hazards.
Inhabited development, incompatible with explosives operations, is prohibited within ESQD Arcs. There
are also facility safety buffers that cannot overlap other inhabited facilities. Operational constraints are a
primary limiting factor for future development in the LEMC District. While these constraints are restrictive,
they do not prohibit development of in-kind missions (i.e. explosives-related facilities within igloo buffers).
2.2.2 Environmental Constraints
LEMC is mostly covered in dense vegetation because of the sprawling layout of the igloos. Other major
land cover includes agricultural fields, streams and wetlands, and environmental restoration sites. Hunting
and fishing are permitted on the Installation in certain areas. There are six observed state-protected animal
species at LEMC and eight known cemeteries within the district boundary.
2.2.3 Developable Areas
After identifying areas constrained by ESQD Arcs, environmental considerations, and facility buffers, areas
that are mostly open and have few constraints to development were highlighted. Areas with existing ESQD
Arcs and facility buffers that can be consolidated and/or relocated were also identified as developable. In
total there are approximately 3,556 acres of high buildable area, 7,822 acres of medium buildable area, and
5,470 acres of low buildable area inside the LEMC district.
2.2.4 Logistics Accessibility and Operational Efficiency
The current development pattern at LEMC is piecemeal and sprawling based on developable land and
operational constraints. This pattern works with the current operational conditions but is inefficient in terms
of transit times and costly in terms of infrastructure maintenance funding. LEMC evaluated alternatives
that would eliminate the sprawling development pattern and consolidate operational facilities to one area
Environmental Assessment Letterkenny Munitions Center
2-19
of the Installation. This approach would result in lower infrastructure repair costs and would facilitate
increased mission capabilities through creation of modern, adaptable, and flexible facilities and modern
igloos.
2.3 Alternatives Considered but Eliminated from Further Consideration
Each of the Alternatives evaluated is intended to provide distinct future development scenarios. The
planning requirements and anticipated results for two other alternatives are described below. However,
these alternatives were not carried forward for analysis because they do not meet the purpose and need to
consolidate and modernize existing facilities while providing a long-range plan for sustainable growth to
support ongoing and future missions.
2.3.1 Alternative 1 – Limited Growth Scenario Alternative 1 presents a limited growth scenario. Figure 2-3 presents an overview of Alternative 1
developments. The current planning and development pattern within LEMC would remain unchanged.
Alternative 1 would only allow for improvements within certain areas of LEMC, which would continue the
existing sprawling development pattern rather than consolidate operations. Because Alternative 1 would
not result in the creation of adaptable, flexible facilities connected by modern infrastructure, it would not
meet the purpose and need described in Sections 1.2.1 and 1.2.2. Therefore, Alternative 1 was eliminated
from further consideration and will not be further analyzed in this EA.

Environmental Assessment Letterkenny Munitions Center
2-20
Figure 2-3: Alternative 1 – Limited Growth Scenario
Environmental Assessment Letterkenny Munitions Center
2-21
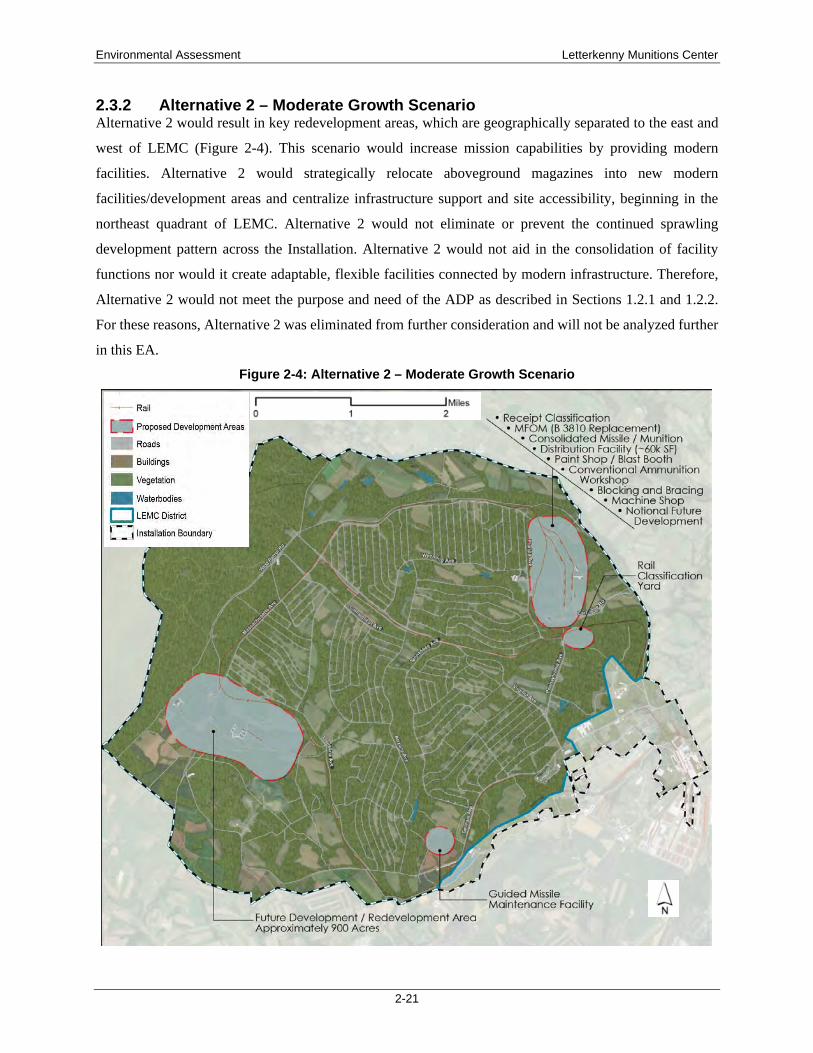
2.3.2 Alternative 2 – Moderate Growth Scenario Alternative 2 would result in key redevelopment areas, which are geographically separated to the east and
west of LEMC (Figure 2-4). This scenario would increase mission capabilities by providing modern
facilities. Alternative 2 would strategically relocate aboveground magazines into new modern
facilities/development areas and centralize infrastructure support and site accessibility, beginning in the
northeast quadrant of LEMC. Alternative 2 would not eliminate or prevent the continued sprawling
development pattern across the Installation. Alternative 2 would not aid in the consolidation of facility
functions nor would it create adaptable, flexible facilities connected by modern infrastructure. Therefore,
Alternative 2 would not meet the purpose and need of the ADP as described in Sections 1.2.1 and 1.2.2.
For these reasons, Alternative 2 was eliminated from further consideration and will not be analyzed further
in this EA.
Figure 2-4: Alternative 2 – Moderate Growth Scenario

Environmental Assessment Letterkenny Munitions Center
2-22
2.4 No Action Alternative
Under the No Action Alternative, the LEMC ADP would not be implemented. Without modernization of
facilities and infrastructure, facility expansions would continue to sprawl along the path of least resistance.
The ability to consolidate operations without a plan in place is a challenge. LEMC would have less
flexibility in facility uses and mission viability would be compromised. As a result, the No Action
Alternative does not fulfill the Proposed Action’s purpose and need. It is included in this analysis because
it provides a baseline against which the beneficial and adverse impacts of the other alternatives can be
compared.
Environmental Assessment Letterkenny Munitions Center
3-1
3.0 AFFECTED ENVIRONMENT AND ENVIRONMENTAL CONSEQUENCES
The affected environment sections describe the existing conditions of the natural, cultural, and social
resources, against which environmental effects of the Proposed Action and No Action Alternative are
evaluated. The existing environmental conditions are presented first for each environmental resource or
condition, followed immediately thereafter by an evaluation of the consequence(s) of the Proposed Action
and No Action Alternative.
The environmental consequences sections present a general analysis of the environmental effects on each
resource area associated with the proposed construction, demolition, and infrastructure improvement
projects outlined in the ADP and this EA. The significance of an action is measured in terms of its duration,
whether the impacts are direct or indirect, the magnitude of the impacts, and whether they are adverse or
beneficial. Definitions of these terms are described below:
• Short-term: Effects that would occur only with respect to a particular activity for a finite period, or
only during the time required for construction or installation activities.
• Long-term: Effects that are more likely to be persistent and chronic, extending beyond the
completion of construction.
• Direct: Effects that are caused by an action and occur around the same time at or near the location
of the action.
• Indirect: Effects that are caused by an action and might occur later in time or be farther removed in
distance but still be a reasonably foreseeable outcome of the action.
• Negligible: When the impacts are localized and perceptible but not measurable at the lowest level
of detection.
• Minor: When the impact is localized and slight, but detectable.
• Moderate: When the impact is readily apparent and appreciable.
• Significant: When the impact is severely adverse, major, and/or highly noticeable.
• Adverse: When the impact has an unfavorable or undesirable outcome on the man-made or natural
environment.
• Beneficial: When the impact would have a positive outcome on the man-made or natural
environment.
The Proposed Action and No Action Alternative environmental consequences for each resource area are
summarized in Table 3.0-1 and further discussed in following sections.

Environmental Assessment Letterkenny Munitions Center
3-2
Table 3.0-1 Summary of Environmental Consequences for the Proposed Action and No Action Alternative
Resource Area Proposed Action No Action Alternative
Land Use • New construction projects would have long-term minor direct adverse impacts from proposed projects that would require conversion of undeveloped land to developed land.
• Impacts from infrastructure upgrades or renovations are not expected.
There would be no changes or impacts to land use.
Aesthetics and Visual Resources
• The Proposed Action would have short-term and minor impacts from activities associated with construction and remodeling.
• Long-term beneficial impacts as buildings would be improved upon and/or newly constructed are expected.
There would be no change to the current aesthetics and visual resources.
Geology, Topography, and Soils
• The Proposed Action would have long-term negligible to minor direct adverse impacts on geology and topography from grading and other earth-moving activities during demolition, construction, and road and infrastructure improvements.
• The Proposed Action would have short-term and long-term moderate adverse direct impacts on soils from disturbance during demolition, construction, and improvement projects due to soil compaction, conversion to impervious surfaces, and erosion during earth moving activities.
There would be no changes or impacts on existing geology, topography, and soils.
Biological Resources
• Short- and long-term negligible adverse effects to vegetation would be expected during new construction, renovation, and infrastructure upgrade activities due to trampling, temporary removal, and permanent removal of vegetation.
• Short-term minor direct and indirect adverse effects to fish and wildlife due to disturbances from noise, construction activities, and heavy equipment use are expected. Long-term minor direct adverse impacts to fish and wildlife due to the addition of developed impervious areas and habitat loss associated with conversion of undeveloped areas to developed are also expected.
• - Minor to no impact on federally listed species and minor to moderate impacts on state-listed species due to habitat loss as a result of tree clearing are expected.
There would be no changes or impacts to vegetation, fish, wildlife, or protected species.
Water Resources
• The Proposed Action would have long-term minor to moderate effects to streams and wetlands from removal of vegetative cover or conversion of vegetated areas to impervious surfaces.
• No direct impacts to groundwater are expected.
There would be no changes or impacts to surface water or groundwater.

Environmental Assessment Letterkenny Munitions Center
3-3
Table 3.0-1 Summary of Environmental Consequences for the Proposed Action and No Action Alternative
Resource Area Proposed Action No Action Alternative
Air Quality, GHGs, and Climate Change
• The Proposed Action would have short-term adverse direct impacts to air quality from increased emissions from equipment associated with construction, renovation, and infrastructure projects.
• The Proposed Action would have temporary GHG releases from increased vehicular traffic and construction equipment; therefore, are not expected to have long-term impacts to the climate.
• No long-term impacts from operation activities are expected.
There would be no changes or impacts to air quality, GHGs, or climate change.
Hazardous and Toxic Substances
• The Proposed Action would have short-term minor adverse effects of hazardous materials associated with the use of hazardous materials such as paints, solvents, sealants, and fuel during construction, demolition, renovation, and infrastructure projects
• The Proposed Action would have minor long-term impact from the increased use of hazardous materials and generated hazardous waste as a result of increased operations and production.
There would be no changes or impacts to hazardous and toxic substances.
Noise • The Proposed Action would have minor short-term adverse noise impacts from new construction, renovations, and infrastructure upgrades.
• The Proposed Action would have minor long-term impacts on the noise environment due to increased train traffic and operational noise in new facilities.
There would be no changes or impacts to noise.
Cultural Resources
• The Proposed Action would have long-term minor to moderate impacts on the cultural resources from new development on cultural or archeological resources.
There would be no changes or impacts to cultural resources.
Socioeconomics • The Proposed Action would have moderate and short-term beneficial direct and indirect impacts on the local economy resulting from construction, renovation, and infrastructure upgrade activities.
• No impacts to minorities, low-income families, or children are expected.
There would be no changes or impacts to socioeconomics.
Traffic and Transportation
• The Proposed Action would have moderate temporary adverse impacts from a temporary increase to existing traffic conditions and road work during construction.
• The Proposed Action would have long-term beneficial direct impacts as improvements to the existing roadway and railroad networks progress, traffic flow would improve.
There would be no long-term improvements to traffic and transportation.
Utilities • The Proposed Action would have short-term negligible direct adverse impacts when facilities are disconnected from and connected to the electrical system and potable water supply.
• The Proposed Action would have long-term beneficial impacts on the potable water system, electrical system, and communications system from proposed infrastructure upgrades.
• No impact on the stormwater system are expected.
There would be no changes or impacts to utilities.

Environmental Assessment Letterkenny Munitions Center
3-4
Table 3.0-1 Summary of Environmental Consequences for the Proposed Action and No Action Alternative
Resource Area Proposed Action No Action Alternative
Recreation • The Proposed Action would have a short-term negligible direct adverse impact on recreation during construction.
• No long-term impacts from operation activities are expected.
There would be no changes or impacts to recreation.
Human Health and Safety
• The Proposed Action would have a short-term minor direct adverse impact on human health and safety from increased use and storage of regulated materials during construction.
• The proposed Action would have minor long-term impact from the increased use of hazardous materials and generated hazardous waste as a result of increased operations and production.
There would be no changes to impacts to human health and safety
3.1 Land Use
3.1.1 Affected Environment
LEMC occupies 16,971 acres of LEAD’s 18,668 acres. Its facilities include 17 explosive operating
buildings, 2.3 million square feet of explosive storage space, 902 igloos, 10 above-ground magazines, and
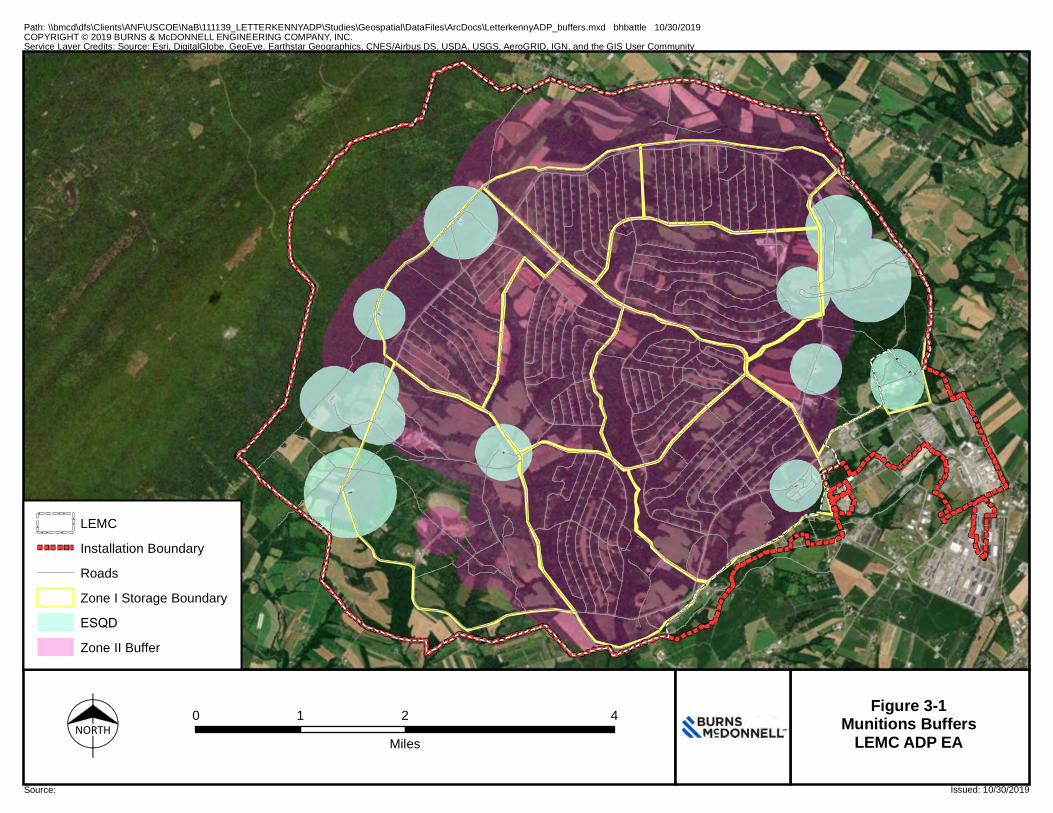
26 rail docks. As depicted in Figure 3-1, LEMC’s land use includes ammunition storage (Zone I) and a
buffer zone (Zone II). The ammunition storage area consists of approximately 12,000 acres of semi-
improved and unimproved land. Zone I associated activities include ammunition storage, tactical missile
storage & assembly, open burning/open detonation, a firing range, agricultural out leasing, wildlife
management, and recreational hunting and fishing (Tetra Tech 2013). Zone I includes Explosive Safety
Quantity-Distance (ESQD) arcs. ESQD arcs are safety buffers intended to protect explosive mission
functions from encroaching development while protecting life and property from explosive hazards.
Inhabited development, incompatible with explosives operations is prohibited within ESQD arcs.
The buffer zone consists of approximately 4,500 acres of semi-improved and unimproved land. Zone II
associated activities include agricultural out leasing, forestry management, wildlife management, and
recreational hunting and fishing (Tetra Tech 2013). LEMC has approximately 9,600 acres of agricultural
land in the ammunition storage area and buffer area that are leased to area farmers for crop production.
LEMC is bordered by agricultural lands to the north and south, the state forest and state game management
land to the west, and LEAD cantonment to the east. More than 85 percent of the land in Franklin County is
either pasture and grassland, row crops, or forest (Tetra Tech 2013). There are several residential
developments and a commercial shopping strips along U.S. 11 that service the LEAD and Chambersburg.

Environmental Assessment Letterkenny Munitions Center
3-5
As depicted in Figure 3-2, LEMC is bordered by the Buchanan State Forest to the west and Pennsylvania
State Game Lands (SGL) occur to the north and east of the Installation (Tetra Tech 2013). Several farms
along the LEMC border are classified as protected agricultural land under the state Agricultural Easement
program (Tetra Tech 2013). Figure 3-3 illustrates the locations of active agricultural outlease parcels within
the Installation.
3.1.2 Environmental Consequences
3.1.2.1 Proposed Action The Proposed Action would have a long-term minor direct adverse impact on land use. For projects
categorized as “new construction” in Table 2.2-1, land that is currently undeveloped would become
developed. However, the proposed new construction projects are primarily located on land that has been
previously disturbed and the new development would be compatible with adjacent and surrounding land
uses. Projects categorized as “infrastructure upgrades” or “renovations” in Table 2.2-1 would have no
impact because there would be no change or modification to the existing land use classification in those
areas.
3.1.2.2 No Action Alternative Under the No Action Alternative, the ADP and proposed projects would not be implemented. There would
be no changes or impacts on land use. However, it is anticipated that future development would still occur,
as the need for modernization and expansion will not cease; and, those future development projects would
be analyzed through the preparation of project specific NEPA documentation, as appropriate.
COPYRIGHT © 2019 BURNS & McDONNELL ENGINEERING COMPANY, INC.
Source: Issued: 10/30/2019
Path: \\bmcd\dfs\Clients\ANF\USCOE\NaB\111139_LETTERKENNYADP\Studies\Geospatial\DataFiles\ArcDocs\LetterkennyADP_buffers.mxd bhbattle 10/30/2019
Service Layer Credits: Source: Esri, DigitalGlobe, GeoEye, Earthstar Geographics, CNES/Airbus DS, USDA, USGS, AeroGRID, IGN, and the GIS User Community
NORTH0 2 41
Miles
Figure 3-1Munitions Buffers
LEMC ADP EA
LEMC
Installation Boundary
Roads
Zone I Storage Boundary
ESQD
Zone II Buffer
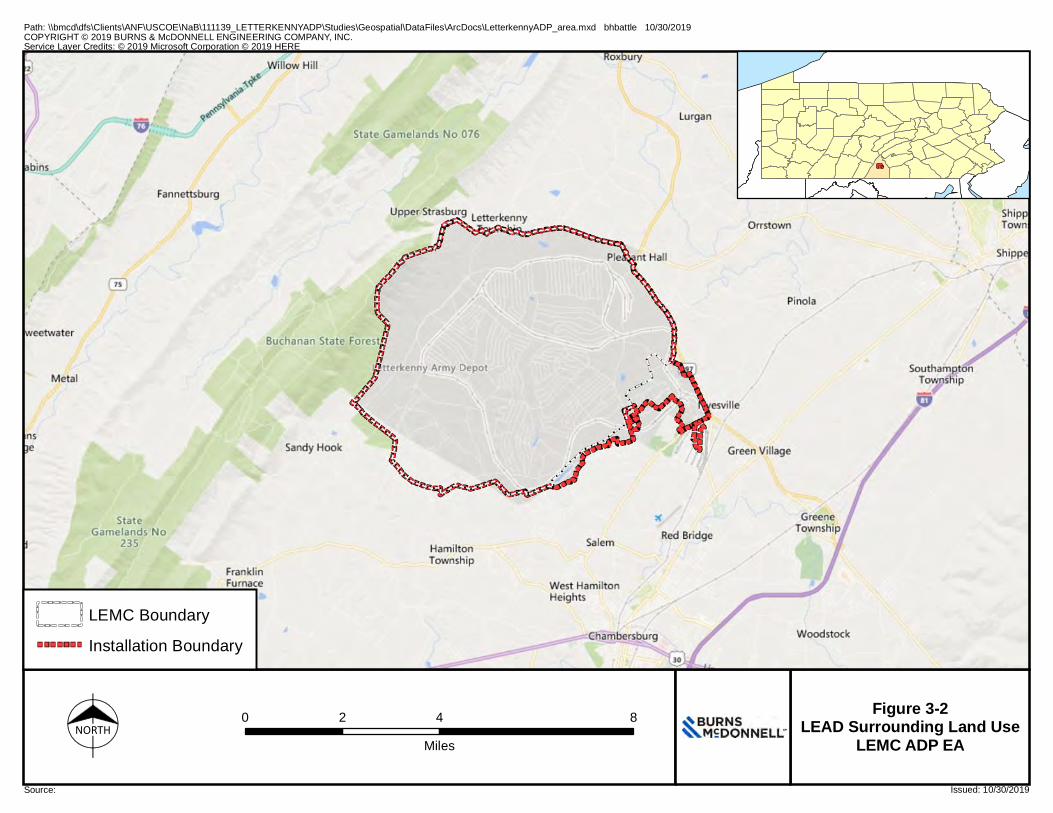
COPYRIGHT © 2019 BURNS & McDONNELL ENGINEERING COMPANY, INC.
Source: Issued: 10/30/2019
Path: \\bmcd\dfs\Clients\ANF\USCOE\NaB\111139_LETTERKENNYADP\Studies\Geospatial\DataFiles\ArcDocs\LetterkennyADP_area.mxd bhbattle 10/30/2019
Service Layer Credits: © 2019 Microsoft Corporation © 2019 HERE
NORTH0 4 82
Miles
Figure 3-2LEAD Surrounding Land Use
LEMC ADP EA
LEMC Boundary
Installation Boundary

COPYRIGHT © 2019 BURNS & McDONNELL ENGINEERING COMPANY, INC.
Source: Issued: 10/30/2019
Path: \\bmcd\dfs\Clients\ANF\USCOE\NaB\111139_LETTERKENNYADP\Studies\Geospatial\DataFiles\ArcDocs\LetterkennyADP_AgParcels.mxd bhbattle 10/30/2019
Service Layer Credits: Source: Esri, DigitalGlobe, GeoEye, Earthstar Geographics, CNES/Airbus DS, USDA, USGS, AeroGRID, IGN, and the GIS User Community
NORTH0 2 41
Miles
Figure 3-3LEAD Agricultural
Outleasing ProgramLEMC ADP EA
LEMC Boundary
Installation Boundary
Roads
Active Fields
Agricultural Tracts

Environmental Assessment Letterkenny Munitions Center
3-9
3.2 Aesthetics and Visual Resources
3.2.1 Affected Environment
LEMC consists of semi-improved and unimproved lands. The semi-improved lands include the over 900
earthen munitions storage igloos, open burning/open detonation area in the southwest, firing range, roads,
railroads, and agricultural out lease fields (row crops and pasture lands). The storage and assembly facilities
are scattered in the eastern, northeastern, and southwestern areas of LEMC, but most of the built structures
reside in the LEAD project area. The unimproved areas of LEMC consist of forests, streams, and wetlands.
There is housing/residential developments on the Installation. However, there is no housing within the
LEMC. Outside the Installation, there are rural residences along the northeast border and higher density
residential developments to the southeast.
3.2.2 Environmental Consequences
3.2.2.1 Proposed Action The Proposed Action would not block or disrupt existing viewsheds. There would be short-term and minor
impacts during construction, remodeling, and new construction that would ultimately result in long-term
beneficial impacts on the aesthetics and visual resources in the area as buildings would be improved upon
and/or newly constructed. The new construction would be concentrated in the northeast portion of LEMC
and away from the higher density housing that exists south of the Installation. There would be limited tree
removal and demolition during the Proposed Action with new developments constructed on undisturbed
and previously disturbed areas alongside similar facilities. The projects would be constructed over a period
of approximately 20 years, so impacts would be spread out over time and would occur at several locations.
By phasing the construction timing and location of different projects, adverse impacts on aesthetics and
visual resources would be minimized.
3.2.2.2 No Action Alternative Under the No Action Alternative, the ADP and proposed projects would not be implemented. There would
be no change to the current aesthetics and visual resources. However, it is anticipated that future
development would still occur, as the need for modernization and expansion will not cease; and, those
future development projects would be analyzed through the preparation of project-specific NEPA
documentation, as appropriate.
Environmental Assessment Letterkenny Munitions Center
3-10
3.3 Geology, Topography, and Soils
3.3.1 Affected Environment
3.3.1.1 Geology LEMC straddles the South Mountain Anticlinorium geologic formation to the east and the Massanutten
Synclinorium geologic formation to the west. The eastern portion of LEMC is underlain by carbonate rocks
(limestones and dolomites) and the western portion is underlain by shales. The munitions center is underlain
by five Ordivician-aged geologic formations: the Chambersburg formation, St. Paul Group, Rockdale Run
formation, Pinesburg Station formation, and Martinsburg formation. To date, no petroleum or mineral
resources have been found on LEMC and no mining activities have occurred within or adjacent to its
boundaries (Tetra Tech 2013).
3.3.1.2 Topography LEMC is in the Susquehanna-Potomac Segment of the Great Valley Section of the Ridge and Valley
Province (PDCNR, 2018). The western portion of the munitions center crosscuts Broad Mountain, and the
rest of LEMC is in the Cumberland Valley. Surface elevations range from approximately 600 to 800 feet
above mean sea level, except for the northwest portion of LEMC where the elevation increases to more
than 2,300 feet (Tetra Tech 2013).
3.3.1.3 Soils According to the Franklin County Soil Survey, three soil associations occur on LEMC. The Weikert-Berks-
Beddington soil association covers most of LEMC. It is characterized as shallow to deep and well-drained.
These acidic soils are weathered from shale, siltstone, and acid sandstone. They are prevalent in valley
bottoms. The Laidig-Very Stony Land-Buchanan association is also acidic and deep, and ranges from
somewhat poorly to well-drained. These soils are formed in colluvium from sandstone on Broad Mountain
along the western border of the depot. The Murrill-Laidig association is made up of less acidic, deep, well-
drained soils formed from colluvium at the base of the eastern side of Broad Mountain (Tetra Tech 2013).
There are no highly erodible soils identified at LEMC, but four soils series were identified as moderately
erodible and occur in the mountainous northeast area of LEMC. These soils series include:
• Buchanan extremely stony loam, 8 to 25 percent slopes;
• Hagerstown silty clay, 15 to 25 percent slopes, eroded;
• Laidig extremely stony sandy loam, 25 to 45 percent slopes; and
• Weikert shaly silt loam, 25 to 70 percent slopes (Tetra Tech 2013).

Environmental Assessment Letterkenny Munitions Center
3-11
LEAD has approximately 1,000 acres of designated prime farmland soils under the federal Farmland
Protection Policy Act and 9,760 acres of farmland soils classified as “farmland soils of statewide
importance.” All the soils in LEMC outside of streams, wetlands, and the mountainous area to the northwest
are either prime farmland or soils of statewide importance. The areas designated as prime farmland are
concentrated to the western area of LEMC at the base of the mountains. The rest of LEMC is classified as
farmland soils of statewide importance (Tetra Tech 2013). Many of the prime farmland areas are being
actively farmed by local farmers through LEMC’s agricultural out lease program.
3.3.2 Environmental Consequences
3.3.2.1 Proposed Action The Proposed Action would have long-term negligible to minor direct adverse impacts on geology and
topography from grading and other earth-moving activities during demolition, construction, and road and
infrastructure improvements. Impacts would be negligible in areas where the land has already been graded
and prepared for construction including existing roads and infrastructure improvements. Impacts would be
minor where new construction is proposed.
The Proposed Action would have short-term and long-term moderate adverse direct impacts on soils from
disturbance during demolition, construction, and improvement projects. Impacts on soils could include
compaction from heavy equipment and construction of impervious surfaces, as well as erosion from
disturbance of soils during earth-moving activities. None of the proposed projects occur in areas with
moderately erodible soils. Effective erosion control procedures and best management practices (BMPs)
would be used during construction to minimize impacts on soils. BMPs could include installing silt fencing
and sediment traps, applying water to disturbed dry soil, and revegetating/stabilizing disturbed areas as
soon as possible after disturbance.
There would be a similar impact on the soils if a spill or leak of petroleum projects or hazardous materials
were to occur. In the event of a spill, LEAD’s Integrated Contingency Plan (ICP) would be followed to
quickly contain and clean up the spill (H.F. Lenz Company 2016).
The Proposed Action would also have long-term adverse impacts on soils classified as prime farmland and
farmland of statewide importance as many of the proposed projects would occur on these soils. LEMC
would aim to avoid impacts to protected soils when siting the proposed projects for development. However,
federal lands are exempt from prime farmland protection, and therefore, no impacts to prime farmland are
anticipated.
Environmental Assessment Letterkenny Munitions Center
3-12
3.3.2.2 No Action Alternative Under the No Action Alternative, the ADP and proposed projects would not be implemented. There would
be no changes or impacts on existing geology, topography, and soils. However, it is anticipated that future
development would still occur, as the need for modernization and expansion will not cease; and, those
future development projects would be analyzed through the preparation of project specific NEPA
documentation, as appropriate.
3.4 Biological Resources
3.4.1 Vegetation
3.4.1.1 Affected Environment Approximately 34 percent of LEAD land is second- and third-growth forest, 52 percent is open fields, and
13 percent is developed with scattered landscaped vegetation. Woody species in the approximately 6,264
acres of forest land on the Installation are primarily of the oak-hickory association, including: red oak
(Quercus rubra), black oak (Quercus velutina), white oak (Quercus alba), chestnut oak (Quercus prinus),
and various hickory species (Carya spp.), with lesser numbers of yellow poplar (Liriodendron tulipifera),
white ash (Fraxinus americana), and red maple (Acer rubrum) (TetraTech, 2013).
Understory species include hawthorn (Crataegus spp.), redbud (Cercis canadensis), blackhaw (Viburnum
prunifolium), hackberry (Celtis spp.), tatarian honeysuckle (Lonicera tatarica), autumn olive (Elaeagnus
umbellata), spicebush (Lindera benzoin), and dogwood (Cornus racemosa) (TetraTech, 2018).
Ground cover species include dogbane (Apocynum spp.), hyacinths (Hyacinthus spp.), clover (Trifolium
spp.), goldenrod (Solidago sp.), sedges (Carex spp.), rushes (Juncus spp.), wild mustard (Brassica spp.),
broom sedge (C. scoparia), spring beauty (Claytonia caroliniana), cattail (Typha latifolia), raspberries and
blackberries (Rubus spp.), wild garlic (Allium vineale), various grasses, Japanese barberry (Berberis
thunbergii), burdock (Arctium spp.), mayapple (Podophyllum peltatum), and multiflora rose (Rosa
multiflora) (TetraTech 2018).
The approximately 9,250 acres of open habitat vegetation on the Installation consists of grassland fields in
the agricultural out lease program. The open areas are primarily buffer areas along roadways, around
munitions igloos, and field borders that also serve as fire breaks.
The forest habitat on LEMC is healthy overall. The greatest threats to habitat are the spread of invasive
species and deer overbrowse (TetraTech 2018). Invasive species include tree of heaven, reed canary grass
Environmental Assessment Letterkenny Munitions Center
3-13
(Phalaris arundinacea), mile-a-minute weed (Persicaria perfoliata), Japanese barberry, wineberry (Rubus
phoenicolasius), multiflora rose, wild privet (Ligustrum vulgare), Japanese stilt grass (Microstegium
vimineum), common reed (Phragmites australis), garlic mustard (Alliaria petiolata), field garlic (Allium
oleraceum), sericea lespedeza (Lespedeza cuneata), and vine- and shrub-form honeysuckles (TetraTech
2018). These rapidly growing species crowd out native vines and shrubs and do not create quality habitat
for other native species (TetraTech 2018). Reed canary grass has been noted as a problem in some of the
wetlands on LEMC and is becoming a dominant plant in several areas (TetraTech 2018).
Forests Pests
The gypsy moth (Lymantria dispar dispar), eastern ash borers (Agrilus planipennis), spotted lanternfly
(Lycorma delicatula), and hemlock woolly adelgid (Adelges tsugae) have caused catastrophic deforestation
in other parts of the country and are closely monitored in the LEMC area (TetraTech 2018). Occasional
gypsy moth infestations have occurred in the western buffer zone of LEMC (TetraTech 2018). Advanced
stages of hemlock woolly adelgid infestation were observed in the buffer zone at the foot of and on the
eastern slopes of Broad Mountain (TetraTech 2018). No evidence of eastern ash borers or spotted
lanternflies have been observed on LEMC (TetraTech 2018).
3.4.1.2 Environmental Consequences
3.4.1.2.1 Proposed Action The Proposed Action would result in short- and long-term negligible to minor effects on vegetation. The
projects would occur in previously disturbed areas, which would result in limited clearing of non-forested
upland and urban upland communities, and undisturbed areas.
Short- and long-term negligible adverse effects on vegetation would be expected during new construction,
renovation, and infrastructure upgrade activities due to trampling, temporary removal, and permanent
removal of vegetation. The impact would be negligible to minor because trees and vegetation would be
replaced or relocated if appropriate and practicable. Additionally, all disturbed ground would be reseeded
with appropriate species.
None of the proposed projects would occur in the far western buffer area of the Installation where past
gypsy month and hemlock woolly adelgid infestations have occurred. Therefore, the construction and
operation activities associated with the projects are not expected to impact or spread these infestations.

Environmental Assessment Letterkenny Munitions Center
3-14
3.4.1.2.2 No Action Alternative Under the No Action Alternative, the ADP and proposed projects would not be implemented. There would
be no changes or impacts to vegetation. However, it is anticipated that future development would still occur,
as the need for modernization and expansion will not cease; and, those future development projects would
be analyzed through the preparation of project-specific NEPA documentation, as appropriate.
3.4.2 Fish and Wildlife
3.4.2.1 Affected Environment Mammals
According to the 2013 INRMP, wildlife inventories and field observations conducted between 1987 and
2005, identified thirty-five species of mammals at LEAD. Additionally, a small mammal survey was
conducted in 2003 by the LEAD Natural Resources Office in conjunction with Shippensburg University to
determine the abundance and distribution of species. Some of the common species of mammals identified
include the Virginia opossum (Didelphis virginiana), Eastern cottontail (Sylvilagus floridanus), Eastern
chipmunk (Tamias striatus), gray squirrel (Sciurus carolinensis), beaver (Castor canadensis), red fox
(Vulpes Vulpes) and the white-tailed deer (Odocoileus virginianus). A mist netting survey was also
conducted in 2000 for the endangered Indiana bat (Myotis sodalis). During the survey, several common
species of bat were identified, including the big brown bat (Eptesicus fuscus) and red bat (Lasiurus
borealis). The federally threatened northern long-eared bat (Myotis septentrionalis) was also identified on
the Installation. Though the Indiana bat was not observed during the survey, the USFWS Information,
Planning, and Consultation System (IPaC) states that the Indiana bat has potential to be affected by activities
on LEMC (USFW 2019).
Birds
Wildlife inventories, field observations, and subsequent surveys conducted by the LEAD Natural Resource
Office, the Pennsylvania Game Commission (PGC), and the Audubon Society identified more than 100
avian species at LEAD (Tetra Tech 2013). The diverse avian habitats attract migratory species like warblers
and vireos that use LEMC as a stopover. Nesting species such as the great blue heron (Ardea horodias),
Canada geese (Branta canadensis), and killdeer (Charadrius vociferous) have been observed in spring and
summer months. Year-round residents include the ring-necked pheasant (Phasianus colchicus), eastern
wild turkey (Meleagris gallopavo), and woodpeckers (Picoides sp.). Grass-land dependent species include
the grasshopper sparrow (Ammodramus savannarum), field sparrow (Spizella pusilla), bobolink
(Dolichonyx oryzivorus), common yellowthroat (Geothlypis trichas), and song sparrow (Melospiza
Environmental Assessment Letterkenny Munitions Center
3-15
melodia). Other species on LEMC include the European starlings (Sturnus vulgaris) and brown-headed
cowbirds (Molothrus ater) (Tetra Tech 2013).
Herpetofauna and Fish
Nineteen species of reptiles have been identified at LEAD as part of the threatened and endangered species
inventories, subsequent surveys, or as field observations. The LEAD Natural Resources Office and
Shippensburg University conducted reptile surveys from 2003 to 2005 to determine the abundance and
distribution of reptile species. Observed species include the wood turtle (Clemmys insculpta), common
snapping turtle (Chelydra s. serpentina), eastern box turtle (Terrapene carolina), midland painted turtle
(Chrysemys picta marginata), five-lined skink lizard (Eumeces fasciatus), northern water snake (Nerodia
sipedon), northern copperhead (Agkistrodon contortrix), and black rat snake (Elaphe obsoleta).
The LEAD Natural Resources Office and Shippensburg University conducted amphibian surveys from
2003 to 2005 to determine the abundance and distribution of amphibian species. Twenty-four species were
observed during these surveys. Another species-specific survey was conducted for box turtles (Terrapene
sp.), marbled salamanders (A. opacum), frogs, and spotted newts (Notophthalmus sp.). LEMC includes a
vernal pond community within an area of forest bordering Buchanan State Forest in the northwestern
portion of LEMC. The vernal ponds on LEMC and in nearby areas house many species including: marbled
salamanders, spotted salamanders, Jefferson’s salamanders (A. jeffersonianum), wood frogs (Rana
sylvatica), spring peepers (Pseudacris crucifer), green frogs (R. clamitans), pickerel frogs (R. palustris),
toads (Bufo spp.), and red-spotted newts (N. viridescens) (Tetra Tech 2013). There is a lack of survey data
related to the condition of fisheries on LEMC.
3.4.2.2 Environmental Consequences
3.4.2.2.1 Proposed Action The Proposed Action would result in short-term minor direct and indirect adverse effects on wildlife due to
disturbances from noise, construction activities, and heavy equipment use. The Proposed Action would also
result in long-term minor direct adverse impacts due to the addition of developed impervious areas. Impacts
would be minor because the projects are in previously disturbed as well as undisturbed areas. In addition,
most species in the vicinity of the project area are tolerant of noise and human activity. Development may
impact vernal pool and wetland communities and would require mitigation.
3.4.2.2.2 No Action Alternative Under the No Action Alternative, the ADP and proposed projects would not be implemented. There would
be no changes or impacts to fish and wildlife. However, it is anticipated that future development would still
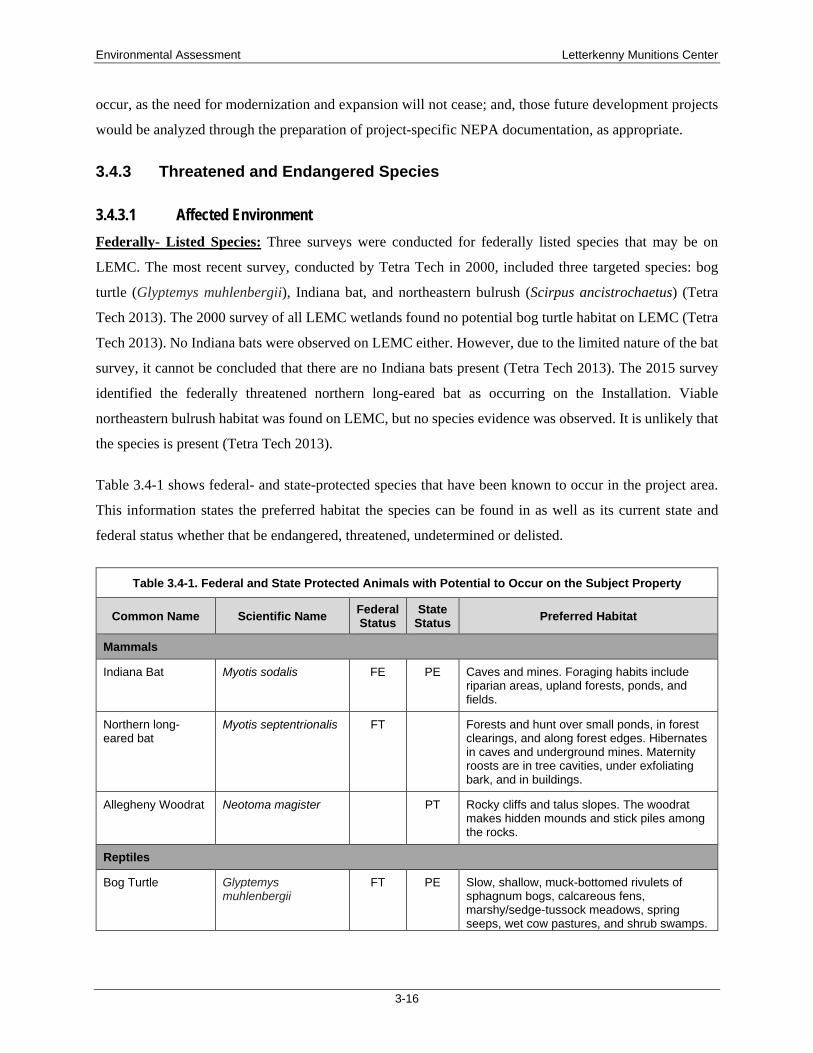
Environmental Assessment Letterkenny Munitions Center
3-16
occur, as the need for modernization and expansion will not cease; and, those future development projects
would be analyzed through the preparation of project-specific NEPA documentation, as appropriate.
3.4.3 Threatened and Endangered Species
3.4.3.1 Affected Environment Federally- Listed Species: Three surveys were conducted for federally listed species that may be on
LEMC. The most recent survey, conducted by Tetra Tech in 2000, included three targeted species: bog
turtle (Glyptemys muhlenbergii), Indiana bat, and northeastern bulrush (Scirpus ancistrochaetus) (Tetra
Tech 2013). The 2000 survey of all LEMC wetlands found no potential bog turtle habitat on LEMC (Tetra
Tech 2013). No Indiana bats were observed on LEMC either. However, due to the limited nature of the bat
survey, it cannot be concluded that there are no Indiana bats present (Tetra Tech 2013). The 2015 survey
identified the federally threatened northern long-eared bat as occurring on the Installation. Viable
northeastern bulrush habitat was found on LEMC, but no species evidence was observed. It is unlikely that
the species is present (Tetra Tech 2013).
Table 3.4-1 shows federal- and state-protected species that have been known to occur in the project area.
This information states the preferred habitat the species can be found in as well as its current state and
federal status whether that be endangered, threatened, undetermined or delisted.
Table 3.4-1. Federal and State Protected Animals with Potential to Occur on the Subject Property
Common Name Scientific Name Federal Status
State Status
Preferred Habitat
Mammals
Indiana Bat Myotis sodalis FE PE Caves and mines. Foraging habits include riparian areas, upland forests, ponds, and fields.
Northern long-eared bat
Myotis septentrionalis FT Forests and hunt over small ponds, in forest clearings, and along forest edges. Hibernates in caves and underground mines. Maternity roosts are in tree cavities, under exfoliating bark, and in buildings.
Allegheny Woodrat Neotoma magister PT Rocky cliffs and talus slopes. The woodrat makes hidden mounds and stick piles among the rocks.
Reptiles
Bog Turtle Glyptemys muhlenbergii
FT PE Slow, shallow, muck-bottomed rivulets of sphagnum bogs, calcareous fens, marshy/sedge-tussock meadows, spring seeps, wet cow pastures, and shrub swamps.

Environmental Assessment Letterkenny Munitions Center
3-17
Table 3.4-1. Federal and State Protected Animals with Potential to Occur on the Subject Property
Common Name Scientific Name Federal Status
State Status
Preferred Habitat
Usually containing an abundance of sedges or mossy cover.
Timber Rattlesnake Crotalus horridus DL Mountainous or hilly deciduous or mixed deciduous-coniferous forest, often with rocky outcroppings, steep ledges, and rockslides.
Eastern Spadefoot Toad
Scaphiopus holbrookii PT Sandy, gravelly, or soft, light soils in wooded or unwooded terrain.
Plants
Northeastern Bulrush
Scirpus ancistrochaetus
FE PE Open, tall herb-dominated wetlands often at the water’s edge, or in a few centimeters of water, but it may also be in fairly deep water or away from standing water.
Lance-leaved Loosestrife
Lysimachia hybrida PE Moist to mesic black soil prairies, open woodlands, thickets, swamps, gravelly seeps, limestone glades, and old fields with hardpan clay or sandy soil.
Brown Sedge Carex buxbaumii TU Variety of wet places; most commonly listed habitats are bogs and wet meadows. Others include fens, marshes, wet shores, swamps, “marly bogs and marshes”, prairie swales, wet river bottom prairie, alluvial meadows, and springs.
FT = Federally Threatened, FE = Federally Endangered, PE = Pennsylvania Endangered, PT = Pennsylvania Threatened, DL = Delisted, TU = Tentatively Undetermined Sources: Natural Heritage, 2019 and USFW, 2019
State-Listed Species: Although an Installation-wide flora survey has not been conducted, several surveys
were conducted with the following state-listed species identified as occurring or potentially occurring at
LEMC. Allegheny woodrat (Neotoma floridana magister), lance-leaved loosestrife (Lysimachia hybrida),
timber rattlesnake (Crotalus horridus), eastern spadefoot toad (Scaphiopus holbrookii), and brown sedge
(Carex buxbaumii) (Tetra Tech 2013). Three Allegheny woodrats were trapped during a small mammal
survey conducted by the LEAD Natural Resources Office with Shippensburg University in 2003 and 2004
(Tetra Tech 2013). Lance-leaved loosestrife was identified on LEMC by Tetra Tech during the 2000
endangered species survey (Tetra Tech 2013). No brown sedge has been observed on LEMC (Tetra Tech
2013). Until an Installation-wide flora survey is completed, impacts to listed plants cannot be determined.
3.4.3.2 Environmental Consequences
3.4.3.2.1 Proposed Action The Proposed Action would have minor to no impact on federally listed species and minor to moderate
impacts on state-listed species. Specific surveys would be conducted on a project by project basis prior to
Environmental Assessment Letterkenny Munitions Center
3-18
construction or clearing activities to determine if bats or other protected species or suitable habitat are
present, which would result in a direct impact. Tree clearing and potential loss of habitat would have a
negligible to minor indirect impact on protected species. There are likely to be greater impacts to state listed
species due to the larger number occurring on the Installation and wider variety of habitats compared to the
federally listed species.
3.4.3.2.2 No Action Alternative Under the No Action Alternative, the ADP and proposed projects would not be implemented. There would
be no changes or impacts to fish, wildlife, nor protected species. However, it is anticipated that future
development would still occur, as the need for modernization and expansion will not cease; and, those
future development projects would be analyzed through the preparation of project specific NEPA
documentation, as appropriate.
3.5 Water Resources
The following sections describe surface water, wetlands, and ground water resources within the Installation.
Figure 3-4 includes the locations of wetlands, waterbodies, and FEMA-designated floodplains within the
Installation.
3.5.1 Surface Water
3.5.1.1 Affected Environment LEMC is approximately 40 miles southwest from the Susquehanna River. LEMC is split into two
watersheds (TetraTech 2013). Surface water runoff from the northeastern portion of LEMC discharges to
Lehman Run, Keasey Run, Muddy Run, or Rowe Run, which are all contained in the Susquehanna River
Watershed (TetraTech 2013). Surface water runoff from the southwestern portion of LEMC discharges to
Dennis Creek, Back Creek, Rocky Spring Branch, or Conococheague Creek, all contained within the
Potomac River watershed (TetraTech 2013). The Susquehanna River and Potomac River both drain into
the Chesapeake Bay making LEMC subject to the Chesapeake 2000 agreement and Pennsylvania’s
Watershed Implementation Plan (TetraTech 2013).
Seven named streams (listed above) and numerous unnamed streams are located on LEMC. Streams cutting
through the limestone of the Chambersburg formation tend to be ephemeral and intermittent, flowing
through valleys in winter and spring or after heavy rains (TetraTech 2013). In contrast, streams in the upper
shale units of the Martinsburg formation are perennial and flow through narrow, steep-walled valleys
(TetraTech 2013).
Environmental Assessment Letterkenny Munitions Center
3-19
Ten manmade impoundments, ranging in surface area from 3 to 17 acres, are located on LEMC. Rocky
Springs Lake, Lake Letterkenny, and Shirley’s Pond are found in the southern portion of LEMC. Cole’s
Pond, Henry’s Pond, Bud’s Lake, Wally’s Pond, Baker’s Pond, and two waterfowl ponds are found in the
northern portion of LEMC (TetraTech 2013).
A total of seven wetland types are present at LEAD: lacustrine, palustrine, aquatic bottom, palustrine
emergent, palustrine forested, palustrine open water, palustrine unconsolidated bottom, palustrine scrub
shrub, and riverine. Previous estimations have concluded that there are approximately 300 acres of wetlands
on LEAD, most of which are expected to also be on LEMC. These wetland habitats have been largely
avoided during development at LEMC and support a diversity of vegetation, amphibians, reptiles, and
mammals.
3.5.1.2 Environmental Consequences
3.5.1.2.1 Proposed Action The Proposed Action would likely impact streams and wetlands in the project area causing long-term minor
to moderate effects on water resources. Prior to construction, stream and wetland delineations would be
conducted and LEMC would identify individual project locations to maximize avoiding impacts to wetlands
and streams in accordance with EO 11990. Where impacts to streams are unavoidable, effective erosion
control procedures and best management practices (BMPs) would be used during construction to minimize
impacts. All necessary permits for each proposed project would be acquired and appropriate mitigation
would be achieved prior to construction. All requirements of Eos 11988 and 11990 would be fulfilled for
any projects involving floodplains or wetlands.
3.5.1.2.2 No Action Alternative Under the No Action Alternative, the ADP and proposed projects would not be implemented. There would
be no changes or impacts to surface water. However, it is anticipated that future development would still
occur, as the need for modernization and expansion will not cease; and, those future development projects
would be analyzed through the preparation of project specific NEPA documentation, as appropriate.
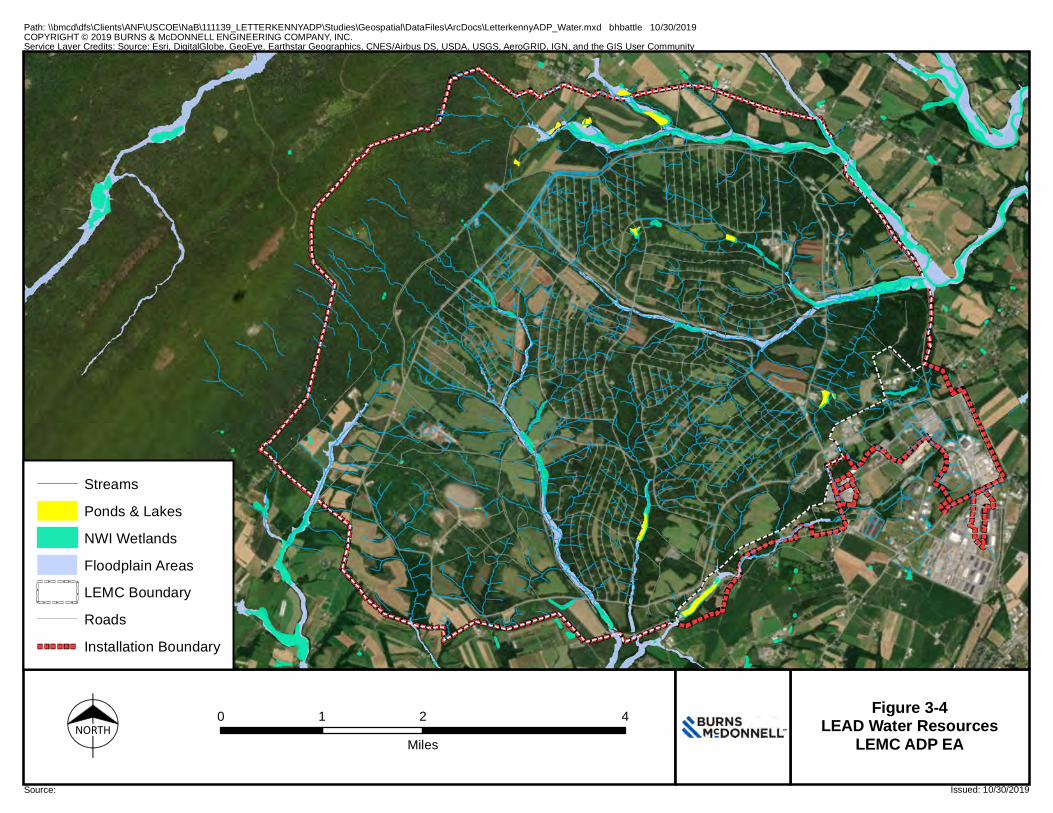
COPYRIGHT © 2019 BURNS & McDONNELL ENGINEERING COMPANY, INC.
Source: Issued: 10/30/2019
Path: \\bmcd\dfs\Clients\ANF\USCOE\NaB\111139_LETTERKENNYADP\Studies\Geospatial\DataFiles\ArcDocs\LetterkennyADP_Water.mxd bhbattle 10/30/2019
Service Layer Credits: Source: Esri, DigitalGlobe, GeoEye, Earthstar Geographics, CNES/Airbus DS, USDA, USGS, AeroGRID, IGN, and the GIS User Community
NORTH0 2 41
Miles
Figure 3-4LEAD Water Resources
LEMC ADP EA
Streams
Ponds & Lakes
NWI Wetlands
Floodplain Areas
LEMC Boundary
Roads
Installation Boundary
Environmental Assessment Letterkenny Munitions Center
3-21
3.5.2 Groundwater
3.5.2.1 Affected Environment LEMC is largely underlain by the Martinsburg formation, an aquifer yielding water with occasional high
iron, manganese, and hydrogen sulfide gas concentrations. Average well yields of 100 gallons per minute
(gpm) can be expected with higher yields in low topographic expressions and lower yields in upland
locations (Tetra Tech 2013). There is no demand for drinking water from the aquifer because LEMC
acquires drinking water from Letterkenny Reservoir (TetraTech 2013).
Yield from the carbonate aquifers ranges from 0.01 to 950 gpm due to the secondary porosity in the
carbonate. Prime locations in the St. Paul group would yield between 150 to 200 gpm. However, the
Chambersburg formation only produces about 40 gpm. Calcium and magnesium deposits can make this
water unsuitable for certain industrial uses (Tetra Tech 2013). The average depth to the water table within
the Valley and Ridge Province is approximately 40 feet (Swain, et. al; 2004).
3.5.2.2 Environmental Consequences
3.5.2.2.1 Proposed Action The Proposed Action would not have direct impacts on groundwater. The facilities would not require use
of groundwater, and new construction, renovation, and infrastructure improvement activities would not
require excavation to the depth of groundwater.
3.5.2.2.2 No Action Alternative Under the No Action Alternative, the ADP and proposed projects would not be implemented. As with the
Proposed Action, there also would be no changes or impacts to groundwater under the No Action
Alternative.
3.6 Air Quality, GHGs, and Climate Change
3.6.1 Affected Environment
The United States Environmental Protection Agency (USEPA) Region 3, and the Pennsylvania Department
of Environmental Protection (Pennsylvania DEP) regulate emissions to protect air quality in the state of
Pennsylvania. The Clean Air Act (CAA) has allowed the EPA to establish primary and secondary National
Ambient Air Quality Standards (NAAQS) for eight pollutants: carbon monoxide (CO), nitrogen dioxide
(NO2), particulate matter 10 microns or less in diameter (PM10), particulate matter 2.5 microns or less in
Environmental Assessment Letterkenny Munitions Center
3-22
diameter (PM2.5), sulfur dioxide (SO2), ozone, and lead. The EPA also regulates the emissions of carbon
dioxide equivalents (CO2e), sulfuric acid mist (H2SO4), and volatile organic compounds (VOCs), but does
not have ambient air standards for these three pollutants. The EPA had delegated permitting actions with
respect to air quality to the Pennsylvania DEP. Currently, LEMC is operating as a Major Facility, Permit
Number 28-05002, issued on December 7, 2018. Any changes to or addition of operating sources must be
reviewed and included in the air permit, as required by the EPA and Pennsylvania DEP.
The CAA also established special air quality and visibility protection to large national parks and wilderness
areas. These specially designated areas are called Class I areas and are subject to more stringent thresholds
than normal ambient air areas, called Class II areas. The closest 1 Class I area is Shenandoah National park,
that is 130 kilometers (km) from LEMC, Dolly Sods and Otter Creek Wilderness Areas are 175 km and
195 km away, respectively.
An area or county is considered in “attainment” if it meets the NAAQS for a specific pollutant and
considered in “non-attainment” if a city, county, or area do not meet the NAAQS for a pollutant. The
USEPA Green Book, where attainment area information is detailed, classifies Franklin County as an
attainment area for all pollutants. Previously, the county had been classified as a non-attainment county for
ozone, but those ozone standards were revoked in 1997. Therefore, Franklin County is in attainment with
the NAAQS standards, and is not subject to conformity regulations.
The CAA has also established a collection of eleven northeastern states, called the Ozone Transport Region
(OTR), that are subject to NOx and VOC restrictions in order to reduce the amount of these pollutants from
travelling upwind to the Midwest and South. These eleven states—Connecticut, Delaware, Maine,
Maryland, Massachusetts, New Hampshire, New Jersey, New York, Pennsylvania, Rhode Island, and
Vermont—are required to submit a state implementation plan (SIP) and install a more restrictive level of
controls for the precursors of ozone (NOx and VOC), even if the state meets the ozone standards. Therefore,
any emission units would be required to meet these stricter standards.
The EPA operates a network of air monitoring stations across the county to monitor ambient concentrations
of air pollutants. Existing ambient air quality for Letterkenny can be estimated using measurements from
nearby monitors. This monitored data is summarized in Table 3.6-1, below.
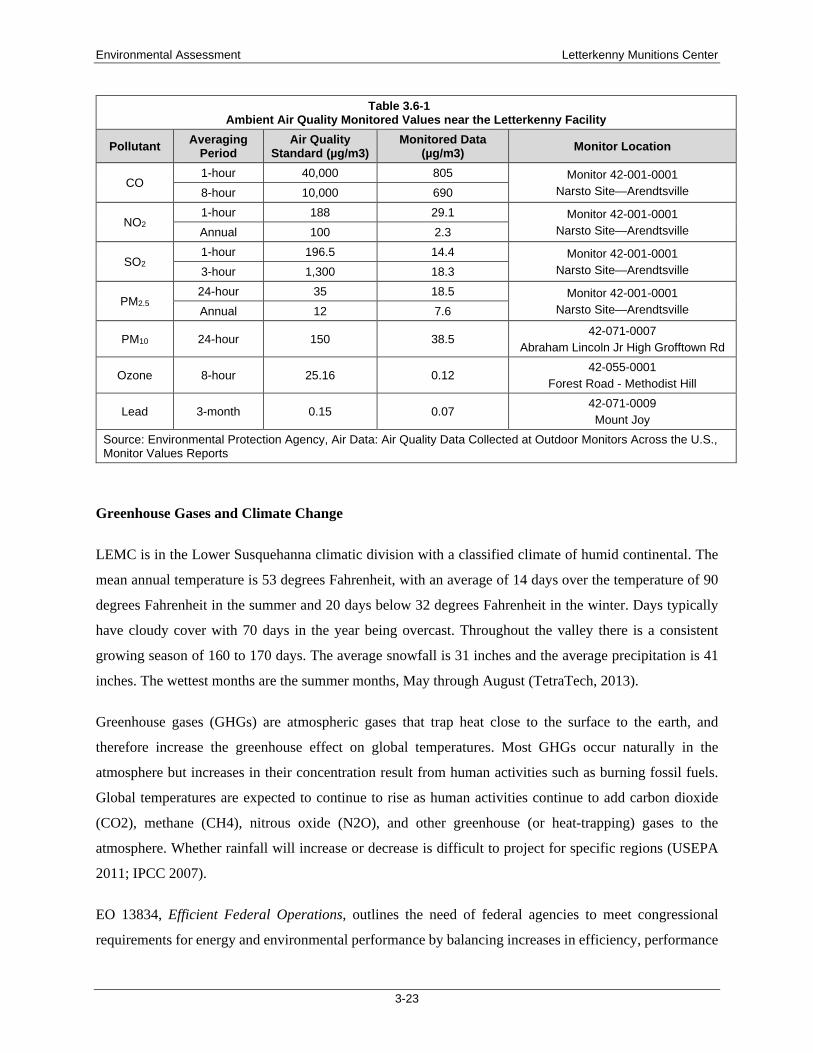
Environmental Assessment Letterkenny Munitions Center
3-23
Table 3.6-1 Ambient Air Quality Monitored Values near the Letterkenny Facility
Pollutant Averaging
Period Air Quality
Standard (µg/m3) Monitored Data
(µg/m3) Monitor Location
CO 1-hour 40,000 805 Monitor 42-001-0001
Narsto Site—Arendtsville 8-hour 10,000 690
NO2 1-hour 188 29.1 Monitor 42-001-0001
Narsto Site—Arendtsville Annual 100 2.3
SO2 1-hour 196.5 14.4 Monitor 42-001-0001
Narsto Site—Arendtsville 3-hour 1,300 18.3
PM2.5 24-hour 35 18.5 Monitor 42-001-0001
Narsto Site—Arendtsville Annual 12 7.6
PM10 24-hour 150 38.5 42-071-0007
Abraham Lincoln Jr High Grofftown Rd
Ozone 8-hour 25.16 0.12 42-055-0001
Forest Road - Methodist Hill
Lead 3-month 0.15 0.07 42-071-0009 Mount Joy
Source: Environmental Protection Agency, Air Data: Air Quality Data Collected at Outdoor Monitors Across the U.S., Monitor Values Reports
Greenhouse Gases and Climate Change
LEMC is in the Lower Susquehanna climatic division with a classified climate of humid continental. The
mean annual temperature is 53 degrees Fahrenheit, with an average of 14 days over the temperature of 90
degrees Fahrenheit in the summer and 20 days below 32 degrees Fahrenheit in the winter. Days typically
have cloudy cover with 70 days in the year being overcast. Throughout the valley there is a consistent
growing season of 160 to 170 days. The average snowfall is 31 inches and the average precipitation is 41
inches. The wettest months are the summer months, May through August (TetraTech, 2013).
Greenhouse gases (GHGs) are atmospheric gases that trap heat close to the surface to the earth, and
therefore increase the greenhouse effect on global temperatures. Most GHGs occur naturally in the
atmosphere but increases in their concentration result from human activities such as burning fossil fuels.
Global temperatures are expected to continue to rise as human activities continue to add carbon dioxide
(CO2), methane (CH4), nitrous oxide (N2O), and other greenhouse (or heat-trapping) gases to the
atmosphere. Whether rainfall will increase or decrease is difficult to project for specific regions (USEPA
2011; IPCC 2007).
EO 13834, Efficient Federal Operations, outlines the need of federal agencies to meet congressional
requirements for energy and environmental performance by balancing increases in efficiency, performance

Environmental Assessment Letterkenny Munitions Center
3-24
optimization, eliminating unnecessary use of resources, and protecting the environment. Implementing
Instructions for EO 13834 was issued in April 2019 and provided additional instructions to Federal agencies
to implement EO 13834, including agency planning, reporting requirements, and accountability.
3.6.2 Environmental Consequences
3.6.2.1 Proposed Action None of the projects listed in the ADP include the installation of new emission sources. Based on
preliminary project information, no new operational emission sources are currently expected to be added to
the facility as a part of the Proposed Action. Therefore, no long-term changes to emissions are expected
from the proposed projects and air quality is not expected to change in the area due to projects at the LEMC
facility.
While operating emissions from the projects are not expected to increase based on the projects listed in
Table 2.2-1, emissions from the construction of the projects, while temporary in nature, would occur.
Construction impacts from the proposed action would be adverse and minor to moderate. Construction
emissions from each project are listed below in Table 3.6-2, organized by expected project date.
Construction emissions would vary from project to project based on the duration of construction, type and
number of construction equipment needed for the project, number of workers, and amount of earthmoving
activities. The estimated emissions below were calculated with assumptions the duration of six construction
phases: site preparation, demolition, grading, building construction, paving, and architectural coatings. Not
all projects would have all six construction phases. Assumptions were made for each project on phase
duration, types and sizes of construction equipment needed for each phase, hours of operation for
construction equipment, number of workers for each project, and amount of earth moving needed as a part
of each project. These assumptions are noted in the calculation tables in Appendix B.
While emissions estimates for the construction of the projects listed have been calculated, as projects
become more detailed and finalized, these calculations need to be revisited and refined as more detailed
construction information becomes available. It should also be verified that no new emissions sources nor
changes to current emissions would occur from any of the projects reviewed. If new sources are added or
current emissions increase from any of the projects, the emissions increases would need to go through a
detailed analysis to determine if any permitting actions need to be taken for the project and/or if additional
NEPA is required.
The projects discussed in this report are expected to have only temporary GHG releases from increased
vehicular traffic and construction equipment; therefore, are not expected to have long-term impacts to the
Environmental Assessment Letterkenny Munitions Center
3-25
climate. Additionally, updated and new buildings would be more efficient and sustainable and must meet
the requirements issued through EO 13834 via the Office of Federal Sustainability. This increased
efficiency would decrease the overall energy demand from the facility. Because the Proposed Alternative’s
GHG emissions are short-term and temporary in nature, and the addition of newer, more efficient buildings
and infrastructure, it is not expected that the Proposed Alternative would have an impact on climate change.
3.6.2.2 No Action Alternative Under the No Action Alternative, the ADP and proposed projects would not be implemented. There would
be no changes or impacts to air quality, GHGs, or climate change. However, it is anticipated that future
development would still occur, as the need for modernization and expansion will not cease; and, those
future development projects would be analyzed through the preparation of project-specific NEPA
documentation, as appropriate.

Environmental Assessment Letterkenny Munitions Center
3-26
Table 3.6-2: Construction Emissions Calculations for Projects at LEMC
Project Project Number
Illustrative Reference
Emissions Estimates (tons per year)
NOx CO VOC SO2 PM10 PM2.5 CO2 CH4 N2O CO2e
SHORT-RANGE (0 – 5 YEARS)
Guided Missile Maintenance Facility
66632 1 13.14 63.69 4.20 1.22 0.80 0.80 1,171.98 0.05 0.01 1,176.21
Precision Strike Missile System (PrSM)
94216 2 2.02 8.25 0.62 0.20 0.11 0.11 237.82 0.01 2.05E-
03 238.68
Rail Modernization 91782 N/A 26.30 164.94 9.58 1.67 1.39 1.35 14,162.42 0.07 0.04 14,175.16
Expand Roadway at Voelz Gate
LEAD 532415 3 2.15 4.27 0.58 0.26 0.11 0.10 232.73 0.01 1.94E-
03 233.54
Consolidated Munition Distribution Facility
86433 4 19.60 122.49 6.76 1.63 1.19 1.18 1,976.93 0.08 0.02 1,984.20
Rail Classification Yard 86433 5 10.27 57.08 3.51 0.81 0.56 0.55 3,238.89 0.03 0.01 3,243.04
LEMC POV Parking Expansion
TBD 6 0.13 0.20 0.03 0.02 0.01 0.01 22.97 9.69E-
04 1.97E-
04 23.06
Inert Storage CAAA15-18MC-
64 7 1.37 7.05 0.45 0.12 0.08 0.08 184.16 0.01
1.50E-03
184.79
Upgrade Utility Infrastructure – Overall
TBD N/A 14.36 225.35 7.42 0.27 0.65 0.62 714.52 0.04 0.01 719.10
Paint Shop Addition CAAA15-18MC-
68 8 2.02 8.20 0.62 0.20 0.11 0.11 232.69 0.01
1.96E-03
233.52
Secure Holding Area for Loaded Trailers
TBD 9 0.13 0.22 0.04 0.02 0.01 0.01 31.15 1.01E-
03 2.22E-
04 31.24
Blast Booth Addition TBD 8 2.02 8.20 0.62 0.20 0.11 0.11 232.69 0.01 1.96E-
03 233.52
Inert Storage – Wood Storage
TBD 10 1.37 7.05 0.45 0.12 0.08 0.08 184.16 0.01 1.50E-
03 184.79
Ready Magazine CAAA15-18MC-
65 11 1.42 7.74 0.47 0.12 0.08 0.08 196.40 0.01
1.61E-03
197.08
Inert Storage TBD 12 1.37 7.05 0.45 0.12 0.08 0.08 184.16 0.01 1.50E-
03 184.79
Breakroom for Building 5321
TBD 13 1.37 7.03 0.44 0.12 0.08 0.08 176.05 0.01 1.48E-
03 176.68

Environmental Assessment Letterkenny Munitions Center
3-27
Table 3.6-2: Construction Emissions Calculations for Projects at LEMC
Project Project Number
Illustrative Reference
Emissions Estimates (tons per year)
NOx CO VOC SO2 PM10 PM2.5 CO2 CH4 N2O CO2e
Facility for SDO at X-11-G
TBD N/A 1.49 7.96 0.49 0.13 0.08 0.08 195.91 0.01 1.73E-
03 196.64
Restoration of Transportation Infrastructure (Rail)
TBD N/A 8.17 47.26 2.76 0.71 0.46 0.45 785.24 0.03 0.01 788.22
MID-RANGE (6 – 10 YEARS)
Rocket Motor Destruction (ARMD) Facility Addition
89246 N/A 2.02 8.19 0.62 0.20 0.11 0.11 231.31 0.01 1.94E-
03 232.13
Repair Electrical Distribution System, Ammunition Area
91417 N/A 0.22 0.26 0.06 0.03 0.01 0.01 31.98 1.34E-
03 2.72E-
04 32.09
Inert Storage TBD 12 1.37 7.05 0.45 0.12 0.08 0.08 184.16 0.01 1.50E-
03 184.79
Upgrade Existing 20-foot Equivalent Units (TEU) Storage Lots
TBD N/A 1.74 3.91 0.48 0.21 0.08 0.08 191.82 0.01 1.62E-
03 192.51
Restoration of Transportation Infrastructure (Roads)
87046 N/A 2.58 9.73 0.78 0.27 0.13 0.13 302.51 0.01 0.64 493.39
Inert Storage TBD 12 1.37 7.05 0.45 0.12 0.08 0.08 184.16 0.01 1.50E-
03 184.79
Security Upgrades (New Post #2)
TBD N/A 4.25 16.92 1.30 0.43 0.23 0.23 506.81 0.02 4.30E-
03 508.62
Building 5321 Addition TBD N/A 2.02 8.19 0.62 0.20 0.11 0.11 231.31 0.01 1.94E-
03 232.13
Inert Storage TBD N/A 1.37 7.05 0.45 0.12 0.08 0.08 184.16 0.01 1.50E-
03 184.79
Project for Modernization of Building 3700
94432 N/A 1.48 7.95 0.49 0.13 0.08 0.08 195.91 0.01 1.73E-
03 196.64

Environmental Assessment Letterkenny Munitions Center
3-28
Table 3.6-2: Construction Emissions Calculations for Projects at LEMC
Project Project Number
Illustrative Reference
Emissions Estimates (tons per year)
NOx CO VOC SO2 PM10 PM2.5 CO2 CH4 N2O CO2e
Inert Storage TBD N/A 1.37 7.05 0.45 0.12 0.08 0.08 184.16 0.01 1.50E-
03 184.79
LONG-RANGE (10+ YEARS)
Igloo Modernization – Overall
90406 N/A 72.84 387.88 23.95 6.49 4.02 4.01 10,040.28 0.39 0.08 10,074.15
Inert Storage TBD N/A 1.37 7.05 0.45 0.12 0.08 0.08 184.16 0.01 1.50E-
03 184.79
Igloo Road Repairs – Overall
90407 N/A 3.70 14.83 1.14 0.39 0.19 0.18 398.82 0.02 3.57E-
03 400.31
Inert Storage TBD N/A 1.37 7.05 0.45 0.12 0.08 0.08 184.16 0.01 1.50E-
03 184.79
Modernization of Building 3701
TBD N/A 1.48 7.89 0.49 0.13 0.08 0.08 195.85 0.01 1.61E-
03 196.53
Aboveground Magazine Repair
86673 N/A 1.49 7.92 0.49 0.13 0.08 0.08 204.90 0.01 1.65E-
03 205.59
Inert Storage TBD N/A 1.37 7.05 0.45 0.12 0.08 0.08 184.16 0.01 1.50E-
03 184.79
Modernization of Building 3702
TBD N/A 1.48 7.88 0.49 0.13 0.08 0.08 188.21 0.01 1.59E-
03 188.88
Earth-covered Magazine Repair
86671 / 86672 N/A 1,490.42 7,984.47 491.59 133.00 82.57 82.18 196,696.38 8.36 1.73 197,421.69
Building 4755 Replacement (Ammunition Demilitarization Facility)
TBD 14 2.03 8.24 0.63 0.20 0.11 0.11 245.29 0.01 2.07E-
03 246.15
Satellite Fire Station TBD 15 2.02 8.19 0.62 0.20 0.11 0.11 231.31 0.01 1.94E-
03 232.13
Building 3626 Replacement (Receipt Classification)
TBD 16 2.03 8.24 0.63 0.20 0.11 0.11 245.29 0.01 2.07E-
03 246.15
Conventional Ammunition Workshop
TBD 17 2.03 8.24 0.63 0.20 0.11 0.11 245.29 0.01 2.07E-
03 246.15
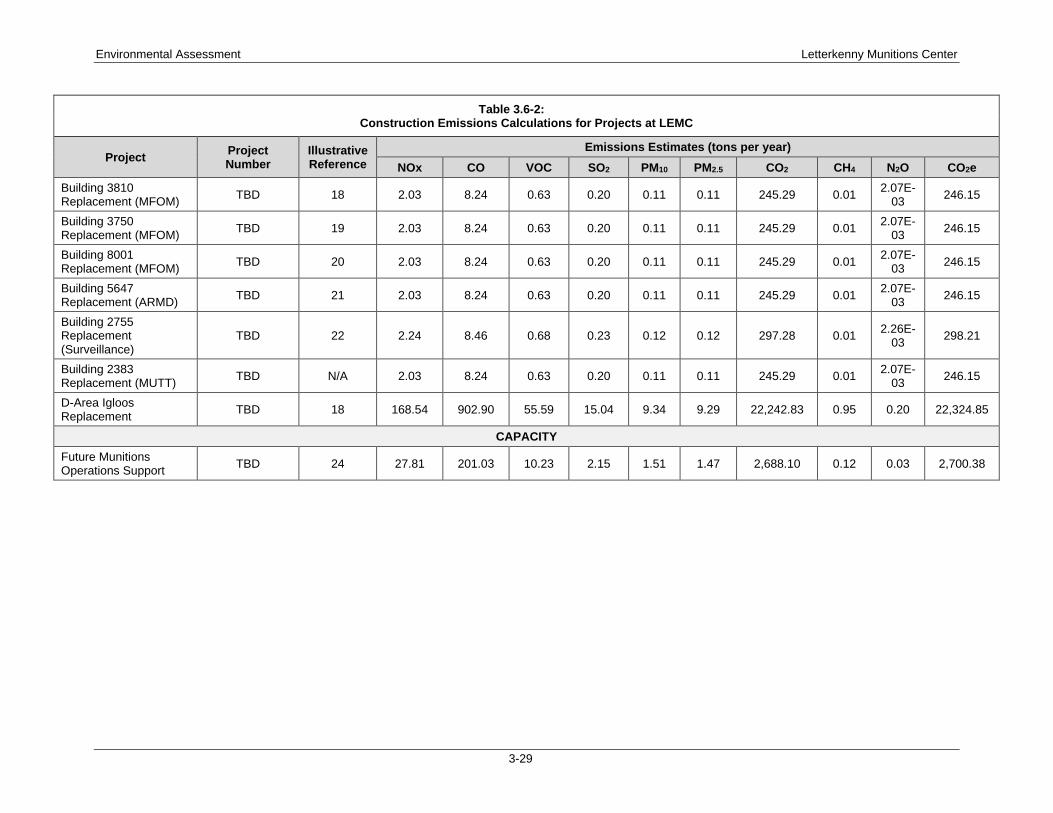
Environmental Assessment Letterkenny Munitions Center
3-29
Table 3.6-2: Construction Emissions Calculations for Projects at LEMC
Project Project Number
Illustrative Reference
Emissions Estimates (tons per year)
NOx CO VOC SO2 PM10 PM2.5 CO2 CH4 N2O CO2e
Building 3810 Replacement (MFOM)
TBD 18 2.03 8.24 0.63 0.20 0.11 0.11 245.29 0.01 2.07E-
03 246.15
Building 3750 Replacement (MFOM)
TBD 19 2.03 8.24 0.63 0.20 0.11 0.11 245.29 0.01 2.07E-
03 246.15
Building 8001 Replacement (MFOM)
TBD 20 2.03 8.24 0.63 0.20 0.11 0.11 245.29 0.01 2.07E-
03 246.15
Building 5647 Replacement (ARMD)
TBD 21 2.03 8.24 0.63 0.20 0.11 0.11 245.29 0.01 2.07E-
03 246.15
Building 2755 Replacement (Surveillance)
TBD 22 2.24 8.46 0.68 0.23 0.12 0.12 297.28 0.01 2.26E-
03 298.21
Building 2383 Replacement (MUTT)
TBD N/A 2.03 8.24 0.63 0.20 0.11 0.11 245.29 0.01 2.07E-
03 246.15
D-Area Igloos Replacement
TBD 18 168.54 902.90 55.59 15.04 9.34 9.29 22,242.83 0.95 0.20 22,324.85
CAPACITY
Future Munitions Operations Support
TBD 24 27.81 201.03 10.23 2.15 1.51 1.47 2,688.10 0.12 0.03 2,700.38

Environmental Assessment Letterkenny Munitions Center
3-30
3.7 Hazardous and Toxic Substances
3.7.1 Affected Environment
Storage and assembly facilities are scattered across the eastern, northeastern, and southwestern areas of
LEMC, but the majority of the built structures reside in the LEAD project area. LEAD contains Installation
Restoration Program (IRP) sites as referenced on Figure 3-5. The IRP sites occurring on LEMC include 14,
15, 17, 18 , 28, 39, 42, 43, 45, 46, 47, 50, 53, 54, and 56 (Weston 2011).
Several hazardous-waste site investigations and remediation projects at LEAD have involved groundwater
contamination, particularly in and around the cantonment area. These investigations have indicated the
presence of volatile organic compound (VOC) contamination. The principal issue of concern is recharge of
contaminated groundwater to surface water bodies of LEMC since groundwater is not directly used as a
water resource.
LEAD is known as a Resource Conservation and Recovery Act (RCRA) permitted treatment, storage, and
disposal facility. LEAD is also considered a large quantity generator due to the volume of hazardous waste
generated.
LEAD was established in 1941 prior to the implementation of the Toxic Substances Control Act of 1976
(TSCA) in which the regulation of asbestos containing materials (ACM) began. As such, it is likely that
ACM is present in the over 900 earthen munitions storage igloos and other structures on the LEMC.
Similarly, lead may occur on LEMC as lead-based paint (LBP) in buildings constructed before 1978. LBP
chips that fall from the exterior of buildings can cause soil contamination. Remaining LBP is likely found
within the earthen munitions storage igloos and other structures on the LEMC.

SW/SD-03
GEORGIA AVENUE (RESOURCE)
05-TBR-1 (Well TD 2 20')
114F
65
114E
6138
9
61
79
105
61
52
16
6132
4144
115
10
57
48C
48A
48B
22
63
6
110B
112B 35
112A
033/049
13
36
30
112C5
110C
431
37
114B106B
324 20
119
119
30
93B
119
93A
130 100
119
59
129
126E
66129
126G111A 117
113
8111B 126B
117B
58
9212
26B
60B
119
93A
26A119
126F
118D89 119
119
80002/101
27
82
11927
116126C
126A
114C118A/118F126D118B
21103118C 119
118E127
1
107/98 (Active)70 (Closed)99 (Closed)
119
29 (Active)67 (Closed)
73A69 (Active)77 (Closed)
11923
5155
72
73B
34
110D
114D
11
64
25
110A
114A
40
106A
60A
78
39
7 (Closed)94 (Active)
Date:01/06/2011
Revision #
Letterkenny Army DepotChambersburg, PA
.
Drainage
Roads
Buildings
BRAC Active Sites
4653
17
42
39
18
14
28
53
47
54
45
50
15
43/56
LEGEND:
ER, A Active Sites
Closed Sites
Dividing line between SE and PDO areas
DSERTS OFF-POST SITES
Site
062068069071076077084086087088090091095096097104
Description
Guilford Alternative Water System (ER, A)Rowe Run Spring (ER, A)Carty Well (ER, A)Rowe Run Drainage Farm Sampling (ER, A)SE Off-Post Groundwater (ER, A)PDO Off-Post Drinking Water (ER, A)SE Off-Post Residential Well Study (Metals) (ER, A)Helman Spring (ER, A)Helman Spring East (ER, A)Witmer Spring (ER, A)Hawbaker Spring (BRAC)Dozens Spring (BRAC)Chamber Spring (BRAC)Nelson Spring (ER, A)Allen Well (ER, A)Nelson Spring East (ER, A)
Status
ClosedActiveActiveClosedActiveActiveActive
ActiveActive
ActiveActiveActiveActiveActiveActiveActive
AMMUNITION AREA
1
118D
118C
60A
127
116
119
118E
21
119
118B
126C
126D
118A/118F
U.S. Army Corps of EngineersBaltimore District
Figure 3-5Location of AEDBR Sites at
Letterkenny Army Depot
800 0 800400 Feet
Balance of Rocky Spring System
Army Retained
ER, A- Environmental Restoration, ArmyDSERTS- Defense Site Environmental Restoration Tracking SystemAST- Aboveground Storage TankUST- Underground Storage TankDRMO- Defense Reutilization and Marketing OfficeIWTP- Industrial Wastewater Treatment PlantOBP- Oil Burn PitPDO- Property Disposal OfficeSE- Southeast AreaRCRA- Resource Conservation and Recovery Act** These sites are listed under both BRAC and ER, A.Work related to transfer issues will be funded under BRAC;ongoing work funded through ER, A will continue.
CLOSED SITESSite
003004005006007
012013014015017018019020021022
054051047045043042041038035032031030028027025024
110C
099089075070067066065064063
060A059058057056055
114B114C
116
119
126B126E
Description
Building 1 (ER, A)Building 350 (ER, A)Building 351 (ER, A)Building 370 (ER, A)Building 349 (ER, A)
Building 2326 MSTP (ER, A)IWTP Lagoons/Area D/Bldg. 360 (ER, A)Building 370D Chemical Lab 55 (ER, A)Acid Burning Pits (ER, A)Projectile Range (ER, A)CS Test Site (ER, A)Weapons Storage Area, IGLOOS (ER, A)Building 11 RAD Storage (ER, A)Building 431 Calibration Lab (ER, A)Building 3223 RAD Disposal Storage (ER, A)Former Drum Storage Revetments (ER, A)Previous Pesticide Area, Bldg. G (ER, A)Open Storage Sheds (Dock 45 Spill of Malathion) (BRAC)Small Sewage Treatment Plant (ER, A)Digested Sludge Spread on Ground (ER, A)Building 2357 (ER, A)Industrial Waste Ditch- Rowe Run (ER, A)Landfill 1 (Area H) (ER, A)Landfill 4 (Area C) (ER, A)Burial Area for Berylium Phos Tubes (Landfill 1) (ER, A)Neutralization Pit (ER, A)Residue Burial Site (ER, A)Demo Ground 1 (ER, A)Burning Ground 1 (ER, A)Deactivation Furnace (ER, A)Ammunition Box Piles (ER, A)Transformer Pad (BRAC)Residue Drum Storage, Ammo Area (ER, A)Waste Oil UST- Auto Shop Bldg. 3238 (ER, A)Classified Paper Incinerator (ER, A)Waste Storage Areas, Pads 2, 3 and 4 (BRAC)Lot 48 Ingot Storage Area
Firemans Training Area (1983) (ER, A)Storage Area- Bldg. 1467 (ER, A)Buried Drum Site #1 (ER, A)Buried Drum Site #2 (BRAC)Rocky Spring Lake Mercury (ER, A)Rocky Spring (Mercury) (ER, A)Soils SE (ER, A)PDO OU6- Lead Paint Release onto Soil from Water Tower (BRAC)Rocky Spring Weir Box (ER, A)
Vehicle Storage West of Tank Farm (BRAC)
Building 581 UST (BRAC)
Railroad Tracks- Herbicide Usage (BRAC)
Radioactive Materials Storage at Building 441 (BRAC)
Vehicle Storage- Building 500 Area (BRAC)Former Vehicle Storage- Gate 6 (BRAC)
696 UST Removal (BRAC)
Backwash Discharge Area from the Wastewater Treatment Plant (BRAC)011
Ore Pile Locations (DA) (ER, A)061
Building 400 Series Fire Training Area118C
Asbestos (BRAC)Radon, Tritium (BRAC)
124123
Gate 1 Guardhouse, Building 511 (BRAC)126A
Former Uncurbed AST at Building 532 (BRAC)126F
114D
110D
Open Vehicle Storage Area (BRAC)
Open Vehicle Storage Area (BRAC)
Disposal Area Lagoons (K Areas)052
Former Vehicle Storage Area North of Test Track114A
ER, A ACTIVE SITESSite
009
029
036039
046
050
053072*074*
079081
083094098103
107106B106A105
Description
Clay-Lined FTA 9 (Area B)
Rocky Spring Lake (VOCs)
Landfill 2 (Area J)Landfill 5 (Area G)- Security Landfill
Demo Ground 2
TNT Washout Plant
Burning Ground 2Stormwater SewersIndustrial Sewers
Waste Disposal Trenches (Area A)
Industrial Waste Sewers- SoilsBuilding 349 SumpRocky Spring SpringhouseOld Pumping Wells Rocky Spring
Rocky Spring PCB SedimentsDRMO Open Storage; Vehicle and Equipment StorageDRMO Scrapyard Demilitarization ActivitiesSpill Site within Area A
SE OU5
PDO OU2
SE OU9AMMO
AMMO
AMMO
AMMOSE OU4SE OU4
SE OU5SE OU3A
SE OU 2SE OU3PDO OU2/OU5PDO OU2/OU5
OU No.
PDO OU5PDO OU5PDO OU5SE OU5
SE OU3BDisposal Area VOC- Contaminated Groundwater
128 SE OU10 SE Industrial Area VOC-Contaminated GroundwaterSouth of Gate 6 (Conococheague Drainage System)Northern Southeast Industrial Area VOC-Contaminated Groundwater North of Gate 6
SE OU11131
010016
033
040044
048A048B
049048C
112C
110A
078
114E
114F
112A
112B
PDO OBPTest Track Area
Area F (Sediment Burial Site)
Open Trench Landfill (Adjacent to Oil Burning Pit)Bermed Area Northwest of OBP
Transfer/Burning RevetmentsWood Pile Storage Area West of the OBP
Area E (Oil Burning Pit Used in the 70's)Paint Can Shredding Area
Storage Area Southeast of Ammo Area Parking Lot
Former Vehicle Storage North of Test Track
PDO OBP Groundwater Divide
Former Test Track in the Disposal AreaNorthern Portion of Former Test Track (Environmental Contractor Staging Area)
Ammo Drum Storage Pad
Former Building Foundations near the Ammo Drum Storage Pad
PDO OU4SE OU8
SE OU8
PDO OU6PDO OU6
PDO OU6PDO OU6
SE OU8PDO OU6
PDO OU6
PDO OU6
PDO OU4
SE OU8
SE OU8
PDO OU6
PDO OU6
Area Upgradient of VOC-Contaminated Source in SE OU 3A
SE OU8
SE OU1
Site
001002008023026A026B034037060B
113111B111A110B
101100093B093A092082080073B*073A*072
117A117B118A118B118D118E118F125126C126D126G
130
129128127
115
Description
Building 57Building 37- Cleaning AreaBuilding 228- Battery Acid Disposal PitBuilding 51 RAD Storage AreaFormer Pesticide Storage Building (2325) (CASD)New Pesticide Storage Building (CASD)Stormwater Outfall- ConococheagueLandfill 3 (Pad 5 Landfill- Sandbag Road)Lot 29 Ingot Storage Area
Tannin Resin Storage at Buildings 651/652Quarry Landfill Area (CASD)Sinkhole Area (CASD)Vehicle/Equipment Storage Area West of the Test Track
Building 37 GroundwaterBuilding 12Recreational Area (CASD)Former PDO Scrapyard (CASD)Demolished Buildings 16 and 17Waste Oil SumpsStorage Area Near Building 32/33 (Truck Open Storage Area
Sediment Storage PileStorage of Sediment from Remediation EffortsGW Discharge to Storm Drainage
Building 683 and 688 Drum Storage PadsVehicle Wash Drainage and Roof Tar StorageBuilding 433, Locomotive Fueling AreaASTs at Golf Course Storage BuildingsFormer Storage Area West of Building 446Building 422 NorthBuilding 433 WestPCBBuilding 437 USTUST Across from Building 425Former Uncurbed AST at the Road Maintenance Area
Former Storage Shed near Buildings 38-1/S38-2
Storage Areas (RCRA) Pads 676 (Pad 1) and 696: Building 675
SE GroundwaterIndustrial Sewer Soils
Tank Farm Storage Area
SE OU8SE OU8SE OU8SE OU8PDO OU6PDO OU6SE OU4PDO OU6
OU No.
SE OU8
PDO OU6PDO OU6PDO OU6PDO OU6
SE OU10SE OU10PDO OU6PDO OU6SE OU8SE OU7SE OU7SE OU8SE OU8SE OU8
PDO OU6PDO OU6SE OU8SE OU8SE OU8SE OU8SE OU8COMPLIANCESE OU8SE OU8PDO OU6
PDO OU8
PDO OU6SE OU10SE OU8
SE OU8
BRAC ACTIVE SITES

Environmental Assessment Letterkenny Munitions Center
3-32
3.7.2 Environmental Consequences
3.7.2.1 Proposed Action Short-term minor adverse effects of hazardous materials and petroleum products would be expected. Prior
to demolition or renovation, ACM and LBP surveys would be required. If ACM and LBP are discovered
in the structures slated for demolition or renovation, abatement activities would ensue. Asbestos abatement
during construction and renovation is implemented per Asbestos Hazard Emergency Response Act
(AHERA) regulations.
Construction, renovation, and infrastructure upgrade activities require the use of hazardous materials such
as paints, solvents, sealants, and fuel. The quantity of hazardous materials used during these activities would
be minimal and their use would be for a short duration. Contractors would be responsible for the
management of hazardous waste according to federal, state, and LEMC regulations. Contractors would
implement BMPs to prevent releases and ensure that any release that occurs would not result in
contamination.
Projects requiring site activity would avoid impacts to IRP sites. If any site activities ensued near IRP sites,
all demolition, renovation or construction would be coordinated with the IRP Manager.
The Proposed Action would have a minor long-term impact from the increased use of hazardous materials
and generated hazardous waste at LEMC as a result of increased operations and production. However, the
hazardous materials would be properly stored in facilities in accordance with applicable state and federal
laws. Any spills or releases would be properly documented and cleaned up. Hazardous wastes would be
documented and properly disposed of in accordance with applicable regulations.
3.7.2.2 No Action Alternative Under the No Action Alternative, the ADP and proposed projects would not be implemented. There would
be no changes or impacts to hazardous and toxic substances. However, it is anticipated that future
development would still occur, as the need for modernization and expansion will not cease; and, those
future development projects would be analyzed through the preparation of project-specific NEPA
documentation, as appropriate.

Environmental Assessment Letterkenny Munitions Center
3-33
3.8 Noise
3.8.1 Affected Environment
LEMC is primarily surrounded by agricultural land. However, there are several nearby noise receptors that
need to be considered as a part of the noise analysis. To the north and northeast there are rural residences
as close as 0.05 miles from the property boundary. Upper Strasburg and Pleasant Hall are small residential
communities that are located 1 mile and 0.5 miles, respectively, north of LEMC. To the south and southeast
rural residences are as close as 0.5 miles from the property boundary. Cheesetown, Green Village, and the
northern most portion of Chambersburg are all approximately one mile south/ southeast of LEMC.
An Installation Compatible Use Zone (ICUZ) analysis was performed for LEAD to identify noise levels in
the facility. Although an ICUZ was not conducted for LEMC specifically, it is expected that the results
would be similar to those of the analysis conducted for LEAD. This analysis determined that the current
sources of noise originating at LEAD include demolition activities, firing ranges, vehicular traffic, rail
equipment, the combat vehicle test track, the helipad, and miscellaneous equipment operations. The ICUZ
analysis states that Zone II noise levels are considered “normally unacceptable” by Army Regulation 200-
1; however, it does not affect the ambient noise environment beyond LEAD’s boundary. Zone II noises
identified in the project area are the functional firing range, inactive demolition ground on the mountain,
and the demolition ground (TetraTech 2013). Currently, detonations at the demolition ground total
approximately 2,100/year (TetraTech 1998).
3.8.2 Environmental Consequences
3.8.2.1 Proposed Action The Proposed Action would result in minor short-term adverse noise impacts from new construction,
renovations, and infrastructure upgrades. These activities include the use of heavy equipment such as
bulldozers, dump trucks, jackhammers, pavers, and other pieces of equipment that generate noise levels
ranging from 90 to 94 dBA at a distance of 50 feet. Projects would be concentrated in the northeastern
portion of LEMC which would affect approximately six rural residences located directly across the street
from LEMC. However, noise impacts would only last for the duration of construction, renovation, and
infrastructure upgrade activities. These impacts could be minimized by restricting active construction
between 7:00 a.m. and 5:00 p.m. and using equipment exhaust mufflers. The short-term increase in noise
levels would not cause significant adverse effects on the surrounding populations.

Environmental Assessment Letterkenny Munitions Center
3-34
The Proposed Action would have minor long-term impacts on the noise environment due to increased train
traffic and operational noise in new facilities. However, vehicular traffic volumes would decrease when the
operational buildings are consolidated on the eastern side of LEMC. The number and frequency of
detonations is not proposed to increase. No proposed increase in the number or frequency of detonations is
anticipated on the Installation.
3.8.2.2 No Action Alternative Under the No Action Alternative, the ADP and proposed projects would not be implemented. There would
be no changes or impacts to noise. However, it is anticipated that future development would still occur, as
the need for modernization and expansion will not cease; and, those future development projects would be
analyzed through the preparation of project specific NEPA documentation, as appropriate.
3.9 Cultural Resources
3.9.1 Affected Environment
LEAD maintains an Integrated Cultural Resources Management Plan (ICRMP) to aide in management of
the cultural resources on the Installation in accordance with appropriate federal laws and other applicable
Army regulations. Cultural resources can be found in various locations throughout LEMC and LEAD. A
total of 20 archeological sites have been identified in the LEAD area through documented research, three
of which are potentially eligible for the National Register of Historic Places (NRHP). One of these sites is
prehistoric and two are known historic sites. No additional fieldwork or investigation of these sites has been
performed.
In the 1999 architectural survey conducted to support the ICRMP, a World War II district was identified,
which contains a complete complex of igloo magazines, safety shelters, administrative buildings, and road
and railroad networks, but the recommended district was never listed on the NRHP.
Approximately 902 Igloo storage structures can be found in the LEMC area. These structures were
determined to be eligible for the NRHP through the Advisory Council on Historic Preservation’s (ACHP)
Program Comment for World War II and Cold War Era Ammunition Storage Facilities, signed in 2005.
However, it was noted in the updated ICRMP as of May 2007, Section 106 coordination is no longer
required for undertakings involving World War II and Cold War facilities constructed at LEAD, which
includes LEMC.
Eight cemeteries are present within LEAD, seven of which are also found within LEMC. Three of these
cemeteries are private while four are church affiliated. There is a total of approximately 520 headstones.
Environmental Assessment Letterkenny Munitions Center
3-35
Internments occurred as early as 1831 ending with the oldest being made around 1940. Cemeteries do not
typically qualify for inclusion on the NRHP unless there are famous persons known to be buried in them or
they are associated with important historic events. The cemeteries at LEMC do not meet either of these
criteria and none are eligible for inclusion on the NRHP.
No historic tanks or guns are included in the current cultural inventory at LEMC. There are also no
traditional military landscapes (New South Associates, Inc. 2013).
3.9.2 Environmental Consequences
3.9.2.1 Proposed Action The Proposed Action could have long-term minor to moderate impacts on the cultural resources in the
project area. Several of the proposed construction projects would likely impact cultural and archeological
resources; however, cultural surveys and Section 106 consultation would need to be conducted for each
individual project. Any renovations or upgrades to existing buildings would likely occur within previously
disturbed building or construction footprints; therefore, the renovation and upgrade projects are unlikely to
result in impacts on cultural resources. Since many of the World War II era buildings and other resources
have been delisted, LEMC may be able to design the projects to avoid impacts on NRHP-eligible resources.
Regardless, the State Historic Preservation Officer would be consulted as required and impacts would be
appropriately mitigated for.
3.9.2.2 No Action Alternative Under the No Action Alternative, the ADP and proposed projects would not be implemented. There would
be no changes or impacts to cultural resources. However, it is anticipated that future development would
still occur, as the need for modernization and expansion will not cease; and, those future development
projects would be analyzed through the preparation of project specific NEPA documentation, as
appropriate.
3.10 Socioeconomics
3.10.1 Affected Environment
Most of LEMC lies within the Letterkenny Township, with small portions in Hamilton Township to the
south. According to the 2013-2017 American Community Survey (5-Year Estimates) the estimated
population of Letterkenny Township is around 2,406 and the median household income is $53,523
(American FactFinder, 2019). According to the same survey, the median household income in Franklin
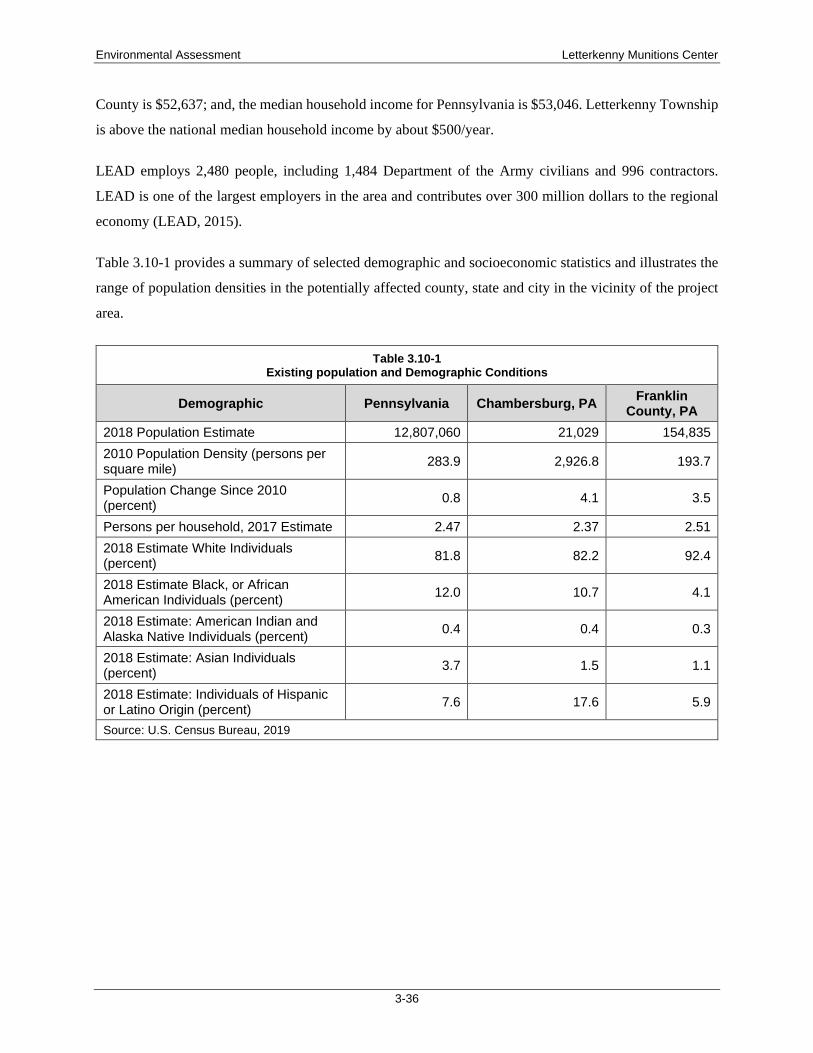
Environmental Assessment Letterkenny Munitions Center
3-36
County is $52,637; and, the median household income for Pennsylvania is $53,046. Letterkenny Township
is above the national median household income by about $500/year.
LEAD employs 2,480 people, including 1,484 Department of the Army civilians and 996 contractors.
LEAD is one of the largest employers in the area and contributes over 300 million dollars to the regional
economy (LEAD, 2015).
Table 3.10-1 provides a summary of selected demographic and socioeconomic statistics and illustrates the
range of population densities in the potentially affected county, state and city in the vicinity of the project
area.
Table 3.10-1 Existing population and Demographic Conditions
Demographic Pennsylvania Chambersburg, PA Franklin
County, PA
2018 Population Estimate 12,807,060 21,029 154,835
2010 Population Density (persons per square mile)
283.9 2,926.8 193.7
Population Change Since 2010 (percent)
0.8 4.1 3.5
Persons per household, 2017 Estimate 2.47 2.37 2.51
2018 Estimate White Individuals (percent)
81.8 82.2 92.4
2018 Estimate Black, or African American Individuals (percent)
12.0 10.7 4.1
2018 Estimate: American Indian and Alaska Native Individuals (percent)
0.4 0.4 0.3
2018 Estimate: Asian Individuals (percent)
3.7 1.5 1.1
2018 Estimate: Individuals of Hispanic or Latino Origin (percent)
7.6 17.6 5.9
Source: U.S. Census Bureau, 2019
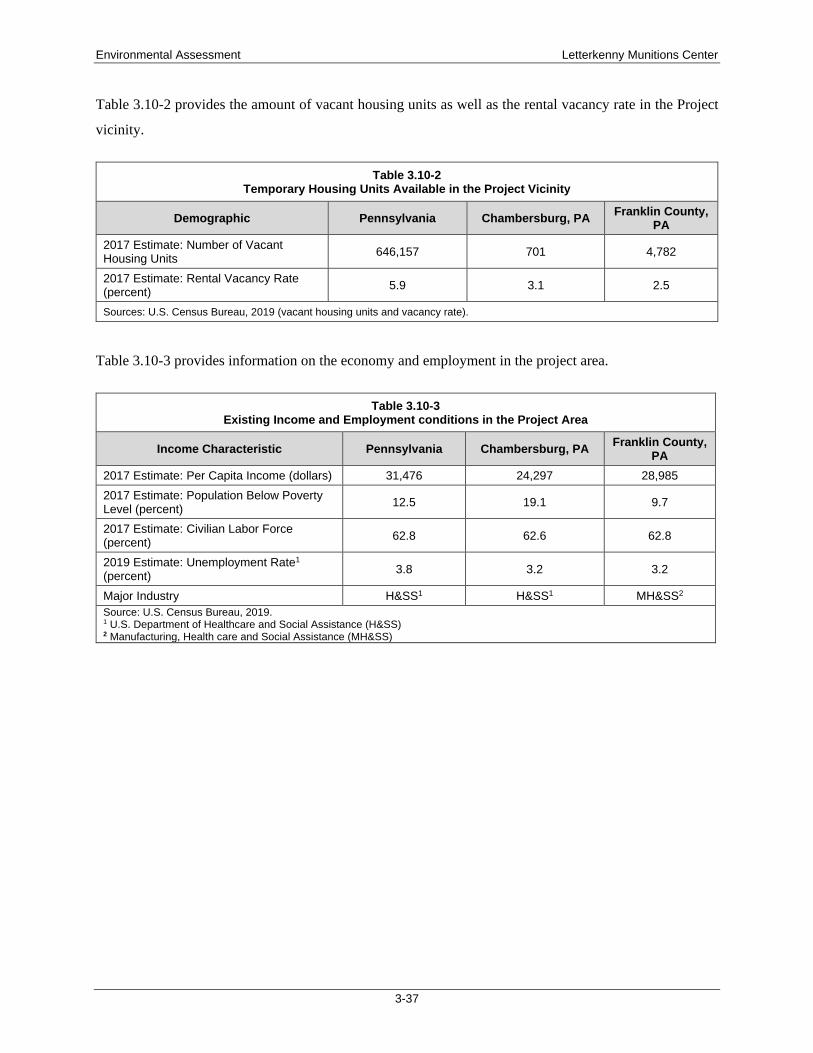
Environmental Assessment Letterkenny Munitions Center
3-37
Table 3.10-2 provides the amount of vacant housing units as well as the rental vacancy rate in the Project
vicinity.
Table 3.10-2 Temporary Housing Units Available in the Project Vicinity
Demographic Pennsylvania Chambersburg, PA Franklin County,
PA
2017 Estimate: Number of Vacant Housing Units
646,157 701 4,782
2017 Estimate: Rental Vacancy Rate (percent)
5.9 3.1 2.5
Sources: U.S. Census Bureau, 2019 (vacant housing units and vacancy rate).
Table 3.10-3 provides information on the economy and employment in the project area.
Table 3.10-3 Existing Income and Employment conditions in the Project Area
Income Characteristic Pennsylvania Chambersburg, PA Franklin County,
PA
2017 Estimate: Per Capita Income (dollars) 31,476 24,297 28,985
2017 Estimate: Population Below Poverty Level (percent)
12.5 19.1 9.7
2017 Estimate: Civilian Labor Force (percent)
62.8 62.6 62.8
2019 Estimate: Unemployment Rate1 (percent)
3.8 3.2 3.2
Major Industry H&SS1 H&SS1 MH&SS2
Source: U.S. Census Bureau, 2019. 1 U.S. Department of Healthcare and Social Assistance (H&SS) 2 Manufacturing, Health care and Social Assistance (MH&SS)
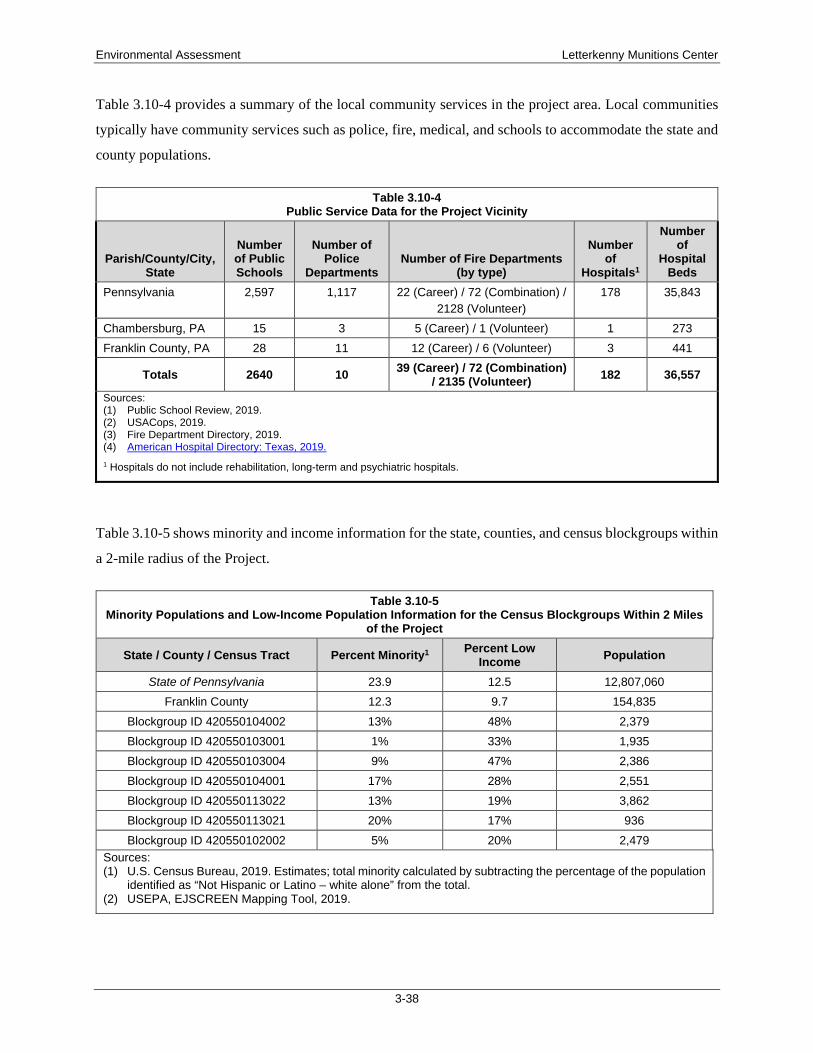
Environmental Assessment Letterkenny Munitions Center
3-38
Table 3.10-4 provides a summary of the local community services in the project area. Local communities
typically have community services such as police, fire, medical, and schools to accommodate the state and
county populations.
Table 3.10-4 Public Service Data for the Project Vicinity
Parish/County/City, State
Number of Public Schools
Number of Police
Departments Number of Fire Departments
(by type)
Number of
Hospitals1
Number of
Hospital Beds
Pennsylvania 2,597 1,117 22 (Career) / 72 (Combination) / 2128 (Volunteer)
178 35,843
Chambersburg, PA 15 3 5 (Career) / 1 (Volunteer) 1 273
Franklin County, PA 28 11 12 (Career) / 6 (Volunteer) 3 441
Totals 2640 10 39 (Career) / 72 (Combination)
/ 2135 (Volunteer) 182 36,557
Sources: (1) Public School Review, 2019. (2) USACops, 2019. (3) Fire Department Directory, 2019. (4) American Hospital Directory: Texas, 2019.
1 Hospitals do not include rehabilitation, long-term and psychiatric hospitals.
Table 3.10-5 shows minority and income information for the state, counties, and census blockgroups within
a 2-mile radius of the Project.
Table 3.10-5 Minority Populations and Low-Income Population Information for the Census Blockgroups Within 2 Miles
of the Project
State / County / Census Tract Percent Minority1 Percent Low Income
Population
State of Pennsylvania 23.9 12.5 12,807,060
Franklin County 12.3 9.7 154,835
Blockgroup ID 420550104002 13% 48% 2,379
Blockgroup ID 420550103001 1% 33% 1,935
Blockgroup ID 420550103004 9% 47% 2,386
Blockgroup ID 420550104001 17% 28% 2,551
Blockgroup ID 420550113022 13% 19% 3,862
Blockgroup ID 420550113021 20% 17% 936
Blockgroup ID 420550102002 5% 20% 2,479
Sources: (1) U.S. Census Bureau, 2019. Estimates; total minority calculated by subtracting the percentage of the population
identified as “Not Hispanic or Latino – white alone” from the total. (2) USEPA, EJSCREEN Mapping Tool, 2019.

Environmental Assessment Letterkenny Munitions Center
3-39
3.10.2 Environmental Consequences
3.10.2.1 Proposed Action The Proposed Action would have less than significant impacts on socioeconomics. There would be some
beneficial direct and indirect impacts on the local economy resulting from construction, renovation, and
infrastructure upgrade activities. These impacts would be moderate and short-term. Local business could
experience an increase in employment and sales volume, and an increase in construction workers could
increase payroll taxes and purchase of goods and services.
All projects would occur entirely within the existing LEMC property boundary, which is fenced with
secured access. Potential adverse impacts on the surrounding populations could include increased noise and
traffic levels and decreased air quality associated with construction activities. These impacts would be
short-term, intermittent, and minimal. No impacts to minorities, low-income families, or children would be
expected.
3.10.2.2 No Action Alternative Under the No Action Alternative, the ADP and proposed projects would not be implemented. There would
be no changes or impacts to socioeconomics. However, it is anticipated that future development would still
occur, as the need for modernization and expansion will not cease; and, those future development projects
would be analyzed through the preparation of project-specific NEPA documentation, as appropriate.
3.11 Traffic and Transportation
3.11.1 Affected Environment
The area around LEMC is served by U.S. Highway No. 11, U.S. Highway No. 30, Interstate 81, and the
Pennsylvania Turnpike is 14 miles north of the facility via State Route 997 (TetraTech 2013). Direct access
to LEMC is provided by State Route 433 and 997 (TetraTech 2013). The primary entrance to LEMC is via
the access point on Coffey Avenue (TetraTech 2013). LEMC includes 123 miles of paved roadways and
additional unpaved roadways. The unpaved roadway network includes direct connections between storage
areas.
Many of the existing roadways and gate systems within LEMC have not been adequately maintained and
are failing. The Voelz Gate, which is heavily utilized, lacks adequate space for overnight, queuing, and
exiting truck traffic. Trucks are frequently required to queue in non-designated space, creating security
issues. Virginia Avenue from Massachusetts Avenue to Pennsylvania Avenue, Wyoming Avenue, part of
Massachusetts Avenue along the K-area, Georgia Avenue from Massachusetts Avenue to Bazooka Road,

Environmental Assessment Letterkenny Munitions Center
3-40
the southeast perimeter section of the C-area, and two areas within the A-area are in poor condition and
present immediate problems to the mission viability. Currently, each of these are paved roadways but are
insufficient in condition and need repair.
The current railroad infrastructure within LEMC is in poor condition and in need of repair. Most of the
existing railroads are rated as 80-pound rail.
3.11.2 Environmental Consequences
3.11.2.1 Proposed Action The Proposed Action would result in moderate temporary adverse impacts on the existing traffic conditions
within LEMC as the area experiences an increase in construction vehicle traffic and road work along many
of the paved and unpaved roadways. As improvements to the existing roadway and railroad networks
progress, traffic flow would improve, resulting in a long-term improvement on traffic and transportation.
Ultimately the permanent impacts on traffic and transportation would significantly improve as a result of
the Proposed Action because the roadways would undergo modernization and the rail improvements would
allow for additional deliveries to be received via rail networks rather than by truck deliveries, freeing up
the LEMC roadways for local commuter traffic.
3.11.2.2 No Action Alternative Under the No Action Alternative, the ADP and proposed projects would not be implemented. There would
be no long-term improvements to traffic and transportation. The existing road and railroad infrastructure
would continue to degrade, resulting in worsening conditions for local commuters and truck deliveries.
However, it is anticipated that future development would still occur, as the need for modernization and
expansion will not cease; and, those future development projects would be analyzed through the preparation
of project-specific NEPA documentation, as appropriate.
3.12 Utilities
3.12.1 Affected Environment
This section assesses the water supply, wastewater systems, stormwater systems, energy sources,
communications, and solid waste service at LEAD. The water, sewer, and electric utilities have been
privatized and services have been purchased from the Franklin County General Authority/Letterkenny
Industrial Development Authority (LIDA), (LEAD, 2015).
Potable Water Supply

Environmental Assessment Letterkenny Munitions Center
3-41
LEAD and LEMC receive potable water from the Letterkenny Reservoir. This reservoir is a 330-million-
gallon reservoir located 10 miles north of the Installation. The portable storage area that serves LEMC is a
300,000-gallon tower (LEAD, 2015).
Wastewater System LEAD uses a privatized wastewater system, operated and maintained by Suez Water Pennsylvania Inc.
through the FCGA. Wastewater is collected throughout LEMC in holding tanks and is pumped out. An
existing wastewater treatment plant operates to the south of the complex but is not currently used for
existing facilities in LEMC. Due to the topography of the area, a connected sanitary sewer system would
require multiple combinations of lift stations, force mains, and gravity flow pipes.
Storm Water System There is no municipal separate storm sewer system for Letterkenny.
Energy Sources The electrical power at LEAD is provided by Allegheny Power’s (AP) Letterkenny substation, which also
provides power for LEMC. The substation is served from a single 138-kV feeder that approaches from the
east, where it ties to the AP distribution grid. Power is then distributed from the adjacent switch station,
which is operated by AP, but is owned by the LIDA. LEMC is sub-fed at 7,200 volts on a single aerial
circuit by means of step-down transformers. The existing electrical distribution system is currently
insufficient for mission needs. Several facilities operate on generators and are not connected to the system.
Natural Gas LEMC is currently in the process of converting the facility from propane to natural gas. Gas service only
exists in certain areas of LEAD and LEMC. UGI Utilities, Inc. Gas Division supplies the natural gas on
LEMC (JG&A 2019).
Communications Aerial mounted copper (voice) and fiber optic (data) cabling exists along the existing utility pole lines and
direct bury lines throughout LEMC (LEAD, 2015).
Solid Waste Solid waste in collected and disposed through Waste Management, Inc. who transports the waste to Upton,
Pennsylvania and places it in a landfill owned by Waste Management of Central Pennsylvania (LEAD,
2015).

Environmental Assessment Letterkenny Munitions Center
3-42
3.12.2 Environmental Consequences
3.12.2.1 Proposed Action Potable Water Supply The current potable water supply is inadequate for the current mission and fire protection needs. The
Proposed Action includes a project to increase the 6-inch potable water lines to 12-inch lines. Therefore,
the project would have long-term beneficial impacts on the water supply at LEMC. However, there would
be short-term interruptions that could occur when new facilities are disconnected from or connected to the
water supply system (JG&A 2019).
Wastewater System The Proposed Action would result in short-term negligible direct adverse impacts when facilities are
disconnected from and connected to the wastewater system. However, the system interruptions would be
temporary and coordinated with area users prior to disconnection (JG&A 2019).
Storm Water System There is no municipal separate storm sewer system for Letterkenny. Therefore, there would not be any
impacts from the Proposed Action (JG&A 2019).
Energy Sources The Proposed Action would result in short-term negligible direct adverse impacts when facilities are
disconnected from and connected to the electrical system. However, the system interruptions would be
temporary and coordinated with area users prior to disconnection. The proposed upgraded electrical system
would have long-term positive benefits by providing more efficient and reliable power to LEMC.
Currently, projects are underway to convert the Installation over to natural gas from propane. The overall
condition is unknown, and a full evaluation would occur prior to additional facilities being connected.
Communications The Proposed Action includes a project to upgrade the communication system with a line between the east
and west ends of LEMC along Virginia Avenue for future development demands. With the upgrades, the
system would adequately serve the needs of the current mission. Therefore, the project would have long-
term beneficial impacts on the communications system (JG&A 2019).
Environmental Assessment Letterkenny Munitions Center
3-43
3.12.2.2 No Action Alternative Under the No Action Alternative, the ADP and proposed projects would not be implemented. There would
be no changes or impacts to utilities.
3.13 Recreation
3.13.1 Affected Environment
Recreation activities (hunting and fishing) occur in the ammunition storage area and buffer zone of LEMC
(TetraTech 2013).
The Ammunition Storage area is a 12,335-acre restricted area that is split into 11 hunting areas. A 4,570-
acre Buffer Area is reserved for public use. Big game species that are hunted on LEMC include white-tailed
deer (Odocoileus virginianus), black bear (Ursus Americana), and eastern wild turkey (Meleagris
gallopavo). Small game species that are hunted on LEMC include ring-necked pheasant (Phasianus
colchius), ruffed grouse (Bonasa umbellus), gray squirrel (Sciurus carolinensis), red squirrel (Tamiasciurus
hudsonicus), eastern cottontail (Sylvilagus floridanus), American crow (Corvus brachyrhynchos), fish crow
(Corvus ossifragus), coyote (Canis latrans), Virginia opossum (Didelphis virginiana), striped skunk
(Mephitis mephitis), woodchuck (Marmota monax), and long-tailed weasel (Mustela frenata). Species that
are trapped on LEMC include coyote, Virginia opossum, striped skunk, long-tailed weasel, raccoon
(Procyon lotor), red fox (Vulpes vulpes), gray fox (V. cinereoargenteus), beaver (Castor canadensis), mink
(Mustela vison), and muskrat (Ondatra zibethicus) (TetraTech 2013).
The waterbodies on LEMC that are primarily used for fishing include Shirley’s Pond, Coles Pond, Henry’s
Pond, Bud’s Lake, Lake Letterkenny, Rocky Spring’s Lake, Muddy Run, and Keasey Run. A PCB-related
fish advisory is in place for Rock Spring’s Lake (TetraTech 2013).
3.13.2 Environmental Consequences
3.13.2.1 Proposed Action The Proposed Action would have a short-term negligible direct adverse impact on recreation during
construction. Based on the locations identified as “potential development areas” in the June 2019, IDP,
most of the new construction would be in areas that are previously disturbed or developed. The largest area
of forest/vegetation, where most hunting occurs, is in the northwestern section of LEMC; which would
likely remain unchanged. The additional noise from general construction operations may startle off local
wildlife temporarily. Once construction is complete, wildlife would be expected to return to the immediate
area. No long-term impacts from operation activities are expected.
Environmental Assessment Letterkenny Munitions Center
3-44
Further, impacts on streams, ponds, and lakes would be short term and would be minimized through
implementation and maintenance of erosion and sediment controls during construction.
3.13.2.2 No Action Alternative Under the No Action Alternative, the ADP and proposed projects would not be implemented. There would
be no changes or impacts to recreation. However, it is anticipated that future development would still occur,
as the need for modernization and expansion will not cease; and, those future development projects would
be analyzed through the preparation of project specific NEPA documentation, as appropriate.
3.14 Human Health and Safety
3.14.1 Affected Environment
The nearest hospital to the Installation is the WellSpan Chambersburg Hospital in Chambersburg,
approximately 6 miles to the south. The Chambersburg Fire Department, in Chambersburg, provides
emergency response and fire protection services. The Chambersburg Fire Department is located
approximately 6 miles to the south of the Installation. The Army Depot Fire Department within LEAD also
serves as a first responder.
3.14.2 Environmental Consequences
3.14.2.1 Proposed Action The Proposed Action would have a short-term minor direct adverse impact on human health and safety. To
address any health and safety hazards that could potentially arise during construction, LEMC would develop
a Health and Safety Plan to address worker safety during the construction and operation of the proposed
projects. The Health and Safety Plan would include provisions for worker protection as is required by the
Occupational Safety and Health Administration (OSHA) with emphasis on CFR 1926 – Safety and Health
Regulations for Construction. During construction, all employees, contractors, and sub-contractors would
be required to conform to OSHA safety procedures. Adequate training would be mandatory for all
construction workers on site. Personal safety equipment such as hard hats, ear and eye protection, and safety
boots would be required for all workers on site. Accidents and injuries would be reported to the designated
safety officer at each site.
The proposed projects would comply with all relevant federal, state, and local requirements, including all
requirements concerning public health and safety, including but not limited to requirements addressing land
use, noise, and traffic.

Environmental Assessment Letterkenny Munitions Center
3-45
The proposed projects would minimize any potential human health and safety impacts through prohibiting
site access except for the purposes of constructing the proposed projects, and for providing access for
emergency equipment, and for police and fire protection. Coffey Avenue and Georgia Avenue are adequate
(width, grade, construction, overall safety, and design capacity) to carry all prospective traffic and entrance
to the Installation is not open to public access.
Risk of accidental fire during construction could occur from human activities such as refueling and cigarette
smoking. The Health and Safety plan would reduce fire-related risks to acceptable levels by imposing
restrictions or procedures regarding these activities. In addition, implementation of industry-approved
design measures for all proposed project components would ensure that fire-related risks would remain
acceptably low.
The Proposed Action would have a minor long-term impact from the increased use and storage of regulated
hazardous materials and generated hazardous waste at LEMC as a result of increased operations and
production. During construction and operation, diesel fuel, gasoline, and lubricating oils from heavy
equipment and vehicles could be accidentally leaked or spilled. Hydraulic fluid, paints, and solvents would
likely be used during construction and operation as well. All used oil generated at the proposed project sites
and other potentially hazardous materials (automotive fluids, spray paint cans, etc.) at the site would be
collected by a licensed/permitted recycler.
If ACM or LBP are present at the site, abatement of said materials would be done in conformance with
applicable local, state, and federal regulations by a licensed abatement contractor with appropriate Personal
Protective Equipment (PPE).
3.14.2.2 No-Action Alternatives Under the No Action Alternative, the ADP and proposed projects would not be implemented. There would
be no changes or impacts to human health or safety. However, it is anticipated that future development
would still occur, as the need for modernization and expansion will not cease; and, those future development
projects would be analyzed through the preparation of project specific NEPA documentation, as
appropriate.
3.15 Cumulative Effects
According to the Council on Environmental Quality (CEQ) regulations, a cumulative impact is defined as
an impact on the natural and human environment, which results from the incremental impact of the proposed
action when combined with impacts from other past, present, and reasonably foreseeable future actions.
This Project and all associated actions must be evaluated with and in addition to the effects from other
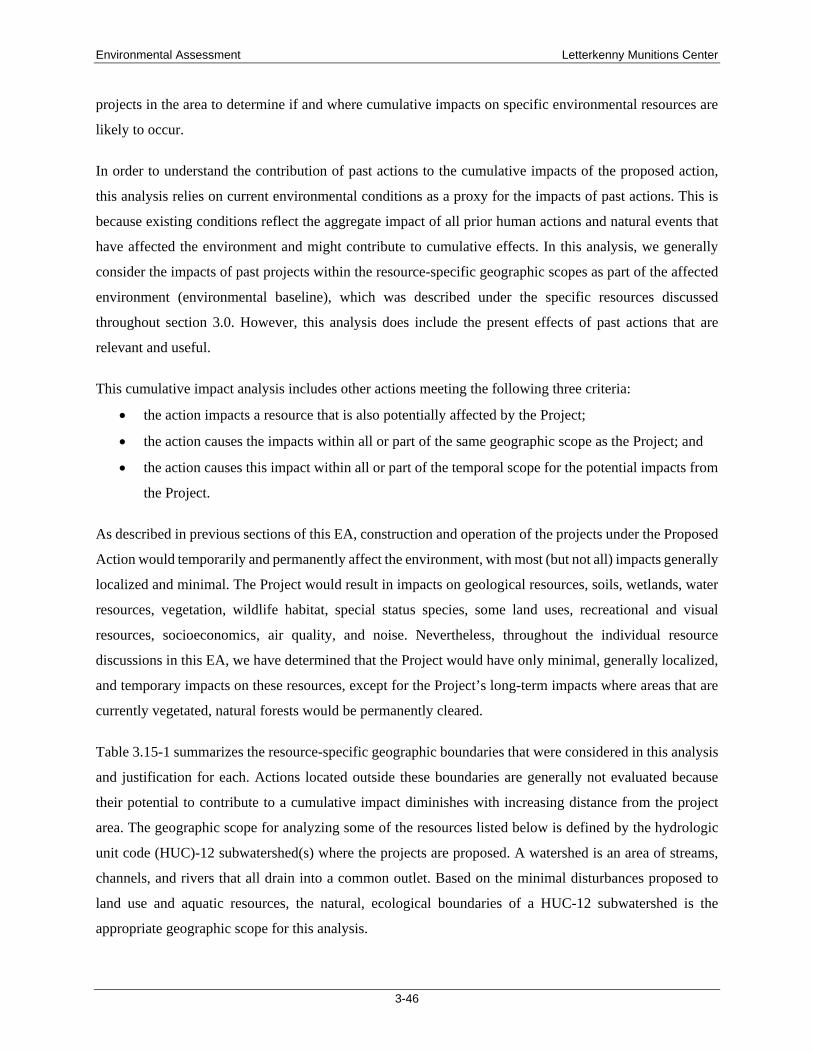
Environmental Assessment Letterkenny Munitions Center
3-46
projects in the area to determine if and where cumulative impacts on specific environmental resources are
likely to occur.
In order to understand the contribution of past actions to the cumulative impacts of the proposed action,
this analysis relies on current environmental conditions as a proxy for the impacts of past actions. This is
because existing conditions reflect the aggregate impact of all prior human actions and natural events that
have affected the environment and might contribute to cumulative effects. In this analysis, we generally
consider the impacts of past projects within the resource-specific geographic scopes as part of the affected
environment (environmental baseline), which was described under the specific resources discussed
throughout section 3.0. However, this analysis does include the present effects of past actions that are
relevant and useful.
This cumulative impact analysis includes other actions meeting the following three criteria:
• the action impacts a resource that is also potentially affected by the Project;
• the action causes the impacts within all or part of the same geographic scope as the Project; and
• the action causes this impact within all or part of the temporal scope for the potential impacts from
the Project.
As described in previous sections of this EA, construction and operation of the projects under the Proposed
Action would temporarily and permanently affect the environment, with most (but not all) impacts generally
localized and minimal. The Project would result in impacts on geological resources, soils, wetlands, water
resources, vegetation, wildlife habitat, special status species, some land uses, recreational and visual
resources, socioeconomics, air quality, and noise. Nevertheless, throughout the individual resource
discussions in this EA, we have determined that the Project would have only minimal, generally localized,
and temporary impacts on these resources, except for the Project’s long-term impacts where areas that are
currently vegetated, natural forests would be permanently cleared.
Table 3.15-1 summarizes the resource-specific geographic boundaries that were considered in this analysis
and justification for each. Actions located outside these boundaries are generally not evaluated because
their potential to contribute to a cumulative impact diminishes with increasing distance from the project
area. The geographic scope for analyzing some of the resources listed below is defined by the hydrologic
unit code (HUC)-12 subwatershed(s) where the projects are proposed. A watershed is an area of streams,
channels, and rivers that all drain into a common outlet. Based on the minimal disturbances proposed to
land use and aquatic resources, the natural, ecological boundaries of a HUC-12 subwatershed is the
appropriate geographic scope for this analysis.

Environmental Assessment Letterkenny Munitions Center
3-47
Table 3.15-1 Resource-Specific Geographic Regions for Determining Cumulative Impacts of the Project
Resource(s) Cumulative Impact Geographic Scope
Justification for Geographic Scope
Geological resources and soils
For geological resources, the area of disturbance of the Project and other projects would be overlapping or immediately abutting one another and involve excavation. Potential soils impact would be limited to within 0.25 mile of the Project workspaces.
Impacts on geological resources and soils would be highly localized and primarily limited to the respective project footprints during active construction. Cumulative impacts would only occur if other geographically overlapping or abutting projects were constructed at the same time as the Project
Surface water, groundwater and aquatic resources
HUC-12 subwatershed boundary. Impacts on surface waters can result in downstream contamination or turbidity; therefore, the geographic scope used to assess cumulative impacts on water and aquatic resources includes the HUC-12 subwatersheds within LEMC. Wetlands
Vegetation and wildlife
2 miles from the LEMC. For less-transient species, such as reptiles and amphibians, the geographic scope will be the area immediately within and abutting the project’s construction areas.
Due to the transient nature of wildlife, cumulative impacts on vegetation and wildlife have been considered within a 2-mile buffer of the LEMC.
Cultural resources
The area of potential effect of the Project and other projects would be overlapping or immediately abutting one another and involve excavation, or within the viewshed.
Project impacts on cultural resources would be restricted to the existing confines of the LEMC, therefore, the geographic scope for cumulative impacts is also confined to the LEMC.
Land use and special interest areas
0.5 mile from the project areas. Project impacts on general land uses would be restricted to the existing confines of the LEMC, therefore, the geographic scope for land use and recreation is 0.5 mile from the centerline of the LEMC boundary.
Visual resources
Viewshed varies based on topography and vegetation.
The geographic scope for assessing cumulative impacts on a viewshed includes the surrounding area from where a new facility would be visible. Therefore, the geographic scope would be limited to areas where clearing of mature trees or installation of new aboveground facilities would occur. 500 feet has been considered for most areas; however, that distance could be greater depending on surrounding topography.
Socioeconomics Affected county. Due to the Project’s limited regional scope, the geographic area for assessing contributions to cumulative impact on socioeconomics, including traffic-related impacts, was evaluated on a county-wide basis.
Air quality – construction
0.25 mile from the project. Due to the limited amount of emissions generated by construction equipment, the geographic scope used to assess potential cumulative impacts on air from construction activities was set at 0.25 mile from the LEMC.
Air quality – operation
Affected county, distance up to 25 kilometers from site
The area immediately surrounding the property will have the largest impacts from the LEMC’s operational emission. However, other nearby emissions sources could impact air quality in the area.
Noise Noise receptors that could be affected during construction and operation; up to 0.25 mile during construction and up to 1 mile during operation.
The geographic scope for assessing potential cumulative impacts on noise was determined to be up to 1 mile due to the nearby residents and municipalities within 1 mile from the Installation.

Environmental Assessment Letterkenny Munitions Center
3-48
Table 3.15-2 provides a preliminary list of the LEMC proposed projects as grouped by schedule. Table 3.15-2
Letterkenny Munitions Center Proposed Projects List
Project Description Project Category Project Number
Short-Range (0-5 years)
PAC 3 Facility New Construction 85904
Shipping and Receiving Facility (56,000 SF) New Construction 59700
Fire Station New Construction 85904
Realign Test Track Infrastructure Upgrade TBD
ACP & Visitors Center New Construction 66632
Renovation of Building 370 Renovation 93919
Renovation of Building 350 Renovation 90162
Renovation of Building 320 Renovation 93918
Industrial Waste Water Treatment Plant New Construction TBD
Mid-Range (6-15 years)
Electrical Distribution Center New Construction TBD
Consolidated POV Parking Lots New Construction TBD
TPY-2 Radar Site New Construction TBD
Ground Support Equipment Maintenance Facility (120,000 SF)
New Construction 68976
Force Provider Facility (240,000 SF) New Construction 69808
Perimeter Realignment and Land Swap Infrastructure Upgrade TBD
Long-Range (16-20 years)
DISA HQ and Administrative Campus (135,000 SF) New Construction 69878
LEAD HQ and Administrative Campus (95,000 SF) New Construction 69849
Electric Repair Facility New Construction 69864
Expansion of Building 320 Renovation TBD
Walking Trails and Open Space New Construction/Renovation TBD
Realigned Road and New LEMC Gate New Construction/ Infrastructure Upgrade
TBD
Capacity Plan
Capacity Administrative Facilities (Total of 336,000 SF)
New Construction TBD
Capacity Storage Facilities (Total of 467,000 SF) New Construction TBD
Capacity Production Facility (240,000 SF) New Construction TBD
Capacity Community Facilities New Construction TBD
Source: JG&A, 2019
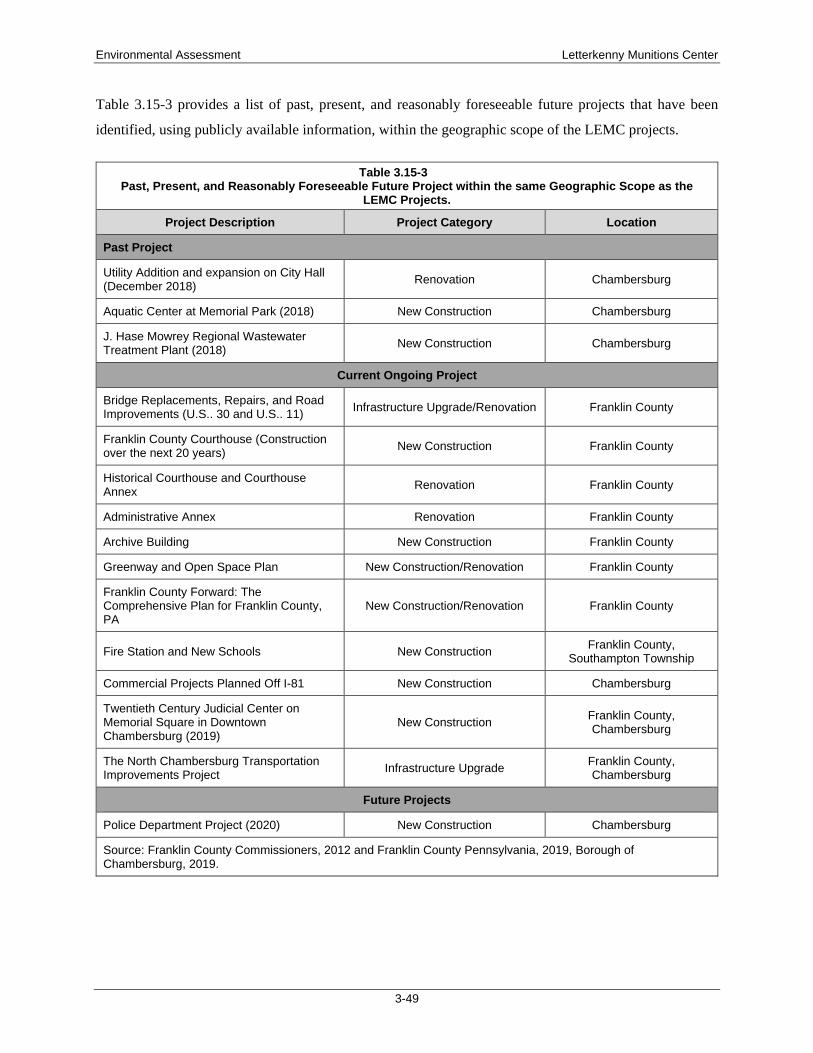
Environmental Assessment Letterkenny Munitions Center
3-49
Table 3.15-3 provides a list of past, present, and reasonably foreseeable future projects that have been
identified, using publicly available information, within the geographic scope of the LEMC projects.
Table 3.15-3 Past, Present, and Reasonably Foreseeable Future Project within the same Geographic Scope as the
LEMC Projects.
Project Description Project Category Location
Past Project
Utility Addition and expansion on City Hall (December 2018)
Renovation Chambersburg
Aquatic Center at Memorial Park (2018) New Construction Chambersburg
J. Hase Mowrey Regional Wastewater Treatment Plant (2018)
New Construction Chambersburg
Current Ongoing Project
Bridge Replacements, Repairs, and Road Improvements (U.S.. 30 and U.S.. 11)
Infrastructure Upgrade/Renovation Franklin County
Franklin County Courthouse (Construction over the next 20 years)
New Construction Franklin County
Historical Courthouse and Courthouse Annex
Renovation Franklin County
Administrative Annex Renovation Franklin County
Archive Building New Construction Franklin County
Greenway and Open Space Plan New Construction/Renovation Franklin County
Franklin County Forward: The Comprehensive Plan for Franklin County, PA
New Construction/Renovation Franklin County
Fire Station and New Schools New Construction Franklin County,
Southampton Township
Commercial Projects Planned Off I-81 New Construction Chambersburg
Twentieth Century Judicial Center on Memorial Square in Downtown Chambersburg (2019)
New Construction Franklin County, Chambersburg
The North Chambersburg Transportation Improvements Project
Infrastructure Upgrade Franklin County, Chambersburg
Future Projects
Police Department Project (2020) New Construction Chambersburg
Source: Franklin County Commissioners, 2012 and Franklin County Pennsylvania, 2019, Borough of Chambersburg, 2019.
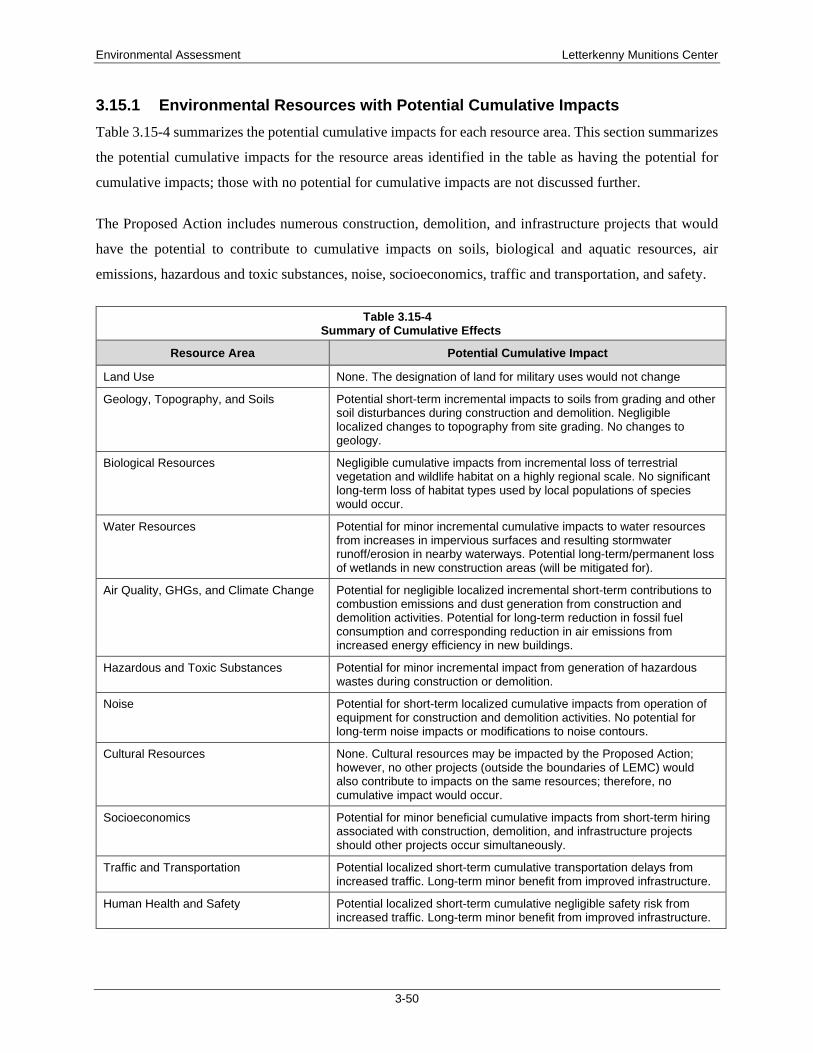
Environmental Assessment Letterkenny Munitions Center
3-50
3.15.1 Environmental Resources with Potential Cumulative Impacts
Table 3.15-4 summarizes the potential cumulative impacts for each resource area. This section summarizes
the potential cumulative impacts for the resource areas identified in the table as having the potential for
cumulative impacts; those with no potential for cumulative impacts are not discussed further.
The Proposed Action includes numerous construction, demolition, and infrastructure projects that would
have the potential to contribute to cumulative impacts on soils, biological and aquatic resources, air
emissions, hazardous and toxic substances, noise, socioeconomics, traffic and transportation, and safety.
Table 3.15-4 Summary of Cumulative Effects
Resource Area Potential Cumulative Impact
Land Use None. The designation of land for military uses would not change
Geology, Topography, and Soils Potential short-term incremental impacts to soils from grading and other soil disturbances during construction and demolition. Negligible localized changes to topography from site grading. No changes to geology.
Biological Resources Negligible cumulative impacts from incremental loss of terrestrial vegetation and wildlife habitat on a highly regional scale. No significant long-term loss of habitat types used by local populations of species would occur.
Water Resources Potential for minor incremental cumulative impacts to water resources from increases in impervious surfaces and resulting stormwater runoff/erosion in nearby waterways. Potential long-term/permanent loss of wetlands in new construction areas (will be mitigated for).
Air Quality, GHGs, and Climate Change Potential for negligible localized incremental short-term contributions to combustion emissions and dust generation from construction and demolition activities. Potential for long-term reduction in fossil fuel consumption and corresponding reduction in air emissions from increased energy efficiency in new buildings.
Hazardous and Toxic Substances Potential for minor incremental impact from generation of hazardous wastes during construction or demolition.
Noise Potential for short-term localized cumulative impacts from operation of equipment for construction and demolition activities. No potential for long-term noise impacts or modifications to noise contours.
Cultural Resources None. Cultural resources may be impacted by the Proposed Action; however, no other projects (outside the boundaries of LEMC) would also contribute to impacts on the same resources; therefore, no cumulative impact would occur.
Socioeconomics Potential for minor beneficial cumulative impacts from short-term hiring associated with construction, demolition, and infrastructure projects should other projects occur simultaneously.
Traffic and Transportation Potential localized short-term cumulative transportation delays from increased traffic. Long-term minor benefit from improved infrastructure.
Human Health and Safety Potential localized short-term cumulative negligible safety risk from increased traffic. Long-term minor benefit from improved infrastructure.

Environmental Assessment Letterkenny Munitions Center
3-51
3.15.1.1 Geology, Topography, and Soils Although the proposed projects under the ADP involve demolition and earth work that would result in
moderate short- and long-term impacts on soils, none of the other projects identified in table 3.15-3 would
be constructed at the same time, nor do they geographically overlap or abut the LEMC. Therefore, no
cumulative impact is expected on geology, topography, or soils.
3.15.1.2 Biological Resources Minor cumulative impacts to terrestrial biological habitat would occur as the result of the new construction
projects under the Proposed Action. Some of the proposed projects would result in the permanent loss of
forested land and of maintained/mowed landscape. This loss would be additive with the conversion of land
from other past and reasonably foreseeable future activities. Because all impacts to vegetation resulting
from the proposed projects would be confined within the boundary of LEMC and would comply with the
requirements of local, state, and federal permits associated with land disturbing impacts and protected
species, it is not expected that vegetation impacts of the proposed projects would interact with other projects
occurring outside of LEMC. Thus, the Proposed Action’s contribution towards a cumulative effect on
regional vegetation and/or wildlife would be negligible.
3.15.1.3 Water Resources Indirect cumulative impacts to water resources could occur during construction and demolition and
following construction projects associated with the Proposed Action. The amount of impervious surface at
LEMC would increase following implementation of all the proposed projects and could be additive with
unrelated projects planned or potentially occurring within the same timeframe and same watershed.
Construction and post-construction stormwater BMPs would limit impacts, although minor cumulative
impacts could occur through incremental increases in scour and sedimentation.
Potential effects to water resources would be confined within the boundaries of LEMC. BMPs and design
features would minimize the potential for indirect impacts to offsite waters. Planned improvements in 2020
for a number of bridges along U.S.-Hwy-30 and U.S.-Hwy-11 could coincide with some of the short-range
(0-5 years) projects proposed under the Proposed Action. There is little potential for interaction of all the
proposed projects with other past, present, and reasonably foreseeable projects outside LEMC boundaries.
Projects within the boundaries of LEMC and unrelated off-post projects may incrementally contribute to
impacts to wetland resources. The Proposed Action would likely result in temporary and permanent impacts
on wetlands, which would require mitigation either through the purchase of mitigation credits, payment to
an in-lieu fee program, or through the development of a permittee-responsible mitigation site.

Environmental Assessment Letterkenny Munitions Center
3-52
3.15.1.4 Air Quality, GHGs, and Climate Change Construction of projects under the Proposed Action (as well as most of the projects and activities listed in
table 3.15-3) would involve the use of heavy equipment that would generate temporary emissions of air
contaminants and fugitive dust. The majority of criteria emissions generated during construction would be
PM10 and PM2.5 in the form of fugitive dust that would result from clearing, grading, excavation, and vehicle
traffic on unpaved roadways. Typically, PM10 settles quickly near the construction sites. The cumulative
air impacts would be additive emissions of pollutants due to the use of equipment powered by diesel or
gasoline engines and further generation of fugitive dust from land clearing and grading. Emissions could
be reduced by various abatement measures including using properly maintained vehicles, and storage pile
and pavement watering. The impacts would be localized to the vicinity of the construction areas during
active construction. For projects under the Proposed Action to contribute to a cumulative impact from
construction air emissions, other projects/actions listed in Table 3.15-3 would need to also involve
concurrent construction (temporal scope) in an area within 0.25 mile of the active construction footprint at
the Installation (geographic scope). None of the other projects are located within 0.25 mile of the
Installation; therefore, the Proposed Action in not expected to contribute to cumulative impacts on air
quality during construction.
The projects listed in Table 2.2-1 are not expected to create large emissions increases of criteria pollutants.
Since the project list contains new buildings, building expansions, building updates, increased and updated
storage operations, and infrastructure updates, there are not expected to be many new emission sources as
a part of the project list. Some buildings may require emergency equipment, but operation of these sources
would be limited to maintenance and testing operations (approximately 200 hours per year of operation).
Similarly, the new/replacement buildings and upgrades to existing buildings would increase the building
efficiency, reducing the energy needed to operate said buildings. Similarly, only the wastewater treatment
plant from the list provided in Table 3.15-3 is expected to have operational emissions that would affect the
air quality. All other buildings are not expected to have any emission sources, or are expected to have
emergency equipment only, as a part of construction.
Table 3.15-5 shows the 2017 Emissions Inventory for Franklin County, Pennsylvania (PDEQ), the 2017
Emissions Inventory for LEMC, and the emissions estimate for the construction of the projects.

Environmental Assessment Letterkenny Munitions Center
3-53
Table 3.15-5 Franklin County Emissions (2017) Compared to Facility Emissions (2017) and Project Emissions
Pollutant Franklin County Emissions (tons)
LEMC Operational
Emissions (tons)
Short-Range Project
Emissions (tons)
Mid-Range Project
Emissions (tons)
Long-Range Project
Emissions (tons)
NOx 223.49 25.60 93.74 19.79 1,596.79
CO 433.95 16.00 528.10 83.06 9,417.24
VOC 293.35 33.30 31.93 6.11 581.35
SO2 18.35 5.30 7.61 1.97 157.71
PM10 196.29 79.90 5.27 1.06 97.70
PM2.5 106.85 79.90 5.22 1.06 97.25
CO2 262,211.90 15,419.80 23,406.01 2,398.58 232,981.19
CH4 6,522.61 0.30 0.35 0.10 9.86
N2O 1.11 0.00 0.10 0.66 2.04
CO2e 425,608.89 15,427.30 23,444.67 2,596.78 233,836.32
GHGs were calculated for each of the Projects during construction and are reported in Table 3.6-2. GHG
emissions from construction equipment are temporary and operational emissions from the project would
not drastically change from the current condition. Additionally, increased efficiency of the new, replaced,
and updated buildings would reduce the energy needed to power the facility. Since the GHG emissions
from the projects are expected to largely be from the construction and the updates and renovations are
expected to reduce energy consumption from the facility, the Projects are not expected to contribute to
climate change.
3.15.1.5 Hazardous and Toxic Substances Construction and demolition projects could have the potential for incremental increased generation of
hazardous wastes, which would require proper handling and disposal.
3.15.1.6 Noise Section 3.8 describes the existing noise environment at LEMC and identifies several residences located just
north of the LEMC boundary. Construction of the Proposed Action would result in minor increases of noise
levels, as compared to current ambient levels, due to the presence and operation of construction equipment
and general construction-related activities. However, once all projects defined under the Proposed Action
are complete, no permanent increases in noise are anticipated. Further, none of the other projects identified
in table 3.15-3 are located within close enough proximity to those same 6 residences for there to be a
cumulative impact when combined with the Proposed Action. Therefore, the Proposed Action would not

Environmental Assessment Letterkenny Munitions Center
3-54
contribute towards a cumulative increase in noise at nearby noise sensitive receptors, when combined with
the other past, present, and reasonably foreseeable future projects.
3.15.1.7 Socioeconomics The Proposed Action would result in some beneficial direct and indirect impacts on the local economy
resulting from construction, renovation, and infrastructure upgrade activities. These impacts would be
moderate and short-term. Local business could experience increases in employment and sales volume, and
an increase in construction workers could increase payroll taxes and purchase of goods and services. The
same type of net positive impact is anticipated from most of the other projects. Therefore, a beneficial
cumulative impact is expected for any projects overlapping in schedule within the Franklin County area.
3.15.1.8 Traffic and Transportation Since the LEMC is surrounded by U.S.-Hwy-30 and U.S.-Hwy-11, construction of the Proposed Action is
expected to result in a minor but noticeable increase in traffic from workers and the transportation of
materials and equipment. This increase is expected across the life of the projects, until all active construction
is complete. There were two other projects identified that would directly affect traffic and transportation
within the same general area. The Pennsylvania DOT is planning infrastructure improvement projects along
U.S.-Hwy-30 and U.S.- Hwy-11. Cumulatively, these highway improvement projects would result in a
cumulative increase in traffic thus directly impacting transportation in the area. However, when the highway
improvements are complete, increased congestion is expected to subside due to the improvements being
complete.
3.15.1.9 Human Health and Safety To quantify cumulative impacts on human health and safety, other projects would need to overlap both in
schedule and geographically. None of the other projects identified in table 3.15-3 would share the same
geographic and temporal scope as the proposed projects. Therefore, no cumulative impact on human health
and safety is expected.
3.16 Mitigation Measures
LEMC would acquire the appropriate permits and clearances for the proposed projects, and mitigation
measures would be implemented based on each permit requirements. Mitigation measures could include
buying mitigation credits for impacts to wetlands and streams, implementing appropriate BMPs during
construction, and limiting construction windows to avoid impacts to species. However, additional
mitigation measures may be required on a project by project basis.

Environmental Assessment Letterkenny Munitions Center
4-1
4.0 REFERENCES
American Hospital Directory. 2019. Pennsylvania. Retrieved from: www.ahd.com/freesearch.php3. Site accessed July 2019.
Borough of Chambersburg. 2019. 2019 Budget Document. Retrieved from: http://www.borough.chambersburg.pa.us/government/documents.html. Site accessed July 2019.
Fire Department Directory. 2019. Fire Department Information. Retrieved from: http://firedepartmentdirectory.com. Site accessed July 2019.
Franklin County Commissioners. 2012. Franklin County, PA Comprehensive Plan. Retrieved from: https://franklincountypa.gov/ckeditorfiles/files/Planning/planning_Executive_Summary_5-16-13.pdf. Site accessed July 2019.
Franklin County Pennsylvania. 2019. Planning Department, County Plans. Retrieved from: https://www.franklincountypa.gov/index.php?section=departments_planning. Site accessed July 2019.
Intergovernmental Panel on Climate Change (IPCC). 2007. Contribution of Working Group II to the Fourth Assessment Report of the Intergovernmental Panel on Climate Change. Cambridge University Press, Cambridge,UK.
John Gallup & Associates (JG&A). 2019. Letterkenny Munitions Center Area Development Plan. Prepared for Letterkenny Army Depot, chambersburg, PA, by John Gallup & Associates in association with The Schriefer Group.
LEAD. 2015. Implementation of Integrated Wildland Fire Management Plan at Letterkenny Army Depot Chambersburg, Pennsylvania. December 2015.
New South Associates, Inc. 2013. Department of the Army. United States Army Letterkenny Army Depot, Pennsylvania. Integrated Cultural Resources Management Plan.
Pennsylvania Department of Conservation and Natural Resources (PDCNR). 2018. Physiographic Provinces of Pennsylvania. Bureau of Topographic and Geologic Survey. Fourth Edition, Second Printing. Accessed September 3, 2019. Available via the internet at: http://www.docs.dcnr.pa.gov/cs/groups/public/documents/document/dcnr_016202.pdf
Pennsylvania Department of Environmental Quality (PDEQ). 2019. Air Quality Reports. Bureau of Air Quality. Retrieved from: http://www.depgreenport.state.pa.us/powerbiproxy/powerbi/Public/DEP/AQ/PBI/Air_Emissions_Report. Accessed October 24, 2019.
Public School Review. 2019. Profiles of USA Public Schools. Retrieved from: http://www.publicschoolreview.com. Site accessed July 2019.
Swain, Lindsay A.; Mesko, Thomas O.; and Hollyday, Este F. 2004. Summary of the Hydrogeology of the Valley and Ridge, Blue Ridge, and Piedmont Physiographic Provinces in the Eastern United States. Professional Paper 1422-A. U.S. Department of Interior and U.S. Geological Survey. Regional Aquifer-System Analysis.
Environmental Assessment Letterkenny Munitions Center
4-2
Tetra Tech, Inc. 2013. Letterkenny Army Depot Integrated Natural Resources Management Plan 2013-2018. Prepared for Letterkenny Army Depot, Chambersburg, PA, by Tetra Tech, Inc., Fairfax, VA.
Tetra Tech, Inc. 2018. Invasive Species Management Plan. Prepared for Letterkenny Army Depot, Chambersburg, PA, by Tetra Tech, Inc., Fairfax, VA.
U.S. Bureau of the Census. 2019. Commuting Characteristics by Sex, 2013-2017 American Community Survey 5-Year Estimates, United States. Retrieved from: https://factfinder.census.gov/faces/tableservices/jsf/pages/productview.xhtml?pid=ACS_16_5YR_S0801&prodType=table. Site accessed July 2019.
USACops. 2019. Law Enforcement Agencies. Retrieved from: http://www.usacops.com/. Site accessed July 2019.
U.S. Environmental Protection Agency (USEPA). 2011. Overview of Greenhouse Gas Emissions. <https://www.epa.gov/ghgemissions/overview-greenhouse-gases>. Accessed October 25, 2019.
U.S. Environmental Protection Agency (USEPA). 2019. EJSCREEN. EPA’s
U.S. Fish and Wildlife (USFW). 2019. IPaC Resource List. Website: https://ecos.fws.gov/ipac/. Accessed: December 2019.
Weston. 2011. Location of AEDBR Sites at Letterkenny Army Depot. Letterkenny Army Depot, Chambersburg, PA. Revised January 6, 2011.
Environmental Assessment Letterkenny Munitions Center
5-1
5.0 AGENCIES AND PERSONS CONTACTED
Tim Burkholder, Letterkenny Munitions Center
Craig Kindlin, Letterkenny Army Depot Natural Resources Manager, Chambersburg, PA
Bryan Hoke, Letterkenny Army Depot Installation Restoration Program Manager, Chambersburg, PA
Erin Kendle, Letterkenny Army Depot Environmental Management Division, Chambersburg, PA
Sam Pelesky, Letterkenny Army Depot Air Quality, Chambersburg, PA
Environmental Assessment Letterkenny Munitions Center
6-1
6.0 LIST OF PREPARERS
Sara Kent, Burns & McDonnell BS. Fisheries & Aquaculture, University of Georgia Years of experience: 12 Robyn Susemihl, Burns & McDonnell BS, Zoology, Auburn University Years of experience: 15
Caitlin Ownbey, Burns & McDonnell BS, Environmental Engineering. Clemson University Years of experience: 3 Tess Fuller, Burns & McDonnell BS Chemical Engineering, Rose-Hulman Institute of Technology Years of Experience: 10 Emily Robbins, Burns & McDonnell MS. Environmental Engineering, University of Kansas Years of experience: 8
Jon Hill, Burns & McDonnell M.S. Environmental Engineering, Missouri University of Science and Technology Years of Experience: 2
Shari Cannon-Mackey, CEP, ENV SP MLA Landscape Architecture, Emphasis Animal Ecology BLA Landscape Architecture BS Fisheries & Wildlife Biology Years of Experience: 29

Environmental Assessment Letterkenny Munitions Center
7-1
7.0 DISTRIBUTION LIST
Environmental Assessment Letterkenny Munitions Center
APPENDIX A – AGENCY CONSULTATIONS

Insert any previously submitted/received consultation letters here.

Environmental Assessment Letterkenny Munitions Center
APPENDIX B – AIR QUALITY CALCULATIONS

Letterkenny Ammunitions Center (LEMC)Estimated On-Road Tailpipe Emissions
Table 1: 10,000 Square foot NEW Building (BMCD ID: 8, 13, 15, 21, 24, 27, 29, 31, 33, and 36) 2,322 730
Table 2: 4,000 square foot NEW building (BMCD ID: 14) 2,322 0
Table 3: 2,700 sqft NEW Building (BMcD ID: 26) 2,322 0
Table 4: 2,400 sqft NEW Building (BMCD ID: 19) 2,322 0
Table 5: 100 Space PARKING LOT (BMCD ID: 7) 1,242 0
Table 6: 1,750 sqft NEW Building (BMCD ID: 10, 12) 5,562 0
Table 7: 5,000 sqft NEW Building (BMCD ID: 40) 2,322 0
Table 8: 35,000 sqft NEW Building (BMCD ID: 2) 17,604 4,380
Table 9: 45,000 sqft NEW Building (x2 BMCD ID: 1) 43,394 10,220
Table 10: 82,000 sqft NEW Building (x4) (BMCD ID: 5) 76,118 18,980
Table 11: 1,125,000 sqft NEW Building (BMCD ID: 50) 2,302,884 591,008
Table 12: 2,700 to 22,000 Square foot REPLACEMENT Building (BMCD ID: 39, 41 through 46, 48, 7 total) 18,684 730
Table 13: 0.9 Acre PARKING LOT (BMCD ID: 11) 2,484 0
Table 14: Expand Roadway at Voelz Gate PARKING LOT (BMCD ID: 4) 17,496 0
Table 15:250 square foot New Building (BMCD ID: 16) 1,242 0
Table 16: 750 square foot UPGRADED Building (BMCD ID: 17) 22,302 0
Table 17: 2050 square foot Upgraded Building (x 1004 BMCD ID: 38) 22,302 0
Table 18: 4400 square foot Upgraded Building (BMCD ID: 28) 22,302 0
Table 19: 5878 square foot Upgraded Building (BMCD ID: 34 and 37) 4,212 730
Table 20: 12,000 square foot Upgraded Building (BMCD ID: 30 and 35) 7,506 1,460
Table 21: 35,000 square foot REPLACEMENT Building (BMCD ID: 47) 18,684 4,380
Table 22: 10 Acre New Security Post Parking lot (BMCD ID: 25a) 6,869 0
Table 23: 100,000 square foot PARKING LOT (BMCD ID: 22) 7,992 0
Table 24: 3 miles of electric upgrades (BMCD ID: 20) 1,512 0
Table 25: 22 miles of RAIL network (BMCD ID: 3) 2,337,444 610,280
Table 26: 10 acre RAIL classification yard (BMCD ID: 6) 472,068 119,209
Table 27: Restoration of 4 miles of RAIL (BMCD ID: 18) 226,584 2,044
Table 28: Repair 11 miles of asphalt ROADS (BMCD ID: 23) 58,644 0
Table 29: Repair 1560000 sqft of asphalt ROADS (BMCD ID: 32) 69,120 0
Table 30: New Security Post Buildings (x2) (BMCD ID: 25b) 5,562 0
Table 31: Upgrade Utility Infrastructure Overall (BMcD ID 9) 1,650,456 0
Passenger Vehicles
NOx CO VOC SO2 PM10 PM2.5 CO2c CH4 N2O NOx CO VOC SO2 PM10 PM2.5 CO2 CH4 N2O CO2e
d
Table 1: 10,000 Square foot NEW Building (BMCD ID: 8, 13, 15, 21, 24, 27, 29, 31, 33, and 36)Gasoline 63% 1462.86 0.14 3.02 0.18 5.77E-03 0.03 1.17E-02 348.17 1.14E-02 5.58E-03 2.22E-04 4.86E-03 2.88E-04 9.30E-06 4.13E-05 1.88E-05 0.56 1.83E-05 9.00E-06 0.56
Diesel 7% 162.54 0.51 1.75 0.07 4.74E-03 0.02 9.87E-03 348.17 6.33E-02 7.00E-04 9.07E-05 3.14E-04 1.24E-05 8.50E-07 4.20E-06 1.77E-06 0.06 1.13E-05 1.25E-07 0.06Gasoline 27% 626.94 0.35 5.26 0.30 7.65E-03 0.04 1.90E-02 476.00 2.58E-02 1.10E-02 2.41E-04 3.63E-03 2.07E-04 5.29E-06 2.71E-05 1.32E-05 0.33 1.78E-05 7.62E-06 0.33
Diesel 3% 69.66 1.78 1.25 0.15 8.53E-03 0.07 5.06E-02 476.00 7.57E-02 2.81E-03 1.37E-04 9.59E-05 1.16E-05 6.55E-07 5.48E-06 3.88E-06 0.04 5.81E-06 2.16E-07 0.04Total Emissions Per Project (tpy) 6.90E-04 8.91E-03 5.19E-04 1.61E-05 7.81E-05 3.76E-05 0.99 5.33E-05 1.70E-05 1.00
Gasoline 63% 1462.86 0.14 3.02 0.18 5.77E-03 0.03 1.17E-02 348.17 1.14E-02 5.58E-03 2.22E-04 4.86E-03 2.88E-04 9.30E-06 4.13E-05 1.88E-05 0.56 1.83E-05 9.00E-06 0.56Diesel 7% 162.54 0.51 1.75 0.07 4.74E-03 0.02 9.87E-03 348.17 6.33E-02 7.00E-04 9.07E-05 3.14E-04 1.24E-05 8.50E-07 4.20E-06 1.77E-06 0.06 1.13E-05 1.25E-07 0.06
Gasoline 27% 626.94 0.35 5.26 0.30 7.65E-03 0.04 1.90E-02 476.00 2.58E-02 1.10E-02 2.41E-04 3.63E-03 2.07E-04 5.29E-06 2.71E-05 1.32E-05 0.33 1.78E-05 7.62E-06 0.33Diesel 3% 69.66 1.78 1.25 0.15 8.53E-03 0.07 5.06E-02 476.00 7.57E-02 2.81E-03 1.37E-04 9.59E-05 1.16E-05 6.55E-07 5.48E-06 3.88E-06 0.04 5.81E-06 2.16E-07 0.04
Total Emissions Per Project (tpy) 6.90E-04 8.91E-03 5.19E-04 1.61E-05 7.81E-05 3.76E-05 0.99 5.33E-05 1.70E-05 1.00
Gasoline 63% 782.46 0.14 3.02 0.18 5.77E-03 0.03 1.17E-02 348.17 1.14E-02 5.58E-03 1.19E-04 2.60E-03 1.54E-04 4.97E-06 2.21E-05 1.00E-05 0.30 9.79E-06 4.82E-06 0.30Diesel 7% 86.94 0.51 1.75 0.07 4.74E-03 0.02 9.87E-03 348.17 6.33E-02 7.00E-04 4.85E-05 1.68E-04 6.64E-06 4.54E-07 2.24E-06 9.46E-07 0.03 6.07E-06 6.71E-08 0.03
Gasoline 27% 335.34 0.35 5.26 0.30 7.65E-03 0.04 1.90E-02 476.00 2.58E-02 1.10E-02 1.29E-04 1.94E-03 1.10E-04 2.83E-06 1.45E-05 7.04E-06 0.18 9.54E-06 4.08E-06 0.18Diesel 3% 37.26 1.78 1.25 0.15 8.53E-03 0.07 5.06E-02 476.00 7.57E-02 2.81E-03 7.33E-05 5.13E-05 6.23E-06 3.50E-07 2.93E-06 2.08E-06 0.02 3.11E-06 1.15E-07 0.02
Total Emissions Per Project (tpy) 3.69E-04 4.76E-03 2.78E-04 8.61E-06 4.18E-05 2.01E-05 0.53 2.85E-05 9.07E-06 0.53
Gasoline 63% 3504.06 0.14 3.02 0.18 5.77E-03 0.03 1.17E-02 348.17 1.14E-02 5.58E-03 5.31E-04 1.17E-02 6.91E-04 2.23E-05 9.89E-05 4.50E-05 1.34 4.38E-05 2.16E-05 1.35Diesel 7% 389.34 0.51 1.75 0.07 4.74E-03 0.02 9.87E-03 348.17 6.33E-02 7.00E-04 2.17E-04 7.51E-04 2.97E-05 2.04E-06 1.00E-05 4.23E-06 0.15 2.72E-05 3.00E-07 0.15
Gasoline 27% 1501.74 0.35 5.26 0.30 7.65E-03 0.04 1.90E-02 476.00 2.58E-02 1.10E-02 5.77E-04 8.70E-03 4.95E-04 1.27E-05 6.49E-05 3.15E-05 0.79 4.27E-05 1.83E-05 0.79Diesel 3% 166.86 1.78 1.25 0.15 8.53E-03 0.07 5.06E-02 476.00 7.57E-02 2.81E-03 3.28E-04 2.30E-04 2.79E-05 1.57E-06 1.31E-05 9.30E-06 0.09 1.39E-05 5.17E-07 0.09
Total Emissions Per Project (tpy) 1.65E-03 2.13E-02 1.24E-03 3.85E-05 1.87E-04 9.00E-05 2.37 1.28E-04 4.06E-05 2.39
Gasoline 63% 1462.86 0.14 3.02 0.18 5.77E-03 0.03 1.17E-02 348.17 1.14E-02 5.58E-03 2.22E-04 4.86E-03 2.88E-04 9.30E-06 4.13E-05 1.88E-05 0.56 1.83E-05 9.00E-06 0.56Diesel 7% 162.54 0.51 1.75 0.07 4.74E-03 0.02 9.87E-03 348.17 6.33E-02 7.00E-04 9.07E-05 3.14E-04 1.24E-05 8.50E-07 4.20E-06 1.77E-06 0.06 1.13E-05 1.25E-07 0.06
Gasoline 27% 626.94 0.35 5.26 0.30 7.65E-03 0.04 1.90E-02 476.00 2.58E-02 1.10E-02 2.41E-04 3.63E-03 2.07E-04 5.29E-06 2.71E-05 1.32E-05 0.33 1.78E-05 7.62E-06 0.33Diesel 3% 69.66 1.78 1.25 0.15 8.53E-03 0.07 5.06E-02 476.00 7.57E-02 2.81E-03 1.37E-04 9.59E-05 1.16E-05 6.55E-07 5.48E-06 3.88E-06 0.04 5.81E-06 2.16E-07 0.04
Total Emissions Per Project (tpy) 6.90E-04 8.91E-03 5.19E-04 1.61E-05 7.81E-05 3.76E-05 0.99 5.33E-05 1.70E-05 1.00
Gasoline 63% 11090.52 0.14 3.02 0.18 5.77E-03 0.03 1.17E-02 348.17 1.14E-02 5.58E-03 1.68E-03 3.69E-02 2.19E-03 7.05E-05 3.13E-04 1.42E-04 4.26 1.39E-04 6.83E-05 4.28Diesel 7% 1232.28 0.51 1.75 0.07 4.74E-03 0.02 9.87E-03 348.17 6.33E-02 7.00E-04 6.88E-04 2.38E-03 9.41E-05 6.44E-06 3.18E-05 1.34E-05 0.47 8.60E-05 9.51E-07 0.48
Gasoline 27% 4753.08 0.35 5.26 0.30 7.65E-03 0.04 1.90E-02 476.00 2.58E-02 1.10E-02 1.83E-03 2.75E-02 1.57E-03 4.01E-05 2.05E-04 9.97E-05 2.49 1.35E-04 5.78E-05 2.51Diesel 3% 528.12 1.78 1.25 0.15 8.53E-03 0.07 5.06E-02 476.00 7.57E-02 2.81E-03 1.04E-03 7.27E-04 8.83E-05 4.96E-06 4.16E-05 2.94E-05 0.28 4.40E-05 1.63E-06 0.28
Total Emissions Per Project (tpy) 5.23E-03 6.75E-02 3.93E-03 1.22E-04 5.92E-04 2.85E-04 7.50 4.04E-04 1.29E-04 7.55
Gasoline 63% 27338.47 0.14 3.02 0.18 5.77E-03 0.03 1.17E-02 348.17 1.14E-02 5.58E-03 4.14E-03 9.09E-02 5.39E-03 1.74E-04 7.72E-04 3.51E-04 10.49 3.42E-04 1.68E-04 10.55Diesel 7% 3037.61 0.51 1.75 0.07 4.74E-03 0.02 9.87E-03 348.17 6.33E-02 7.00E-04 1.70E-03 5.86E-03 2.32E-04 1.59E-05 7.84E-05 3.30E-05 1.17 2.12E-04 2.34E-06 1.17
Gasoline 27% 11716.49 0.35 5.26 0.30 7.65E-03 0.04 1.90E-02 476.00 2.58E-02 1.10E-02 4.50E-03 6.79E-02 3.86E-03 9.88E-05 5.06E-04 2.46E-04 6.15 3.33E-04 1.42E-04 6.20Diesel 3% 1301.83 1.78 1.25 0.15 8.53E-03 0.07 5.06E-02 476.00 7.57E-02 2.81E-03 2.56E-03 1.79E-03 2.18E-04 1.22E-05 1.02E-04 7.25E-05 0.68 1.09E-04 4.03E-06 0.69
Total Emissions Per Project (tpy) 1.29E-02 1.66E-01 9.70E-03 3.01E-04 1.46E-03 7.02E-04 18.49 9.96E-04 3.17E-04 18.61
Gasoline 63% 47954.59 0.14 3.02 0.18 5.77E-03 0.03 1.17E-02 348.17 1.14E-02 5.58E-03 7.27E-03 1.59E-01 9.45E-03 3.05E-04 1.35E-03 6.16E-04 18.40 6.00E-04 2.95E-04 18.51Diesel 7% 5328.29 0.51 1.75 0.07 4.74E-03 0.02 9.87E-03 348.17 6.33E-02 7.00E-04 2.97E-03 1.03E-02 4.07E-04 2.78E-05 1.38E-04 5.80E-05 2.04 3.72E-04 4.11E-06 2.06
Gasoline 27% 20551.97 0.35 5.26 0.30 7.65E-03 0.04 1.90E-02 476.00 2.58E-02 1.10E-02 7.90E-03 1.19E-01 6.77E-03 1.73E-04 8.88E-04 4.31E-04 10.78 5.85E-04 2.50E-04 10.87Diesel 3% 2283.55 1.78 1.25 0.15 8.53E-03 0.07 5.06E-02 476.00 7.57E-02 2.81E-03 4.49E-03 3.15E-03 3.82E-04 2.15E-05 1.80E-04 1.27E-04 1.20 1.90E-04 7.07E-06 1.21
Total Emissions Per Project (tpy) 2.26E-02 2.92E-01 1.70E-02 5.27E-04 2.56E-03 1.23E-03 32.43 1.75E-03 5.56E-04 32.64
Passenger Truck
Passenger Car
Passenger Truck
Passenger Car
Passenger Truck
Passenger Car
Passenger Truck
Table 6: 1,750 sqft NEW Building (BMCD ID: 10, 12)
Table 7: 5,000 sqft NEW Building (BMCD ID: 40)
Table 8: 35,000 sqft NEW Building (BMCD ID: 2)
Table 9: 45,000 sqft NEW Building (x2 BMCD ID: 1)
Table 10: 82,000 sqft NEW Building (x4) (BMCD ID: 5)
Passenger Car
Passenger Truck
Passenger Car
Project ListDelivery Vehicle Miles Travelled
Emission Factor (g/mile)b
Worker Vehicle Miles
Travelled
Passenger Car
Passenger Truck
Emissions (tons)
Type Fuel PercentageaWorker VMT
(miles/project)
Passenger Car
Passenger Truck
Passenger Car
Passenger Truck
Passenger Car
Passenger Truck
Passenger Car
Passenger Truck
Table 2: 4,000 square foot NEW building (BMCD ID: 14)
Table 3: 2,700 sqft NEW Building (BMcD ID: 26)
Table 4: 2,400 sqft NEW Building (BMCD ID: 19)
Table 5: 100 Space PARKING LOT (BMCD ID: 7)
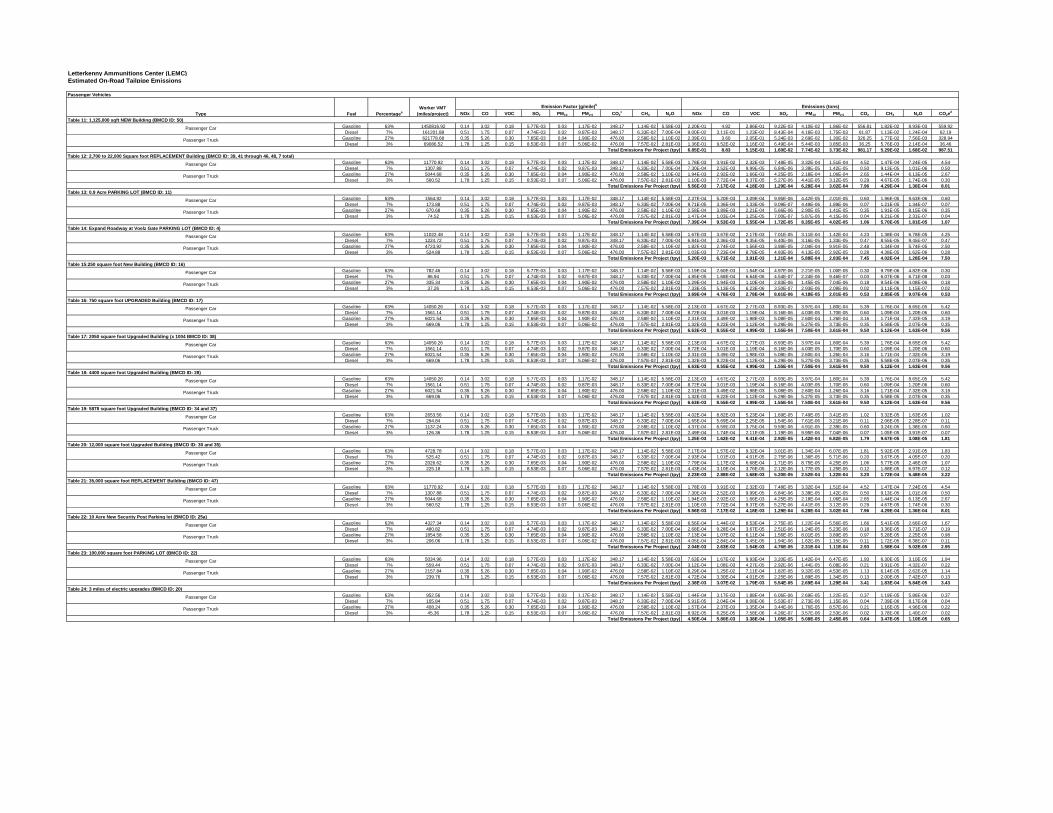
Letterkenny Ammunitions Center (LEMC)Estimated On-Road Tailpipe Emissions
NOx CO VOC SO2 PM10 PM2.5 CO2c CH4 N2O NOx CO VOC SO2 PM10 PM2.5 CO2 CH4 N2O CO2e
d
Gasoline 63% 1450816.92 0.14 3.02 0.18 5.77E-03 0.03 1.17E-02 348.17 1.14E-02 5.58E-03 2.20E-01 4.82 2.86E-01 9.22E-03 4.10E-02 1.86E-02 556.81 1.82E-02 8.93E-03 559.92Diesel 7% 161201.88 0.51 1.75 0.07 4.74E-03 0.02 9.87E-03 348.17 6.33E-02 7.00E-04 9.00E-02 3.11E-01 1.23E-02 8.43E-04 4.16E-03 1.75E-03 61.87 1.13E-02 1.24E-04 62.19
Gasoline 27% 621778.68 0.35 5.26 0.30 7.65E-03 0.04 1.90E-02 476.00 2.58E-02 1.10E-02 2.39E-01 3.60 2.05E-01 5.24E-03 2.69E-02 1.30E-02 326.25 1.77E-02 7.56E-03 328.94Diesel 3% 69086.52 1.78 1.25 0.15 8.53E-03 0.07 5.06E-02 476.00 7.57E-02 2.81E-03 1.36E-01 9.52E-02 1.16E-02 6.49E-04 5.44E-03 3.85E-03 36.25 5.76E-03 2.14E-04 36.46
Total Emissions Per Project (tpy) 6.85E-01 8.83 5.15E-01 1.60E-02 7.74E-02 3.73E-02 981.17 5.29E-02 1.68E-02 987.51
Gasoline 63% 11770.92 0.14 3.02 0.18 5.77E-03 0.03 1.17E-02 348.17 1.14E-02 5.58E-03 1.78E-03 3.91E-02 2.32E-03 7.48E-05 3.32E-04 1.51E-04 4.52 1.47E-04 7.24E-05 4.54Diesel 7% 1307.88 0.51 1.75 0.07 4.74E-03 0.02 9.87E-03 348.17 6.33E-02 7.00E-04 7.30E-04 2.52E-03 9.99E-05 6.84E-06 3.38E-05 1.42E-05 0.50 9.13E-05 1.01E-06 0.50
Gasoline 27% 5044.68 0.35 5.26 0.30 7.65E-03 0.04 1.90E-02 476.00 2.58E-02 1.10E-02 1.94E-03 2.92E-02 1.66E-03 4.25E-05 2.18E-04 1.06E-04 2.65 1.44E-04 6.13E-05 2.67Diesel 3% 560.52 1.78 1.25 0.15 8.53E-03 0.07 5.06E-02 476.00 7.57E-02 2.81E-03 1.10E-03 7.72E-04 9.37E-05 5.27E-06 4.41E-05 3.12E-05 0.29 4.67E-05 1.74E-06 0.30
Total Emissions Per Project (tpy) 5.56E-03 7.17E-02 4.18E-03 1.29E-04 6.28E-04 3.02E-04 7.96 4.29E-04 1.36E-04 8.01
Gasoline 63% 1564.92 0.14 3.02 0.18 5.77E-03 0.03 1.17E-02 348.17 1.14E-02 5.58E-03 2.37E-04 5.20E-03 3.09E-04 9.95E-06 4.42E-05 2.01E-05 0.60 1.96E-05 9.63E-06 0.60Diesel 7% 173.88 0.51 1.75 0.07 4.74E-03 0.02 9.87E-03 348.17 6.33E-02 7.00E-04 9.71E-05 3.36E-04 1.33E-05 9.09E-07 4.49E-06 1.89E-06 0.07 1.21E-05 1.34E-07 0.07
Gasoline 27% 670.68 0.35 5.26 0.30 7.65E-03 0.04 1.90E-02 476.00 2.58E-02 1.10E-02 2.58E-04 3.89E-03 2.21E-04 5.66E-06 2.90E-05 1.41E-05 0.35 1.91E-05 8.15E-06 0.35Diesel 3% 74.52 1.78 1.25 0.15 8.53E-03 0.07 5.06E-02 476.00 7.57E-02 2.81E-03 1.47E-04 1.03E-04 1.25E-05 7.00E-07 5.87E-06 4.15E-06 0.04 6.21E-06 2.31E-07 0.04
Total Emissions Per Project (tpy) 7.39E-04 9.53E-03 5.55E-04 1.72E-05 8.35E-05 4.02E-05 1.06 5.70E-05 1.81E-05 1.07
Gasoline 63% 11022.48 0.14 3.02 0.18 5.77E-03 0.03 1.17E-02 348.17 1.14E-02 5.58E-03 1.67E-03 3.67E-02 2.17E-03 7.01E-05 3.11E-04 1.42E-04 4.23 1.38E-04 6.78E-05 4.25Diesel 7% 1224.72 0.51 1.75 0.07 4.74E-03 0.02 9.87E-03 348.17 6.33E-02 7.00E-04 6.84E-04 2.36E-03 9.35E-05 6.40E-06 3.16E-05 1.33E-05 0.47 8.55E-05 9.45E-07 0.47
Gasoline 27% 4723.92 0.35 5.26 0.30 7.65E-03 0.04 1.90E-02 476.00 2.58E-02 1.10E-02 1.82E-03 2.74E-02 1.56E-03 3.98E-05 2.04E-04 9.91E-05 2.48 1.34E-04 5.74E-05 2.50Diesel 3% 524.88 1.78 1.25 0.15 8.53E-03 0.07 5.06E-02 476.00 7.57E-02 2.81E-03 1.03E-03 7.23E-04 8.78E-05 4.93E-06 4.13E-05 2.92E-05 0.28 4.38E-05 1.62E-06 0.28
Total Emissions Per Project (tpy) 5.20E-03 6.71E-02 3.91E-03 1.21E-04 5.88E-04 2.83E-04 7.45 4.02E-04 1.28E-04 7.50
Gasoline 63% 782.46 0.14 3.02 0.18 5.77E-03 0.03 1.17E-02 348.17 1.14E-02 5.58E-03 1.19E-04 2.60E-03 1.54E-04 4.97E-06 2.21E-05 1.00E-05 0.30 9.79E-06 4.82E-06 0.30Diesel 7% 86.94 0.51 1.75 0.07 4.74E-03 0.02 9.87E-03 348.17 6.33E-02 7.00E-04 4.85E-05 1.68E-04 6.64E-06 4.54E-07 2.24E-06 9.46E-07 0.03 6.07E-06 6.71E-08 0.03
Gasoline 27% 335.34 0.35 5.26 0.30 7.65E-03 0.04 1.90E-02 476.00 2.58E-02 1.10E-02 1.29E-04 1.94E-03 1.10E-04 2.83E-06 1.45E-05 7.04E-06 0.18 9.54E-06 4.08E-06 0.18Diesel 3% 37.26 1.78 1.25 0.15 8.53E-03 0.07 5.06E-02 476.00 7.57E-02 2.81E-03 7.33E-05 5.13E-05 6.23E-06 3.50E-07 2.93E-06 2.08E-06 0.02 3.11E-06 1.15E-07 0.02
Total Emissions Per Project (tpy) 3.69E-04 4.76E-03 2.78E-04 8.61E-06 4.18E-05 2.01E-05 0.53 2.85E-05 9.07E-06 0.53
Gasoline 63% 14050.26 0.14 3.02 0.18 5.77E-03 0.03 1.17E-02 348.17 1.14E-02 5.58E-03 2.13E-03 4.67E-02 2.77E-03 8.93E-05 3.97E-04 1.80E-04 5.39 1.76E-04 8.65E-05 5.42Diesel 7% 1561.14 0.51 1.75 0.07 4.74E-03 0.02 9.87E-03 348.17 6.33E-02 7.00E-04 8.72E-04 3.01E-03 1.19E-04 8.16E-06 4.03E-05 1.70E-05 0.60 1.09E-04 1.20E-06 0.60
Gasoline 27% 6021.54 0.35 5.26 0.30 7.65E-03 0.04 1.90E-02 476.00 2.58E-02 1.10E-02 2.31E-03 3.49E-02 1.98E-03 5.08E-05 2.60E-04 1.26E-04 3.16 1.71E-04 7.32E-05 3.19Diesel 3% 669.06 1.78 1.25 0.15 8.53E-03 0.07 5.06E-02 476.00 7.57E-02 2.81E-03 1.32E-03 9.22E-04 1.12E-04 6.29E-06 5.27E-05 3.73E-05 0.35 5.58E-05 2.07E-06 0.35
Total Emissions Per Project (tpy) 6.63E-03 8.55E-02 4.99E-03 1.55E-04 7.50E-04 3.61E-04 9.50 5.12E-04 1.63E-04 9.56
Gasoline 63% 2653.56 0.14 3.02 0.18 5.77E-03 0.03 1.17E-02 348.17 1.14E-02 5.58E-03 4.02E-04 8.82E-03 5.23E-04 1.69E-05 7.49E-05 3.41E-05 1.02 3.32E-05 1.63E-05 1.02Diesel 7% 294.84 0.51 1.75 0.07 4.74E-03 0.02 9.87E-03 348.17 6.33E-02 7.00E-04 1.65E-04 5.69E-04 2.25E-05 1.54E-06 7.61E-06 3.21E-06 0.11 2.06E-05 2.28E-07 0.11
Gasoline 27% 1137.24 0.35 5.26 0.30 7.65E-03 0.04 1.90E-02 476.00 2.58E-02 1.10E-02 4.37E-04 6.59E-03 3.75E-04 9.59E-06 4.91E-05 2.39E-05 0.60 3.24E-05 1.38E-05 0.60Diesel 3% 126.36 1.78 1.25 0.15 8.53E-03 0.07 5.06E-02 476.00 7.57E-02 2.81E-03 2.49E-04 1.74E-04 2.11E-05 1.19E-06 9.95E-06 7.04E-06 0.07 1.05E-05 3.91E-07 0.07
Total Emissions Per Project (tpy) 1.25E-03 1.62E-02 9.41E-04 2.92E-05 1.42E-04 6.82E-05 1.79 9.67E-05 3.08E-05 1.81
Gasoline 63% 4728.78 0.14 3.02 0.18 5.77E-03 0.03 1.17E-02 348.17 1.14E-02 5.58E-03 7.17E-04 1.57E-02 9.32E-04 3.01E-05 1.34E-04 6.07E-05 1.81 5.92E-05 2.91E-05 1.83Diesel 7% 525.42 0.51 1.75 0.07 4.74E-03 0.02 9.87E-03 348.17 6.33E-02 7.00E-04 2.93E-04 1.01E-03 4.01E-05 2.75E-06 1.36E-05 5.71E-06 0.20 3.67E-05 4.05E-07 0.20
Gasoline 27% 2026.62 0.35 5.26 0.30 7.65E-03 0.04 1.90E-02 476.00 2.58E-02 1.10E-02 7.79E-04 1.17E-02 6.68E-04 1.71E-05 8.75E-05 4.25E-05 1.06 5.77E-05 2.46E-05 1.07Diesel 3% 225.18 1.78 1.25 0.15 8.53E-03 0.07 5.06E-02 476.00 7.57E-02 2.81E-03 4.43E-04 3.10E-04 3.76E-05 2.12E-06 1.77E-05 1.25E-05 0.12 1.88E-05 6.97E-07 0.12
Total Emissions Per Project (tpy) 2.23E-03 2.88E-02 1.68E-03 5.20E-05 2.52E-04 1.22E-04 3.20 1.72E-04 5.48E-05 3.22
Gasoline 63% 11770.92 0.14 3.02 0.18 5.77E-03 0.03 1.17E-02 348.17 1.14E-02 5.58E-03 1.78E-03 3.91E-02 2.32E-03 7.48E-05 3.32E-04 1.51E-04 4.52 1.47E-04 7.24E-05 4.54Diesel 7% 1307.88 0.51 1.75 0.07 4.74E-03 0.02 9.87E-03 348.17 6.33E-02 7.00E-04 7.30E-04 2.52E-03 9.99E-05 6.84E-06 3.38E-05 1.42E-05 0.50 9.13E-05 1.01E-06 0.50
Gasoline 27% 5044.68 0.35 5.26 0.30 7.65E-03 0.04 1.90E-02 476.00 2.58E-02 1.10E-02 1.94E-03 2.92E-02 1.66E-03 4.25E-05 2.18E-04 1.06E-04 2.65 1.44E-04 6.13E-05 2.67Diesel 3% 560.52 1.78 1.25 0.15 8.53E-03 0.07 5.06E-02 476.00 7.57E-02 2.81E-03 1.10E-03 7.72E-04 9.37E-05 5.27E-06 4.41E-05 3.12E-05 0.29 4.67E-05 1.74E-06 0.30
Total Emissions Per Project (tpy) 5.56E-03 7.17E-02 4.18E-03 1.29E-04 6.28E-04 3.02E-04 7.96 4.29E-04 1.36E-04 8.01
Gasoline 63% 4327.34 0.14 3.02 0.18 5.77E-03 0.03 1.17E-02 348.17 1.14E-02 5.58E-03 6.56E-04 1.44E-02 8.53E-04 2.75E-05 1.22E-04 5.56E-05 1.66 5.41E-05 2.66E-05 1.67Diesel 7% 480.82 0.51 1.75 0.07 4.74E-03 0.02 9.87E-03 348.17 6.33E-02 7.00E-04 2.68E-04 9.28E-04 3.67E-05 2.51E-06 1.24E-05 5.23E-06 0.18 3.36E-05 3.71E-07 0.19
Gasoline 27% 1854.58 0.35 5.26 0.30 7.65E-03 0.04 1.90E-02 476.00 2.58E-02 1.10E-02 7.13E-04 1.07E-02 6.11E-04 1.56E-05 8.01E-05 3.89E-05 0.97 5.28E-05 2.25E-05 0.98Diesel 3% 206.06 1.78 1.25 0.15 8.53E-03 0.07 5.06E-02 476.00 7.57E-02 2.81E-03 4.05E-04 2.84E-04 3.45E-05 1.94E-06 1.62E-05 1.15E-05 0.11 1.72E-05 6.38E-07 0.11
Total Emissions Per Project (tpy) 2.04E-03 2.63E-02 1.54E-03 4.76E-05 2.31E-04 1.11E-04 2.93 1.58E-04 5.02E-05 2.95
Gasoline 63% 5034.96 0.14 3.02 0.18 5.77E-03 0.03 1.17E-02 348.17 1.14E-02 5.58E-03 7.63E-04 1.67E-02 9.93E-04 3.20E-05 1.42E-04 6.47E-05 1.93 6.30E-05 3.10E-05 1.94Diesel 7% 559.44 0.51 1.75 0.07 4.74E-03 0.02 9.87E-03 348.17 6.33E-02 7.00E-04 3.12E-04 1.08E-03 4.27E-05 2.92E-06 1.44E-05 6.08E-06 0.21 3.91E-05 4.32E-07 0.22
Gasoline 27% 2157.84 0.35 5.26 0.30 7.65E-03 0.04 1.90E-02 476.00 2.58E-02 1.10E-02 8.29E-04 1.25E-02 7.11E-04 1.82E-05 9.32E-05 4.53E-05 1.13 6.14E-05 2.62E-05 1.14Diesel 3% 239.76 1.78 1.25 0.15 8.53E-03 0.07 5.06E-02 476.00 7.57E-02 2.81E-03 4.72E-04 3.30E-04 4.01E-05 2.25E-06 1.89E-05 1.34E-05 0.13 2.00E-05 7.42E-07 0.13
Total Emissions Per Project (tpy) 2.38E-03 3.07E-02 1.79E-03 5.54E-05 2.69E-04 1.29E-04 3.41 1.83E-04 5.84E-05 3.43
Gasoline 63% 952.56 0.14 3.02 0.18 5.77E-03 0.03 1.17E-02 348.17 1.14E-02 5.58E-03 1.44E-04 3.17E-03 1.88E-04 6.06E-06 2.69E-05 1.22E-05 0.37 1.19E-05 5.86E-06 0.37Diesel 7% 105.84 0.51 1.75 0.07 4.74E-03 0.02 9.87E-03 348.17 6.33E-02 7.00E-04 5.91E-05 2.04E-04 8.08E-06 5.53E-07 2.73E-06 1.15E-06 0.04 7.39E-06 8.17E-08 0.04
Gasoline 27% 408.24 0.35 5.26 0.30 7.65E-03 0.04 1.90E-02 476.00 2.58E-02 1.10E-02 1.57E-04 2.37E-03 1.35E-04 3.44E-06 1.76E-05 8.57E-06 0.21 1.16E-05 4.96E-06 0.22Diesel 3% 45.36 1.78 1.25 0.15 8.53E-03 0.07 5.06E-02 476.00 7.57E-02 2.81E-03 8.92E-05 6.25E-05 7.58E-06 4.26E-07 3.57E-06 2.53E-06 0.02 3.78E-06 1.40E-07 0.02
Total Emissions Per Project (tpy) 4.50E-04 5.80E-03 3.38E-04 1.05E-05 5.08E-05 2.45E-05 0.64 3.47E-05 1.10E-05 0.65
Table 23: 100,000 square foot PARKING LOT (BMCD ID: 22)
Table 24: 3 miles of electric upgrades (BMCD ID: 20)
Table 11: 1,125,000 sqft NEW Building (BMCD ID: 50)
Passenger Vehicles
Passenger Truck
Passenger Truck
Passenger Car
Emissions (tons)
Type Fuel PercentageaWorker VMT
(miles/project)
Emission Factor (g/mile)b
Passenger Truck
Passenger Car
Table 12: 2,700 to 22,000 Square foot REPLACEMENT Building (BMCD ID: 39, 41 through 46, 48, 7 total)
Table 13: 0.9 Acre PARKING LOT (BMCD ID: 11)
Table 14: Expand Roadway at Voelz Gate PARKING LOT (BMCD ID: 4)
Table 16: 750 square foot UPGRADED Building (BMCD ID: 17)
Passenger Car
Passenger Truck
Passenger Car
Passenger Car
Passenger Truck
Passenger Car
Passenger Truck
Passenger Car
Passenger Car
Passenger Truck
Passenger Car
Passenger Truck
Passenger Car
Passenger Truck
Passenger Car
Table 15:250 square foot New Building (BMCD ID: 16)
Table 19: 5878 square foot Upgraded Building (BMCD ID: 34 and 37)
Table 20: 12,000 square foot Upgraded Building (BMCD ID: 30 and 35)
Table 21: 35,000 square foot REPLACEMENT Building (BMCD ID: 47)
Table 22: 10 Acre New Security Post Parking lot (BMCD ID: 25a)
Table 17: 2050 square foot Upgraded Building (x 1004 BMCD ID: 38)
Table 18: 4400 square foot Upgraded Building (BMCD ID: 28)
Passenger Car
Passenger Truck
Passenger Car
Passenger Truck
Passenger Truck
Passenger Car
Passenger Truck
Passenger Truck

Letterkenny Ammunitions Center (LEMC)Estimated On-Road Tailpipe Emissions
NOx CO VOC SO2 PM10 PM2.5 CO2c CH4 N2O NOx CO VOC SO2 PM10 PM2.5 CO2 CH4 N2O CO2e
d
Gasoline 63% 1472589.72 0.14 3.02 0.18 5.77E-03 0.03 1.17E-02 348.17 1.14E-02 5.58E-03 2.23E-01 4.90 2.90E-01 9.36E-03 4.16E-02 1.89E-02 565.16 1.84E-02 9.06E-03 568.32Diesel 7% 163621.08 0.51 1.75 0.07 4.74E-03 0.02 9.87E-03 348.17 6.33E-02 7.00E-04 9.13E-02 3.16E-01 1.25E-02 8.55E-04 4.22E-03 1.78E-03 62.80 1.14E-02 1.26E-04 63.12
Gasoline 27% 631109.88 0.35 5.26 0.30 7.65E-03 0.04 1.90E-02 476.00 2.58E-02 1.10E-02 2.43E-01 3.66 2.08E-01 5.32E-03 2.73E-02 1.32E-02 331.14 1.80E-02 7.67E-03 333.88Diesel 3% 70123.32 1.78 1.25 0.15 8.53E-03 0.07 5.06E-02 476.00 7.57E-02 2.81E-03 1.38E-01 9.66E-02 1.17E-02 6.59E-04 5.52E-03 3.91E-03 36.79 5.85E-03 2.17E-04 37.00
Total Emissions Per Project (tpy) 6.95E-01 8.97 5.22E-01 1.62E-02 7.86E-02 3.78E-02 995.90 5.36E-02 1.71E-02 1002.33
Gasoline 63% 297402.84 0.14 3.02 0.18 5.77E-03 0.03 1.17E-02 348.17 1.14E-02 5.58E-03 4.51E-02 9.89E-01 5.86E-02 1.89E-03 8.40E-03 3.82E-03 114.14 3.72E-03 1.83E-03 114.78Diesel 7% 33044.76 0.51 1.75 0.07 4.74E-03 0.02 9.87E-03 348.17 6.33E-02 7.00E-04 1.84E-02 6.38E-02 2.52E-03 1.73E-04 8.53E-04 3.59E-04 12.68 2.31E-03 2.55E-05 12.75
Gasoline 27% 127458.36 0.35 5.26 0.30 7.65E-03 0.04 1.90E-02 476.00 2.58E-02 1.10E-02 4.90E-02 7.38E-01 4.20E-02 1.07E-03 5.51E-03 2.67E-03 66.88 3.63E-03 1.55E-03 67.43Diesel 3% 14162.04 1.78 1.25 0.15 8.53E-03 0.07 5.06E-02 476.00 7.57E-02 2.81E-03 2.79E-02 1.95E-02 2.37E-03 1.33E-04 1.11E-03 7.89E-04 7.43 1.18E-03 4.38E-05 7.47
Total Emissions Per Project (tpy) 1.40E-01 1.81 1.06E-01 3.27E-03 1.59E-02 7.64E-03 201.13 1.08E-02 3.45E-03 202.43
Gasoline 63% 142747.92 0.14 3.02 0.18 5.77E-03 0.03 1.17E-02 348.17 1.14E-02 5.58E-03 2.16E-02 4.75E-01 2.81E-02 9.07E-04 4.03E-03 1.83E-03 54.78 1.79E-03 8.79E-04 55.09Diesel 7% 15860.88 0.51 1.75 0.07 4.74E-03 0.02 9.87E-03 348.17 6.33E-02 7.00E-04 8.85E-03 3.06E-02 1.21E-03 8.29E-05 4.09E-04 1.73E-04 6.09 1.11E-03 1.22E-05 6.12
Gasoline 27% 61177.68 0.35 5.26 0.30 7.65E-03 0.04 1.90E-02 476.00 2.58E-02 1.10E-02 2.35E-02 3.54E-01 2.02E-02 5.16E-04 2.64E-03 1.28E-03 32.10 1.74E-03 7.43E-04 32.37Diesel 3% 6797.52 1.78 1.25 0.15 8.53E-03 0.07 5.06E-02 476.00 7.57E-02 2.81E-03 1.34E-02 9.36E-03 1.14E-03 6.39E-05 5.35E-04 3.79E-04 3.57 5.67E-04 2.10E-05 3.59
Total Emissions Per Project (tpy) 6.74E-02 8.69E-01 5.06E-02 1.57E-03 7.62E-03 3.67E-03 96.54 5.20E-03 1.66E-03 97.16
Gasoline 63% 36945.72 0.14 3.02 0.18 5.77E-03 0.03 1.17E-02 348.17 1.14E-02 5.58E-03 5.60E-03 1.23E-01 7.28E-03 2.35E-04 1.04E-03 4.74E-04 14.18 4.62E-04 2.27E-04 14.26Diesel 7% 4105.08 0.51 1.75 0.07 4.74E-03 0.02 9.87E-03 348.17 6.33E-02 7.00E-04 2.29E-03 7.92E-03 3.13E-04 2.15E-05 1.06E-04 4.46E-05 1.58 2.87E-04 3.17E-06 1.58
Gasoline 27% 15833.88 0.35 5.26 0.30 7.65E-03 0.04 1.90E-02 476.00 2.58E-02 1.10E-02 6.09E-03 9.17E-02 5.22E-03 1.34E-04 6.84E-04 3.32E-04 8.31 4.50E-04 1.92E-04 8.38Diesel 3% 1759.32 1.78 1.25 0.15 8.53E-03 0.07 5.06E-02 476.00 7.57E-02 2.81E-03 3.46E-03 2.42E-03 2.94E-04 1.65E-05 1.38E-04 9.80E-05 0.92 1.47E-04 5.45E-06 0.93
Total Emissions Per Project (tpy) 1.74E-02 2.25E-01 1.31E-02 4.06E-04 1.97E-03 9.49E-04 24.99 1.35E-03 4.28E-04 25.15
Gasoline 63% 43545.60 0.14 3.02 0.18 5.77E-03 0.03 1.17E-02 348.17 1.14E-02 5.58E-03 6.60E-03 1.45E-01 8.58E-03 2.77E-04 1.23E-03 5.59E-04 16.71 5.45E-04 2.68E-04 16.81Diesel 7% 4838.40 0.51 1.75 0.07 4.74E-03 0.02 9.87E-03 348.17 6.33E-02 7.00E-04 2.70E-03 9.34E-03 3.69E-04 2.53E-05 1.25E-04 5.26E-05 1.86 3.38E-04 3.73E-06 1.87
Gasoline 27% 18662.40 0.35 5.26 0.30 7.65E-03 0.04 1.90E-02 476.00 2.58E-02 1.10E-02 7.17E-03 1.08E-01 6.15E-03 1.57E-04 8.06E-04 3.92E-04 9.79 5.31E-04 2.27E-04 9.87Diesel 3% 2073.60 1.78 1.25 0.15 8.53E-03 0.07 5.06E-02 476.00 7.57E-02 2.81E-03 4.08E-03 2.86E-03 3.47E-04 1.95E-05 1.63E-04 1.16E-04 1.09 1.73E-04 6.42E-06 1.09
Total Emissions Per Project (tpy) 2.06E-02 2.65E-01 1.55E-02 4.79E-04 2.32E-03 1.12E-03 29.45 1.59E-03 5.05E-04 29.64
Gasoline 63% 3504.06 0.14 3.02 0.18 5.77E-03 0.03 1.17E-02 348.17 1.14E-02 5.58E-03 5.31E-04 1.17E-02 6.91E-04 2.23E-05 9.89E-05 4.50E-05 1.34 4.38E-05 2.16E-05 1.35Diesel 7% 389.34 0.51 1.75 0.07 4.74E-03 0.02 9.87E-03 348.17 6.33E-02 7.00E-04 2.17E-04 7.51E-04 2.97E-05 2.04E-06 1.00E-05 4.23E-06 0.15 2.72E-05 3.00E-07 0.15
Gasoline 27% 1501.74 0.35 5.26 0.30 7.65E-03 0.04 1.90E-02 476.00 2.58E-02 1.10E-02 5.77E-04 8.70E-03 4.95E-04 1.27E-05 6.49E-05 3.15E-05 0.79 4.27E-05 1.83E-05 0.79Diesel 3% 166.86 1.78 1.25 0.15 8.53E-03 0.07 5.06E-02 476.00 7.57E-02 2.81E-03 3.28E-04 2.30E-04 2.79E-05 1.57E-06 1.31E-05 9.30E-06 0.09 1.39E-05 5.17E-07 0.09
Total Emissions Per Project (tpy) 1.65E-03 2.13E-02 1.24E-03 3.85E-05 1.87E-04 9.00E-05 2.37 1.28E-04 4.06E-05 2.39
Gasoline 63% 1039787.28 0.14 3.02 0.18 5.77E-03 0.03 1.17E-02 348.17 1.14E-02 5.58E-03 1.58E-01 3.46 2.05E-01 6.61E-03 2.94E-02 1.34E-02 399.06 1.30E-02 6.40E-03 401.29Diesel 7% 115531.92 0.51 1.75 0.07 4.74E-03 0.02 9.87E-03 348.17 6.33E-02 7.00E-04 6.45E-02 2.23E-01 8.82E-03 6.04E-04 2.98E-03 1.26E-03 44.34 8.07E-03 8.91E-05 44.57
Gasoline 27% 445623.12 0.35 5.26 0.30 7.65E-03 0.04 1.90E-02 476.00 2.58E-02 1.10E-02 1.71E-01 2.58 1.47E-01 3.76E-03 1.92E-02 9.35E-03 233.82 1.27E-02 5.42E-03 235.75Diesel 3% 49513.68 1.78 1.25 0.15 8.53E-03 0.07 5.06E-02 476.00 7.57E-02 2.81E-03 9.74E-02 6.82E-02 8.28E-03 4.65E-04 3.90E-03 2.76E-03 25.98 4.13E-03 1.53E-04 26.13
(a) Vehicle breakdown based on U.S. fleet trends in US EPA Report "Light-Duty Automotive Technology, Carbon Dioxide Emissions, and Fuel Economy Trends: 1975 through 2014"Percent passenger cars 70%
Percent passenger trucks 30%Percent gasoline vehicles 90%
Percent diesel vehicles 10%(b) Emission factors from MOVES2010b, average of vehicle years 1990-2020. PM10 and PM2.5 emissions include exhaust emissions plus tire and brake wear emissions.
(c) CO2 emission factors from the US EPA Report "Light-Duty Automotive Technology, Carbon Dioxide Emissions, and Fuel Economy Trends: 1975 through 2014"(d) Global Warming Potentials Table A-1 to Subpart A of 40 CFR Part 98
CO2 1CH4 25N2O 298
Table 28: Repair 11 miles of asphalt ROADS (BMCD ID: 23)
Passenger Car
Passenger Truck
Passenger Car
Table 31: Upgrade Utility Infrastructure Overall (BMcD ID 9)
Table 25: 22 miles of RAIL network (BMCD ID: 3)
Passenger Vehicles
Table 26: 10 acre RAIL classification yard (BMCD ID: 6)
Table 27: Restoration of 4 miles of RAIL (BMCD ID: 18)
Type Fuel PercentageaWorker VMT
(miles/project)
Emission Factor (g/mile)b Emissions (tons)
Passenger Car
Passenger Truck
Passenger Truck
Passenger Truck
Passenger Car
Passenger Truck
Passenger Car
Passenger Truck
Passenger Truck
Passenger Car
Passenger Car
Table 29: Repair 1560000 sqft of asphalt ROADS (BMCD ID: 32)
Table 30: New Security Post Buildings (x2) (BMCD ID: 25b)
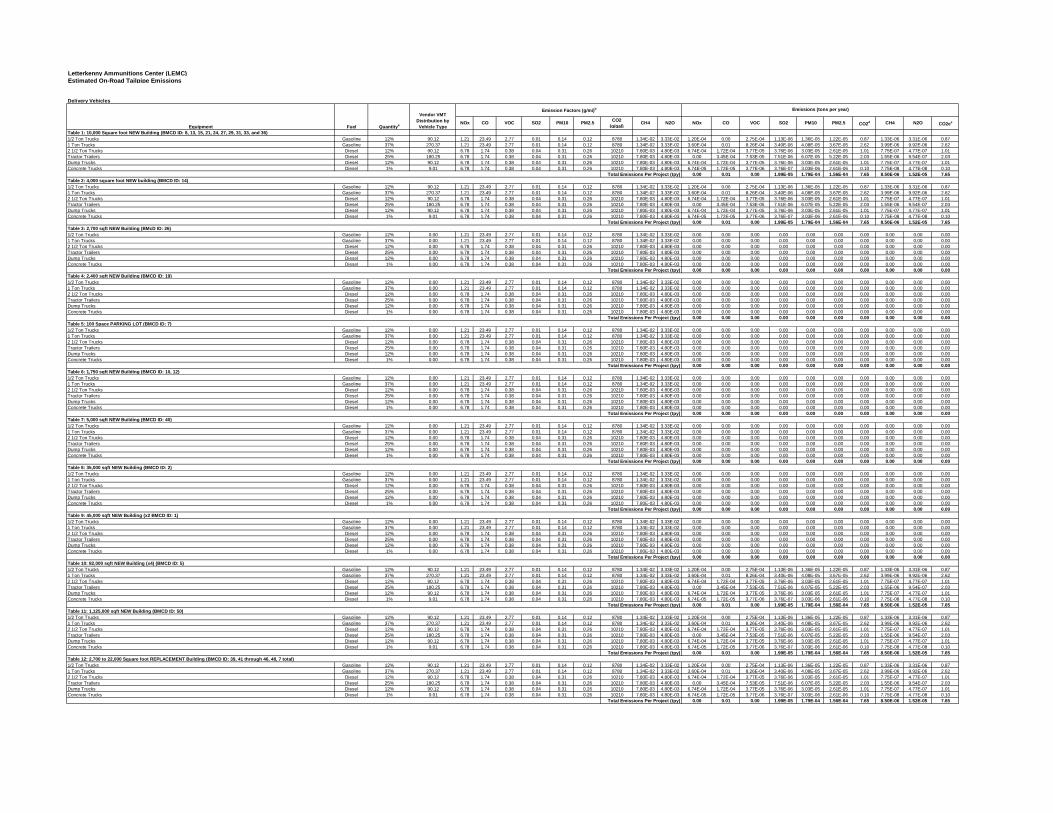
Letterkenny Ammunitions Center (LEMC)Estimated On-Road Tailpipe Emissions
NOx CO VOC SO2 PM10 PM2.5CO2
(g/gal)CH4 N2O NOx CO VOC SO2 PM10 PM2.5 CO2d CH4 N2O CO2ee
Table 1: 10,000 Square foot NEW Building (BMCD ID: 8, 13, 15, 21, 24, 27, 29, 31, 33, and 36)1/2 Ton Trucks Gasoline 12% 90.12 1.21 23.49 2.77 0.01 0.14 0.12 8780 1.34E-02 3.33E-02 1.20E-04 0.00 2.75E-04 1.13E-06 1.36E-05 1.22E-05 0.87 1.33E-06 3.31E-06 0.871 Ton Trucks Gasoline 37% 270.37 1.21 23.49 2.77 0.01 0.14 0.12 8780 1.34E-02 3.33E-02 3.60E-04 0.01 8.26E-04 3.40E-06 4.08E-05 3.67E-05 2.62 3.99E-06 9.92E-06 2.622 1/2 Ton Trucks Diesel 12% 90.12 6.78 1.74 0.38 0.04 0.31 0.26 10210 7.80E-03 4.80E-03 6.74E-04 1.72E-04 3.77E-05 3.76E-06 3.03E-05 2.61E-05 1.01 7.75E-07 4.77E-07 1.01Tractor Trailers Diesel 25% 180.25 6.78 1.74 0.38 0.04 0.31 0.26 10210 7.80E-03 4.80E-03 0.00 3.45E-04 7.53E-05 7.51E-06 6.07E-05 5.22E-05 2.03 1.55E-06 9.54E-07 2.03Dump Trucks Diesel 12% 90.12 6.78 1.74 0.38 0.04 0.31 0.26 10210 7.80E-03 4.80E-03 6.74E-04 1.72E-04 3.77E-05 3.76E-06 3.03E-05 2.61E-05 1.01 7.75E-07 4.77E-07 1.01Concrete Trucks Diesel 1% 9.01 6.78 1.74 0.38 0.04 0.31 0.26 10210 7.80E-03 4.80E-03 6.74E-05 1.72E-05 3.77E-06 3.76E-07 3.03E-06 2.61E-06 0.10 7.75E-08 4.77E-08 0.10
Total Emissions Per Project (tpy) 0.00 0.01 0.00 1.99E-05 1.79E-04 1.56E-04 7.65 8.50E-06 1.52E-05 7.65
1/2 Ton Trucks Gasoline 12% 90.12 1.21 23.49 2.77 0.01 0.14 0.12 8780 1.34E-02 3.33E-02 1.20E-04 0.00 2.75E-04 1.13E-06 1.36E-05 1.22E-05 0.87 1.33E-06 3.31E-06 0.871 Ton Trucks Gasoline 37% 270.37 1.21 23.49 2.77 0.01 0.14 0.12 8780 1.34E-02 3.33E-02 3.60E-04 0.01 8.26E-04 3.40E-06 4.08E-05 3.67E-05 2.62 3.99E-06 9.92E-06 2.622 1/2 Ton Trucks Diesel 12% 90.12 6.78 1.74 0.38 0.04 0.31 0.26 10210 7.80E-03 4.80E-03 6.74E-04 1.72E-04 3.77E-05 3.76E-06 3.03E-05 2.61E-05 1.01 7.75E-07 4.77E-07 1.01Tractor Trailers Diesel 25% 180.25 6.78 1.74 0.38 0.04 0.31 0.26 10210 7.80E-03 4.80E-03 0.00 3.45E-04 7.53E-05 7.51E-06 6.07E-05 5.22E-05 2.03 1.55E-06 9.54E-07 2.03Dump Trucks Diesel 12% 90.12 6.78 1.74 0.38 0.04 0.31 0.26 10210 7.80E-03 4.80E-03 6.74E-04 1.72E-04 3.77E-05 3.76E-06 3.03E-05 2.61E-05 1.01 7.75E-07 4.77E-07 1.01Concrete Trucks Diesel 1% 9.01 6.78 1.74 0.38 0.04 0.31 0.26 10210 7.80E-03 4.80E-03 6.74E-05 1.72E-05 3.77E-06 3.76E-07 3.03E-06 2.61E-06 0.10 7.75E-08 4.77E-08 0.10
Total Emissions Per Project (tpy) 0.00 0.01 0.00 1.99E-05 1.79E-04 1.56E-04 7.65 8.50E-06 1.52E-05 7.65
1/2 Ton Trucks Gasoline 12% 0.00 1.21 23.49 2.77 0.01 0.14 0.12 8780 1.34E-02 3.33E-02 0.00 0.00 0.00 0.00 0.00 0.00 0.00 0.00 0.00 0.001 Ton Trucks Gasoline 37% 0.00 1.21 23.49 2.77 0.01 0.14 0.12 8780 1.34E-02 3.33E-02 0.00 0.00 0.00 0.00 0.00 0.00 0.00 0.00 0.00 0.002 1/2 Ton Trucks Diesel 12% 0.00 6.78 1.74 0.38 0.04 0.31 0.26 10210 7.80E-03 4.80E-03 0.00 0.00 0.00 0.00 0.00 0.00 0.00 0.00 0.00 0.00Tractor Trailers Diesel 25% 0.00 6.78 1.74 0.38 0.04 0.31 0.26 10210 7.80E-03 4.80E-03 0.00 0.00 0.00 0.00 0.00 0.00 0.00 0.00 0.00 0.00Dump Trucks Diesel 12% 0.00 6.78 1.74 0.38 0.04 0.31 0.26 10210 7.80E-03 4.80E-03 0.00 0.00 0.00 0.00 0.00 0.00 0.00 0.00 0.00 0.00Concrete Trucks Diesel 1% 0.00 6.78 1.74 0.38 0.04 0.31 0.26 10210 7.80E-03 4.80E-03 0.00 0.00 0.00 0.00 0.00 0.00 0.00 0.00 0.00 0.00
Total Emissions Per Project (tpy) 0.00 0.00 0.00 0.00 0.00 0.00 0.00 0.00 0.00 0.00
1/2 Ton Trucks Gasoline 12% 90.12 1.21 23.49 2.77 0.01 0.14 0.12 8780 1.34E-02 3.33E-02 1.20E-04 0.00 2.75E-04 1.13E-06 1.36E-05 1.22E-05 0.87 1.33E-06 3.31E-06 0.871 Ton Trucks Gasoline 37% 270.37 1.21 23.49 2.77 0.01 0.14 0.12 8780 1.34E-02 3.33E-02 3.60E-04 0.01 8.26E-04 3.40E-06 4.08E-05 3.67E-05 2.62 3.99E-06 9.92E-06 2.622 1/2 Ton Trucks Diesel 12% 90.12 6.78 1.74 0.38 0.04 0.31 0.26 10210 7.80E-03 4.80E-03 6.74E-04 1.72E-04 3.77E-05 3.76E-06 3.03E-05 2.61E-05 1.01 7.75E-07 4.77E-07 1.01Tractor Trailers Diesel 25% 180.25 6.78 1.74 0.38 0.04 0.31 0.26 10210 7.80E-03 4.80E-03 0.00 3.45E-04 7.53E-05 7.51E-06 6.07E-05 5.22E-05 2.03 1.55E-06 9.54E-07 2.03Dump Trucks Diesel 12% 90.12 6.78 1.74 0.38 0.04 0.31 0.26 10210 7.80E-03 4.80E-03 6.74E-04 1.72E-04 3.77E-05 3.76E-06 3.03E-05 2.61E-05 1.01 7.75E-07 4.77E-07 1.01Concrete Trucks Diesel 1% 9.01 6.78 1.74 0.38 0.04 0.31 0.26 10210 7.80E-03 4.80E-03 6.74E-05 1.72E-05 3.77E-06 3.76E-07 3.03E-06 2.61E-06 0.10 7.75E-08 4.77E-08 0.10
Total Emissions Per Project (tpy) 0.00 0.01 0.00 1.99E-05 1.79E-04 1.56E-04 7.65 8.50E-06 1.52E-05 7.65
Table 12: 2,700 to 22,000 Square foot REPLACEMENT Building (BMCD ID: 39, 41 through 46, 48, 7 total)
Table 7: 5,000 sqft NEW Building (BMCD ID: 40)
Table 8: 35,000 sqft NEW Building (BMCD ID: 2)
Table 9: 45,000 sqft NEW Building (x2 BMCD ID: 1)
Table 10: 82,000 sqft NEW Building (x4) (BMCD ID: 5)
Table 11: 1,125,000 sqft NEW Building (BMCD ID: 50)
Table 3: 2,700 sqft NEW Building (BMcD ID: 26)
Table 4: 2,400 sqft NEW Building (BMCD ID: 19)
Table 5: 100 Space PARKING LOT (BMCD ID: 7)
Delivery Vehicles
Table 6: 1,750 sqft NEW Building (BMCD ID: 10, 12)
Table 2: 4,000 square foot NEW building (BMCD ID: 14)
Emissions (tons per year)Emission Factors (g/mi)b
Equipment Fuel Quantitya
Vendor VMT Distribution by Vehicle Type
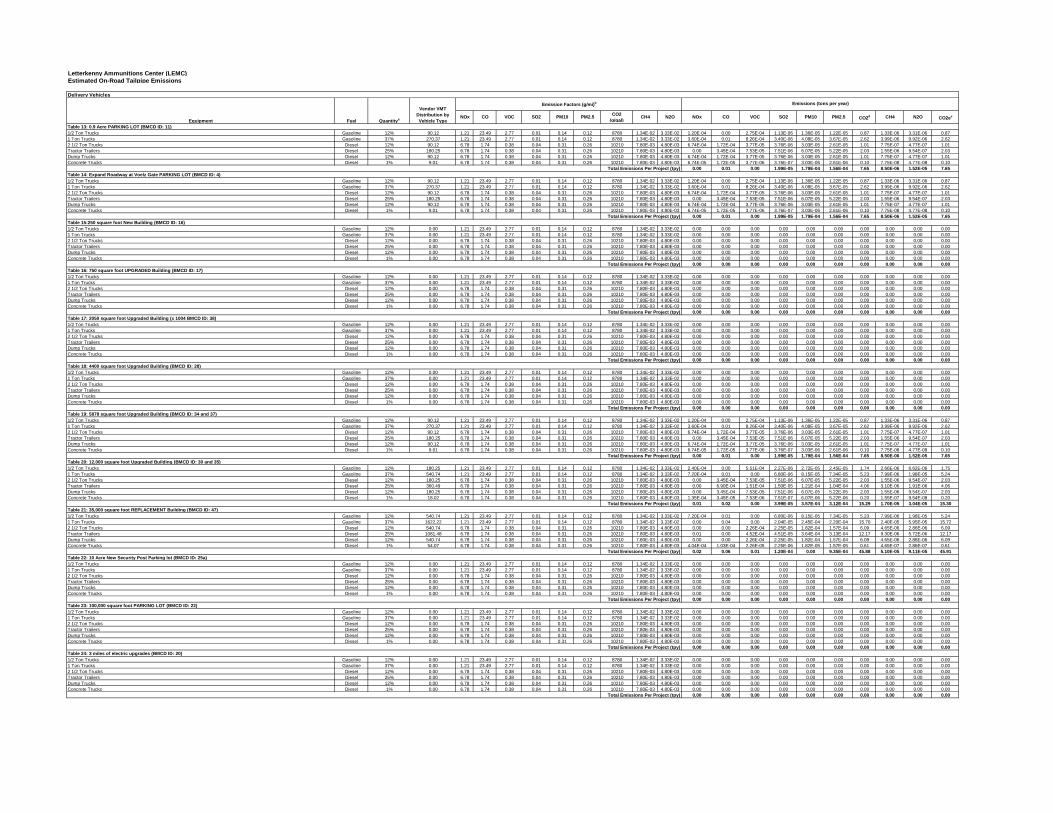
Letterkenny Ammunitions Center (LEMC)Estimated On-Road Tailpipe Emissions
NOx CO VOC SO2 PM10 PM2.5CO2
(g/gal)CH4 N2O NOx CO VOC SO2 PM10 PM2.5 CO2d CH4 N2O CO2ee
1/2 Ton Trucks Gasoline 12% 90.12 1.21 23.49 2.77 0.01 0.14 0.12 8780 1.34E-02 3.33E-02 1.20E-04 0.00 2.75E-04 1.13E-06 1.36E-05 1.22E-05 0.87 1.33E-06 3.31E-06 0.871 Ton Trucks Gasoline 37% 270.37 1.21 23.49 2.77 0.01 0.14 0.12 8780 1.34E-02 3.33E-02 3.60E-04 0.01 8.26E-04 3.40E-06 4.08E-05 3.67E-05 2.62 3.99E-06 9.92E-06 2.622 1/2 Ton Trucks Diesel 12% 90.12 6.78 1.74 0.38 0.04 0.31 0.26 10210 7.80E-03 4.80E-03 6.74E-04 1.72E-04 3.77E-05 3.76E-06 3.03E-05 2.61E-05 1.01 7.75E-07 4.77E-07 1.01Tractor Trailers Diesel 25% 180.25 6.78 1.74 0.38 0.04 0.31 0.26 10210 7.80E-03 4.80E-03 0.00 3.45E-04 7.53E-05 7.51E-06 6.07E-05 5.22E-05 2.03 1.55E-06 9.54E-07 2.03Dump Trucks Diesel 12% 90.12 6.78 1.74 0.38 0.04 0.31 0.26 10210 7.80E-03 4.80E-03 6.74E-04 1.72E-04 3.77E-05 3.76E-06 3.03E-05 2.61E-05 1.01 7.75E-07 4.77E-07 1.01Concrete Trucks Diesel 1% 9.01 6.78 1.74 0.38 0.04 0.31 0.26 10210 7.80E-03 4.80E-03 6.74E-05 1.72E-05 3.77E-06 3.76E-07 3.03E-06 2.61E-06 0.10 7.75E-08 4.77E-08 0.10
Total Emissions Per Project (tpy) 0.00 0.01 0.00 1.99E-05 1.79E-04 1.56E-04 7.65 8.50E-06 1.52E-05 7.65
1/2 Ton Trucks Gasoline 12% 0.00 1.21 23.49 2.77 0.01 0.14 0.12 8780 1.34E-02 3.33E-02 0.00 0.00 0.00 0.00 0.00 0.00 0.00 0.00 0.00 0.001 Ton Trucks Gasoline 37% 0.00 1.21 23.49 2.77 0.01 0.14 0.12 8780 1.34E-02 3.33E-02 0.00 0.00 0.00 0.00 0.00 0.00 0.00 0.00 0.00 0.002 1/2 Ton Trucks Diesel 12% 0.00 6.78 1.74 0.38 0.04 0.31 0.26 10210 7.80E-03 4.80E-03 0.00 0.00 0.00 0.00 0.00 0.00 0.00 0.00 0.00 0.00Tractor Trailers Diesel 25% 0.00 6.78 1.74 0.38 0.04 0.31 0.26 10210 7.80E-03 4.80E-03 0.00 0.00 0.00 0.00 0.00 0.00 0.00 0.00 0.00 0.00Dump Trucks Diesel 12% 0.00 6.78 1.74 0.38 0.04 0.31 0.26 10210 7.80E-03 4.80E-03 0.00 0.00 0.00 0.00 0.00 0.00 0.00 0.00 0.00 0.00Concrete Trucks Diesel 1% 0.00 6.78 1.74 0.38 0.04 0.31 0.26 10210 7.80E-03 4.80E-03 0.00 0.00 0.00 0.00 0.00 0.00 0.00 0.00 0.00 0.00
Total Emissions Per Project (tpy) 0.00 0.00 0.00 0.00 0.00 0.00 0.00 0.00 0.00 0.00
1/2 Ton Trucks Gasoline 12% 90.12 1.21 23.49 2.77 0.01 0.14 0.12 8780 1.34E-02 3.33E-02 1.20E-04 0.00 2.75E-04 1.13E-06 1.36E-05 1.22E-05 0.87 1.33E-06 3.31E-06 0.871 Ton Trucks Gasoline 37% 270.37 1.21 23.49 2.77 0.01 0.14 0.12 8780 1.34E-02 3.33E-02 3.60E-04 0.01 8.26E-04 3.40E-06 4.08E-05 3.67E-05 2.62 3.99E-06 9.92E-06 2.622 1/2 Ton Trucks Diesel 12% 90.12 6.78 1.74 0.38 0.04 0.31 0.26 10210 7.80E-03 4.80E-03 6.74E-04 1.72E-04 3.77E-05 3.76E-06 3.03E-05 2.61E-05 1.01 7.75E-07 4.77E-07 1.01Tractor Trailers Diesel 25% 180.25 6.78 1.74 0.38 0.04 0.31 0.26 10210 7.80E-03 4.80E-03 0.00 3.45E-04 7.53E-05 7.51E-06 6.07E-05 5.22E-05 2.03 1.55E-06 9.54E-07 2.03Dump Trucks Diesel 12% 90.12 6.78 1.74 0.38 0.04 0.31 0.26 10210 7.80E-03 4.80E-03 6.74E-04 1.72E-04 3.77E-05 3.76E-06 3.03E-05 2.61E-05 1.01 7.75E-07 4.77E-07 1.01Concrete Trucks Diesel 1% 9.01 6.78 1.74 0.38 0.04 0.31 0.26 10210 7.80E-03 4.80E-03 6.74E-05 1.72E-05 3.77E-06 3.76E-07 3.03E-06 2.61E-06 0.10 7.75E-08 4.77E-08 0.10
Total Emissions Per Project (tpy) 0.00 0.01 0.00 1.99E-05 1.79E-04 1.56E-04 7.65 8.50E-06 1.52E-05 7.65
1/2 Ton Trucks Gasoline 12% 180.25 1.21 23.49 2.77 0.01 0.14 0.12 8780 1.34E-02 3.33E-02 2.40E-04 0.00 5.51E-04 2.27E-06 2.72E-05 2.45E-05 1.74 2.66E-06 6.62E-06 1.751 Ton Trucks Gasoline 37% 540.74 1.21 23.49 2.77 0.01 0.14 0.12 8780 1.34E-02 3.33E-02 7.20E-04 0.01 0.00 6.80E-06 8.15E-05 7.34E-05 5.23 7.99E-06 1.98E-05 5.242 1/2 Ton Trucks Diesel 12% 180.25 6.78 1.74 0.38 0.04 0.31 0.26 10210 7.80E-03 4.80E-03 0.00 3.45E-04 7.53E-05 7.51E-06 6.07E-05 5.22E-05 2.03 1.55E-06 9.54E-07 2.03Tractor Trailers Diesel 25% 360.49 6.78 1.74 0.38 0.04 0.31 0.26 10210 7.80E-03 4.80E-03 0.00 6.90E-04 1.51E-04 1.50E-05 1.21E-04 1.04E-04 4.06 3.10E-06 1.91E-06 4.06Dump Trucks Diesel 12% 180.25 6.78 1.74 0.38 0.04 0.31 0.26 10210 7.80E-03 4.80E-03 0.00 3.45E-04 7.53E-05 7.51E-06 6.07E-05 5.22E-05 2.03 1.55E-06 9.54E-07 2.03Concrete Trucks Diesel 1% 18.02 6.78 1.74 0.38 0.04 0.31 0.26 10210 7.80E-03 4.80E-03 1.35E-04 3.45E-05 7.53E-06 7.51E-07 6.07E-06 5.22E-06 0.20 1.55E-07 9.54E-08 0.20
Total Emissions Per Project (tpy) 0.01 0.02 0.00 3.99E-05 3.57E-04 3.12E-04 15.29 1.70E-05 3.04E-05 15.30
1/2 Ton Trucks Gasoline 12% 540.74 1.21 23.49 2.77 0.01 0.14 0.12 8780 1.34E-02 3.33E-02 7.20E-04 0.01 0.00 6.80E-06 8.15E-05 7.34E-05 5.23 7.99E-06 1.98E-05 5.241 Ton Trucks Gasoline 37% 1622.22 1.21 23.49 2.77 0.01 0.14 0.12 8780 1.34E-02 3.33E-02 0.00 0.04 0.00 2.04E-05 2.45E-04 2.20E-04 15.70 2.40E-05 5.95E-05 15.722 1/2 Ton Trucks Diesel 12% 540.74 6.78 1.74 0.38 0.04 0.31 0.26 10210 7.80E-03 4.80E-03 0.00 0.00 2.26E-04 2.25E-05 1.82E-04 1.57E-04 6.09 4.65E-06 2.86E-06 6.09Tractor Trailers Diesel 25% 1081.48 6.78 1.74 0.38 0.04 0.31 0.26 10210 7.80E-03 4.80E-03 0.01 0.00 4.52E-04 4.51E-05 3.64E-04 3.13E-04 12.17 9.30E-06 5.72E-06 12.17Dump Trucks Diesel 12% 540.74 6.78 1.74 0.38 0.04 0.31 0.26 10210 7.80E-03 4.80E-03 0.00 0.00 2.26E-04 2.25E-05 1.82E-04 1.57E-04 6.09 4.65E-06 2.86E-06 6.09Concrete Trucks Diesel 1% 54.07 6.78 1.74 0.38 0.04 0.31 0.26 10210 7.80E-03 4.80E-03 4.04E-04 1.03E-04 2.26E-05 2.25E-06 1.82E-05 1.57E-05 0.61 4.65E-07 2.86E-07 0.61
Total Emissions Per Project (tpy) 0.02 0.06 0.01 1.20E-04 0.00 9.35E-04 45.88 5.10E-05 9.11E-05 45.91
1/2 Ton Trucks Gasoline 12% 0.00 1.21 23.49 2.77 0.01 0.14 0.12 8780 1.34E-02 3.33E-02 0.00 0.00 0.00 0.00 0.00 0.00 0.00 0.00 0.00 0.001 Ton Trucks Gasoline 37% 0.00 1.21 23.49 2.77 0.01 0.14 0.12 8780 1.34E-02 3.33E-02 0.00 0.00 0.00 0.00 0.00 0.00 0.00 0.00 0.00 0.002 1/2 Ton Trucks Diesel 12% 0.00 6.78 1.74 0.38 0.04 0.31 0.26 10210 7.80E-03 4.80E-03 0.00 0.00 0.00 0.00 0.00 0.00 0.00 0.00 0.00 0.00Tractor Trailers Diesel 25% 0.00 6.78 1.74 0.38 0.04 0.31 0.26 10210 7.80E-03 4.80E-03 0.00 0.00 0.00 0.00 0.00 0.00 0.00 0.00 0.00 0.00Dump Trucks Diesel 12% 0.00 6.78 1.74 0.38 0.04 0.31 0.26 10210 7.80E-03 4.80E-03 0.00 0.00 0.00 0.00 0.00 0.00 0.00 0.00 0.00 0.00Concrete Trucks Diesel 1% 0.00 6.78 1.74 0.38 0.04 0.31 0.26 10210 7.80E-03 4.80E-03 0.00 0.00 0.00 0.00 0.00 0.00 0.00 0.00 0.00 0.00
Total Emissions Per Project (tpy) 0.00 0.00 0.00 0.00 0.00 0.00 0.00 0.00 0.00 0.00
Table 22: 10 Acre New Security Post Parking lot (BMCD ID: 25a)
Table 23: 100,000 square foot PARKING LOT (BMCD ID: 22)
Table 24: 3 miles of electric upgrades (BMCD ID: 20)
Table 13: 0.9 Acre PARKING LOT (BMCD ID: 11)
Table 14: Expand Roadway at Voelz Gate PARKING LOT (BMCD ID: 4)
Table 15:250 square foot New Building (BMCD ID: 16)
Emissions (tons per year)
Equipment Fuel Quantitya
Vendor VMT Distribution by Vehicle Type
Emission Factors (g/mi)b
Delivery Vehicles
Table 16: 750 square foot UPGRADED Building (BMCD ID: 17)
Table 17: 2050 square foot Upgraded Building (x 1004 BMCD ID: 38)
Table 18: 4400 square foot Upgraded Building (BMCD ID: 28)
Table 19: 5878 square foot Upgraded Building (BMCD ID: 34 and 37)
Table 20: 12,000 square foot Upgraded Building (BMCD ID: 30 and 35)
Table 21: 35,000 square foot REPLACEMENT Building (BMCD ID: 47)
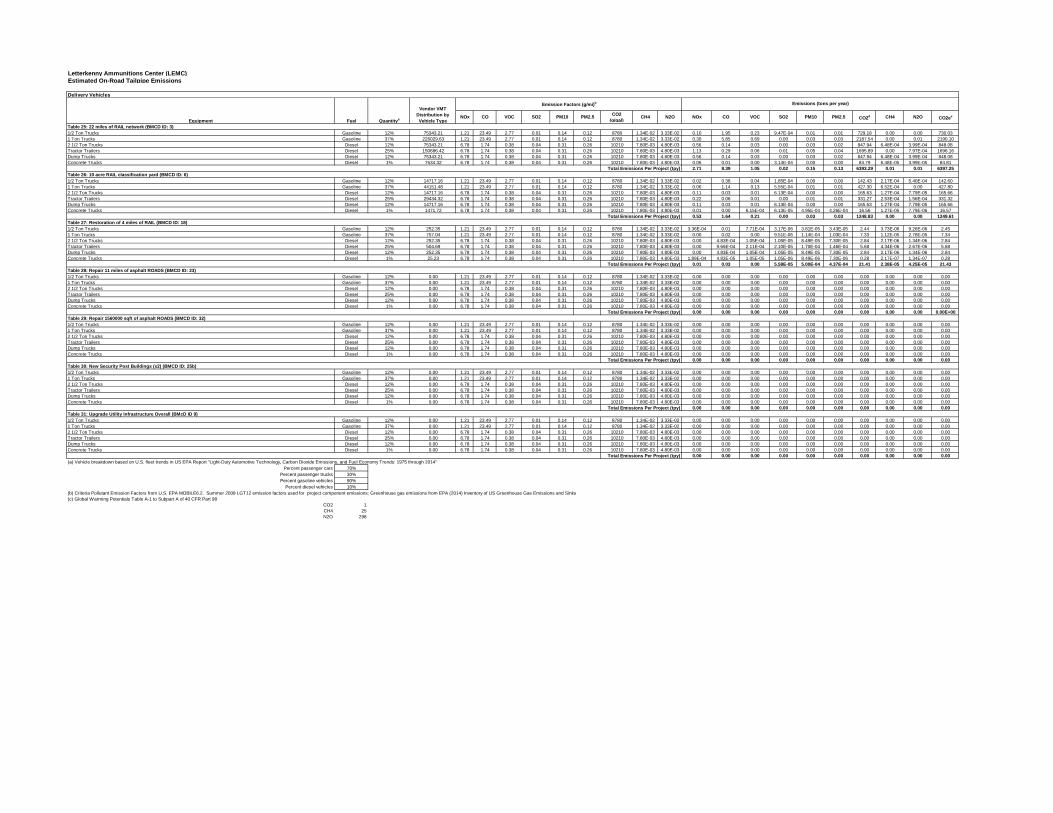
Letterkenny Ammunitions Center (LEMC)Estimated On-Road Tailpipe Emissions
NOx CO VOC SO2 PM10 PM2.5CO2
(g/gal)CH4 N2O NOx CO VOC SO2 PM10 PM2.5 CO2d CH4 N2O CO2ee
1/2 Ton Trucks Gasoline 12% 75343.21 1.21 23.49 2.77 0.01 0.14 0.12 8780 1.34E-02 3.33E-02 0.10 1.95 0.23 9.47E-04 0.01 0.01 729.18 0.00 0.00 730.031 Ton Trucks Gasoline 37% 226029.63 1.21 23.49 2.77 0.01 0.14 0.12 8780 1.34E-02 3.33E-02 0.30 5.85 0.69 0.00 0.03 0.03 2187.54 0.00 0.01 2190.102 1/2 Ton Trucks Diesel 12% 75343.21 6.78 1.74 0.38 0.04 0.31 0.26 10210 7.80E-03 4.80E-03 0.56 0.14 0.03 0.00 0.03 0.02 847.94 6.48E-04 3.99E-04 848.08Tractor Trailers Diesel 25% 150686.42 6.78 1.74 0.38 0.04 0.31 0.26 10210 7.80E-03 4.80E-03 1.13 0.29 0.06 0.01 0.05 0.04 1695.89 0.00 7.97E-04 1696.16Dump Trucks Diesel 12% 75343.21 6.78 1.74 0.38 0.04 0.31 0.26 10210 7.80E-03 4.80E-03 0.56 0.14 0.03 0.00 0.03 0.02 847.94 6.48E-04 3.99E-04 848.08Concrete Trucks Diesel 1% 7534.32 6.78 1.74 0.38 0.04 0.31 0.26 10210 7.80E-03 4.80E-03 0.06 0.01 0.00 3.14E-04 0.00 0.00 84.79 6.48E-05 3.99E-05 84.81
Total Emissions Per Project (tpy) 2.71 8.39 1.05 0.02 0.15 0.13 6393.29 0.01 0.01 6397.25
1/2 Ton Trucks Gasoline 12% 14717.16 1.21 23.49 2.77 0.01 0.14 0.12 8780 1.34E-02 3.33E-02 0.02 0.38 0.04 1.85E-04 0.00 0.00 142.43 2.17E-04 5.40E-04 142.601 Ton Trucks Gasoline 37% 44151.48 1.21 23.49 2.77 0.01 0.14 0.12 8780 1.34E-02 3.33E-02 0.06 1.14 0.13 5.55E-04 0.01 0.01 427.30 6.52E-04 0.00 427.802 1/2 Ton Trucks Diesel 12% 14717.16 6.78 1.74 0.38 0.04 0.31 0.26 10210 7.80E-03 4.80E-03 0.11 0.03 0.01 6.13E-04 0.00 0.00 165.63 1.27E-04 7.79E-05 165.66Tractor Trailers Diesel 25% 29434.32 6.78 1.74 0.38 0.04 0.31 0.26 10210 7.80E-03 4.80E-03 0.22 0.06 0.01 0.00 0.01 0.01 331.27 2.53E-04 1.56E-04 331.32Dump Trucks Diesel 12% 14717.16 6.78 1.74 0.38 0.04 0.31 0.26 10210 7.80E-03 4.80E-03 0.11 0.03 0.01 6.13E-04 0.00 0.00 165.63 1.27E-04 7.79E-05 165.66Concrete Trucks Diesel 1% 1471.72 6.78 1.74 0.38 0.04 0.31 0.26 10210 7.80E-03 4.80E-03 0.01 0.00 6.15E-04 6.13E-05 4.95E-04 4.26E-04 16.56 1.27E-05 7.79E-06 16.57
Total Emissions Per Project (tpy) 0.53 1.64 0.21 0.00 0.03 0.03 1248.83 0.00 0.00 1249.61
1/2 Ton Trucks Gasoline 12% 252.35 1.21 23.49 2.77 0.01 0.14 0.12 8780 1.34E-02 3.33E-02 3.36E-04 0.01 7.71E-04 3.17E-06 3.81E-05 3.43E-05 2.44 3.73E-06 9.26E-06 2.451 Ton Trucks Gasoline 37% 757.04 1.21 23.49 2.77 0.01 0.14 0.12 8780 1.34E-02 3.33E-02 0.00 0.02 0.00 9.51E-06 1.14E-04 1.03E-04 7.33 1.12E-05 2.78E-05 7.342 1/2 Ton Trucks Diesel 12% 252.35 6.78 1.74 0.38 0.04 0.31 0.26 10210 7.80E-03 4.80E-03 0.00 4.83E-04 1.05E-04 1.05E-05 8.49E-05 7.30E-05 2.84 2.17E-06 1.34E-06 2.84Tractor Trailers Diesel 25% 504.69 6.78 1.74 0.38 0.04 0.31 0.26 10210 7.80E-03 4.80E-03 0.00 9.66E-04 2.11E-04 2.10E-05 1.70E-04 1.46E-04 5.68 4.34E-06 2.67E-06 5.68Dump Trucks Diesel 12% 252.35 6.78 1.74 0.38 0.04 0.31 0.26 10210 7.80E-03 4.80E-03 0.00 4.83E-04 1.05E-04 1.05E-05 8.49E-05 7.30E-05 2.84 2.17E-06 1.34E-06 2.84Concrete Trucks Diesel 1% 25.23 6.78 1.74 0.38 0.04 0.31 0.26 10210 7.80E-03 4.80E-03 1.89E-04 4.83E-05 1.05E-05 1.05E-06 8.49E-06 7.30E-06 0.28 2.17E-07 1.34E-07 0.28
Total Emissions Per Project (tpy) 0.01 0.03 0.00 5.58E-05 5.00E-04 4.37E-04 21.41 2.38E-05 4.25E-05 21.43
1/2 Ton Trucks Gasoline 12% 0.00 1.21 23.49 2.77 0.01 0.14 0.12 8780 1.34E-02 3.33E-02 0.00 0.00 0.00 0.00 0.00 0.00 0.00 0.00 0.00 0.001 Ton Trucks Gasoline 37% 0.00 1.21 23.49 2.77 0.01 0.14 0.12 8780 1.34E-02 3.33E-02 0.00 0.00 0.00 0.00 0.00 0.00 0.00 0.00 0.00 0.002 1/2 Ton Trucks Diesel 12% 0.00 6.78 1.74 0.38 0.04 0.31 0.26 10210 7.80E-03 4.80E-03 0.00 0.00 0.00 0.00 0.00 0.00 0.00 0.00 0.00 0.00Tractor Trailers Diesel 25% 0.00 6.78 1.74 0.38 0.04 0.31 0.26 10210 7.80E-03 4.80E-03 0.00 0.00 0.00 0.00 0.00 0.00 0.00 0.00 0.00 0.00Dump Trucks Diesel 12% 0.00 6.78 1.74 0.38 0.04 0.31 0.26 10210 7.80E-03 4.80E-03 0.00 0.00 0.00 0.00 0.00 0.00 0.00 0.00 0.00 0.00Concrete Trucks Diesel 1% 0.00 6.78 1.74 0.38 0.04 0.31 0.26 10210 7.80E-03 4.80E-03 0.00 0.00 0.00 0.00 0.00 0.00 0.00 0.00 0.00 0.00
Total Emissions Per Project (tpy) 0.00 0.00 0.00 0.00 0.00 0.00 0.00 0.00 0.00 0.00E+00
1/2 Ton Trucks Gasoline 12% 0.00 1.21 23.49 2.77 0.01 0.14 0.12 8780 1.34E-02 3.33E-02 0.00 0.00 0.00 0.00 0.00 0.00 0.00 0.00 0.00 0.001 Ton Trucks Gasoline 37% 0.00 1.21 23.49 2.77 0.01 0.14 0.12 8780 1.34E-02 3.33E-02 0.00 0.00 0.00 0.00 0.00 0.00 0.00 0.00 0.00 0.002 1/2 Ton Trucks Diesel 12% 0.00 6.78 1.74 0.38 0.04 0.31 0.26 10210 7.80E-03 4.80E-03 0.00 0.00 0.00 0.00 0.00 0.00 0.00 0.00 0.00 0.00Tractor Trailers Diesel 25% 0.00 6.78 1.74 0.38 0.04 0.31 0.26 10210 7.80E-03 4.80E-03 0.00 0.00 0.00 0.00 0.00 0.00 0.00 0.00 0.00 0.00Dump Trucks Diesel 12% 0.00 6.78 1.74 0.38 0.04 0.31 0.26 10210 7.80E-03 4.80E-03 0.00 0.00 0.00 0.00 0.00 0.00 0.00 0.00 0.00 0.00Concrete Trucks Diesel 1% 0.00 6.78 1.74 0.38 0.04 0.31 0.26 10210 7.80E-03 4.80E-03 0.00 0.00 0.00 0.00 0.00 0.00 0.00 0.00 0.00 0.00
Total Emissions Per Project (tpy) 0.00 0.00 0.00 0.00 0.00 0.00 0.00 0.00 0.00 0.00
1/2 Ton Trucks Gasoline 12% 0.00 1.21 23.49 2.77 0.01 0.14 0.12 8780 1.34E-02 3.33E-02 0.00 0.00 0.00 0.00 0.00 0.00 0.00 0.00 0.00 0.001 Ton Trucks Gasoline 37% 0.00 1.21 23.49 2.77 0.01 0.14 0.12 8780 1.34E-02 3.33E-02 0.00 0.00 0.00 0.00 0.00 0.00 0.00 0.00 0.00 0.002 1/2 Ton Trucks Diesel 12% 0.00 6.78 1.74 0.38 0.04 0.31 0.26 10210 7.80E-03 4.80E-03 0.00 0.00 0.00 0.00 0.00 0.00 0.00 0.00 0.00 0.00Tractor Trailers Diesel 25% 0.00 6.78 1.74 0.38 0.04 0.31 0.26 10210 7.80E-03 4.80E-03 0.00 0.00 0.00 0.00 0.00 0.00 0.00 0.00 0.00 0.00Dump Trucks Diesel 12% 0.00 6.78 1.74 0.38 0.04 0.31 0.26 10210 7.80E-03 4.80E-03 0.00 0.00 0.00 0.00 0.00 0.00 0.00 0.00 0.00 0.00Concrete Trucks Diesel 1% 0.00 6.78 1.74 0.38 0.04 0.31 0.26 10210 7.80E-03 4.80E-03 0.00 0.00 0.00 0.00 0.00 0.00 0.00 0.00 0.00 0.00
Total Emissions Per Project (tpy) 0.00 0.00 0.00 0.00 0.00 0.00 0.00 0.00 0.00 0.00(a) Vehicle breakdown based on U.S. fleet trends in US EPA Report "Light-Duty Automotive Technology, Carbon Dioxide Emissions, and Fuel Economy Trends: 1975 through 2014"
Percent passenger cars 70%Percent passenger trucks 30%Percent gasoline vehicles 90%
Percent diesel vehicles 10%(b) Criteria Pollutant Emission Factors from U.S. EPA MOBILE6.2. Summer 2008 LGT12 emission factors used for project component emissions; Greenhouse gas emissions from EPA (2014) Inventory of US Greenhouse Gas Emissions and Sinks(c) Global Warming Potentials Table A-1 to Subpart A of 40 CFR Part 98
CO2 1CH4 25N2O 298
Table 27: Restoration of 4 miles of RAIL (BMCD ID: 18)
Table 28: Repair 11 miles of asphalt ROADS (BMCD ID: 23)
Table 29: Repair 1560000 sqft of asphalt ROADS (BMCD ID: 32)
Table 30: New Security Post Buildings (x2) (BMCD ID: 25b)
Table 31: Upgrade Utility Infrastructure Overall (BMcD ID 9)
Table 25: 22 miles of RAIL network (BMCD ID: 3)
Table 26: 10 acre RAIL classification yard (BMCD ID: 6)
Equipment Fuel Quantitya
Vendor VMT Distribution by Vehicle Type
Emission Factors (g/mi)b Emissions (tons per year)
Delivery Vehicles

Letterkenny Ammunitions Center (LEMC)Fugitive Dust Emissions from Vehicle Travel to Construction Site on Paved Roads
Unpaved Roads emission factor from AP-42, Section 13.2.2: Unpaved Roads (11/06); Equations a1 and 2
Paved Roads emission factor from AP-42, Section 13.2.1: Paved Roads (01/11)E = k(sL)0.91(W)1.02(1-P/(4*365))
where:sL = 0.6 road surface silt loading silt loading (g/m2) [Table 13.2.1-2, for Ubiquitous Baseline, <500]W = varies tons [Average vehicle weight]k = 0.0022 lb/VMT [Table 13.2.1-1, for PM10 ]
k = 0.00054 lb/VMT [Table 13.2.1-1, for PM2.5]
P = 120 days [Average number of days with > 0.01 inches of precipitation for southeast Texas, Figure 13.2.1-2]
PM10 PM2.5 PM10 PM2.5 PM10 PM2.5 PM10 PM2.5
Table 1: 10,000 Square foot NEW Building (BMCD ID: 8, 13, 15, 21, 24, 27, 29, 31, 33, and 36)Site Prep 1 10.8 5 54 3 0.004 0.001 1.05E-04 2.58E-05 7.30 0 0 15 0.02 4.93E-03 0.00 0.00Grading 2 10.8 10 216 3 0.004 0.001 4.20E-04 1.03E-04 7.30 0 0 15 0.02 4.93E-03 0.00 0.00Building Construction 100 10.8 1 1,080 3 0.004 0.001 2.10E-03 5.16E-04 7.30 1 730 15 0.02 4.93E-03 7.33E-03 1.80E-03Paving 5 10.8 18 972 3 0.004 0.001 1.89E-03 4.64E-04 7.30 0 0 15 0.02 4.93E-03 0.00 0.00Architectural Coating 5 10.8 0 0 3 0.004 0.001 0.00 0.00 7.30 0 0 15 0.02 4.93E-03 0.00 0.00
4.52E-03 1.11E-03 Total Emissions (tpy) 7.33E-03 1.80E-03
Site Prep 1 10.8 5 54 3 0.004 0.001 1.05E-04 2.58E-05 7.30 0 0 15 0.02 4.93E-03 0.00 0.00Grading 2 10.8 10 216 3 0.004 0.001 4.20E-04 1.03E-04 7.30 0 0 15 0.02 4.93E-03 0.00 0.00Building Construction 100 10.8 1 1,080 3 0.004 0.001 2.10E-03 5.16E-04 7.30 0 0 15 0.02 4.93E-03 0.00 0.00Paving 5 10.8 18 972 3 0.004 0.001 1.89E-03 4.64E-04 7.30 0 0 15 0.02 4.93E-03 0.00 0.00Architectural Coating 5 10.8 0 0 3 0.004 0.001 0.00 0.00 7.30 0 0 15 0.02 4.93E-03 0.00 0.00
Total Emissions (tpy) 4.52E-03 1.11E-03 Total Emissions (tpy) 0.00 0.00
Site Preparation 1 10.8 5 54 3 0.004 0.001 1.05E-04 2.58E-05 7.30 0 0 15 0.02 4.93E-03 0.00 0.00Grading 2 10.8 10 216 3 0.004 0.001 4.20E-04 1.03E-04 7.30 0 0 15 0.02 4.93E-03 0.00 0.00Building Construction 100 10.8 1 1,080 3 0.004 0.001 2.10E-03 5.16E-04 7.30 0 0 15 0.02 4.93E-03 0.00 0.00Paving 5 10.8 18 972 3 0.004 0.001 1.89E-03 4.64E-04 7.30 0 0 15 0.02 4.93E-03 0.00 0.00Architectural Coating 5 10.8 0 0 3 0.004 0.001 0.00 0.00 7.30 0 0 15 0.02 4.93E-03 0.00 0.00
Total Emissions (tpy) 4.52E-03 1.11E-03 Total Emissions (tpy) 0.00 0.00
Site Preparation 1 10.8 5 54 3 0.004 0.001 1.05E-04 2.58E-05 7.30 0 0 15 0.02 4.93E-03 0.00 0.00Grading 2 10.8 10 216 3 0.004 0.001 4.20E-04 1.03E-04 7.30 0 0 15 0.02 4.93E-03 0.00 0.00Paving 5 10.8 18 972 3 0.004 0.001 1.89E-03 4.64E-04 7.30 0 0 15 0.02 4.93E-03 0.00 0.00Architectural Coating 5 10.8 0 0 3 0.004 0.001 0.00 0.00 7.30 0 0 15 0.02 4.93E-03 0.00 0.00
Total Emissions (tpy) 2.42E-03 5.93E-04 Total Emissions (tpy) 0.00 0.00
Site Prep 1 10.8 5 54 3 0.004 0.001 1.05E-04 2.58E-05 7.30 0 0 15 0.02 4.93E-03 0.00 0.00Grading 2 10.8 10 216 3 0.004 0.001 4.20E-04 1.03E-04 7.30 0 0 15 0.02 4.93E-03 0.00 0.00Building Construction 100 10.8 4 4,320 3 0.004 0.001 8.40E-03 2.06E-03 7.30 0 0 15 0.02 4.93E-03 0.00 0.00Paving 5 10.8 18 972 3 0.004 0.001 1.89E-03 4.64E-04 7.30 0 0 15 0.02 4.93E-03 0.00 0.00Architectural Coating 5 10.8 0 0 3 0.004 0.001 0.00 0.00 7.30 0 0 15 0.02 4.93E-03 0.00 0.00
Total Emissions (tpy) 0.01 2.66E-03 Total Emissions (tpy) 0.00 0.00
Site Prep 1 10.8 5 54 3 0.004 0.001 1.05E-04 2.58E-05 7.30 0 0 15 0.02 4.93E-03 0.00 0.00Grading 2 10.8 10 216 3 0.004 0.001 4.20E-04 1.03E-04 7.30 0 0 15 0.02 4.93E-03 0.00 0.00Building Construction 100 10.8 1 1,080 3 0.004 0.001 2.10E-03 5.16E-04 7.30 0 0 15 0.02 4.93E-03 0.00 0.00Paving 5 10.8 18 972 3 0.004 0.001 1.89E-03 4.64E-04 7.30 0 0 15 0.02 4.93E-03 0.00 0.00Architectural Coating 5 10.8 0 0 3 0.004 0.001 0.00 0.00 7.30 0 0 15 0.02 4.93E-03 0.00 0.00
Total Emissions (tpy) 4.52E-03 1.11E-03 Total Emissions (tpy) 0.00 0.00
Site Preparation 1 10.8 5 54 3 0.004 0.001 1.05E-04 2.58E-05 7.30 0 0 15 0.02 4.93E-03 0.00 0.00Grading 2 10.8 10 216 3 0.004 0.001 4.20E-04 1.03E-04 7.30 0 0 15 0.02 4.93E-03 0.00 0.00Building Construction 100 10.8 15 16,200 3 0.004 0.001 0.03 7.73E-03 7.30 6 4,380 15 0.02 4.93E-03 0.04 0.01Paving 5 10.8 18 972 3 0.004 0.001 1.89E-03 4.64E-04 7.30 0 0 15 0.02 4.93E-03 0.00 0.00Architectural Coating 5 10.8 3 162 3 0.004 0.001 3.15E-04 7.73E-05 7.30 0 0 15 0.02 4.93E-03 0.00 0.00
Total Emissions (tpy) 0.03 8.40E-03 Total Emissions (tpy) 0.04 0.01
Site Preparation 2 10.8 8 173 3 0.004 0.001 3.36E-04 8.25E-05 7.30 0 0 15 0.02 4.93E-03 0.00 0.00Grading 4 10.8 8 346 3 0.004 0.001 6.72E-04 1.65E-04 7.30 0 0 15 0.02 4.93E-03 0.00 0.00Building Construction 200 10.8 19 41,040 3 0.004 0.001 0.08 0.02 7.30 7 10,220 15 0.02 4.93E-03 0.10 0.03Paving 10 10.8 13 1,404 3 0.004 0.001 2.73E-03 6.70E-04 7.30 0 0 15 0.02 4.93E-03 0.00 0.00Architectural Coating 10 10.8 4 432 3 0.004 0.001 8.40E-04 2.06E-04 7.30 0 0 15 0.02 4.93E-03 0.00 0.00
Total Emissions (tpy) 0.08 0.02 Total Emissions (tpy) 0.10 0.03
Site Preparation 2 10.8 8 173 3 0.004 0.001 3.36E-04 8.25E-05 7.30 0 0 15 0.02 4.93E-03 0.00 0.00Grading 4 10.8 8 346 3 0.004 0.001 6.72E-04 1.65E-04 7.30 0 0 15 0.02 4.93E-03 0.00 0.00Building Construction 200 10.8 34 73,440 3 0.004 0.001 0.14 0.04 7.30 13 18,980 15 0.02 4.93E-03 0.19 0.05Paving 10 10.8 13 1,404 3 0.004 0.001 2.73E-03 6.70E-04 7.30 0 0 15 0.02 4.93E-03 0.00 0.00Architectural Coating 10 10.8 7 756 3 0.004 0.001 1.47E-03 3.61E-04 7.30 0 0 15 0.02 4.93E-03 0.00 0.00
Total Emissions (tpy) 0.15 0.04 Total Emissions (tpy) 0.19 0.05
Table 8: 35,000 sqft NEW Building (BMCD ID: 2)
Table 9: 45,000 sqft NEW Building (x2 BMCD ID: 1)
Table 10: 82,000 sqft NEW Building (x4) (BMCD ID: 5)
Table 6: 1,750 sqft NEW Building (BMCD ID: 10, 12)
Table 7: 5,000 sqft NEW Building (BMCD ID: 40)
Table 3: 2,700 sqft NEW Building (BMcD ID: 26)
Table 4: 2,400 sqft NEW Building (BMCD ID: 19)
Table 5: 100 Space PARKING LOT (BMCD ID: 7)
Table 2: 4,000 square foot NEW building (BMCD ID: 14)Total Emissions (tpy)
Emissions Per Facility(tons)
W: Mean Vehicle Weight
(tons)b
Emission Factors (lb/VMT)c Emissions Per Facility(tons) Trips per day-
Vendors
Total Vehicle Miles
Traveleda
(VMT)-Workers
Total Vehicle
Miles Traveleda
(VMT)-Vendors
W: Mean Vehicle Weight
(tons)c
Emission Factors (lb/VMT)d
Equipment Construction
Duration (days)
Trip Length-Workers
Trips per day-Workers
Trip Length- Vendors
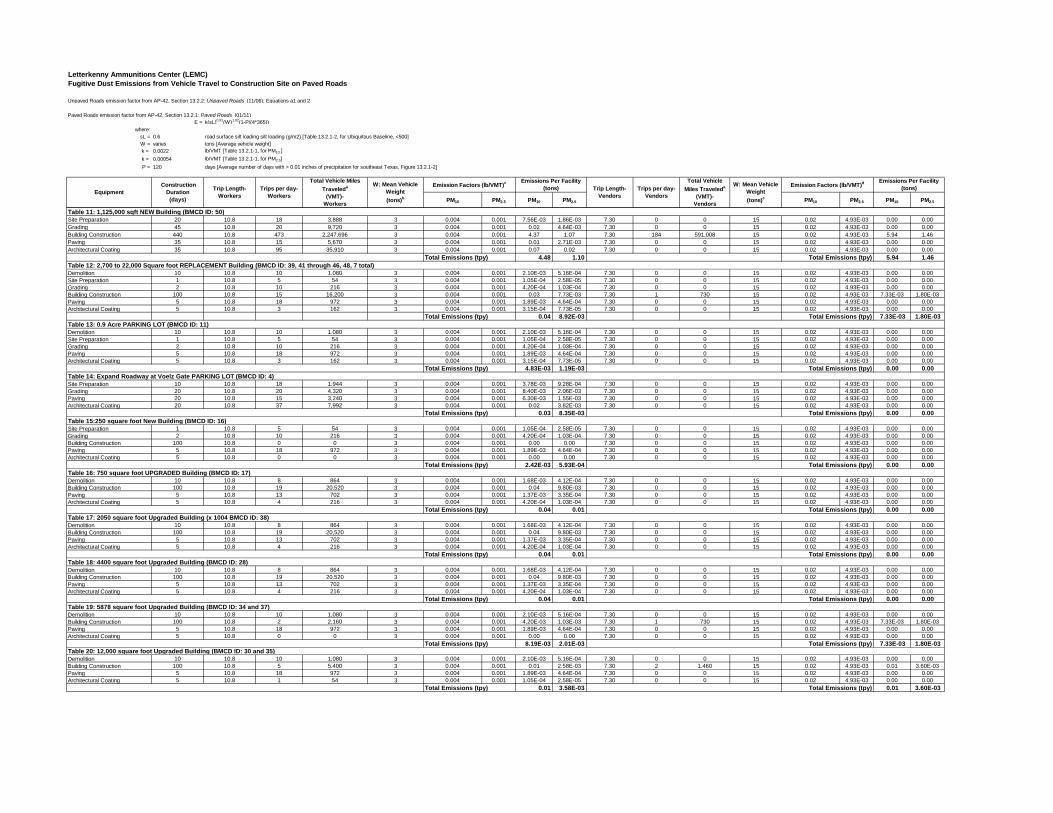
Letterkenny Ammunitions Center (LEMC)Fugitive Dust Emissions from Vehicle Travel to Construction Site on Paved Roads
Unpaved Roads emission factor from AP-42, Section 13.2.2: Unpaved Roads (11/06); Equations a1 and 2
Paved Roads emission factor from AP-42, Section 13.2.1: Paved Roads (01/11)E = k(sL)0.91(W)1.02(1-P/(4*365))
where:sL = 0.6 road surface silt loading silt loading (g/m2) [Table 13.2.1-2, for Ubiquitous Baseline, <500]W = varies tons [Average vehicle weight]k = 0.0022 lb/VMT [Table 13.2.1-1, for PM10 ]
k = 0.00054 lb/VMT [Table 13.2.1-1, for PM2.5]
P = 120 days [Average number of days with > 0.01 inches of precipitation for southeast Texas, Figure 13.2.1-2]
PM10 PM2.5 PM10 PM2.5 PM10 PM2.5 PM10 PM2.5
Emissions Per Facility(tons)
W: Mean Vehicle Weight
(tons)b
Emission Factors (lb/VMT)c Emissions Per Facility(tons) Trips per day-
Vendors
Total Vehicle Miles
Traveleda
(VMT)-Workers
Total Vehicle
Miles Traveleda
(VMT)-Vendors
W: Mean Vehicle Weight
(tons)c
Emission Factors (lb/VMT)d
Equipment Construction
Duration (days)
Trip Length-Workers
Trips per day-Workers
Trip Length- Vendors
Site Preparation 20 10.8 18 3,888 3 0.004 0.001 7.56E-03 1.86E-03 7.30 0 0 15 0.02 4.93E-03 0.00 0.00Grading 45 10.8 20 9,720 3 0.004 0.001 0.02 4.64E-03 7.30 0 0 15 0.02 4.93E-03 0.00 0.00Building Construction 440 10.8 473 2,247,696 3 0.004 0.001 4.37 1.07 7.30 184 591,008 15 0.02 4.93E-03 5.94 1.46Paving 35 10.8 15 5,670 3 0.004 0.001 0.01 2.71E-03 7.30 0 0 15 0.02 4.93E-03 0.00 0.00Architectural Coating 35 10.8 95 35,910 3 0.004 0.001 0.07 0.02 7.30 0 0 15 0.02 4.93E-03 0.00 0.00
Total Emissions (tpy) 4.48 1.10 Total Emissions (tpy) 5.94 1.46
Demolition 10 10.8 10 1,080 3 0.004 0.001 2.10E-03 5.16E-04 7.30 0 0 15 0.02 4.93E-03 0.00 0.00Site Preparation 1 10.8 5 54 3 0.004 0.001 1.05E-04 2.58E-05 7.30 0 0 15 0.02 4.93E-03 0.00 0.00Grading 2 10.8 10 216 3 0.004 0.001 4.20E-04 1.03E-04 7.30 0 0 15 0.02 4.93E-03 0.00 0.00Building Construction 100 10.8 15 16,200 3 0.004 0.001 0.03 7.73E-03 7.30 1 730 15 0.02 4.93E-03 7.33E-03 1.80E-03Paving 5 10.8 18 972 3 0.004 0.001 1.89E-03 4.64E-04 7.30 0 0 15 0.02 4.93E-03 0.00 0.00Architectural Coating 5 10.8 3 162 3 0.004 0.001 3.15E-04 7.73E-05 7.30 0 0 15 0.02 4.93E-03 0.00 0.00
Total Emissions (tpy) 0.04 8.92E-03 Total Emissions (tpy) 7.33E-03 1.80E-03
Demolition 10 10.8 10 1,080 3 0.004 0.001 2.10E-03 5.16E-04 7.30 0 0 15 0.02 4.93E-03 0.00 0.00Site Preparation 1 10.8 5 54 3 0.004 0.001 1.05E-04 2.58E-05 7.30 0 0 15 0.02 4.93E-03 0.00 0.00Grading 2 10.8 10 216 3 0.004 0.001 4.20E-04 1.03E-04 7.30 0 0 15 0.02 4.93E-03 0.00 0.00Paving 5 10.8 18 972 3 0.004 0.001 1.89E-03 4.64E-04 7.30 0 0 15 0.02 4.93E-03 0.00 0.00Architectural Coating 5 10.8 3 162 3 0.004 0.001 3.15E-04 7.73E-05 7.30 0 0 15 0.02 4.93E-03 0.00 0.00
Total Emissions (tpy) 4.83E-03 1.19E-03 Total Emissions (tpy) 0.00 0.00
Site Preparation 10 10.8 18 1,944 3 0.004 0.001 3.78E-03 9.28E-04 7.30 0 0 15 0.02 4.93E-03 0.00 0.00Grading 20 10.8 20 4,320 3 0.004 0.001 8.40E-03 2.06E-03 7.30 0 0 15 0.02 4.93E-03 0.00 0.00Paving 20 10.8 15 3,240 3 0.004 0.001 6.30E-03 1.55E-03 7.30 0 0 15 0.02 4.93E-03 0.00 0.00Architectural Coating 20 10.8 37 7,992 3 0.004 0.001 0.02 3.82E-03 7.30 0 0 15 0.02 4.93E-03 0.00 0.00
Total Emissions (tpy) 0.03 8.35E-03 Total Emissions (tpy) 0.00 0.00
Site Preparation 1 10.8 5 54 3 0.004 0.001 1.05E-04 2.58E-05 7.30 0 0 15 0.02 4.93E-03 0.00 0.00Grading 2 10.8 10 216 3 0.004 0.001 4.20E-04 1.03E-04 7.30 0 0 15 0.02 4.93E-03 0.00 0.00Building Construction 100 10.8 0 0 3 0.004 0.001 0.00 0.00 7.30 0 0 15 0.02 4.93E-03 0.00 0.00Paving 5 10.8 18 972 3 0.004 0.001 1.89E-03 4.64E-04 7.30 0 0 15 0.02 4.93E-03 0.00 0.00Architectural Coating 5 10.8 0 0 3 0.004 0.001 0.00 0.00 7.30 0 0 15 0.02 4.93E-03 0.00 0.00
Total Emissions (tpy) 2.42E-03 5.93E-04 Total Emissions (tpy) 0.00 0.00
Demolition 10 10.8 8 864 3 0.004 0.001 1.68E-03 4.12E-04 7.30 0 0 15 0.02 4.93E-03 0.00 0.00Building Construction 100 10.8 19 20,520 3 0.004 0.001 0.04 9.80E-03 7.30 0 0 15 0.02 4.93E-03 0.00 0.00Paving 5 10.8 13 702 3 0.004 0.001 1.37E-03 3.35E-04 7.30 0 0 15 0.02 4.93E-03 0.00 0.00Architectural Coating 5 10.8 4 216 3 0.004 0.001 4.20E-04 1.03E-04 7.30 0 0 15 0.02 4.93E-03 0.00 0.00
Total Emissions (tpy) 0.04 0.01 Total Emissions (tpy) 0.00 0.00
Demolition 10 10.8 10 1,080 3 0.004 0.001 2.10E-03 5.16E-04 7.30 0 0 15 0.02 4.93E-03 0.00 0.00Building Construction 100 10.8 2 2,160 3 0.004 0.001 4.20E-03 1.03E-03 7.30 1 730 15 0.02 4.93E-03 7.33E-03 1.80E-03Paving 5 10.8 18 972 3 0.004 0.001 1.89E-03 4.64E-04 7.30 0 0 15 0.02 4.93E-03 0.00 0.00Architectural Coating 5 10.8 0 0 3 0.004 0.001 0.00 0.00 7.30 0 0 15 0.02 4.93E-03 0.00 0.00
Total Emissions (tpy) 8.19E-03 2.01E-03 Total Emissions (tpy) 7.33E-03 1.80E-03
Demolition 10 10.8 10 1,080 3 0.004 0.001 2.10E-03 5.16E-04 7.30 0 0 15 0.02 4.93E-03 0.00 0.00Building Construction 100 10.8 5 5,400 3 0.004 0.001 0.01 2.58E-03 7.30 2 1,460 15 0.02 4.93E-03 0.01 3.60E-03Paving 5 10.8 18 972 3 0.004 0.001 1.89E-03 4.64E-04 7.30 0 0 15 0.02 4.93E-03 0.00 0.00Architectural Coating 5 10.8 1 54 3 0.004 0.001 1.05E-04 2.58E-05 7.30 0 0 15 0.02 4.93E-03 0.00 0.00
Total Emissions (tpy) 0.01 3.58E-03 Total Emissions (tpy) 0.01 3.60E-03
Table 19: 5878 square foot Upgraded Building (BMCD ID: 34 and 37)
Table 20: 12,000 square foot Upgraded Building (BMCD ID: 30 and 35)
Table 16: 750 square foot UPGRADED Building (BMCD ID: 17)
Table 17: 2050 square foot Upgraded Building (x 1004 BMCD ID: 38)
Table 18: 4400 square foot Upgraded Building (BMCD ID: 28)
Table 15:250 square foot New Building (BMCD ID: 16)
Table 12: 2,700 to 22,000 Square foot REPLACEMENT Building (BMCD ID: 39, 41 through 46, 48, 7 total)
Table 13: 0.9 Acre PARKING LOT (BMCD ID: 11)
Table 14: Expand Roadway at Voelz Gate PARKING LOT (BMCD ID: 4)
Table 11: 1,125,000 sqft NEW Building (BMCD ID: 50)
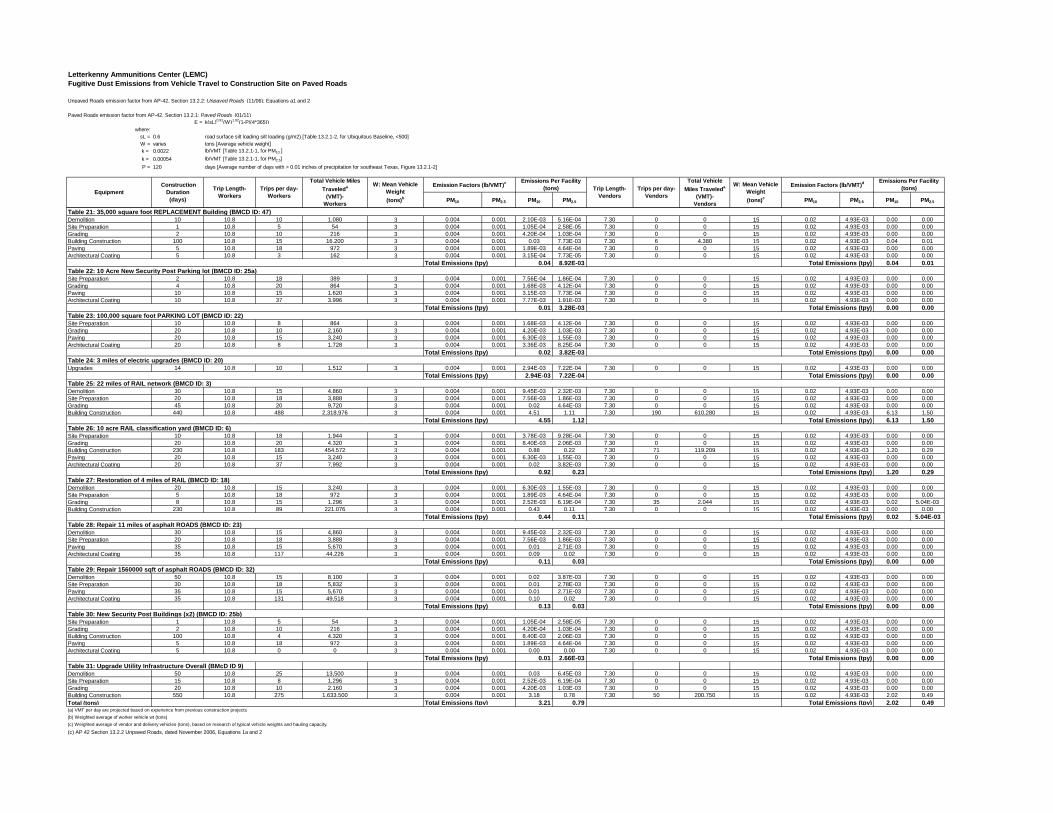
Letterkenny Ammunitions Center (LEMC)Fugitive Dust Emissions from Vehicle Travel to Construction Site on Paved Roads
Unpaved Roads emission factor from AP-42, Section 13.2.2: Unpaved Roads (11/06); Equations a1 and 2
Paved Roads emission factor from AP-42, Section 13.2.1: Paved Roads (01/11)E = k(sL)0.91(W)1.02(1-P/(4*365))
where:sL = 0.6 road surface silt loading silt loading (g/m2) [Table 13.2.1-2, for Ubiquitous Baseline, <500]W = varies tons [Average vehicle weight]k = 0.0022 lb/VMT [Table 13.2.1-1, for PM10 ]
k = 0.00054 lb/VMT [Table 13.2.1-1, for PM2.5]
P = 120 days [Average number of days with > 0.01 inches of precipitation for southeast Texas, Figure 13.2.1-2]
PM10 PM2.5 PM10 PM2.5 PM10 PM2.5 PM10 PM2.5
Emissions Per Facility(tons)
W: Mean Vehicle Weight
(tons)b
Emission Factors (lb/VMT)c Emissions Per Facility(tons) Trips per day-
Vendors
Total Vehicle Miles
Traveleda
(VMT)-Workers
Total Vehicle
Miles Traveleda
(VMT)-Vendors
W: Mean Vehicle Weight
(tons)c
Emission Factors (lb/VMT)d
Equipment Construction
Duration (days)
Trip Length-Workers
Trips per day-Workers
Trip Length- Vendors
Demolition 10 10.8 10 1,080 3 0.004 0.001 2.10E-03 5.16E-04 7.30 0 0 15 0.02 4.93E-03 0.00 0.00Site Preparation 1 10.8 5 54 3 0.004 0.001 1.05E-04 2.58E-05 7.30 0 0 15 0.02 4.93E-03 0.00 0.00Grading 2 10.8 10 216 3 0.004 0.001 4.20E-04 1.03E-04 7.30 0 0 15 0.02 4.93E-03 0.00 0.00Building Construction 100 10.8 15 16,200 3 0.004 0.001 0.03 7.73E-03 7.30 6 4,380 15 0.02 4.93E-03 0.04 0.01Paving 5 10.8 18 972 3 0.004 0.001 1.89E-03 4.64E-04 7.30 0 0 15 0.02 4.93E-03 0.00 0.00Architectural Coating 5 10.8 3 162 3 0.004 0.001 3.15E-04 7.73E-05 7.30 0 0 15 0.02 4.93E-03 0.00 0.00
Total Emissions (tpy) 0.04 8.92E-03 Total Emissions (tpy) 0.04 0.01
Site Preparation 2 10.8 18 389 3 0.004 0.001 7.56E-04 1.86E-04 7.30 0 0 15 0.02 4.93E-03 0.00 0.00Grading 4 10.8 20 864 3 0.004 0.001 1.68E-03 4.12E-04 7.30 0 0 15 0.02 4.93E-03 0.00 0.00Paving 10 10.8 15 1,620 3 0.004 0.001 3.15E-03 7.73E-04 7.30 0 0 15 0.02 4.93E-03 0.00 0.00Architectural Coating 10 10.8 37 3,996 3 0.004 0.001 7.77E-03 1.91E-03 7.30 0 0 15 0.02 4.93E-03 0.00 0.00
Total Emissions (tpy) 0.01 3.28E-03 Total Emissions (tpy) 0.00 0.00
Site Preparation 10 10.8 8 864 3 0.004 0.001 1.68E-03 4.12E-04 7.30 0 0 15 0.02 4.93E-03 0.00 0.00Grading 20 10.8 10 2,160 3 0.004 0.001 4.20E-03 1.03E-03 7.30 0 0 15 0.02 4.93E-03 0.00 0.00Paving 20 10.8 15 3,240 3 0.004 0.001 6.30E-03 1.55E-03 7.30 0 0 15 0.02 4.93E-03 0.00 0.00Architectural Coating 20 10.8 8 1,728 3 0.004 0.001 3.36E-03 8.25E-04 7.30 0 0 15 0.02 4.93E-03 0.00 0.00
Total Emissions (tpy) 0.02 3.82E-03 Total Emissions (tpy) 0.00 0.00
Upgrades 14 10.8 10 1,512 3 0.004 0.001 2.94E-03 7.22E-04 7.30 0 0 15 0.02 4.93E-03 0.00 0.00Total Emissions (tpy) 2.94E-03 7.22E-04 Total Emissions (tpy) 0.00 0.00
Demolition 30 10.8 15 4,860 3 0.004 0.001 9.45E-03 2.32E-03 7.30 0 0 15 0.02 4.93E-03 0.00 0.00Site Preparation 20 10.8 18 3,888 3 0.004 0.001 7.56E-03 1.86E-03 7.30 0 0 15 0.02 4.93E-03 0.00 0.00Grading 45 10.8 20 9,720 3 0.004 0.001 0.02 4.64E-03 7.30 0 0 15 0.02 4.93E-03 0.00 0.00Building Construction 440 10.8 488 2,318,976 3 0.004 0.001 4.51 1.11 7.30 190 610,280 15 0.02 4.93E-03 6.13 1.50
Total Emissions (tpy) 4.55 1.12 Total Emissions (tpy) 6.13 1.50
Site Preparation 10 10.8 18 1,944 3 0.004 0.001 3.78E-03 9.28E-04 7.30 0 0 15 0.02 4.93E-03 0.00 0.00Grading 20 10.8 20 4,320 3 0.004 0.001 8.40E-03 2.06E-03 7.30 0 0 15 0.02 4.93E-03 0.00 0.00Building Construction 230 10.8 183 454,572 3 0.004 0.001 0.88 0.22 7.30 71 119,209 15 0.02 4.93E-03 1.20 0.29Paving 20 10.8 15 3,240 3 0.004 0.001 6.30E-03 1.55E-03 7.30 0 0 15 0.02 4.93E-03 0.00 0.00Architectural Coating 20 10.8 37 7,992 3 0.004 0.001 0.02 3.82E-03 7.30 0 0 15 0.02 4.93E-03 0.00 0.00
Total Emissions (tpy) 0.92 0.23 Total Emissions (tpy) 1.20 0.29
Demolition 20 10.8 15 3,240 3 0.004 0.001 6.30E-03 1.55E-03 7.30 0 0 15 0.02 4.93E-03 0.00 0.00Site Preparation 5 10.8 18 972 3 0.004 0.001 1.89E-03 4.64E-04 7.30 0 0 15 0.02 4.93E-03 0.00 0.00Grading 8 10.8 15 1,296 3 0.004 0.001 2.52E-03 6.19E-04 7.30 35 2,044 15 0.02 4.93E-03 0.02 5.04E-03Building Construction 230 10.8 89 221,076 3 0.004 0.001 0.43 0.11 7.30 0 0 15 0.02 4.93E-03 0.00 0.00
Total Emissions (tpy) 0.44 0.11 Total Emissions (tpy) 0.02 5.04E-03
Demolition 30 10.8 15 4,860 3 0.004 0.001 9.45E-03 2.32E-03 7.30 0 0 15 0.02 4.93E-03 0.00 0.00Site Preparation 20 10.8 18 3,888 3 0.004 0.001 7.56E-03 1.86E-03 7.30 0 0 15 0.02 4.93E-03 0.00 0.00Paving 35 10.8 15 5,670 3 0.004 0.001 0.01 2.71E-03 7.30 0 0 15 0.02 4.93E-03 0.00 0.00Architectural Coating 35 10.8 117 44,226 3 0.004 0.001 0.09 0.02 7.30 0 0 15 0.02 4.93E-03 0.00 0.00
Total Emissions (tpy) 0.11 0.03 Total Emissions (tpy) 0.00 0.00
Demolition 50 10.8 15 8,100 3 0.004 0.001 0.02 3.87E-03 7.30 0 0 15 0.02 4.93E-03 0.00 0.00Site Preparation 30 10.8 18 5,832 3 0.004 0.001 0.01 2.78E-03 7.30 0 0 15 0.02 4.93E-03 0.00 0.00Paving 35 10.8 15 5,670 3 0.004 0.001 0.01 2.71E-03 7.30 0 0 15 0.02 4.93E-03 0.00 0.00Architectural Coating 35 10.8 131 49,518 3 0.004 0.001 0.10 0.02 7.30 0 0 15 0.02 4.93E-03 0.00 0.00
Total Emissions (tpy) 0.13 0.03 Total Emissions (tpy) 0.00 0.00
Site Preparation 1 10.8 5 54 3 0.004 0.001 1.05E-04 2.58E-05 7.30 0 0 15 0.02 4.93E-03 0.00 0.00Grading 2 10.8 10 216 3 0.004 0.001 4.20E-04 1.03E-04 7.30 0 0 15 0.02 4.93E-03 0.00 0.00Building Construction 100 10.8 4 4,320 3 0.004 0.001 8.40E-03 2.06E-03 7.30 0 0 15 0.02 4.93E-03 0.00 0.00Paving 5 10.8 18 972 3 0.004 0.001 1.89E-03 4.64E-04 7.30 0 0 15 0.02 4.93E-03 0.00 0.00Architectural Coating 5 10.8 0 0 3 0.004 0.001 0.00 0.00 7.30 0 0 15 0.02 4.93E-03 0.00 0.00
Total Emissions (tpy) 0.01 2.66E-03 Total Emissions (tpy) 0.00 0.00Table 31: Upgrade Utility Infrastructure Overall (BMcD ID 9)Demolition 50 10.8 25 13,500 3 0.004 0.001 0.03 6.45E-03 7.30 0 0 15 0.02 4.93E-03 0.00 0.00Site Preparation 15 10.8 8 1,296 3 0.004 0.001 2.52E-03 6.19E-04 7.30 0 0 15 0.02 4.93E-03 0.00 0.00Grading 20 10.8 10 2,160 3 0.004 0.001 4.20E-03 1.03E-03 7.30 0 0 15 0.02 4.93E-03 0.00 0.00Building Construction 550 10.8 275 1,633,500 3 0.004 0.001 3.18 0.78 7.30 50 200,750 15 0.02 4.93E-03 2.02 0.49Total (tons) Total Emissions (tpy) 3.21 0.79 Total Emissions (tpy) 2.02 0.49(a) VMT per day are projected based on experience from previous construction projects
(b) Weighted average of worker vehicle wt (tons)
(c) Weighted average of vendor and delivery vehicles (tons), based on research of typical vehicle weights and hauling capacity.
(c) AP 42 Section 13.2.2 Unpaved Roads, dated November 2006, Equations 1a and 2
Table 29: Repair 1560000 sqft of asphalt ROADS (BMCD ID: 32)
Table 30: New Security Post Buildings (x2) (BMCD ID: 25b)
Table 26: 10 acre RAIL classification yard (BMCD ID: 6)
Table 27: Restoration of 4 miles of RAIL (BMCD ID: 18)
Table 28: Repair 11 miles of asphalt ROADS (BMCD ID: 23)
Table 25: 22 miles of RAIL network (BMCD ID: 3)
Table 23: 100,000 square foot PARKING LOT (BMCD ID: 22)
Table 24: 3 miles of electric upgrades (BMCD ID: 20)
Table 21: 35,000 square foot REPLACEMENT Building (BMCD ID: 47)
Table 22: 10 Acre New Security Post Parking lot (BMCD ID: 25a)
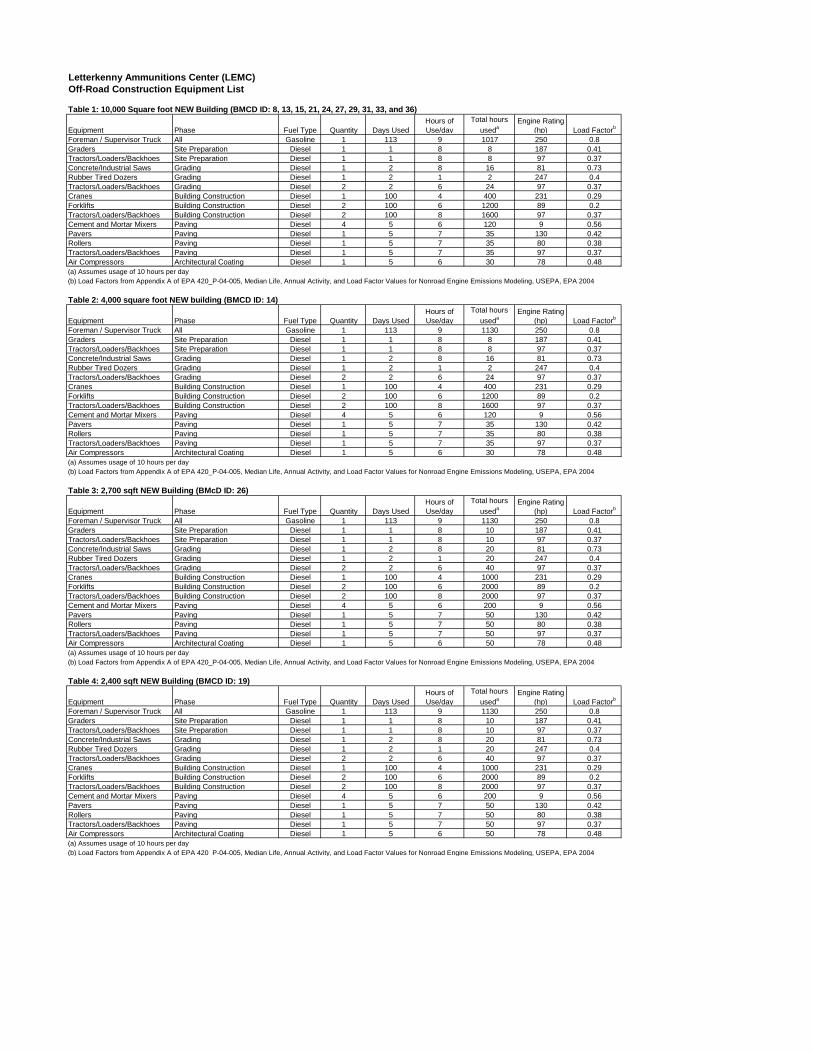
Letterkenny Ammunitions Center (LEMC)Off-Road Construction Equipment List
Table 1: 10,000 Square foot NEW Building (BMCD ID: 8, 13, 15, 21, 24, 27, 29, 31, 33, and 36)
Equipment Phase Fuel Type Quantity Days UsedHours of Use/day
Total hours
usedaEngine Rating
(hp) Load Factorb
Foreman / Supervisor Truck All Gasoline 1 113 9 1017 250 0.8Graders Site Preparation Diesel 1 1 8 8 187 0.41Tractors/Loaders/Backhoes Site Preparation Diesel 1 1 8 8 97 0.37Concrete/Industrial Saws Grading Diesel 1 2 8 16 81 0.73Rubber Tired Dozers Grading Diesel 1 2 1 2 247 0.4Tractors/Loaders/Backhoes Grading Diesel 2 2 6 24 97 0.37Cranes Building Construction Diesel 1 100 4 400 231 0.29Forklifts Building Construction Diesel 2 100 6 1200 89 0.2Tractors/Loaders/Backhoes Building Construction Diesel 2 100 8 1600 97 0.37Cement and Mortar Mixers Paving Diesel 4 5 6 120 9 0.56Pavers Paving Diesel 1 5 7 35 130 0.42Rollers Paving Diesel 1 5 7 35 80 0.38Tractors/Loaders/Backhoes Paving Diesel 1 5 7 35 97 0.37Air Compressors Architectural Coating Diesel 1 5 6 30 78 0.48(a) Assumes usage of 10 hours per day(b) Load Factors from Appendix A of EPA 420_P-04-005, Median Life, Annual Activity, and Load Factor Values for Nonroad Engine Emissions Modeling, USEPA, EPA 2004
Table 2: 4,000 square foot NEW building (BMCD ID: 14)
Equipment Phase Fuel Type Quantity Days UsedHours of Use/day
Total hours
usedaEngine Rating
(hp) Load Factorb
Foreman / Supervisor Truck All Gasoline 1 113 9 1130 250 0.8Graders Site Preparation Diesel 1 1 8 8 187 0.41Tractors/Loaders/Backhoes Site Preparation Diesel 1 1 8 8 97 0.37Concrete/Industrial Saws Grading Diesel 1 2 8 16 81 0.73Rubber Tired Dozers Grading Diesel 1 2 1 2 247 0.4Tractors/Loaders/Backhoes Grading Diesel 2 2 6 24 97 0.37Cranes Building Construction Diesel 1 100 4 400 231 0.29Forklifts Building Construction Diesel 2 100 6 1200 89 0.2Tractors/Loaders/Backhoes Building Construction Diesel 2 100 8 1600 97 0.37Cement and Mortar Mixers Paving Diesel 4 5 6 120 9 0.56Pavers Paving Diesel 1 5 7 35 130 0.42Rollers Paving Diesel 1 5 7 35 80 0.38Tractors/Loaders/Backhoes Paving Diesel 1 5 7 35 97 0.37Air Compressors Architectural Coating Diesel 1 5 6 30 78 0.48(a) Assumes usage of 10 hours per day(b) Load Factors from Appendix A of EPA 420_P-04-005, Median Life, Annual Activity, and Load Factor Values for Nonroad Engine Emissions Modeling, USEPA, EPA 2004
Table 3: 2,700 sqft NEW Building (BMcD ID: 26)
Equipment Phase Fuel Type Quantity Days UsedHours of Use/day
Total hours
usedaEngine Rating
(hp) Load Factorb
Foreman / Supervisor Truck All Gasoline 1 113 9 1130 250 0.8Graders Site Preparation Diesel 1 1 8 10 187 0.41Tractors/Loaders/Backhoes Site Preparation Diesel 1 1 8 10 97 0.37Concrete/Industrial Saws Grading Diesel 1 2 8 20 81 0.73Rubber Tired Dozers Grading Diesel 1 2 1 20 247 0.4Tractors/Loaders/Backhoes Grading Diesel 2 2 6 40 97 0.37Cranes Building Construction Diesel 1 100 4 1000 231 0.29Forklifts Building Construction Diesel 2 100 6 2000 89 0.2Tractors/Loaders/Backhoes Building Construction Diesel 2 100 8 2000 97 0.37Cement and Mortar Mixers Paving Diesel 4 5 6 200 9 0.56Pavers Paving Diesel 1 5 7 50 130 0.42Rollers Paving Diesel 1 5 7 50 80 0.38Tractors/Loaders/Backhoes Paving Diesel 1 5 7 50 97 0.37Air Compressors Architectural Coating Diesel 1 5 6 50 78 0.48(a) Assumes usage of 10 hours per day
Table 4: 2,400 sqft NEW Building (BMCD ID: 19)
Equipment Phase Fuel Type Quantity Days UsedHours of Use/day
Total hours
usedaEngine Rating
(hp) Load Factorb
Foreman / Supervisor Truck All Gasoline 1 113 9 1130 250 0.8Graders Site Preparation Diesel 1 1 8 10 187 0.41Tractors/Loaders/Backhoes Site Preparation Diesel 1 1 8 10 97 0.37Concrete/Industrial Saws Grading Diesel 1 2 8 20 81 0.73Rubber Tired Dozers Grading Diesel 1 2 1 20 247 0.4Tractors/Loaders/Backhoes Grading Diesel 2 2 6 40 97 0.37Cranes Building Construction Diesel 1 100 4 1000 231 0.29Forklifts Building Construction Diesel 2 100 6 2000 89 0.2Tractors/Loaders/Backhoes Building Construction Diesel 2 100 8 2000 97 0.37Cement and Mortar Mixers Paving Diesel 4 5 6 200 9 0.56Pavers Paving Diesel 1 5 7 50 130 0.42Rollers Paving Diesel 1 5 7 50 80 0.38Tractors/Loaders/Backhoes Paving Diesel 1 5 7 50 97 0.37Air Compressors Architectural Coating Diesel 1 5 6 50 78 0.48(a) Assumes usage of 10 hours per day
(b) Load Factors from Appendix A of EPA 420_P-04-005, Median Life, Annual Activity, and Load Factor Values for Nonroad Engine Emissions Modeling, USEPA, EPA 2004
(b) Load Factors from Appendix A of EPA 420_P-04-005, Median Life, Annual Activity, and Load Factor Values for Nonroad Engine Emissions Modeling, USEPA, EPA 2004
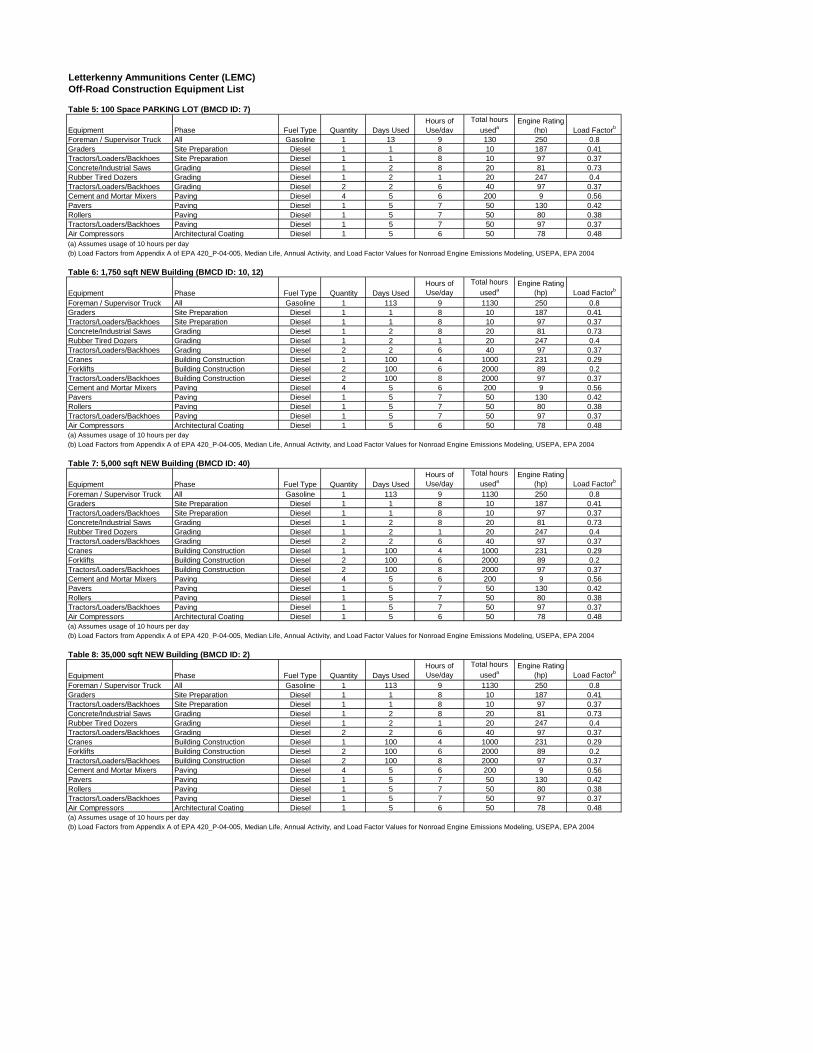
Letterkenny Ammunitions Center (LEMC)Off-Road Construction Equipment List
Table 5: 100 Space PARKING LOT (BMCD ID: 7)
Equipment Phase Fuel Type Quantity Days UsedHours of Use/day
Total hours
usedaEngine Rating
(hp) Load Factorb
Foreman / Supervisor Truck All Gasoline 1 13 9 130 250 0.8Graders Site Preparation Diesel 1 1 8 10 187 0.41Tractors/Loaders/Backhoes Site Preparation Diesel 1 1 8 10 97 0.37Concrete/Industrial Saws Grading Diesel 1 2 8 20 81 0.73Rubber Tired Dozers Grading Diesel 1 2 1 20 247 0.4Tractors/Loaders/Backhoes Grading Diesel 2 2 6 40 97 0.37Cement and Mortar Mixers Paving Diesel 4 5 6 200 9 0.56Pavers Paving Diesel 1 5 7 50 130 0.42Rollers Paving Diesel 1 5 7 50 80 0.38Tractors/Loaders/Backhoes Paving Diesel 1 5 7 50 97 0.37Air Compressors Architectural Coating Diesel 1 5 6 50 78 0.48(a) Assumes usage of 10 hours per day
Table 6: 1,750 sqft NEW Building (BMCD ID: 10, 12)
Equipment Phase Fuel Type Quantity Days UsedHours of Use/day
Total hours
usedaEngine Rating
(hp) Load Factorb
Foreman / Supervisor Truck All Gasoline 1 113 9 1130 250 0.8Graders Site Preparation Diesel 1 1 8 10 187 0.41Tractors/Loaders/Backhoes Site Preparation Diesel 1 1 8 10 97 0.37Concrete/Industrial Saws Grading Diesel 1 2 8 20 81 0.73Rubber Tired Dozers Grading Diesel 1 2 1 20 247 0.4Tractors/Loaders/Backhoes Grading Diesel 2 2 6 40 97 0.37Cranes Building Construction Diesel 1 100 4 1000 231 0.29Forklifts Building Construction Diesel 2 100 6 2000 89 0.2Tractors/Loaders/Backhoes Building Construction Diesel 2 100 8 2000 97 0.37Cement and Mortar Mixers Paving Diesel 4 5 6 200 9 0.56Pavers Paving Diesel 1 5 7 50 130 0.42Rollers Paving Diesel 1 5 7 50 80 0.38Tractors/Loaders/Backhoes Paving Diesel 1 5 7 50 97 0.37Air Compressors Architectural Coating Diesel 1 5 6 50 78 0.48(a) Assumes usage of 10 hours per day
Table 7: 5,000 sqft NEW Building (BMCD ID: 40)
Equipment Phase Fuel Type Quantity Days UsedHours of Use/day
Total hours
usedaEngine Rating
(hp) Load Factorb
Foreman / Supervisor Truck All Gasoline 1 113 9 1130 250 0.8Graders Site Preparation Diesel 1 1 8 10 187 0.41Tractors/Loaders/Backhoes Site Preparation Diesel 1 1 8 10 97 0.37Concrete/Industrial Saws Grading Diesel 1 2 8 20 81 0.73Rubber Tired Dozers Grading Diesel 1 2 1 20 247 0.4Tractors/Loaders/Backhoes Grading Diesel 2 2 6 40 97 0.37Cranes Building Construction Diesel 1 100 4 1000 231 0.29Forklifts Building Construction Diesel 2 100 6 2000 89 0.2Tractors/Loaders/Backhoes Building Construction Diesel 2 100 8 2000 97 0.37Cement and Mortar Mixers Paving Diesel 4 5 6 200 9 0.56Pavers Paving Diesel 1 5 7 50 130 0.42Rollers Paving Diesel 1 5 7 50 80 0.38Tractors/Loaders/Backhoes Paving Diesel 1 5 7 50 97 0.37Air Compressors Architectural Coating Diesel 1 5 6 50 78 0.48(a) Assumes usage of 10 hours per day
Table 8: 35,000 sqft NEW Building (BMCD ID: 2)
Equipment Phase Fuel Type Quantity Days UsedHours of Use/day
Total hours
usedaEngine Rating
(hp) Load Factorb
Foreman / Supervisor Truck All Gasoline 1 113 9 1130 250 0.8Graders Site Preparation Diesel 1 1 8 10 187 0.41Tractors/Loaders/Backhoes Site Preparation Diesel 1 1 8 10 97 0.37Concrete/Industrial Saws Grading Diesel 1 2 8 20 81 0.73Rubber Tired Dozers Grading Diesel 1 2 1 20 247 0.4Tractors/Loaders/Backhoes Grading Diesel 2 2 6 40 97 0.37Cranes Building Construction Diesel 1 100 4 1000 231 0.29Forklifts Building Construction Diesel 2 100 6 2000 89 0.2Tractors/Loaders/Backhoes Building Construction Diesel 2 100 8 2000 97 0.37Cement and Mortar Mixers Paving Diesel 4 5 6 200 9 0.56Pavers Paving Diesel 1 5 7 50 130 0.42Rollers Paving Diesel 1 5 7 50 80 0.38Tractors/Loaders/Backhoes Paving Diesel 1 5 7 50 97 0.37Air Compressors Architectural Coating Diesel 1 5 6 50 78 0.48(a) Assumes usage of 10 hours per day
(b) Load Factors from Appendix A of EPA 420_P-04-005, Median Life, Annual Activity, and Load Factor Values for Nonroad Engine Emissions Modeling, USEPA, EPA 2004
(b) Load Factors from Appendix A of EPA 420_P-04-005, Median Life, Annual Activity, and Load Factor Values for Nonroad Engine Emissions Modeling, USEPA, EPA 2004
(b) Load Factors from Appendix A of EPA 420_P-04-005, Median Life, Annual Activity, and Load Factor Values for Nonroad Engine Emissions Modeling, USEPA, EPA 2004
(b) Load Factors from Appendix A of EPA 420_P-04-005, Median Life, Annual Activity, and Load Factor Values for Nonroad Engine Emissions Modeling, USEPA, EPA 2004
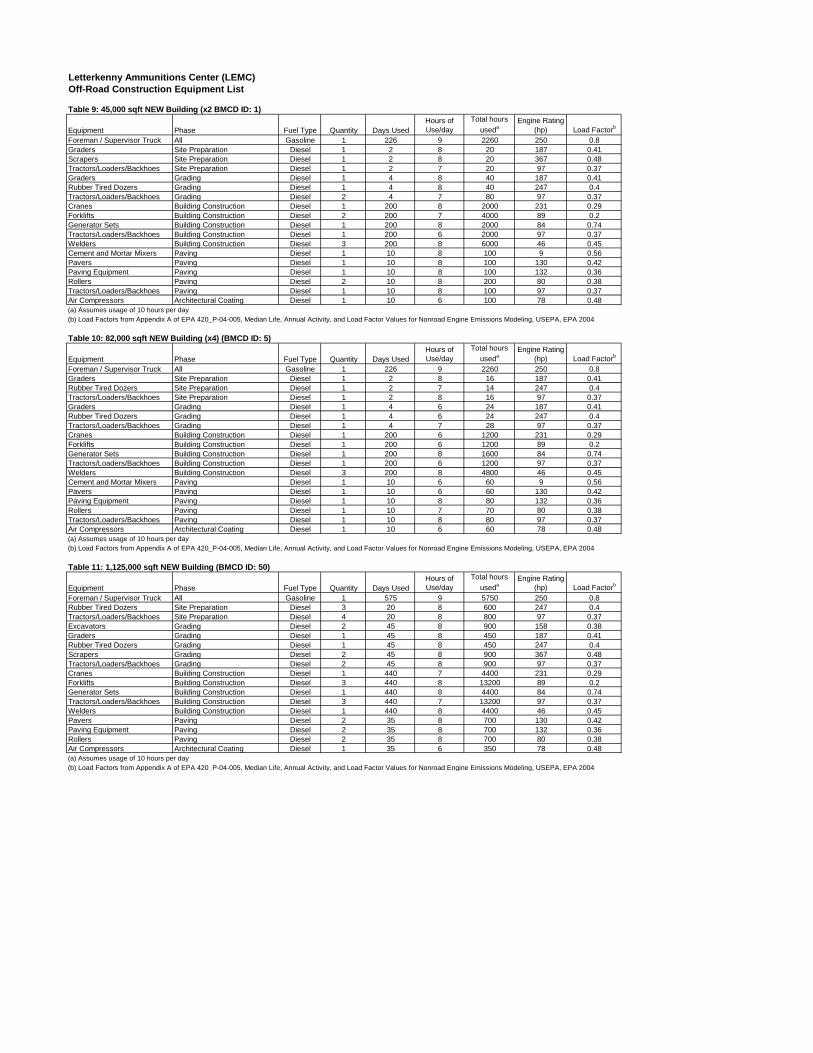
Letterkenny Ammunitions Center (LEMC)Off-Road Construction Equipment List
Table 9: 45,000 sqft NEW Building (x2 BMCD ID: 1)
Equipment Phase Fuel Type Quantity Days UsedHours of Use/day
Total hours
usedaEngine Rating
(hp) Load Factorb
Foreman / Supervisor Truck All Gasoline 1 226 9 2260 250 0.8Graders Site Preparation Diesel 1 2 8 20 187 0.41Scrapers Site Preparation Diesel 1 2 8 20 367 0.48Tractors/Loaders/Backhoes Site Preparation Diesel 1 2 7 20 97 0.37Graders Grading Diesel 1 4 8 40 187 0.41Rubber Tired Dozers Grading Diesel 1 4 8 40 247 0.4Tractors/Loaders/Backhoes Grading Diesel 2 4 7 80 97 0.37Cranes Building Construction Diesel 1 200 8 2000 231 0.29Forklifts Building Construction Diesel 2 200 7 4000 89 0.2Generator Sets Building Construction Diesel 1 200 8 2000 84 0.74Tractors/Loaders/Backhoes Building Construction Diesel 1 200 6 2000 97 0.37Welders Building Construction Diesel 3 200 8 6000 46 0.45Cement and Mortar Mixers Paving Diesel 1 10 8 100 9 0.56Pavers Paving Diesel 1 10 8 100 130 0.42Paving Equipment Paving Diesel 1 10 8 100 132 0.36Rollers Paving Diesel 2 10 8 200 80 0.38Tractors/Loaders/Backhoes Paving Diesel 1 10 8 100 97 0.37Air Compressors Architectural Coating Diesel 1 10 6 100 78 0.48(a) Assumes usage of 10 hours per day
Table 10: 82,000 sqft NEW Building (x4) (BMCD ID: 5)
Equipment Phase Fuel Type Quantity Days UsedHours of Use/day
Total hours
usedaEngine Rating
(hp) Load Factorb
Foreman / Supervisor Truck All Gasoline 1 226 9 2260 250 0.8Graders Site Preparation Diesel 1 2 8 16 187 0.41Rubber Tired Dozers Site Preparation Diesel 1 2 7 14 247 0.4Tractors/Loaders/Backhoes Site Preparation Diesel 1 2 8 16 97 0.37Graders Grading Diesel 1 4 6 24 187 0.41Rubber Tired Dozers Grading Diesel 1 4 6 24 247 0.4Tractors/Loaders/Backhoes Grading Diesel 1 4 7 28 97 0.37Cranes Building Construction Diesel 1 200 6 1200 231 0.29Forklifts Building Construction Diesel 1 200 6 1200 89 0.2Generator Sets Building Construction Diesel 1 200 8 1600 84 0.74Tractors/Loaders/Backhoes Building Construction Diesel 1 200 6 1200 97 0.37Welders Building Construction Diesel 3 200 8 4800 46 0.45Cement and Mortar Mixers Paving Diesel 1 10 6 60 9 0.56Pavers Paving Diesel 1 10 6 60 130 0.42Paving Equipment Paving Diesel 1 10 8 80 132 0.36Rollers Paving Diesel 1 10 7 70 80 0.38Tractors/Loaders/Backhoes Paving Diesel 1 10 8 80 97 0.37Air Compressors Architectural Coating Diesel 1 10 6 60 78 0.48(a) Assumes usage of 10 hours per day
Table 11: 1,125,000 sqft NEW Building (BMCD ID: 50)
Equipment Phase Fuel Type Quantity Days UsedHours of Use/day
Total hours
usedaEngine Rating
(hp) Load Factorb
Foreman / Supervisor Truck All Gasoline 1 575 9 5750 250 0.8Rubber Tired Dozers Site Preparation Diesel 3 20 8 600 247 0.4Tractors/Loaders/Backhoes Site Preparation Diesel 4 20 8 800 97 0.37Excavators Grading Diesel 2 45 8 900 158 0.38Graders Grading Diesel 1 45 8 450 187 0.41Rubber Tired Dozers Grading Diesel 1 45 8 450 247 0.4Scrapers Grading Diesel 2 45 8 900 367 0.48Tractors/Loaders/Backhoes Grading Diesel 2 45 8 900 97 0.37Cranes Building Construction Diesel 1 440 7 4400 231 0.29Forklifts Building Construction Diesel 3 440 8 13200 89 0.2Generator Sets Building Construction Diesel 1 440 8 4400 84 0.74Tractors/Loaders/Backhoes Building Construction Diesel 3 440 7 13200 97 0.37Welders Building Construction Diesel 1 440 8 4400 46 0.45Pavers Paving Diesel 2 35 8 700 130 0.42Paving Equipment Paving Diesel 2 35 8 700 132 0.36Rollers Paving Diesel 2 35 8 700 80 0.38Air Compressors Architectural Coating Diesel 1 35 6 350 78 0.48(a) Assumes usage of 10 hours per day
(b) Load Factors from Appendix A of EPA 420_P-04-005, Median Life, Annual Activity, and Load Factor Values for Nonroad Engine Emissions Modeling, USEPA, EPA 2004
(b) Load Factors from Appendix A of EPA 420_P-04-005, Median Life, Annual Activity, and Load Factor Values for Nonroad Engine Emissions Modeling, USEPA, EPA 2004
(b) Load Factors from Appendix A of EPA 420_P-04-005, Median Life, Annual Activity, and Load Factor Values for Nonroad Engine Emissions Modeling, USEPA, EPA 2004

Letterkenny Ammunitions Center (LEMC)Off-Road Construction Equipment List
Table 12: 2,700 to 22,000 Square foot REPLACEMENT Building (BMCD ID: 39, 41 through 46, 48, 7 total)
Equipment Phase Fuel Type Quantity Days UsedHours of Use/day
Total hours
usedaEngine Rating
(hp) Load Factorb
Foreman / Supervisor Truck All Gasoline 1 113 9 1130 250 0.8Concrete/Industrial Saws Demolition Diesel 1 10 8 100 81 0.73Rubber Tired Dozers Demolition Diesel 1 10 1 100 247 0.4Tractors/Loaders/Backhoes Demolition Diesel 2 10 6 200 97 0.37Graders Site Preparation Diesel 1 1 8 10 187 0.41Tractors/Loaders/Backhoes Site Preparation Diesel 1 1 8 10 97 0.37Concrete/Industrial Saws Grading Diesel 1 2 8 20 81 0.73Rubber Tired Dozers Grading Diesel 1 2 1 20 247 0.4Tractors/Loaders/Backhoes Grading Diesel 2 2 6 40 97 0.37Cranes Building Construction Diesel 1 100 4 1000 231 0.29Forklifts Building Construction Diesel 2 100 6 2000 89 0.2Tractors/Loaders/Backhoes Building Construction Diesel 2 100 8 2000 97 0.37Cement and Mortar Mixers Paving Diesel 4 5 6 200 9 0.56Pavers Paving Diesel 1 5 7 50 130 0.42Rollers Paving Diesel 1 5 7 50 80 0.38Tractors/Loaders/Backhoes Paving Diesel 1 5 7 50 97 0.37Air Compressors Architectural Coating Diesel 1 5 6 50 78 0.48(a) Assumes usage of 10 hours per day
(c) It was determined the CalEEMod generates the same construction equipment list for buidlings ranging from at least 2,700 to 22,000 square feet. As such, one set of outputs will be multiplied by 8.
Table 13: 0.9 Acre PARKING LOT (BMCD ID: 11)
Equipment Phase Fuel Type Quantity Days UsedHours of Use/day
Total hours
usedaEngine Rating
(hp) Load Factorb
Foreman / Supervisor Truck All Gasoline 1 13 9 130 250 0.8Graders Site Preparation Diesel 1 1 8 10 187 0.41Tractors/Loaders/Backhoes Site Preparation Diesel 1 1 8 10 97 0.37Concrete/Industrial Saws Grading Diesel 1 2 8 20 81 0.73Rubber Tired Dozers Grading Diesel 1 2 1 20 247 0.4Tractors/Loaders/Backhoes Grading Diesel 2 2 6 40 97 0.37Cement and Mortar Mixers Paving Diesel 4 5 6 200 9 0.56Pavers Paving Diesel 1 5 7 50 130 0.42Rollers Paving Diesel 1 5 7 50 80 0.38Tractors/Loaders/Backhoes Paving Diesel 1 5 7 50 97 0.37Air Compressors Architectural Coating Diesel 1 5 6 50 78 0.48(a) Assumes usage of 10 hours per day
Table 14: Expand Roadway at Voelz Gate PARKING LOT (BMCD ID: 4)
Equipment Phase Fuel Type Quantity Days UsedHours of Use/day
Total hours
usedaEngine Rating
(hp) Load Factorb
Foreman / Supervisor Truck All Gasoline 1 70 9 700 250 0.8Rubber Tired Dozers Site Preparation Diesel 3 10 8 300 247 0.4
Tractors/Loaders/Backhoes Site Preparation Diesel 4 10 8 400 97 0.37Excavators Grading Diesel 2 20 8 400 158 0.38
Graders Grading Diesel 1 20 8 200 187 0.41Rubber Tired Dozers Grading Diesel 1 20 8 200 247 0.4
Scrapers Grading Diesel 2 20 8 400 367 0.48Tractors/Loaders/Backhoes Grading Diesel 2 20 8 400 97 0.37
Pavers Paving Diesel 2 20 8 400 130 0.42Paving Equipment Paving Diesel 2 20 8 400 132 0.36
Rollers Paving Diesel 2 20 8 400 80 0.38Air Compressors Architectural Coating Diesel 1 20 6 200 78 0.48
Table 15:250 square foot New Building (BMCD ID: 16)
Equipment Phase Fuel Type Quantity Days UsedHours of Use/day
Total hours
usedaEngine Rating
(hp) Load Factorb
Foreman / Supervisor Truck All Gasoline 1 113 9 1017 250 0.8Graders Site Preparation Diesel 1 1 8 8 187 0.41Tractors/Loaders/Backhoes Site Preparation Diesel 1 1 8 8 97 0.37Concrete/Industrial Saws Grading Diesel 1 2 8 16 81 0.73Rubber Tired Dozers Grading Diesel 1 2 1 2 247 0.4Tractors/Loaders/Backhoes Grading Diesel 2 2 6 24 97 0.37Cranes Building Construction Diesel 1 100 4 400 231 0.29Forklifts Building Construction Diesel 2 100 6 1200 89 0.2Tractors/Loaders/Backhoes Building Construction Diesel 2 100 8 1600 97 0.37Cement and Mortar Mixers Paving Diesel 4 5 6 120 9 0.56Pavers Paving Diesel 1 5 7 35 130 0.42Rollers Paving Diesel 1 5 7 35 80 0.38Tractors/Loaders/Backhoes Paving Diesel 1 5 7 35 97 0.37Air Compressors Architectural Coating Diesel 1 5 6 30 78 0.48(a) Assumes usage of 10 hours per day
(b) Load Factors from Appendix A of EPA 420_P-04-005, Median Life, Annual Activity, and Load Factor Values for Nonroad Engine Emissions Modeling, USEPA, EPA 2004
(b) Load Factors from Appendix A of EPA 420_P-04-005, Median Life, Annual Activity, and Load Factor Values for Nonroad Engine Emissions Modeling, USEPA, EPA 2004
(b) Load Factors from Appendix A of EPA 420_P-04-005, Median Life, Annual Activity, and Load Factor Values for Nonroad Engine Emissions Modeling, USEPA, EPA 2004
(b) Load Factors from Appendix A of EPA 420_P-04-005, Median Life, Annual Activity, and Load Factor Values for Nonroad Engine Emissions Modeling, USEPA, EPA 2004

Letterkenny Ammunitions Center (LEMC)Off-Road Construction Equipment List
Table 16: 750 square foot UPGRADED Building (BMCD ID: 17)
Equipment Phase Fuel Type Quantity Days UsedHours of Use/day
Total hours
usedaEngine Rating
(hp) Load Factorb
Foreman / Supervisor Truck All Gasoline 1 120 9 1080 250 0.8Concrete/Industrial Saws Demolition Diesel 1 10 8 80 81 0.73Rubber Tired Dozers Demolition Diesel 1 10 1 10 247 0.4Tractors/Loaders/Backhoes Demolition Diesel 2 10 6 120 97 0.37Cranes Building Construction Diesel 1 100 4 400 231 0.29Forklifts Building Construction Diesel 2 100 6 1200 89 0.2Tractors/Loaders/Backhoes Building Construction Diesel 2 100 8 1600 97 0.37Cement and Mortar Mixers Paving Diesel 4 5 6 120 9 0.56Pavers Paving Diesel 1 5 7 35 130 0.42Rollers Paving Diesel 1 5 7 35 80 0.38Tractors/Loaders/Backhoes Paving Diesel 1 5 7 35 97 0.37Air Compressors Architectural Coating Diesel 1 5 6 30 78 0.48(a) Assumes usage of 10 hours per day
Table 17: 2050 square foot Upgraded Building (x 902 BMCD ID: 38)
Equipment Phase Fuel Type Quantity Days UsedHours of Use/day
Total hours
usedaEngine Rating
(hp) Load Factorb
Foreman / Supervisor Truck All Gasoline 1 120 9 1080 250 0.8Graders Demolition Diesel 1 10 8 80 81 0.73Tractors/Loaders/Backhoes Demolition Diesel 1 10 1 10 247 0.4Tractors/Loaders/Backhoes Demolition Diesel 2 10 6 120 97 0.37Cranes Building Construction Diesel 1 100 4 400 231 0.29Forklifts Building Construction Diesel 2 100 6 1200 89 0.2Tractors/Loaders/Backhoes Building Construction Diesel 2 100 8 1600 97 0.37Cement and Mortar Mixers Paving Diesel 4 5 6 120 9 0.56Pavers Paving Diesel 1 5 7 35 130 0.42Rollers Paving Diesel 1 5 7 35 80 0.38Tractors/Loaders/Backhoes Paving Diesel 1 5 7 35 97 0.37Air Compressors Architectural Coating Diesel 1 5 6 30 78 0.48(a) Assumes usage of 10 hours per day
Table 18: 4400 square foot Upgraded Building (BMCD ID: 28)
Equipment Phase Fuel Type Quantity Days UsedHours of Use/day
Total hours
usedaEngine Rating
(hp) Load Factorb
Foreman / Supervisor Truck All Gasoline 1 120 9 1080 250 0.8Graders Demolition Diesel 1 10 8 80 81 0.73Tractors/Loaders/Backhoes Demolition Diesel 1 10 1 10 247 0.4Tractors/Loaders/Backhoes Demolition Diesel 2 10 6 120 97 0.37Cranes Building Construction Diesel 1 100 4 400 231 0.29Forklifts Building Construction Diesel 2 100 6 1200 89 0.2Tractors/Loaders/Backhoes Building Construction Diesel 2 100 8 1600 97 0.37Cement and Mortar Mixers Paving Diesel 4 5 6 120 9 0.56Pavers Paving Diesel 1 5 7 35 130 0.42Rollers Paving Diesel 1 5 7 35 80 0.38Tractors/Loaders/Backhoes Paving Diesel 1 5 7 35 97 0.37Air Compressors Architectural Coating Diesel 1 5 6 30 78 0.48(a) Assumes usage of 10 hours per day
Table 19: 5878 square foot Upgraded Building (BMCD ID: 34 and 37)
Equipment Phase Fuel Type Quantity Days UsedHours of Use/day
Total hours
usedaEngine Rating
(hp) Load Factorb
Foreman / Supervisor Truck All Gasoline 1 120 9 1080 250 0.8Graders Demolition Diesel 1 10 8 80 81 0.73Tractors/Loaders/Backhoes Demolition Diesel 1 10 1 10 247 0.4Tractors/Loaders/Backhoes Demolition Diesel 2 10 6 120 97 0.37Cranes Building Construction Diesel 1 100 4 400 231 0.29Forklifts Building Construction Diesel 2 100 6 1200 89 0.2Tractors/Loaders/Backhoes Building Construction Diesel 2 100 8 1600 97 0.37Cement and Mortar Mixers Paving Diesel 4 5 6 120 9 0.56Pavers Paving Diesel 1 5 7 35 130 0.42Rollers Paving Diesel 1 5 7 35 80 0.38Tractors/Loaders/Backhoes Paving Diesel 1 5 7 35 97 0.37Air Compressors Architectural Coating Diesel 1 5 6 30 78 0.48(a) Assumes usage of 10 hours per day
(b) Load Factors from Appendix A of EPA 420_P-04-005, Median Life, Annual Activity, and Load Factor Values for Nonroad Engine Emissions Modeling, USEPA, EPA 2004
(b) Load Factors from Appendix A of EPA 420_P-04-005, Median Life, Annual Activity, and Load Factor Values for Nonroad Engine Emissions Modeling, USEPA, EPA 2004
(b) Load Factors from Appendix A of EPA 420_P-04-005, Median Life, Annual Activity, and Load Factor Values for Nonroad Engine Emissions Modeling, USEPA, EPA 2004
(b) Load Factors from Appendix A of EPA 420_P-04-005, Median Life, Annual Activity, and Load Factor Values for Nonroad Engine Emissions Modeling, USEPA, EPA 2004
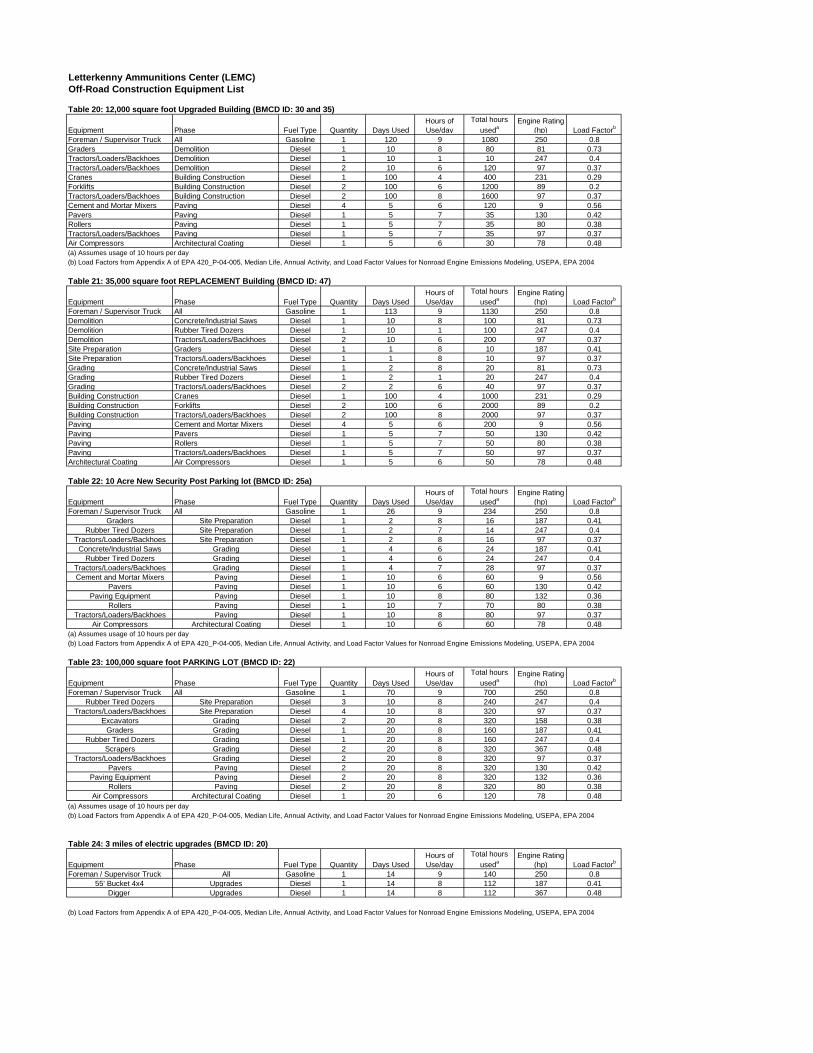
Letterkenny Ammunitions Center (LEMC)Off-Road Construction Equipment List
Table 20: 12,000 square foot Upgraded Building (BMCD ID: 30 and 35)
Equipment Phase Fuel Type Quantity Days UsedHours of Use/day
Total hours
usedaEngine Rating
(hp) Load Factorb
Foreman / Supervisor Truck All Gasoline 1 120 9 1080 250 0.8Graders Demolition Diesel 1 10 8 80 81 0.73Tractors/Loaders/Backhoes Demolition Diesel 1 10 1 10 247 0.4Tractors/Loaders/Backhoes Demolition Diesel 2 10 6 120 97 0.37Cranes Building Construction Diesel 1 100 4 400 231 0.29Forklifts Building Construction Diesel 2 100 6 1200 89 0.2Tractors/Loaders/Backhoes Building Construction Diesel 2 100 8 1600 97 0.37Cement and Mortar Mixers Paving Diesel 4 5 6 120 9 0.56Pavers Paving Diesel 1 5 7 35 130 0.42Rollers Paving Diesel 1 5 7 35 80 0.38Tractors/Loaders/Backhoes Paving Diesel 1 5 7 35 97 0.37Air Compressors Architectural Coating Diesel 1 5 6 30 78 0.48(a) Assumes usage of 10 hours per day
Table 21: 35,000 square foot REPLACEMENT Building (BMCD ID: 47)
Equipment Phase Fuel Type Quantity Days UsedHours of Use/day
Total hours
usedaEngine Rating
(hp) Load Factorb
Foreman / Supervisor Truck All Gasoline 1 113 9 1130 250 0.8Demolition Concrete/Industrial Saws Diesel 1 10 8 100 81 0.73Demolition Rubber Tired Dozers Diesel 1 10 1 100 247 0.4Demolition Tractors/Loaders/Backhoes Diesel 2 10 6 200 97 0.37Site Preparation Graders Diesel 1 1 8 10 187 0.41Site Preparation Tractors/Loaders/Backhoes Diesel 1 1 8 10 97 0.37Grading Concrete/Industrial Saws Diesel 1 2 8 20 81 0.73Grading Rubber Tired Dozers Diesel 1 2 1 20 247 0.4Grading Tractors/Loaders/Backhoes Diesel 2 2 6 40 97 0.37Building Construction Cranes Diesel 1 100 4 1000 231 0.29Building Construction Forklifts Diesel 2 100 6 2000 89 0.2Building Construction Tractors/Loaders/Backhoes Diesel 2 100 8 2000 97 0.37Paving Cement and Mortar Mixers Diesel 4 5 6 200 9 0.56Paving Pavers Diesel 1 5 7 50 130 0.42Paving Rollers Diesel 1 5 7 50 80 0.38Paving Tractors/Loaders/Backhoes Diesel 1 5 7 50 97 0.37Architectural Coating Air Compressors Diesel 1 5 6 50 78 0.48
Table 22: 10 Acre New Security Post Parking lot (BMCD ID: 25a)
Equipment Phase Fuel Type Quantity Days UsedHours of Use/day
Total hours
usedaEngine Rating
(hp) Load Factorb
Foreman / Supervisor Truck All Gasoline 1 26 9 234 250 0.8Graders Site Preparation Diesel 1 2 8 16 187 0.41
Rubber Tired Dozers Site Preparation Diesel 1 2 7 14 247 0.4Tractors/Loaders/Backhoes Site Preparation Diesel 1 2 8 16 97 0.37
Concrete/Industrial Saws Grading Diesel 1 4 6 24 187 0.41Rubber Tired Dozers Grading Diesel 1 4 6 24 247 0.4
Tractors/Loaders/Backhoes Grading Diesel 1 4 7 28 97 0.37Cement and Mortar Mixers Paving Diesel 1 10 6 60 9 0.56
Pavers Paving Diesel 1 10 6 60 130 0.42Paving Equipment Paving Diesel 1 10 8 80 132 0.36
Rollers Paving Diesel 1 10 7 70 80 0.38Tractors/Loaders/Backhoes Paving Diesel 1 10 8 80 97 0.37
Air Compressors Architectural Coating Diesel 1 10 6 60 78 0.48(a) Assumes usage of 10 hours per day
Table 23: 100,000 square foot PARKING LOT (BMCD ID: 22)
Equipment Phase Fuel Type Quantity Days UsedHours of Use/day
Total hours
usedaEngine Rating
(hp) Load Factorb
Foreman / Supervisor Truck All Gasoline 1 70 9 700 250 0.8Rubber Tired Dozers Site Preparation Diesel 3 10 8 240 247 0.4
Tractors/Loaders/Backhoes Site Preparation Diesel 4 10 8 320 97 0.37Excavators Grading Diesel 2 20 8 320 158 0.38
Graders Grading Diesel 1 20 8 160 187 0.41Rubber Tired Dozers Grading Diesel 1 20 8 160 247 0.4
Scrapers Grading Diesel 2 20 8 320 367 0.48Tractors/Loaders/Backhoes Grading Diesel 2 20 8 320 97 0.37
Pavers Paving Diesel 2 20 8 320 130 0.42Paving Equipment Paving Diesel 2 20 8 320 132 0.36
Rollers Paving Diesel 2 20 8 320 80 0.38Air Compressors Architectural Coating Diesel 1 20 6 120 78 0.48
(a) Assumes usage of 10 hours per day
Table 24: 3 miles of electric upgrades (BMCD ID: 20)
Equipment Phase Fuel Type Quantity Days UsedHours of Use/day
Total hours
usedaEngine Rating
(hp) Load Factorb
Foreman / Supervisor Truck All Gasoline 1 14 9 140 250 0.855' Bucket 4x4 Upgrades Diesel 1 14 8 112 187 0.41
Digger Upgrades Diesel 1 14 8 112 367 0.48
(b) Load Factors from Appendix A of EPA 420_P-04-005, Median Life, Annual Activity, and Load Factor Values for Nonroad Engine Emissions Modeling, USEPA, EPA 2004
(b) Load Factors from Appendix A of EPA 420_P-04-005, Median Life, Annual Activity, and Load Factor Values for Nonroad Engine Emissions Modeling, USEPA, EPA 2004
(b) Load Factors from Appendix A of EPA 420_P-04-005, Median Life, Annual Activity, and Load Factor Values for Nonroad Engine Emissions Modeling, USEPA, EPA 2004
(b) Load Factors from Appendix A of EPA 420_P-04-005, Median Life, Annual Activity, and Load Factor Values for Nonroad Engine Emissions Modeling, USEPA, EPA 2004

Letterkenny Ammunitions Center (LEMC)Off-Road Construction Equipment List
Table 25: 22 miles of RAIL network (BMCD ID: 3)
Equipment Phase Fuel Type Quantity Days UsedHours of Use/day
Total hours
usedaEngine Rating
(hp) Load Factorb
Foreman / Supervisor Truck All Gasoline 1 505 9 5050 250 0.8Concrete/Industrial Saws Demolition Diesel 1 30 8 240 81 0.73
Excavators Demolition Diesel 3 30 8 720 158 0.38Rubber Tired Dozers Demolition Diesel 2 30 8 480 247 0.4Rubber Tired Dozers Site Preparation Diesel 3 20 8 480 247 0.4
Tractors/Loaders/Backhoes Site Preparation Diesel 4 20 8 640 97 0.37Excavators Grading Diesel 2 45 8 720 158 0.38
Graders Grading Diesel 1 45 8 360 187 0.41Rubber Tired Dozers Grading Diesel 1 45 8 360 247 0.4
Scrapers Grading Diesel 2 45 8 720 367 0.48Tractors/Loaders/Backhoes Grading Diesel 2 45 8 720 97 0.37
Cranes Building Construction Diesel 1 440 7 3080 231 0.29Forklifts Building Construction Diesel 3 440 8 10560 89 0.2
Generator Sets Building Construction Diesel 1 440 8 3520 84 0.74Tractors/Loaders/Backhoes Building Construction Diesel 3 440 7 9240 97 0.37
Welders Building Construction Diesel 1 440 8 3520 46 0.45
Table 26: 10 acre RAIL classification yard (BMCD ID: 6)
Equipment Phase Fuel Type Quantity Days UsedHours of Use/day
Total hours
usedaEngine Rating
(hp) Load Factorb
Foreman / Supervisor Truck All Gasoline 1 300 9 3000 250 0.8Rubber Tired Dozers Site Preparation Diesel 3 10 8 240 247 0.4
Tractors/Loaders/Backhoes Site Preparation Diesel 4 10 8 320 97 0.37Excavators Grading Diesel 2 20 8 320 158 0.38
Graders Grading Diesel 1 20 8 160 187 0.41Rubber Tired Dozers Grading Diesel 1 20 8 160 247 0.4
Scrapers Grading Diesel 2 20 8 320 367 0.48Tractors/Loaders/Backhoes Grading Diesel 2 20 8 320 97 0.37
Cranes Building Construction Diesel 1 230 7 1610 231 0.29Forklifts Building Construction Diesel 3 230 8 5520 89 0.2
Generator Sets Building Construction Diesel 1 230 8 1840 84 0.74Tractors/Loaders/Backhoes Building Construction Diesel 3 230 7 4830 97 0.37
Welders Building Construction Diesel 1 230 8 1840 46 0.45Pavers Paving Diesel 2 20 8 320 130 0.42
Paving Equipment Paving Diesel 2 20 8 320 132 0.36Rollers Paving Diesel 2 20 8 320 80 0.38
Air Compressors Architectural Coating Diesel 1 20 6 120 78 0.48
Table 27: Restoration of 4 miles of RAIL (BMCD ID: 18)
Equipment Phase Fuel Type Quantity Days UsedHours of Use/day
Total hours
usedaEngine Rating
(hp) Load Factorb
Foreman / Supervisor Truck All Gasoline 1 278 9 2780 250 0.8Concrete/Industrial Saws Demolition Diesel 1 20 8 160 81 0.73
Excavators Demolition Diesel 3 20 8 480 158 0.38Rubber Tired Dozers Demolition Diesel 2 20 8 320 247 0.4Rubber Tired Dozers Site Preparation Diesel 3 5 8 120 247 0.4
Tractors/Loaders/Backhoes Site Preparation Diesel 4 5 8 160 97 0.37Excavators Grading Diesel 1 8 8 64 158 0.38
Graders Grading Diesel 1 8 8 64 187 0.41Rubber Tired Dozers Grading Diesel 1 8 8 64 247 0.4
Tractors/Loaders/Backhoes Grading Diesel 3 8 8 192 97 0.37Cranes Building Construction Diesel 1 230 7 1610 231 0.29Forklifts Building Construction Diesel 3 230 8 5520 89 0.2
Generator Sets Building Construction Diesel 1 230 8 1840 84 0.74Tractors/Loaders/Backhoes Building Construction Diesel 3 230 7 4830 97 0.37
Welders Building Construction Diesel 1 230 8 1840 46 0.45
Table 28: Repair 11 miles of asphalt ROADS (BMCD ID: 23)
Equipment Phase Fuel Type Quantity Days UsedHours of Use/day
Total hours
usedaEngine Rating
(hp) Load Factorb
Foreman / Supervisor Truck All Gasoline 1 120 9 1200 250 0.8Concrete/Industrial Saws Demolition Diesel 1 30 8 240 81 0.73
Excavators Demolition Diesel 3 30 8 720 158 0.38Rubber Tired Dozers Demolition Diesel 2 30 8 480 247 0.4Rubber Tired Dozers Site Preparation Diesel 3 20 8 480 247 0.4
Tractors/Loaders/Backhoes Site Preparation Diesel 4 20 8 640 97 0.37Pavers Paving Diesel 2 35 8 560 130 0.42
Paving Equipment Paving Diesel 2 35 8 560 132 0.36Rollers Paving Diesel 2 35 8 560 80 0.38
Air Compressors Architectural Coating Diesel 1 35 6 210 78 0.48
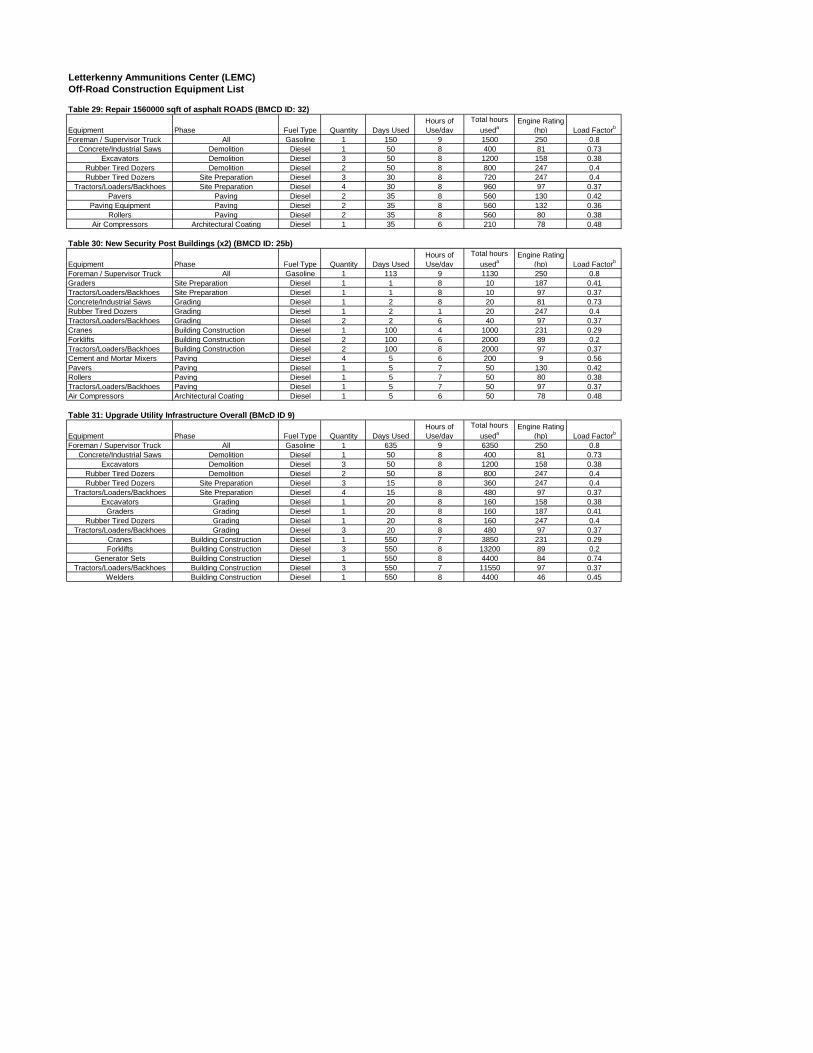
Letterkenny Ammunitions Center (LEMC)Off-Road Construction Equipment List
Table 29: Repair 1560000 sqft of asphalt ROADS (BMCD ID: 32)
Equipment Phase Fuel Type Quantity Days UsedHours of Use/day
Total hours
usedaEngine Rating
(hp) Load Factorb
Foreman / Supervisor Truck All Gasoline 1 150 9 1500 250 0.8Concrete/Industrial Saws Demolition Diesel 1 50 8 400 81 0.73
Excavators Demolition Diesel 3 50 8 1200 158 0.38Rubber Tired Dozers Demolition Diesel 2 50 8 800 247 0.4Rubber Tired Dozers Site Preparation Diesel 3 30 8 720 247 0.4
Tractors/Loaders/Backhoes Site Preparation Diesel 4 30 8 960 97 0.37Pavers Paving Diesel 2 35 8 560 130 0.42
Paving Equipment Paving Diesel 2 35 8 560 132 0.36Rollers Paving Diesel 2 35 8 560 80 0.38
Air Compressors Architectural Coating Diesel 1 35 6 210 78 0.48
Table 30: New Security Post Buildings (x2) (BMCD ID: 25b)
Equipment Phase Fuel Type Quantity Days UsedHours of Use/day
Total hours
usedaEngine Rating
(hp) Load Factorb
Foreman / Supervisor Truck All Gasoline 1 113 9 1130 250 0.8Graders Site Preparation Diesel 1 1 8 10 187 0.41Tractors/Loaders/Backhoes Site Preparation Diesel 1 1 8 10 97 0.37Concrete/Industrial Saws Grading Diesel 1 2 8 20 81 0.73Rubber Tired Dozers Grading Diesel 1 2 1 20 247 0.4Tractors/Loaders/Backhoes Grading Diesel 2 2 6 40 97 0.37Cranes Building Construction Diesel 1 100 4 1000 231 0.29Forklifts Building Construction Diesel 2 100 6 2000 89 0.2Tractors/Loaders/Backhoes Building Construction Diesel 2 100 8 2000 97 0.37Cement and Mortar Mixers Paving Diesel 4 5 6 200 9 0.56Pavers Paving Diesel 1 5 7 50 130 0.42Rollers Paving Diesel 1 5 7 50 80 0.38Tractors/Loaders/Backhoes Paving Diesel 1 5 7 50 97 0.37Air Compressors Architectural Coating Diesel 1 5 6 50 78 0.48
Table 31: Upgrade Utility Infrastructure Overall (BMcD ID 9)
Equipment Phase Fuel Type Quantity Days UsedHours of Use/day
Total hours
usedaEngine Rating
(hp) Load Factorb
Foreman / Supervisor Truck All Gasoline 1 635 9 6350 250 0.8Concrete/Industrial Saws Demolition Diesel 1 50 8 400 81 0.73
Excavators Demolition Diesel 3 50 8 1200 158 0.38Rubber Tired Dozers Demolition Diesel 2 50 8 800 247 0.4Rubber Tired Dozers Site Preparation Diesel 3 15 8 360 247 0.4
Tractors/Loaders/Backhoes Site Preparation Diesel 4 15 8 480 97 0.37Excavators Grading Diesel 1 20 8 160 158 0.38
Graders Grading Diesel 1 20 8 160 187 0.41Rubber Tired Dozers Grading Diesel 1 20 8 160 247 0.4
Tractors/Loaders/Backhoes Grading Diesel 3 20 8 480 97 0.37Cranes Building Construction Diesel 1 550 7 3850 231 0.29Forklifts Building Construction Diesel 3 550 8 13200 89 0.2
Generator Sets Building Construction Diesel 1 550 8 4400 84 0.74Tractors/Loaders/Backhoes Building Construction Diesel 3 550 7 11550 97 0.37
Welders Building Construction Diesel 1 550 8 4400 46 0.45

Letterkenny Ammunitions Center (LEMC)Criteria & GHG Pollutant Emissions - Construction Equipment
Table 1: 10,000 Square foot NEW Building (BMCD ID: 8, 13, 15, 21, 24, 27, 29, 31, 33, and 36)
NOx CO VOC SO2 PM10 PM2.5 CO2 CH4 N2O CO2 CH4 N2O NOx CO VOC SO2 PM10 PM2.5 CO2 CH4 N2O CO2e
Foreman / Supervisor Truck 1,017 Gasoline 250 200.00 1130.00 0.309 4.925 0.158 0.005 0.013 0.013 g/mile
Updated Emission Factors of Air Pollutants from Vehicle Operations in GREET Using MOVES - Table A4 - Model
year 2017 70.22 3.00E-03 6.00E-04 491.54 2.10E-02 4.20E-03 0.39 6.24 0.20 0.01 0.02 0.02 110.21 4.71E-03 9.42E-04 110.61Graders 8 Diesel 187 76.67 * D302 7.08 4.69 1.77 0.93 0.27 0.27 g/hp-hr 73.96 3.00E-03 6.00E-04 517.72 2.10E-02 4.20E-03 0.00 0.00 1.20E-03 6.29E-04 1.81E-04 1.81E-04 0.35 1.42E-05 2.84E-06 0.35Tractors/Loaders/Backhoes 8 Diesel 97 35.89 D101 8.05 6.71 2.01 0.93 0.54 0.54 g/hp-hr 73.96 3.00E-03 6.00E-04 517.72 2.10E-02 4.20E-03 0.00 0.00 6.37E-04 2.94E-04 1.70E-04 1.70E-04 0.16 6.65E-06 1.33E-06 0.16Concrete/Industrial Saws 16 Diesel 81 59.13 D101 8.05 6.71 2.01 0.93 0.54 0.54 g/hp-hr 73.96 3.00E-03 6.00E-04 517.72 2.10E-02 4.20E-03 0.01 0.01 2.10E-03 9.70E-04 5.59E-04 5.59E-04 0.54 2.19E-05 4.38E-06 0.54Rubber Tired Dozers 2 Diesel 247 98.80 D302 7.08 4.69 1.77 0.93 0.27 0.27 g/hp-hr 73.96 3.00E-03 6.00E-04 517.72 2.10E-02 4.20E-03 0.00 0.00 3.86E-04 2.03E-04 5.84E-05 5.84E-05 0.11 4.57E-06 9.15E-07 0.11
Tractors/Loaders/Backhoes 24 Diesel 97 35.89 D101 8.05 6.71 2.01 0.93 0.54 0.54 g/hp-hr 73.96 3.00E-03 6.00E-04 517.72 2.10E-02 4.20E-03 0.01 0.01 1.91E-03 8.83E-04 5.09E-04 5.09E-04 0.49 1.99E-05 3.99E-06 0.49Cranes 400 Diesel 231 66.99 D603 6.87 4.69 1.72 0.93 0.27 0.27 g/hp-hr 73.96 3.00E-03 6.00E-04 517.72 2.10E-02 4.20E-03 0.20 0.14 5.07E-02 2.75E-02 7.92E-03 7.92E-03 15.29 6.20E-04 1.24E-04 15.34Forklifts 1,200 Diesel 89 17.80 D101 8.05 6.71 2.01 0.93 0.54 0.54 g/hp-hr 73.96 3.00E-03 6.00E-04 517.72 2.10E-02 4.20E-03 0.19 0.16 4.74E-02 2.19E-02 1.26E-02 1.26E-02 12.19 4.94E-04 9.89E-05 12.23Tractors/Loaders/Backhoes 1,600 Diesel 97 35.89 D101 8.05 6.71 2.01 0.93 0.54 0.54 g/hp-hr 73.96 3.00E-03 6.00E-04 517.72 2.10E-02 4.20E-03 0.51 0.42 1.27E-01 5.89E-02 3.40E-02 3.40E-02 32.77 1.33E-03 2.66E-04 32.88Cement and Mortar Mixers 120 Diesel 9 5.04 D11 8.05 10.73 2.01 0.93 1.07 1.07 g/hp-hr 73.96 3.00E-03 6.00E-04 517.72 2.10E-02 4.20E-03 0.01 0.01 1.34E-03 6.20E-04 7.15E-04 7.15E-04 0.35 1.40E-05 2.80E-06 0.35Pavers 35 Diesel 130 54.60 D174 7.08 6.71 1.77 0.93 0.40 0.40 g/hp-hr 73.96 3.00E-03 6.00E-04 517.72 2.10E-02 4.20E-03 0.01 0.01 3.73E-03 1.96E-03 8.47E-04 8.47E-04 1.09 4.42E-05 8.85E-06 1.09Rollers 35 Diesel 80 30.40 D101 8.05 6.71 2.01 0.93 0.54 0.54 g/hp-hr 73.96 3.00E-03 6.00E-04 517.72 2.10E-02 4.20E-03 0.01 0.01 2.36E-03 1.09E-03 6.29E-04 6.29E-04 0.61 2.46E-05 4.93E-06 0.61Tractors/Loaders/Backhoes 35 Diesel 97 35.89 D101 8.05 6.71 2.01 0.93 0.54 0.54 g/hp-hr 73.96 3.00E-03 6.00E-04 517.72 2.10E-02 4.20E-03 0.01 0.01 2.79E-03 1.29E-03 7.43E-04 7.43E-04 0.72 2.91E-05 5.82E-06 0.72Air Compressors 30 Diesel 78 37.44 D101 8.05 6.71 2.01 0.93 0.54 0.54 g/hp-hr 73.96 3.00E-03 6.00E-04 517.72 2.10E-02 4.20E-03 0.01 0.01 2.49E-03 1.15E-03 6.64E-04 6.64E-04 0.64 2.60E-05 5.20E-06 0.64
Total 1.37 7.03 0.44 0.12 0.08 0.08 175.52 7.36E-03 1.47E-03 176.14(a) Equipment usage based on construction schedule
(d) Greenhouse gas emissions from 40 CFR 98; conversion of 7000 Btu/hp-hr is assumed(e) Global warming potentials: CO2 = 1; CH4 = 25; N2O = 298 (Table A-1 to Subpart A of 40 CFR 98)
Table 2: 4,000 square foot NEW building (BMCD ID: 14)
NOx CO VOC SO2 PM10 PM2.5 CO2 CH4 N2O CO2 CH4 N2O NOx CO VOC SO2 PM10 PM2.5 CO2 CH4 N2O CO2e
Foreman / Supervisor Truck 1,130 Gasoline 250 200 1130.00 0.309 4.925 0.158 0.005 0.013 0.013 g/mile
Updated Emission Factors of Air Pollutants from Vehicle Operations in GREET Using MOVES - Table A4 - Model
year 2017 70.22 3.00E-03 6.00E-04 491.54 2.10E-02 4.20E-03 0.44 6.93 0.22 0.01 0.02 0.02 122.45 5.23E-03 1.05E-03 122.90Graders 8 Diesel 187 77 D302 7.08 4.69 1.77 0.93 0.27 0.27 g/hp-hr 73.96 3.00E-03 6.00E-04 517.72 2.10E-02 4.20E-03 0.00 0.00 1.20E-03 6.29E-04 1.81E-04 1.81E-04 0.35 1.42E-05 2.84E-06 0.35Tractors/Loaders/Backhoes 8 Diesel 97 36 D101 8.05 6.71 2.01 0.93 0.54 0.54 g/hp-hr 73.96 3.00E-03 6.00E-04 517.72 2.10E-02 4.20E-03 0.00 0.00 6.37E-04 2.94E-04 1.70E-04 1.70E-04 0.16 6.65E-06 1.33E-06 0.16Concrete/Industrial Saws 16 Diesel 81 59 D101 8.05 6.71 2.01 0.93 0.54 0.54 g/hp-hr 73.96 3.00E-03 6.00E-04 517.72 2.10E-02 4.20E-03 0.01 0.01 2.10E-03 9.70E-04 5.59E-04 5.59E-04 0.54 2.19E-05 4.38E-06 0.54Rubber Tired Dozers 2 Diesel 247 99 D302 7.08 4.69 1.77 0.93 0.27 0.27 g/hp-hr 73.96 3.00E-03 6.00E-04 517.72 2.10E-02 4.20E-03 0.00 0.00 3.86E-04 2.03E-04 5.84E-05 5.84E-05 0.11 4.57E-06 9.15E-07 0.11Tractors/Loaders/Backhoes 24 Diesel 97 36 D101 8.05 6.71 2.01 0.93 0.54 0.54 g/hp-hr 73.96 3.00E-03 6.00E-04 517.72 2.10E-02 4.20E-03 0.01 0.01 1.91E-03 8.83E-04 5.09E-04 5.09E-04 0.49 1.99E-05 3.99E-06 0.49Cranes 400 Diesel 231 67 D603 6.87 4.69 1.72 0.93 0.27 0.27 g/hp-hr 73.96 3.00E-03 6.00E-04 517.72 2.10E-02 4.20E-03 0.20 0.14 5.07E-02 2.75E-02 7.92E-03 7.92E-03 15.29 6.20E-04 1.24E-04 15.34Forklifts 1,200 Diesel 89 18 D101 8.05 6.71 2.01 0.93 0.54 0.54 g/hp-hr 73.96 3.00E-03 6.00E-04 517.72 2.10E-02 4.20E-03 0.19 0.16 4.74E-02 2.19E-02 1.26E-02 1.26E-02 12.19 4.94E-04 9.89E-05 12.23Tractors/Loaders/Backhoes 1,600 Diesel 97 36 D101 8.05 6.71 2.01 0.93 0.54 0.54 g/hp-hr 73.96 3.00E-03 6.00E-04 517.72 2.10E-02 4.20E-03 0.51 0.42 1.27E-01 5.89E-02 3.40E-02 3.40E-02 32.77 1.33E-03 2.66E-04 32.88Cement and Mortar Mixers 120 Diesel 9 5 D11 8.05 10.73 2.01 0.93 1.07 1.07 g/hp-hr 73.96 3.00E-03 6.00E-04 517.72 2.10E-02 4.20E-03 0.01 0.01 1.34E-03 6.20E-04 7.15E-04 7.15E-04 0.35 1.40E-05 2.80E-06 0.35Pavers 35 Diesel 130 55 D174 7.08 6.71 1.77 0.93 0.40 0.40 g/hp-hr 73.96 3.00E-03 6.00E-04 517.72 2.10E-02 4.20E-03 0.01 0.01 3.73E-03 1.96E-03 8.47E-04 8.47E-04 1.09 4.42E-05 8.85E-06 1.09Rollers 35 Diesel 80 30 D101 8.05 6.71 2.01 0.93 0.54 0.54 g/hp-hr 73.96 3.00E-03 6.00E-04 517.72 2.10E-02 4.20E-03 0.01 0.01 2.36E-03 1.09E-03 6.29E-04 6.29E-04 0.61 2.46E-05 4.93E-06 0.61Tractors/Loaders/Backhoes 35 Diesel 97 36 D101 8.05 6.71 2.01 0.93 0.54 0.54 g/hp-hr 73.96 3.00E-03 6.00E-04 517.72 2.10E-02 4.20E-03 0.01 0.01 2.79E-03 1.29E-03 7.43E-04 7.43E-04 0.72 2.91E-05 5.82E-06 0.72Air Compressors 30 Diesel 78 37 D101 8.05 6.71 2.01 0.93 0.54 0.54 g/hp-hr 73.96 3.00E-03 6.00E-04 517.72 2.10E-02 4.20E-03 0.01 0.01 2.49E-03 1.15E-03 6.64E-04 6.64E-04 0.64 2.60E-05 5.20E-06 0.64
Total 1.41 7.72 0.47 0.12 0.08 0.08 187.77 7.88E-03 1.58E-03 188.43(a) Equipment usage based on construction schedule
(d) Greenhouse gas emissions from 40 CFR 98; conversion of 7000 Btu/hp-hr is assumed(e) Global warming potentials: CO2 = 1; CH4 = 25; N2O = 298 (Table A-1 to Subpart A of 40 CFR 98)
Table 3: 2,700 sqft NEW Building (BMcD ID: 26)
NOx CO VOC SO2 PM10 PM2.5 CO2 CH4 N2O CO2 CH4 N2O NOx CO VOC SO2 PM10 PM2.5 CO2 CH4 N2O CO2e
Foreman / Supervisor Truck 1,130 Gasoline 250 200.00 1130.00 0.309 4.925 0.158 0.005 0.013 0.013 g/mile
Updated Emission Factors of Air Pollutants from Vehicle Operations in GREET Using MOVES - Table A4 - Model
year 2017 70.22 3.00E-03 6.00E-04 491.54 2.10E-02 4.20E-03 0.44 6.93 0.22 0.01 0.02 0.02 122.45 5.23E-03 1.05E-03 122.90Graders 10 Diesel 187 76.67 D302 7.08 4.69 1.77 0.93 0.27 0.27 g/hp-hr 73.96 3.00E-03 6.00E-04 517.72 2.10E-02 4.20E-03 0.01 0.00 1.50E-03 7.86E-04 2.27E-04 2.27E-04 0.44 1.77E-05 3.55E-06 0.44Tractors/Loaders/Backhoes 10 Diesel 97 35.89 D101 8.05 6.71 2.01 0.93 0.54 0.54 g/hp-hr 73.96 3.00E-03 6.00E-04 517.72 2.10E-02 4.20E-03 0.00 0.00 7.96E-04 3.68E-04 2.12E-04 2.12E-04 0.20 8.31E-06 1.66E-06 0.21Concrete/Industrial Saws 20 Diesel 81 59.13 D101 8.05 6.71 2.01 0.93 0.54 0.54 g/hp-hr 73.96 3.00E-03 6.00E-04 517.72 2.10E-02 4.20E-03 0.01 0.01 2.62E-03 1.21E-03 6.99E-04 6.99E-04 0.67 2.74E-05 5.48E-06 0.68Rubber Tired Dozers 20 Diesel 247 98.80 D302 7.08 4.69 1.77 0.93 0.27 0.27 g/hp-hr 73.96 3.00E-03 6.00E-04 517.72 2.10E-02 4.20E-03 0.02 0.01 3.86E-03 2.03E-03 5.84E-04 5.84E-04 1.13 4.57E-05 9.15E-06 1.13Tractors/Loaders/Backhoes 40 Diesel 97 35.89 D101 8.05 6.71 2.01 0.93 0.54 0.54 g/hp-hr 73.96 3.00E-03 6.00E-04 517.72 2.10E-02 4.20E-03 0.01 0.01 3.18E-03 1.47E-03 8.49E-04 8.49E-04 0.82 3.32E-05 6.65E-06 0.82Cranes 1,000 Diesel 231 66.99 D603 6.87 4.69 1.72 0.93 0.27 0.27 g/hp-hr 73.96 3.00E-03 6.00E-04 517.72 2.10E-02 4.20E-03 0.51 0.35 1.27E-01 6.87E-02 1.98E-02 1.98E-02 38.23 1.55E-03 3.10E-04 38.36Forklifts 2,000 Diesel 89 17.80 D101 8.05 6.71 2.01 0.93 0.54 0.54 g/hp-hr 73.96 3.00E-03 6.00E-04 517.72 2.10E-02 4.20E-03 0.32 0.26 7.89E-02 3.65E-02 2.10E-02 2.10E-02 20.32 8.24E-04 1.65E-04 20.39Tractors/Loaders/Backhoes 2,000 Diesel 97 35.89 D101 8.05 6.71 2.01 0.93 0.54 0.54 g/hp-hr 73.96 3.00E-03 6.00E-04 517.72 2.10E-02 4.20E-03 0.64 0.53 1.59E-01 7.36E-02 4.24E-02 4.24E-02 40.96 1.66E-03 3.32E-04 41.10Cement and Mortar Mixers 200 Diesel 9 5.04 D11 8.05 10.73 2.01 0.93 1.07 1.07 g/hp-hr 73.96 3.00E-03 6.00E-04 517.72 2.10E-02 4.20E-03 0.01 0.01 2.24E-03 1.03E-03 1.19E-03 1.19E-03 0.58 2.33E-05 4.67E-06 0.58Pavers 50 Diesel 130 54.60 D174 7.08 6.71 1.77 0.93 0.40 0.40 g/hp-hr 73.96 3.00E-03 6.00E-04 517.72 2.10E-02 4.20E-03 0.02 0.02 5.33E-03 2.80E-03 1.21E-03 1.21E-03 1.56 6.32E-05 1.26E-05 1.56Rollers 50 Diesel 80 30.40 D101 8.05 6.71 2.01 0.93 0.54 0.54 g/hp-hr 73.96 3.00E-03 6.00E-04 517.72 2.10E-02 4.20E-03 0.01 0.01 3.37E-03 1.56E-03 8.99E-04 8.99E-04 0.87 3.52E-05 7.04E-06 0.87Tractors/Loaders/Backhoes 50 Diesel 97 35.89 D101 8.05 6.71 2.01 0.93 0.54 0.54 g/hp-hr 73.96 3.00E-03 6.00E-04 517.72 2.10E-02 4.20E-03 0.02 0.01 3.98E-03 1.84E-03 1.06E-03 1.06E-03 1.02 4.15E-05 8.31E-06 1.03Air Compressors 50 Diesel 78 37.44 D101 8.05 6.71 2.01 0.93 0.54 0.54 g/hp-hr 73.96 3.00E-03 6.00E-04 517.72 2.10E-02 4.20E-03 0.02 0.01 4.15E-03 1.92E-03 1.11E-03 1.11E-03 1.07 4.33E-05 8.67E-06 1.07
Total 2.02 8.18 0.62 0.20 0.11 0.11 230.32 9.61E-03 1.92E-03 231.13(a) Equipment usage based on construction schedule
(d) Greenhouse gas emissions from 40 CFR 98; conversion of 7000 Btu/hp-hr is assumed(e) Global warming potentials: CO2 = 1; CH4 = 25; N2O = 298 (Table A-1 to Subpart A of 40 CFR 98)
Criteria Emissions (tons per year)
Criteria Emissions (tons per year)
Criteria Emissions (tons per year)
GHG Emissions (tons per year)e
40 CFR 89.112, Tier 2
Equipment
Equipment
Usage (Hours)a Fuel Type
Effective Loaded
Powerb Criteria Emission Factor
Basis
Criteria Emission Factors c GHG Emission Factors (kg/MMBtu)d
HP each Miles/yearEmission Factor
Category Units
GHG Emission Factors (g/hp-hr)d
GHG Emissions (tons per year)e
40 CFR 89.112, Tier 2
(b) Load Factors from Appendix A of EPA 420_P-04-005, Median Life, Annual Activity, and Load Factor Values for Nonroad Engine Emissions Modeling, USEPA, EPA 2004
(b) Load Factors from Appendix A of EPA 420_P-04-005, Median Life, Annual Activity, and Load Factor Values for Nonroad Engine Emissions Modeling, USEPA, EPA 2004
GHG Emission Factors (kg/MMBtu)d
Equipment
Equipment
Usage (Hours)a Fuel Type HP each
Effective Loaded
Powerb GHG Emission Factors (g/hp-hr)d
Miles/yearEmission Factor
Category
Criteria Emission Factors c
UnitsCriteria Emission Factor
Basis
GHG Emissions (tons per year)e
40 CFR 89.112, Tier 2
Miles/yearEmission Factor
Category
Criteria Emission Factors c
UnitsCriteria Emission Factor
Basis
(b) Load Factors from Appendix A of EPA 420_P-04-005, Median Life, Annual Activity, and Load Factor Values for Nonroad Engine Emissions Modeling, USEPA, EPA 2004
Equipment
Equipment
Usage (Hours)a Fuel Type HP each
Effective Loaded
Powerb GHG Emission Factors (kg/MMBtu)d GHG Emission Factors (g/hp-hr)d

Letterkenny Ammunitions Center (LEMC)Criteria & GHG Pollutant Emissions - Construction Equipment
Table 4: 2,400 sqft NEW Building (BMCD ID: 19)
NOx CO VOC SO2 PM10 PM2.5 CO2 CH4 N2O CO2 CH4 N2O NOx CO VOC SO2 PM10 PM2.5 CO2 CH4 N2O CO2e
Foreman / Supervisor Truck 1,130 Gasoline 250 200.00 1130.00 0.309 4.925 0.158 0.005 0.013 0.013 g/mile
Updated Emission Factors of Air Pollutants from Vehicle Operations in GREET Using MOVES - Table A4 - Model
year 2017 70.22 3.00E-03 6.00E-04 491.54 2.10E-02 4.20E-03 0.44 6.93 0.22 0.01 0.02 0.02 122.45 5.23E-03 1.05E-03 122.90Graders 10 Diesel 187 76.67 D302 7.08 4.69 1.77 0.93 0.27 0.27 g/hp-hr 73.96 3.00E-03 6.00E-04 517.72 2.10E-02 4.20E-03 0.01 0.00 1.50E-03 7.86E-04 2.27E-04 2.27E-04 0.44 1.77E-05 3.55E-06 0.44Tractors/Loaders/Backhoes 10 Diesel 97 35.89 D101 8.05 6.71 2.01 0.93 0.54 0.54 g/hp-hr 73.96 3.00E-03 6.00E-04 517.72 2.10E-02 4.20E-03 0.00 0.00 7.96E-04 3.68E-04 2.12E-04 2.12E-04 0.20 8.31E-06 1.66E-06 0.21Concrete/Industrial Saws 20 Diesel 81 59.13 D101 8.05 6.71 2.01 0.93 0.54 0.54 g/hp-hr 73.96 3.00E-03 6.00E-04 517.72 2.10E-02 4.20E-03 0.01 0.01 2.62E-03 1.21E-03 6.99E-04 6.99E-04 0.67 2.74E-05 5.48E-06 0.68Rubber Tired Dozers 20 Diesel 247 98.80 D302 7.08 4.69 1.77 0.93 0.27 0.27 g/hp-hr 73.96 3.00E-03 6.00E-04 517.72 2.10E-02 4.20E-03 0.02 0.01 3.86E-03 2.03E-03 5.84E-04 5.84E-04 1.13 4.57E-05 9.15E-06 1.13Tractors/Loaders/Backhoes 40 Diesel 97 35.89 D101 8.05 6.71 2.01 0.93 0.54 0.54 g/hp-hr 73.96 3.00E-03 6.00E-04 517.72 2.10E-02 4.20E-03 0.01 0.01 3.18E-03 1.47E-03 8.49E-04 8.49E-04 0.82 3.32E-05 6.65E-06 0.82Cranes 1,000 Diesel 231 66.99 D603 6.87 4.69 1.72 0.93 0.27 0.27 g/hp-hr 73.96 3.00E-03 6.00E-04 517.72 2.10E-02 4.20E-03 0.51 0.35 1.27E-01 6.87E-02 1.98E-02 1.98E-02 38.23 1.55E-03 3.10E-04 38.36Forklifts 2,000 Diesel 89 17.80 D101 8.05 6.71 2.01 0.93 0.54 0.54 g/hp-hr 73.96 3.00E-03 6.00E-04 517.72 2.10E-02 4.20E-03 0.32 0.26 7.89E-02 3.65E-02 2.10E-02 2.10E-02 20.32 8.24E-04 1.65E-04 20.39Tractors/Loaders/Backhoes 2,000 Diesel 97 35.89 D101 8.05 6.71 2.01 0.93 0.54 0.54 g/hp-hr 73.96 3.00E-03 6.00E-04 517.72 2.10E-02 4.20E-03 0.64 0.53 1.59E-01 7.36E-02 4.24E-02 4.24E-02 40.96 1.66E-03 3.32E-04 41.10Cement and Mortar Mixers 200 Diesel 9 5.04 D11 8.05 10.73 2.01 0.93 1.07 1.07 g/hp-hr 73.96 3.00E-03 6.00E-04 517.72 2.10E-02 4.20E-03 0.01 0.01 2.24E-03 1.03E-03 1.19E-03 1.19E-03 0.58 2.33E-05 4.67E-06 0.58Pavers 50 Diesel 130 54.60 D174 7.08 6.71 1.77 0.93 0.40 0.40 g/hp-hr 73.96 3.00E-03 6.00E-04 517.72 2.10E-02 4.20E-03 0.02 0.02 5.33E-03 2.80E-03 1.21E-03 1.21E-03 1.56 6.32E-05 1.26E-05 1.56Rollers 50 Diesel 80 30.40 D101 8.05 6.71 2.01 0.93 0.54 0.54 g/hp-hr 73.96 3.00E-03 6.00E-04 517.72 2.10E-02 4.20E-03 0.01 0.01 3.37E-03 1.56E-03 8.99E-04 8.99E-04 0.87 3.52E-05 7.04E-06 0.87Tractors/Loaders/Backhoes 50 Diesel 97 35.89 D101 8.05 6.71 2.01 0.93 0.54 0.54 g/hp-hr 73.96 3.00E-03 6.00E-04 517.72 2.10E-02 4.20E-03 0.02 0.01 3.98E-03 1.84E-03 1.06E-03 1.06E-03 1.02 4.15E-05 8.31E-06 1.03Air Compressors 50 Diesel 78 37.44 D101 8.05 6.71 2.01 0.93 0.54 0.54 g/hp-hr 73.96 3.00E-03 6.00E-04 517.72 2.10E-02 4.20E-03 0.02 0.01 4.15E-03 1.92E-03 1.11E-03 1.11E-03 1.07 4.33E-05 8.67E-06 1.07
Total 2.02 8.18 0.62 0.20 0.11 0.11 230.32 9.61E-03 1.92E-03 231.13(a) Equipment usage based on construction schedule
(d) Greenhouse gas emissions from 40 CFR 98; conversion of 7000 Btu/hp-hr is assumed(e) Global warming potentials: CO2 = 1; CH4 = 25; N2O = 298 (Table A-1 to Subpart A of 40 CFR 98)
Table 5: 100 Space PARKING LOT (BMCD ID: 7)
NOx CO VOC SO2 PM10 PM2.5 CO2 CH4 N2O CO2 CH4 N2O NOx CO VOC SO2 PM10 PM2.5 CO2 CH4 N2O CO2e
Foreman / Supervisor Truck 130 Gasoline 250 200.00 130.00 0.309 4.925 0.158 0.005 0.013 0.013 g/mile
Updated Emission Factors of Air Pollutants from Vehicle Operations in GREET Using MOVES - Table A4 - Model
year 2017 70.22 3.00E-03 6.00E-04 491.54 2.10E-02 4.20E-03 0.01 0.09 0.00 0.00 0.00 0.00 14.09 6.02E-04 1.20E-04 14.14Graders 10 Diesel 187 76.67 D302 7.08 4.69 1.77 0.93 0.27 0.27 g/hp-hr 73.96 3.00E-03 6.00E-04 517.72 2.10E-02 4.20E-03 0.01 0.00 1.50E-03 7.86E-04 2.27E-04 2.27E-04 0.44 1.77E-05 3.55E-06 0.44Tractors/Loaders/Backhoes 10 Diesel 97 35.89 D101 8.05 6.71 2.01 0.93 0.54 0.54 g/hp-hr 73.96 3.00E-03 6.00E-04 517.72 2.10E-02 4.20E-03 0.00 0.00 7.96E-04 3.68E-04 2.12E-04 2.12E-04 0.20 8.31E-06 1.66E-06 0.21Concrete/Industrial Saws 20 Diesel 81 59.13 D101 8.05 6.71 2.01 0.93 0.54 0.54 g/hp-hr 73.96 3.00E-03 6.00E-04 517.72 2.10E-02 4.20E-03 0.01 0.01 2.62E-03 1.21E-03 6.99E-04 6.99E-04 0.67 2.74E-05 5.48E-06 0.68Rubber Tired Dozers 20 Diesel 247 98.80 D302 7.08 4.69 1.77 0.93 0.27 0.27 g/hp-hr 73.96 3.00E-03 6.00E-04 517.72 2.10E-02 4.20E-03 0.02 0.01 3.86E-03 2.03E-03 5.84E-04 5.84E-04 1.13 4.57E-05 9.15E-06 1.13Tractors/Loaders/Backhoes 40 Diesel 97 35.89 D101 8.05 6.71 2.01 0.93 0.54 0.54 g/hp-hr 73.96 3.00E-03 6.00E-04 517.72 2.10E-02 4.20E-03 0.01 0.01 3.18E-03 1.47E-03 8.49E-04 8.49E-04 0.82 3.32E-05 6.65E-06 0.82Cement and Mortar Mixers 200 Diesel 9 5.04 D11 8.05 10.73 2.01 0.93 1.07 1.07 g/hp-hr 73.96 3.00E-03 6.00E-04 517.72 2.10E-02 4.20E-03 0.01 0.01 2.24E-03 1.03E-03 1.19E-03 1.19E-03 0.58 2.33E-05 4.67E-06 0.58Pavers 50 Diesel 130 54.60 D174 7.08 6.71 1.77 0.93 0.40 0.40 g/hp-hr 73.96 3.00E-03 6.00E-04 517.72 2.10E-02 4.20E-03 0.02 0.02 5.33E-03 2.80E-03 1.21E-03 1.21E-03 1.56 6.32E-05 1.26E-05 1.56Rollers 50 Diesel 80 30.40 D101 8.05 6.71 2.01 0.93 0.54 0.54 g/hp-hr 73.96 3.00E-03 6.00E-04 517.72 2.10E-02 4.20E-03 0.01 0.01 3.37E-03 1.56E-03 8.99E-04 8.99E-04 0.87 3.52E-05 7.04E-06 0.87Tractors/Loaders/Backhoes 50 Diesel 97 35.89 D101 8.05 6.71 2.01 0.93 0.54 0.54 g/hp-hr 73.96 3.00E-03 6.00E-04 517.72 2.10E-02 4.20E-03 0.02 0.01 3.98E-03 1.84E-03 1.06E-03 1.06E-03 1.02 4.15E-05 8.31E-06 1.03Air Compressors 50 Diesel 78 37.44 D101 8.05 6.71 2.01 0.93 0.54 0.54 g/hp-hr 73.96 3.00E-03 6.00E-04 517.72 2.10E-02 4.20E-03 0.02 0.01 4.15E-03 1.92E-03 1.11E-03 1.11E-03 1.07 4.33E-05 8.67E-06 1.07
Total 0.13 0.20 0.03 0.02 0.01 0.01 22.44 9.41E-04 1.88E-04 22.52(a) Equipment usage based on construction schedule
(d) Greenhouse gas emissions from 40 CFR 98; conversion of 7000 Btu/hp-hr is assumed(e) Global warming potentials: CO2 = 1; CH4 = 25; N2O = 298 (Table A-1 to Subpart A of 40 CFR 98)
Table 6: 1,750 sqft NEW Building (BMCD ID: 10, 12)
NOx CO VOC SO2 PM10 PM2.5 CO2 CH4 N2O CO2 CH4 N2O NOx CO VOC SO2 PM10 PM2.5 CO2 CH4 N2O CO2e
Foreman / Supervisor Truck 1,130 Gasoline 250 200.00 1130.00 0.309 4.925 0.158 0.005 0.013 0.013 g/mile
Updated Emission Factors of Air Pollutants from Vehicle Operations in GREET Using MOVES - Table A4 - Model
year 2017 70.22 3.00E-03 6.00E-04 491.54 2.10E-02 4.20E-03 0.44 6.93 0.22 0.01 0.02 0.02 122.45 5.23E-03 1.05E-03 122.90Graders 10 Diesel 187 76.67 D302 7.08 4.69 1.77 0.93 0.27 0.27 g/hp-hr 73.96 3.00E-03 6.00E-04 517.72 2.10E-02 4.20E-03 0.01 0.00 1.50E-03 7.86E-04 2.27E-04 2.27E-04 0.44 1.77E-05 3.55E-06 0.44Tractors/Loaders/Backhoes 10 Diesel 97 35.89 D101 8.05 6.71 2.01 0.93 0.54 0.54 g/hp-hr 73.96 3.00E-03 6.00E-04 517.72 2.10E-02 4.20E-03 0.00 0.00 7.96E-04 3.68E-04 2.12E-04 2.12E-04 0.20 8.31E-06 1.66E-06 0.21Concrete/Industrial Saws 20 Diesel 81 59.13 D101 8.05 6.71 2.01 0.93 0.54 0.54 g/hp-hr 73.96 3.00E-03 6.00E-04 517.72 2.10E-02 4.20E-03 0.01 0.01 2.62E-03 1.21E-03 6.99E-04 6.99E-04 0.67 2.74E-05 5.48E-06 0.68Rubber Tired Dozers 20 Diesel 247 98.80 D302 7.08 4.69 1.77 0.93 0.27 0.27 g/hp-hr 73.96 3.00E-03 6.00E-04 517.72 2.10E-02 4.20E-03 0.02 0.01 3.86E-03 2.03E-03 5.84E-04 5.84E-04 1.13 4.57E-05 9.15E-06 1.13Tractors/Loaders/Backhoes 40 Diesel 97 35.89 D101 8.05 6.71 2.01 0.93 0.54 0.54 g/hp-hr 73.96 3.00E-03 6.00E-04 517.72 2.10E-02 4.20E-03 0.01 0.01 3.18E-03 1.47E-03 8.49E-04 8.49E-04 0.82 3.32E-05 6.65E-06 0.82Cranes 1,000 Diesel 231 66.99 D603 6.87 4.69 1.72 0.93 0.27 0.27 g/hp-hr 73.96 3.00E-03 6.00E-04 517.72 2.10E-02 4.20E-03 0.51 0.35 1.27E-01 6.87E-02 1.98E-02 1.98E-02 38.23 1.55E-03 3.10E-04 38.36Forklifts 2,000 Diesel 89 17.80 D101 8.05 6.71 2.01 0.93 0.54 0.54 g/hp-hr 73.96 3.00E-03 6.00E-04 517.72 2.10E-02 4.20E-03 0.32 0.26 7.89E-02 3.65E-02 2.10E-02 2.10E-02 20.32 8.24E-04 1.65E-04 20.39Tractors/Loaders/Backhoes 2,000 Diesel 97 35.89 D101 8.05 6.71 2.01 0.93 0.54 0.54 g/hp-hr 73.96 3.00E-03 6.00E-04 517.72 2.10E-02 4.20E-03 0.64 0.53 1.59E-01 7.36E-02 4.24E-02 4.24E-02 40.96 1.66E-03 3.32E-04 41.10Cement and Mortar Mixers 200 Diesel 9 5.04 D11 8.05 10.73 2.01 0.93 1.07 1.07 g/hp-hr 73.96 3.00E-03 6.00E-04 517.72 2.10E-02 4.20E-03 0.01 0.01 2.24E-03 1.03E-03 1.19E-03 1.19E-03 0.58 2.33E-05 4.67E-06 0.58Pavers 50 Diesel 130 54.60 D174 7.08 6.71 1.77 0.93 0.40 0.40 g/hp-hr 73.96 3.00E-03 6.00E-04 517.72 2.10E-02 4.20E-03 0.02 0.02 5.33E-03 2.80E-03 1.21E-03 1.21E-03 1.56 6.32E-05 1.26E-05 1.56Rollers 50 Diesel 80 30.40 D101 8.05 6.71 2.01 0.93 0.54 0.54 g/hp-hr 73.96 3.00E-03 6.00E-04 517.72 2.10E-02 4.20E-03 0.01 0.01 3.37E-03 1.56E-03 8.99E-04 8.99E-04 0.87 3.52E-05 7.04E-06 0.87Tractors/Loaders/Backhoes 50 Diesel 97 35.89 D101 8.05 6.71 2.01 0.93 0.54 0.54 g/hp-hr 73.96 3.00E-03 6.00E-04 517.72 2.10E-02 4.20E-03 0.02 0.01 3.98E-03 1.84E-03 1.06E-03 1.06E-03 1.02 4.15E-05 8.31E-06 1.03Air Compressors 50 Diesel 78 37.44 D101 8.05 6.71 2.01 0.93 0.54 0.54 g/hp-hr 73.96 3.00E-03 6.00E-04 517.72 2.10E-02 4.20E-03 0.02 0.01 4.15E-03 1.92E-03 1.11E-03 1.11E-03 1.07 4.33E-05 8.67E-06 1.07
Total 2.02 8.18 0.62 0.20 0.11 0.11 230.32 9.61E-03 1.92E-03 231.13(a) Equipment usage based on construction schedule
(d) Greenhouse gas emissions from 40 CFR 98; conversion of 7000 Btu/hp-hr is assumed(e) Global warming potentials: CO2 = 1; CH4 = 25; N2O = 298 (Table A-1 to Subpart A of 40 CFR 98)
Table 7: 5,000 sqft NEW Building (BMCD ID: 40)
NOx CO VOC SO2 PM10 PM2.5 CO2 CH4 N2O CO2 CH4 N2O NOx CO VOC SO2 PM10 PM2.5 CO2 CH4 N2O CO2e
Foreman / Supervisor Truck 1,130 Gasoline 250 200.00 1130.00 0.309 4.925 0.158 0.005 0.013 0.013 g/mile
Updated Emission Factors of Air Pollutants from Vehicle Operations in GREET Using MOVES - Table A4 - Model
year 2017 70.22 3.00E-03 6.00E-04 491.54 2.10E-02 4.20E-03 0.44 6.93 0.22 0.01 0.02 0.02 122.45 5.23E-03 1.05E-03 122.90Graders 10 Diesel 187 76.67 D302 7.08 4.69 1.77 0.93 0.27 0.27 g/hp-hr 73.96 3.00E-03 6.00E-04 517.72 2.10E-02 4.20E-03 0.01 0.00 1.50E-03 7.86E-04 2.27E-04 2.27E-04 0.44 1.77E-05 3.55E-06 0.44Tractors/Loaders/Backhoes 10 Diesel 97 35.89 D101 8.05 6.71 2.01 0.93 0.54 0.54 g/hp-hr 73.96 3.00E-03 6.00E-04 517.72 2.10E-02 4.20E-03 0.00 0.00 7.96E-04 3.68E-04 2.12E-04 2.12E-04 0.20 8.31E-06 1.66E-06 0.21Concrete/Industrial Saws 20 Diesel 81 59.13 D101 8.05 6.71 2.01 0.93 0.54 0.54 g/hp-hr 73.96 3.00E-03 6.00E-04 517.72 2.10E-02 4.20E-03 0.01 0.01 2.62E-03 1.21E-03 6.99E-04 6.99E-04 0.67 2.74E-05 5.48E-06 0.68Rubber Tired Dozers 20 Diesel 247 98.80 D302 7.08 4.69 1.77 0.93 0.27 0.27 g/hp-hr 73.96 3.00E-03 6.00E-04 517.72 2.10E-02 4.20E-03 0.02 0.01 3.86E-03 2.03E-03 5.84E-04 5.84E-04 1.13 4.57E-05 9.15E-06 1.13Tractors/Loaders/Backhoes 40 Diesel 97 35.89 D101 8.05 6.71 2.01 0.93 0.54 0.54 g/hp-hr 73.96 3.00E-03 6.00E-04 517.72 2.10E-02 4.20E-03 0.01 0.01 3.18E-03 1.47E-03 8.49E-04 8.49E-04 0.82 3.32E-05 6.65E-06 0.82Cranes 1,000 Diesel 231 66.99 D603 6.87 4.69 1.72 0.93 0.27 0.27 g/hp-hr 73.96 3.00E-03 6.00E-04 517.72 2.10E-02 4.20E-03 0.51 0.35 1.27E-01 6.87E-02 1.98E-02 1.98E-02 38.23 1.55E-03 3.10E-04 38.36Forklifts 2,000 Diesel 89 17.80 D101 8.05 6.71 2.01 0.93 0.54 0.54 g/hp-hr 73.96 3.00E-03 6.00E-04 517.72 2.10E-02 4.20E-03 0.32 0.26 7.89E-02 3.65E-02 2.10E-02 2.10E-02 20.32 8.24E-04 1.65E-04 20.39Tractors/Loaders/Backhoes 2,000 Diesel 97 35.89 D101 8.05 6.71 2.01 0.93 0.54 0.54 g/hp-hr 73.96 3.00E-03 6.00E-04 517.72 2.10E-02 4.20E-03 0.64 0.53 1.59E-01 7.36E-02 4.24E-02 4.24E-02 40.96 1.66E-03 3.32E-04 41.10Cement and Mortar Mixers 200 Diesel 9 5.04 D11 8.05 10.73 2.01 0.93 1.07 1.07 g/hp-hr 73.96 3.00E-03 6.00E-04 517.72 2.10E-02 4.20E-03 0.01 0.01 2.24E-03 1.03E-03 1.19E-03 1.19E-03 0.58 2.33E-05 4.67E-06 0.58Pavers 50 Diesel 130 54.60 D174 7.08 6.71 1.77 0.93 0.40 0.40 g/hp-hr 73.96 3.00E-03 6.00E-04 517.72 2.10E-02 4.20E-03 0.02 0.02 5.33E-03 2.80E-03 1.21E-03 1.21E-03 1.56 6.32E-05 1.26E-05 1.56Rollers 50 Diesel 80 30.40 D101 8.05 6.71 2.01 0.93 0.54 0.54 g/hp-hr 73.96 3.00E-03 6.00E-04 517.72 2.10E-02 4.20E-03 0.01 0.01 3.37E-03 1.56E-03 8.99E-04 8.99E-04 0.87 3.52E-05 7.04E-06 0.87Tractors/Loaders/Backhoes 50 Diesel 97 35.89 D101 8.05 6.71 2.01 0.93 0.54 0.54 g/hp-hr 73.96 3.00E-03 6.00E-04 517.72 2.10E-02 4.20E-03 0.02 0.01 3.98E-03 1.84E-03 1.06E-03 1.06E-03 1.02 4.15E-05 8.31E-06 1.03Air Compressors 50 Diesel 78 37.44 D101 8.05 6.71 2.01 0.93 0.54 0.54 g/hp-hr 73.96 3.00E-03 6.00E-04 517.72 2.10E-02 4.20E-03 0.02 0.01 4.15E-03 1.92E-03 1.11E-03 1.11E-03 1.07 4.33E-05 8.67E-06 1.07
Total 2.02 8.18 0.62 0.20 0.11 0.11 230.32 9.61E-03 1.92E-03 231.13(a) Equipment usage based on construction schedule
(d) Greenhouse gas emissions from 40 CFR 98; conversion of 7000 Btu/hp-hr is assumed(e) Global warming potentials: CO2 = 1; CH4 = 25; N2O = 298 (Table A-1 to Subpart A of 40 CFR 98)
Equipment
Equipment
Usage (Hours)a Fuel Type HP each
Effective Loaded
Powerb Miles/yearEmission Factor
Category
Criteria Emission Factors c GHG Emissions (tons per year)e
(b) Load Factors from Appendix A of EPA 420_P-04-005, Median Life, Annual Activity, and Load Factor Values for Nonroad Engine Emissions Modeling, USEPA, EPA 2004
Equipment
Equipment
Usage (Hours)a Fuel Type HP each
Effective Loaded
Powerb Miles/yearEmission Factor
Category
Criteria Emission Factors c GHG Emission Factors (kg/MMBtu)d GHG Emission Factors (g/hp-hr)d Criteria Emissions (tons per year)
UnitsCriteria Emission Factor
Basis
GHG Emission Factors (kg/MMBtu)d GHG Emission Factors (g/hp-hr)d Criteria Emissions (tons per year)
GHG Emissions (tons per year)e
40 CFR 89.112, Tier 2
UnitsCriteria Emission Factor
Basis
40 CFR 89.112, Tier 2
(b) Load Factors from Appendix A of EPA 420_P-04-005, Median Life, Annual Activity, and Load Factor Values for Nonroad Engine Emissions Modeling, USEPA, EPA 2004
Equipment
Equipment
Usage (Hours)a Fuel Type HP each
Effective Loaded
Powerb Miles/yearEmission Factor
Category
Criteria Emission Factors c
UnitsCriteria Emission Factor
Basis
GHG Emission Factors (kg/MMBtu)d GHG Emission Factors (g/hp-hr)d Criteria Emissions (tons per year) GHG Emissions (tons per year)e
40 CFR 89.112, Tier 2
(b) Load Factors from Appendix A of EPA 420_P-04-005, Median Life, Annual Activity, and Load Factor Values for Nonroad Engine Emissions Modeling, USEPA, EPA 2004

Letterkenny Ammunitions Center (LEMC)Criteria & GHG Pollutant Emissions - Construction Equipment
Table 8: 35,000 sqft NEW Building (BMCD ID: 2)
NOx CO VOC SO2 PM10 PM2.5 CO2 CH4 N2O CO2 CH4 N2O NOx CO VOC SO2 PM10 PM2.5 CO2 CH4 N2O CO2e
Foreman / Supervisor Truck 1,130 Gasoline 250 200.00 1130.00 0.309 4.925 0.158 0.005 0.013 0.013 g/mile
Updated Emission Factors of Air Pollutants from Vehicle Operations in GREET Using MOVES - Table A4 - Model
year 2017 70.22 3.00E-03 6.00E-04 491.54 2.10E-02 4.20E-03 0.44 6.93 0.22 0.01 0.02 0.02 122.45 5.23E-03 1.05E-03 122.90Graders 10 Diesel 187 76.67 D302 7.08 4.69 1.77 0.93 0.27 0.27 g/hp-hr 73.96 3.00E-03 6.00E-04 517.72 2.10E-02 4.20E-03 0.01 0.00 1.50E-03 7.86E-04 2.27E-04 2.27E-04 0.44 1.77E-05 3.55E-06 0.44Tractors/Loaders/Backhoes 10 Diesel 97 35.89 D101 8.05 6.71 2.01 0.93 0.54 0.54 g/hp-hr 73.96 3.00E-03 6.00E-04 517.72 2.10E-02 4.20E-03 0.00 0.00 7.96E-04 3.68E-04 2.12E-04 2.12E-04 0.20 8.31E-06 1.66E-06 0.21Concrete/Industrial Saws 20 Diesel 81 59.13 D101 8.05 6.71 2.01 0.93 0.54 0.54 g/hp-hr 73.96 3.00E-03 6.00E-04 517.72 2.10E-02 4.20E-03 0.01 0.01 2.62E-03 1.21E-03 6.99E-04 6.99E-04 0.67 2.74E-05 5.48E-06 0.68Rubber Tired Dozers 20 Diesel 247 98.80 D302 7.08 4.69 1.77 0.93 0.27 0.27 g/hp-hr 73.96 3.00E-03 6.00E-04 517.72 2.10E-02 4.20E-03 0.02 0.01 3.86E-03 2.03E-03 5.84E-04 5.84E-04 1.13 4.57E-05 9.15E-06 1.13Tractors/Loaders/Backhoes 40 Diesel 97 35.89 D101 8.05 6.71 2.01 0.93 0.54 0.54 g/hp-hr 73.96 3.00E-03 6.00E-04 517.72 2.10E-02 4.20E-03 0.01 0.01 3.18E-03 1.47E-03 8.49E-04 8.49E-04 0.82 3.32E-05 6.65E-06 0.82Cranes 1,000 Diesel 231 66.99 D603 6.87 4.69 1.72 0.93 0.27 0.27 g/hp-hr 73.96 3.00E-03 6.00E-04 517.72 2.10E-02 4.20E-03 0.51 0.35 1.27E-01 6.87E-02 1.98E-02 1.98E-02 38.23 1.55E-03 3.10E-04 38.36Forklifts 2,000 Diesel 89 17.80 D101 8.05 6.71 2.01 0.93 0.54 0.54 g/hp-hr 73.96 3.00E-03 6.00E-04 517.72 2.10E-02 4.20E-03 0.32 0.26 7.89E-02 3.65E-02 2.10E-02 2.10E-02 20.32 8.24E-04 1.65E-04 20.39Tractors/Loaders/Backhoes 2,000 Diesel 97 35.89 D101 8.05 6.71 2.01 0.93 0.54 0.54 g/hp-hr 73.96 3.00E-03 6.00E-04 517.72 2.10E-02 4.20E-03 0.64 0.53 1.59E-01 7.36E-02 4.24E-02 4.24E-02 40.96 1.66E-03 3.32E-04 41.10Cement and Mortar Mixers 200 Diesel 9 5.04 D11 8.05 10.73 2.01 0.93 1.07 1.07 g/hp-hr 73.96 3.00E-03 6.00E-04 517.72 2.10E-02 4.20E-03 0.01 0.01 2.24E-03 1.03E-03 1.19E-03 1.19E-03 0.58 2.33E-05 4.67E-06 0.58Pavers 50 Diesel 130 54.60 D174 7.08 6.71 1.77 0.93 0.40 0.40 g/hp-hr 73.96 3.00E-03 6.00E-04 517.72 2.10E-02 4.20E-03 0.02 0.02 5.33E-03 2.80E-03 1.21E-03 1.21E-03 1.56 6.32E-05 1.26E-05 1.56Rollers 50 Diesel 80 30.40 D101 8.05 6.71 2.01 0.93 0.54 0.54 g/hp-hr 73.96 3.00E-03 6.00E-04 517.72 2.10E-02 4.20E-03 0.01 0.01 3.37E-03 1.56E-03 8.99E-04 8.99E-04 0.87 3.52E-05 7.04E-06 0.87Tractors/Loaders/Backhoes 50 Diesel 97 35.89 D101 8.05 6.71 2.01 0.93 0.54 0.54 g/hp-hr 73.96 3.00E-03 6.00E-04 517.72 2.10E-02 4.20E-03 0.02 0.01 3.98E-03 1.84E-03 1.06E-03 1.06E-03 1.02 4.15E-05 8.31E-06 1.03Air Compressors 50 Diesel 78 37.44 D101 8.05 6.71 2.01 0.93 0.54 0.54 g/hp-hr 73.96 3.00E-03 6.00E-04 517.72 2.10E-02 4.20E-03 0.02 0.01 4.15E-03 1.92E-03 1.11E-03 1.11E-03 1.07 4.33E-05 8.67E-06 1.07
Total 2.02 8.18 0.62 0.20 0.11 0.11 230.32 9.61E-03 1.92E-03 231.13(a) Equipment usage based on construction schedule
(d) Greenhouse gas emissions from 40 CFR 98; conversion of 7000 Btu/hp-hr is assumed(e) Global warming potentials: CO2 = 1; CH4 = 25; N2O = 298 (Table A-1 to Subpart A of 40 CFR 98)
Table 9: 45,000 sqft NEW Building (x2 BMCD ID: 1)
NOx CO VOC SO2 PM10 PM2.5 CO2 CH4 N2O CO2 CH4 N2O NOx CO VOC SO2 PM10 PM2.5 CO2 CH4 N2O CO2e
Foreman / Supervisor Truck 2,260 Gasoline 250 200.00 2260.00 0.309 4.925 0.158 0.005 0.013 0.013 g/mile
Updated Emission Factors of Air Pollutants from Vehicle Operations in GREET Using MOVES - Table A4 - Model
year 2017 70.22 3.00E-03 6.00E-04 491.54 2.10E-02 4.20E-03 1.74 27.73 0.89 0.03 0.07 0.07 244.91 1.05E-02 2.09E-03 245.79Graders 20 Diesel 187 76.67 D302 7.08 4.69 1.77 0.93 0.27 0.27 g/hp-hr 73.96 3.00E-03 6.00E-04 517.72 2.10E-02 4.20E-03 0.01 0.01 2.99E-03 1.57E-03 4.53E-04 4.53E-04 0.88 3.55E-05 7.10E-06 0.88Scrapers 20 Diesel 367 176.16 D603 6.87 4.69 1.72 0.93 0.27 0.27 g/hp-hr 73.96 3.00E-03 6.00E-04 517.72 2.10E-02 4.20E-03 0.03 0.02 6.67E-03 3.61E-03 1.04E-03 1.04E-03 2.01 8.16E-05 1.63E-05 2.02Tractors/Loaders/Backhoes 20 Diesel 97 35.89 D101 8.05 6.71 2.01 0.93 0.54 0.54 g/hp-hr 73.96 3.00E-03 6.00E-04 517.72 2.10E-02 4.20E-03 0.01 0.01 1.59E-03 7.36E-04 4.24E-04 4.24E-04 0.41 1.66E-05 3.32E-06 0.41Graders 40 Diesel 187 76.67 D302 7.08 4.69 1.77 0.93 0.27 0.27 g/hp-hr 73.96 3.00E-03 6.00E-04 517.72 2.10E-02 4.20E-03 0.02 0.02 5.98E-03 3.14E-03 9.07E-04 9.07E-04 1.75 7.10E-05 1.42E-05 1.76Rubber Tired Dozers 40 Diesel 247 98.80 D302 7.08 4.69 1.77 0.93 0.27 0.27 g/hp-hr 73.96 3.00E-03 6.00E-04 517.72 2.10E-02 4.20E-03 0.03 0.02 7.71E-03 4.05E-03 1.17E-03 1.17E-03 2.26 9.15E-05 1.83E-05 2.26Tractors/Loaders/Backhoes 80 Diesel 97 35.89 D101 8.05 6.71 2.01 0.93 0.54 0.54 g/hp-hr 73.96 3.00E-03 6.00E-04 517.72 2.10E-02 4.20E-03 0.03 0.02 6.37E-03 2.94E-03 1.70E-03 1.70E-03 1.64 6.65E-05 1.33E-05 1.64Cranes 2,000 Diesel 231 66.99 D603 6.87 4.69 1.72 0.93 0.27 0.27 g/hp-hr 73.96 3.00E-03 6.00E-04 517.72 2.10E-02 4.20E-03 1.01 0.69 2.54E-01 1.37E-01 3.96E-02 3.96E-02 76.46 3.10E-03 6.20E-04 76.72Forklifts 4,000 Diesel 89 17.80 D101 8.05 6.71 2.01 0.93 0.54 0.54 g/hp-hr 73.96 3.00E-03 6.00E-04 517.72 2.10E-02 4.20E-03 0.63 0.53 1.58E-01 7.30E-02 4.21E-02 4.21E-02 40.63 1.65E-03 3.30E-04 40.77Generator Sets 2,000 Diesel 84 62.16 D101 8.05 6.71 2.01 0.93 0.54 0.54 g/hp-hr 73.96 3.00E-03 6.00E-04 517.72 2.10E-02 4.20E-03 1.10 0.92 2.76E-01 1.27E-01 7.35E-02 7.35E-02 70.95 2.88E-03 5.76E-04 71.19Tractors/Loaders/Backhoes 2,000 Diesel 97 35.89 D101 8.05 6.71 2.01 0.93 0.54 0.54 g/hp-hr 73.96 3.00E-03 6.00E-04 517.72 2.10E-02 4.20E-03 0.64 0.53 1.59E-01 7.36E-02 4.24E-02 4.24E-02 40.96 1.66E-03 3.32E-04 41.10Welders 6,000 Diesel 46 20.70 D50 8.05 7.38 2.01 0.93 0.80 0.80 g/hp-hr 73.96 3.00E-03 6.00E-04 517.72 2.10E-02 4.20E-03 1.10 1.01 2.75E-01 1.27E-01 1.10E-01 1.10E-01 70.88 2.88E-03 5.75E-04 71.12Cement and Mortar Mixers 100 Diesel 9 5.04 D11 8.05 10.73 2.01 0.93 1.07 1.07 g/hp-hr 73.96 3.00E-03 6.00E-04 517.72 2.10E-02 4.20E-03 0.00 0.01 1.12E-03 5.17E-04 5.96E-04 5.96E-04 0.29 1.17E-05 2.33E-06 0.29Pavers 100 Diesel 130 54.60 D174 7.08 6.71 1.77 0.93 0.40 0.40 g/hp-hr 73.96 3.00E-03 6.00E-04 517.72 2.10E-02 4.20E-03 0.04 0.04 1.07E-02 5.60E-03 2.42E-03 2.42E-03 3.12 1.26E-04 2.53E-05 3.13Paving Equipment 100 Diesel 132 47.52 D174 7.08 6.71 1.77 0.93 0.40 0.40 g/hp-hr 73.96 3.00E-03 6.00E-04 517.72 2.10E-02 4.20E-03 0.04 0.04 9.27E-03 4.87E-03 2.11E-03 2.11E-03 2.71 1.10E-04 2.20E-05 2.72Rollers 200 Diesel 80 30.40 D101 8.05 6.71 2.01 0.93 0.54 0.54 g/hp-hr 73.96 3.00E-03 6.00E-04 517.72 2.10E-02 4.20E-03 0.05 0.04 1.35E-02 6.23E-03 3.60E-03 3.60E-03 3.47 1.41E-04 2.81E-05 3.48Tractors/Loaders/Backhoes 100 Diesel 97 35.89 D101 8.05 6.71 2.01 0.93 0.54 0.54 g/hp-hr 73.96 3.00E-03 6.00E-04 517.72 2.10E-02 4.20E-03 0.03 0.03 7.96E-03 3.68E-03 2.12E-03 2.12E-03 2.05 8.31E-05 1.66E-05 2.06Air Compressors 100 Diesel 78 37.44 D101 8.05 6.71 2.01 0.93 0.54 0.54 g/hp-hr 73.96 3.00E-03 6.00E-04 517.72 2.10E-02 4.20E-03 0.03 0.03 8.30E-03 3.84E-03 2.21E-03 2.21E-03 2.14 8.67E-05 1.73E-05 2.14
Total 6.56 31.68 2.09 0.61 0.40 0.40 567.50 2.35E-02 4.71E-03 569.49(a) Equipment usage based on construction schedule
(d) Greenhouse gas emissions from 40 CFR 98; conversion of 7000 Btu/hp-hr is assumed(e) Global warming potentials: CO2 = 1; CH4 = 25; N2O = 298 (Table A-1 to Subpart A of 40 CFR 98)
Table 10: 82,000 sqft NEW Building (x4) (BMCD ID: 5)
NOx CO VOC SO2 PM10 PM2.5 CO2 CH4 N2O CO2 CH4 N2O NOx CO VOC SO2 PM10 PM2.5 CO2 CH4 N2O CO2e
Foreman / Supervisor Truck 2,260 Gasoline 250 200.00 2260.00 0.309 4.925 0.158 0.005 0.013 0.013 g/mile
Updated Emission Factors of Air Pollutants from Vehicle Operations in GREET Using MOVES - Table A4 - Model
year 2017 70.22 3.00E-03 6.00E-04 491.54 2.10E-02 4.20E-03 1.74 27.73 0.89 0.03 0.07 0.07 244.91 1.05E-02 2.09E-03 245.79Graders 16 Diesel 187 76.67 D302 7.08 4.69 1.77 0.93 0.27 0.27 g/hp-hr 73.96 3.00E-03 6.00E-04 517.72 2.10E-02 4.20E-03 0.01 0.01 2.39E-03 1.26E-03 3.63E-04 3.63E-04 0.70 2.84E-05 5.68E-06 0.70Rubber Tired Dozers 14 Diesel 247 98.80 D302 7.08 4.69 1.77 0.93 0.27 0.27 g/hp-hr 73.96 3.00E-03 6.00E-04 517.72 2.10E-02 4.20E-03 0.01 0.01 2.70E-03 1.42E-03 4.09E-04 4.09E-04 0.79 3.20E-05 6.40E-06 0.79Tractors/Loaders/Backhoes 16 Diesel 97 35.89 D101 8.05 6.71 2.01 0.93 0.54 0.54 g/hp-hr 73.96 3.00E-03 6.00E-04 517.72 2.10E-02 4.20E-03 0.01 0.00 1.27E-03 5.89E-04 3.40E-04 3.40E-04 0.33 1.33E-05 2.66E-06 0.33Graders 24 Diesel 187 76.67 D302 7.08 4.69 1.77 0.93 0.27 0.27 g/hp-hr 73.96 3.00E-03 6.00E-04 517.72 2.10E-02 4.20E-03 0.01 0.01 3.59E-03 1.89E-03 5.44E-04 5.44E-04 1.05 4.26E-05 8.52E-06 1.05Rubber Tired Dozers 24 Diesel 247 98.80 D302 7.08 4.69 1.77 0.93 0.27 0.27 g/hp-hr 73.96 3.00E-03 6.00E-04 517.72 2.10E-02 4.20E-03 0.02 0.01 4.63E-03 2.43E-03 7.01E-04 7.01E-04 1.35 5.49E-05 1.10E-05 1.36Tractors/Loaders/Backhoes 28 Diesel 97 35.89 D101 8.05 6.71 2.01 0.93 0.54 0.54 g/hp-hr 73.96 3.00E-03 6.00E-04 517.72 2.10E-02 4.20E-03 0.01 0.01 2.23E-03 1.03E-03 5.94E-04 5.94E-04 0.57 2.33E-05 4.65E-06 0.58Cranes 1,200 Diesel 231 66.99 D603 6.87 4.69 1.72 0.93 0.27 0.27 g/hp-hr 73.96 3.00E-03 6.00E-04 517.72 2.10E-02 4.20E-03 0.61 0.42 1.52E-01 8.24E-02 2.38E-02 2.38E-02 45.88 1.86E-03 3.72E-04 46.03Forklifts 1,200 Diesel 89 17.80 D101 8.05 6.71 2.01 0.93 0.54 0.54 g/hp-hr 73.96 3.00E-03 6.00E-04 517.72 2.10E-02 4.20E-03 0.19 0.16 4.74E-02 2.19E-02 1.26E-02 1.26E-02 12.19 4.94E-04 9.89E-05 12.23Generator Sets 1,600 Diesel 84 62.16 D101 8.05 6.71 2.01 0.93 0.54 0.54 g/hp-hr 73.96 3.00E-03 6.00E-04 517.72 2.10E-02 4.20E-03 0.88 0.74 2.21E-01 1.02E-01 5.88E-02 5.88E-02 56.76 2.30E-03 4.60E-04 56.95Tractors/Loaders/Backhoes 1,200 Diesel 97 35.89 D101 8.05 6.71 2.01 0.93 0.54 0.54 g/hp-hr 73.96 3.00E-03 6.00E-04 517.72 2.10E-02 4.20E-03 0.38 0.32 9.55E-02 4.41E-02 2.55E-02 2.55E-02 24.58 9.97E-04 1.99E-04 24.66Welders 4,800 Diesel 46 20.70 D50 8.05 7.38 2.01 0.93 0.80 0.80 g/hp-hr 73.96 3.00E-03 6.00E-04 517.72 2.10E-02 4.20E-03 0.88 0.81 2.20E-01 1.02E-01 8.81E-02 8.81E-02 56.70 2.30E-03 4.60E-04 56.90Cement and Mortar Mixers 60 Diesel 9 5.04 D11 8.05 10.73 2.01 0.93 1.07 1.07 g/hp-hr 73.96 3.00E-03 6.00E-04 517.72 2.10E-02 4.20E-03 0.00 0.00 6.71E-04 3.10E-04 3.58E-04 3.58E-04 0.17 7.00E-06 1.40E-06 0.17Pavers 60 Diesel 130 54.60 D174 7.08 6.71 1.77 0.93 0.40 0.40 g/hp-hr 73.96 3.00E-03 6.00E-04 517.72 2.10E-02 4.20E-03 0.03 0.02 6.39E-03 3.36E-03 1.45E-03 1.45E-03 1.87 7.58E-05 1.52E-05 1.88Paving Equipment 80 Diesel 132 47.52 D174 7.08 6.71 1.77 0.93 0.40 0.40 g/hp-hr 73.96 3.00E-03 6.00E-04 517.72 2.10E-02 4.20E-03 0.03 0.03 7.42E-03 3.90E-03 1.69E-03 1.69E-03 2.17 8.80E-05 1.76E-05 2.18Rollers 70 Diesel 80 30.40 D101 8.05 6.71 2.01 0.93 0.54 0.54 g/hp-hr 73.96 3.00E-03 6.00E-04 517.72 2.10E-02 4.20E-03 0.02 0.02 4.72E-03 2.18E-03 1.26E-03 1.26E-03 1.21 4.93E-05 9.85E-06 1.22Tractors/Loaders/Backhoes 80 Diesel 97 35.89 D101 8.05 6.71 2.01 0.93 0.54 0.54 g/hp-hr 73.96 3.00E-03 6.00E-04 517.72 2.10E-02 4.20E-03 0.03 0.02 6.37E-03 2.94E-03 1.70E-03 1.70E-03 1.64 6.65E-05 1.33E-05 1.64Air Compressors 60 Diesel 78 37.44 D101 8.05 6.71 2.01 0.93 0.54 0.54 g/hp-hr 73.96 3.00E-03 6.00E-04 517.72 2.10E-02 4.20E-03 0.02 0.02 4.98E-03 2.30E-03 1.33E-03 1.33E-03 1.28 5.20E-05 1.04E-05 1.29
Total 4.87 30.32 1.67 0.41 0.29 0.29 454.15 1.90E-02 3.79E-03 455.76(a) Equipment usage based on construction schedule
(d) Greenhouse gas emissions from 40 CFR 98; conversion of 7000 Btu/hp-hr is assumed(e) Global warming potentials: CO2 = 1; CH4 = 25; N2O = 298 (Table A-1 to Subpart A of 40 CFR 98)
Equipment
Equipment
Usage (Hours)a Fuel Type HP each
Effective Loaded
Powerb Miles/yearEmission Factor
Category
Criteria Emission Factors c
UnitsCriteria Emission Factor
Basis
GHG Emission Factors (kg/MMBtu)d GHG Emission Factors (g/hp-hr)d Criteria Emissions (tons per year) GHG Emissions (tons per year)e
40 CFR 89.112, Tier 2
(b) Load Factors from Appendix A of EPA 420_P-04-005, Median Life, Annual Activity, and Load Factor Values for Nonroad Engine Emissions Modeling, USEPA, EPA 2004
Equipment
Equipment
Usage (Hours)a Fuel Type HP each
Effective Loaded
Powerb Miles/yearEmission Factor
Category
Criteria Emission Factors c
UnitsCriteria Emission Factor
Basis
GHG Emission Factors (kg/MMBtu)d GHG Emission Factors (g/hp-hr)d Criteria Emissions (tons per year) GHG Emissions (tons per year)e
40 CFR 89.112, Tier 2
(b) Load Factors from Appendix A of EPA 420_P-04-005, Median Life, Annual Activity, and Load Factor Values for Nonroad Engine Emissions Modeling, USEPA, EPA 2004
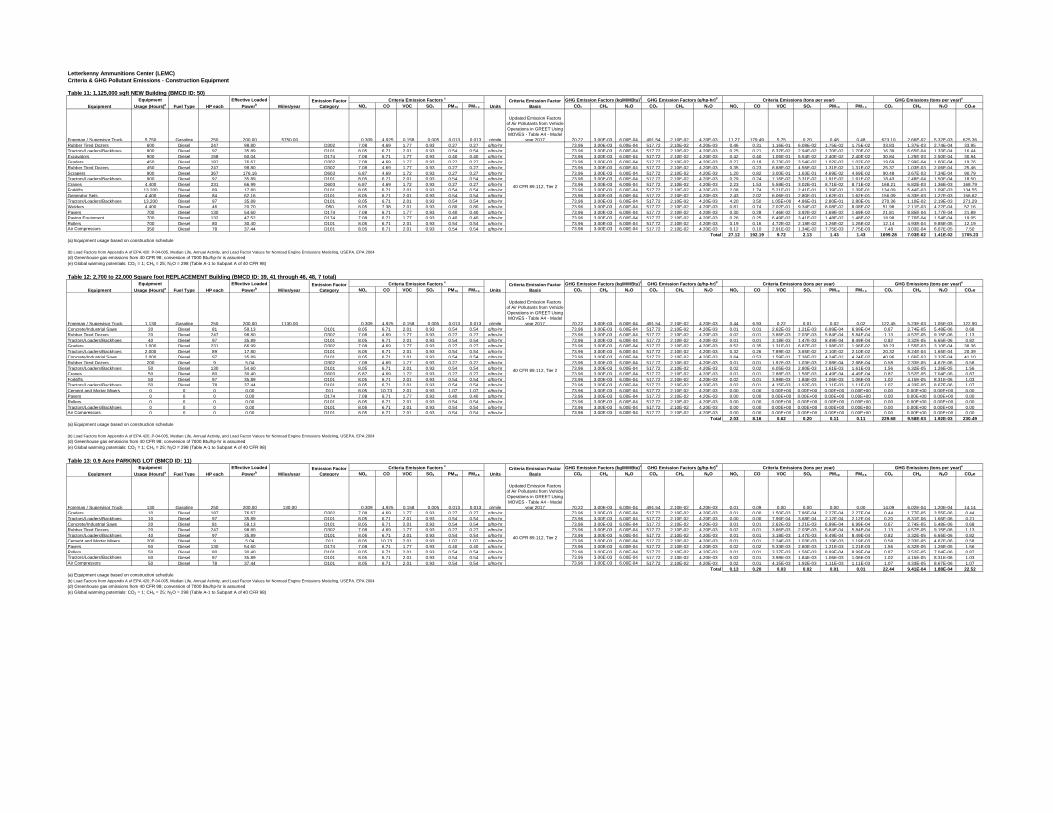
Letterkenny Ammunitions Center (LEMC)Criteria & GHG Pollutant Emissions - Construction Equipment
Table 11: 1,125,000 sqft NEW Building (BMCD ID: 50)
NOx CO VOC SO2 PM10 PM2.5 CO2 CH4 N2O CO2 CH4 N2O NOx CO VOC SO2 PM10 PM2.5 CO2 CH4 N2O CO2e
Foreman / Supervisor Truck 5,750 Gasoline 250 200.00 5750.00 0.309 4.925 0.158 0.005 0.013 0.013 g/mile
Updated Emission Factors of Air Pollutants from Vehicle Operations in GREET Using MOVES - Table A4 - Model
year 2017 70.22 3.00E-03 6.00E-04 491.54 2.10E-02 4.20E-03 11.27 179.49 5.75 0.20 0.48 0.48 623.10 2.66E-02 5.32E-03 625.36Rubber Tired Dozers 600 Diesel 247 98.80 D302 7.08 4.69 1.77 0.93 0.27 0.27 g/hp-hr 73.96 3.00E-03 6.00E-04 517.72 2.10E-02 4.20E-03 0.46 0.31 1.16E-01 6.08E-02 1.75E-02 1.75E-02 33.83 1.37E-03 2.74E-04 33.95Tractors/Loaders/Backhoes 800 Diesel 97 35.89 D101 8.05 6.71 2.01 0.93 0.54 0.54 g/hp-hr 73.96 3.00E-03 6.00E-04 517.72 2.10E-02 4.20E-03 0.25 0.21 6.37E-02 2.94E-02 1.70E-02 1.70E-02 16.39 6.65E-04 1.33E-04 16.44Excavators 900 Diesel 158 60.04 D174 7.08 6.71 1.77 0.93 0.40 0.40 g/hp-hr 73.96 3.00E-03 6.00E-04 517.72 2.10E-02 4.20E-03 0.42 0.40 1.05E-01 5.54E-02 2.40E-02 2.40E-02 30.84 1.25E-03 2.50E-04 30.94Graders 450 Diesel 187 76.67 D302 7.08 4.69 1.77 0.93 0.27 0.27 g/hp-hr 73.96 3.00E-03 6.00E-04 517.72 2.10E-02 4.20E-03 0.27 0.18 6.73E-02 3.54E-02 1.02E-02 1.02E-02 19.69 7.99E-04 1.60E-04 19.76Rubber Tired Dozers 450 Diesel 247 98.80 D302 7.08 4.69 1.77 0.93 0.27 0.27 g/hp-hr 73.96 3.00E-03 6.00E-04 517.72 2.10E-02 4.20E-03 0.35 0.23 8.68E-02 4.56E-02 1.31E-02 1.31E-02 25.37 1.03E-03 2.06E-04 25.46Scrapers 900 Diesel 367 176.16 D603 6.87 4.69 1.72 0.93 0.27 0.27 g/hp-hr 73.96 3.00E-03 6.00E-04 517.72 2.10E-02 4.20E-03 1.20 0.82 3.00E-01 1.63E-01 4.69E-02 4.69E-02 90.48 3.67E-03 7.34E-04 90.79Tractors/Loaders/Backhoes 900 Diesel 97 35.89 D101 8.05 6.71 2.01 0.93 0.54 0.54 g/hp-hr 73.96 3.00E-03 6.00E-04 517.72 2.10E-02 4.20E-03 0.29 0.24 7.16E-02 3.31E-02 1.91E-02 1.91E-02 18.43 7.48E-04 1.50E-04 18.50Cranes 4,400 Diesel 231 66.99 D603 6.87 4.69 1.72 0.93 0.27 0.27 g/hp-hr 73.96 3.00E-03 6.00E-04 517.72 2.10E-02 4.20E-03 2.23 1.53 5.58E-01 3.02E-01 8.71E-02 8.71E-02 168.21 6.82E-03 1.36E-03 168.79Forklifts 13,200 Diesel 89 17.80 D101 8.05 6.71 2.01 0.93 0.54 0.54 g/hp-hr 73.96 3.00E-03 6.00E-04 517.72 2.10E-02 4.20E-03 2.08 1.74 5.21E-01 2.41E-01 1.39E-01 1.39E-01 134.09 5.44E-03 1.09E-03 134.55Generator Sets 4,400 Diesel 84 62.16 D101 8.05 6.71 2.01 0.93 0.54 0.54 g/hp-hr 73.96 3.00E-03 6.00E-04 517.72 2.10E-02 4.20E-03 2.43 2.02 6.06E-01 2.80E-01 1.62E-01 1.62E-01 156.09 6.33E-03 1.27E-03 156.62Tractors/Loaders/Backhoes 13,200 Diesel 97 35.89 D101 8.05 6.71 2.01 0.93 0.54 0.54 g/hp-hr 73.96 3.00E-03 6.00E-04 517.72 2.10E-02 4.20E-03 4.20 3.50 1.05E+00 4.86E-01 2.80E-01 2.80E-01 270.36 1.10E-02 2.19E-03 271.29Welders 4,400 Diesel 46 20.70 D50 8.05 7.38 2.01 0.93 0.80 0.80 g/hp-hr 73.96 3.00E-03 6.00E-04 517.72 2.10E-02 4.20E-03 0.81 0.74 2.02E-01 9.34E-02 8.08E-02 8.08E-02 51.98 2.11E-03 4.22E-04 52.16Pavers 700 Diesel 130 54.60 D174 7.08 6.71 1.77 0.93 0.40 0.40 g/hp-hr 73.96 3.00E-03 6.00E-04 517.72 2.10E-02 4.20E-03 0.30 0.28 7.46E-02 3.92E-02 1.69E-02 1.69E-02 21.81 8.85E-04 1.77E-04 21.89Paving Equipment 700 Diesel 132 47.52 D174 7.08 6.71 1.77 0.93 0.40 0.40 g/hp-hr 73.96 3.00E-03 6.00E-04 517.72 2.10E-02 4.20E-03 0.26 0.25 6.49E-02 3.41E-02 1.48E-02 1.48E-02 18.98 7.70E-04 1.54E-04 19.05Rollers 700 Diesel 80 30.40 D101 8.05 6.71 2.01 0.93 0.54 0.54 g/hp-hr 73.96 3.00E-03 6.00E-04 517.72 2.10E-02 4.20E-03 0.19 0.16 4.72E-02 2.18E-02 1.26E-02 1.26E-02 12.14 4.93E-04 9.85E-05 12.19Air Compressors 350 Diesel 78 37.44 D101 8.05 6.71 2.01 0.93 0.54 0.54 g/hp-hr 73.96 3.00E-03 6.00E-04 517.72 2.10E-02 4.20E-03 0.12 0.10 2.91E-02 1.34E-02 7.75E-03 7.75E-03 7.48 3.03E-04 6.07E-05 7.50
Total 27.12 192.19 9.72 2.13 1.43 1.43 1699.28 7.03E-02 1.41E-02 1705.23(a) Equipment usage based on construction schedule
(d) Greenhouse gas emissions from 40 CFR 98; conversion of 7000 Btu/hp-hr is assumed(e) Global warming potentials: CO2 = 1; CH4 = 25; N2O = 298 (Table A-1 to Subpart A of 40 CFR 98)
Table 12: 2,700 to 22,000 Square foot REPLACEMENT Building (BMCD ID: 39, 41 through 46, 48, 7 total)
NOx CO VOC SO2 PM10 PM2.5 CO2 CH4 N2O CO2 CH4 N2O NOx CO VOC SO2 PM10 PM2.5 CO2 CH4 N2O CO2e
Foreman / Supervisor Truck 1,130 Gasoline 250 200.00 1130.00 0.309 4.925 0.158 0.005 0.013 0.013 g/mile
Updated Emission Factors of Air Pollutants from Vehicle Operations in GREET Using MOVES - Table A4 - Model
year 2017 70.22 3.00E-03 6.00E-04 491.54 2.10E-02 4.20E-03 0.44 6.93 0.22 0.01 0.02 0.02 122.45 5.23E-03 1.05E-03 122.90Concrete/Industrial Saws 20 Diesel 81 59.13 D101 8.05 6.71 2.01 0.93 0.54 0.54 g/hp-hr 73.96 3.00E-03 6.00E-04 517.72 2.10E-02 4.20E-03 0.01 0.01 2.62E-03 1.21E-03 6.99E-04 6.99E-04 0.67 2.74E-05 5.48E-06 0.68Rubber Tired Dozers 20 Diesel 247 98.80 D302 7.08 4.69 1.77 0.93 0.27 0.27 g/hp-hr 73.96 3.00E-03 6.00E-04 517.72 2.10E-02 4.20E-03 0.02 0.01 3.86E-03 2.03E-03 5.84E-04 5.84E-04 1.13 4.57E-05 9.15E-06 1.13Tractors/Loaders/Backhoes 40 Diesel 97 35.89 D101 8.05 6.71 2.01 0.93 0.54 0.54 g/hp-hr 73.96 3.00E-03 6.00E-04 517.72 2.10E-02 4.20E-03 0.01 0.01 3.18E-03 1.47E-03 8.49E-04 8.49E-04 0.82 3.32E-05 6.65E-06 0.82Graders 1,000 Diesel 231 66.99 D302 7.08 4.69 1.77 0.93 0.27 0.27 g/hp-hr 73.96 3.00E-03 6.00E-04 517.72 2.10E-02 4.20E-03 0.52 0.35 1.31E-01 6.87E-02 1.98E-02 1.98E-02 38.23 1.55E-03 3.10E-04 38.36Tractors/Loaders/Backhoes 2,000 Diesel 89 17.80 D101 8.05 6.71 2.01 0.93 0.54 0.54 g/hp-hr 73.96 3.00E-03 6.00E-04 517.72 2.10E-02 4.20E-03 0.32 0.26 7.89E-02 3.65E-02 2.10E-02 2.10E-02 20.32 8.24E-04 1.65E-04 20.39Concrete/Industrial Saws 2,000 Diesel 97 35.89 D101 8.05 6.71 2.01 0.93 0.54 0.54 g/hp-hr 73.96 3.00E-03 6.00E-04 517.72 2.10E-02 4.20E-03 0.64 0.53 1.59E-01 7.36E-02 4.24E-02 4.24E-02 40.96 1.66E-03 3.32E-04 41.10Rubber Tired Dozers 200 Diesel 9 5.04 D302 7.08 4.69 1.77 0.93 0.27 0.27 g/hp-hr 73.96 3.00E-03 6.00E-04 517.72 2.10E-02 4.20E-03 0.01 0.01 1.97E-03 1.03E-03 2.98E-04 2.98E-04 0.58 2.33E-05 4.67E-06 0.58Tractors/Loaders/Backhoes 50 Diesel 130 54.60 D101 8.05 6.71 2.01 0.93 0.54 0.54 g/hp-hr 73.96 3.00E-03 6.00E-04 517.72 2.10E-02 4.20E-03 0.02 0.02 6.05E-03 2.80E-03 1.61E-03 1.61E-03 1.56 6.32E-05 1.26E-05 1.56Cranes 50 Diesel 80 30.40 D603 6.87 4.69 1.72 0.93 0.27 0.27 g/hp-hr 73.96 3.00E-03 6.00E-04 517.72 2.10E-02 4.20E-03 0.01 0.01 2.88E-03 1.56E-03 4.49E-04 4.49E-04 0.87 3.52E-05 7.04E-06 0.87Forklifts 50 Diesel 97 35.89 D101 8.05 6.71 2.01 0.93 0.54 0.54 g/hp-hr 73.96 3.00E-03 6.00E-04 517.72 2.10E-02 4.20E-03 0.02 0.01 3.98E-03 1.84E-03 1.06E-03 1.06E-03 1.02 4.15E-05 8.31E-06 1.03Tractors/Loaders/Backhoes 50 Diesel 78 37.44 D101 8.05 6.71 2.01 0.93 0.54 0.54 g/hp-hr 73.96 3.00E-03 6.00E-04 517.72 2.10E-02 4.20E-03 0.02 0.01 4.15E-03 1.92E-03 1.11E-03 1.11E-03 1.07 4.33E-05 8.67E-06 1.07Cement and Mortar Mixers 0 0 0 0.00 D11 8.05 10.73 2.01 0.93 1.07 1.07 g/hp-hr 73.96 3.00E-03 6.00E-04 517.72 2.10E-02 4.20E-03 0.00 0.00 0.00E+00 0.00E+00 0.00E+00 0.00E+00 0.00 0.00E+00 0.00E+00 0.00Pavers 0 0 0 0.00 D174 7.08 6.71 1.77 0.93 0.40 0.40 g/hp-hr 73.96 3.00E-03 6.00E-04 517.72 2.10E-02 4.20E-03 0.00 0.00 0.00E+00 0.00E+00 0.00E+00 0.00E+00 0.00 0.00E+00 0.00E+00 0.00Rollers 0 0 0 0.00 D101 8.05 6.71 2.01 0.93 0.54 0.54 g/hp-hr 73.96 3.00E-03 6.00E-04 517.72 2.10E-02 4.20E-03 0.00 0.00 0.00E+00 0.00E+00 0.00E+00 0.00E+00 0.00 0.00E+00 0.00E+00 0.00Tractors/Loaders/Backhoes 0 0 0 0.00 D101 8.05 6.71 2.01 0.93 0.54 0.54 g/hp-hr 73.96 3.00E-03 6.00E-04 517.72 2.10E-02 4.20E-03 0.00 0.00 0.00E+00 0.00E+00 0.00E+00 0.00E+00 0.00 0.00E+00 0.00E+00 0.00Air Compressors 0 0 0 0.00 D101 8.05 6.71 2.01 0.93 0.54 0.54 g/hp-hr 73.96 3.00E-03 6.00E-04 517.72 2.10E-02 4.20E-03 0.00 0.00 0.00E+00 0.00E+00 0.00E+00 0.00E+00 0.00 0.00E+00 0.00E+00 0.00
Total 2.03 8.16 0.62 0.20 0.11 0.11 229.68 9.58E-03 1.92E-03 230.49(a) Equipment usage based on construction schedule
(d) Greenhouse gas emissions from 40 CFR 98; conversion of 7000 Btu/hp-hr is assumed(e) Global warming potentials: CO2 = 1; CH4 = 25; N2O = 298 (Table A-1 to Subpart A of 40 CFR 98)
Table 13: 0.9 Acre PARKING LOT (BMCD ID: 11)
NOx CO VOC SO2 PM10 PM2.5 CO2 CH4 N2O CO2 CH4 N2O NOx CO VOC SO2 PM10 PM2.5 CO2 CH4 N2O CO2e
Foreman / Supervisor Truck 130 Gasoline 250 200.00 130.00 0.309 4.925 0.158 0.005 0.013 0.013 g/mile
Updated Emission Factors of Air Pollutants from Vehicle Operations in GREET Using MOVES - Table A4 - Model
year 2017 70.22 3.00E-03 6.00E-04 491.54 2.10E-02 4.20E-03 0.01 0.09 0.00 0.00 0.00 0.00 14.09 6.02E-04 1.20E-04 14.14Graders 10 Diesel 187 76.67 D302 7.08 4.69 1.77 0.93 0.27 0.27 g/hp-hr 73.96 3.00E-03 6.00E-04 517.72 2.10E-02 4.20E-03 0.01 0.00 1.50E-03 7.86E-04 2.27E-04 2.27E-04 0.44 1.77E-05 3.55E-06 0.44Tractors/Loaders/Backhoes 10 Diesel 97 35.89 D101 8.05 6.71 2.01 0.93 0.54 0.54 g/hp-hr 73.96 3.00E-03 6.00E-04 517.72 2.10E-02 4.20E-03 0.00 0.00 7.96E-04 3.68E-04 2.12E-04 2.12E-04 0.20 8.31E-06 1.66E-06 0.21Concrete/Industrial Saws 20 Diesel 81 59.13 D101 8.05 6.71 2.01 0.93 0.54 0.54 g/hp-hr 73.96 3.00E-03 6.00E-04 517.72 2.10E-02 4.20E-03 0.01 0.01 2.62E-03 1.21E-03 6.99E-04 6.99E-04 0.67 2.74E-05 5.48E-06 0.68Rubber Tired Dozers 20 Diesel 247 98.80 D302 7.08 4.69 1.77 0.93 0.27 0.27 g/hp-hr 73.96 3.00E-03 6.00E-04 517.72 2.10E-02 4.20E-03 0.02 0.01 3.86E-03 2.03E-03 5.84E-04 5.84E-04 1.13 4.57E-05 9.15E-06 1.13Tractors/Loaders/Backhoes 40 Diesel 97 35.89 D101 8.05 6.71 2.01 0.93 0.54 0.54 g/hp-hr 73.96 3.00E-03 6.00E-04 517.72 2.10E-02 4.20E-03 0.01 0.01 3.18E-03 1.47E-03 8.49E-04 8.49E-04 0.82 3.32E-05 6.65E-06 0.82Cement and Mortar Mixers 200 Diesel 9 5.04 D11 8.05 10.73 2.01 0.93 1.07 1.07 g/hp-hr 73.96 3.00E-03 6.00E-04 517.72 2.10E-02 4.20E-03 0.01 0.01 2.24E-03 1.03E-03 1.19E-03 1.19E-03 0.58 2.33E-05 4.67E-06 0.58Pavers 50 Diesel 130 54.60 D174 7.08 6.71 1.77 0.93 0.40 0.40 g/hp-hr 73.96 3.00E-03 6.00E-04 517.72 2.10E-02 4.20E-03 0.02 0.02 5.33E-03 2.80E-03 1.21E-03 1.21E-03 1.56 6.32E-05 1.26E-05 1.56Rollers 50 Diesel 80 30.40 D101 8.05 6.71 2.01 0.93 0.54 0.54 g/hp-hr 73.96 3.00E-03 6.00E-04 517.72 2.10E-02 4.20E-03 0.01 0.01 3.37E-03 1.56E-03 8.99E-04 8.99E-04 0.87 3.52E-05 7.04E-06 0.87Tractors/Loaders/Backhoes 50 Diesel 97 35.89 D101 8.05 6.71 2.01 0.93 0.54 0.54 g/hp-hr 73.96 3.00E-03 6.00E-04 517.72 2.10E-02 4.20E-03 0.02 0.01 3.98E-03 1.84E-03 1.06E-03 1.06E-03 1.02 4.15E-05 8.31E-06 1.03Air Compressors 50 Diesel 78 37.44 D101 8.05 6.71 2.01 0.93 0.54 0.54 g/hp-hr 73.96 3.00E-03 6.00E-04 517.72 2.10E-02 4.20E-03 0.02 0.01 4.15E-03 1.92E-03 1.11E-03 1.11E-03 1.07 4.33E-05 8.67E-06 1.07
Total 0.13 0.20 0.03 0.02 0.01 0.01 22.44 9.41E-04 1.88E-04 22.52(a) Equipment usage based on construction schedule
(d) Greenhouse gas emissions from 40 CFR 98; conversion of 7000 Btu/hp-hr is assumed(e) Global warming potentials: CO2 = 1; CH4 = 25; N2O = 298 (Table A-1 to Subpart A of 40 CFR 98)
(b) Load Factors from Appendix A of EPA 420_P-04-005, Median Life, Annual Activity, and Load Factor Values for Nonroad Engine Emissions Modeling, USEPA, EPA 2004
Equipment
Equipment
Usage (Hours)a Fuel Type HP each
Effective Loaded
Powerb Miles/yearEmission Factor
Category
Criteria Emission Factors c
UnitsCriteria Emission Factor
Basis
GHG Emission Factors (kg/MMBtu)d GHG Emission Factors (g/hp-hr)d Criteria Emissions (tons per year) GHG Emissions (tons per year)e
40 CFR 89.112, Tier 2
(b) Load Factors from Appendix A of EPA 420_P-04-005, Median Life, Annual Activity, and Load Factor Values for Nonroad Engine Emissions Modeling, USEPA, EPA 2004
Equipment
Equipment
Usage (Hours)a Fuel Type HP each
Effective Loaded
Powerb Miles/yearEmission Factor
Category
Criteria Emission Factors c
UnitsCriteria Emission Factor
Basis
GHG Emissions (tons per year)e
40 CFR 89.112, Tier 2
GHG Emissions (tons per year)e
40 CFR 89.112, Tier 2
(b) Load Factors from Appendix A of EPA 420_P-04-005, Median Life, Annual Activity, and Load Factor Values for Nonroad Engine Emissions Modeling, USEPA, EPA 2004
Equipment
Equipment
Usage (Hours)a Fuel Type HP each
Effective Loaded
Powerb Miles/yearEmission Factor
Category
Criteria Emission Factors c
UnitsCriteria Emission Factor
Basis
GHG Emission Factors (kg/MMBtu)d GHG Emission Factors (g/hp-hr)d Criteria Emissions (tons per year)
GHG Emission Factors (kg/MMBtu)d GHG Emission Factors (g/hp-hr)d Criteria Emissions (tons per year)
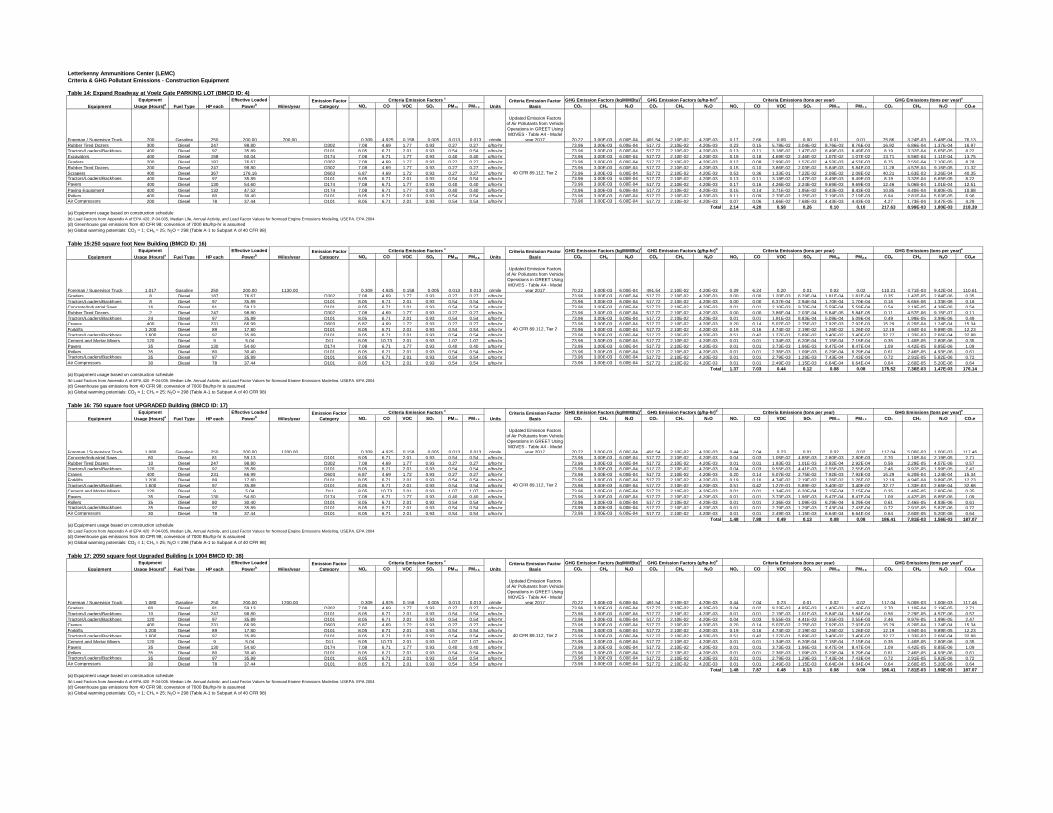
Letterkenny Ammunitions Center (LEMC)Criteria & GHG Pollutant Emissions - Construction Equipment
Table 14: Expand Roadway at Voelz Gate PARKING LOT (BMCD ID: 4)
NOx CO VOC SO2 PM10 PM2.5 CO2 CH4 N2O CO2 CH4 N2O NOx CO VOC SO2 PM10 PM2.5 CO2 CH4 N2O CO2e
Foreman / Supervisor Truck 700 Gasoline 250 200.00 700.00 0.309 4.925 0.158 0.005 0.013 0.013 g/mile
Updated Emission Factors of Air Pollutants from Vehicle Operations in GREET Using MOVES - Table A4 - Model
year 2017 70.22 3.00E-03 6.00E-04 491.54 2.10E-02 4.20E-03 0.17 2.66 0.09 0.00 0.01 0.01 75.86 3.24E-03 6.48E-04 76.13Rubber Tired Dozers 300 Diesel 247 98.80 D302 7.08 4.69 1.77 0.93 0.27 0.27 g/hp-hr 73.96 3.00E-03 6.00E-04 517.72 2.10E-02 4.20E-03 0.23 0.15 5.78E-02 3.04E-02 8.76E-03 8.76E-03 16.92 6.86E-04 1.37E-04 16.97Tractors/Loaders/Backhoes 400 Diesel 97 35.89 D101 8.05 6.71 2.01 0.93 0.54 0.54 g/hp-hr 73.96 3.00E-03 6.00E-04 517.72 2.10E-02 4.20E-03 0.13 0.11 3.18E-02 1.47E-02 8.49E-03 8.49E-03 8.19 3.32E-04 6.65E-05 8.22Excavators 400 Diesel 158 60.04 D174 7.08 6.71 1.77 0.93 0.40 0.40 g/hp-hr 73.96 3.00E-03 6.00E-04 517.72 2.10E-02 4.20E-03 0.19 0.18 4.69E-02 2.46E-02 1.07E-02 1.07E-02 13.71 5.56E-04 1.11E-04 13.75Graders 200 Diesel 187 76.67 D302 7.08 4.69 1.77 0.93 0.27 0.27 g/hp-hr 73.96 3.00E-03 6.00E-04 517.72 2.10E-02 4.20E-03 0.12 0.08 2.99E-02 1.57E-02 4.53E-03 4.53E-03 8.75 3.55E-04 7.10E-05 8.78Rubber Tired Dozers 200 Diesel 247 98.80 D302 7.08 4.69 1.77 0.93 0.27 0.27 g/hp-hr 73.96 3.00E-03 6.00E-04 517.72 2.10E-02 4.20E-03 0.15 0.10 3.86E-02 2.03E-02 5.84E-03 5.84E-03 11.28 4.57E-04 9.15E-05 11.32Scrapers 400 Diesel 367 176.16 D603 6.87 4.69 1.72 0.93 0.27 0.27 g/hp-hr 73.96 3.00E-03 6.00E-04 517.72 2.10E-02 4.20E-03 0.53 0.36 1.33E-01 7.22E-02 2.08E-02 2.08E-02 40.21 1.63E-03 3.26E-04 40.35Tractors/Loaders/Backhoes 400 Diesel 97 35.89 D101 8.05 6.71 2.01 0.93 0.54 0.54 g/hp-hr 73.96 3.00E-03 6.00E-04 517.72 2.10E-02 4.20E-03 0.13 0.11 3.18E-02 1.47E-02 8.49E-03 8.49E-03 8.19 3.32E-04 6.65E-05 8.22Pavers 400 Diesel 130 54.60 D174 7.08 6.71 1.77 0.93 0.40 0.40 g/hp-hr 73.96 3.00E-03 6.00E-04 517.72 2.10E-02 4.20E-03 0.17 0.16 4.26E-02 2.24E-02 9.69E-03 9.69E-03 12.46 5.06E-04 1.01E-04 12.51Paving Equipment 400 Diesel 132 47.52 D174 7.08 6.71 1.77 0.93 0.40 0.40 g/hp-hr 73.96 3.00E-03 6.00E-04 517.72 2.10E-02 4.20E-03 0.15 0.14 3.71E-02 1.95E-02 8.43E-03 8.43E-03 10.85 4.40E-04 8.80E-05 10.88Rollers 400 Diesel 80 30.40 D101 8.05 6.71 2.01 0.93 0.54 0.54 g/hp-hr 73.96 3.00E-03 6.00E-04 517.72 2.10E-02 4.20E-03 0.11 0.09 2.70E-02 1.25E-02 7.19E-03 7.19E-03 6.94 2.81E-04 5.63E-05 6.96Air Compressors 200 Diesel 78 37.44 D101 8.05 6.71 2.01 0.93 0.54 0.54 g/hp-hr 73.96 3.00E-03 6.00E-04 517.72 2.10E-02 4.20E-03 0.07 0.06 1.66E-02 7.68E-03 4.43E-03 4.43E-03 4.27 1.73E-04 3.47E-05 4.29
Total 2.14 4.20 0.58 0.26 0.10 0.10 217.63 8.99E-03 1.80E-03 218.39(a) Equipment usage based on construction schedule
(d) Greenhouse gas emissions from 40 CFR 98; conversion of 7000 Btu/hp-hr is assumed(e) Global warming potentials: CO2 = 1; CH4 = 25; N2O = 298 (Table A-1 to Subpart A of 40 CFR 98)
Table 15:250 square foot New Building (BMCD ID: 16)
NOx CO VOC SO2 PM10 PM2.5 CO2 CH4 N2O CO2 CH4 N2O NOx CO VOC SO2 PM10 PM2.5 CO2 CH4 N2O CO2e
Foreman / Supervisor Truck 1,017 Gasoline 250 200.00 1130.00 0.309 4.925 0.158 0.005 0.013 0.013 g/mile
Updated Emission Factors of Air Pollutants from Vehicle Operations in GREET Using MOVES - Table A4 - Model
year 2017 70.22 3.00E-03 6.00E-04 491.54 2.10E-02 4.20E-03 0.39 6.24 0.20 0.01 0.02 0.02 110.21 4.71E-03 9.42E-04 110.61Graders 8 Diesel 187 76.67 D302 7.08 4.69 1.77 0.93 0.27 0.27 g/hp-hr 73.96 3.00E-03 6.00E-04 517.72 2.10E-02 4.20E-03 0.00 0.00 1.20E-03 6.29E-04 1.81E-04 1.81E-04 0.35 1.42E-05 2.84E-06 0.35Tractors/Loaders/Backhoes 8 Diesel 97 35.89 D101 8.05 6.71 2.01 0.93 0.54 0.54 g/hp-hr 73.96 3.00E-03 6.00E-04 517.72 2.10E-02 4.20E-03 0.00 0.00 6.37E-04 2.94E-04 1.70E-04 1.70E-04 0.16 6.65E-06 1.33E-06 0.16Concrete/Industrial Saws 16 Diesel 81 59.13 D101 8.05 6.71 2.01 0.93 0.54 0.54 g/hp-hr 73.96 3.00E-03 6.00E-04 517.72 2.10E-02 4.20E-03 0.01 0.01 2.10E-03 9.70E-04 5.59E-04 5.59E-04 0.54 2.19E-05 4.38E-06 0.54Rubber Tired Dozers 2 Diesel 247 98.80 D302 7.08 4.69 1.77 0.93 0.27 0.27 g/hp-hr 73.96 3.00E-03 6.00E-04 517.72 2.10E-02 4.20E-03 0.00 0.00 3.86E-04 2.03E-04 5.84E-05 5.84E-05 0.11 4.57E-06 9.15E-07 0.11Tractors/Loaders/Backhoes 24 Diesel 97 35.89 D101 8.05 6.71 2.01 0.93 0.54 0.54 g/hp-hr 73.96 3.00E-03 6.00E-04 517.72 2.10E-02 4.20E-03 0.01 0.01 1.91E-03 8.83E-04 5.09E-04 5.09E-04 0.49 1.99E-05 3.99E-06 0.49Cranes 400 Diesel 231 66.99 D603 6.87 4.69 1.72 0.93 0.27 0.27 g/hp-hr 73.96 3.00E-03 6.00E-04 517.72 2.10E-02 4.20E-03 0.20 0.14 5.07E-02 2.75E-02 7.92E-03 7.92E-03 15.29 6.20E-04 1.24E-04 15.34Forklifts 1,200 Diesel 89 17.80 D101 8.05 6.71 2.01 0.93 0.54 0.54 g/hp-hr 73.96 3.00E-03 6.00E-04 517.72 2.10E-02 4.20E-03 0.19 0.16 4.74E-02 2.19E-02 1.26E-02 1.26E-02 12.19 4.94E-04 9.89E-05 12.23Tractors/Loaders/Backhoes 1,600 Diesel 97 35.89 D101 8.05 6.71 2.01 0.93 0.54 0.54 g/hp-hr 73.96 3.00E-03 6.00E-04 517.72 2.10E-02 4.20E-03 0.51 0.42 1.27E-01 5.89E-02 3.40E-02 3.40E-02 32.77 1.33E-03 2.66E-04 32.88Cement and Mortar Mixers 120 Diesel 9 5.04 D11 8.05 10.73 2.01 0.93 1.07 1.07 g/hp-hr 73.96 3.00E-03 6.00E-04 517.72 2.10E-02 4.20E-03 0.01 0.01 1.34E-03 6.20E-04 7.15E-04 7.15E-04 0.35 1.40E-05 2.80E-06 0.35Pavers 35 Diesel 130 54.60 D174 7.08 6.71 1.77 0.93 0.40 0.40 g/hp-hr 73.96 3.00E-03 6.00E-04 517.72 2.10E-02 4.20E-03 0.01 0.01 3.73E-03 1.96E-03 8.47E-04 8.47E-04 1.09 4.42E-05 8.85E-06 1.09Rollers 35 Diesel 80 30.40 D101 8.05 6.71 2.01 0.93 0.54 0.54 g/hp-hr 73.96 3.00E-03 6.00E-04 517.72 2.10E-02 4.20E-03 0.01 0.01 2.36E-03 1.09E-03 6.29E-04 6.29E-04 0.61 2.46E-05 4.93E-06 0.61Tractors/Loaders/Backhoes 35 Diesel 97 35.89 D101 8.05 6.71 2.01 0.93 0.54 0.54 g/hp-hr 73.96 3.00E-03 6.00E-04 517.72 2.10E-02 4.20E-03 0.01 0.01 2.79E-03 1.29E-03 7.43E-04 7.43E-04 0.72 2.91E-05 5.82E-06 0.72Air Compressors 30 Diesel 78 37.44 D101 8.05 6.71 2.01 0.93 0.54 0.54 g/hp-hr 73.96 3.00E-03 6.00E-04 517.72 2.10E-02 4.20E-03 0.01 0.01 2.49E-03 1.15E-03 6.64E-04 6.64E-04 0.64 2.60E-05 5.20E-06 0.64
Total 1.37 7.03 0.44 0.12 0.08 0.08 175.52 7.36E-03 1.47E-03 176.14(a) Equipment usage based on construction schedule
(d) Greenhouse gas emissions from 40 CFR 98; conversion of 7000 Btu/hp-hr is assumed(e) Global warming potentials: CO2 = 1; CH4 = 25; N2O = 298 (Table A-1 to Subpart A of 40 CFR 98)
Table 16: 750 square foot UPGRADED Building (BMCD ID: 17)
NOx CO VOC SO2 PM10 PM2.5 CO2 CH4 N2O CO2 CH4 N2O NOx CO VOC SO2 PM10 PM2.5 CO2 CH4 N2O CO2e
Foreman / Supervisor Truck 1,080 Gasoline 250 200.00 1200.00 0.309 4.925 0.158 0.005 0.013 0.013 g/mile
Updated Emission Factors of Air Pollutants from Vehicle Operations in GREET Using MOVES - Table A4 - Model
year 2017 70.22 3.00E-03 6.00E-04 491.54 2.10E-02 4.20E-03 0.44 7.04 0.23 0.01 0.02 0.02 117.04 5.00E-03 1.00E-03 117.46Concrete/Industrial Saws 80 Diesel 81 59.13 D101 8.05 6.71 2.01 0.93 0.54 0.54 g/hp-hr 73.96 3.00E-03 6.00E-04 517.72 2.10E-02 4.20E-03 0.04 0.03 1.05E-02 4.85E-03 2.80E-03 2.80E-03 2.70 1.10E-04 2.19E-05 2.71Rubber Tired Dozers 10 Diesel 247 98.80 D302 7.08 4.69 1.77 0.93 0.27 0.27 g/hp-hr 73.96 3.00E-03 6.00E-04 517.72 2.10E-02 4.20E-03 0.01 0.01 1.93E-03 1.01E-03 2.92E-04 2.92E-04 0.56 2.29E-05 4.57E-06 0.57Tractors/Loaders/Backhoes 120 Diesel 97 35.89 D101 8.05 6.71 2.01 0.93 0.54 0.54 g/hp-hr 73.96 3.00E-03 6.00E-04 517.72 2.10E-02 4.20E-03 0.04 0.03 9.55E-03 4.41E-03 2.55E-03 2.55E-03 2.46 9.97E-05 1.99E-05 2.47Cranes 400 Diesel 231 66.99 D603 6.87 4.69 1.72 0.93 0.27 0.27 g/hp-hr 73.96 3.00E-03 6.00E-04 517.72 2.10E-02 4.20E-03 0.20 0.14 5.07E-02 2.75E-02 7.92E-03 7.92E-03 15.29 6.20E-04 1.24E-04 15.34Forklifts 1,200 Diesel 89 17.80 D101 8.05 6.71 2.01 0.93 0.54 0.54 g/hp-hr 73.96 3.00E-03 6.00E-04 517.72 2.10E-02 4.20E-03 0.19 0.16 4.74E-02 2.19E-02 1.26E-02 1.26E-02 12.19 4.94E-04 9.89E-05 12.23Tractors/Loaders/Backhoes 1,600 Diesel 97 35.89 D101 8.05 6.71 2.01 0.93 0.54 0.54 g/hp-hr 73.96 3.00E-03 6.00E-04 517.72 2.10E-02 4.20E-03 0.51 0.42 1.27E-01 5.89E-02 3.40E-02 3.40E-02 32.77 1.33E-03 2.66E-04 32.88Cement and Mortar Mixers 120 Diesel 9 5.04 D11 8.05 10.73 2.01 0.93 1.07 1.07 g/hp-hr 73.96 3.00E-03 6.00E-04 517.72 2.10E-02 4.20E-03 0.01 0.01 1.34E-03 6.20E-04 7.15E-04 7.15E-04 0.35 1.40E-05 2.80E-06 0.35Pavers 35 Diesel 130 54.60 D174 7.08 6.71 1.77 0.93 0.40 0.40 g/hp-hr 73.96 3.00E-03 6.00E-04 517.72 2.10E-02 4.20E-03 0.01 0.01 3.73E-03 1.96E-03 8.47E-04 8.47E-04 1.09 4.42E-05 8.85E-06 1.09Rollers 35 Diesel 80 30.40 D101 8.05 6.71 2.01 0.93 0.54 0.54 g/hp-hr 73.96 3.00E-03 6.00E-04 517.72 2.10E-02 4.20E-03 0.01 0.01 2.36E-03 1.09E-03 6.29E-04 6.29E-04 0.61 2.46E-05 4.93E-06 0.61Tractors/Loaders/Backhoes 35 Diesel 97 35.89 D101 8.05 6.71 2.01 0.93 0.54 0.54 g/hp-hr 73.96 3.00E-03 6.00E-04 517.72 2.10E-02 4.20E-03 0.01 0.01 2.79E-03 1.29E-03 7.43E-04 7.43E-04 0.72 2.91E-05 5.82E-06 0.72Air Compressors 30 Diesel 78 37.44 D101 8.05 6.71 2.01 0.93 0.54 0.54 g/hp-hr 73.96 3.00E-03 6.00E-04 517.72 2.10E-02 4.20E-03 0.01 0.01 2.49E-03 1.15E-03 6.64E-04 6.64E-04 0.64 2.60E-05 5.20E-06 0.64
Total 1.48 7.88 0.49 0.13 0.08 0.08 186.41 7.81E-03 1.56E-03 187.07(a) Equipment usage based on construction schedule
(d) Greenhouse gas emissions from 40 CFR 98; conversion of 7000 Btu/hp-hr is assumed(e) Global warming potentials: CO2 = 1; CH4 = 25; N2O = 298 (Table A-1 to Subpart A of 40 CFR 98)
Table 17: 2050 square foot Upgraded Building (x 1004 BMCD ID: 38)
NOx CO VOC SO2 PM10 PM2.5 CO2 CH4 N2O CO2 CH4 N2O NOx CO VOC SO2 PM10 PM2.5 CO2 CH4 N2O CO2e
Foreman / Supervisor Truck 1,080 Gasoline 250 200.00 1200.00 0.309 4.925 0.158 0.005 0.013 0.013 g/mile
Updated Emission Factors of Air Pollutants from Vehicle Operations in GREET Using MOVES - Table A4 - Model
year 2017 70.22 3.00E-03 6.00E-04 491.54 2.10E-02 4.20E-03 0.44 7.04 0.23 0.01 0.02 0.02 117.04 5.00E-03 1.00E-03 117.46Graders 80 Diesel 81 59.13 D302 7.08 4.69 1.77 0.93 0.27 0.27 g/hp-hr 73.96 3.00E-03 6.00E-04 517.72 2.10E-02 4.20E-03 0.04 0.02 9.23E-03 4.85E-03 1.40E-03 1.40E-03 2.70 1.10E-04 2.19E-05 2.71Tractors/Loaders/Backhoes 10 Diesel 247 98.80 D101 8.05 6.71 2.01 0.93 0.54 0.54 g/hp-hr 73.96 3.00E-03 6.00E-04 517.72 2.10E-02 4.20E-03 0.01 0.01 2.19E-03 1.01E-03 5.84E-04 5.84E-04 0.56 2.29E-05 4.57E-06 0.57Tractors/Loaders/Backhoes 120 Diesel 97 35.89 D101 8.05 6.71 2.01 0.93 0.54 0.54 g/hp-hr 73.96 3.00E-03 6.00E-04 517.72 2.10E-02 4.20E-03 0.04 0.03 9.55E-03 4.41E-03 2.55E-03 2.55E-03 2.46 9.97E-05 1.99E-05 2.47Cranes 400 Diesel 231 66.99 D603 6.87 4.69 1.72 0.93 0.27 0.27 g/hp-hr 73.96 3.00E-03 6.00E-04 517.72 2.10E-02 4.20E-03 0.20 0.14 5.07E-02 2.75E-02 7.92E-03 7.92E-03 15.29 6.20E-04 1.24E-04 15.34Forklifts 1,200 Diesel 89 17.80 D101 8.05 6.71 2.01 0.93 0.54 0.54 g/hp-hr 73.96 3.00E-03 6.00E-04 517.72 2.10E-02 4.20E-03 0.19 0.16 4.74E-02 2.19E-02 1.26E-02 1.26E-02 12.19 4.94E-04 9.89E-05 12.23Tractors/Loaders/Backhoes 1,600 Diesel 97 35.89 D101 8.05 6.71 2.01 0.93 0.54 0.54 g/hp-hr 73.96 3.00E-03 6.00E-04 517.72 2.10E-02 4.20E-03 0.51 0.42 1.27E-01 5.89E-02 3.40E-02 3.40E-02 32.77 1.33E-03 2.66E-04 32.88Cement and Mortar Mixers 120 Diesel 9 5.04 D11 8.05 10.73 2.01 0.93 1.07 1.07 g/hp-hr 73.96 3.00E-03 6.00E-04 517.72 2.10E-02 4.20E-03 0.01 0.01 1.34E-03 6.20E-04 7.15E-04 7.15E-04 0.35 1.40E-05 2.80E-06 0.35Pavers 35 Diesel 130 54.60 D174 7.08 6.71 1.77 0.93 0.40 0.40 g/hp-hr 73.96 3.00E-03 6.00E-04 517.72 2.10E-02 4.20E-03 0.01 0.01 3.73E-03 1.96E-03 8.47E-04 8.47E-04 1.09 4.42E-05 8.85E-06 1.09Rollers 35 Diesel 80 30.40 D101 8.05 6.71 2.01 0.93 0.54 0.54 g/hp-hr 73.96 3.00E-03 6.00E-04 517.72 2.10E-02 4.20E-03 0.01 0.01 2.36E-03 1.09E-03 6.29E-04 6.29E-04 0.61 2.46E-05 4.93E-06 0.61Tractors/Loaders/Backhoes 35 Diesel 97 35.89 D101 8.05 6.71 2.01 0.93 0.54 0.54 g/hp-hr 73.96 3.00E-03 6.00E-04 517.72 2.10E-02 4.20E-03 0.01 0.01 2.79E-03 1.29E-03 7.43E-04 7.43E-04 0.72 2.91E-05 5.82E-06 0.72Air Compressors 30 Diesel 78 37.44 D101 8.05 6.71 2.01 0.93 0.54 0.54 g/hp-hr 73.96 3.00E-03 6.00E-04 517.72 2.10E-02 4.20E-03 0.01 0.01 2.49E-03 1.15E-03 6.64E-04 6.64E-04 0.64 2.60E-05 5.20E-06 0.64
Total 1.48 7.87 0.48 0.13 0.08 0.08 186.41 7.81E-03 1.56E-03 187.07(a) Equipment usage based on construction schedule
(d) Greenhouse gas emissions from 40 CFR 98; conversion of 7000 Btu/hp-hr is assumed(e) Global warming potentials: CO2 = 1; CH4 = 25; N2O = 298 (Table A-1 to Subpart A of 40 CFR 98)
40 CFR 89.112, Tier 2
(b) Load Factors from Appendix A of EPA 420_P-04-005, Median Life, Annual Activity, and Load Factor Values for Nonroad Engine Emissions Modeling, USEPA, EPA 2004
Miles/yearEmission Factor
Category
Criteria Emission Factors c
UnitsCriteria Emission Factor
Basis
GHG Emission Factors (kg/MMBtu)d GHG Emission Factors (g/hp-hr)d Criteria Emissions (tons per year) GHG Emissions (tons per year)e
GHG Emissions (tons per year)e
40 CFR 89.112, Tier 2
(b) Load Factors from Appendix A of EPA 420_P-04-005, Median Life, Annual Activity, and Load Factor Values for Nonroad Engine Emissions Modeling, USEPA, EPA 2004
Equipment
Equipment
Usage (Hours)a Fuel Type HP each
Effective Loaded
Powerb Miles/yearEmission Factor
Category
Criteria Emission Factors c
UnitsCriteria Emission Factor
Basis
GHG Emission Factors (kg/MMBtu)d GHG Emission Factors (g/hp-hr)d Criteria Emissions (tons per year) GHG Emissions (tons per year)e
Equipment
Equipment
Usage (Hours)a Fuel Type HP each
Effective Loaded
Powerb Miles/year
GHG Emissions (tons per year)e
40 CFR 89.112, Tier 2
(b) Load Factors from Appendix A of EPA 420_P-04-005, Median Life, Annual Activity, and Load Factor Values for Nonroad Engine Emissions Modeling, USEPA, EPA 2004
Equipment
Equipment
Usage (Hours)a Fuel Type HP each
Effective Loaded
Powerb Miles/yearEmission Factor
Category
Criteria Emission Factors c
UnitsCriteria Emission Factor
Basis
GHG Emission Factors (kg/MMBtu)d GHG Emission Factors (g/hp-hr)d Criteria Emissions (tons per year)
Emission Factor Category
Criteria Emission Factors c
UnitsCriteria Emission Factor
Basis
GHG Emission Factors (kg/MMBtu)d GHG Emission Factors (g/hp-hr)d Criteria Emissions (tons per year)
40 CFR 89.112, Tier 2
(b) Load Factors from Appendix A of EPA 420_P-04-005, Median Life, Annual Activity, and Load Factor Values for Nonroad Engine Emissions Modeling, USEPA, EPA 2004
Equipment
Equipment
Usage (Hours)a Fuel Type HP each
Effective Loaded
Powerb

Letterkenny Ammunitions Center (LEMC)Criteria & GHG Pollutant Emissions - Construction Equipment
Table 18: 4400 square foot Upgraded Building (BMCD ID: 28)
NOx CO VOC SO2 PM10 PM2.5 CO2 CH4 N2O CO2 CH4 N2O NOx CO VOC SO2 PM10 PM2.5 CO2 CH4 N2O CO2e
Foreman / Supervisor Truck 1,080 Gasoline 250 200.00 1200.00 0.309 4.925 0.158 0.005 0.013 0.013 g/mile
Updated Emission Factors of Air Pollutants from Vehicle Operations in GREET Using MOVES - Table A4 - Model
year 2017 70.22 3.00E-03 6.00E-04 491.54 2.10E-02 4.20E-03 0.44 7.04 0.23 0.01 0.02 0.02 117.04 5.00E-03 1.00E-03 117.46Graders 80 Diesel 81 59.13 D302 7.08 4.69 1.77 0.93 0.27 0.27 g/hp-hr 73.96 3.00E-03 6.00E-04 517.72 2.10E-02 4.20E-03 0.04 0.02 9.23E-03 4.85E-03 1.40E-03 1.40E-03 2.70 1.10E-04 2.19E-05 2.71Tractors/Loaders/Backhoes 10 Diesel 247 98.80 D101 8.05 6.71 2.01 0.93 0.54 0.54 g/hp-hr 73.96 3.00E-03 6.00E-04 517.72 2.10E-02 4.20E-03 0.01 0.01 2.19E-03 1.01E-03 5.84E-04 5.84E-04 0.56 2.29E-05 4.57E-06 0.57Tractors/Loaders/Backhoes 120 Diesel 97 35.89 D101 8.05 6.71 2.01 0.93 0.54 0.54 g/hp-hr 73.96 3.00E-03 6.00E-04 517.72 2.10E-02 4.20E-03 0.04 0.03 9.55E-03 4.41E-03 2.55E-03 2.55E-03 2.46 9.97E-05 1.99E-05 2.47Cranes 400 Diesel 231 66.99 D603 6.87 4.69 1.72 0.93 0.27 0.27 g/hp-hr 73.96 3.00E-03 6.00E-04 517.72 2.10E-02 4.20E-03 0.20 0.14 5.07E-02 2.75E-02 7.92E-03 7.92E-03 15.29 6.20E-04 1.24E-04 15.34Forklifts 1,200 Diesel 89 17.80 D101 8.05 6.71 2.01 0.93 0.54 0.54 g/hp-hr 73.96 3.00E-03 6.00E-04 517.72 2.10E-02 4.20E-03 0.19 0.16 4.74E-02 2.19E-02 1.26E-02 1.26E-02 12.19 4.94E-04 9.89E-05 12.23Tractors/Loaders/Backhoes 1,600 Diesel 97 35.89 D101 8.05 6.71 2.01 0.93 0.54 0.54 g/hp-hr 73.96 3.00E-03 6.00E-04 517.72 2.10E-02 4.20E-03 0.51 0.42 1.27E-01 5.89E-02 3.40E-02 3.40E-02 32.77 1.33E-03 2.66E-04 32.88Cement and Mortar Mixers 120 Diesel 9 5.04 D11 8.05 10.73 2.01 0.93 1.07 1.07 g/hp-hr 73.96 3.00E-03 6.00E-04 517.72 2.10E-02 4.20E-03 0.01 0.01 1.34E-03 6.20E-04 7.15E-04 7.15E-04 0.35 1.40E-05 2.80E-06 0.35Pavers 35 Diesel 130 54.60 D174 7.08 6.71 1.77 0.93 0.40 0.40 g/hp-hr 73.96 3.00E-03 6.00E-04 517.72 2.10E-02 4.20E-03 0.01 0.01 3.73E-03 1.96E-03 8.47E-04 8.47E-04 1.09 4.42E-05 8.85E-06 1.09Rollers 35 Diesel 80 30.40 D101 8.05 6.71 2.01 0.93 0.54 0.54 g/hp-hr 73.96 3.00E-03 6.00E-04 517.72 2.10E-02 4.20E-03 0.01 0.01 2.36E-03 1.09E-03 6.29E-04 6.29E-04 0.61 2.46E-05 4.93E-06 0.61Tractors/Loaders/Backhoes 35 Diesel 97 35.89 D101 8.05 6.71 2.01 0.93 0.54 0.54 g/hp-hr 73.96 3.00E-03 6.00E-04 517.72 2.10E-02 4.20E-03 0.01 0.01 2.79E-03 1.29E-03 7.43E-04 7.43E-04 0.72 2.91E-05 5.82E-06 0.72Air Compressors 30 Diesel 78 37.44 D101 8.05 6.71 2.01 0.93 0.54 0.54 g/hp-hr 73.96 3.00E-03 6.00E-04 517.72 2.10E-02 4.20E-03 0.01 0.01 2.49E-03 1.15E-03 6.64E-04 6.64E-04 0.64 2.60E-05 5.20E-06 0.64
Total 1.48 7.87 0.48 0.13 0.08 0.08 186.41 7.81E-03 1.56E-03 187.07(a) Equipment usage based on construction schedule
(d) Greenhouse gas emissions from 40 CFR 98; conversion of 7000 Btu/hp-hr is assumed(e) Global warming potentials: CO2 = 1; CH4 = 25; N2O = 298 (Table A-1 to Subpart A of 40 CFR 98)
Table 19: 5878 square foot Upgraded Building (BMCD ID: 34 and 37)
NOx CO VOC SO2 PM10 PM2.5 CO2 CH4 N2O CO2 CH4 N2O NOx CO VOC SO2 PM10 PM2.5 CO2 CH4 N2O CO2e
Foreman / Supervisor Truck 1,080 Gasoline 250 200.00 1200.00 0.309 4.925 0.158 0.005 0.013 0.013 g/mile
Updated Emission Factors of Air Pollutants from Vehicle Operations in GREET Using MOVES - Table A4 - Model
year 2017 70.22 3.00E-03 6.00E-04 491.54 2.10E-02 4.20E-03 0.44 7.04 0.23 0.01 0.02 0.02 117.04 5.00E-03 1.00E-03 117.46Graders 80 Diesel 81 59.13 D302 7.08 4.69 1.77 0.93 0.27 0.27 g/hp-hr 73.96 3.00E-03 6.00E-04 517.72 2.10E-02 4.20E-03 0.04 0.02 9.23E-03 4.85E-03 1.40E-03 1.40E-03 2.70 1.10E-04 2.19E-05 2.71Tractors/Loaders/Backhoes 10 Diesel 247 98.80 D101 8.05 6.71 2.01 0.93 0.54 0.54 g/hp-hr 73.96 3.00E-03 6.00E-04 517.72 2.10E-02 4.20E-03 0.01 0.01 2.19E-03 1.01E-03 5.84E-04 5.84E-04 0.56 2.29E-05 4.57E-06 0.57Tractors/Loaders/Backhoes 120 Diesel 97 35.89 D101 8.05 6.71 2.01 0.93 0.54 0.54 g/hp-hr 73.96 3.00E-03 6.00E-04 517.72 2.10E-02 4.20E-03 0.04 0.03 9.55E-03 4.41E-03 2.55E-03 2.55E-03 2.46 9.97E-05 1.99E-05 2.47Cranes 400 Diesel 231 66.99 D603 6.87 4.69 1.72 0.93 0.27 0.27 g/hp-hr 73.96 3.00E-03 6.00E-04 517.72 2.10E-02 4.20E-03 0.20 0.14 5.07E-02 2.75E-02 7.92E-03 7.92E-03 15.29 6.20E-04 1.24E-04 15.34Forklifts 1,200 Diesel 89 17.80 D101 8.05 6.71 2.01 0.93 0.54 0.54 g/hp-hr 73.96 3.00E-03 6.00E-04 517.72 2.10E-02 4.20E-03 0.19 0.16 4.74E-02 2.19E-02 1.26E-02 1.26E-02 12.19 4.94E-04 9.89E-05 12.23Tractors/Loaders/Backhoes 1,600 Diesel 97 35.89 D101 8.05 6.71 2.01 0.93 0.54 0.54 g/hp-hr 73.96 3.00E-03 6.00E-04 517.72 2.10E-02 4.20E-03 0.51 0.42 1.27E-01 5.89E-02 3.40E-02 3.40E-02 32.77 1.33E-03 2.66E-04 32.88Cement and Mortar Mixers 120 Diesel 9 5.04 D11 8.05 10.73 2.01 0.93 1.07 1.07 g/hp-hr 73.96 3.00E-03 6.00E-04 517.72 2.10E-02 4.20E-03 0.01 0.01 1.34E-03 6.20E-04 7.15E-04 7.15E-04 0.35 1.40E-05 2.80E-06 0.35Pavers 35 Diesel 130 54.60 D174 7.08 6.71 1.77 0.93 0.40 0.40 g/hp-hr 73.96 3.00E-03 6.00E-04 517.72 2.10E-02 4.20E-03 0.01 0.01 3.73E-03 1.96E-03 8.47E-04 8.47E-04 1.09 4.42E-05 8.85E-06 1.09Rollers 35 Diesel 80 30.40 D101 8.05 6.71 2.01 0.93 0.54 0.54 g/hp-hr 73.96 3.00E-03 6.00E-04 517.72 2.10E-02 4.20E-03 0.01 0.01 2.36E-03 1.09E-03 6.29E-04 6.29E-04 0.61 2.46E-05 4.93E-06 0.61Tractors/Loaders/Backhoes 35 Diesel 97 35.89 D101 8.05 6.71 2.01 0.93 0.54 0.54 g/hp-hr 73.96 3.00E-03 6.00E-04 517.72 2.10E-02 4.20E-03 0.01 0.01 2.79E-03 1.29E-03 7.43E-04 7.43E-04 0.72 2.91E-05 5.82E-06 0.72Air Compressors 30 Diesel 78 37.44 D101 8.05 6.71 2.01 0.93 0.54 0.54 g/hp-hr 73.96 3.00E-03 6.00E-04 517.72 2.10E-02 4.20E-03 0.01 0.01 2.49E-03 1.15E-03 6.64E-04 6.64E-04 0.64 2.60E-05 5.20E-06 0.64
Total 1.48 7.87 0.48 0.13 0.08 0.08 186.41 7.81E-03 1.56E-03 187.07(a) Equipment usage based on construction schedule
(d) Greenhouse gas emissions from 40 CFR 98; conversion of 7000 Btu/hp-hr is assumed(e) Global warming potentials: CO2 = 1; CH4 = 25; N2O = 298 (Table A-1 to Subpart A of 40 CFR 98)
Table 20: 12,000 square foot Upgraded Building (BMCD ID: 30 and 35)
NOx CO VOC SO2 PM10 PM2.5 CO2 CH4 N2O CO2 CH4 N2O NOx CO VOC SO2 PM10 PM2.5 CO2 CH4 N2O CO2e
Foreman / Supervisor Truck 1,080 Gasoline 250 200.00 1200.00 0.309 4.925 0.158 0.005 0.013 0.013 g/mile
Updated Emission Factors of Air Pollutants from Vehicle Operations in GREET Using MOVES - Table A4 - Model
year 2017 70.22 3.00E-03 6.00E-04 491.54 2.10E-02 4.20E-03 0.44 7.04 0.23 0.01 0.02 0.02 117.04 5.00E-03 1.00E-03 117.46Graders 80 Diesel 81 59.13 D302 7.08 4.69 1.77 0.93 0.27 0.27 g/hp-hr 73.96 3.00E-03 6.00E-04 517.72 2.10E-02 4.20E-03 0.04 0.02 9.23E-03 4.85E-03 1.40E-03 1.40E-03 2.70 1.10E-04 2.19E-05 2.71Tractors/Loaders/Backhoes 10 Diesel 247 98.80 D101 8.05 6.71 2.01 0.93 0.54 0.54 g/hp-hr 73.96 3.00E-03 6.00E-04 517.72 2.10E-02 4.20E-03 0.01 0.01 2.19E-03 1.01E-03 5.84E-04 5.84E-04 0.56 2.29E-05 4.57E-06 0.57Tractors/Loaders/Backhoes 120 Diesel 97 35.89 D101 8.05 6.71 2.01 0.93 0.54 0.54 g/hp-hr 73.96 3.00E-03 6.00E-04 517.72 2.10E-02 4.20E-03 0.04 0.03 9.55E-03 4.41E-03 2.55E-03 2.55E-03 2.46 9.97E-05 1.99E-05 2.47Cranes 400 Diesel 231 66.99 D603 6.87 4.69 1.72 0.93 0.27 0.27 g/hp-hr 73.96 3.00E-03 6.00E-04 517.72 2.10E-02 4.20E-03 0.20 0.14 5.07E-02 2.75E-02 7.92E-03 7.92E-03 15.29 6.20E-04 1.24E-04 15.34Forklifts 1,200 Diesel 89 17.80 D101 8.05 6.71 2.01 0.93 0.54 0.54 g/hp-hr 73.96 3.00E-03 6.00E-04 517.72 2.10E-02 4.20E-03 0.19 0.16 4.74E-02 2.19E-02 1.26E-02 1.26E-02 12.19 4.94E-04 9.89E-05 12.23Tractors/Loaders/Backhoes 1,600 Diesel 97 35.89 D101 8.05 6.71 2.01 0.93 0.54 0.54 g/hp-hr 73.96 3.00E-03 6.00E-04 517.72 2.10E-02 4.20E-03 0.51 0.42 1.27E-01 5.89E-02 3.40E-02 3.40E-02 32.77 1.33E-03 2.66E-04 32.88Cement and Mortar Mixers 120 Diesel 9 5.04 D11 8.05 10.73 2.01 0.93 1.07 1.07 g/hp-hr 73.96 3.00E-03 6.00E-04 517.72 2.10E-02 4.20E-03 0.01 0.01 1.34E-03 6.20E-04 7.15E-04 7.15E-04 0.35 1.40E-05 2.80E-06 0.35Pavers 35 Diesel 130 54.60 D174 7.08 6.71 1.77 0.93 0.40 0.40 g/hp-hr 73.96 3.00E-03 6.00E-04 517.72 2.10E-02 4.20E-03 0.01 0.01 3.73E-03 1.96E-03 8.47E-04 8.47E-04 1.09 4.42E-05 8.85E-06 1.09Rollers 35 Diesel 80 30.40 D101 8.05 6.71 2.01 0.93 0.54 0.54 g/hp-hr 73.96 3.00E-03 6.00E-04 517.72 2.10E-02 4.20E-03 0.01 0.01 2.36E-03 1.09E-03 6.29E-04 6.29E-04 0.61 2.46E-05 4.93E-06 0.61Tractors/Loaders/Backhoes 35 Diesel 97 35.89 D101 8.05 6.71 2.01 0.93 0.54 0.54 g/hp-hr 73.96 3.00E-03 6.00E-04 517.72 2.10E-02 4.20E-03 0.01 0.01 2.79E-03 1.29E-03 7.43E-04 7.43E-04 0.72 2.91E-05 5.82E-06 0.72Air Compressors 30 Diesel 78 37.44 D101 8.05 6.71 2.01 0.93 0.54 0.54 g/hp-hr 73.96 3.00E-03 6.00E-04 517.72 2.10E-02 4.20E-03 0.01 0.01 2.49E-03 1.15E-03 6.64E-04 6.64E-04 0.64 2.60E-05 5.20E-06 0.64
Total 1.48 7.87 0.48 0.13 0.08 0.08 186.41 7.81E-03 1.56E-03 187.07(a) Equipment usage based on construction schedule
(d) Greenhouse gas emissions from 40 CFR 98; conversion of 7000 Btu/hp-hr is assumed(e) Global warming potentials: CO2 = 1; CH4 = 25; N2O = 298 (Table A-1 to Subpart A of 40 CFR 98)
Table 21: 35,000 square foot REPLACEMENT Building (BMCD ID: 47)
NOx CO VOC SO2 PM10 PM2.5 CO2 CH4 N2O CO2 CH4 N2O NOx CO VOC SO2 PM10 PM2.5 CO2 CH4 N2O CO2e
Foreman / Supervisor Truck 1,130 Gasoline 250 200.00 1130.00 0.309 4.925 0.158 0.005 0.013 0.013 g/mile
Updated Emission Factors of Air Pollutants from Vehicle Operations in GREET Using MOVES - Table A4 - Model
year 2017 70.22 3.00E-03 6.00E-04 491.54 2.10E-02 4.20E-03 0.44 6.93 0.22 0.01 0.02 0.02 122.45 5.23E-03 1.05E-03 122.90Concrete/Industrial Saws 100 Diesel 81 59.13 D101 8.05 6.71 2.01 0.93 0.54 0.54 g/hp-hr 73.96 3.00E-03 6.00E-04 517.72 2.10E-02 4.20E-03 0.05 0.04 1.31E-02 6.06E-03 3.50E-03 3.50E-03 3.37 1.37E-04 2.74E-05 3.39Rubber Tired Dozers 100 Diesel 247 98.80 D302 7.08 4.69 1.77 0.93 0.27 0.27 g/hp-hr 73.96 3.00E-03 6.00E-04 517.72 2.10E-02 4.20E-03 0.08 0.05 1.93E-02 1.01E-02 2.92E-03 2.92E-03 5.64 2.29E-04 4.57E-05 5.66Tractors/Loaders/Backhoes 200 Diesel 97 35.89 D101 8.05 6.71 2.01 0.93 0.54 0.54 g/hp-hr 73.96 3.00E-03 6.00E-04 517.72 2.10E-02 4.20E-03 0.06 0.05 1.59E-02 7.36E-03 4.24E-03 4.24E-03 4.10 1.66E-04 3.32E-05 4.11Graders 10 Diesel 187 76.67 D302 7.08 4.69 1.77 0.93 0.27 0.27 g/hp-hr 73.96 3.00E-03 6.00E-04 517.72 2.10E-02 4.20E-03 0.01 0.00 1.50E-03 7.86E-04 2.27E-04 2.27E-04 0.44 1.77E-05 3.55E-06 0.44Tractors/Loaders/Backhoes 10 Diesel 97 35.89 D101 8.05 6.71 2.01 0.93 0.54 0.54 g/hp-hr 73.96 3.00E-03 6.00E-04 517.72 2.10E-02 4.20E-03 0.00 0.00 7.96E-04 3.68E-04 2.12E-04 2.12E-04 0.20 8.31E-06 1.66E-06 0.21Concrete/Industrial Saws 20 Diesel 81 59.13 D101 8.05 6.71 2.01 0.93 0.54 0.54 g/hp-hr 73.96 3.00E-03 6.00E-04 517.72 2.10E-02 4.20E-03 0.01 0.01 2.62E-03 1.21E-03 6.99E-04 6.99E-04 0.67 2.74E-05 5.48E-06 0.68Rubber Tired Dozers 20 Diesel 247 98.80 D302 7.08 4.69 1.77 0.93 0.27 0.27 g/hp-hr 73.96 3.00E-03 6.00E-04 517.72 2.10E-02 4.20E-03 0.02 0.01 3.86E-03 2.03E-03 5.84E-04 5.84E-04 1.13 4.57E-05 9.15E-06 1.13Tractors/Loaders/Backhoes 40 Diesel 97 35.89 D101 8.05 6.71 2.01 0.93 0.54 0.54 g/hp-hr 73.96 3.00E-03 6.00E-04 517.72 2.10E-02 4.20E-03 0.01 0.01 3.18E-03 1.47E-03 8.49E-04 8.49E-04 0.82 3.32E-05 6.65E-06 0.82Cranes 1,000 Diesel 231 66.99 D603 6.87 4.69 1.72 0.93 0.27 0.27 g/hp-hr 73.96 3.00E-03 6.00E-04 517.72 2.10E-02 4.20E-03 0.51 0.35 1.27E-01 6.87E-02 1.98E-02 1.98E-02 38.23 1.55E-03 3.10E-04 38.36Forklifts 2,000 Diesel 89 17.80 D101 8.05 6.71 2.01 0.93 0.54 0.54 g/hp-hr 73.96 3.00E-03 6.00E-04 517.72 2.10E-02 4.20E-03 0.32 0.26 7.89E-02 3.65E-02 2.10E-02 2.10E-02 20.32 8.24E-04 1.65E-04 20.39Tractors/Loaders/Backhoes 2,000 Diesel 97 35.89 D101 8.05 6.71 2.01 0.93 0.54 0.54 g/hp-hr 73.96 3.00E-03 6.00E-04 517.72 2.10E-02 4.20E-03 0.64 0.53 1.59E-01 7.36E-02 4.24E-02 4.24E-02 40.96 1.66E-03 3.32E-04 41.10Cement and Mortar Mixers 200 Diesel 9 5.04 D11 8.05 10.73 2.01 0.93 1.07 1.07 g/hp-hr 73.96 3.00E-03 6.00E-04 517.72 2.10E-02 4.20E-03 0.01 0.01 2.24E-03 1.03E-03 1.19E-03 1.19E-03 0.58 2.33E-05 4.67E-06 0.58Pavers 50 Diesel 130 54.60 D174 7.08 6.71 1.77 0.93 0.40 0.40 g/hp-hr 73.96 3.00E-03 6.00E-04 517.72 2.10E-02 4.20E-03 0.02 0.02 5.33E-03 2.80E-03 1.21E-03 1.21E-03 1.56 6.32E-05 1.26E-05 1.56Rollers 50 Diesel 80 30.40 D101 8.05 6.71 2.01 0.93 0.54 0.54 g/hp-hr 73.96 3.00E-03 6.00E-04 517.72 2.10E-02 4.20E-03 0.01 0.01 3.37E-03 1.56E-03 8.99E-04 8.99E-04 0.87 3.52E-05 7.04E-06 0.87Tractors/Loaders/Backhoes 50 Diesel 97 35.89 D101 8.05 6.71 2.01 0.93 0.54 0.54 g/hp-hr 73.96 3.00E-03 6.00E-04 517.72 2.10E-02 4.20E-03 0.02 0.01 3.98E-03 1.84E-03 1.06E-03 1.06E-03 1.02 4.15E-05 8.31E-06 1.03Air Compressors 50 Diesel 78 37.44 D101 8.05 6.71 2.01 0.93 0.54 0.54 g/hp-hr 73.96 3.00E-03 6.00E-04 517.72 2.10E-02 4.20E-03 0.02 0.01 4.15E-03 1.92E-03 1.11E-03 1.11E-03 1.07 4.33E-05 8.67E-06 1.07
Total 2.21 8.33 0.67 0.22 0.12 0.12 243.43 1.01E-02 2.03E-03 244.29(a) Equipment usage based on construction schedule
(d) Greenhouse gas emissions from 40 CFR 98; conversion of 7000 Btu/hp-hr is assumed(e) Global warming potentials: CO2 = 1; CH4 = 25; N2O = 298 (Table A-1 to Subpart A of 40 CFR 98)
40 CFR 89.112, Tier 2
(b) Load Factors from Appendix A of EPA 420_P-04-005, Median Life, Annual Activity, and Load Factor Values for Nonroad Engine Emissions Modeling, USEPA, EPA 2004
GHG Emission Factors (g/hp-hr)d Criteria Emissions (tons per year) GHG Emissions (tons per year)e
40 CFR 89.112, Tier 2
(b) Load Factors from Appendix A of EPA 420_P-04-005, Median Life, Annual Activity, and Load Factor Values for Nonroad Engine Emissions Modeling, USEPA, EPA 2004
Equipment
Equipment
Usage (Hours)a Fuel Type HP each
Effective Loaded
Powerb Miles/yearEmission Factor
Category
Criteria Emission Factors c
UnitsCriteria Emission Factor
Basis
GHG Emission Factors (kg/MMBtu)d GHG Emission Factors (g/hp-hr)d Criteria Emissions (tons per year) GHG Emissions (tons per year)e
40 CFR 89.112, Tier 2
(b) Load Factors from Appendix A of EPA 420_P-04-005, Median Life, Annual Activity, and Load Factor Values for Nonroad Engine Emissions Modeling, USEPA, EPA 2004
Equipment
Equipment
Usage (Hours)a Fuel Type HP each
Effective Loaded
Powerb Miles/yearEmission Factor
Category
Criteria Emission Factors c
UnitsCriteria Emission Factor
Basis
GHG Emission Factors (kg/MMBtu)d
GHG Emission Factors (g/hp-hr)d Criteria Emissions (tons per year) GHG Emissions (tons per year)e
40 CFR 89.112, Tier 2
(b) Load Factors from Appendix A of EPA 420_P-04-005, Median Life, Annual Activity, and Load Factor Values for Nonroad Engine Emissions Modeling, USEPA, EPA 2004
Equipment
Equipment
Usage (Hours)a Fuel Type HP each
Effective Loaded
Powerb Miles/yearEmission Factor
Category
Criteria Emission Factors c
UnitsCriteria Emission Factor
Basis
GHG Emission Factors (kg/MMBtu)d GHG Emission Factors (g/hp-hr)d Criteria Emissions (tons per year) GHG Emissions (tons per year)e
Equipment
Equipment
Usage (Hours)a Fuel Type HP each
Effective Loaded
Powerb Miles/yearEmission Factor
Category
Criteria Emission Factors c
UnitsCriteria Emission Factor
Basis
GHG Emission Factors (kg/MMBtu)d

Letterkenny Ammunitions Center (LEMC)Criteria & GHG Pollutant Emissions - Construction Equipment
Table 22: 10 Acre New Security Post Parking lot (BMCD ID: 25a)
NOx CO VOC SO2 PM10 PM2.5 CO2 CH4 N2O CO2 CH4 N2O NOx CO VOC SO2 PM10 PM2.5 CO2 CH4 N2O CO2e
Foreman / Supervisor Truck 234 Gasoline 250 200.00 260.00 0.309 4.925 0.158 0.005 0.013 0.013 g/mile
Updated Emission Factors of Air Pollutants from Vehicle Operations in GREET Using MOVES - Table A4 - Model
year 2017 70.22 3.00E-03 6.00E-04 491.54 2.10E-02 4.20E-03 0.02 0.33 0.01 0.00 0.00 0.00 25.36 1.08E-03 2.17E-04 25.45Graders 16 Diesel 187 76.67 D302 7.08 4.69 1.77 0.93 0.27 0.27 g/hp-hr 73.96 3.00E-03 6.00E-04 517.72 2.10E-02 4.20E-03 0.01 0.01 2.39E-03 1.26E-03 3.63E-04 3.63E-04 0.70 2.84E-05 5.68E-06 0.70Rubber Tired Dozers 14 Diesel 247 98.80 D302 7.08 4.69 1.77 0.93 0.27 0.27 g/hp-hr 73.96 3.00E-03 6.00E-04 517.72 2.10E-02 4.20E-03 0.01 0.01 2.70E-03 1.42E-03 4.09E-04 4.09E-04 0.79 3.20E-05 6.40E-06 0.79Tractors/Loaders/Backhoes 16 Diesel 97 35.89 D101 8.05 6.71 2.01 0.93 0.54 0.54 g/hp-hr 73.96 3.00E-03 6.00E-04 517.72 2.10E-02 4.20E-03 0.01 0.00 1.27E-03 5.89E-04 3.40E-04 3.40E-04 0.33 1.33E-05 2.66E-06 0.33Concrete/Industrial Saws 24 Diesel 187 76.67 D101 8.05 6.71 2.01 0.93 0.54 0.54 g/hp-hr 73.96 3.00E-03 6.00E-04 517.72 2.10E-02 4.20E-03 0.02 0.01 4.08E-03 1.89E-03 1.09E-03 1.09E-03 1.05 4.26E-05 8.52E-06 1.05Rubber Tired Dozers 24 Diesel 247 98.80 D302 7.08 4.69 1.77 0.93 0.27 0.27 g/hp-hr 73.96 3.00E-03 6.00E-04 517.72 2.10E-02 4.20E-03 0.02 0.01 4.63E-03 2.43E-03 7.01E-04 7.01E-04 1.35 5.49E-05 1.10E-05 1.36Tractors/Loaders/Backhoes 28 Diesel 97 35.89 D101 8.05 6.71 2.01 0.93 0.54 0.54 g/hp-hr 73.96 3.00E-03 6.00E-04 517.72 2.10E-02 4.20E-03 0.01 0.01 2.23E-03 1.03E-03 5.94E-04 5.94E-04 0.57 2.33E-05 4.65E-06 0.58Cement and Mortar Mixers 60 Diesel 9 5.04 D11 8.05 10.73 2.01 0.93 1.07 1.07 g/hp-hr 73.96 3.00E-03 6.00E-04 517.72 2.10E-02 4.20E-03 0.00 0.00 6.71E-04 3.10E-04 3.58E-04 3.58E-04 0.17 7.00E-06 1.40E-06 0.17Pavers 60 Diesel 130 54.60 D174 7.08 6.71 1.77 0.93 0.40 0.40 g/hp-hr 73.96 3.00E-03 6.00E-04 517.72 2.10E-02 4.20E-03 0.03 0.02 6.39E-03 3.36E-03 1.45E-03 1.45E-03 1.87 7.58E-05 1.52E-05 1.88Paving Equipment 80 Diesel 132 47.52 D174 7.08 6.71 1.77 0.93 0.40 0.40 g/hp-hr 73.96 3.00E-03 6.00E-04 517.72 2.10E-02 4.20E-03 0.03 0.03 7.42E-03 3.90E-03 1.69E-03 1.69E-03 2.17 8.80E-05 1.76E-05 2.18Rollers 70 Diesel 80 30.40 D101 8.05 6.71 2.01 0.93 0.54 0.54 g/hp-hr 73.96 3.00E-03 6.00E-04 517.72 2.10E-02 4.20E-03 0.02 0.02 4.72E-03 2.18E-03 1.26E-03 1.26E-03 1.21 4.93E-05 9.85E-06 1.22Tractors/Loaders/Backhoes 80 Diesel 97 35.89 D101 8.05 6.71 2.01 0.93 0.54 0.54 g/hp-hr 73.96 3.00E-03 6.00E-04 517.72 2.10E-02 4.20E-03 0.03 0.02 6.37E-03 2.94E-03 1.70E-03 1.70E-03 1.64 6.65E-05 1.33E-05 1.64Air Compressors 60 Diesel 78 37.44 D101 8.05 6.71 2.01 0.93 0.54 0.54 g/hp-hr 73.96 3.00E-03 6.00E-04 517.72 2.10E-02 4.20E-03 0.02 0.02 4.98E-03 2.30E-03 1.33E-03 1.33E-03 1.28 5.20E-05 1.04E-05 1.29
Total 0.21 0.49 0.06 0.02 0.01 0.01 38.50 1.62E-03 3.23E-04 38.64(a) Equipment usage based on construction schedule
(d) Greenhouse gas emissions from 40 CFR 98; conversion of 7000 Btu/hp-hr is assumed(e) Global warming potentials: CO2 = 1; CH4 = 25; N2O = 298 (Table A-1 to Subpart A of 40 CFR 98)
Table 23: 100,000 square foot PARKING LOT (BMCD ID: 22)
NOx CO VOC SO2 PM10 PM2.5 CO2 CH4 N2O CO2 CH4 N2O NOx CO VOC SO2 PM10 PM2.5 CO2 CH4 N2O CO2e
Foreman / Supervisor Truck 700 Gasoline 250 200.00 700.00 0.309 4.925 0.158 0.005 0.013 0.013 g/mile
Updated Emission Factors of Air Pollutants from Vehicle Operations in GREET Using MOVES - Table A4 - Model
year 2017 70.22 3.00E-03 6.00E-04 491.54 2.10E-02 4.20E-03 0.17 2.66 0.09 0.00 0.01 0.01 75.86 3.24E-03 6.48E-04 76.13Rubber Tired Dozers 240 Diesel 247 98.80 D302 7.08 4.69 1.77 0.93 0.27 0.27 g/hp-hr 73.96 3.00E-03 6.00E-04 517.72 2.10E-02 4.20E-03 0.19 0.12 4.63E-02 2.43E-02 7.01E-03 7.01E-03 13.53 5.49E-04 1.10E-04 13.58Tractors/Loaders/Backhoes 320 Diesel 97 35.89 D101 8.05 6.71 2.01 0.93 0.54 0.54 g/hp-hr 73.96 3.00E-03 6.00E-04 517.72 2.10E-02 4.20E-03 0.10 0.08 2.55E-02 1.18E-02 6.79E-03 6.79E-03 6.55 2.66E-04 5.32E-05 6.58Excavators 320 Diesel 158 60.04 D174 7.08 6.71 1.77 0.93 0.40 0.40 g/hp-hr 73.96 3.00E-03 6.00E-04 517.72 2.10E-02 4.20E-03 0.15 0.14 3.75E-02 1.97E-02 8.52E-03 8.52E-03 10.96 4.45E-04 8.89E-05 11.00Graders 160 Diesel 187 76.67 D302 7.08 4.69 1.77 0.93 0.27 0.27 g/hp-hr 73.96 3.00E-03 6.00E-04 517.72 2.10E-02 4.20E-03 0.10 0.06 2.39E-02 1.26E-02 3.63E-03 3.63E-03 7.00 2.84E-04 5.68E-05 7.02Rubber Tired Dozers 160 Diesel 247 98.80 D302 7.08 4.69 1.77 0.93 0.27 0.27 g/hp-hr 73.96 3.00E-03 6.00E-04 517.72 2.10E-02 4.20E-03 0.12 0.08 3.08E-02 1.62E-02 4.67E-03 4.67E-03 9.02 3.66E-04 7.32E-05 9.05Scrapers 320 Diesel 367 176.16 D603 6.87 4.69 1.72 0.93 0.27 0.27 g/hp-hr 73.96 3.00E-03 6.00E-04 517.72 2.10E-02 4.20E-03 0.43 0.29 1.07E-01 5.78E-02 1.67E-02 1.67E-02 32.17 1.30E-03 2.61E-04 32.28Tractors/Loaders/Backhoes 320 Diesel 97 35.89 D101 8.05 6.71 2.01 0.93 0.54 0.54 g/hp-hr 73.96 3.00E-03 6.00E-04 517.72 2.10E-02 4.20E-03 0.10 0.08 2.55E-02 1.18E-02 6.79E-03 6.79E-03 6.55 2.66E-04 5.32E-05 6.58Pavers 320 Diesel 130 54.60 D174 7.08 6.71 1.77 0.93 0.40 0.40 g/hp-hr 73.96 3.00E-03 6.00E-04 517.72 2.10E-02 4.20E-03 0.14 0.13 3.41E-02 1.79E-02 7.75E-03 7.75E-03 9.97 4.04E-04 8.09E-05 10.01Paving Equipment 320 Diesel 132 47.52 D174 7.08 6.71 1.77 0.93 0.40 0.40 g/hp-hr 73.96 3.00E-03 6.00E-04 517.72 2.10E-02 4.20E-03 0.12 0.11 2.97E-02 1.56E-02 6.74E-03 6.74E-03 8.68 3.52E-04 7.04E-05 8.71Rollers 320 Diesel 80 30.40 D101 8.05 6.71 2.01 0.93 0.54 0.54 g/hp-hr 73.96 3.00E-03 6.00E-04 517.72 2.10E-02 4.20E-03 0.09 0.07 2.16E-02 9.97E-03 5.75E-03 5.75E-03 5.55 2.25E-04 4.50E-05 5.57Air Compressors 120 Diesel 78 37.44 D101 8.05 6.71 2.01 0.93 0.54 0.54 g/hp-hr 73.96 3.00E-03 6.00E-04 517.72 2.10E-02 4.20E-03 0.04 0.03 9.96E-03 4.61E-03 2.66E-03 2.66E-03 2.56 1.04E-04 2.08E-05 2.57
Total 1.73 3.88 0.48 0.21 0.08 0.08 188.42 7.81E-03 1.56E-03 189.08(a) Equipment usage based on construction schedule
(d) Greenhouse gas emissions from 40 CFR 98; conversion of 7000 Btu/hp-hr is assumed(e) Global warming potentials: CO2 = 1; CH4 = 25; N2O = 298 (Table A-1 to Subpart A of 40 CFR 98)
Table 24: 3 miles of electric upgrades (BMCD ID: 20)
NOx CO VOC SO2 PM10 PM2.5 CO2 CH4 N2O CO2 CH4 N2O NOx CO VOC SO2 PM10 PM2.5 CO2 CH4 N2O CO2e
Foreman / Supervisor Truck 140 Gasoline 250 200.00 140.00 0.309 4.925 0.158 0.005 0.013 0.013 g/mile
Updated Emission Factors of Air Pollutants from Vehicle Operations in GREET Using MOVES - Table A4 - Model
year 2017 70.22 3.00E-03 6.00E-04 491.54 2.10E-02 4.20E-03 0.01 0.11 0.00 0.00 0.00 0.00 15.17 6.48E-04 1.30E-04 15.2355' Bucket 4x4 112 Diesel 187 76.67 D302 7.08 4.69 1.77 0.93 0.27 0.27 g/hp-hr 73.96 3.00E-03 6.00E-04 517.72 2.10E-02 4.20E-03 0.07 0.04 1.68E-02 8.80E-03 2.54E-03 2.54E-03 4.90 1.99E-04 3.98E-05 4.92Digger 112 Diesel 367 176.16 D603 6.87 4.69 1.72 0.93 0.27 0.27 g/hp-hr 73.96 3.00E-03 6.00E-04 517.72 2.10E-02 4.20E-03 0.15 0.10 3.73E-02 2.02E-02 5.83E-03 5.83E-03 11.26 4.57E-04 9.13E-05 11.30
Total 0.22 0.25 0.06 0.03 0.01 0.01 31.33 1.30E-03 2.61E-04 31.44(a) Equipment usage based on construction schedule
(d) Greenhouse gas emissions from 40 CFR 98; conversion of 7000 Btu/hp-hr is assumed(e) Global warming potentials: CO2 = 1; CH4 = 25; N2O = 298 (Table A-1 to Subpart A of 40 CFR 98)
Table 25: 22 miles of RAIL network (BMCD ID: 3)
NOx CO VOC SO2 PM10 PM2.5 CO2 CH4 N2O CO2 CH4 N2O NOx CO VOC SO2 PM10 PM2.5 CO2 CH4 N2O CO2e
Foreman / Supervisor Truck 5,050 Gasoline 250 200.00 5050.00 0.309 4.925 0.158 0.005 0.013 0.013 g/mile
Updated Emission Factors of Air Pollutants from Vehicle Operations in GREET Using MOVES - Table A4 - Model
year 2017 70.22 3.00E-03 6.00E-04 491.54 2.10E-02 4.20E-03 8.69 138.45 4.44 0.15 0.37 0.37 547.25 2.34E-02 4.68E-03 549.23Demolition 240 Diesel 81 59.13 D101 8.05 6.71 2.01 0.93 0.54 0.54 g/hp-hr 73.96 3.00E-03 6.00E-04 517.72 2.10E-02 4.20E-03 0.13 0.10 3.15E-02 1.45E-02 8.39E-03 8.39E-03 8.10 3.29E-04 6.57E-05 8.13Demolition 720 Diesel 158 60.04 D174 7.08 6.71 1.77 0.93 0.40 0.40 g/hp-hr 73.96 3.00E-03 6.00E-04 517.72 2.10E-02 4.20E-03 0.34 0.32 8.44E-02 4.43E-02 1.92E-02 1.92E-02 24.67 1.00E-03 2.00E-04 24.75Demolition 480 Diesel 247 98.80 D302 7.08 4.69 1.77 0.93 0.27 0.27 g/hp-hr 73.96 3.00E-03 6.00E-04 517.72 2.10E-02 4.20E-03 0.37 0.25 9.25E-02 4.86E-02 1.40E-02 1.40E-02 27.06 1.10E-03 2.20E-04 27.16Rubber Tired Dozers 480 Diesel 247 98.80 D302 7.08 4.69 1.77 0.93 0.27 0.27 g/hp-hr 73.96 3.00E-03 6.00E-04 517.72 2.10E-02 4.20E-03 0.37 0.25 9.25E-02 4.86E-02 1.40E-02 1.40E-02 27.06 1.10E-03 2.20E-04 27.16Tractors/Loaders/Backhoes 640 Diesel 97 35.89 D101 8.05 6.71 2.01 0.93 0.54 0.54 g/hp-hr 73.96 3.00E-03 6.00E-04 517.72 2.10E-02 4.20E-03 0.20 0.17 5.09E-02 2.35E-02 1.36E-02 1.36E-02 13.11 5.32E-04 1.06E-04 13.15Excavators 720 Diesel 158 60.04 D174 7.08 6.71 1.77 0.93 0.40 0.40 g/hp-hr 73.96 3.00E-03 6.00E-04 517.72 2.10E-02 4.20E-03 0.34 0.32 8.44E-02 4.43E-02 1.92E-02 1.92E-02 24.67 1.00E-03 2.00E-04 24.75Graders 360 Diesel 187 76.67 D302 7.08 4.69 1.77 0.93 0.27 0.27 g/hp-hr 73.96 3.00E-03 6.00E-04 517.72 2.10E-02 4.20E-03 0.22 0.14 5.39E-02 2.83E-02 8.16E-03 8.16E-03 15.75 6.39E-04 1.28E-04 15.81Rubber Tired Dozers 360 Diesel 247 98.80 D302 7.08 4.69 1.77 0.93 0.27 0.27 g/hp-hr 73.96 3.00E-03 6.00E-04 517.72 2.10E-02 4.20E-03 0.28 0.18 6.94E-02 3.65E-02 1.05E-02 1.05E-02 20.30 8.23E-04 1.65E-04 20.37Scrapers 720 Diesel 367 176.16 D603 6.87 4.69 1.72 0.93 0.27 0.27 g/hp-hr 73.96 3.00E-03 6.00E-04 517.72 2.10E-02 4.20E-03 0.96 0.66 2.40E-01 1.30E-01 3.75E-02 3.75E-02 72.38 2.94E-03 5.87E-04 72.63Tractors/Loaders/Backhoes 720 Diesel 97 35.89 D101 8.05 6.71 2.01 0.93 0.54 0.54 g/hp-hr 73.96 3.00E-03 6.00E-04 517.72 2.10E-02 4.20E-03 0.23 0.19 5.73E-02 2.65E-02 1.53E-02 1.53E-02 14.75 5.98E-04 1.20E-04 14.80Cranes 3,080 Diesel 231 66.99 D603 6.87 4.69 1.72 0.93 0.27 0.27 g/hp-hr 73.96 3.00E-03 6.00E-04 517.72 2.10E-02 4.20E-03 1.56 1.07 3.90E-01 2.11E-01 6.10E-02 6.10E-02 117.75 4.78E-03 9.55E-04 118.15Forklifts 10,560 Diesel 89 17.80 D101 8.05 6.71 2.01 0.93 0.54 0.54 g/hp-hr 73.96 3.00E-03 6.00E-04 517.72 2.10E-02 4.20E-03 1.67 1.39 4.17E-01 1.93E-01 1.11E-01 1.11E-01 107.27 4.35E-03 8.70E-04 107.64Generator Sets 3,520 Diesel 84 62.16 D101 8.05 6.71 2.01 0.93 0.54 0.54 g/hp-hr 73.96 3.00E-03 6.00E-04 517.72 2.10E-02 4.20E-03 1.94 1.62 4.85E-01 2.24E-01 1.29E-01 1.29E-01 124.87 5.06E-03 1.01E-03 125.30Tractors/Loaders/Backhoes 9,240 Diesel 97 35.89 D101 8.05 6.71 2.01 0.93 0.54 0.54 g/hp-hr 73.96 3.00E-03 6.00E-04 517.72 2.10E-02 4.20E-03 2.94 2.45 7.35E-01 3.40E-01 1.96E-01 1.96E-01 189.25 7.68E-03 1.54E-03 189.90Welders 3,520 Diesel 46 20.70 D50 8.05 7.38 2.01 0.93 0.80 0.80 g/hp-hr 73.96 3.00E-03 6.00E-04 517.72 2.10E-02 4.20E-03 0.65 0.59 1.62E-01 7.47E-02 6.46E-02 6.46E-02 41.58 1.69E-03 3.37E-04 41.73
Total 20.87 148.15 7.48 1.64 1.09 1.09 1375.83 5.70E-02 1.14E-02 1380.65(a) Equipment usage based on construction schedule
(d) Greenhouse gas emissions from 40 CFR 98; conversion of 7000 Btu/hp-hr is assumed(e) Global warming potentials: CO2 = 1; CH4 = 25; N2O = 298 (Table A-1 to Subpart A of 40 CFR 98)
40 CFR 89.112, Tier 2
(b) Load Factors from Appendix A of EPA 420_P-04-005, Median Life, Annual Activity, and Load Factor Values for Nonroad Engine Emissions Modeling, USEPA, EPA 2004
GHG Emission Factors (g/hp-hr)d Criteria Emissions (tons per year) GHG Emissions (tons per year)e
40 CFR 89.112, Tier 2
(b) Load Factors from Appendix A of EPA 420_P-04-005, Median Life, Annual Activity, and Load Factor Values for Nonroad Engine Emissions Modeling, USEPA, EPA 2004
Equipment
Equipment
Usage (Hours)a Fuel Type HP each
Effective Loaded
Powerb Miles/yearEmission Factor
Category
Criteria Emission Factors c
UnitsCriteria Emission Factor
Basis
GHG Emission Factors (kg/MMBtu)d GHG Emission Factors (g/hp-hr)d Criteria Emissions (tons per year) GHG Emissions (tons per year)e
GHG Emission Factors (g/hp-hr)d Criteria Emissions (tons per year) GHG Emissions (tons per year)e
40 CFR 89.112, Tier 2
(b) Load Factors from Appendix A of EPA 420_P-04-005, Median Life, Annual Activity, and Load Factor Values for Nonroad Engine Emissions Modeling, USEPA, EPA 2004
Equipment
Equipment
Usage (Hours)a Fuel Type HP each
Effective Loaded
Powerb Miles/yearEmission Factor
Category
Criteria Emission Factors c
UnitsCriteria Emission Factor
Basis
GHG Emission Factors (kg/MMBtu)d
Equipment
Equipment
Usage (Hours)a Fuel Type HP each
Effective Loaded
Powerb Miles/yearEmission Factor
Category
Criteria Emission Factors c
UnitsCriteria Emission Factor
Basis
GHG Emission Factors (kg/MMBtu)d
HP each
Effective Loaded
Powerb Miles/yearEmission Factor
Category
Criteria Emission Factors c
UnitsCriteria Emission Factor
Basis
GHG Emission Factors (kg/MMBtu)d GHG Emission Factors (g/hp-hr)d Criteria Emissions (tons per year) GHG Emissions (tons per year)e
40 CFR 89.112, Tier 2
(b) Load Factors from Appendix A of EPA 420_P-04-005, Median Life, Annual Activity, and Load Factor Values for Nonroad Engine Emissions Modeling, USEPA, EPA 2004
Equipment
Equipment
Usage (Hours)a Fuel Type

Letterkenny Ammunitions Center (LEMC)Criteria & GHG Pollutant Emissions - Construction Equipment
Table 26: 10 acre RAIL classification yard (BMCD ID: 6)
NOx CO VOC SO2 PM10 PM2.5 CO2 CH4 N2O CO2 CH4 N2O NOx CO VOC SO2 PM10 PM2.5 CO2 CH4 N2O CO2e
Foreman / Supervisor Truck 3,000 Gasoline 250 200.00 3000.00 0.309 4.925 0.158 0.005 0.013 0.013 g/mile
Updated Emission Factors of Air Pollutants from Vehicle Operations in GREET Using MOVES - Table A4 - Model
year 2017 70.22 3.00E-03 6.00E-04 491.54 2.10E-02 4.20E-03 3.07 48.86 1.57 0.05 0.13 0.13 325.10 1.39E-02 2.78E-03 326.27Rubber Tired Dozers 240 Diesel 247 98.80 D302 7.08 4.69 1.77 0.93 0.27 0.27 g/hp-hr 73.96 3.00E-03 6.00E-04 517.72 2.10E-02 4.20E-03 0.19 0.12 4.63E-02 2.43E-02 7.01E-03 7.01E-03 13.53 5.49E-04 1.10E-04 13.58Tractors/Loaders/Backhoes 320 Diesel 97 35.89 D101 8.05 6.71 2.01 0.93 0.54 0.54 g/hp-hr 73.96 3.00E-03 6.00E-04 517.72 2.10E-02 4.20E-03 0.10 0.08 2.55E-02 1.18E-02 6.79E-03 6.79E-03 6.55 2.66E-04 5.32E-05 6.58Excavators 320 Diesel 158 60.04 D174 7.08 6.71 1.77 0.93 0.40 0.40 g/hp-hr 73.96 3.00E-03 6.00E-04 517.72 2.10E-02 4.20E-03 0.15 0.14 3.75E-02 1.97E-02 8.52E-03 8.52E-03 10.96 4.45E-04 8.89E-05 11.00Graders 160 Diesel 187 76.67 D302 7.08 4.69 1.77 0.93 0.27 0.27 g/hp-hr 73.96 3.00E-03 6.00E-04 517.72 2.10E-02 4.20E-03 0.10 0.06 2.39E-02 1.26E-02 3.63E-03 3.63E-03 7.00 2.84E-04 5.68E-05 7.02Rubber Tired Dozers 160 Diesel 247 98.80 D302 7.08 4.69 1.77 0.93 0.27 0.27 g/hp-hr 73.96 3.00E-03 6.00E-04 517.72 2.10E-02 4.20E-03 0.12 0.08 3.08E-02 1.62E-02 4.67E-03 4.67E-03 9.02 3.66E-04 7.32E-05 9.05Scrapers 320 Diesel 367 176.16 D603 6.87 4.69 1.72 0.93 0.27 0.27 g/hp-hr 73.96 3.00E-03 6.00E-04 517.72 2.10E-02 4.20E-03 0.43 0.29 1.07E-01 5.78E-02 1.67E-02 1.67E-02 32.17 1.30E-03 2.61E-04 32.28Tractors/Loaders/Backhoes 320 Diesel 97 35.89 D101 8.05 6.71 2.01 0.93 0.54 0.54 g/hp-hr 73.96 3.00E-03 6.00E-04 517.72 2.10E-02 4.20E-03 0.10 0.08 2.55E-02 1.18E-02 6.79E-03 6.79E-03 6.55 2.66E-04 5.32E-05 6.58Cranes 1,610 Diesel 231 66.99 D603 6.87 4.69 1.72 0.93 0.27 0.27 g/hp-hr 73.96 3.00E-03 6.00E-04 517.72 2.10E-02 4.20E-03 0.82 0.56 2.04E-01 1.11E-01 3.19E-02 3.19E-02 61.55 2.50E-03 4.99E-04 61.76Forklifts 5,520 Diesel 89 17.80 D101 8.05 6.71 2.01 0.93 0.54 0.54 g/hp-hr 73.96 3.00E-03 6.00E-04 517.72 2.10E-02 4.20E-03 0.87 0.73 2.18E-01 1.01E-01 5.81E-02 5.81E-02 56.07 2.27E-03 4.55E-04 56.27Generator Sets 1,840 Diesel 84 62.16 D101 8.05 6.71 2.01 0.93 0.54 0.54 g/hp-hr 73.96 3.00E-03 6.00E-04 517.72 2.10E-02 4.20E-03 1.01 0.85 2.54E-01 1.17E-01 6.76E-02 6.76E-02 65.27 2.65E-03 5.30E-04 65.50Tractors/Loaders/Backhoes 4,830 Diesel 97 35.89 D101 8.05 6.71 2.01 0.93 0.54 0.54 g/hp-hr 73.96 3.00E-03 6.00E-04 517.72 2.10E-02 4.20E-03 1.54 1.28 3.84E-01 1.78E-01 1.02E-01 1.02E-01 98.93 4.01E-03 8.03E-04 99.27Welders 1,840 Diesel 46 20.70 D50 8.05 7.38 2.01 0.93 0.80 0.80 g/hp-hr 73.96 3.00E-03 6.00E-04 517.72 2.10E-02 4.20E-03 0.34 0.31 8.45E-02 3.90E-02 3.38E-02 3.38E-02 21.74 8.82E-04 1.76E-04 21.81Pavers 320 Diesel 130 54.60 D174 7.08 6.71 1.77 0.93 0.40 0.40 g/hp-hr 73.96 3.00E-03 6.00E-04 517.72 2.10E-02 4.20E-03 0.14 0.13 3.41E-02 1.79E-02 7.75E-03 7.75E-03 9.97 4.04E-04 8.09E-05 10.01Paving Equipment 320 Diesel 132 47.52 D174 7.08 6.71 1.77 0.93 0.40 0.40 g/hp-hr 73.96 3.00E-03 6.00E-04 517.72 2.10E-02 4.20E-03 0.12 0.11 2.97E-02 1.56E-02 6.74E-03 6.74E-03 8.68 3.52E-04 7.04E-05 8.71Rollers 320 Diesel 80 30.40 D101 8.05 6.71 2.01 0.93 0.54 0.54 g/hp-hr 73.96 3.00E-03 6.00E-04 517.72 2.10E-02 4.20E-03 0.09 0.07 2.16E-02 9.97E-03 5.75E-03 5.75E-03 5.55 2.25E-04 4.50E-05 5.57Air Compressors 120 Diesel 78 37.44 D101 8.05 6.71 2.01 0.93 0.54 0.54 g/hp-hr 73.96 3.00E-03 6.00E-04 517.72 2.10E-02 4.20E-03 0.04 0.03 9.96E-03 4.61E-03 2.66E-03 2.66E-03 2.56 1.04E-04 2.08E-05 2.57
Total 9.21 53.80 3.10 0.80 0.50 0.50 741.22 3.08E-02 6.15E-03 743.82(a) Equipment usage based on construction schedule
(d) Greenhouse gas emissions from 40 CFR 98; conversion of 7000 Btu/hp-hr is assumed(e) Global warming potentials: CO2 = 1; CH4 = 25; N2O = 298 (Table A-1 to Subpart A of 40 CFR 98)
Table 27: Restoration of 4 miles of RAIL (BMCD ID: 18)
NOx CO VOC SO2 PM10 PM2.5 CO2 CH4 N2O CO2 CH4 N2O NOx CO VOC SO2 PM10 PM2.5 CO2 CH4 N2O CO2e
Foreman / Supervisor Truck 2,780 Gasoline 250 200.00 2780.00 0.309 4.925 0.158 0.005 0.013 0.013 g/mile
Updated Emission Factors of Air Pollutants from Vehicle Operations in GREET Using MOVES - Table A4 - Model
year 2017 70.22 3.00E-03 6.00E-04 491.54 2.10E-02 4.20E-03 2.63 41.96 1.35 0.05 0.11 0.11 301.26 1.29E-02 2.57E-03 302.35Concrete/Industrial Saws 160 Diesel 81 59.13 D101 8.05 6.71 2.01 0.93 0.54 0.54 g/hp-hr 73.96 3.00E-03 6.00E-04 517.72 2.10E-02 4.20E-03 0.08 0.07 2.10E-02 9.70E-03 5.59E-03 5.59E-03 5.40 2.19E-04 4.38E-05 5.42Excavators 480 Diesel 158 60.04 D174 7.08 6.71 1.77 0.93 0.40 0.40 g/hp-hr 73.96 3.00E-03 6.00E-04 517.72 2.10E-02 4.20E-03 0.22 0.21 5.62E-02 2.95E-02 1.28E-02 1.28E-02 16.45 6.67E-04 1.33E-04 16.50Rubber Tired Dozers 320 Diesel 247 98.80 D302 7.08 4.69 1.77 0.93 0.27 0.27 g/hp-hr 73.96 3.00E-03 6.00E-04 517.72 2.10E-02 4.20E-03 0.25 0.16 6.17E-02 3.24E-02 9.35E-03 9.35E-03 18.04 7.32E-04 1.46E-04 18.10Rubber Tired Dozers 120 Diesel 247 98.80 D302 7.08 4.69 1.77 0.93 0.27 0.27 g/hp-hr 73.96 3.00E-03 6.00E-04 517.72 2.10E-02 4.20E-03 0.09 0.06 2.31E-02 1.22E-02 3.51E-03 3.51E-03 6.77 2.74E-04 5.49E-05 6.79Tractors/Loaders/Backhoes 160 Diesel 97 35.89 D101 8.05 6.71 2.01 0.93 0.54 0.54 g/hp-hr 73.96 3.00E-03 6.00E-04 517.72 2.10E-02 4.20E-03 0.05 0.04 1.27E-02 5.89E-03 3.40E-03 3.40E-03 3.28 1.33E-04 2.66E-05 3.29Excavators 64 Diesel 158 60.04 D174 7.08 6.71 1.77 0.93 0.40 0.40 g/hp-hr 73.96 3.00E-03 6.00E-04 517.72 2.10E-02 4.20E-03 0.03 0.03 7.50E-03 3.94E-03 1.70E-03 1.70E-03 2.19 8.89E-05 1.78E-05 2.20Graders 64 Diesel 187 76.67 D302 7.08 4.69 1.77 0.93 0.27 0.27 g/hp-hr 73.96 3.00E-03 6.00E-04 517.72 2.10E-02 4.20E-03 0.04 0.03 9.57E-03 5.03E-03 1.45E-03 1.45E-03 2.80 1.14E-04 2.27E-05 2.81Rubber Tired Dozers 64 Diesel 247 98.80 D302 7.08 4.69 1.77 0.93 0.27 0.27 g/hp-hr 73.96 3.00E-03 6.00E-04 517.72 2.10E-02 4.20E-03 0.05 0.03 1.23E-02 6.48E-03 1.87E-03 1.87E-03 3.61 1.46E-04 2.93E-05 3.62Tractors/Loaders/Backhoes 192 Diesel 97 35.89 D101 8.05 6.71 2.01 0.93 0.54 0.54 g/hp-hr 73.96 3.00E-03 6.00E-04 517.72 2.10E-02 4.20E-03 0.06 0.05 1.53E-02 7.06E-03 4.07E-03 4.07E-03 3.93 1.60E-04 3.19E-05 3.95Cranes 1,610 Diesel 231 66.99 D603 6.87 4.69 1.72 0.93 0.27 0.27 g/hp-hr 73.96 3.00E-03 6.00E-04 517.72 2.10E-02 4.20E-03 0.82 0.56 2.04E-01 1.11E-01 3.19E-02 3.19E-02 61.55 2.50E-03 4.99E-04 61.76Forklifts 5,520 Diesel 89 17.80 D101 8.05 6.71 2.01 0.93 0.54 0.54 g/hp-hr 73.96 3.00E-03 6.00E-04 517.72 2.10E-02 4.20E-03 0.87 0.73 2.18E-01 1.01E-01 5.81E-02 5.81E-02 56.07 2.27E-03 4.55E-04 56.27Generator Sets 1,840 Diesel 84 62.16 D101 8.05 6.71 2.01 0.93 0.54 0.54 g/hp-hr 73.96 3.00E-03 6.00E-04 517.72 2.10E-02 4.20E-03 1.01 0.85 2.54E-01 1.17E-01 6.76E-02 6.76E-02 65.27 2.65E-03 5.30E-04 65.50Tractors/Loaders/Backhoes 4,830 Diesel 97 35.89 D101 8.05 6.71 2.01 0.93 0.54 0.54 g/hp-hr 73.96 3.00E-03 6.00E-04 517.72 2.10E-02 4.20E-03 1.54 1.28 3.84E-01 1.78E-01 1.02E-01 1.02E-01 98.93 4.01E-03 8.03E-04 99.27Welders 1,840 Diesel 46 20.70 D50 8.05 7.38 2.01 0.93 0.80 0.80 g/hp-hr 73.96 3.00E-03 6.00E-04 517.72 2.10E-02 4.20E-03 0.34 0.31 8.45E-02 3.90E-02 3.38E-02 3.38E-02 21.74 8.82E-04 1.76E-04 21.81
Total 8.09 46.36 2.71 0.70 0.45 0.45 667.29 2.77E-02 5.54E-03 669.63(a) Equipment usage based on construction schedule
(d) Greenhouse gas emissions from 40 CFR 98; conversion of 7000 Btu/hp-hr is assumed(e) Global warming potentials: CO2 = 1; CH4 = 25; N2O = 298 (Table A-1 to Subpart A of 40 CFR 98)
Table 28: Repair 11 miles of asphalt ROADS (BMCD ID: 23)
NOx CO VOC SO2 PM10 PM2.5 CO2 CH4 N2O CO2 CH4 N2O NOx CO VOC SO2 PM10 PM2.5 CO2 CH4 N2O CO2e
Foreman / Supervisor Truck 1,200 Gasoline 250 200.00 1200.00 0.309 4.925 0.158 0.005 0.013 0.013 g/mile
Updated Emission Factors of Air Pollutants from Vehicle Operations in GREET Using MOVES - Table A4 - Model
year 2017 70.22 3.00E-03 6.00E-04 491.54 2.10E-02 4.20E-03 0.49 7.82 0.25 0.01 0.02 0.02 130.04 5.56E-03 1.11E-03 130.51Concrete/Industrial Saws 240 Diesel 81 59.13 D101 8.05 6.71 2.01 0.93 0.54 0.54 g/hp-hr 73.96 3.00E-03 6.00E-04 517.72 2.10E-02 4.20E-03 0.13 0.10 3.15E-02 1.45E-02 8.39E-03 8.39E-03 8.10 3.29E-04 6.57E-05 8.13Excavators 720 Diesel 158 60.04 D174 7.08 6.71 1.77 0.93 0.40 0.40 g/hp-hr 73.96 3.00E-03 6.00E-04 517.72 2.10E-02 4.20E-03 0.34 0.32 8.44E-02 4.43E-02 1.92E-02 1.92E-02 24.67 1.00E-03 2.00E-04 24.75Rubber Tired Dozers 480 Diesel 247 98.80 D302 7.08 4.69 1.77 0.93 0.27 0.27 g/hp-hr 73.96 3.00E-03 6.00E-04 517.72 2.10E-02 4.20E-03 0.37 0.25 9.25E-02 4.86E-02 1.40E-02 1.40E-02 27.06 1.10E-03 2.20E-04 27.16Rubber Tired Dozers 480 Diesel 247 98.80 D302 7.08 4.69 1.77 0.93 0.27 0.27 g/hp-hr 73.96 3.00E-03 6.00E-04 517.72 2.10E-02 4.20E-03 0.37 0.25 9.25E-02 4.86E-02 1.40E-02 1.40E-02 27.06 1.10E-03 2.20E-04 27.16Tractors/Loaders/Backhoes 640 Diesel 97 35.89 D101 8.05 6.71 2.01 0.93 0.54 0.54 g/hp-hr 73.96 3.00E-03 6.00E-04 517.72 2.10E-02 4.20E-03 0.20 0.17 5.09E-02 2.35E-02 1.36E-02 1.36E-02 13.11 5.32E-04 1.06E-04 13.15Pavers 560 Diesel 130 54.60 D174 7.08 6.71 1.77 0.93 0.40 0.40 g/hp-hr 73.96 3.00E-03 6.00E-04 517.72 2.10E-02 4.20E-03 0.24 0.23 5.97E-02 3.13E-02 1.36E-02 1.36E-02 17.45 7.08E-04 1.42E-04 17.51Paving Equipment 560 Diesel 132 47.52 D174 7.08 6.71 1.77 0.93 0.40 0.40 g/hp-hr 73.96 3.00E-03 6.00E-04 517.72 2.10E-02 4.20E-03 0.21 0.20 5.19E-02 2.73E-02 1.18E-02 1.18E-02 15.19 6.16E-04 1.23E-04 15.24Rollers 560 Diesel 80 30.40 D101 8.05 6.71 2.01 0.93 0.54 0.54 g/hp-hr 76.96 3.00E-03 3.00E+00 538.72 2.10E-02 2.10E+01 0.15 0.13 3.77E-02 1.74E-02 1.01E-02 1.01E-02 10.11 3.94E-04 3.94E-01 127.58Air Compressors 210 Diesel 78 37.44 D101 8.05 6.71 2.01 0.93 0.54 0.54 g/hp-hr 77.96 3.00E-03 4.00E+00 545.72 2.10E-02 2.80E+01 0.07 0.06 1.74E-02 8.06E-03 4.65E-03 4.65E-03 4.73 1.82E-04 2.43E-01 77.06
Total 2.56 9.51 0.77 0.27 0.13 0.13 277.52 1.15E-02 0.64 468.25(a) Equipment usage based on construction schedule
(d) Greenhouse gas emissions from 40 CFR 98; conversion of 7000 Btu/hp-hr is assumed(e) Global warming potentials: CO2 = 1; CH4 = 25; N2O = 298 (Table A-1 to Subpart A of 40 CFR 98)
Table 29: Repair 1560000 sqft of asphalt ROADS (BMCD ID: 32)
NOx CO VOC SO2 PM10 PM2.5 CO2 CH4 N2O CO2 CH4 N2O NOx CO VOC SO2 PM10 PM2.5 CO2 CH4 N2O CO2e
Foreman / Supervisor Truck 1,500 Gasoline 250 200.00 1500.00 0.309 4.925 0.158 0.005 0.013 0.013 g/mile
Updated Emission Factors of Air Pollutants from Vehicle Operations in GREET Using MOVES - Table A4 - Model
year 2017 70.22 3.00E-03 6.00E-04 491.54 2.10E-02 4.20E-03 0.77 12.21 0.39 0.01 0.03 0.03 162.55 6.94E-03 1.39E-03 163.14Concrete/Industrial Saws 400 Diesel 81 59.13 D101 8.05 6.71 2.01 0.93 0.54 0.54 g/hp-hr 73.96 3.00E-03 6.00E-04 517.72 2.10E-02 4.20E-03 0.21 0.17 5.24E-02 2.42E-02 1.40E-02 1.40E-02 13.50 5.48E-04 1.10E-04 13.54Excavators 1,200 Diesel 158 60.04 D174 7.08 6.71 1.77 0.93 0.40 0.40 g/hp-hr 73.96 3.00E-03 6.00E-04 517.72 2.10E-02 4.20E-03 0.56 0.53 1.41E-01 7.38E-02 3.20E-02 3.20E-02 41.12 1.67E-03 3.34E-04 41.26Rubber Tired Dozers 800 Diesel 247 98.80 D302 7.08 4.69 1.77 0.93 0.27 0.27 g/hp-hr 73.96 3.00E-03 6.00E-04 517.72 2.10E-02 4.20E-03 0.62 0.41 1.54E-01 8.10E-02 2.34E-02 2.34E-02 45.11 1.83E-03 3.66E-04 45.26Rubber Tired Dozers 720 Diesel 247 98.80 D302 7.08 4.69 1.77 0.93 0.27 0.27 g/hp-hr 73.96 3.00E-03 6.00E-04 517.72 2.10E-02 4.20E-03 0.56 0.37 1.39E-01 7.29E-02 2.10E-02 2.10E-02 40.60 1.65E-03 3.29E-04 40.74Tractors/Loaders/Backhoes 960 Diesel 97 35.89 D101 8.05 6.71 2.01 0.93 0.54 0.54 g/hp-hr 73.96 3.00E-03 6.00E-04 517.72 2.10E-02 4.20E-03 0.31 0.25 7.64E-02 3.53E-02 2.04E-02 2.04E-02 19.66 7.98E-04 1.60E-04 19.73Pavers 560 Diesel 130 54.60 D174 7.08 6.71 1.77 0.93 0.40 0.40 g/hp-hr 73.96 3.00E-03 6.00E-04 517.72 2.10E-02 4.20E-03 0.24 0.23 5.97E-02 3.13E-02 1.36E-02 1.36E-02 17.45 7.08E-04 1.42E-04 17.51Paving Equipment 560 Diesel 132 47.52 D174 7.08 6.71 1.77 0.93 0.40 0.40 g/hp-hr 73.96 3.00E-03 6.00E-04 517.72 2.10E-02 4.20E-03 0.21 0.20 5.19E-02 2.73E-02 1.18E-02 1.18E-02 15.19 6.16E-04 1.23E-04 15.24Rollers 560 Diesel 80 30.40 D101 8.05 6.71 2.01 0.93 0.54 0.54 g/hp-hr 73.96 3.00E-03 6.00E-04 517.72 2.10E-02 4.20E-03 0.15 0.13 3.77E-02 1.74E-02 1.01E-02 1.01E-02 9.72 3.94E-04 7.88E-05 9.75Air Compressors 210 Diesel 78 37.44 D101 8.05 6.71 2.01 0.93 0.54 0.54 g/hp-hr 73.96 3.00E-03 6.00E-04 517.72 2.10E-02 4.20E-03 0.07 0.06 1.74E-02 8.06E-03 4.65E-03 4.65E-03 4.49 1.82E-04 3.64E-05 4.50
Total 3.68 14.56 1.12 0.38 0.18 0.18 369.37 1.53E-02 3.07E-03 370.67(a) Equipment usage based on construction schedule
(d) Greenhouse gas emissions from 40 CFR 98; conversion of 7000 Btu/hp-hr is assumed(e) Global warming potentials: CO2 = 1; CH4 = 25; N2O = 298 (Table A-1 to Subpart A of 40 CFR 98)
Equipment
Equipment
Usage (Hours)a Fuel Type HP each
Effective Loaded
Powerb Miles/yearEmission Factor
Category
Criteria Emission Factors c
UnitsCriteria Emission Factor
Basis
GHG Emission Factors (kg/MMBtu)d GHG Emission Factors (g/hp-hr)d Criteria Emissions (tons per year) GHG Emissions (tons per year)e
Criteria Emissions (tons per year) GHG Emissions (tons per year)e
40 CFR 89.112, Tier 2
(b) Load Factors from Appendix A of EPA 420_P-04-005, Median Life, Annual Activity, and Load Factor Values for Nonroad Engine Emissions Modeling, USEPA, EPA 2004
Equipment
Equipment
Usage (Hours)a Fuel Type HP each
Effective Loaded
Powerb Miles/yearEmission Factor
Category
Criteria Emission Factors c
UnitsCriteria Emission Factor
Basis
GHG Emission Factors (kg/MMBtu)d GHG Emission Factors (g/hp-hr)d Criteria Emissions (tons per year) GHG Emissions (tons per year)e
Equipment
Equipment
Usage (Hours)a Fuel Type HP each
Effective Loaded
Powerb Miles/year
40 CFR 89.112, Tier 2
40 CFR 89.112, Tier 2
(b) Load Factors from Appendix A of EPA 420_P-04-005, Median Life, Annual Activity, and Load Factor Values for Nonroad Engine Emissions Modeling, USEPA, EPA 2004
Criteria Emission Factor Basis
GHG Emission Factors (kg/MMBtu)d
GHG Emission Factors (g/hp-hr)d
Equipment
Equipment
Usage (Hours)a Fuel Type
(b) Load Factors from Appendix A of EPA 420_P-04-005, Median Life, Annual Activity, and Load Factor Values for Nonroad Engine Emissions Modeling, USEPA, EPA 2004
Emission Factor Category
Criteria Emission Factors c
UnitsCriteria Emission Factor
Basis
GHG Emission Factors (kg/MMBtu)d
GHG Emission Factors (g/hp-hr)d Criteria Emissions (tons per year) GHG Emissions (tons per year)e
40 CFR 89.112, Tier 2
(b) Load Factors from Appendix A of EPA 420_P-04-005, Median Life, Annual Activity, and Load Factor Values for Nonroad Engine Emissions Modeling, USEPA, EPA 2004
HP each
Effective Loaded
Powerb Miles/yearEmission Factor
Category
Criteria Emission Factors c
Units
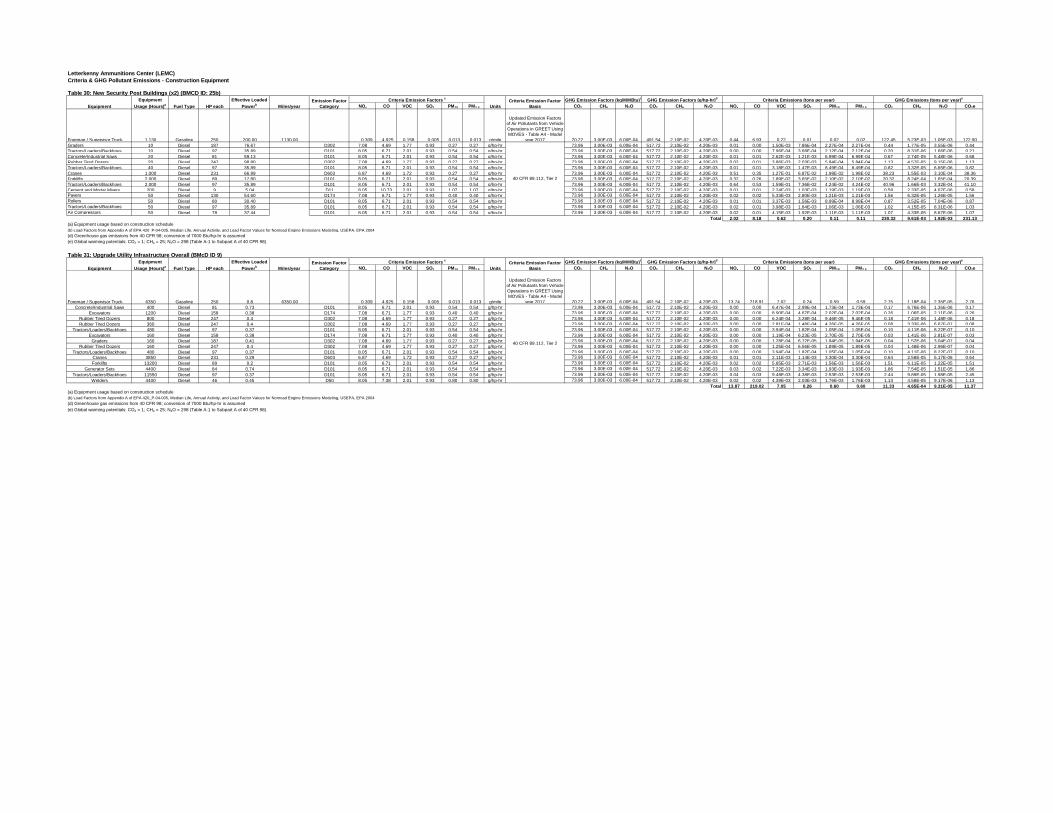
Letterkenny Ammunitions Center (LEMC)Criteria & GHG Pollutant Emissions - Construction Equipment
Table 30: New Security Post Buildings (x2) (BMCD ID: 25b)
NOx CO VOC SO2 PM10 PM2.5 CO2 CH4 N2O CO2 CH4 N2O NOx CO VOC SO2 PM10 PM2.5 CO2 CH4 N2O CO2e
Foreman / Supervisor Truck 1,130 Gasoline 250 200.00 1130.00 0.309 4.925 0.158 0.005 0.013 0.013 g/mile
Updated Emission Factors of Air Pollutants from Vehicle Operations in GREET Using MOVES - Table A4 - Model
year 2017 70.22 3.00E-03 6.00E-04 491.54 2.10E-02 4.20E-03 0.44 6.93 0.22 0.01 0.02 0.02 122.45 5.23E-03 1.05E-03 122.90Graders 10 Diesel 187 76.67 D302 7.08 4.69 1.77 0.93 0.27 0.27 g/hp-hr 73.96 3.00E-03 6.00E-04 517.72 2.10E-02 4.20E-03 0.01 0.00 1.50E-03 7.86E-04 2.27E-04 2.27E-04 0.44 1.77E-05 3.55E-06 0.44Tractors/Loaders/Backhoes 10 Diesel 97 35.89 D101 8.05 6.71 2.01 0.93 0.54 0.54 g/hp-hr 73.96 3.00E-03 6.00E-04 517.72 2.10E-02 4.20E-03 0.00 0.00 7.96E-04 3.68E-04 2.12E-04 2.12E-04 0.20 8.31E-06 1.66E-06 0.21Concrete/Industrial Saws 20 Diesel 81 59.13 D101 8.05 6.71 2.01 0.93 0.54 0.54 g/hp-hr 73.96 3.00E-03 6.00E-04 517.72 2.10E-02 4.20E-03 0.01 0.01 2.62E-03 1.21E-03 6.99E-04 6.99E-04 0.67 2.74E-05 5.48E-06 0.68Rubber Tired Dozers 20 Diesel 247 98.80 D302 7.08 4.69 1.77 0.93 0.27 0.27 g/hp-hr 73.96 3.00E-03 6.00E-04 517.72 2.10E-02 4.20E-03 0.02 0.01 3.86E-03 2.03E-03 5.84E-04 5.84E-04 1.13 4.57E-05 9.15E-06 1.13Tractors/Loaders/Backhoes 40 Diesel 97 35.89 D101 8.05 6.71 2.01 0.93 0.54 0.54 g/hp-hr 73.96 3.00E-03 6.00E-04 517.72 2.10E-02 4.20E-03 0.01 0.01 3.18E-03 1.47E-03 8.49E-04 8.49E-04 0.82 3.32E-05 6.65E-06 0.82Cranes 1,000 Diesel 231 66.99 D603 6.87 4.69 1.72 0.93 0.27 0.27 g/hp-hr 73.96 3.00E-03 6.00E-04 517.72 2.10E-02 4.20E-03 0.51 0.35 1.27E-01 6.87E-02 1.98E-02 1.98E-02 38.23 1.55E-03 3.10E-04 38.36Forklifts 2,000 Diesel 89 17.80 D101 8.05 6.71 2.01 0.93 0.54 0.54 g/hp-hr 73.96 3.00E-03 6.00E-04 517.72 2.10E-02 4.20E-03 0.32 0.26 7.89E-02 3.65E-02 2.10E-02 2.10E-02 20.32 8.24E-04 1.65E-04 20.39Tractors/Loaders/Backhoes 2,000 Diesel 97 35.89 D101 8.05 6.71 2.01 0.93 0.54 0.54 g/hp-hr 73.96 3.00E-03 6.00E-04 517.72 2.10E-02 4.20E-03 0.64 0.53 1.59E-01 7.36E-02 4.24E-02 4.24E-02 40.96 1.66E-03 3.32E-04 41.10Cement and Mortar Mixers 200 Diesel 9 5.04 D11 8.05 10.73 2.01 0.93 1.07 1.07 g/hp-hr 73.96 3.00E-03 6.00E-04 517.72 2.10E-02 4.20E-03 0.01 0.01 2.24E-03 1.03E-03 1.19E-03 1.19E-03 0.58 2.33E-05 4.67E-06 0.58Pavers 50 Diesel 130 54.60 D174 7.08 6.71 1.77 0.93 0.40 0.40 g/hp-hr 73.96 3.00E-03 6.00E-04 517.72 2.10E-02 4.20E-03 0.02 0.02 5.33E-03 2.80E-03 1.21E-03 1.21E-03 1.56 6.32E-05 1.26E-05 1.56Rollers 50 Diesel 80 30.40 D101 8.05 6.71 2.01 0.93 0.54 0.54 g/hp-hr 73.96 3.00E-03 6.00E-04 517.72 2.10E-02 4.20E-03 0.01 0.01 3.37E-03 1.56E-03 8.99E-04 8.99E-04 0.87 3.52E-05 7.04E-06 0.87Tractors/Loaders/Backhoes 50 Diesel 97 35.89 D101 8.05 6.71 2.01 0.93 0.54 0.54 g/hp-hr 73.96 3.00E-03 6.00E-04 517.72 2.10E-02 4.20E-03 0.02 0.01 3.98E-03 1.84E-03 1.06E-03 1.06E-03 1.02 4.15E-05 8.31E-06 1.03Air Compressors 50 Diesel 78 37.44 D101 8.05 6.71 2.01 0.93 0.54 0.54 g/hp-hr 73.96 3.00E-03 6.00E-04 517.72 2.10E-02 4.20E-03 0.02 0.01 4.15E-03 1.92E-03 1.11E-03 1.11E-03 1.07 4.33E-05 8.67E-06 1.07
Total 2.02 8.18 0.62 0.20 0.11 0.11 230.32 9.61E-03 1.92E-03 231.13(a) Equipment usage based on construction schedule
(d) Greenhouse gas emissions from 40 CFR 98; conversion of 7000 Btu/hp-hr is assumed(e) Global warming potentials: CO2 = 1; CH4 = 25; N2O = 298 (Table A-1 to Subpart A of 40 CFR 98)
Table 31: Upgrade Utility Infrastructure Overall (BMcD ID 9)
NOx CO VOC SO2 PM10 PM2.5 CO2 CH4 N2O CO2 CH4 N2O NOx CO VOC SO2 PM10 PM2.5 CO2 CH4 N2O CO2e
Foreman / Supervisor Truck 6350 Gasoline 250 0.8 6350.00 0.309 4.925 0.158 0.005 0.013 0.013 g/mile
Updated Emission Factors of Air Pollutants from Vehicle Operations in GREET Using MOVES - Table A4 - Model
year 2017 70.22 3.00E-03 6.00E-04 491.54 2.10E-02 4.20E-03 13.74 218.91 7.02 0.24 0.59 0.59 2.75 1.18E-04 2.35E-05 2.76Concrete/Industrial Saws 400 Diesel 81 0.73 D101 8.05 6.71 2.01 0.93 0.54 0.54 g/hp-hr 73.96 3.00E-03 6.00E-04 517.72 2.10E-02 4.20E-03 0.00 0.00 6.47E-04 2.99E-04 1.73E-04 1.73E-04 0.17 6.76E-06 1.35E-06 0.17
Excavators 1200 Diesel 158 0.38 D174 7.08 6.71 1.77 0.93 0.40 0.40 g/hp-hr 73.96 3.00E-03 6.00E-04 517.72 2.10E-02 4.20E-03 0.00 0.00 8.90E-04 4.67E-04 2.02E-04 2.02E-04 0.26 1.06E-05 2.11E-06 0.26Rubber Tired Dozers 800 Diesel 247 0.4 D302 7.08 4.69 1.77 0.93 0.27 0.27 g/hp-hr 73.96 3.00E-03 6.00E-04 517.72 2.10E-02 4.20E-03 0.00 0.00 6.24E-04 3.28E-04 9.46E-05 9.46E-05 0.18 7.41E-06 1.48E-06 0.18Rubber Tired Dozers 360 Diesel 247 0.4 D302 7.08 4.69 1.77 0.93 0.27 0.27 g/hp-hr 73.96 3.00E-03 6.00E-04 517.72 2.10E-02 4.20E-03 0.00 0.00 2.81E-04 1.48E-04 4.26E-05 4.26E-05 0.08 3.33E-06 6.67E-07 0.08
Tractors/Loaders/Backhoes 480 Diesel 97 0.37 D101 8.05 6.71 2.01 0.93 0.54 0.54 g/hp-hr 73.96 3.00E-03 6.00E-04 517.72 2.10E-02 4.20E-03 0.00 0.00 3.94E-04 1.82E-04 1.05E-04 1.05E-04 0.10 4.11E-06 8.22E-07 0.10Excavators 160 Diesel 158 0.38 D174 7.08 6.71 1.77 0.93 0.40 0.40 g/hp-hr 73.96 3.00E-03 6.00E-04 517.72 2.10E-02 4.20E-03 0.00 0.00 1.19E-04 6.23E-05 2.70E-05 2.70E-05 0.03 1.41E-06 2.81E-07 0.03
Graders 160 Diesel 187 0.41 D302 7.08 4.69 1.77 0.93 0.27 0.27 g/hp-hr 73.96 3.00E-03 6.00E-04 517.72 2.10E-02 4.20E-03 0.00 0.00 1.28E-04 6.72E-05 1.94E-05 1.94E-05 0.04 1.52E-06 3.04E-07 0.04Rubber Tired Dozers 160 Diesel 247 0.4 D302 7.08 4.69 1.77 0.93 0.27 0.27 g/hp-hr 73.96 3.00E-03 6.00E-04 517.72 2.10E-02 4.20E-03 0.00 0.00 1.25E-04 6.56E-05 1.89E-05 1.89E-05 0.04 1.48E-06 2.96E-07 0.04
Tractors/Loaders/Backhoes 480 Diesel 97 0.37 D101 8.05 6.71 2.01 0.93 0.54 0.54 g/hp-hr 73.96 3.00E-03 6.00E-04 517.72 2.10E-02 4.20E-03 0.00 0.00 3.94E-04 1.82E-04 1.05E-04 1.05E-04 0.10 4.11E-06 8.22E-07 0.10Cranes 3850 Diesel 231 0.29 D603 6.87 4.69 1.72 0.93 0.27 0.27 g/hp-hr 73.96 3.00E-03 6.00E-04 517.72 2.10E-02 4.20E-03 0.01 0.01 2.11E-03 1.14E-03 3.30E-04 3.30E-04 0.64 2.58E-05 5.17E-06 0.64Forklifts 13200 Diesel 89 0.2 D101 8.05 6.71 2.01 0.93 0.54 0.54 g/hp-hr 73.96 3.00E-03 6.00E-04 517.72 2.10E-02 4.20E-03 0.02 0.02 5.85E-03 2.71E-03 1.56E-03 1.56E-03 1.51 6.11E-05 1.22E-05 1.51
Generator Sets 4400 Diesel 84 0.74 D101 8.05 6.71 2.01 0.93 0.54 0.54 g/hp-hr 73.96 3.00E-03 6.00E-04 517.72 2.10E-02 4.20E-03 0.03 0.02 7.22E-03 3.34E-03 1.93E-03 1.93E-03 1.86 7.54E-05 1.51E-05 1.86Tractors/Loaders/Backhoes 11550 Diesel 97 0.37 D101 8.05 6.71 2.01 0.93 0.54 0.54 g/hp-hr 73.96 3.00E-03 6.00E-04 517.72 2.10E-02 4.20E-03 0.04 0.03 9.48E-03 4.38E-03 2.53E-03 2.53E-03 2.44 9.89E-05 1.98E-05 2.45
Welders 4400 Diesel 46 0.45 D50 8.05 7.38 2.01 0.93 0.80 0.80 g/hp-hr 73.96 3.00E-03 6.00E-04 517.72 2.10E-02 4.20E-03 0.02 0.02 4.39E-03 2.03E-03 1.76E-03 1.76E-03 1.13 4.58E-05 9.17E-06 1.13Total 13.87 219.02 7.05 0.26 0.60 0.60 11.33 4.65E-04 9.31E-05 11.37
(a) Equipment usage based on construction schedule
(d) Greenhouse gas emissions from 40 CFR 98; conversion of 7000 Btu/hp-hr is assumed(e) Global warming potentials: CO2 = 1; CH4 = 25; N2O = 298 (Table A-1 to Subpart A of 40 CFR 98)
Criteria Emission Factor Basis
GHG Emission Factors (kg/MMBtu)d GHG Emission Factors (g/hp-hr)d Criteria Emissions (tons per year) GHG Emissions (tons per year)e
40 CFR 89.112, Tier 2
(b) Load Factors from Appendix A of EPA 420_P-04-005, Median Life, Annual Activity, and Load Factor Values for Nonroad Engine Emissions Modeling, USEPA, EPA 2004
Equipment
Equipment
Usage (Hours)a Fuel Type HP each
Effective Loaded
Powerb Miles/yearEmission Factor
Category
Criteria Emission Factors c
Units
(b) Load Factors from Appendix A of EPA 420_P-04-005, Median Life, Annual Activity, and Load Factor Values for Nonroad Engine Emissions Modeling, USEPA, EPA 2004
40 CFR 89.112, Tier 2
Equipment
Equipment
Usage (Hours)a Fuel Type HP each
Effective Loaded
Powerb Miles/yearEmission Factor
Category
Criteria Emission Factors c
UnitsCriteria Emission Factor
Basis
GHG Emission Factors (kg/MMBtu)d GHG Emission Factors (g/hp-hr)d Criteria Emissions (tons per year) GHG Emissions (tons per year)e

Letterkenny Ammunitions Center (LEMC)Emissions from Construction Equipment Travel on Construction Site
Unpaved Roads emission factor from AP-42, Section 13.2.2: Unpaved Roads (11/06)
E = [k(s/12)a(W/3)b]*[(365-P)/365]
where:
s = 8.5 surface material silt content (%) [Table 13.2.2-1, Construction sites mean silt content %]
W = 15 tons [Average vehicle weight]a
k = 1.5 lb/VMT [Table 13.2.2-2, for PM10 ]
k = 0.15 lb/VMT [Table 13.2.2-2, for PM2.5]
a = 0.9 constant [Table 13.2.2-2, for PM10 and PM2.5]
b = 0.45 constant [Table 13.2.2-2, for PM10 and PM2.5]
P = 120 days [Average number of days with > 0.01 inches of precipitation for southern Pennsylvania, Figure 13.2.2-1E (PM10)= 1.52 lb/VMT
E (PM2.5)= 0.15 lb/VMT
Project
VMT per
daybEquipment
Days Total VMT
PM10
(tons)
PM2.5
(tons)Table 1: 10,000 Square foot NEW Building (BMCD ID: 8, 13, 15, 21, 24, 27, 29, 31, 33, and 36) 2.00 550 1100.00 0.84 0.08Table 2: 4,000 square foot NEW building (BMCD ID: 14) 2.00 550 1100.00 0.84 0.08Table 3: 2,700 sqft NEW Building (BMcD ID: 26) 2.00 550 1100.00 0.84 0.08Table 4: 2,400 sqft NEW Building (BMCD ID: 19) 2.00 550 1100.00 0.84 0.08Table 5: 100 Space PARKING LOT (BMCD ID: 7) 2.00 50 100.00 0.08 0.01Table 6: 1,750 sqft NEW Building (BMCD ID: 10, 12) 2.00 550 1100.00 0.84 0.08Table 7: 5,000 sqft NEW Building (BMCD ID: 40) 2.00 550 1100.00 0.84 0.08Table 8: 35,000 sqft NEW Building (BMCD ID: 2) 2.00 550 1100.00 0.84 0.08Table 9: 45,000 sqft NEW Building (x2 BMCD ID: 1) 2.00 1,692 3384.00 2.58 0.26Table 10: 82,000 sqft NEW Building (x4) (BMCD ID: 5) 2.00 1,478 2956.00 2.25 0.23Table 11: 1,125,000 sqft NEW Building (BMCD ID: 50) 2.00 4,705 9410.00 7.17 0.72Table 12: 2,700 to 22,000 Square foot REPLACEMENT Building (BMCD ID: 39, 41 through 46, 48, 7 total) 2.00 590 1180.00 0.90 0.09Table 13: 0.9 Acre PARKING LOT (BMCD ID: 11) 2.00 50 100.00 0.08 0.01Table 14: Expand Roadway at Voelz Gate PARKING LOT (BMCD ID: 4) 2.00 370 740.00 0.56 0.06Table 15:250 square foot New Building (BMCD ID: 16) 2.00 550 1100.00 0.84 0.08Table 16: 750 square foot UPGRADED Building (BMCD ID: 17) 2.00 580 1160.00 0.88 0.09Table 17: 2050 square foot Upgraded Building (x 1004 BMCD ID: 38) 2.00 580 1160.00 0.88 0.09Table 18: 4400 square foot Upgraded Building (BMCD ID: 28) 2.00 580 1160.00 0.88 0.09Table 19: 5878 square foot Upgraded Building (BMCD ID: 34 and 37) 2.00 580 1160.00 0.88 0.09Table 20: 12,000 square foot Upgraded Building (BMCD ID: 30 and 35) 2.00 580 1160.00 0.88 0.09Table 21: 35,000 square foot REPLACEMENT Building (BMCD ID: 47) 2.00 590 1180.00 0.90 0.09Table 22: 10 Acre New Security Post Parking lot (BMCD ID: 25a) 2.00 104 208.00 0.16 0.02Table 23: 100,000 square foot PARKING LOT (BMCD ID: 22) 2.00 370 740.00 0.56 0.06Table 24: 3 miles of electric upgrades (BMCD ID: 20) 2.00 28 56.00 0.04 0.00Table 25: 22 miles of RAIL network (BMCD ID: 3) 2.00 4,640 9280.00 7.07 0.71Table 26: 10 acre RAIL classification yard (BMCD ID: 6) 2.00 2,440 4880.00 3.72 0.37Table 27: Restoration of 4 miles of RAIL (BMCD ID: 18) 2.00 2,273 4546.00 3.46 0.35Table 28: Repair 11 miles of asphalt ROADS (BMCD ID: 23) 2.00 565 1130.00 0.86 0.09Table 29: Repair 1560000 sqft of asphalt ROADS (BMCD ID: 32) 2.00 755 1510.00 1.15 0.11Table 30: New Security Post Buildings (x2) (BMCD ID: 25b) 2.00 550 1100.00 0.84 0.08Table 31: Upgrade Utility Infrastructure Overall (BMcD ID 9) 2.00 5,475 10950.00 4.17 0.42
Total 41.50 4.15(a) Average construction equipment weights for the grouping of all construction equipment is projected to be 15 tons.
(b) Vehicle Miles Traveled (VMT) per day is projected to be 2 miles and used as a conservative estimate for construction of each Project
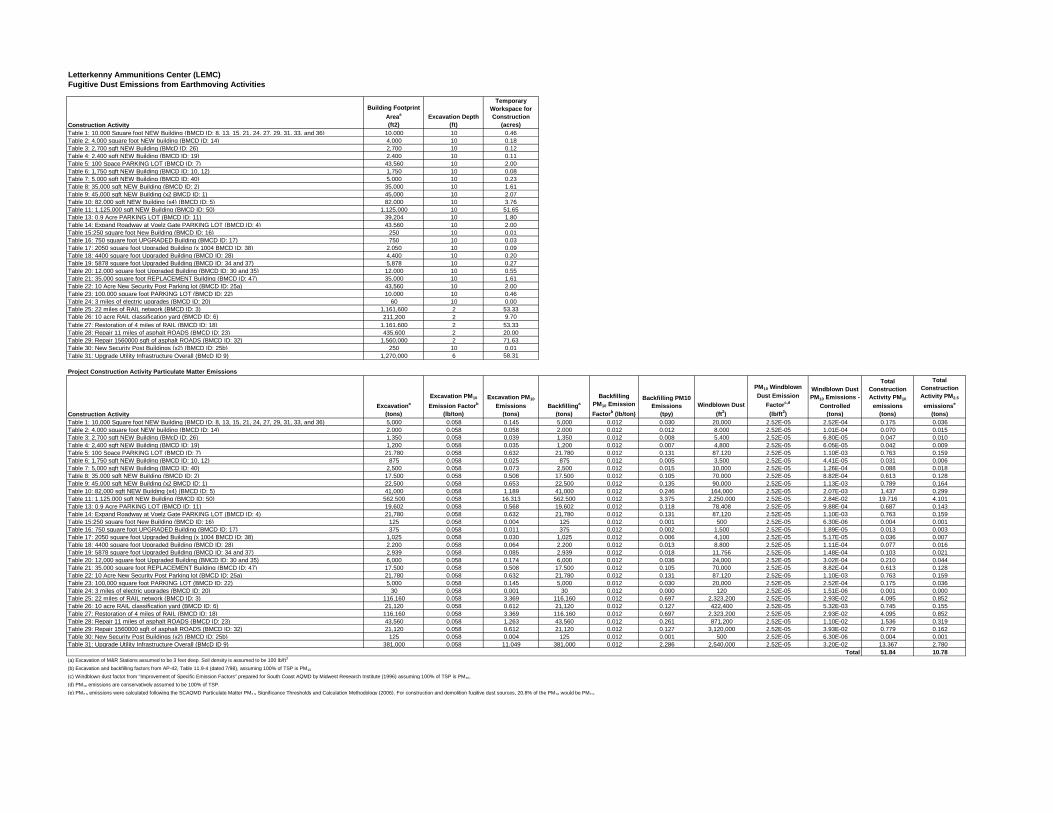
Letterkenny Ammunitions Center (LEMC)Fugitive Dust Emissions from Earthmoving Activities
Construction Activity
Building Footprint
Areaa
(ft2)Excavation Depth
(ft)
Temporary Workspace for Construction
(acres)Table 1: 10,000 Square foot NEW Building (BMCD ID: 8, 13, 15, 21, 24, 27, 29, 31, 33, and 36) 10,000 10 0.46Table 2: 4,000 square foot NEW building (BMCD ID: 14) 4,000 10 0.18Table 3: 2,700 sqft NEW Building (BMcD ID: 26) 2,700 10 0.12Table 4: 2,400 sqft NEW Building (BMCD ID: 19) 2,400 10 0.11Table 5: 100 Space PARKING LOT (BMCD ID: 7) 43,560 10 2.00Table 6: 1,750 sqft NEW Building (BMCD ID: 10, 12) 1,750 10 0.08Table 7: 5,000 sqft NEW Building (BMCD ID: 40) 5,000 10 0.23Table 8: 35,000 sqft NEW Building (BMCD ID: 2) 35,000 10 1.61Table 9: 45,000 sqft NEW Building (x2 BMCD ID: 1) 45,000 10 2.07Table 10: 82,000 sqft NEW Building (x4) (BMCD ID: 5) 82,000 10 3.76Table 11: 1,125,000 sqft NEW Building (BMCD ID: 50) 1,125,000 10 51.65Table 13: 0.9 Acre PARKING LOT (BMCD ID: 11) 39,204 10 1.80Table 14: Expand Roadway at Voelz Gate PARKING LOT (BMCD ID: 4) 43,560 10 2.00Table 15:250 square foot New Building (BMCD ID: 16) 250 10 0.01Table 16: 750 square foot UPGRADED Building (BMCD ID: 17) 750 10 0.03Table 17: 2050 square foot Upgraded Building (x 1004 BMCD ID: 38) 2,050 10 0.09Table 18: 4400 square foot Upgraded Building (BMCD ID: 28) 4,400 10 0.20Table 19: 5878 square foot Upgraded Building (BMCD ID: 34 and 37) 5,878 10 0.27Table 20: 12,000 square foot Upgraded Building (BMCD ID: 30 and 35) 12,000 10 0.55Table 21: 35,000 square foot REPLACEMENT Building (BMCD ID: 47) 35,000 10 1.61Table 22: 10 Acre New Security Post Parking lot (BMCD ID: 25a) 43,560 10 2.00Table 23: 100,000 square foot PARKING LOT (BMCD ID: 22) 10,000 10 0.46Table 24: 3 miles of electric upgrades (BMCD ID: 20) 60 10 0.00Table 25: 22 miles of RAIL network (BMCD ID: 3) 1,161,600 2 53.33Table 26: 10 acre RAIL classification yard (BMCD ID: 6) 211,200 2 9.70Table 27: Restoration of 4 miles of RAIL (BMCD ID: 18) 1,161,600 2 53.33Table 28: Repair 11 miles of asphalt ROADS (BMCD ID: 23) 435,600 2 20.00Table 29: Repair 1560000 sqft of asphalt ROADS (BMCD ID: 32) 1,560,000 2 71.63Table 30: New Security Post Buildings (x2) (BMCD ID: 25b) 250 10 0.01Table 31: Upgrade Utility Infrastructure Overall (BMcD ID 9) 1,270,000 6 58.31
Project Construction Activity Particulate Matter Emissions
Construction ActivityExcavationa
(tons)
Excavation PM10
Emission Factorb
(lb/ton)
Excavation PM10
Emissions (tons)
Backfillinga
(tons)
Backfilling PM10 Emission
Factorb (lb/ton)
Backfilling PM10 Emissions
(tpy)
Windblown Dust
(ft2)
PM10 Windblown
Dust Emission
Factorc,d
(lb/ft2)
Windblown Dust PM10 Emissions -
Controlled (tons)
Total Construction Activity PM10
emissions(tons)
Total Construction Activity PM2.5
emissionse
(tons)Table 1: 10,000 Square foot NEW Building (BMCD ID: 8, 13, 15, 21, 24, 27, 29, 31, 33, and 36) 5,000 0.058 0.145 5,000 0.012 0.030 20,000 2.52E-05 2.52E-04 0.175 0.036Table 2: 4,000 square foot NEW building (BMCD ID: 14) 2,000 0.058 0.058 2,000 0.012 0.012 8,000 2.52E-05 1.01E-04 0.070 0.015Table 3: 2,700 sqft NEW Building (BMcD ID: 26) 1,350 0.058 0.039 1,350 0.012 0.008 5,400 2.52E-05 6.80E-05 0.047 0.010Table 4: 2,400 sqft NEW Building (BMCD ID: 19) 1,200 0.058 0.035 1,200 0.012 0.007 4,800 2.52E-05 6.05E-05 0.042 0.009Table 5: 100 Space PARKING LOT (BMCD ID: 7) 21,780 0.058 0.632 21,780 0.012 0.131 87,120 2.52E-05 1.10E-03 0.763 0.159Table 6: 1,750 sqft NEW Building (BMCD ID: 10, 12) 875 0.058 0.025 875 0.012 0.005 3,500 2.52E-05 4.41E-05 0.031 0.006Table 7: 5,000 sqft NEW Building (BMCD ID: 40) 2,500 0.058 0.073 2,500 0.012 0.015 10,000 2.52E-05 1.26E-04 0.088 0.018Table 8: 35,000 sqft NEW Building (BMCD ID: 2) 17,500 0.058 0.508 17,500 0.012 0.105 70,000 2.52E-05 8.82E-04 0.613 0.128Table 9: 45,000 sqft NEW Building (x2 BMCD ID: 1) 22,500 0.058 0.653 22,500 0.012 0.135 90,000 2.52E-05 1.13E-03 0.789 0.164Table 10: 82,000 sqft NEW Building (x4) (BMCD ID: 5) 41,000 0.058 1.189 41,000 0.012 0.246 164,000 2.52E-05 2.07E-03 1.437 0.299Table 11: 1,125,000 sqft NEW Building (BMCD ID: 50) 562,500 0.058 16.313 562,500 0.012 3.375 2,250,000 2.52E-05 2.84E-02 19.716 4.101Table 13: 0.9 Acre PARKING LOT (BMCD ID: 11) 19,602 0.058 0.568 19,602 0.012 0.118 78,408 2.52E-05 9.88E-04 0.687 0.143Table 14: Expand Roadway at Voelz Gate PARKING LOT (BMCD ID: 4) 21,780 0.058 0.632 21,780 0.012 0.131 87,120 2.52E-05 1.10E-03 0.763 0.159Table 15:250 square foot New Building (BMCD ID: 16) 125 0.058 0.004 125 0.012 0.001 500 2.52E-05 6.30E-06 0.004 0.001Table 16: 750 square foot UPGRADED Building (BMCD ID: 17) 375 0.058 0.011 375 0.012 0.002 1,500 2.52E-05 1.89E-05 0.013 0.003Table 17: 2050 square foot Upgraded Building (x 1004 BMCD ID: 38) 1,025 0.058 0.030 1,025 0.012 0.006 4,100 2.52E-05 5.17E-05 0.036 0.007Table 18: 4400 square foot Upgraded Building (BMCD ID: 28) 2,200 0.058 0.064 2,200 0.012 0.013 8,800 2.52E-05 1.11E-04 0.077 0.016Table 19: 5878 square foot Upgraded Building (BMCD ID: 34 and 37) 2,939 0.058 0.085 2,939 0.012 0.018 11,756 2.52E-05 1.48E-04 0.103 0.021Table 20: 12,000 square foot Upgraded Building (BMCD ID: 30 and 35) 6,000 0.058 0.174 6,000 0.012 0.036 24,000 2.52E-05 3.02E-04 0.210 0.044Table 21: 35,000 square foot REPLACEMENT Building (BMCD ID: 47) 17,500 0.058 0.508 17,500 0.012 0.105 70,000 2.52E-05 8.82E-04 0.613 0.128Table 22: 10 Acre New Security Post Parking lot (BMCD ID: 25a) 21,780 0.058 0.632 21,780 0.012 0.131 87,120 2.52E-05 1.10E-03 0.763 0.159Table 23: 100,000 square foot PARKING LOT (BMCD ID: 22) 5,000 0.058 0.145 5,000 0.012 0.030 20,000 2.52E-05 2.52E-04 0.175 0.036Table 24: 3 miles of electric upgrades (BMCD ID: 20) 30 0.058 0.001 30 0.012 0.000 120 2.52E-05 1.51E-06 0.001 0.000Table 25: 22 miles of RAIL network (BMCD ID: 3) 116,160 0.058 3.369 116,160 0.012 0.697 2,323,200 2.52E-05 2.93E-02 4.095 0.852Table 26: 10 acre RAIL classification yard (BMCD ID: 6) 21,120 0.058 0.612 21,120 0.012 0.127 422,400 2.52E-05 5.32E-03 0.745 0.155Table 27: Restoration of 4 miles of RAIL (BMCD ID: 18) 116,160 0.058 3.369 116,160 0.012 0.697 2,323,200 2.52E-05 2.93E-02 4.095 0.852Table 28: Repair 11 miles of asphalt ROADS (BMCD ID: 23) 43,560 0.058 1.263 43,560 0.012 0.261 871,200 2.52E-05 1.10E-02 1.536 0.319Table 29: Repair 1560000 sqft of asphalt ROADS (BMCD ID: 32) 21,120 0.058 0.612 21,120 0.012 0.127 3,120,000 2.52E-05 3.93E-02 0.779 0.162Table 30: New Security Post Buildings (x2) (BMCD ID: 25b) 125 0.058 0.004 125 0.012 0.001 500 2.52E-05 6.30E-06 0.004 0.001Table 31: Upgrade Utility Infrastructure Overall (BMcD ID 9) 381,000 0.058 11.049 381,000 0.012 2.286 2,540,000 2.52E-05 3.20E-02 13.367 2.780
51.84 10.78(a) Excavation of M&R Stations assumed to be 3 feet deep. Soil density is assumed to be 100 lb/ft3
(b) Excavation and backfilling factors from AP-42, Table 11.9-4 (dated 7/98), assuming 100% of TSP is PM10
(c) Windblown dust factor from "Improvement of Specific Emission Factors" prepared for South Coast AQMD by Midwest Research Institute (1996) assuming 100% of TSP is PM10.
(d) PM10 emissions are conservatively assumed to be 100% of TSP.
(e) PM2.5 emissions were calculated following the SCAQMD Particulate Matter PM2.5 Significance Thresholds and Calculation Methodology (2006). For construction and demolition fugitive dust sources, 20.8% of the PM10 would be PM2.5
Total
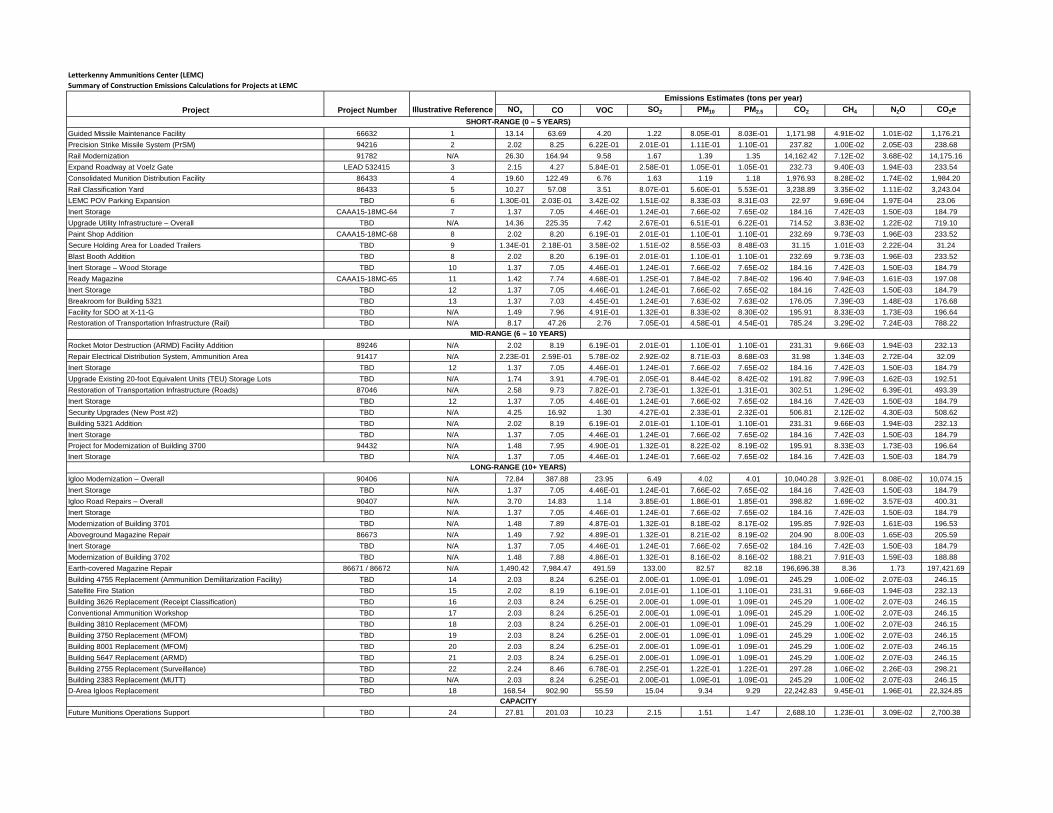
Letterkenny Ammunitions Center (LEMC)Summary of Construction Emissions Calculations for Projects at LEMC
NOx CO VOC SO2 PM10 PM2.5 CO2 CH4 N2O CO2e
Guided Missile Maintenance Facility 66632 1 13.14 63.69 4.20 1.22 8.05E-01 8.03E-01 1,171.98 4.91E-02 1.01E-02 1,176.21
Precision Strike Missile System (PrSM) 94216 2 2.02 8.25 6.22E-01 2.01E-01 1.11E-01 1.10E-01 237.82 1.00E-02 2.05E-03 238.68
Rail Modernization 91782 N/A 26.30 164.94 9.58 1.67 1.39 1.35 14,162.42 7.12E-02 3.68E-02 14,175.16
Expand Roadway at Voelz Gate LEAD 532415 3 2.15 4.27 5.84E-01 2.58E-01 1.05E-01 1.05E-01 232.73 9.40E-03 1.94E-03 233.54
Consolidated Munition Distribution Facility 86433 4 19.60 122.49 6.76 1.63 1.19 1.18 1,976.93 8.28E-02 1.74E-02 1,984.20
Rail Classification Yard 86433 5 10.27 57.08 3.51 8.07E-01 5.60E-01 5.53E-01 3,238.89 3.35E-02 1.11E-02 3,243.04
LEMC POV Parking Expansion TBD 6 1.30E-01 2.03E-01 3.42E-02 1.51E-02 8.33E-03 8.31E-03 22.97 9.69E-04 1.97E-04 23.06
Inert Storage CAAA15-18MC-64 7 1.37 7.05 4.46E-01 1.24E-01 7.66E-02 7.65E-02 184.16 7.42E-03 1.50E-03 184.79
Upgrade Utility Infrastructure – Overall TBD N/A 14.36 225.35 7.42 2.67E-01 6.51E-01 6.22E-01 714.52 3.83E-02 1.22E-02 719.10
Paint Shop Addition CAAA15-18MC-68 8 2.02 8.20 6.19E-01 2.01E-01 1.10E-01 1.10E-01 232.69 9.73E-03 1.96E-03 233.52
Secure Holding Area for Loaded Trailers TBD 9 1.34E-01 2.18E-01 3.58E-02 1.51E-02 8.55E-03 8.48E-03 31.15 1.01E-03 2.22E-04 31.24
Blast Booth Addition TBD 8 2.02 8.20 6.19E-01 2.01E-01 1.10E-01 1.10E-01 232.69 9.73E-03 1.96E-03 233.52
Inert Storage – Wood Storage TBD 10 1.37 7.05 4.46E-01 1.24E-01 7.66E-02 7.65E-02 184.16 7.42E-03 1.50E-03 184.79
Ready Magazine CAAA15-18MC-65 11 1.42 7.74 4.68E-01 1.25E-01 7.84E-02 7.84E-02 196.40 7.94E-03 1.61E-03 197.08
Inert Storage TBD 12 1.37 7.05 4.46E-01 1.24E-01 7.66E-02 7.65E-02 184.16 7.42E-03 1.50E-03 184.79
Breakroom for Building 5321 TBD 13 1.37 7.03 4.45E-01 1.24E-01 7.63E-02 7.63E-02 176.05 7.39E-03 1.48E-03 176.68
Facility for SDO at X-11-G TBD N/A 1.49 7.96 4.91E-01 1.32E-01 8.33E-02 8.30E-02 195.91 8.33E-03 1.73E-03 196.64
Restoration of Transportation Infrastructure (Rail) TBD N/A 8.17 47.26 2.76 7.05E-01 4.58E-01 4.54E-01 785.24 3.29E-02 7.24E-03 788.22
Rocket Motor Destruction (ARMD) Facility Addition 89246 N/A 2.02 8.19 6.19E-01 2.01E-01 1.10E-01 1.10E-01 231.31 9.66E-03 1.94E-03 232.13
Repair Electrical Distribution System, Ammunition Area 91417 N/A 2.23E-01 2.59E-01 5.78E-02 2.92E-02 8.71E-03 8.68E-03 31.98 1.34E-03 2.72E-04 32.09
Inert Storage TBD 12 1.37 7.05 4.46E-01 1.24E-01 7.66E-02 7.65E-02 184.16 7.42E-03 1.50E-03 184.79
Upgrade Existing 20-foot Equivalent Units (TEU) Storage Lots TBD N/A 1.74 3.91 4.79E-01 2.05E-01 8.44E-02 8.42E-02 191.82 7.99E-03 1.62E-03 192.51
Restoration of Transportation Infrastructure (Roads) 87046 N/A 2.58 9.73 7.82E-01 2.73E-01 1.32E-01 1.31E-01 302.51 1.29E-02 6.39E-01 493.39
Inert Storage TBD 12 1.37 7.05 4.46E-01 1.24E-01 7.66E-02 7.65E-02 184.16 7.42E-03 1.50E-03 184.79
Security Upgrades (New Post #2) TBD N/A 4.25 16.92 1.30 4.27E-01 2.33E-01 2.32E-01 506.81 2.12E-02 4.30E-03 508.62
Building 5321 Addition TBD N/A 2.02 8.19 6.19E-01 2.01E-01 1.10E-01 1.10E-01 231.31 9.66E-03 1.94E-03 232.13
Inert Storage TBD N/A 1.37 7.05 4.46E-01 1.24E-01 7.66E-02 7.65E-02 184.16 7.42E-03 1.50E-03 184.79
Project for Modernization of Building 3700 94432 N/A 1.48 7.95 4.90E-01 1.32E-01 8.22E-02 8.19E-02 195.91 8.33E-03 1.73E-03 196.64
Inert Storage TBD N/A 1.37 7.05 4.46E-01 1.24E-01 7.66E-02 7.65E-02 184.16 7.42E-03 1.50E-03 184.79
Igloo Modernization – Overall 90406 N/A 72.84 387.88 23.95 6.49 4.02 4.01 10,040.28 3.92E-01 8.08E-02 10,074.15
Inert Storage TBD N/A 1.37 7.05 4.46E-01 1.24E-01 7.66E-02 7.65E-02 184.16 7.42E-03 1.50E-03 184.79
Igloo Road Repairs – Overall 90407 N/A 3.70 14.83 1.14 3.85E-01 1.86E-01 1.85E-01 398.82 1.69E-02 3.57E-03 400.31
Inert Storage TBD N/A 1.37 7.05 4.46E-01 1.24E-01 7.66E-02 7.65E-02 184.16 7.42E-03 1.50E-03 184.79
Modernization of Building 3701 TBD N/A 1.48 7.89 4.87E-01 1.32E-01 8.18E-02 8.17E-02 195.85 7.92E-03 1.61E-03 196.53
Aboveground Magazine Repair 86673 N/A 1.49 7.92 4.89E-01 1.32E-01 8.21E-02 8.19E-02 204.90 8.00E-03 1.65E-03 205.59
Inert Storage TBD N/A 1.37 7.05 4.46E-01 1.24E-01 7.66E-02 7.65E-02 184.16 7.42E-03 1.50E-03 184.79
Modernization of Building 3702 TBD N/A 1.48 7.88 4.86E-01 1.32E-01 8.16E-02 8.16E-02 188.21 7.91E-03 1.59E-03 188.88
Earth-covered Magazine Repair 86671 / 86672 N/A 1,490.42 7,984.47 491.59 133.00 82.57 82.18 196,696.38 8.36 1.73 197,421.69
Building 4755 Replacement (Ammunition Demilitarization Facility) TBD 14 2.03 8.24 6.25E-01 2.00E-01 1.09E-01 1.09E-01 245.29 1.00E-02 2.07E-03 246.15
Satellite Fire Station TBD 15 2.02 8.19 6.19E-01 2.01E-01 1.10E-01 1.10E-01 231.31 9.66E-03 1.94E-03 232.13
Building 3626 Replacement (Receipt Classification) TBD 16 2.03 8.24 6.25E-01 2.00E-01 1.09E-01 1.09E-01 245.29 1.00E-02 2.07E-03 246.15
Conventional Ammunition Workshop TBD 17 2.03 8.24 6.25E-01 2.00E-01 1.09E-01 1.09E-01 245.29 1.00E-02 2.07E-03 246.15
Building 3810 Replacement (MFOM) TBD 18 2.03 8.24 6.25E-01 2.00E-01 1.09E-01 1.09E-01 245.29 1.00E-02 2.07E-03 246.15
Building 3750 Replacement (MFOM) TBD 19 2.03 8.24 6.25E-01 2.00E-01 1.09E-01 1.09E-01 245.29 1.00E-02 2.07E-03 246.15
Building 8001 Replacement (MFOM) TBD 20 2.03 8.24 6.25E-01 2.00E-01 1.09E-01 1.09E-01 245.29 1.00E-02 2.07E-03 246.15
Building 5647 Replacement (ARMD) TBD 21 2.03 8.24 6.25E-01 2.00E-01 1.09E-01 1.09E-01 245.29 1.00E-02 2.07E-03 246.15
Building 2755 Replacement (Surveillance) TBD 22 2.24 8.46 6.78E-01 2.25E-01 1.22E-01 1.22E-01 297.28 1.06E-02 2.26E-03 298.21
Building 2383 Replacement (MUTT) TBD N/A 2.03 8.24 6.25E-01 2.00E-01 1.09E-01 1.09E-01 245.29 1.00E-02 2.07E-03 246.15
D-Area Igloos Replacement TBD 18 168.54 902.90 55.59 15.04 9.34 9.29 22,242.83 9.45E-01 1.96E-01 22,324.85
Future Munitions Operations Support TBD 24 27.81 201.03 10.23 2.15 1.51 1.47 2,688.10 1.23E-01 3.09E-02 2,700.38
Project Number Illustrative Reference
Emissions Estimates (tons per year)
SHORT-RANGE (0 – 5 YEARS)
MID-RANGE (6 – 10 YEARS)
LONG-RANGE (10+ YEARS)
CAPACITY
Project