environment protection authority - · pdf filesustainable land use ... innovation and relevant...
TRANSCRIPT

Environment Protection AuthorityAnnual Report 2006–07

ENVIRONMENT PROTECTION AUTHORITY
ANNUAL REPORT
1 July 2006 to 30 June 2007
Environment Protection Authority Annual Report 2006−07 For further information please contact: Information Officer Environment Protection Authority GPO Box 2607 ADELAIDE SA 5001 Telephone: (08) 8204 2004 Facsimile: (08) 8204 2020 Freecall (country): 1800 623 445 E-mail: <[email protected]> Website: <www.epa.sa.gov.au> ISSN 1322-1662 ISBN 978-1-921125-56-0 September 2007 © Environment Protection Authority This document may be reproduced in whole or part for the purpose of study or training, subject to the inclusion of an acknowledgment of the source and to its not being used for commercial purposes or sale. Reproduction for purposes other that those given above requires the prior written permission of the Environment Protection Authority.
Printed on recycled paper
CONTENTS
LETTER OF TRANSMITTAL .............................................................................1 EPA CHIEF EXECUTIVE AND EPA BOARD CHAIRMAN’S STATEMENT ...........................3
Reconciliation statement .........................................................................4 ABBREVIATIONS..........................................................................................5 HIGHLIGHTS AND MAJOR INITIATIVES ...............................................................7 INTRODUCTION...........................................................................................9 EPA BOARD AND ITS ACTIVITIES .................................................................... 11
EPA Board members............................................................................... 13 EPA Board Subcommittees....................................................................... 15
Local Government Subcommittee ............................................................. 15 Landfill Guidelines Subcommittee............................................................. 16 State of the Environment Report Subcommittee (SoE Subcommittee) .................. 17 Waste to Resources Subcommittee............................................................ 17
EPA Strategic Plan 2005−08..................................................................... 18 ENVIRONMENTAL GOALS ............................................................................. 21
Clean and healthy air ............................................................................. 21 Water that meets agreed environmental values ............................................ 27 Communities protected from unacceptable noise.......................................... 30 Sustainable land use .............................................................................. 32
Promoting sustainable waste and resource management practices ..................... 32 Adoption of eco-efficient practices ........................................................... 34 Development assessment ....................................................................... 35 Site contamination............................................................................... 37
CORPORATE PROGRAMS.............................................................................. 39 Enhancing organisational capability, accountability and responsiveness.............. 39 EPA Organisational Structure ................................................................... 43 Contributing to a more sustainable South Australia........................................ 45 Developing strategic partnerships ............................................................. 45 Predictable, consistent and fair compliance and enforcement.......................... 48 Timely provision of reliable and relevant environmental information................. 56 Innovation and relevant policy advice and legislation..................................... 56
APPENDIX 1 ORGANISATIONAL INFORMATION ................................................ A-1 Finance and administration .................................................................... A-1 Human Resources and Development ......................................................... A-1 Information technology system improvements............................................. A-6 Occupational health, safety, welfare and injury management ......................... A-7
APPENDIX 2 FINANCIAL STATEMENTS AND ACCOMPANYING NOTES.................... A-11 APPENDIX 3 OTHER STATUTORY INFORMATION............................................ A-33 APPENDIX 4 PUBLICATIONS RELEASED OR UPDATED DURING 2006−07 ............... A-41 APPENDIX 5 FREEDOM OF INFORMATION STATEMENT .................................... A-45 APPENDIX 6 SOUTH AUSTRALIA’S AIR QUALITY DATA .................................... A-49
List of figures
Figure 1 Emergency response—incidents reported by type....................................53 Figure 2 Emergency response—source of calls...................................................54 Figure 3 Hazard and incident reports—annual trends ........................................ A-9 Figure 4 Paper diverted from landfill .......................................................... A-35 Figure 5 Recycling of containers (cans, bottles and cartons) .............................. A-35 Figure 6 Proportion of unleaded fuel used in dual fuel vehicles .......................... A-38 Figure 7 Greenhouse gas emissions............................................................. A-39 Figure 8 Adelaide’s air quality index 2006 .................................................... A-49 Figure 9 PM10 data for Walls Street monitoring site, Whyalla, 2006 ...................... A-50 Figure 10 Daily average particulate lead concentrations at Port Pirie South
monitoring site, Port Pirie, 2006..................................................... A-51 Figure 11 Daily average particulate lead concentrations at Risdon Park
monitoring site, Port Pirie, 2005..................................................... A-51 Figure 12 Sulfur dioxide daily maximum 1-hour averages in Port Pirie, 2006 ............ A-52
List of tables
Table 1 Referred development applications completed...................................... 36 Table 2 Progress against 2006–07 portfolio statement targets .............................. 42 Table 3 Freedom of Information applications, public register requests and
Section 7 enquiries ....................................................................... 51 Table 4 Environmental authorisations ........................................................... 51 Table 5 Number of complaints received by the EPA .......................................... 52 Table 6 Environment Protection Orders......................................................... 54 Table 7 Finalised prosecutions 2006−07......................................................... 55 Table 8 Total number of employees ............................................................ A-2 Table 9 Employee gender balance .............................................................. A-2 Table 10 Number of persons separated from or recruited to EPA........................... A-2 Table 11 Number of persons on leave without pay as at 30 June 2007..................... A-2 Table 12 Number of employees by salary bracket ............................................. A-2 Table 13 Status of employees in current position.............................................. A-3 Table 14 Number of executives by gender, classification and status....................... A-3 Table 15 Average days leave taken per FTE employee........................................ A-3 Table 16 Number of employees by age bracket by gender ................................... A-4 Table 17 Number of Aboriginal and/or Torres Strait Islander employees .................. A-4 Table 18 Cultural and linguistic diversity of employees ...................................... A-4 Table 19 Number of employees with ongoing disabilities requiring workplace
adaptation ................................................................................ A-5 Table 20 Number of employees using voluntary flexible working arrangements
by gender.................................................................................. A-5 Table 21 Documented review of individual performance development plan .............. A-5 Table 22 Leadership and management training expenditure................................. A-5 Table 23 Accredited training packages by classification...................................... A-6 Table 24 Positions with customer service reflective in job and person specifications... A-6 Table 25 Occupational health, safety and welfare (OHSW) statistics ...................... A-7 Table 26 Account payment performance .......................................................A-11 Table 27 Use of consultants—controlled entity................................................A-11 Table 28 Use of consultants—administered entity ............................................A-12 Table 29 Overseas travel by employees ........................................................A-33 Table 30 Performance against annual energy use targets ...................................A-34 Table 31 IT equipment and energy consumption..............................................A-34 Table 32 Printer consumables recycling ........................................................A-36 Table 33 EPA vehicle fleet ........................................................................A-37 Table 34 Energy use and greenhouse gas emissions ..........................................A-38

1
LETTER OF TRANSMITTAL
The Hon Gail Gago, MLC Minister for Environment and Conservation Parliament House North Terrace ADELAIDE South Australia 5000 Dear Minister It is with pleasure that I present you with the Annual Report of the Environment Protection Authority for the period 1 July 2006 to 30 June 2007. This report has been prepared in accordance with requirements of the Environment Protection Act 1993 and the Public Sector Management Act 1995. Yours sincerely
Dr Paul Vogel Chief Executive and Chair Environment Protection Authority 28 September 2007

3
EPA CHIEF EXECUTIVE AND EPA BOARD CHAIRMAN’S STATEMENT I am delighted to present the Environment Protection Authority Annual Report for 2006−07. It is also with some sadness, as this is my last report before moving to Western Australia with my family in late 2007. During my term as Chairman and Chief Executive, I have enjoyed leading the EPA and striving to realise its vision for a clean, healthy and valued environment that supports social and economic prosperity for all South Australians. Once again the year has presented both the Environment Protection Authority (EPA) and the EPA Board with numerous opportunities and challenges for promoting the principles of ecologically sustainable development. I would like to take this opportunity to reflect on what has been achieved to allow the EPA to move from being a good organisation to a great one. The ‘culture change’ and performance improvement program, combined with a change in the EPA’s structure for optimal alignment with our corporate strategy, has been achieved, resulting in improved delivery of our programs and services to stakeholders. We have also invested in our people to ensure staff have the required skills to effectively do their job, and have prioritised development of systems, processes and policies to support them. In addition, the performance improvement program is driving improvements in performance measurement and reporting. While the past year has been one of continued progress it has also presented the EPA with some challenges that are worth acknowledging, including:
• delivering sustainable environmental outcomes under the SA Government’s strong economic growth agenda
• the Council of Australian Governments and State Government’s priorities for reducing the regulatory burden on business and streamlined environmental assessments and approvals
• increasing importance of interactions and working relationships with local and state governments, industry and the community
• managing ongoing competing and often conflicting community, government and commercial interests in environmental management issues whilst ensuring a reputation for being a credible and effective environmental regulator.
These external drivers and pressures, together with complex and increasing environmental challenges, are the key reasons why the EPA must continue to learn, change and evolve. I am confident the EPA is prepared for these challenges and opportunities and will be successful in achieving its aims. It has been a privilege to serve South Australia in this position for the past five years. This is particularly so because of the support I have received from industry, the community and from the various ministers and their staff. Most of all, I have been able to work in partnership with a team of professional and cooperative staff dedicated to public service and providing a clean, safe and sustainable environment for South Australia. I thank them all.
Dr Paul Vogel Chief Executive and Chair Environment Protection Authority 28 September 2007
4
Reconciliation statement
The EPA would like to acknowledge the traditional custodians on whose ancestral lands the EPA carries out its business, and that it respects their spiritual relationship with their country. The EPA also acknowledges the deep feelings of attachment and relationship of Aboriginal peoples to country.
In fulfilling its functions, the EPA is cognisant of the cultural and natural heritage of traditional owners and strives to achieve positive outcomes wherever these matters are concerned.
5
ABBREVIATIONS
ABC Adelaide Brighton Cement CARES Complaints and Reports of Environmental Significance CDL container deposit legislation; or the beverage container provisions
of the Environment Protection Act 1993 CMS Community Mediation Services CSIRO Commonwealth Scientific and Industrial Research Organisation DA development applications DEH Department for Environment and Heritage DTED Department for Trade and Economic Development DTEI Department for Transport, Energy and Infrastructure DWLBC Department of Water, Land and Biodiversity Conservation EIP environment improvement program EP Act Environment Protection Act 1993 EPA Environment Protection Authority EPHC Environment Protection and Heritage Council EPO Environment Protection Order EPP Environment Protection Policy ERD Court Environment, Resources and Development Court FTE full-time equivalent GENI General Environmental Information Systems GIS geographical information systems GoGO Greening of Government Operations HRD human resources and development IT information technology KESAB Keep South Australia Beautiful KPIs key performance indicators LGA Local Government Association LMC Land Management Corporation NEPC National Environment Protection Council NEPM National Environment Protection Measure NPI National Pollutant Inventory NRM natural resource management NWQMS National Water Quality Management System OHSW occupational health, safety and welfare PC personal computer PIRSA Department of Primary Industries and Resources SA PM10 particles of less than 10 micrometres in diameter RPC Act Radiation Protection and Control Act 1982 WQIP water quality improvement plan WRC Act Workers Rehabilitation and Compensation Act 1986

Environment Protection Authority Annual Report 2006−07
7
HIGHLIGHTS AND MAJOR INITIATIVES The following is a list of some of the EPA’s key highlights and major initiatives for 2006−07: Corporate and business support
• Establishment and review of OHSW systems • Delivered second Leadership Development Program • Finance and Administration Branch streamlined or automated processes and systems
Corporate strategy, governance and communications
• Finalised an EPA penalty calculations policy to guide implementation of civil penalties in South Australia
• Site Contamination Bill 2007 introduced into Parliament. Regulation and compliance
• Finalised revised approach to EPA licence fee structure • Developed a risk-based environment compliance auditing program • Developed an operational manual for authorised officers
Science and sustainability
• Completed the Adelaide Coastal Waters Study • Led the implementation of the National Water Quality Management Strategy for key
South Australian water bodies.


Environment Protection Authority Annual Report 2006−07
9
INTRODUCTION The Environment Protection Authority (EPA) is an independent statutory authority, which forms part of the Environment and Conservation Portfolio of South Australia for government administrative purposes. The portfolio also includes the Department for Environment and Heritage (DEH), the Department of Water, Land and Biodiversity Conservation (DWLBC) and Zero Waste South Australia (ZWSA). The EPA is South Australia’s primary environmental regulator for the control and minimisation of pollution and waste. It is responsible for the protection and enhancement of air and water quality, and control of pollution, waste and environmental noise. The EPA uses a number of ways to manage environmental risk and to ensure that business, government and the community consider the environmental impacts of their daily operations. The EPA’s mission is to manage and influence human activities to protect, restore and enhance the environment and to support human, social and economic wellbeing. This is reflected in the EPA’s capacity to regulate environmentally significant activities, and its role in influencing others and building partnerships with stakeholders and the community. The functions of the EPA are detailed in the Environment Protection Act 1993 (EP Act). In summary, its purpose is to:
• administer and enforce the EP Act, and advise the minister on administration of the EP Act and of other legislation that might affect the environment
• prepare draft Environment Protection Policies, contribute to national environment protection measures and regularly review the effectiveness of policies, regulations, measures and practices, and provide relevant advice to the minister
• facilitate the pursuit of the objects under the EP Act by government, the private sector and the public, by advising on, and assisting with, the development of best environmental management practices
• regulate, control and/or monitor activities through an authorisation system for controlling and minimising pollution and waste, and through investigation, compliance assessment, environmental monitoring and evaluation, and enforcement.
The staff of the EPA administer the EP Act, and are assisted by members of the South Australian Police and local government officers who have been appointed as authorised officers under the EP Act. The EPA Board is the governing body under the EP Act, and hence is accountable for its administration. Significant administrative responsibilities under the EP Act include licensing prescribed activities of environmental significance; monitoring air and water quality, waste and noise; and investigating incidents that cause, or could cause, serious or material environmental harm. The EPA maintains a program of community involvement and environmental monitoring, as well as developing policy and reviewing legislation. As at 30 June 2007, the EPA had issued the following environmental authorisations—2024 licences, 118 exemptions and 24 works approvals. The 2024 licences were issued under the EP Act for industries ranging from large cement manufacturers, electricity generators and wastewater treatment plants to foundries, abattoirs and shipyards. Licensed activities are managed on a risk basis, where environment protection officers inspect premises, negotiate environmental improvements and, where necessary, enforce legislation. Some EPA powers are delegated to local government to deal with matters not licensed under the EP Act. The EPA assists local government officers with training, the provision of meters and ongoing technical and legal support. It is currently working with local government to investigate opportunities for expanding local government’s role in managing low risk

Environment Protection Authority Annual Report 2006−07
10
environmental protection matters—generally matters not licensed under the EP Act. South Australian Police continue to use the powers under the EP Act to help manage local nuisances, particularly domestic noise. The Radiation Protection and Control Act 1982 (RPC Act) is also administered by the EPA, but through delegations by the Minister for Environment and Conservation to the Chief Executive of the EPA. As such, the reporting requirements for the RPC Act for this reporting period are covered in a separate, but attached, report.

Environment Protection Authority Annual Report 2006−07
11
EPA BOARD AND ITS ACTIVITIES The nine members of the EPA Board are appointed by the governor. They are chosen for their qualifications, experience and expertise in the areas of environmental protection and management; industrial, commercial or economic development; local government; the environmental management industry; environmental conservation and advocacy; and environmental law. This wide spectrum of expertise gives the EPA the capacity to make decisions on the complex problems and issues that threaten the environment. The Board is the governing body of the EPA. It provides strategic direction, develops environmental policy and monitors performance. It also makes decisions on significant environmental issues under the EP Act. The EPA Board:
• is independent and makes unbiased, balanced decisions based on the best available evidence
• is open and responsive to its stakeholders • is professional in its business • is proactive and progressive • strives to provide quality and timely information and advice • values the contribution of its support and partnership organisations.
General and special meetings
During 2006−07, the Board met formally on 12 occasions. It also held a special strategic planning session on 15 May 2007. At this session, the Board identified a number of strategic priorities facing the agency and considered the best way to deal with these. As a result of the day, the Board strengthened its governance framework and determined a number of key priorities requiring further action over the next 12 months. In association with these meetings, the Board also held various regional consultation sessions with stakeholders, which are detailed below.
Stakeholder consultation program 2006–07
In addition to the legislative requirement to hold an annual EPA Round-table conference, the EPA Board initiated a number of consultation sessions with stakeholders during 2006−07. As in past years, these sessions have proved extremely beneficial to all participants and gave the Board an opportunity to hear directly from stakeholders about environment protection matters they considered important. This program of consultation contributes to the review and refinement of the EPA’s priorities. Mid North regional consultation meeting Members of the Board visited Whyalla’s Mount Laura landfill and Hummock Hill, as well as observed OneSteel’s pellet plant. The visit allowed Board members to meet with operators and obtain an insight into the issues and challenges associated with the sites. In addition, Board members participated in a public forum to discuss issues such as:
• EPA Landfill Guidelines—timeframes for compliance • air quality and respiratory problems in the region • OneSteel’s indenture licence • water use for dust control and possible future water restrictions.
Meeting with environment groups The Board held a consultation session with representatives from various environment groups including the Conservation Council of SA, The People’s Environment Protection Alliance,
Environment Protection Authority Annual Report 2006−07
12
Environmental Defenders Office, Clean Air Society of Australia & New Zealand, Nature Conservation Society of South Australia, Keep South Australia Beautiful (KESAB), Friends of Gulf St Vincent and Nature Foundation SA. Key themes included:
• air quality issues and indoor air quality • review of the current container deposit legislation and the deposit refund amount • land use issues including the regulation and management of landfill sites.
Northern metropolitan councils consultation The Board met with Charles Sturt, Salisbury, Port Adelaide Enfield, Playford and Tea Tree Gully councils to discuss issues of importance. Key themes included:
• noise control restrictions impacting on council operations • referral processes between the EPA and councils regarding noise and dust complaints • possibility of using more civil mechanisms, like the Fences Act 1975, to resolve
disputes between neighbours. Port Pirie regional consultation As part of its consultation program, the Board travelled to Port Pirie where it undertook a tour of the Zinifex smelter and received a briefing on the tenby10 Program that is aimed at reducing the blood lead levels of children in Port Pirie. The goal of this program is to have 95% of Port Pirie children up to the age of four years with blood lead levels below the Australian national guideline of 10 micrograms per decilitre (ug/dL) by 2010. A community consultation session was also held during which the following key issues were raised:
• waste management, including landfill and recycling, illegal dumping and disposal of hazardous household waste
• lead contamination in children's blood and food produce • contamination of rail corridors and state liability for remediation.
Waste industry visit A visit of waste management and recycling facilities in the Wingfield precinct was undertaken in June. The sites visited include Wastecare SA, Jeffries Garden Soils, AMCOR Recycling, Adelaide Resource Recovery, Alternative Fuel Company, Integrated Waste Services and the recycling division of SIMS Metal. This tour enabled the Board to see, first hand, how the facilities operate and to develop a better understanding of the EPA’s current involvement with this significant sector.
Round-table 2007
The annual Round-table is a required consultative measure under the EP Act and was held in May. The theme for this year’s Round-table was ‘Growing Prosperity’. In collaboration with the Department for Trade and Economic Development (DTED), approximately 50 participants from business, industry and community based organisations focused on the role of environmental regulation in growing prosperity in a sustainable manner. Keynote speakers Neil Coulson (Chief Executive of the Victorian Chamber of Commerce and Industry) and Graham Paterson (Head of Corporate Responsibility and Sustainability with Westpac Banking Corporation) shared valuable insights based on their own experiences.
Environment Protection Authority Annual Report 2006−07
13
A number of themes emerged from group discussions at the Round-table. Some of these were: • providing tools and information for businesses • reward and recognition • developing partnerships • developing and managing programs.
A whole-of-government response to many of the issues raised at the Round-table is being developed. EPA Board members
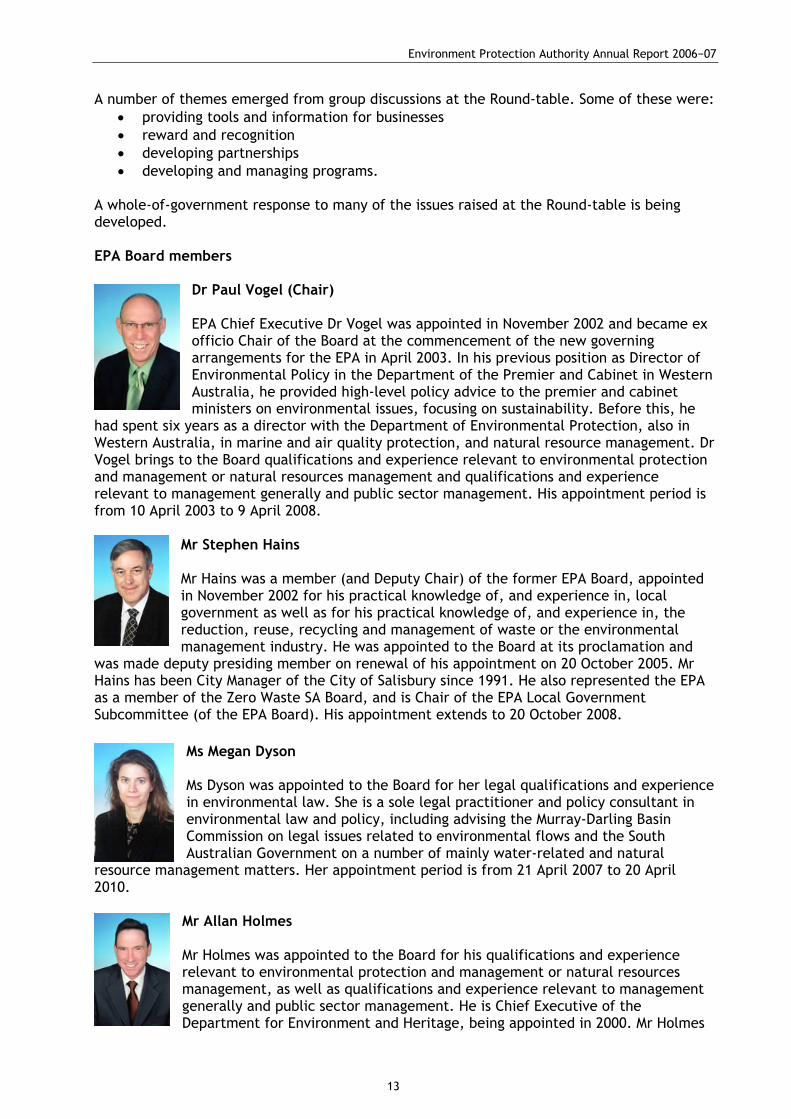
Dr Paul Vogel (Chair) EPA Chief Executive Dr Vogel was appointed in November 2002 and became ex officio Chair of the Board at the commencement of the new governing arrangements for the EPA in April 2003. In his previous position as Director of Environmental Policy in the Department of the Premier and Cabinet in Western Australia, he provided high-level policy advice to the premier and cabinet ministers on environmental issues, focusing on sustainability. Before this, he
had spent six years as a director with the Department of Environmental Protection, also in Western Australia, in marine and air quality protection, and natural resource management. Dr Vogel brings to the Board qualifications and experience relevant to environmental protection and management or natural resources management and qualifications and experience relevant to management generally and public sector management. His appointment period is from 10 April 2003 to 9 April 2008.
Mr Stephen Hains Mr Hains was a member (and Deputy Chair) of the former EPA Board, appointed in November 2002 for his practical knowledge of, and experience in, local government as well as for his practical knowledge of, and experience in, the reduction, reuse, recycling and management of waste or the environmental management industry. He was appointed to the Board at its proclamation and
was made deputy presiding member on renewal of his appointment on 20 October 2005. Mr Hains has been City Manager of the City of Salisbury since 1991. He also represented the EPA as a member of the Zero Waste SA Board, and is Chair of the EPA Local Government Subcommittee (of the EPA Board). His appointment extends to 20 October 2008.
Ms Megan Dyson Ms Dyson was appointed to the Board for her legal qualifications and experience in environmental law. She is a sole legal practitioner and policy consultant in environmental law and policy, including advising the Murray-Darling Basin Commission on legal issues related to environmental flows and the South Australian Government on a number of mainly water-related and natural
resource management matters. Her appointment period is from 21 April 2007 to 20 April 2010.
Mr Allan Holmes Mr Holmes was appointed to the Board for his qualifications and experience relevant to environmental protection and management or natural resources management, as well as qualifications and experience relevant to management generally and public sector management. He is Chief Executive of the Department for Environment and Heritage, being appointed in 2000. Mr Holmes
Environment Protection Authority Annual Report 2006−07
14
chairs the Zero Waste SA Board and represents the state on the Murray-Darling Basin Commission. His appointment is from 21 April 2007 to 20 April 2010.
Mr Andrew Fletcher Mr Fletcher is an engineer with more than 30 years experience in senior management roles in the engineering and construction industry. He is a Director and Chief Executive Officer of the Port Adelaide Maritime Corporation, a member of the Defence Industry Advisory Board and a past member of the Economic
Development Board. He is also a board member of Penrice Soda Holdings Ltd and has extensive corporate governance experience in the private and public sectors, including significant personal interests in the South Australian wine industry. He was appointed to the Board for his practical knowledge of, and experience in, industry, commerce or economic development. His appointment period is from 21 April 2007 to 20 April 2010.
Mr Mike Nagel Mr Nagel has worked in global roles in the manufacturing industry in Australia and overseas for over 40 years. He retired in November 2004 after a distinguished career with Britax Rainsfords (now Shefenacker Vision Systems), the South Australian Centre for Manufacturing (as Executive Director) and subsequently with Seeley International. Mr Nagel was a trustee of VIVASA
(formerly SA Business Vision 2010) and was elected as a Companion of the Institution of Engineers in 2000 for his support for engineering. He has been a Foundation Fellow of the Australian Institute of Company Directors since 1990. He was appointed to the Board for his practical knowledge of, and experience in, industry, commerce or economic development. His appointment period is from 20 October 2005 to 21 October 2008. Mr Nagel resigned from the EPA Board for personal reasons effective 30 June 2007. The EPA thanks Mr Nagel for his valuable contribution to the Board over the past two years and his commitment to the protection of the environment of South Australia.
Mr Greg Panigas Mr Panigas is State Manager of SITA/PWM/Pacific Waste Management with 12 years experience in the waste management industry. He is a board member of both KESAB and the Waste Management Association of Australia’s SA Branch Executive, and is a fellow of the Australian Institute of Company Directors. Mr Panigas was appointed to the Board for his practical knowledge of, and
experience in, the reduction, reuse, recycling and management of waste or the environmental management industry. His appointment is from 4 March 2006 to 3 March 2009.
Ms Yvonne Sneddon Ms Sneddon has expertise in a wide range of areas including sustainability reporting and strategy development. She serves on a number of boards and committees and is Presiding Member of the Adelaide and Mount Lofty Ranges Natural Resources Management (NRM) Board. Ms Sneddon has over 25 years experience as a chartered accountant, was previously a partner in Deloitte
Touche Tohmatsu in Adelaide and now practises as a non-executive company director. Ms Sneddon was appointed to the Board for her qualifications and experience relevant to environmental protection and management or natural resources management. Her appointment period is from 21 April 2006 to 20 April 2009.

Environment Protection Authority Annual Report 2006−07
15
Ms Katherine Wells Ms Wells was appointed to the Board for her practical knowledge of, and experience in, environmental conservation and advocacy on environmental matters on behalf of the community. Ms Wells was the Chair of the South Australian Premier's Round Table on Sustainability, and former Vice President of the Australian Conservation Foundation, Australia’s peak national environment
group. Ms Wells is a climate change consultant to Finlaysons Lawyers in Adelaide, has broad experience in environmental law and policy and has worked around Australia for business, the environment movement and the wider community. Ms Wells also serves on a number of other boards and committees, including the recently formed Community Engagement Board for South Australia’s Strategic Plan, and the Zero Waste SA Board. Her appointment is from 21 April 2007 to 20 April 2010.
Outgoing member of the Board Mr Mike Elliott Mr Mike Elliott was the director of UniSA Northern Adelaide Partnerships, appointed in 2002. Prior to this, he was the leader of the SA Democrat Party (since 1993) and a member of the Legislative Council. Mr Elliott was appointed to the Board for his practical knowledge of, and experience in, environmental conservation and advocacy on environmental matters on behalf of the community. His term with the Board commenced 21 April 2005 and concluded 20 April 2007. The EPA thanks Mr Elliott for his valuable contribution to the Board over the past two years and his commitment to the protection of the environment of South Australia. EPA BOARD Subcommittees Four subcommittees reported to the Board over 2006−07:
• Local Government Subcommittee • Landfill Guidelines Subcommittee (dissolved in November 2006) • State of the Environment Report Subcommittee (created in April 2007) • Waste to Resources Subcommittee (created in May 2007).
Local Government Subcommittee The Local Government Subcommittee was established by the EPA Board in June 2005 under Section 17(1)(b) of the EP Act as a forum for formal discussion and resolution of issues between the EPA and local government, and as a mechanism for involving local government in the EPA policy development process.
The subcommittee is comprised of representatives from both local government and the EPA. It is chaired by Mr Stephen Hains and subcommittee members include:
• Mr Stephen Hains (Chair) • Mr Michael Barry, Local Government Association of South Australia • Mr John Coombe, Alexandrina Council • Ms Verity Sanders, City of Port Adelaide Enfield • Mr Tom Spirat, Corporation of the City of Whyalla • Mr David Whiting, Corporation of the Town of Walkerville • Ms Susan Churchman, Planning and Communications, EPA • Mr Tony Circelli, Regulation and Compliance, EPA • Mr Peter Dolan, Science and Sustainability, EPA.
Terms of reference Established as a subcommittee of the EPA Board, the subcommittee is accountable and reports to the EPA Board. The subcommittee provides advice to the EPA Board and the Local

Environment Protection Authority Annual Report 2006−07
16
Government Association (LGA) State Executive Committee. The subcommittee receives matters referred from the LGA State Executive and the EPA Board. The subcommittee’s functions include:
• finalising a formal agreement to support the sharing of environment protection responsibilities between the EPA and local government
• establishing key performance indicators to be used as a two-way performance measure on the efficacy of the formal agreement
• overseeing the operation of the formal agreement, including the resolution of any disputes
• providing a mechanism for the timely involvement of local government in the EPA policy development process
• advising the EPA Board on issues affecting the EPA’s relationship with local government and acting as an interface between the Board and local government on such issues including those arising out of EPA regulation of local government activities
• providing advice to the Board on any matters referred to the subcommittee by the Board.
Landfill Guidelines Subcommittee The Landfill Guidelines Subcommittee was established by the EPA Board in June 2006 under Section 17(1)(b) of the EP Act as a forum for formal discussion and resolution of issues between the EPA and the waste industry. The EPA Guidelines: Environmental management of landfill facilities were the subject of extended consultation by the EPA with local government and the waste industry through the Waste Management Association of South Australia. The guidelines were prepared to provide detailed guidance for planning, designing, operating, monitoring and closure of landfills based on environmental risk; greater transparency in the development and implementation of standards; more assurance for short, medium and long-term planning of waste management facilities; and advice on compliance with the Environment Protection Act 1993, including compliance with the general environmental duty. Members of the Landfill Subcommittee were:
• Mr Stephen Hains (Chair) • Mr Greg Panigas • Mr Mike Nagel.
The subcommittee was supported by senior EPA staff. Terms of reference Established as a subcommittee of the EPA Board, the Landfill Guidelines Subcommittee was accountable and reported to the EPA Board. The objectives of the subcommittee were to:
• develop a shared understanding of issues associated with the management of landfills and associated operations, especially as they are dealt with at the interface between the EPA and local government
• develop a shared understanding of the development of the EPA Guidelines: Environmental management of landfill facilities and their impact on local government and industry
• identify additional analysis, including further information, that was required to progress the completion of the guidelines
• identify desired outcomes to be achieved with the introduction of a landfill classification system and associated guidelines
• reach agreement about the most effective means of achieving the outcomes.
Environment Protection Authority Annual Report 2006−07
17
At its November 2006 meeting, the Board requested this subcommittee be disbanded as it had completed its task. The Landfill Subcommittee’s report can be found on the EPA website at <www.epa.sa.gov.au/pdfs/landfill_guidelines.pdf>.
State of the Environment Report Subcommittee (SoE Subcommittee) The State of the Environment Report Subcommittee was established by the EPA Board in April 2007 under Section 17(1)(b) of the EP Act as a mechanism to drive the development of the State of the Environment Report for South Australia 2008. The subcommittee is comprised of representatives from the EPA Board, Natural Resources Management (NRM) Council, Premier’s Round Table on Sustainability, local government, academia and the Department of Premier and Cabinet’s Sustainability and Climate Change Division. Members of the State of the Environment Report Subcommittee are:
• Dr Paul Vogel,(Chair) • Ms Megan Dyson, (Deputy Chair) • Ms Vicki-Jo Russell, NRM Council • Prof Mike Young, Premier’s Round Table on Sustainability • Mr Mark Searle, City of Marion • Prof Mike Taylor, University of South Australia • Prof Nick Harvey, University of Adelaide • Mr Jacob Wallace, Department of the Premier and Cabinet (Sustainability and
Workforce Planning Division). Terms of reference Established as a subcommittee of the EPA Board, the SoE Report Subcommittee is accountable and reports to the EPA Board. The key functions of the subcommittee are:
• management and oversight of the process, including monitoring of milestones and outputs
• multi-directional information exchange between the SoE Steering Committee and external representative bodies
• review and input into report structure and format • review of peer reviewer selections • endorsement of subsidiary documents, ie Education Package and Communications
Strategy • development of recommendations to be forwarded to the EPA Board for consideration
in the final report • ensure lessons learnt from producing this report are documented for future reports.
Waste to Resources Subcommittee The Waste to Resources Subcommittee was established by the EPA Board in May 2007 under Section 17(1)(b) of the EP Act as a forum for formal discussion and resolution of issues in relation to regulation of waste to resources. Members of the subcommittee are:
• Mr Allan Holmes (Chair) • Ms Megan Dyson • Mr Greg Panigas • Mr Vaughan Levitzke, Zero Waste SA
The subcommittee is supported by senior EPA staff.
Environment Protection Authority Annual Report 2006−07
18
Established as a subcommittee of the EPA Board, the Waste to Resources Subcommittee is accountable and reports to the EPA Board. The objectives of the subcommittee are to:
• recommend to the Board an appropriate model for the control of the environmental impacts of waste in the context of the State Waste Strategy
• advise the Board on strategies and other requirements for implementing the model. Terms of reference In developing recommendations and advice, the subcommittee will:
• explore and articulate the EPA goal for regulating waste within the state policy framework of increasing recycling and resource recovery
• identify the key issues for regulating waste—when and how to regulate. This task will include articulating and assessing the effectiveness of the current arrangements
• identify possible strategies to deal with the issues in a way that will achieve the identified goal
• identify any other relevant matters • consider the potential for a regional waste plan • provide advice to the Board on the above issues at its September 2007 meeting.
EPA STRATEGIC PLAN 2005−08 In November 2006, the EPA Board initiated a review of the EPA’s strategic plan. Following consultation with EPA staff and the Executive, Goal Four has been expanded to that of ‘Sustainable Use of Resources’ rather than ‘Sustainable Land Use’. The Strategic Plan has been refined to provide a business model that identifies five strategies for the manner in which the EPA will conduct business. The business model replaces the less definitive cross-goal strategies. Feedback from EPA staff indicated that the ‘gap’ between the Strategic Plan and divisional-level business plan was difficult to bridge meaningfully. Consequently, a Corporate Operational Plan, which aims to bridge the gap, will be developed and implemented for 2007−08.
KEY ASPECTS OF THE EPA STRATEGIC PLAN
Our vision A clean, healthy and valued environment that supports social and economic prosperity for all South Australians now and in the future Our mission We manage and influence human activities to protect, restore and enhance the environment and to support human, social and economic well-being
Our values
Empathy Listening to the needs of our stakeholders and responding with understanding, sensitivity and respect underpin the quality of our service to our stakeholders
Sound judgment Practical and balanced judgement guided by sound science, analysis and evidence
Cooperation Achieving results through open communication and working in partnership with each other and our stakeholders
Environment Protection Authority Annual Report 2006−07
19
Innovation Using lateral thinking and initiative for creative and innovative problem solving
Integrity Honesty, transparency and taking responsibility for all we say and do provide the foundation for being accountable.
EPA business model Working together The EPA will work in partnership with business, community and governments to identify and implement innovative and cost-effective means to reduce human impacts on the environment and improve our quality of life. Reducing human impacts For existing activities that pose a risk to the environment or human health, the EPA will use its regulatory tools and policies to set standards and criteria and ensure compliance through regimes that are fair, consistent, predictable, transparent and proportional. New developments will continue to be assessed for environmental impacts in a timely manner to ensure that sustainability objectives and principles are met. Risk-based and outcome-focused The EPA focuses its attention on those activities that present a significant risk to the environment or human health, including cumulative risk. Our regulatory, policy and business systems are being reformed to ensure that unnecessary regulatory burdens on business are removed while ensuring that environmental risks are reduced and environmental outcomes achieved. Sound regulatory and policy frameworks We will ensure that environmental regulation and policy is based on sound science and evidence, and remains relevant, effective and efficient by developing and applying innovative and appropriate regulatory and policy tools to support the transition to more sustainable practices. Efficient use of resources Through cooperative industry partnership programs and its regulatory programs, the EPA can help industry save money, improve productivity and competitiveness, and reduce environmental impacts by using fewer resources. Organisational capabilities The EPA will continue its program of systematically developing its organisational capabilities to ensure that it can deliver the strategy outlined in this plan. The focus will be on staff development and the continuous improvement of systems and processes.
Future direction The strategic priorities reflect the areas to which the EPA will be giving particular attention over the next 12−18 months, as described below. Better environmental regulation The EPA will develop effective environmental regulation that incorporates a mix of policy tools, a risk-based approach, and effective engagement and dialogue with business and other stakeholders. Better regulation can drive innovation, provide clear standards, and reduce resource inputs and the generation of waste and pollution.
Environment Protection Authority Annual Report 2006−07
20
Informed businesses and communities behaving sustainably The EPA will contribute to a sustainable South Australia through improved consultation, the delivery of educational and behavioural change programs, improving access to its services and working in partnerships. The threat of climate change makes the change to sustainable behaviour more pressing. Furthering a service-oriented culture ‘South Australia’s Strategic Plan places an obligation on the public sector to measure and improve the community’s satisfaction with the wide range of services they receive from Government.1’ The EPA is committed to ensuring that it has a service-oriented culture. Recruiting and retaining good people At the heart of the EPA’s ability to undertake its regulatory functions and deliver its other programs and services are its staff. The current demand for skilled and experienced people provides a challenge in recruiting and retaining the breadth of skills and knowledge required to move from a good to a great organisation. The EPA will develop and deploy appropriate strategies to ensure the recruitment and retention of good people.
1 Hon Jay Weatherill MP Minister Assisting the Premier in Cabinet, Business and Public Sector Management, Customer Service Good Practice Guide.

Environment Protection Authority Annual Report 2006−07
21
ENVIRONMENTAL GOALS
CLEAN AND HEALTHY AIR Air quality affects us all. What is not clear to many people is that although South Australia generally has good air quality, concentrations of some air pollutants are still too high in some areas when compared with national and international standards. Levels of fine airborne particles, called PM10 and PM2.5, are still too high in some areas of metropolitan Adelaide and in some regional centres. Particles arise from many sources including vehicles, domestic wood heaters, industries and, on occasions, natural events such as bushfires and dust storms. These particles, especially PM2.5, have adverse effects on human health, being strongly associated with a range of respiratory diseases and heart conditions in urban communities. The very young, elderly and people who are already sick are at greatest risk. Even in Adelaide, preliminary estimates suggest that health costs from fine particles alone are in the hundreds of millions of dollars per year. Levels of other pollutants are usually low, although ozone concentrations can occasionally exceed the national standard under certain weather conditions. Lead is still a concern in Port Pirie, prompting the establishment of the tenby10 program, aimed at substantially reducing blood lead levels in children by 2010. The EPA is leading the development of an air quality strategic plan for South Australia that will address these problems over the next decade or so. A primary outcome of this strategic plan will be a set of practical targets aimed at improving air quality and consequent population exposure to criteria air pollutants2 in the Adelaide metropolitan area and major regional airsheds around the state. Strategies and activities Key strategies for this goal include:
• developing a framework for managing air quality • understanding air quality in critical airsheds • national policy: Air National Environment Protection Measure (NEPM) review.
Key point source pollution programs
Zinifex Zinifex operates the world’s largest lead smelter at Port Pirie. The operation, which began in 1889, has resulted in historical heavy metal contamination of the local environment and elevated blood lead levels in the community. Current EPA licence conditions for Zinifex Port Pirie Pty Ltd require ongoing stepwise reductions in ambient average lead in air levels, as measured at several sites in the township, over the three-year period of the current licence. This requirement recognises the significant historical impact of Zinifex’s operations on environmental
2 “Criteria air pollutants” is a term in common use amongst air quality area scientists. It refers to pollutants that can be used to give a general indication of air quality as they arise from multiple sources and so it is not necessarily limited to a given set of pollutants. The term is not used in the Ambient Air NEPM but is used in the Air Toxics NEPM to refer to the Ambient Air NEPM pollutants. The criteria air pollutants referred to in this document are those in the ambient Air NEPM of carbon monoxide, nitrogen dioxide, photochemical smog as ozone, sulfur dioxide, lead, particles as PM10.
Environment Protection Authority Annual Report 2006−07
22
lead levels in and around the township and the need for ongoing reductions in airborne lead emissions. Recent results of EPA air monitoring within the township indicate a downward trend in measured ambient lead in air concentrations. In late 2006−2007, the EPA negotiated a revised environment improvement program (EIP) with Zinifex with the primary aim of continuing the implementation of capital works and site procedures designed to significantly reduce fugitive lead emissions from the smelter site. The tenby10 Program that was launched in 2006, aims to reduce children’s blood lead levels in Port Pirie such that 95% of children up to the age of four years have levels below 10 μg/dl by the end of 2010. Zinifex has committed approximately $56 million towards achievement of this goal. The Executive Steering Committee of tenby10, involving the Chief Executive of the EPA, the Executive Director of the Population Health Division of the Department of Health, General Manager of Zinifex Port Pirie and the Chief Executive of the Port Pirie Regional Council, has identified and progressed key strategic actions for the project aimed at both emission and exposure reduction. The current primary EPA licence for the Zinifex site expires on 30 June 2008. Negotiations commenced in March 2007 between Zinifex and the EPA with a view to developing a 10-year licence that will address both the lead reduction strategies of tenby10 and a range of other environmental aspects over a longer term, including sulphur dioxide emission reduction and improvements to stormwater discharge quality, waste management and the storage of intermediates. OneSteel Haematite (‘red’) dust During 2006, fine particle levels (measured as PM10) exceeded 50 μg/m3 on 29 recorded occasions at Walls Street in Whyalla. This site is used by the EPA to measure the performance of OneSteel in controlling iron ore dust emissions. This is an increase of nine exceedences from the previous reporting period and may be associated with the haematite stockpiles established north of the pellet plant in mid- 2006. OneSteel have established an external stockpile area on the Iron Knob road to reduce the impact of fugitive haematite dust on Whyalla residents. OneSteel has submitted draft plans for closing and remediating the northern haematite stockpile, and cleaning and demolition of the plant made redundant by Project Magnet. The management of red dust emissions is further discussed in the regulatory activities section below. Project Magnet The proposed conversion of the pellet plant from fine haematite to magnetite slurry feed (Project Magnet) continued over the period and is expected to be complete in late 2007. The new shipping facility was commissioned in 2007. The conversion is expected to significantly reduce fine particulate levels and nuisance dust.
Environment Protection Authority Annual Report 2006−07
23
Regulatory activities Since 3 November 2005, amendments to the Broken Hill Proprietary Company’s Steel Works Indenture Act 1958 (South Australia) have replaced the EPA licence with an environmental authorisation administered by the EPA. Upon commencement of the Indenture Act, the EPA began regulating OneSteel in accordance with Schedule 3 and with the mandatory Environment Protection Policies not affected by the amendments to the indenture. An Environment Protection Order was imposed on OneSteel in May 2006 under the Environment Protection (Air Quality) Policy 1994 requiring the company to carry out a complete review of its air pollution control plant in the light of continuing equipment failure. This work was completed in late 2006. An Environment Protection Order was imposed on OneSteel in January 2007 to secure compliance with the environmental authorisation in relation to management of haematite stockpiles north of the pellet plant. After discussions with the EPA, the company agreed to accept an Environment Protection Order that imposed conditions for management of the northern haematite stockpiles to reduce the generation of fugitive dust. Adelaide Brighton Cement The EPA has continued its participation in the Adelaide Brighton Community Liaison Group meetings. Membership includes representatives from the local community, local council and Adelaide Brighton Cement (ABC). The ABC licence is due for renewal in November 2007. This will provide an opportunity to review the effectiveness of the current licence and address local community concerns with regard to the ABC site. A meeting was held in early 2007, whereby local residents were invited to provide comment on the key impacts they feel ABC have on their lives. The new EPA licence for ABC aims to address these key issues raised by the local community. The new licence will focus on the development of an environment improvement program aimed at reducing stack and fugitive particulate emissions, and developing an ambient monitoring program for particulates and a site maintenance and clean up program. A licence subcommittee has been established to enable representatives from the Adelaide Brighton Community Liaison Group to be involved in the negotiations of the new licence conditions between EPA and ABC representatives. This level of involvement by local community members in the negotiation of a new licence is a notable occurrence, as this is an innovative step forward to address the needs of the local community. Bradken Resources Pty Ltd The proposed foundry expansion by Bradken Resources is currently being assessed through the Major Developments process. The proposal sets to expand the current foundry operations from 12 500 tonnes to 32 000 tonnes of dressed product per annum. The EPA has reviewed and made comment on the Public Environmental Report (PER) prepared by Bradken Resources to address the key environmental, social and economic issues of the proposed expansion. The PER was released on 28 February 2007 and the extended public comment period closed on 30 April 2007.
Environment Protection Authority Annual Report 2006−07
24
The EPA is seeking improvements to the site’s current operations and emissions, regardless of whether or not the foundry expansion is approved. New Castalloy−North Plympton The foundry and associated metal finishing operations at Castalloy’s Mooringe Avenue site have been the subject of numerous residential complaints to the EPA over a number of years, particularly in relation to odour and noise emissions. In August 2006, Harley Davidson Incorporated entered into a business sales agreement to purchase the majority of the assets of Castalloy Manufacturing (formerly Ion Automotive), its Australian supplier of cast motorcycle wheels and hubs. New Castalloy was established as a business entity under this arrangement. The detailed 10-year EPA licence, which had originally been negotiated in 2005, was subsequently transferred unchanged to New Castalloy. This licence required significant stepwise improvements in the environmental performance of the site, including:
annual monitoring and reporting of all stack emissions odour and noise targets to be achieved development of environment improvement programs relative to waste and
stormwater management establishment of a community consultation program.
The EPA has been very encouraged by the improvements that have been achieved over the past year, particularly in relation to odour and noise reduction. Whilst some of this improvement has resulted from the cessation of car component foundry operations, infrastructure and operational changes by the company have also contributed significantly. As a result, resident complaints to the EPA have decreased markedly over this time.
Additional air quality data for South Australia is available in Appendix 6. Performance measures High ambient air quality performance measures comprise:
• indicator: air quality trends versus Air NEPM • measure: ambient air quality monitoring
Priority point source pollution emissions performance measures comprise:
• indicator: reduction of pollutant loads • measure: reduce lead and sulphur dioxide exceedences in Port Pirie, reduce PM10
exceedences in Whyalla • frequency: quarterly.
Rational for performance measures High ambient air quality In Australia, national standards to protect the Australian population from effects of carbon monoxide, ozone, nitrogen oxides, sulphur dioxide, lead and PM10 particles are embodied in the Air NEPM originally published in 1998. The Air NEPM also established a 10-year goal for achievement of these standards by 2008, to provide targets for jurisdictional management programs to improve air quality. For example, the ambient standard for PM10 is 50 μg/m3, with a goal to reduce exceedences of the standard to five per year by 2008. In Adelaide, ambient air quality is evaluated at six monitoring stations distributed as a network across the metropolitan area, and the EPA reports its results nationally to the Environment Protection and Heritage Council (EPHC), in addition to publishing annual monitoring reports in South Australia.
Environment Protection Authority Annual Report 2006−07
25
Determining real trends in air quality takes 5−10 years because of the wide variations and long-term cycles in weather conditions. Therefore, the effectiveness of air quality management programs may not be fully understood over intervals of less than a few years. However, it is also important to know the state of air quality throughout the year to gauge any health impacts, as measured against the national standards, of short-term events such as unusual weather patterns, bushfires, dust storms or any local changes in emissions of pollutants. Priority point source pollution emissions Lead and sulphur dioxide are specific emissions from the Zinifex smelter at Port Pirie, which it must control under its licence conditions. Lead has been of concern in Port Pirie for a considerable period, because of its long-term effects on the local community, especially children. The National Environment Protection Measure for Ambient Air Quality establishes a one-year standard for lead of 0.5μg/m3, set to limit the impacts that lead will have on individual people, as also measured by blood lead concentrations. In Whyalla, a primary concern is the impact on residents of PM10 particles from industrial operations, particularly associated with the steel works. In this case, the national standard for PM10 provides the best protection for the community. Trends The following air quality trends have been measured:
• Metropolitan Adelaide: carbon monoxide and nitrogen oxide levels in Adelaide CBD have decreased over time due to improvements in vehicle emissions, however there are indications that ozone concentrations are slightly higher than in the mid-1990s
• Port Augusta: where the EPA monitors PM10 particles at only one site, it appears to have improved over time and EPA monitoring has now ceased
• Port Pirie: lead levels at Port Pirie West currently show a slight decrease from 1984 levels but levels are still high. Improvements in the smelter are planned to reduce levels by 2010. For Sulphur dioxide (monitored approximately centrally in Port Pirie), short-term levels still exceed the NEPM standard
• Whyalla: particulate matter is monitored at two locations at the eastern end near the steelworks where levels continue to exceed the NEPM standard, but at the western end, levels are lower. Changes to processes at the steelworks, for example, Project Magnet are expected to improve local air quality and this should show in monitoring data over time.
Goals The following goals have been set by the EPA:
• air quality that meets the standards set out in the Air NEPM • to maintain and improve air quality in the Adelaide airshed and regional centres in
South Australia. Diffuse source of pollution Emissions from motor vehicles are the largest single source of air pollution in South Australia. Better engine technology and fuel standards will only improve air quality. In fact, use of motor vehicle transportation in South Australia continues to rise. Industrial processes are another major source of air pollution along with a range of commercial and domestic activities, such as burning wood for heat. These activities can increase the concentration of gases and particles in the air to levels that have potentially harmful effects on humans and, to a lesser extent, on the environment. The Air NEPM was introduced in July 1998 by the NEPC. The Air NEPM sets health protection standards for air pollutants to be achieved by 2008, based on hourly, four-hourly, eight-hourly, daily and/or yearly averages, depending on the pollutant and the manner in which it has an impact on human health. Air NEPM standards do not apply to locations adjacent to
Environment Protection Authority Annual Report 2006−07
26
individual sources (such as an industrial facility) where peak concentrations may be expected, but relate to the exposure of the general population in residential zones or areas. At present, the Air NEPM addresses the following air pollutants: particles less than 10 μm (PM10), carbon monoxide, lead, nitrogen dioxide, sulphur dioxide and ozone. Levels of other, larger particulates (total suspended particles) are assessed using World Health Organisation and National Health and Medical Research Council guidelines. The EPA conducts regular air quality monitoring of key air pollutants in the ambient or surrounding atmosphere at a variety of locations throughout the Adelaide airshed (Port Adelaide, Thebarton, Netley, Adelaide CBD, Osborne, Gilles Plains, Northfield, Kensington, Parkside, Gawler, Elizabeth and Christies Beach) as well as at sites in the Mount Gambier, Whyalla, Port Augusta and Port Pirie airsheds. It is also intended to monitor air quality for the Riverland and Barossa airsheds. These areas form part of a five-year mobile monitoring program commenced by the EPA in 2000 to ascertain levels of air pollutants in regional areas, as part of its implementation of the Air NEPM, and to gain a more accurate understanding of air quality issues in those regions. Achievements and key issues Emissions from motor vehicles are likely to increase significantly over the next decade as vehicle numbers increase. Emissions include particles and volatile organic compounds that arise mainly from unburnt or partially burnt fuel, and nitrogen oxides. These are pollutants in their own right, but also contribute to the production of ozone and other oxidants. While significant reductions in emissions from individual cars, trucks and buses are being achieved nationally through improved fuel quality and engine performance, if current trends continue, the EPA expects that the sheer number of vehicles will begin to offset those gains in the next 5−10 years. In some areas of the state, wood heaters are a dominant method used to heat people’s houses. The smoke from these heaters can be irritating to neighbours and can also cause wider air quality problems under still winter weather conditions, by increasing levels of fine particles (PM2.5), which are known to have adverse effects on the health of our hearts and lungs. The EPA runs the SmokeWatch Program, aimed at improving awareness of the impacts of wood heaters and assisting people to operate them more effectively, thus reducing their emissions, while at the same time saving them money by improving the efficiency with which they burn wood. From a limited study at Woodside in the Adelaide Hills, there is evidence that this program is bearing fruit, and that people are indeed operating their wood heaters more efficiently.
Future direction Review of the National Environment Protection (Ambient Air Quality) Measure The Air NEPM is currently undergoing its statutory 10-year review. As part of this process, the EPA is participating in a national review working group, the role of which is to report on the effectiveness of the current NEPM and recommend any changes to its goals, standards, structure and protocol that may be necessary to improve its performance. A discussion paper was released for public consultation in June 2007, addressing many of the structural issues identified by stakeholder groups. A further discussion paper is due for release around March 2008 that will address the relevance and appropriateness of current standards, international trends in standards, standard-setting methodologies and methods for cost-benefit analysis of possible future standards. It will also make recommendations to the EPHC on any variations that may be required to existing standards and goals.

Environment Protection Authority Annual Report 2006−07
27
South Australian air quality strategic plan During 2007, the EPA will commence development of a comprehensive strategic plan for air quality, which will embody practical targets for air quality management over the next decade or so. In addition to the existing regulatory functions of the EPA, the plan will need to address broader air quality issues facing South Australian communities, including:
• emissions from increasing volumes of traffic • how to manage emissions from other distributed sources such as wood heaters • predicted effects of climate change on air quality, such as increased frequency of dust
storms and bushfires, and potential increases in levels of ozone in urban areas.
WATER THAT MEETS AGREED ENVIRONMENTAL VALUES South Australia’s surface, ground, coastal and marine waters are critical to the state. They support important aquatic ecosystems that sustain a diverse range of plants and animals; supply drinking water for most of the state’s population; sustain much of our irrigated agriculture, manufacturing, food processing, aquaculture and wine-making industries; and provide a focus for recreational activities and tourism. The pollution and degradation of these waters compromises our ability to utilise our water resources to meet our needs. Ultimately, declining water quality may threaten the state’s future. High-impact land use, such as intensive agriculture and urban development, combined with vegetation clearance and water extraction are key factors affecting water quality in South Australia. Our waters are at risk from various forms of pollution and poor land management. Local pollution from industrial discharges and spills can introduce nutrients, pesticides and heavy metals into water bodies. Nutrients from urban and rural areas can find their way into rivers and streams as runoff, and enter water supply reservoirs where they can cause algal blooms. Faecal contamination from animals and poorly maintained septic tank systems can also cause water pollution problems. Previous and current planning decisions can add further stress to water resources, as can water extraction and other modifications to flow. The EPA works in partnership with water resource managers to protect and manage water quality across the state. In South Australia, resource managers or stakeholders in water quality management include SA Water, NRM Boards, a range of other state government agencies, local councils, industries and the community. The EPA provides leadership in water quality management by:
• developing and implementing the Environment Protection (Water Quality) Policy 2003 (Water Quality EPP) and related codes of practice
• licensing and compliance monitoring of scheduled activities • environmental compliance management, enforcement and prosecution (including
support for other agencies, such as local councils, that choose to use the EP Act’s compliance and enforcement tools)
• advising on planning policy and assessment of referred development applications • assessing aquaculture licences or lease variations under the Aquaculture Act 2001 • awareness raising and behaviour change programs to encourage adoption of eco-
efficient and/or best environmental management practices and compliance with the EP Act, the Water Quality EPP and associated codes of practice
• monitoring, assessment and research into the state of resources, functioning of aquatic ecosystems, and identification of sources and effects of pollution
• development and use of decision support tools such as water quality models to help determine the best way to deal with related problems.
Environment Protection Authority Annual Report 2006−07
28
Strategies and activities Key strategies for this goal include:
• lead the development of integrated water quality monitoring and assessment to support and evaluate South Australia’s water quality planning and management
• develop behavioural change and management tools to address water pollution • lead the development of agreed environmental values.
Performance measures Priority point source pollution emissions performance measures comprise:
• indicator: reduction of pollutant loads entering the Port River from licensed premises • measure: % pollutant reduction versus 2003 baseline via Port River Project • frequency: annual • achievement of performance measure: as at 2007, a 10% pollutant reduction has been
achieved, versus the 2003 baseline. Rational for performance measures The performance measures were chosen as interim measures, while more comprehensive measures were developed that reflect the EPA strategic plan. These measures tell us how we are managing and protecting the water quality of an intensively used region, for which a range of programs to improve and better manage water quality are being undertaken. Key point source pollution program—water that meets agreed environmental values
Penrice Soda Products Penrice has a set of environmental management strategies in place with the EPA to deal with water quality (particularly ammonia and suspended solids). The company’s solids recycling plant, commissioned in April 2001, has contributed to a significant (20-fold) reduction in suspended solid concentrations discharged into the Port River, maintaining an operating target well below the licence limit. Strategies to manage Penrice’s environmental performance include an ammonia reduction EIP with two targets met as at 31 December 2006; a research and development program; and coastal waters monitoring program with EPA audit review and independent verification. Penrice is continuing to work towards a reduction of emissions to air and water by carrying out the EIPs which have been discussed and agreed with the EPA. Implementation and maintenance of the Ammonia Reduction 2006−2010 EIP with the goal of reducing ammonia discharge to the Port River began in 2006. Penrice has met EIP set targets and is committed to achieving targets beyond the EIP goals by continuing to review best available technology economically achievable. SA Water environment improvement programs SA Water is currently committed to implementing eight EIPs in cooperation with the EPA. These EIPs aim to minimise the effects of wastewater treatment plants on the environment, consistent with the requirements under the EP Act and where applicable, the Water Quality EPP. To date, SA Water has completed 11 EIPs. Monitoring programs have been used to gauge the success of the EIPs in reducing or eliminating environmental harm. This monitoring is currently underway for the remaining programs.
Achievements and key issues In 2006, a number of branches within the EPA were merged into one Water Quality Branch. This provided an opportunity for greater collaboration, consistency and a strategic approach to managing water quality across South Australia.

Environment Protection Authority Annual Report 2006−07
29
Water quality monitoring During 2006−07, the EPA developed web-based reporting to make all water quality monitoring information publicly available. Strategic risk assessments were undertaken of endocrine disrupting chemicals to the state’s waters and of pollution discharges to Gulf St Vincent waters. The methodology developed for the Gulf St Vincent study is subsequently being adopted around the state by NRM Boards. Support was provided to the River Torrens taskforce, and literature studies were commenced to investigate monitoring of stygofauna and diatoms as indicators of water quality. Mount Lofty Ranges E2 model In 2007, the Mount Lofty Ranges Watershed Protection Office launched its computer-based catchment model, E2, which is designed for application to a range of catchment sizes. It provides output at various temporal and spatial scales. E2 can model such scenarios as changes in land use and management, modification of riparian zones, construction of on-ground works (for example, wetlands) to intercept and treat runoff, modification of flow regimes and responses to changing or variable climate. Upper Cox Creek nutrient mitigation program Initiated by SA Water and supported by the EPA and the Adelaide and Mount Lofty Ranges Natural Resources Management Board, the Upper Cox Creek Nutrient Mitigation Program addresses a long-standing issue of drinking water reservoir management. The Cox Creek catchment represents only 1% of the total area delivering source water to the Happy Valley reservoir, but contributes about 40−50% of nutrients, mainly due to agricultural (annual cropping) activities. In 2006, the partner agencies launched the Cox Creek sedimentation basin and Woodhouse Wetlands as part of this comprehensive program. To date, an investment of approximately $1.6 million has been made by the partners (and funding bodies) to combine technological solutions (sediment and nutrient trapping by a wetland system; creek bed and bank stabilisation) with on-farm and community actions. River Murray and Lower Lakes catchment risk assessment for water quality In 2006, the EPA completed the River Murray and Lower Lakes Catchment Risk Assessment for Water Quality project, which was designed to engage and provide information to a wide range of stakeholders on the sources of risk to water quality within the River Murray and Lower Lakes catchment in South Australia. In 2007, the roll out commenced of EPA projects that address priorities identified during the risk assessment. Port waterways water quality improvement plan A water quality improvement plan was developed to address water quality issues in the Port River and Barker Inlet areas. The WQIP has set long-term targets that will enable community expectations for water quality to be met. Substantial reductions in nutrient discharges have been negotiated with Penrice Soda Products, actioned through an EPA regulated environment improvement program. SA Water, the other major discharger, has previously (in 2003) addressed this issue via changes to the Bolivar Wastewater Treatment Plant, with further substantial reductions in discharges being needed, for example, via reuse of treated wastewater. Adelaide Coastal Waters Study The waters and ecosystems off Adelaide’s coast have been severely affected by industry, treated sewage and stormwater discharges. Extensive areas of seagrass have been lost (at least 5000 hectares over the last 30 years), sand movement has increased, reef systems have degraded, algal blooms are more frequent and water quality is poorer. The objective of the Adelaide Coastal Waters Study was to improve knowledge and develop tools for the sustainable management of these coastal waters by identifying the causes of ecosystem degradation, and the means to halt and reverse the damage—the draft final report was submitted to the EPA in 2007. A water quality improvement plan, consistent with that
Environment Protection Authority Annual Report 2006−07
30
prepared for the Port Waterways, is being developed to address the findings of the Adelaide Coastal Waters Study. Codes of practice Codes of practice (CoP) for Materials handling on wharves was completed and submitted for formal publication and regulatory linkage to the Environment Protection (Water Quality) Policy 2003. The draft CoPs for Industrial, retail and commercial stormwater management and Vessel and facility management: marine and inland waters reached the final draft stage, and progress was made on the CoP for Stormwater discharge to aquifers. Future directions The identification of environmental values (EVs) for water resources is a current focus and a future direction for the EPA. EVs are the intrinsic properties of a water resource that the community wishes to protect (for example, healthy aquatic ecosystems) and the beneficial uses they wish to obtain from that resource (for example, drinking supplies, irrigation and recreational use). Water quality requirements vary depending on the EVs that are identified, and they help determine what protection, management and monitoring measures are needed to address water quality for any given water resource. The EPA is developing EVs for the Adelaide and Mount Lofty Ranges region and the River Murray, with respective NRM boards. EVs are also being developed as part of the Adelaide Coastal Water Quality Improvement Plan and the aquifer storage and recovery project. Other key future directions will include a focus on:
• the coordination of water quality monitoring with other stakeholders (for example, state agencies and NRM boards)
• quality issues associated with water reuse (for example, stormwater and treated wastewater aquifer storage and recovery)
• land-based impacts on the marine environment (including the Adelaide Coastal Water Quality Improvement Plan and the Water Sensitive Urban Design projects)
• risk management (for example, modelling and assessment of risks, projects to address identified risks—particularly in the Murraylands and Mount Lofty Ranges watershed, implementation of codes of practice and support for regulatory approaches including development assessment and licensing).
COMMUNITIES PROTECTED FROM UNACCEPTABLE NOISE
Virtually all human activity generates noise. People’s response to noise is as varied as the activities that produce it. Approximately 30% of all calls to the EPA Help Desk are about noise. Continued exposure to unacceptable noise can have adverse effects on community health. The EPA has established a reputation as the lead government authority on environmental noise. Strategies and activities Key strategies for this goal include:
• developing a flexible and adaptive regulatory framework to manage noise producing activities
• developing relationships with other authorities that manage noise. Achievements and key issues Environment Protection (Noise) Policy The EPA has prepared a Draft Environment Protection (Noise) Policy (draft Noise EPP) to replace the two existing noise policies, the Environment Protection (Industrial Noise) Policy 1994 and the Environment Protection (Machine Noise) Policy 1994. The draft Noise EPP has been subject to extensive consultation with the public, industry other key stakeholders and was endorsed by the Board.
Environment Protection Authority Annual Report 2006−07
31
The draft Noise EPP makes reference to guidance documents for the operation of audible bird-scaring devices and wind farms. During 2007, the Board of the EPA endorsed the guidelines relating to bird-scaring devices. The wind farm guidelines, endorsed by the Board in 2003, have recently been reviewed. It is expected that the Noise EPP will be finalised and come into operation before the end of 2007. Wind farm noise The Wind farms: Environmental noise guidelines was published by the EPA in February 2003 in response to the rapidly emerging wind farm industry in South Australia. Given the stringency of the guidelines, it was intended a review be undertaken following the emergence and establishment of wind farms in the state and the undertaking of research in key areas. In 2006 a two-stage consultation process was conducted after extensive familiarisation with and research into the industry and completion of EPA research. The consultation process included the provision of discussion papers and a summary of the EPA research when seeking submissions from stakeholders. A draft amended wind farm guideline has been prepared as a result of the review. Rail noise Rail noise includes the rumble of locomotives, the general rolling noise of wagons, and flanging, wheel squeal and wheel howl. Idling trains, shunting, signal crossings and warning signals all make noise, and cause problems where residential development is close to the rail corridor. The most annoying noise—squeal from wheels against rails, typically on curves—is most noticeable when freight trains pass through the Adelaide Hills. Extensive research into squeal has suggested a variety of causes, and an element of randomness has made it difficult to identify consistent and, therefore, predictable causes. A wheel squeal monitoring system has now been operating in the Adelaide Hills since February 2006. It has determined rail wheel squeal trends and can identify individual wheel sets that squeal. For example, it has determined how frequently any given wheel produces wheel squeal. This allows rail operators to target their maintenance programs specifically for wheels that have been identified as causing repeat events of wheel squeal. Rail owners and individual rolling stock operators using the Adelaide Hills rail lines have been required to submit EIPs to reduce their level and incidence of rail wheel squeal. Prevention and control of noise The EPA continues to provide strategic advice and comment to planning authorities and other government agencies regarding the control of noise emissions from developments and major projects with the potential to cause unacceptable noise. The EPA also prevents and controls noise by placing conditions on environmental authorisations held by industries. Community and local government support During the course of the last year, the EPA has expanded its training program for operational police officers to include all the South Australian Police service areas. With recent changes to the EP Act, which include the introduction of a strict liability offence for causing an environmental nuisance, it is expected that this training program will continue. One permanent EPO has been prepared for the police to manage persistent offenders who cause environmental harm by playing loud music generally late at night, adversely affecting the amenity value of the area and interfering unreasonably with enjoyment of the area by people living nearby. The police have indicated that offending generally stops following the
Environment Protection Authority Annual Report 2006−07
32
receipt of a permanent order. However, the introduction of the strict liability offence for causing an environmental nuisance, which includes an expiation fee ($300), has provided the police with an extremely useful legislative tool that appears to be reducing the need to issue permanent orders. Future directions If it is approved by the minister, the Cabinet and the governor, one of the main goals for the EPA regarding noise will be the introduction of the new Noise EPP. This will include educating stakeholders about the Noise EPP and amending all EPA guidelines and information sheets that make reference to noise policies.
SUSTAINABLE LAND USE ‘Attaining Sustainability’ is a key objective of South Australia’s Strategic Plan 2007 and provides a framework and targets for all of South Australia to live and work towards. This principle, that guides the objectives described in the South Australia’s Waste Strategy 2005−10 (foster sustainable behaviour, less waste, effective systems, effective policy instruments and successful cooperation) are in line with the principles of ecologically sustainable development, which is a key Object of the EP Act. The EPA has a number of strategies that contribute to the achievement of this goal, namely:
• promoting sustainable waste and resource management practices • adoption of eco-efficient practices • development assessment • managing site contamination.
Promoting sustainable waste and resource management practices Strategies and activities Key strategies and activities for this goal include:
• promoting the development of an integrated land-use planning system for South Australia
• Waste to Resources EPP • waste and resource efficiency • landfill guidelines.
Performance Measures The following performance measures are used for achieving reduced waste to landfill:
• indicator: reduction in landfill weight by 25% in 10 years (SASP target) • measure: % change in landfill tonnes per Gross State Product • frequency: three monthly.
Key point source pollution programs—promoting the adoption of eco-efficient practices
Garden Island During a compulsory Environment, Resources and Development Court (ERD Court) conference in August 2001, agreement was reached between the previous operator, Western Region Waste Management Authority (Western), the landowner Land Management Corporation (LMC) and the EPA to enter into an environmental performance agreement for closure, rehabilitation and post-closure activities of the waste depot on Garden Island. The closure plan for Garden Island was developed and accepted in principle by all parties in 2002. The landfill capping implementation plan was then drafted and accepted by all parties.
Environment Protection Authority Annual Report 2006−07
33
The environment performance agreement—reflecting milestones, responsibilities and timeframes as negotiated in both the closure and capping implementation plans—as well as financial commitments by Western and LMC have been finalised. The first milestone in the agreement for partial capping of the site was met by April 2007 with greater than the minimum area completed. That area is due for revegetation following the 2007 winter rains. A memorandum of understanding is currently being drafted by Western with a landfill gas contractor for extraction and investigation of the feasibility for producing green energy from the site. The second milestone for capping in the agreement is expected to be completed ahead of schedule by the end of 2007.
Activities Waste to Resources EPP The EPA continues to work with Zero Waste SA in development of the Environment Protection (Waste to Resources) Policy. The Government approved the preparation of a draft Waste to Resources EPP for public consultation in late 2005−06. The Waste to Resources EPP will be a fundamental tool for industry and government to manage waste disposal and waste reduction. The proposed Waste to Resources EPP will enable the EPA to more effectively regulate the waste industry to achieve compliance, and targets and outcomes in the South Australia’s Waste Strategy 2005-2010, by providing appropriate legislative support for the strategy, including through:
• requiring waste from metropolitan Adelaide (subject to some exceptions) to be processed through a materials recovery facility prior to any disposal to landfill, with diversion performance targets for these materials recovery facilities
• banning certain wastes from being disposed of in landfills, either across the state or within certain parts of it
• creating several new offences and using definitions to effectively deal with illegal dumping of waste
• allowing waste management codes of practice that may be developed with industry sectors to be recognised and supported
• more clearly ensuring the safe management, handling and disposal of various waste types, especially listed and hazardous wastes.
Waste and resource efficiency The EPA aims to provide a consistent approach to activities such as resource recovery, managing recycling facilities, transfer stations and compost sites through the application of standards defined in guidelines and through on-going liaison with the Waste Management Association of Australia. The EPA is also developing position papers on the practical and regulatory definition of waste and appropriate waste processing into bona fide recycled products. Achievements and key issues Landfill guidelines The EPA has given priority to managing the environmental risks from the generation of leachate at landfills and compost facilities (which poses a risk to ground and surface waters), controlling landfill gas emissions (which contain greenhouse gases—carbon dioxide and methane, and trace volatile organic compounds) and diversion of clean stormwater away from waste. The management of amenity is also a key issue and the EPA requires licensees to address and mitigate the risk of adverse impact on amenity caused by dust, odour, litter and vermin. In this regard, the EPA publishes guidelines that describe the expected performance outcomes and suggested measures by which licensees can achieve responsible and acceptable

Environment Protection Authority Annual Report 2006−07
34
environmental management of their activities. In January 2007, the EPA released the revised guidelines for Environmental management of landfill facilities and has recently released the Draft guidelines for composting works in South Australia for public consultation. The landfill guidelines describe a minimum standard and expected outcomes. The guidelines allow for alternatives, provided they can be shown to meet the required outcomes. Other guidelines are being developed, including guidelines for compost facilities, material recycling facilities and solid waste assessment and disposal. Licensees are currently in the process of either implementing or planning for implementation of upgrades to facilities where required and planning for closure of unsustainable waste management facilities, particularly landfill. Currently, all five large metropolitan landfills that receive 80% of South Australia’s waste are compliant with the standards specified in the landfill guidelines. Future direction During 2007−08, the EPA will focus on establishing agreed acceptable standards for the processing and management of waste to address the emerging issues of increased diversion, and processes and stockpiling for reuse of waste. The EPA will also aim to clarify its policy position as to what it regards as waste, particularly as this relates to processes recovering waste into beneficial products. In addition, it is planned to review waste depot licences for large operations are reviewed to ensure consistency and incorporation of standards in accordance with the landfill guidelines. Key issues at the sites will be assessed and managed using a project management and EPA’s risk management approach.
Adoption of eco-efficient practices Adoption of eco-efficient practices by business is a key strategy in the pursuit of ecologically sustainable development. In facing international competition, business needs to develop and retain a competitive edge through efficiencies in use of energy, water and raw materials, a factor identified in South Australia’s Strategic Plan <www.saplan.org.au/index.php> that specifies attaining sustainability as one of its six goals along with growing prosperity and fostering creativity and innovation. Eco-efficiency is also the basis for the ‘no-regrets’ approach widely promoted by governments to reduce greenhouse gas emissions, one of the major issues facing South Australia according to the State of the Environment Report for South Australia 2003 <www.environment.sa.gov.au/soe2003>. Strategies Key strategies for this goal include:
• contributing to the development and implementation of industry–related programs in a climate change response strategy for South Australia
• providing education/training programs in eco-efficiency for businesses • providing technical and financial assistance to individual industries or their
associations in energy, water and resource efficiency, and waste minimisation. Activities Activities for this goal involve:
• South Australian wine industry • Motor Trade Association of South Australia • Electronics Industry Association • small business eco-efficiency training program • Greening the Supply Chain Program in partnership with
South Australian wine industry Motor Trade Association of South Australia

Environment Protection Authority Annual Report 2006−07
35
Electronics Industry Association • Used Packaging NEPM • Product Stewardship NEPM—national policy.
Achievements and key issues Eco-efficiency The emphasis in 2006−07 was on the introduction of Ecomapping as a visual auditing tool in the development and implementation of environmental management systems. Regional seminars on eco-efficiency and climate change were conducted in the Mid North and Riverland in conjunction with regional development boards. Officers of the Department of Trade and Economic Development, Zero Waste SA, Adelaide and Mount Lofty Ranges Natural Resource Management Board, SA Water and Department of Premier and Cabinet (Sustainability and Workforce Planning Division) initiated an agency forum (the Sustainable Business Alliance) to coordinate development and delivery of business-centred programs on lean manufacturing and eco-efficiency principles. EPA contributed funding and technical advice to Kangaroo Island Development Board for a Greening the Supply Chain project involving at least 18 local businesses aimed at environmental performance improvement, to enhance the ‘green’ image of the food and tourism industries on the island. The Electronics Industry Association used EPA funding to develop and pilot a training course to help electrical and electronic sector companies become compliant with the International Standard ISO 14000 environmental management. Continued access to the European market is dependent on demonstration of such compliance and adherence to the European Union Directive on Restriction of Hazardous Substances in electrical and electronic appliances. Future direction The focus on obtaining leverage by working cooperatively with other organisations within government and the industry sector will continue in 2007−08 as a feature of EPA eco-efficiency programs. Small and medium enterprises (SMEs), rather than EPA licence-holders, have previously been the focus of EPA programs. It has become apparent that licensees still need, and can benefit from, training and detailed advice in eco-efficient practices. By coordinating with other agencies that focus on SMEs, EPA will include licensees in its prospective audience for eco-efficiency training. EPA will also participate in a new multi-agency eco-efficiency program known as Adelaide Sustainable 1000, the pilot stage of which will be managed by Salisbury City Council in 2007−08.
Development assessment The EPA coordinates the assessment of development applications of environmental significance referred by local government or the Development Assessment Commission. Since the referral process began in mid-1995, the EPA has assessed nearly 6000 development applications, an average of around 600 applications per year. This year, 603 applications were assessed (Table 1). The EPA can influence and, in certain cases, direct that proposals are refused or certain conditions are attached to ensure that the environment and community are protected, and to encourage sustainable development3.
3 The EPA has directive power in relation to Schedule 22 referrals, activities that require a licence under the EP Act and for
certain activities within the River Murray Water Protection Area.

Environment Protection Authority Annual Report 2006−07
36
Table 1 Referred development applications completed
2005−06 2006−07 Development application type Description
No. On time (%) No. On time
(%)
Schedule 8 Part 11
Schedule 22: Activities of major environmental significance
175 97 268 98
Schedule 8 Part 10(b)
Schedule 21: Activities of environmental significance
147 93 146 96
Schedule 8 Part 10(a)
‘Non-complying’ development in a water protection area
89 90 73 99
Schedule 8 Part 9
Wind farms 3 100 0 na
Reg 29 Land Division 74 86 81 98
Section 49 Crown development by state agencies
44 98 35 100
Total 532 93 603 98
Assessment of major developments and projects The EPA also assesses proposals declared by the minister with responsibility for development and planning to be of major environmental, social or economic importance. These major developments and projects must be referred to the EPA if they include an activity of environmental significance as prescribed in Schedule 1 of the EP Act. Documentation relating to the following major projects was referred to the EPA during 2006−07 for assessment:
• IWS Dublin Balefill Contaminated Soil and Liquid Treatment Plant (amendments) • Mannum Marina • Wakefield Waters • Narnu Waterways • Northern Expressway • Bradken Foundry • Buckland Park Township • Olympic Dam Mine Expansion • Ceduna Keys Marina • Cape Jaffa Anchorage Marina.
The development referral schedules have been reviewed with 13 activities identified and endorsed for removal from Schedule 21. Planning SA has supported the recommendation of the EPA, and the development regulations were amended accordingly, in November. Planners’ guidelines have been developed and have been made available on the EPA website to assist planners undertaking development assessment roles. EPA has embarked on a further review of development referral schedules with potential amendments likely to be implemented in 2007−08. Planning policy EPA regularly reviews proposed amendments to council development plans by assessing Statements of Intent and Plan Amendment Reports to encourage both councils and the Minister for Urban Development and Planning to adopt development assessment criteria that result in protection of the environment and sustainable development. During the year, the EPA assessed 41 local council Statements of Intent, six Ministerial Plan Amendment Reports (PARs), 49 local council PARs and five local council Section 30 reviews.
Environment Protection Authority Annual Report 2006−07
37
Aquaculture The Aquaculture Act, which became operational in July 2002, has Primary Industries and Resources South Australia (PIRSA) responsible for its administration. However, the Aquaculture Act stipulates statutory requirements that must be met by the EPA, such as assessment and provision of comments on aquaculture licence applications, variations of licence conditions and lease conversions. The EPA also addresses and responds to the statutory requirements of the Development Act 1993 and to general aquaculture issues that may arise. The EPA is represented on the Aquaculture Advisory Committee, which advises the minister responsible for administering the Aquaculture Act on matters pertaining to aquaculture.
Site contamination This section includes waste to resources, industry sustainability programs (promoting the adoption of eco-efficient practices) and site contamination. Site contamination, the historical pollution of land and water (including groundwater), is an issue of major importance in South Australia. Site contamination has the potential to cause harm to humans and the environment, and must be managed in a way that ensures human health and the environment are protected. Strategies Key strategies for this goal include developing a legislative and policy framework to manage site contamination. Activities Activities achieved for this goal are:
• site contamination draft legislation developed and tabled in parliament • draft site contamination regulations prepared and ready for consultation • project plan developed for implementation of site contamination legislation, once
approved by parliament • site contamination presence on the EPA website • guidelines on how to select an environmental consultant and use of environmental
auditors have been published • new web pages for site contamination.
Achievements and key issues A draft Bill for the management of site contamination was prepared, consulted on, amended as a result of comments received during the consultation process and tabled in parliament in April 2007. The Bill is scheduled for debate in the Upper House in 2007. A project plan has been prepared for the implementation of the new legislation. This plan includes the development of a series of guidelines and information sheets to assist stakeholders to work within the requirements of the new legislation, changes to the Section 7 process under the Land and Business (Sales and Conveyancing) Act 1993 and the development of internal IT systems to manage the information that will result from the new legislation. During 2007, the EPA also published a draft of information on its website, aimed at educating stakeholders in the administrative arrangements that are currently in place for the management of site contamination. The EPA will also prepare policy for the remediation (management) of contaminated groundwater.
Environment Protection Authority Annual Report 2006−07
38
Site contamination review To ensure a nationally consistent approach to the assessment of site contamination, the Assessment of Site Contamination NEPM was made by the NEPC on 10 December 1999 and gazetted on 22 December 1999. This NEPM made provision for a review after five years of operation. In December 2004, the NEPC approved the commencement of the review. This review has established that the NEPM has delivered benefits to its users. However, there have been significant advances in technology and knowledge in relation to soil and water contamination since 1999. In order to address these findings, the review report contains 27 recommendations of varying priority and resource requirements. On 2 June 2007, the NEPC agreed to initiate a process to vary the Assessment of Site Contamination NEPM based on these recommendations. The proposed variation aims to ensure that the NEPM remains the premier document for the assessment of site contamination in Australia by drawing on the latest methodologies for assessing human and ecological risk from contaminated sites, and updating guidance on site assessment methods in line with technological changes in Australia and overseas. Future direction During 2007−08, the EPA will focus very strongly on establishing the systems and processes in place to allow it to properly implement the new site contamination legislation. This will include the establishment of a statutory audit system. In the interim period, site contamination issues will be administered in accordance with administrative arrangements approved by the EPA Board.
Environment Protection Authority Annual Report 2006−07
39
CORPORATE PROGRAMS
ENHANCING ORGANISATIONAL CAPABILITY, ACCOUNTABILITY AND RESPONSIVENESS
Organisational improvement program The Organisational Improvement Project (OIP), formerly the Culture Change and Process Improvement Project (CCPIP), was initiated by the EPA Board and Executive in August 2005 in response to a number of key ‘drivers for change’. The EPA’s strategic plan provided the mandate for this program and was the means by which the cross-goal strategy ‘Enhancing organisational capability, accountability and responsiveness’ was delivered. Initially the program had four major projects: a review of the organisational structure, improved performance measurement and reporting, systems and process improvement and staff development and/or culture change. Following the transition to the new organisational structure in July 2006, a review of the organisational change program was undertaken. As a result of this review, projects within the renamed OIP were grouped into two categories: corporate and operational. The program now consists of five corporate-level projects and five operational-level projects. Some of these projects are reported on elsewhere in this report, and where this occurs a reference to the appropriate section is provided. Corporate projects Risk management The Auditor-General’s 2005−06 interim audit of the EPA acknowledged that although the EPA’s strategic and business planning processes used a risk-based approach, there was little formal documentation to substantiate and systematise the work that had been undertaken. The report concluded ‘…that there is a need to review the EPA’s approach to risk management, including ensuring that risk management is built into the corporate reporting systems that currently exist.4’ Key areas, including risk management policy, implementation plan and management training, were noted for further improvement to ensure EPA receives maximum benefit from risk management. During 2006−07 a project officer was appointed to develop and manage the implementation of the EPA Risk Management Framework Project. The outcomes of the project are to establish clearly defined risk management processes that will underpin the continued evolution of a risk-based culture in the EPA. During the last 12 months, the EPA Risk Management Policy was drafted, training for managers in risk management and assessment (in line with the Australian Standard AS/NZS 4320:2004) was undertaken (to continue in 2007−08) and a risk register developed. Communications and web development Refer to the section ‘Behaviour change programs’.
4 Environment Protection Authority 2005−06 Audit Findings Appendix, SA Auditor-General’s Department, 21 June 2006

Environment Protection Authority Annual Report 2006−07
40
Key performance indicators development In order to effectively measure progress against the outcomes identified in the EPA’s strategic plan, the EPA initiated a review of its key performance indicators (KPIs) in late 2006. Using the Program Logic Model as the means of systematically identifying high level KPIs and other performance measures that contribute to the high level KPIs, the EPA has undertaken a number of training sessions to familiarise managers and directors with the methodology. To date, KPIs have been identified for three key business areas: radiation protection, water quality and licensee compliance. These will be implemented at the beginning of the 2007−08 financial year. Work to finalise the remaining KPIs will continue over the next 12−18 months. Human resources (HR) During the latter part of 2006−07, an HR consultant was utilised to assist with the completion of a skills inventory. Consequently, EPA staff completed an online skills inventory survey during June 2007. An interface will be developed shortly to allow appropriate access to information about employee skills. Skills information will assist us in meeting our strategic and operational outcomes and workforce planning, and can be used to identify training needs. Further projects that are underway in 2007−08 to support the Organisational Improvement Program include providing recommendations for approaches for workforce planning and knowledge management, development of the strategic human resources and development plan and a review of our performance and development review process and tools. Review of EPA customer service In June 2006, an independent review of the EPA’s centralised customer service function was completed. This review complemented the 2005 Customer Satisfaction Study. The review made a number of recommendations. Two key recommendations were:
• The EPA develops a customer service charter that reflects the agency’s commitment to excellence in customer service. The draft EPA service charter—a guide for the community and business outlines:
what the EPA does and does not do the EPA’s values and service principles service standards the EPA aspires to standards of behaviour EPA staff adhere to when undertaking regulatory
functions how to contact the EPA, and client responsibilities when dealing with the EPA how to provide feedback and resolve complaints.
The draft charter was developed during the first half of 2007 and is expected to be finalised and made available on the EPA website during the next financial year.
• Review of the EPA’s customer service desk An outsourced call centre is the first point of contact for all customers using the EPA’s general number. The call centre provides a 24-hour, seven days a week service. Any unresolved information requests and complaints are forwarded to the EPA’s customer service desk. During 2006−07, two additional dedicated customer service officers were appointed bringing the total number to three. The newly-appointed officers focus on finalising information requests and complaints about non-licensed premises.
A client service strategy will be developed in 2007−08 to address remaining recommendations in an integrated way.
Environment Protection Authority Annual Report 2006−07
41
Operational projects Authorised officer training The intent of the proposed training program for authorised officers is to improve the consistency, timeliness and quality of advice given and actions undertaken by EPA authorised officers in the course of their duties. To this end, the training program will be aligned to EPA priorities, and delivered as practical, competency based modules. Following a comprehensive survey of EPA managers and staff, and a scoping study, an options paper has been developed. Authorised officer eBook (authorised officers’ manual) The authorised officer eBook was made available, in electronic form, to all EPA staff in December 2006. The eBook covers such topics as the legal framework that authorised officers operate within, what constitutes ethical behavior, guidance for staff responding to development application referrals and managing complaints. The eBook provides readily accessible information and will help authorised officers to provide a consistent approach to managing licensed premises. Development assessment improvement project During 2005−06, the EPA finalised a review of its role and processes in the development application referral system. The review found ways to improve performance, in both quality and timeliness of delivery. The Board endorsed the findings of the review and its recommendations in March 2005. A report on the review with recommendations for consideration by the EPA Board, minister and Cabinet is due in the first half of 2007−08. In 2006−07, the following improvements have been implemented:
• the General Environmental Information System (GENI) development assessment module became operative throughout the EPA in March 2007. The new GENI system provides a substantial improvement in the EPA's ability to track the progress of internal development assessment processes, streamline requests for further information and enable a wide range of automatic reports to be prepared
• 13 activities were removed from Schedule 21 of the Development Regulations 1993 in line with recommendations approved by the EPA Board
• interim Environmental Assessment Guides for Planners were made available for local councils. These guides were prepared as a substitute for the advice previously provided by the EPA on certain types of development applications
• the commencement of a review of the remaining development application referral categories in Schedule 21 of the Development Regulations 1993 in association began with the LGA, DTED, DWLBC, DPC and Planning SA
• as a means of providing for local councils to contribute to the review, a special online questionnaire was prepared by the EPA and responses invited from councils for a four week period during June 2007.
Licence administration review Review of the EPA licensing function provides the opportunity to ensure that the administrative processes are aligned to the strategic direction adopted by the government (for example, reduction in ‘red-tape’) and the EPA (for example, a risk-based, transparent process). The intent of the review is to improve the efficiency and effectiveness of the EPA licensing system. Stage 1 of the project consists of scoping the project to clearly identify the parameters and desired outcomes, the appointment of a contractor to assist with the review, the review of the existing licensing process and identifying opportunities for improvement. It will be completed by December 2007. Project scoping is complete and a consultant to assist with the review will be appointed in the near future.
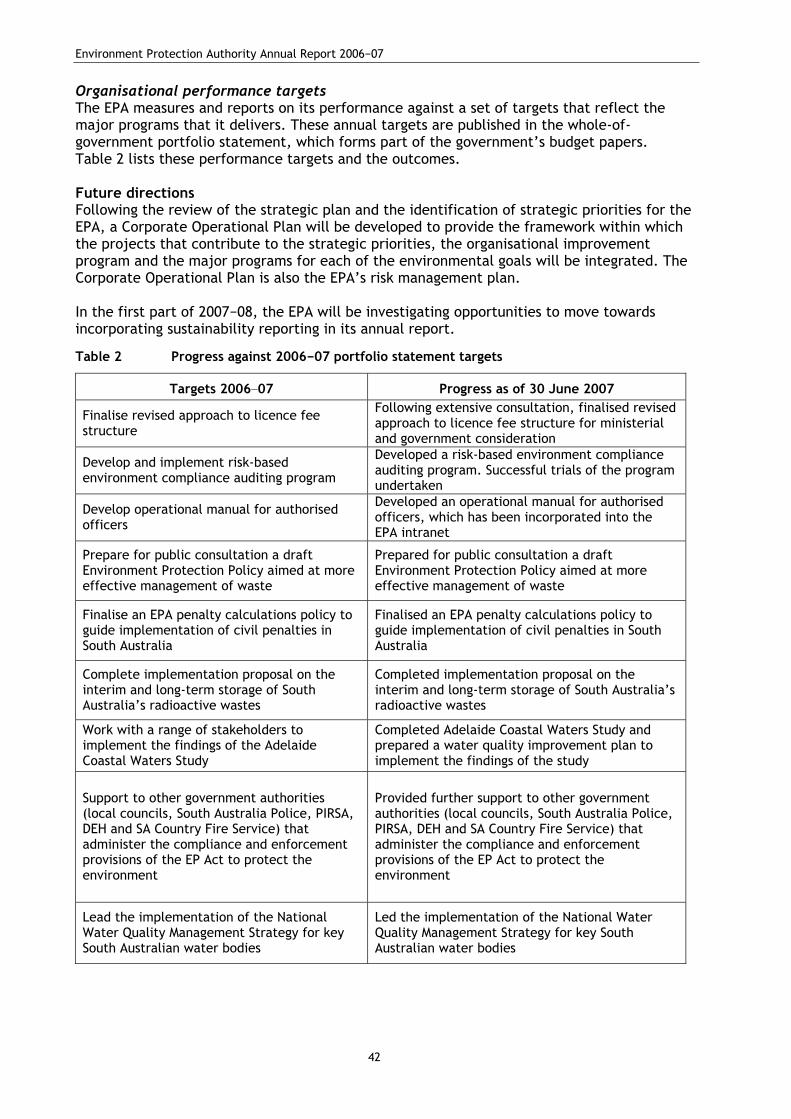
Environment Protection Authority Annual Report 2006−07
42
Organisational performance targets The EPA measures and reports on its performance against a set of targets that reflect the major programs that it delivers. These annual targets are published in the whole-of-government portfolio statement, which forms part of the government’s budget papers. Table 2 lists these performance targets and the outcomes. Future directions Following the review of the strategic plan and the identification of strategic priorities for the EPA, a Corporate Operational Plan will be developed to provide the framework within which the projects that contribute to the strategic priorities, the organisational improvement program and the major programs for each of the environmental goals will be integrated. The Corporate Operational Plan is also the EPA’s risk management plan. In the first part of 2007−08, the EPA will be investigating opportunities to move towards incorporating sustainability reporting in its annual report.
Table 2 Progress against 2006−07 portfolio statement targets
Targets 2006−07 Progress as of 30 June 2007
Finalise revised approach to licence fee structure
Following extensive consultation, finalised revised approach to licence fee structure for ministerial and government consideration
Develop and implement risk-based environment compliance auditing program
Developed a risk-based environment compliance auditing program. Successful trials of the program undertaken
Develop operational manual for authorised officers
Developed an operational manual for authorised officers, which has been incorporated into the EPA intranet
Prepare for public consultation a draft Environment Protection Policy aimed at more effective management of waste
Prepared for public consultation a draft Environment Protection Policy aimed at more effective management of waste
Finalise an EPA penalty calculations policy to guide implementation of civil penalties in South Australia
Finalised an EPA penalty calculations policy to guide implementation of civil penalties in South Australia
Complete implementation proposal on the interim and long-term storage of South Australia’s radioactive wastes
Completed implementation proposal on the interim and long-term storage of South Australia’s radioactive wastes
Work with a range of stakeholders to implement the findings of the Adelaide Coastal Waters Study
Completed Adelaide Coastal Waters Study and prepared a water quality improvement plan to implement the findings of the study
Support to other government authorities (local councils, South Australia Police, PIRSA, DEH and SA Country Fire Service) that administer the compliance and enforcement provisions of the EP Act to protect the environment
Provided further support to other government authorities (local councils, South Australia Police, PIRSA, DEH and SA Country Fire Service) that administer the compliance and enforcement provisions of the EP Act to protect the environment
Lead the implementation of the National Water Quality Management Strategy for key South Australian water bodies
Led the implementation of the National Water Quality Management Strategy for key South Australian water bodies
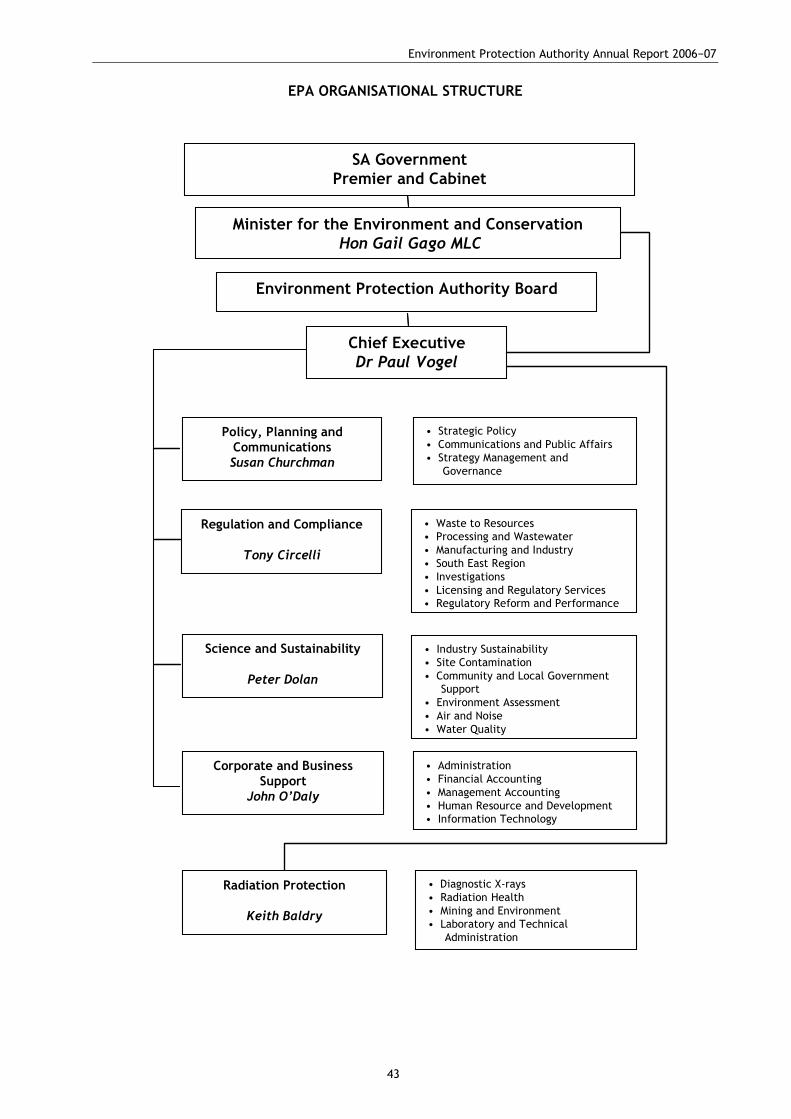
Environment Protection Authority Annual Report 2006−07
43
EPA ORGANISATIONAL STRUCTURE
• Strategic Policy• Communications and Public Affairs• Strategy Management and
Governance
• Waste to Resources• Processing and Wastewater• Manufacturing and Industry• South East Region• Investigations• Licensing and Regulatory Services• Regulatory Reform and Performance
• Industry Sustainability• Site Contamination• Community and Local Government
Support• Environment Assessment• Air and Noise• Water Quality
• Administration• Financial Accounting• Management Accounting• Human Resource and Development• Information Technology
• Diagnostic X-rays• Radiation Health• Mining and Environment• Laboratory and Technical
Administration
Minister for the Environment and ConservationHon Gail Gago MLC
SA GovernmentPremier and Cabinet
Chief ExecutiveDr Paul Vogel
Environment Protection Authority Board
Policy, Planning and CommunicationsSusan Churchman
Regulation and Compliance
Tony Circelli
Radiation Protection
Keith Baldry
Science and Sustainability
Peter Dolan
Corporate and BusinessSupport
John O’Daly

Environment Protection Authority Annual Report 2006−07
45
CONTRIBUTING TO A MORE SUSTAINABLE SOUTH AUSTRALIA The principles of ecological sustainability development are enshrined as objects under the EP Act, and the EPA is required to promote these principles in its decision making and program and service delivery. In this way, the EPA uses its powers and functions to manage and influence human behaviour so as to achieve more sustainable practices.
Participate in development of the state’s greenhouse strategy Tackling Climate Change, South Australia’s Greenhouse Strategy 2007−2020 was released on 31 May 2007, together with a related report by Professor Stephen Schneider. The government’s action plan attached to the strategy incorporated most of the recommendations by Professor Schneider, the state’s ninth Thinker–in-Residence and a globally recognised expert in dealing with climate change. EPA and DTED co-chaired the working group of industry representatives convened to develop the industry-related chapter of the strategy. The strategy recommends initially continuing a voluntary approach to pursue ‘no regrets’ measures to reduce greenhouse gas emissions, supported by government programs aimed at improving eco-efficiency in industry. It does not exclude additional measures over time, such as mandated industry programs to implement measures with short payback periods. These will still result in financial benefits to industry, and improve competitiveness. EPA is a member of advisory committees that assist development of national motor vehicle emission standards and fuel composition legislation, and will also influence actions to address transport-related greenhouse gas emissions in this state and nationally.
Develop behaviour change programs WaterCare WaterCare has been a successful whole-of-government initiative to raise awareness of water issues and promote responsible water use and management of South Australia’s water resources. During 2006−07, a number of other water initiatives were developed across government to communicate specific messages and promote responsible water use during drought conditions in South Australia. As a result, activity on the WaterCare program was reduced significantly. The program will be reviewed during 2007−08 to determine its future direction.
DEVELOPING STRATEGIC PARTNERSHIPS The EPA endeavours to work with all sectors of society and all levels of government to support and encourage involvement in environment and radiation protection. Effective protection of human health and the environment requires an informed, supportive and engaged community, industry, business sector and government. This is being achieved through improved consultation and communications activities, the delivery of educational and behavioural change programs, improving access to our services and working in partnerships. The engagement strategy, EPA—Engaging its Communities was developed in 2005−06 to help develop mutually beneficial relationships with key stakeholders and the community, and to communicate and share knowledge.

Environment Protection Authority Annual Report 2006−07
46
Communication plans and support for high-priority projects The Engagement Strategy sets out a framework to support the EPA in delivering its Strategic Plan to assist the organisation in developing strong relationships with all stakeholders, both internally and externally. High-priority projects now have communication plans that outline the roles and responsibilities of project participants in the approval and dissemination of information about key project processes, the milestones and the review process. The communication plan also ensures internal and external stakeholders are kept informed and that the information provided is relevant, accurate and consistent.
Community engagement projects SmokeWatch In 2006, EPA developed a behaviour change pilot program in partnership with the Adelaide Hills Council that encouraged households to engage in efficient wood heater practices to minimise wood smoke. As part of this project, the EPA monitored the level of particulates in the Adelaide Hills with specialised equipment set up at Woodside Primary School, which was the first time any air monitoring had been done in this area by the EPA. Results showed that while no pollutants monitored exceeded national standards, wood smoke was detected during cold and still nights. In June 2007, part two of the pilot program was implemented, concentrating on the Woodside catchment area. Residents are encouraged to take up a ‘SmokeWatch Challenge’, in which they commit to undertaking four key efficient wood-heater practices throughout winter in order to reduce wood smoke pollution, with the chance to win a variety of incentives. A strong emphasis has been placed on developing the support of local businesses as well as encouraging teachers and students at Woodside Primary School to promote the SmokeWatch message. Monitoring is being undertaken again, which will compare wood smoke pollution levels with those detected during the monitoring of 2006. EPA TravelSmart Workplace Plan EPA’s TravelSmart Workplace Plan was launched in April 2007, and is an initiative that encourages and supports EPA employees to use sustainable transport (cycling, walking, public transport and car-pooling) when commuting and undertaking business travel. The plan was developed in partnership with the Department for Transport, Energy and Infrastructure, and will enable the EPA to take a leadership role in advocating and acting in accordance with the South Australian Government’s sustainability principles and practices. During the first year of the three-year plan, a number of initiatives will be introduced and developed including a walking program, business travel competition, the sale of discounted public transport tickets (as part of Adelaide Metro’s Workplace Deal), a Bicycle User Group (or BUG) and a sustainable transport induction pack for new employees. AirWatch program AirWatch is a significant community education program that has been delivered in both primary and secondary schools by the EPA since 2001. The program offers a valuable way for the EPA to engage the school community in air quality issues and work towards achieving behaviour change that supports clean air. Through ‘hands-on’ and inquiry-based activities, students learn about air pollution, its causes and solutions, and also have the opportunity to undertake their own air monitoring by borrowing EPA equipment.

Environment Protection Authority Annual Report 2006−07
47
A review of the AirWatch program was initiated in early 2007 and seeks to develop strategies to improve the current program, to ensure that it remains attractive and relevant to schools, as well as informing the development of a SA Air Quality Management Strategy. As part of the review, teachers currently and/or previously involved in AirWatch are being consulted as are various other educators of environmental programs both in South Australia and interstate. Frog Census The EPA has been conducting the Frog Census for the past 13 years. In 2006, this highly successful South Australian community engagement program had 337 volunteer groups taking part across the state during the week of 24−31 September, when frogs were expected to be most vocal. The majority of recording sites were located in Adelaide, Mount Lofty Ranges, Murray−Darling Basin and the South East. Frogs are bio-indicators of the health of waterways and pollution effects. The data collected by volunteers and assessed by the EPA is used to inform the public, stakeholders, local government and catchment water management boards about water quality. Data from the 2006 survey has been entered into the EPA Environmental Data Management System and feedback will be provided to participants.
Engagement and partnerships The engagement strategy represents a disciplined effort across the EPA to produce a vision, outcomes and actions for communication and engagement over a five–year period. The strategy outlines how the EPA engages with its stakeholders to ensure it is a relevant and credible organisation, which is leading the way to sustainability. It is a purposeful process of engaging people within and outside the organisation in new paths of communication and involvement.
Communication goal outcomes Extensive market research was carried out in 2006 to ascertain how key stakeholder groups, including licensees, unlicensed businesses, local government and the community, perceived the role and performance of the EPA. The research has guided the EPA in developing a Targeted Communication Strategy to ensure information and consultation is accessible to identified stakeholder groups. The communications team works closely with EPA officers to assist in developing strong and functional relationships with target audiences. The aim is to help inform staff about the role they play promoting the values of the EPA.
Review and improvement program of the EPA website Market research highlighted a need to redesign the existing EPA website, to make it more user friendly. Extensive consultation with internal and external stakeholder groups has since been conducted and a number of redesign options considered. The aim is to bring the EPA website in line with world’s best practice and best practice in government. The project is scheduled for completion during 2007−08.
Training for local government The EPA considers all authorised officers should be appropriately trained in the exercise of their powers and responsibilities under the EP Act. Over the last year, the EPA has supported 11 officers from seven metropolitan and one rural council to attend the Environment Protection Enforcement Certificate Course—a five-day course that deals specifically with the EP Act, investigations and prosecutions. These officers have been, or will be, authorised by their respective councils to administer the EP Act.
Environment Protection Authority Annual Report 2006−07
48
The EPA reimburses councils for the course fees and reasonable travelling and accommodation expenses if the officers come from rural councils.
PREDICTABLE, CONSISTENT AND FAIR COMPLIANCE AND ENFORCEMENT A key function of the EPA is to ensure an efficient and effective environmental protection system, aimed at protecting and improving the environment, which contributes to and underpins the government’s strategic plan objectives, such as attaining sustainability and growing prosperity. Consistent and fair administration of the EP Act and RPC Act is fundamental to achieving these objectives. This builds credibility and trust with our stakeholders based on a shared understanding and responsibility for achieving environmental outcomes across government, community and industry, at least cost to all parties. It helps to provide a climate of certainty for the business community, and sustain a level playing field for industry and commerce—important factors in attracting and retaining business and industry in the state. Licensing of environmentally significant activities is an important means of achieving environmental improvement. A licence sets obligations on the holder, such as achieving certain environmental standards, monitoring of discharges or environmental improvements. Under the EP Act everyone has a general environmental duty to take all reasonable and practicable measures to minimise or avoid polluting the environment. The EPA protects the environment and secures compliance with the requirements of the EP Act and its subordinate legislation, including EPPs, through various functions, from providing advice and collaboration through to enforcing the law. Although it expects full voluntary compliance with relevant legislative requirements, it will not hesitate to use its enforcement powers where necessary. The EP Act provides the EPA with a range of compliance and enforcement tools and with the discretion to determine:
• when enforcement is required • which enforcement measures are appropriate for the circumstance.
The EPA determines whether or not to take action, and which approach may be appropriate in the circumstances, by taking account of factors set out in the EPA Guidelines for compliance and enforcement, which seeks to balance social, environmental and economic factors. Action taken may range from warning letters through to prosecution. The guidelines provide for a multi-stage and escalating response to enforcing the EP Act. The level of response depends on factors such as the seriousness of the offence, an alleged offender’s history and the need for deterrents. The guidelines can be found at <www.epa.sa.gov.au/pdfs/guide_compliance.pdf>.
Performance measures The following performance measures are used for industry compliance:
• indicators: % of compliance with licence conditions, five of non-compliance resolved (frequency: quarterly)
• number of inspections performed (frequency: every two months) • number of orders issued (frequency: every two months) • number of successful prosecutions (frequency: every six months).
Environment Protection Authority Annual Report 2006−07
49
Industry compliance audit system Audits are a useful tool that allow the EPA to systematically assess compliance with the Environment Protection Act. When problems are identified, they are documented and the EPA works with the auditee to achieve compliance. The EPA analyses information gained from audits to identify common problems and then provides guidance to the business sectors or geographical regions we audit. The EPA has conducted a number of environmental compliance audits in recent years including:
• assessment of business along the Torrens River • industry around the Port River • industry in the Kilburn area • industry in northern Spencer Gulf region • slipways around the state.
During the year, the EPA undertook the Wingfield waste precinct audit. The principal aim of this audit was to ensure appropriate protection is afforded to the environment in relation to historic and current waste management activities in the Wingfield precinct in a reasonable and consistent regulatory manner. This audit program identified that, generally speaking, the EPA was satisfied with the level of compliance shown by those licensees that were audited. The majority of issues identified during the audit program related to waste disposal and stormwater monitoring. To support future regional and industry sector audits, the EPA has developed an industry compliance auditing system. This system provides a consistent approach to auditing, supported by a suite of tools including checklists and reporting templates. This system supports EPA staff in carrying out effective audits in a consistent manner. The EPA is currently undertaking the following three pilot audits to test the industry compliance audit system:
• audit of 27 facilities licensed for the production of listed waste, and includes surface coaters, manufacturers, scientific laboratories, printers, corrosives users and an agricultural processor. When informed of the audits a further 33 listed waste producers requested a checklist to carry out a self audit
• audit of all licensed ceramic works including two glassworks, five brickworks and one ceramic works
• self audit questionnaire targeting fire risk at six waste transfer stations, in cooperation with the Metropolitan Fire Service.
Generally, the initial findings from the pilot audits show that the non-compliances identified during the audit programs were relatively minor. The listed waste audit program identified minor issues of non-compliance at most premises. Typically these issues presented a low level of environmental risk and were corrected within a month of the completion of the audits. The audit results suggested that industries currently licensed as activities that produce listed waste are generally operating in an environmentally sound manner. However, results of the audit program also highlighted that licence holders displayed a lack of knowledge regarding their regulatory requirements under the EP Act and the conditions of the EPA authorisation. The EPA is acting on these findings to ensure that a variety of methods are made available for licensees to access information on pollution mitigation and regulatory requirements (including the updating the EPA website and distribution of educational information in the mail).
Environment Protection Authority Annual Report 2006−07
50
The initial findings from the ceramics audit program indicate that most of the licensees audited were compliant with their licence conditions. One of the key issues identified during the audit was that the licence conditions were not consistent across the sector. The EPA will act on this finding to ensure licences are consistent. Licensees found this audit process worked well and expressed their appreciation for being given prior notice with a comprehensive explanation of the proposed process and the audit checklist. The findings from the pilot audits will be used to refine the auditing system and for future audit planning.
Licence fee reform The EPA is developing a new system to determine licence fees, in order to better reflect the EPA’s regulatory effort and extend the incentives to reduce pollutant emissions. In November 2004, the EPA sought public feedback on options for a conceptual fee structure. Over 80 submissions were received, and there was strong support for a fee structure of:
• a flat minimum component, representing the minimum paperwork common to all licences
• an environment management component, reflecting EPA regulatory effort that is linked to environmental risk
• a load-based component, where fees are based on the amount and type of pollutants discharged to the environment (giving effect to the polluter pays principle and providing a modest incentive to reduce pollutant emissions).
A reference group, consisting of industry and community representatives, analysed the submissions and recommended a fee structure consisting of these three components. The steering committee recommended this to the EPA Board, which then endorsed the conceptual fee structure. In conjunction with independent consultants and in consultation with the reference group, the EPA developed the details of the fee structure and released a discussion paper in May 2006 seeking public feedback. Nine public consultation workshops were held in May and June. The industry and community reference group reviewed the issues raised in the public workshops and the 84 submissions, and the fee structure was revised to address the issues that were raised. The EPA consulted the reference group on the revised draft proposal, and made further changes. The fee structure is now being finalised for consideration by government. All licensees will be informed about the new fee structure when the regulations have been revised and approved.
Investigating regulatory reform initiatives During 2006−07, there were significant advances for the EPA in the area of regulatory reform and improvement. The formation of a dedicated functional unit to focus upon this area occurred in the lead up to 2006−07, and the key EPA priorities of improving efficiency, consistency and quality were all progressed. The publication of the report Regulatory reform within the South Australian Environment Protection Authority: progress and future released in late 2006 outlines the principles for regulatory reform within the EPA, and details the achievements and challenges for the EPA in the future. Importantly, the document establishes clearly what the aspirations for the EPA are in this area, specifically that:
Regulatory reform is an ongoing systematic process to minimise the overall costs of regulation to the government, business and the community, without compromising progress towards a clean, healthy and valued environment that supports social and economic prosperity for all South Australians.
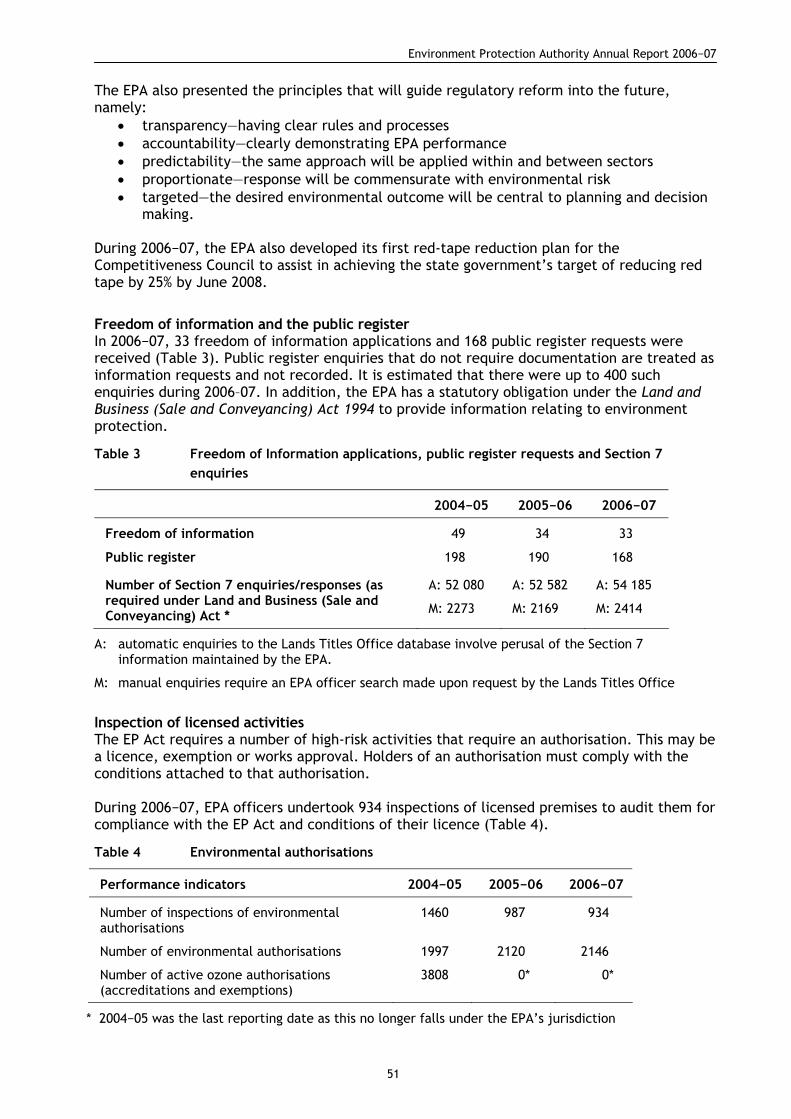
Environment Protection Authority Annual Report 2006−07
51
The EPA also presented the principles that will guide regulatory reform into the future, namely:
• transparency—having clear rules and processes • accountability—clearly demonstrating EPA performance • predictability—the same approach will be applied within and between sectors • proportionate—response will be commensurate with environmental risk • targeted—the desired environmental outcome will be central to planning and decision
making. During 2006−07, the EPA also developed its first red-tape reduction plan for the Competitiveness Council to assist in achieving the state government’s target of reducing red tape by 25% by June 2008.
Freedom of information and the public register In 2006−07, 33 freedom of information applications and 168 public register requests were received (Table 3). Public register enquiries that do not require documentation are treated as information requests and not recorded. It is estimated that there were up to 400 such enquiries during 2006–07. In addition, the EPA has a statutory obligation under the Land and Business (Sale and Conveyancing) Act 1994 to provide information relating to environment protection.
Table 3 Freedom of Information applications, public register requests and Section 7 enquiries
2004−05 2005−06 2006−07
Freedom of information 49 34 33
Public register 198 190 168
Number of Section 7 enquiries/responses (as required under Land and Business (Sale and Conveyancing) Act *
A: 52 080
M: 2273
A: 52 582
M: 2169
A: 54 185
M: 2414
A: automatic enquiries to the Lands Titles Office database involve perusal of the Section 7 information maintained by the EPA.
M: manual enquiries require an EPA officer search made upon request by the Lands Titles Office
Inspection of licensed activities The EP Act requires a number of high-risk activities that require an authorisation. This may be a licence, exemption or works approval. Holders of an authorisation must comply with the conditions attached to that authorisation. During 2006−07, EPA officers undertook 934 inspections of licensed premises to audit them for compliance with the EP Act and conditions of their licence (Table 4).
Table 4 Environmental authorisations
Performance indicators 2004−05 2005−06 2006−07
Number of inspections of environmental authorisations
1460 987 934
Number of environmental authorisations 1997 2120 2146
Number of active ozone authorisations (accreditations and exemptions)
3808 0* 0*
* 2004−05 was the last reporting date as this no longer falls under the EPA’s jurisdiction
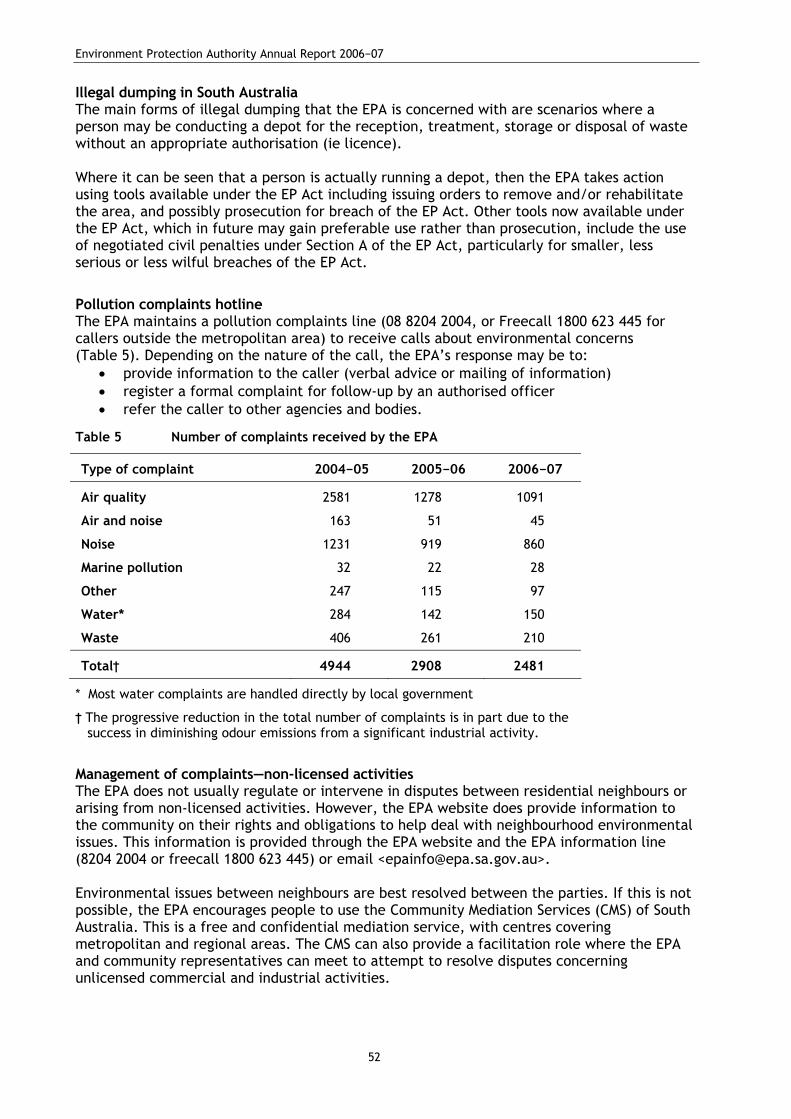
Environment Protection Authority Annual Report 2006−07
52
Illegal dumping in South Australia The main forms of illegal dumping that the EPA is concerned with are scenarios where a person may be conducting a depot for the reception, treatment, storage or disposal of waste without an appropriate authorisation (ie licence). Where it can be seen that a person is actually running a depot, then the EPA takes action using tools available under the EP Act including issuing orders to remove and/or rehabilitate the area, and possibly prosecution for breach of the EP Act. Other tools now available under the EP Act, which in future may gain preferable use rather than prosecution, include the use of negotiated civil penalties under Section A of the EP Act, particularly for smaller, less serious or less wilful breaches of the EP Act.
Pollution complaints hotline The EPA maintains a pollution complaints line (08 8204 2004, or Freecall 1800 623 445 for callers outside the metropolitan area) to receive calls about environmental concerns (Table 5). Depending on the nature of the call, the EPA’s response may be to:
• provide information to the caller (verbal advice or mailing of information) • register a formal complaint for follow-up by an authorised officer • refer the caller to other agencies and bodies.
Table 5 Number of complaints received by the EPA
Type of complaint 2004−05 2005−06 2006−07
Air quality 2581 1278 1091
Air and noise 163 51 45
Noise 1231 919 860
Marine pollution 32 22 28
Other 247 115 97
Water* 284 142 150
Waste 406 261 210
Total† 4944 2908 2481
* Most water complaints are handled directly by local government
† The progressive reduction in the total number of complaints is in part due to the success in diminishing odour emissions from a significant industrial activity.
Management of complaints—non-licensed activities The EPA does not usually regulate or intervene in disputes between residential neighbours or arising from non-licensed activities. However, the EPA website does provide information to the community on their rights and obligations to help deal with neighbourhood environmental issues. This information is provided through the EPA website and the EPA information line (8204 2004 or freecall 1800 623 445) or email <[email protected]>. Environmental issues between neighbours are best resolved between the parties. If this is not possible, the EPA encourages people to use the Community Mediation Services (CMS) of South Australia. This is a free and confidential mediation service, with centres covering metropolitan and regional areas. The CMS can also provide a facilitation role where the EPA and community representatives can meet to attempt to resolve disputes concerning unlicensed commercial and industrial activities.
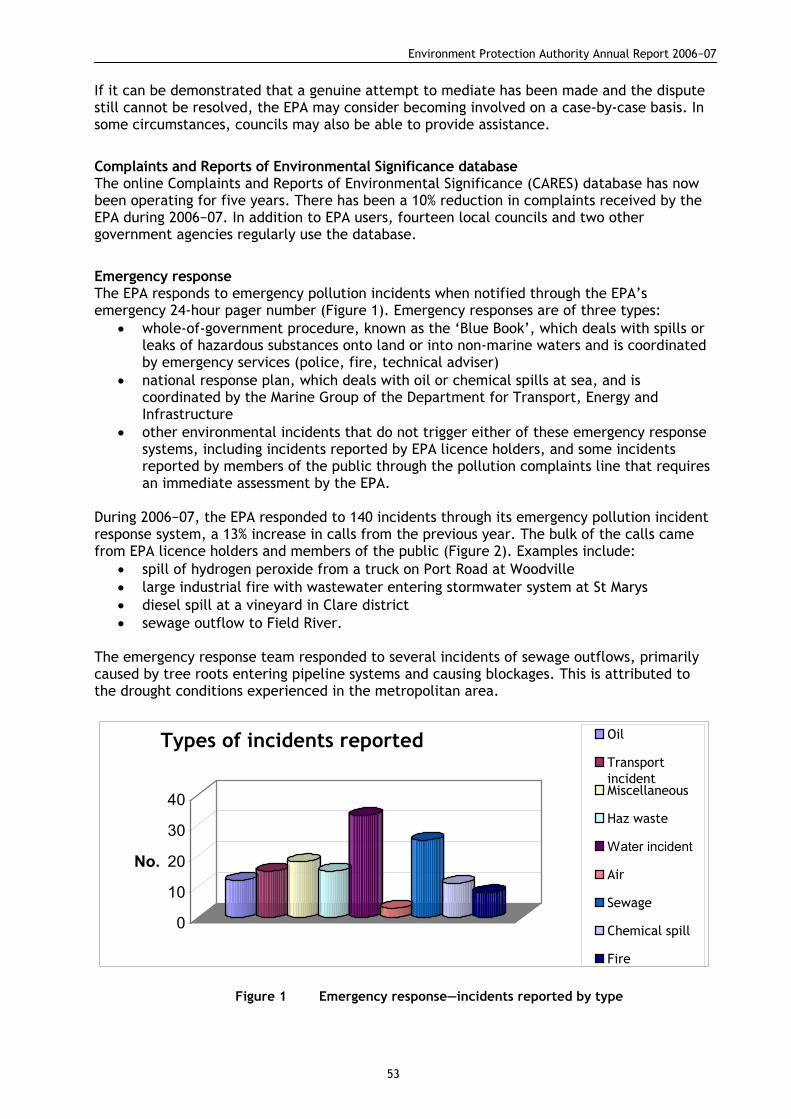
Environment Protection Authority Annual Report 2006−07
53
If it can be demonstrated that a genuine attempt to mediate has been made and the dispute still cannot be resolved, the EPA may consider becoming involved on a case-by-case basis. In some circumstances, councils may also be able to provide assistance.
Complaints and Reports of Environmental Significance database The online Complaints and Reports of Environmental Significance (CARES) database has now been operating for five years. There has been a 10% reduction in complaints received by the EPA during 2006−07. In addition to EPA users, fourteen local councils and two other government agencies regularly use the database.
Emergency response The EPA responds to emergency pollution incidents when notified through the EPA’s emergency 24-hour pager number (Figure 1). Emergency responses are of three types:
• whole-of-government procedure, known as the ‘Blue Book’, which deals with spills or leaks of hazardous substances onto land or into non-marine waters and is coordinated by emergency services (police, fire, technical adviser)
• national response plan, which deals with oil or chemical spills at sea, and is coordinated by the Marine Group of the Department for Transport, Energy and Infrastructure
• other environmental incidents that do not trigger either of these emergency response systems, including incidents reported by EPA licence holders, and some incidents reported by members of the public through the pollution complaints line that requires an immediate assessment by the EPA.
During 2006−07, the EPA responded to 140 incidents through its emergency pollution incident response system, a 13% increase in calls from the previous year. The bulk of the calls came from EPA licence holders and members of the public (Figure 2). Examples include:
• spill of hydrogen peroxide from a truck on Port Road at Woodville • large industrial fire with wastewater entering stormwater system at St Marys • diesel spill at a vineyard in Clare district • sewage outflow to Field River.
The emergency response team responded to several incidents of sewage outflows, primarily caused by tree roots entering pipeline systems and causing blockages. This is attributed to the drought conditions experienced in the metropolitan area.
0
10
20
30
40
No.
Types of incidents reported Oil
TransportincidentMiscellaneous
Haz waste
Water incident
Air
Sewage
Chemical spill
Fire
Figure 1 Emergency response—incidents reported by type

Environment Protection Authority Annual Report 2006−07
54
Calls received
41
361310
3
23
8 6 Licence holderPublicPoliceMetro FireCountry FireOtherCouncilTechnical adviser
Figure 2 Emergency response—source of calls
Environment Protection Orders Environment Protection Orders or EPOs (Table 6) can be issued by authorised officers under Section 93 (1) of the EP Act:
(a) for the purpose of securing compliance with—
(i) the general environmental duty; or
(ii) mandatory provisions of an environment protection policy; or
(iii) a condition of an environmental authorisation; or
(iv) a condition of a beverage container approval; or
(v) any other requirement imposed by or under this Act; or
(b) for the purpose of giving effect to an environment protection policy. Police officers are authorised under the EP Act to use EPOs to deal with complaints about noise from domestic premises. Some local government officers are also authorised under the EP Act, but this authority is limited to the council area in which they are employed.
Table 6 Environment Protection Orders
EPOs recorded 2004−05 2005−06 2006−07
EPA 52 44 21
Police 309 416 279
Councils 49 62 39
Enforcement and investigations The Investigations Unit has commenced 35 significant investigations this year, with nine matters carried over from 2005−06. 30 of these matters are now finalised, four are under review by the Crown Solicitor’s Office to determine the sufficiency of evidence, two matters are before various courts and there are eight matters currently under active investigation. Not all of the matters investigated revealed evidence of contraventions of the EP Act and some were dealt with by Environment Protection Orders and through civil remedies available under Section 104 of the EP Act.
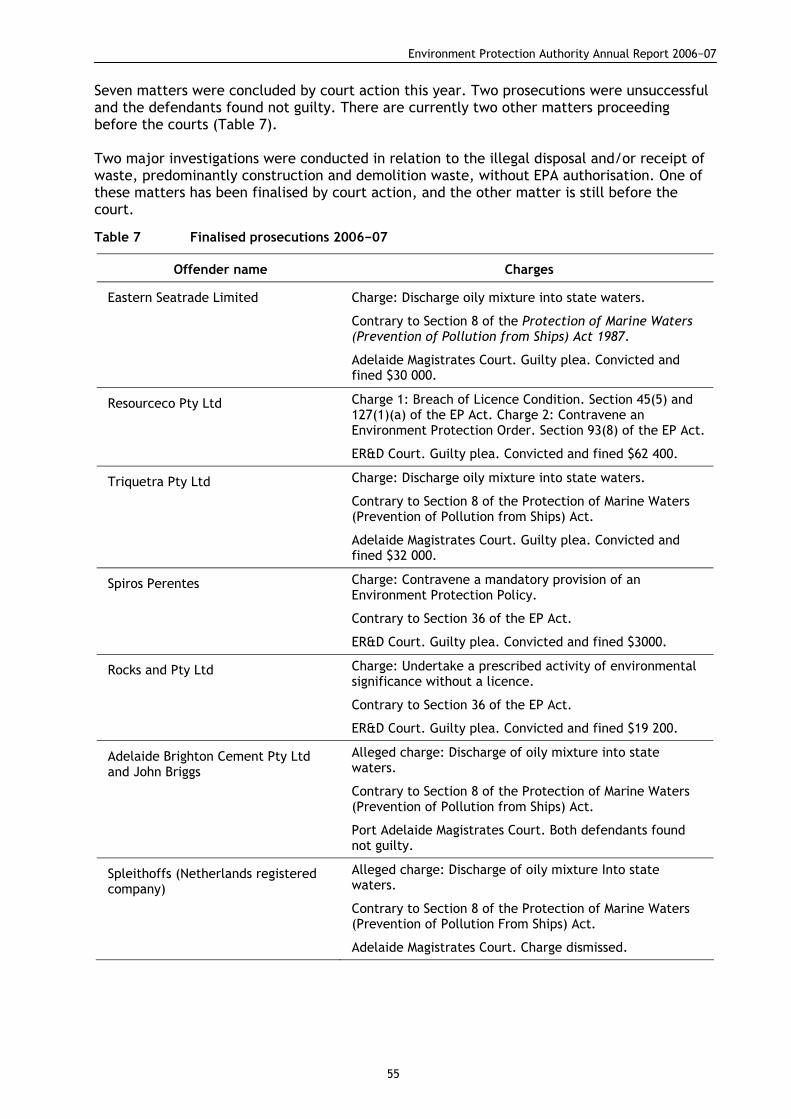
Environment Protection Authority Annual Report 2006−07
55
Seven matters were concluded by court action this year. Two prosecutions were unsuccessful and the defendants found not guilty. There are currently two other matters proceeding before the courts (Table 7). Two major investigations were conducted in relation to the illegal disposal and/or receipt of waste, predominantly construction and demolition waste, without EPA authorisation. One of these matters has been finalised by court action, and the other matter is still before the court.
Table 7 Finalised prosecutions 2006−07
Offender name Charges
Eastern Seatrade Limited Charge: Discharge oily mixture into state waters.
Contrary to Section 8 of the Protection of Marine Waters (Prevention of Pollution from Ships) Act 1987.
Adelaide Magistrates Court. Guilty plea. Convicted and fined $30 000.
Resourceco Pty Ltd Charge 1: Breach of Licence Condition. Section 45(5) and 127(1)(a) of the EP Act. Charge 2: Contravene an Environment Protection Order. Section 93(8) of the EP Act.
ER&D Court. Guilty plea. Convicted and fined $62 400.
Triquetra Pty Ltd Charge: Discharge oily mixture into state waters.
Contrary to Section 8 of the Protection of Marine Waters (Prevention of Pollution from Ships) Act.
Adelaide Magistrates Court. Guilty plea. Convicted and fined $32 000.
Spiros Perentes Charge: Contravene a mandatory provision of an Environment Protection Policy.
Contrary to Section 36 of the EP Act.
ER&D Court. Guilty plea. Convicted and fined $3000.
Rocks and Pty Ltd Charge: Undertake a prescribed activity of environmental significance without a licence.
Contrary to Section 36 of the EP Act.
ER&D Court. Guilty plea. Convicted and fined $19 200.
Adelaide Brighton Cement Pty Ltd and John Briggs
Alleged charge: Discharge of oily mixture into state waters.
Contrary to Section 8 of the Protection of Marine Waters (Prevention of Pollution from Ships) Act.
Port Adelaide Magistrates Court. Both defendants found not guilty.
Spleithoffs (Netherlands registered company)
Alleged charge: Discharge of oily mixture Into state waters.
Contrary to Section 8 of the Protection of Marine Waters (Prevention of Pollution From Ships) Act.
Adelaide Magistrates Court. Charge dismissed.
Environment Protection Authority Annual Report 2006−07
56
TIMELY PROVISION OF RELIABLE AND RELEVANT ENVIRONMENTAL INFORMATION The best available environmental information is used to inform policy formulation and risk-weighted decision making. Decisions and actions are underpinned by sound science. This program aims to assure stakeholders that the EPA is managing uncertainties and risk effectively. Broadly speaking, there are three types of monitoring from which the EPA gathers information:
• EPA monitoring for strategic purposes, typically state of the environment assessment • regulatory monitoring and testing by industry—can be imposed by an EPA authorisation
to provide information to support the management of environmental risks and effectiveness of management strategies
• monitoring by industry to meet the reporting requirements of national reporting inventories and registers, including reporting to the National Pollutant Inventory (NPI).
National Pollutant Inventory The NPI is an Australian Government initiative supported by all jurisdictions including the EPA. It is an internet database that provides information on the types and volumes of pollutants emitted to the environment (air, land and water). The NPI provides pollutant emission estimates from industrial and commercial sources (reported annually by industry) and diffuse sources (calculated by government agencies). The EPA actively seeks new reporters to the NPI program to make the database as complete as possible. This is reflected by the 5% increase in NPI reporting facilities over the last year. The EPA has recognised the need for the NPI database to be as accurate as possible and, as such, is focusing on streamlining the reporting process and making it more efficient for users. Thus, the EPA has been actively contributing to the Australian Government project of developing an online web-based reporting system to ensure the system will simplify the industry reporting process and include additional validation resulting in improved data quality. The EPA is also involved in the review of emission estimation technique manuals to ensure that the guidance documents are relevant to the users and specific to Australian conditions. In June 2007, the NEPC agreed upon a variation to the National Environment Protection (National Pollutant Inventory) Measure, which included the following changes:
• the inclusion of mandatory reporting of transfers to a final destination (in other words, landfill or sewerage system)
• the inclusion of reporting on greenhouse gas emissions (until such time as a stand alone, national scheme is developed)
• substance and threshold changes • changes to the reporting time frames.
In addition to making the database more comprehensive, these changes will make the NPI more comparable to other pollutant release and transfer registers around the world.
INNOVATION AND RELEVANT POLICY ADVICE AND LEGISLATION The EPA, under the Minister for Environment and Conservation, is responsible for administering the EP Act, as well as the:
• Radiation Protection and Control Act 1982 • National Environment Protection Council (South Australia) Act 1995 • Wingfield Waste Depot Closure Act 1999.
Environment Protection Authority Annual Report 2006−07
57
The EPA also has regulatory responsibilities under Acts within the jurisdiction of other state government agencies, such as the Aquaculture Act and the Development Act. The EP Act was assented to in October 1993 and came into operation on 1 May 1995. Changing community values and a better understanding of both environmental impact and contemporary approaches to environmental management require a commitment to continually review and update the EP Act. Since it came into operation, parts of the EP Act have been amended, subordinate legislation such as EPPs has been introduced and a number of areas where the EP Act could be improved have been identified. In early 2003, the EP Act was amended to establish new governance arrangements for the EPA and increased penalties for major offences. In June 2005, a further Act was passed and assented to—the Environment Protection (Miscellaneous) Amendment Act 2005. As well as legislative policy development, the EPA also considers policy development in areas such as the effects of pollution on health, and more recently, its role in and contribution to the growing sustainability agenda. For initiatives related to legislative review of the RPC Act, please see the Annual Report on the Administration of the Radiation Protection and Control Ac1 1982. The purpose of the EPA’s legislative and policy program is aimed at guiding the South Australian community towards sustainable practices. In addition, the EPA continues to work cooperatively with other jurisdictions to represent the state’s interests at the national level, and to ensure that South Australia is well positioned to address strategic state, national and global environmental issues.
Implement the Environment Protection (Miscellaneous) Amendments Act The Environment Protection (Miscellaneous) Amendment Act contains a new system of civil penalties that was introduced into the Environment Protection Act 1993 on 1 July 2006. The civil penalty system empowers the EPA to negotiate a civil penalty in relation to a contravention of the EP Act, directly with a person who the EPA is satisfied has committed the offence. Alternatively the EPA may apply to the Environment Resources and Development Court for an order that a person pay to the EPA an amount as a civil penalty. Negotiated civil penalties will be used as an efficient alternative to criminal prosecution in response to certain less serious contraventions of the EP Act. Criminal prosecution will continue to be used to deal with more serious or re-occurring offences. To support the introduction of the new negotiated civil penalty system, a civil penalty calculation policy was released in November 2006. The policy identifies the factors that the EPA must consider when deciding whether to recover an amount as a civil penalty rather than undertaking criminal prosecution. The EPA will have regard for the seriousness of the contravention, the previous record of the offender and any other relevant factors in determining the appropriateness of applying for a civil penalty. One of the objectives of the policy is to create a transparent and consistent method of calculating a penalty amount for a contravention of the EP Act for the negotiation of a civil penalty. In preparing the calculations policy, effective engagement of key interest groups was undertaken during the period November 2005 to June 2006 to maximise ownership of the policy. The EPA worked with Business SA and local councils to run three awareness sessions about the Environment Protection (Miscellaneous) Amendment Act during this time.
Environment Protection Authority Annual Report 2006−07
58
Review of container deposit legislation In October 2006, the government released the Draft Environment Protection (Beverage Containers) Amendment Bill 2006 to strengthen the container deposit legislation (CDL) system. The two main proposals in the Bill are the regulation of super collectors and offences to address interstate rorting. As part of the consultation the state government welcomed comments on the separate issue of the refund amount for the CDL system. The refund amount is prescribed by regulation and is not a subject for inclusion in the Bill. However, the adequacy of the refund amount is of public interest, and is topical given the current interest in introducing a CDL system in Western Australia. In light of this, the state government canvassed public opinion on a range of refund options, including a 10c or 20c deposit or a tiered scheme based on the size of containers. The government has received submissions from industry and the community as a response to the public consultation undertaken on the Bill and adequacy of the refund amount. The EPA has reviewed all submissions and has received a report from a consultant detailing the economic and environmental impacts of increasing the refund amount. The EPA has provided this information to the government so it may make a decision about the content of the Bill and the adequacy of the refund amount that takes into account relevant issues and impacts.
EPA position statements The EPA Board has started preparing statements that outline policy position and principles on key priority environmental issues. The key elements of a statement may include:
• identification of the nature of the environmental issue • identification of the EPA’s role in managing the issue, or what the EPA is, or will be,
doing • identification of the challenges and opportunities associated with the topic and/or
what the EPA is intending to further assess or evaluate • a call for action to better manage the issue—that is, what the EPA believes needs to
happen. During the year, the EPA Board finalised a position statement on the role of precaution in EPA decision making. This statement is currently being converted into an internal operating procedure for use by EPA staff, which has not yet been finalised. Earlier position statements on the health effects of air pollution and the EPA role in sustainability are available on the EPA website.
Environment Protection Authority Annual Report 2006−07
A-1
APPENDIX 1 ORGANISATIONAL INFORMATION
FINANCE AND ADMINISTRATION The Finance and Administration Branch undertook numerous initiatives this year with the focus on streamlining or automating processes and systems and on key accommodation requirements. The accounts payable function was outsourced to DEH early in the financial year. The EPA was the first site to go live for the accounts payable invoice scanning solution, and an online credit card statement system was implemented. The invoice scanning solution has reduced the administrative burden, particularly for finance staff, along with providing a more effective and efficient method for investigating transactions. Accommodation was also a key focus area, and included finalising alterations following the organisational restructure, completing the accommodation fit-out on Level 2 of the SA Water House building and undertaking modifications to the Stirling office to assist in the co-location of the Murray Bridge and Stirling offices. The 2007−08 financial year will be a challenging one. The new licence fee structure to be implemented 1 July 2008 requires a detailed cost-recovery model to be established, maintained and reviewed in an ongoing manner. This will be a significant project for the 2007−08 financial year in order to ensure it is as automated as possible to minimise review periods going forward. There is also a requirement to transition the revenue officer role and associated functions from the Licensing and Regulatory Services area to the finance team, as well as a review of management reports, again in order to streamline the process. The EPA will also be working on strategic accommodation plans in preparation for our lease expiry in 2008.
HUMAN RESOURCES AND DEVELOPMENT Critical human resources and development (HRD) areas for 2006−07 have been staff learning and development, further establishment and review of OHSW systems and key projects associated with the Organisational Improvement Program. The HRD Branch continues to provide high-level consultancy, learning and development opportunities and OHSW coordination that is well used by managers and staff. An EPA workforce capability development area is the provision of learning to ensure that managers have the skills to provide leadership and management. The EPA delivered its second Leadership Development Program to enhance the skills of existing leaders and develop future leaders. A total of twelve participants commenced in February and the program concludes in July 2007.
Disability Action Plan The HRD Branch is currently investigating the development of a Disability Action Plan to ensure the promotion of independence for both employees and customers with disabilities. As part of this plan, an environment assessment was conducted to ensure accessibility of the organisation for people with disabilities.
Equal employment opportunity The Office of the Commissioner for Equal Opportunity provided a range of workshops to assist staff in preventing, and suitably responding to, inappropriate behaviours in the workplace during the latter part of 2006. These workshops were attended by all staff and provided effective strategies to promote a safe and satisfying workplace.
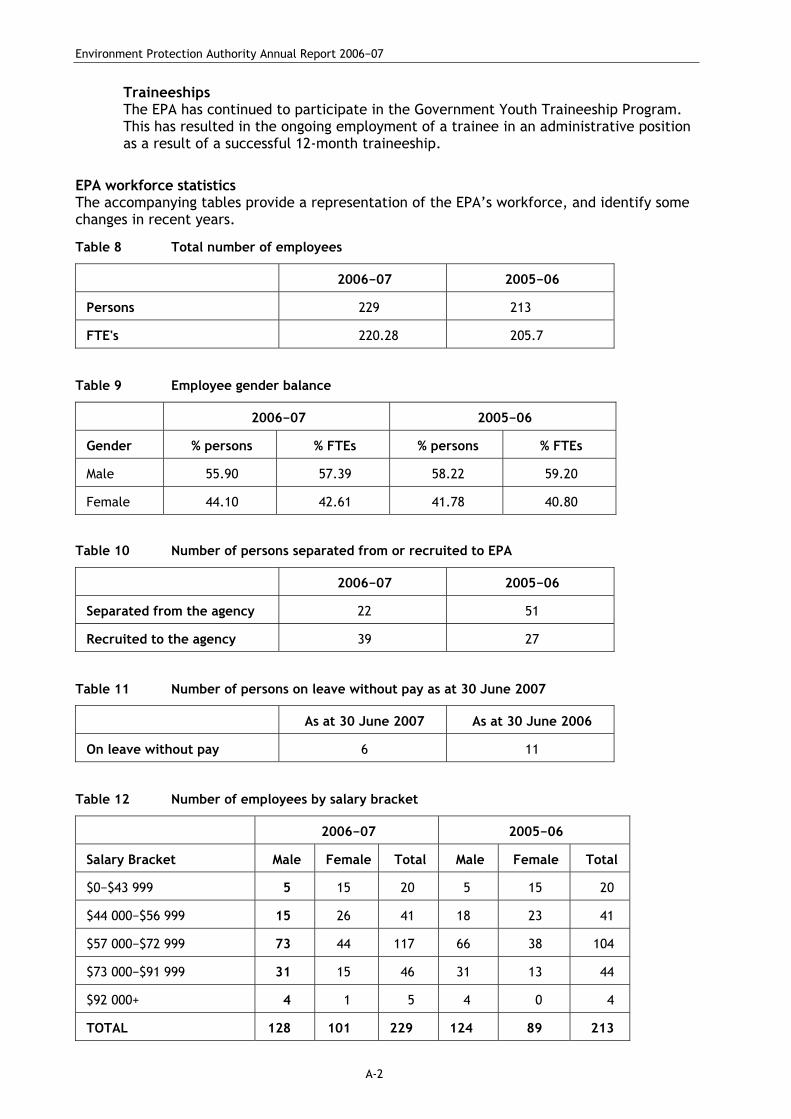
Environment Protection Authority Annual Report 2006−07
A-2
Traineeships The EPA has continued to participate in the Government Youth Traineeship Program. This has resulted in the ongoing employment of a trainee in an administrative position as a result of a successful 12-month traineeship.
EPA workforce statistics The accompanying tables provide a representation of the EPA’s workforce, and identify some changes in recent years.
Table 8 Total number of employees
2006−07 2005−06
Persons 229 213
FTE's 220.28 205.7
Table 9 Employee gender balance
2006−07 2005−06
Gender % persons % FTEs % persons % FTEs
Male 55.90 57.39 58.22 59.20
Female 44.10 42.61 41.78 40.80
Table 10 Number of persons separated from or recruited to EPA
2006−07 2005−06
Separated from the agency 22 51
Recruited to the agency 39 27
Table 11 Number of persons on leave without pay as at 30 June 2007
As at 30 June 2007 As at 30 June 2006
On leave without pay 6 11
Table 12 Number of employees by salary bracket
2006−07 2005−06
Salary Bracket Male Female Total Male Female Total
$0−$43 999 5 15 20 5 15 20
$44 000−$56 999 15 26 41 18 23 41
$57 000−$72 999 73 44 117 66 38 104
$73 000−$91 999 31 15 46 31 13 44
$92 000+ 4 1 5 4 0 4
TOTAL 128 101 229 124 89 213
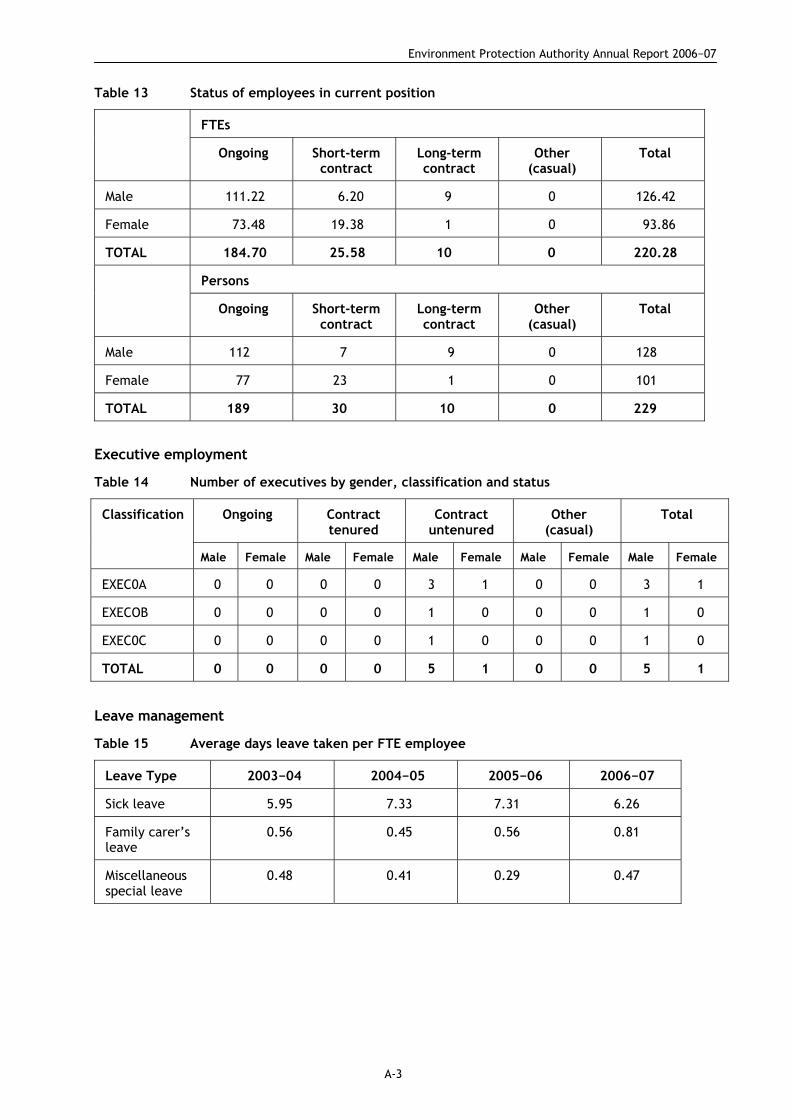
Environment Protection Authority Annual Report 2006−07
A-3
Table 13 Status of employees in current position
FTEs
Ongoing Short-term contract
Long-term contract
Other (casual)
Total
Male 111.22 6.20 9 0 126.42
Female 73.48 19.38 1 0 93.86
TOTAL 184.70 25.58 10 0 220.28
Persons
Ongoing Short-term contract
Long-term contract
Other (casual)
Total
Male 112 7 9 0 128
Female 77 23 1 0 101
TOTAL 189 30 10 0 229
Executive employment
Table 14 Number of executives by gender, classification and status
Ongoing Contract tenured
Contract untenured
Other (casual)
Total Classification
Male Female Male Female Male Female Male Female Male Female
EXEC0A 0 0 0 0 3 1 0 0 3 1
EXECOB 0 0 0 0 1 0 0 0 1 0
EXEC0C 0 0 0 0 1 0 0 0 1 0
TOTAL 0 0 0 0 5 1 0 0 5 1
Leave management
Table 15 Average days leave taken per FTE employee
Leave Type 2003−04 2004−05 2005−06 2006−07
Sick leave 5.95 7.33 7.31 6.26
Family carer’s leave
0.56 0.45 0.56 0.81
Miscellaneous special leave
0.48 0.41 0.29 0.47
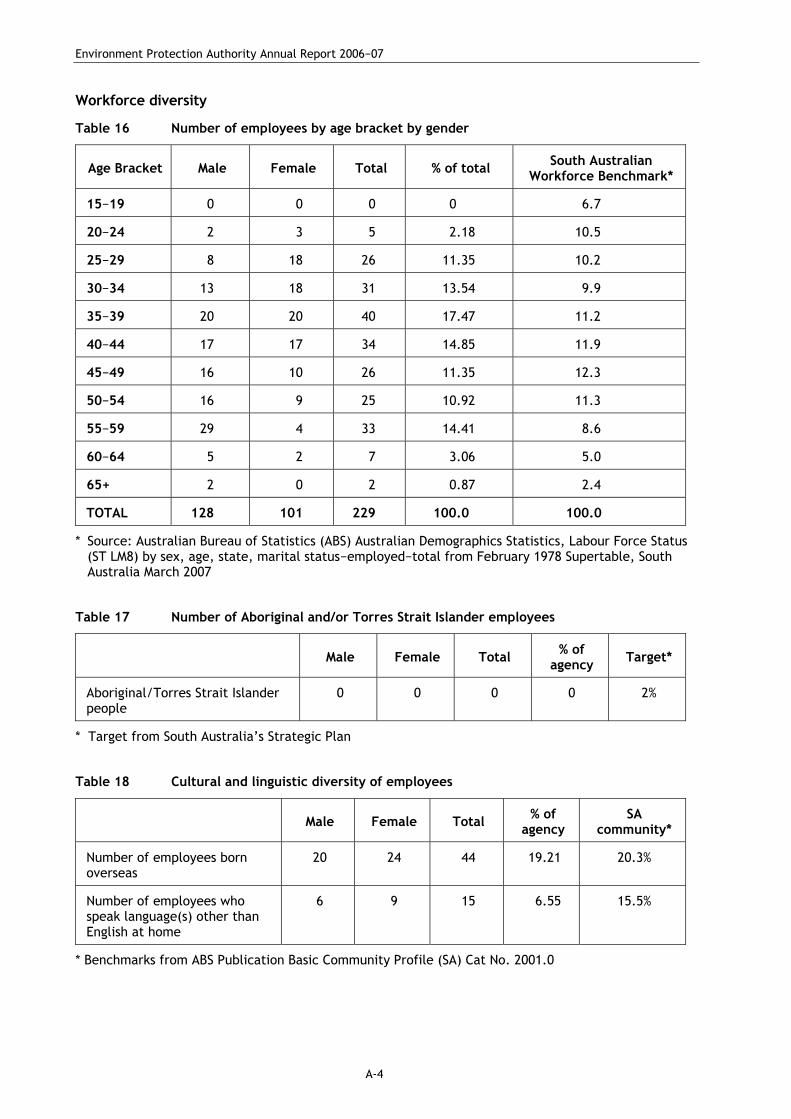
Environment Protection Authority Annual Report 2006−07
A-4
Workforce diversity
Table 16 Number of employees by age bracket by gender
Age Bracket Male Female Total % of total South Australian Workforce Benchmark*
15−19 0 0 0 0 6.7
20−24 2 3 5 2.18 10.5
25−29 8 18 26 11.35 10.2
30−34 13 18 31 13.54 9.9
35−39 20 20 40 17.47 11.2
40−44 17 17 34 14.85 11.9
45−49 16 10 26 11.35 12.3
50−54 16 9 25 10.92 11.3
55−59 29 4 33 14.41 8.6
60−64 5 2 7 3.06 5.0
65+ 2 0 2 0.87 2.4
TOTAL 128 101 229 100.0 100.0
* Source: Australian Bureau of Statistics (ABS) Australian Demographics Statistics, Labour Force Status (ST LM8) by sex, age, state, marital status−employed−total from February 1978 Supertable, South Australia March 2007
Table 17 Number of Aboriginal and/or Torres Strait Islander employees
Male Female Total % of agency Target*
Aboriginal/Torres Strait Islander people
0 0 0 0 2%
* Target from South Australia’s Strategic Plan
Table 18 Cultural and linguistic diversity of employees
Male Female Total % of agency
SA community*
Number of employees born overseas
20 24 44 19.21 20.3%
Number of employees who speak language(s) other than English at home
6 9 15 6.55 15.5%
* Benchmarks from ABS Publication Basic Community Profile (SA) Cat No. 2001.0
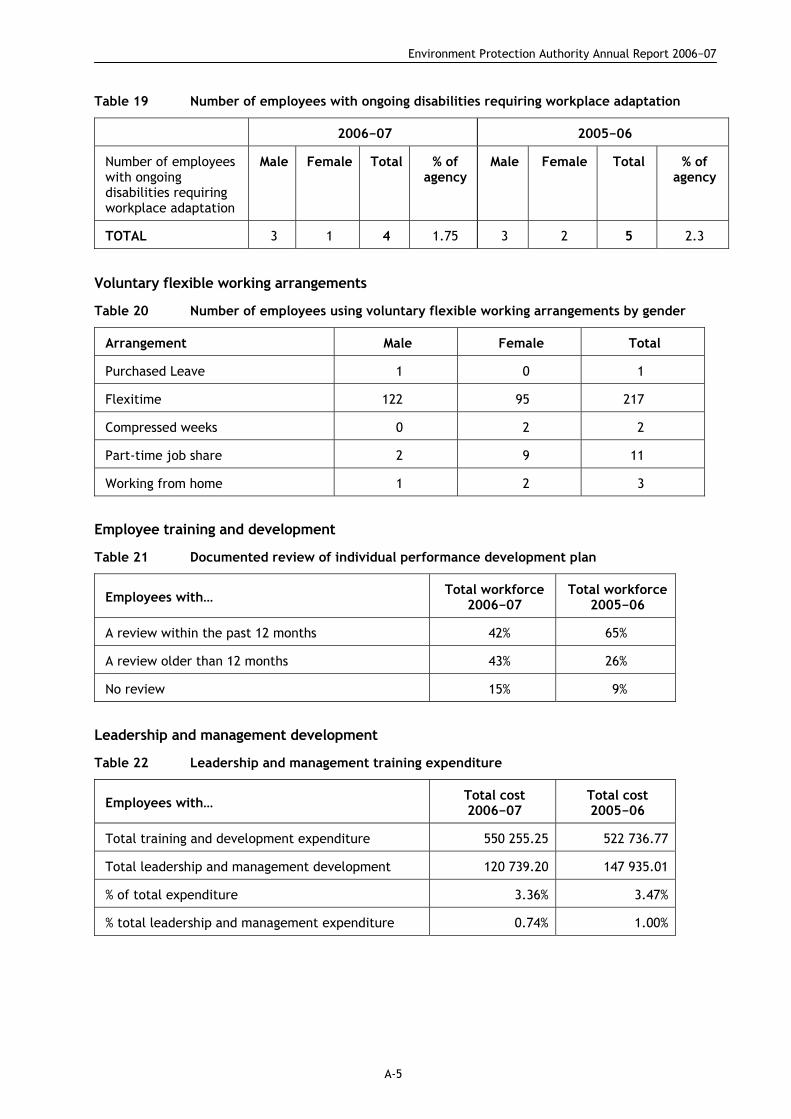
Environment Protection Authority Annual Report 2006−07
A-5
Table 19 Number of employees with ongoing disabilities requiring workplace adaptation
2006−07 2005−06
Number of employees with ongoing disabilities requiring workplace adaptation
Male Female Total % of agency
Male Female Total % of agency
TOTAL 3 1 4 1.75 3 2 5 2.3
Voluntary flexible working arrangements
Table 20 Number of employees using voluntary flexible working arrangements by gender
Arrangement Male Female Total
Purchased Leave 1 0 1
Flexitime 122 95 217
Compressed weeks 0 2 2
Part-time job share 2 9 11
Working from home 1 2 3
Employee training and development
Table 21 Documented review of individual performance development plan
Employees with… Total workforce 2006−07
Total workforce 2005−06
A review within the past 12 months 42% 65%
A review older than 12 months 43% 26%
No review 15% 9%
Leadership and management development
Table 22 Leadership and management training expenditure
Employees with… Total cost 2006−07
Total cost 2005−06
Total training and development expenditure 550 255.25 522 736.77
Total leadership and management development 120 739.20 147 935.01
% of total expenditure 3.36% 3.47%
% total leadership and management expenditure 0.74% 1.00%
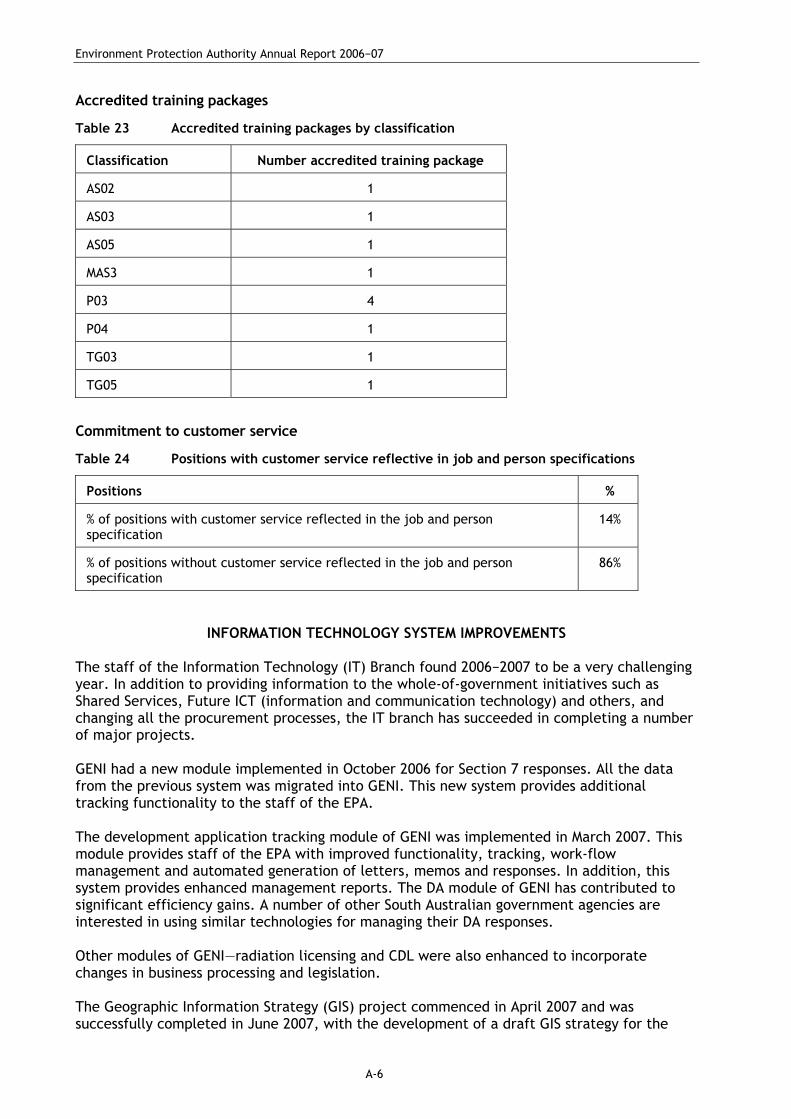
Environment Protection Authority Annual Report 2006−07
A-6
Accredited training packages
Table 23 Accredited training packages by classification
Classification Number accredited training package
AS02 1
AS03 1
AS05 1
MAS3 1
P03 4
P04 1
TG03 1
TG05 1
Commitment to customer service
Table 24 Positions with customer service reflective in job and person specifications
Positions %
% of positions with customer service reflected in the job and person specification
14%
% of positions without customer service reflected in the job and person specification
86%
INFORMATION TECHNOLOGY SYSTEM IMPROVEMENTS The staff of the Information Technology (IT) Branch found 2006−2007 to be a very challenging year. In addition to providing information to the whole-of-government initiatives such as Shared Services, Future ICT (information and communication technology) and others, and changing all the procurement processes, the IT branch has succeeded in completing a number of major projects. GENI had a new module implemented in October 2006 for Section 7 responses. All the data from the previous system was migrated into GENI. This new system provides additional tracking functionality to the staff of the EPA. The development application tracking module of GENI was implemented in March 2007. This module provides staff of the EPA with improved functionality, tracking, work-flow management and automated generation of letters, memos and responses. In addition, this system provides enhanced management reports. The DA module of GENI has contributed to significant efficiency gains. A number of other South Australian government agencies are interested in using similar technologies for managing their DA responses. Other modules of GENI—radiation licensing and CDL were also enhanced to incorporate changes in business processing and legislation. The Geographic Information Strategy (GIS) project commenced in April 2007 and was successfully completed in June 2007, with the development of a draft GIS strategy for the
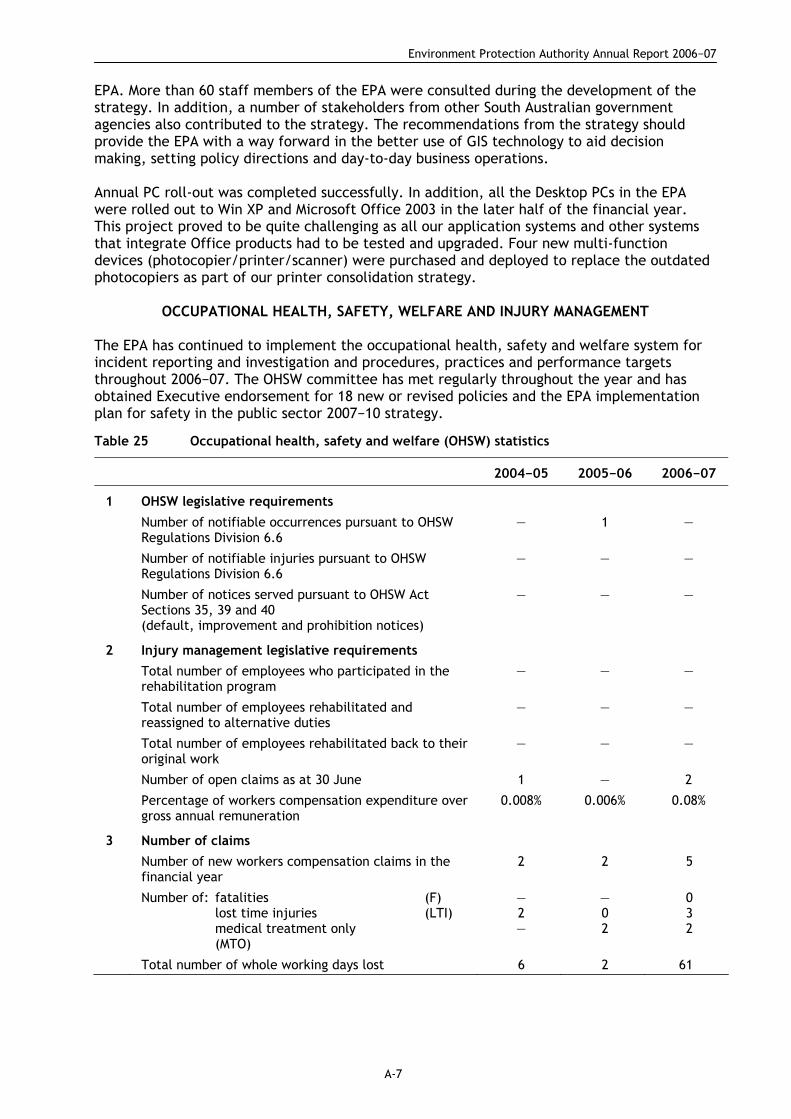
Environment Protection Authority Annual Report 2006−07
A-7
EPA. More than 60 staff members of the EPA were consulted during the development of the strategy. In addition, a number of stakeholders from other South Australian government agencies also contributed to the strategy. The recommendations from the strategy should provide the EPA with a way forward in the better use of GIS technology to aid decision making, setting policy directions and day-to-day business operations. Annual PC roll-out was completed successfully. In addition, all the Desktop PCs in the EPA were rolled out to Win XP and Microsoft Office 2003 in the later half of the financial year. This project proved to be quite challenging as all our application systems and other systems that integrate Office products had to be tested and upgraded. Four new multi-function devices (photocopier/printer/scanner) were purchased and deployed to replace the outdated photocopiers as part of our printer consolidation strategy.
OCCUPATIONAL HEALTH, SAFETY, WELFARE AND INJURY MANAGEMENT The EPA has continued to implement the occupational health, safety and welfare system for incident reporting and investigation and procedures, practices and performance targets throughout 2006−07. The OHSW committee has met regularly throughout the year and has obtained Executive endorsement for 18 new or revised policies and the EPA implementation plan for safety in the public sector 2007−10 strategy.
Table 25 Occupational health, safety and welfare (OHSW) statistics
2004−05 2005−06 2006−07
1 OHSW legislative requirements Number of notifiable occurrences pursuant to OHSW
Regulations Division 6.6 — 1 —
Number of notifiable injuries pursuant to OHSW Regulations Division 6.6
— — —
Number of notices served pursuant to OHSW Act Sections 35, 39 and 40 (default, improvement and prohibition notices)
— — —
2 Injury management legislative requirements Total number of employees who participated in the
rehabilitation program — — —
Total number of employees rehabilitated and reassigned to alternative duties
— — —
Total number of employees rehabilitated back to their original work
— — —
Number of open claims as at 30 June 1 — 2 Percentage of workers compensation expenditure over
gross annual remuneration 0.008% 0.006% 0.08%
3 Number of claims Number of new workers compensation claims in the
financial year 2 2 5
Number of: fatalities (F) lost time injuries (LTI) medical treatment only (MTO)
— 2 —
— 0 2
0 3 2
Total number of whole working days lost 6 2 61

Environment Protection Authority Annual Report 2006−07
A-8
2004−05 2005−06 2006−07
4 Cost of workers compensation Cost of new claims for financial year $1155 $462 $14 399 Cost of all claims excluding lump sum payments on
the settlement of a claim (under the Workers Rehabilitation and Compensation Act 1986 (WRC Act))
$1155 $498 $14 399
Future liabilities for weekly payments/medical/loss of earnings (S 42)
— — —
Permanent disability (S 43) — — — Lump sum payment on death of spouse/child (S 44) — — — Amount paid for lump sum payments
(S 42)
(S 43)
(S 44)
—
—
—
—
—
—
—
—
—
Total amount recovered from external sources (WRC Act S 54) including from a negligent third party
— — —
Budget allocation for workers compensation — — —
5 Trends
Injury frequency rate for new lost-time injury/disease for each million hours worked
5.1 5.4 12.6
Most frequent cause (mechanism) of injury Trip, slip, fall
Body stressing
Body stressing
Most expensive cause (mechanism) of injury Trip, slip, fall on level
surface
Body stressing
Body stressing
6 Meeting the organisation’s strategic targets: • OHSW Action Plan—Action Plan reviewed
with 24 items completed (66%): 8 items under progress (22%): 4 items not started (11%)
• Safety in the Public Sector Strategy—development of the Chief Executive Safety Commitment Statement and the Agency Implementation Plan
• OHSW Policies—2 new policies implemented and 7 policies reviewed, updated and implemented.
• OHSW Performance report —Developed and implemented and used as the basis for monitoring the completion of OHSW activities
• Hazard management—Workplace inspections, Hazardous Substances, and Hazard Incident Injury reporting processes implemented
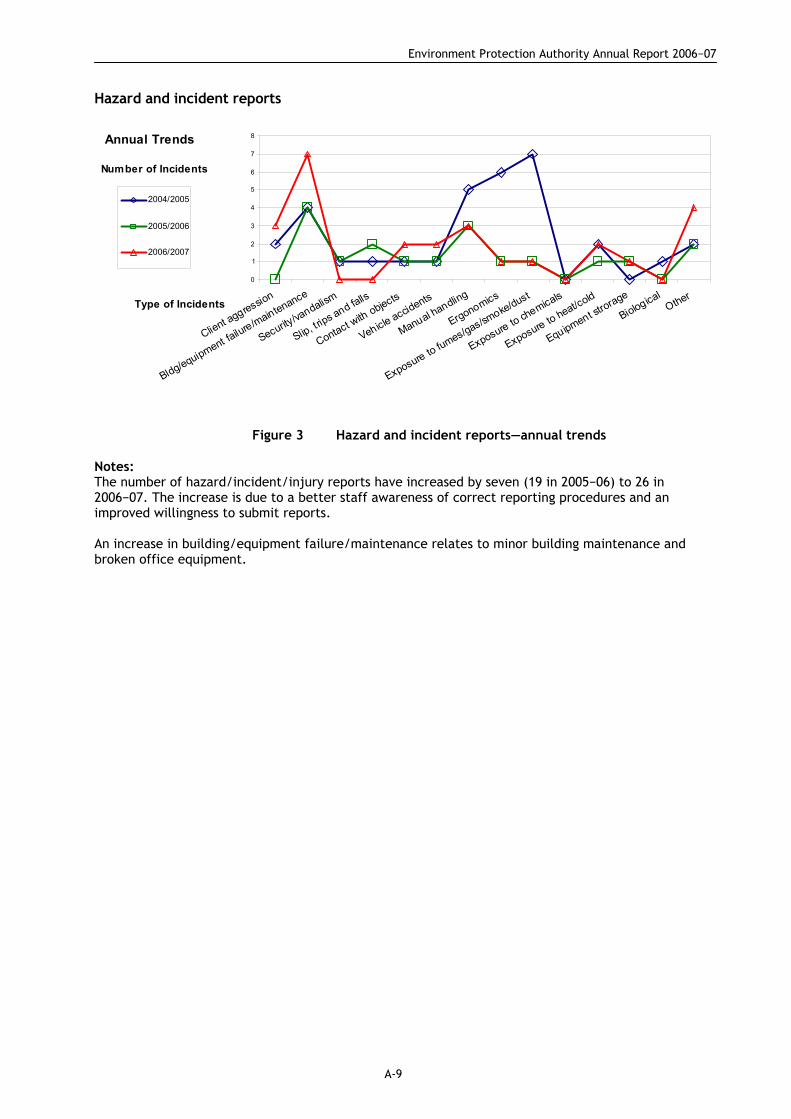
Environment Protection Authority Annual Report 2006−07
A-9
Hazard and incident reports
Annual Trends
0
1
2
3
4
5
6
7
8
Client aggression
Bldg/equipment failure/maintenance
Security/vandalism
Slip, trips and falls
Contact with objects
Vehicle accidents
Manual handling
Ergonomics
Exposure to fumes/gas/smoke/dust
Exposure to chemicals
Exposure to heat/cold
Equipment strorage
BiologicalOther
Type of Incidents
Number of Incidents
2004/2005
2005/2006
2006/2007
Figure 3 Hazard and incident reports—annual trends
Notes: The number of hazard/incident/injury reports have increased by seven (19 in 2005−06) to 26 in 2006−07. The increase is due to a better staff awareness of correct reporting procedures and an improved willingness to submit reports. An increase in building/equipment failure/maintenance relates to minor building maintenance and broken office equipment.

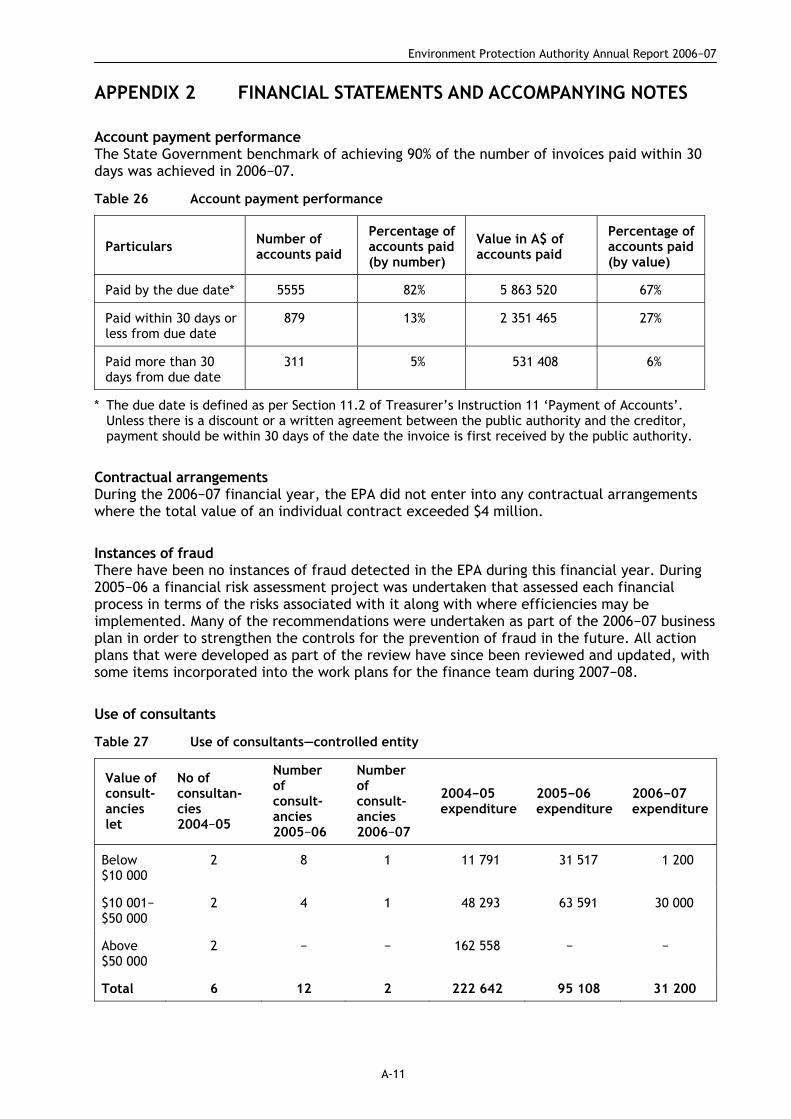
Environment Protection Authority Annual Report 2006−07
A-11
APPENDIX 2 FINANCIAL STATEMENTS AND ACCOMPANYING NOTES
Account payment performance The State Government benchmark of achieving 90% of the number of invoices paid within 30 days was achieved in 2006−07.
Table 26 Account payment performance
Particulars Number of accounts paid
Percentage of accounts paid (by number)
Value in A$ of accounts paid
Percentage of accounts paid (by value)
Paid by the due date* 5555 82% 5 863 520 67%
Paid within 30 days or less from due date
879 13% 2 351 465 27%
Paid more than 30 days from due date
311 5% 531 408 6%
* The due date is defined as per Section 11.2 of Treasurer’s Instruction 11 ‘Payment of Accounts’. Unless there is a discount or a written agreement between the public authority and the creditor, payment should be within 30 days of the date the invoice is first received by the public authority.
Contractual arrangements During the 2006−07 financial year, the EPA did not enter into any contractual arrangements where the total value of an individual contract exceeded $4 million.
Instances of fraud There have been no instances of fraud detected in the EPA during this financial year. During 2005−06 a financial risk assessment project was undertaken that assessed each financial process in terms of the risks associated with it along with where efficiencies may be implemented. Many of the recommendations were undertaken as part of the 2006−07 business plan in order to strengthen the controls for the prevention of fraud in the future. All action plans that were developed as part of the review have since been reviewed and updated, with some items incorporated into the work plans for the finance team during 2007−08.
Use of consultants
Table 27 Use of consultants—controlled entity
Value of consult-ancies let
No of consultan-cies 2004−05
Number of consult-ancies 2005−06
Number of consult-ancies 2006−07
2004−05 expenditure
2005−06 expenditure
2006−07 expenditure
Below $10 000
2 8 1 11 791 31 517 1 200
$10 001− $50 000
2 4 1 48 293 63 591 30 000
Above $50 000
2 − − 162 558 − −
Total 6 12 2 222 642 95 108 31 200
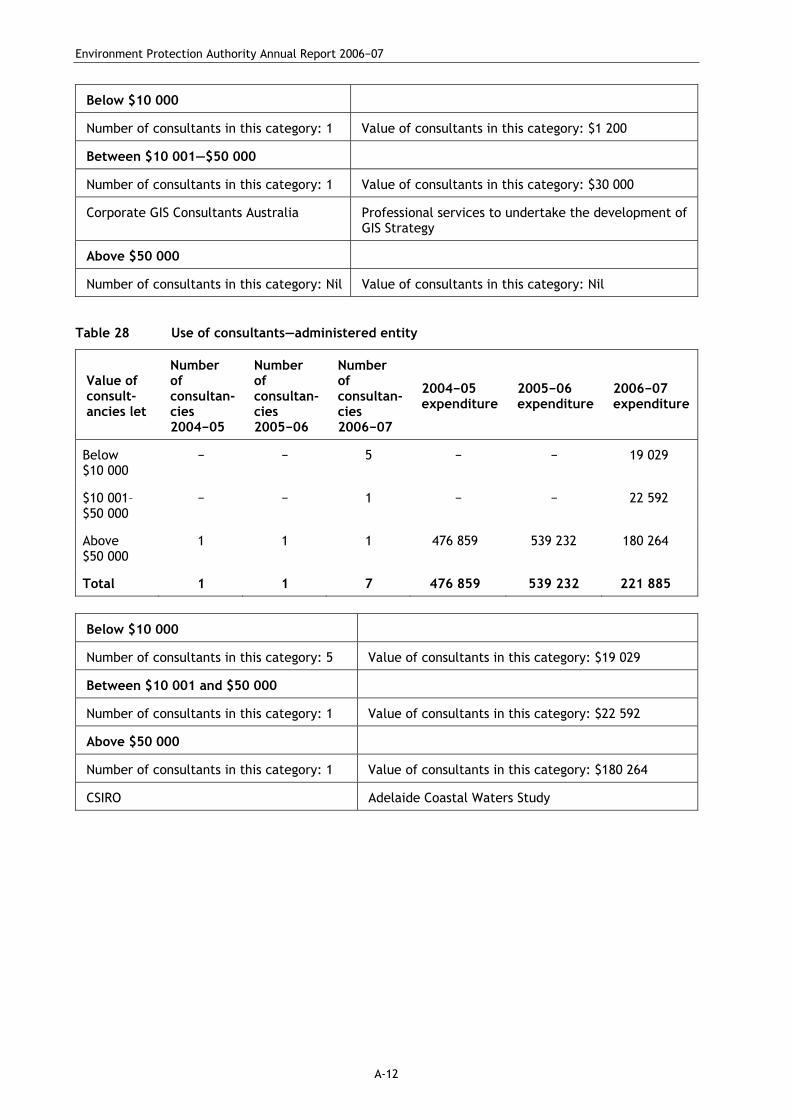
Environment Protection Authority Annual Report 2006−07
A-12
Below $10 000
Number of consultants in this category: 1 Value of consultants in this category: $1 200
Between $10 001—$50 000
Number of consultants in this category: 1 Value of consultants in this category: $30 000
Corporate GIS Consultants Australia Professional services to undertake the development of GIS Strategy
Above $50 000
Number of consultants in this category: Nil Value of consultants in this category: Nil
Table 28 Use of consultants—administered entity
Value of consult-ancies let
Number of consultan-cies 2004−05
Number of consultan-cies 2005−06
Number of consultan-cies 2006−07
2004−05 expenditure
2005−06 expenditure
2006−07 expenditure
Below $10 000
− − 5 − − 19 029
$10 001–$50 000
− − 1 − − 22 592
Above $50 000
1 1 1 476 859 539 232 180 264
Total 1 1 7 476 859 539 232 221 885
Below $10 000
Number of consultants in this category: 5 Value of consultants in this category: $19 029
Between $10 001 and $50 000
Number of consultants in this category: 1 Value of consultants in this category: $22 592
Above $50 000
Number of consultants in this category: 1 Value of consultants in this category: $180 264
CSIRO Adelaide Coastal Waters Study
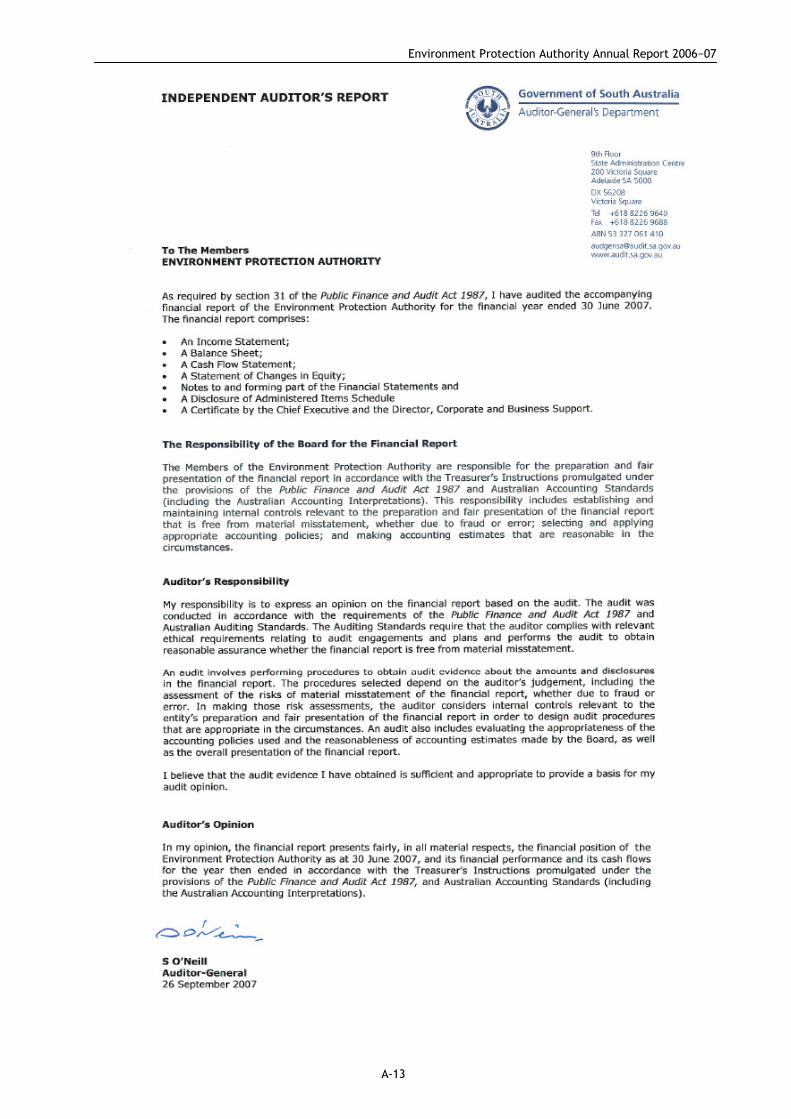
Environment Protection Authority Annual Report 2006−07
A-13
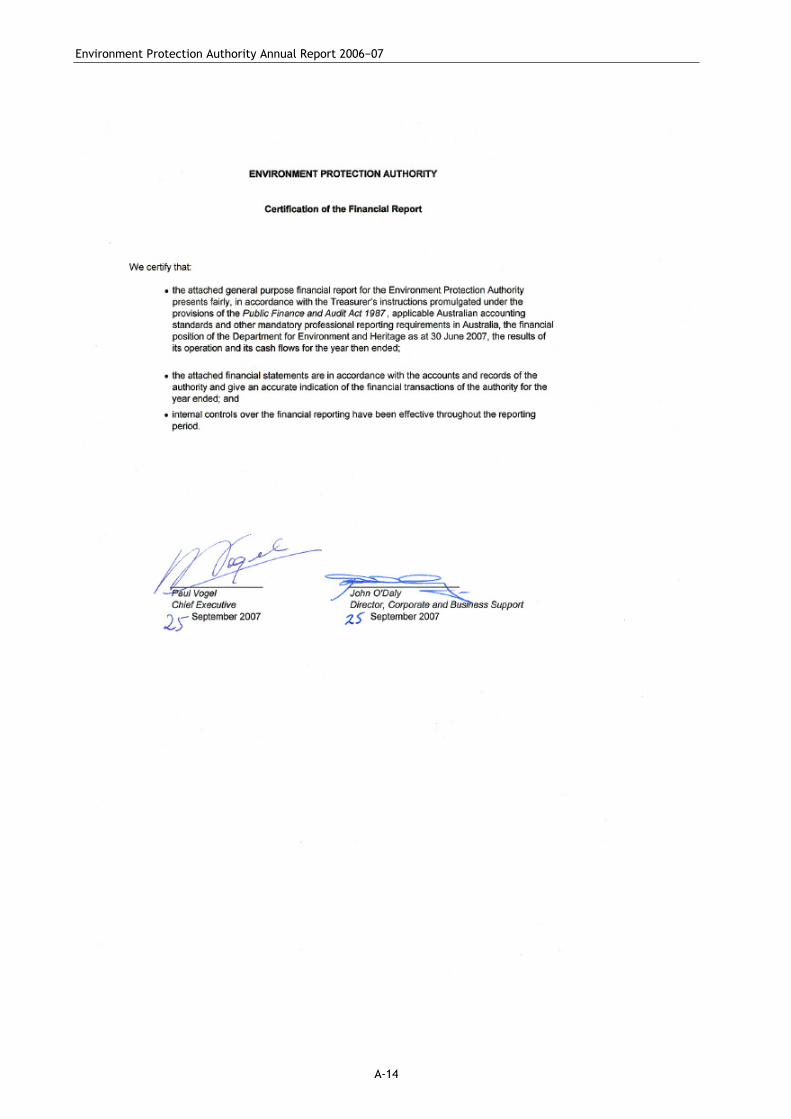
Environment Protection Authority Annual Report 2006−07
A-14
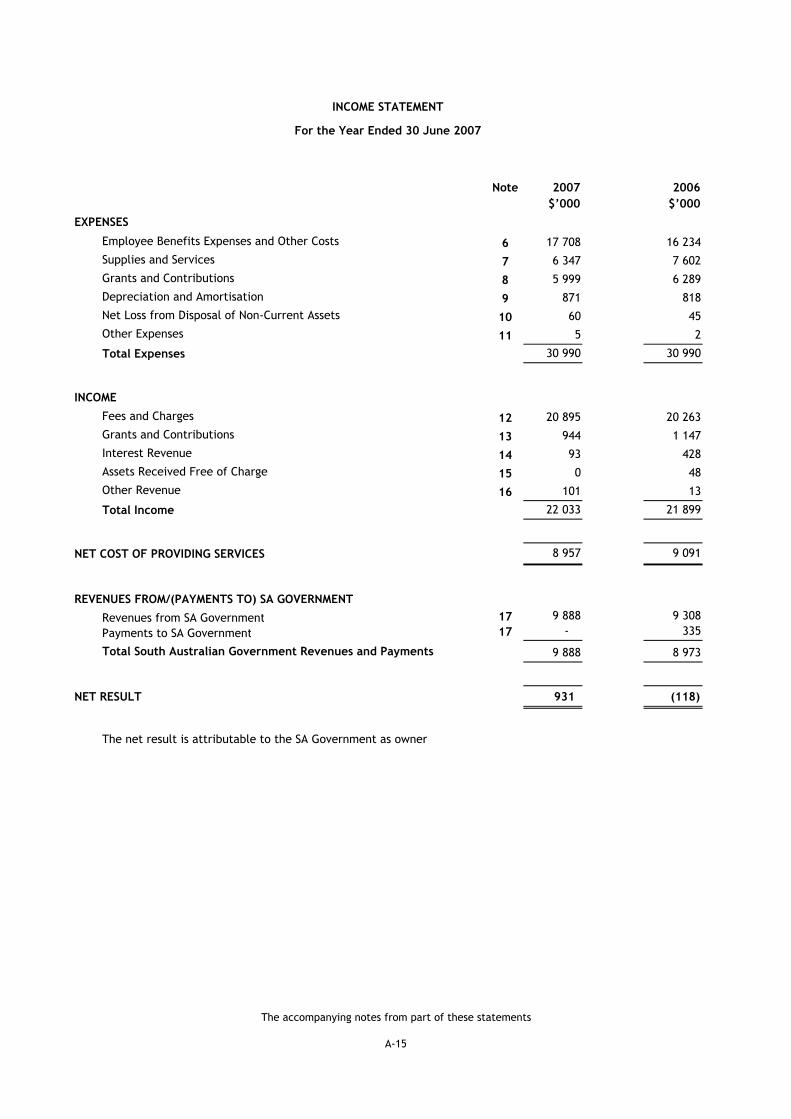
Note 2007 2006$’000 $’000
Employee Benefits Expenses and Other Costs 6 17 708 Notes'!A222 16 234Supplies and Services 7 6 347 7 602Grants and Contributions 8 5 999 Notes'!A433 6 289Depreciation and Amortisation 9 871 Notes'!A471 818Net Loss from Disposal of Non-Current Assets 10 60 Notes'!A495 45Other Expenses 11 5 Notes'!A537 2
Total Expenses 30 990 30 990
INCOME
Fees and Charges 12 20 895 Notes'!A552 20 263Grants and Contributions 13 944 Notes'!A660 1 147Interest Revenue 14 93 Notes'!A729 428Assets Received Free of Charge 15 0 Notes'!A743 48Other Revenue 16 101 Notes'!A755 13
Total Income 22 033 21 899
NET COST OF PROVIDING SERVICES 8 957 18 9 091
REVENUES FROM/(PAYMENTS TO) SA GOVERNMENT
Revenues from SA Government 17 9 888 Notes'!A796 9 308Payments to SA Government 17 - Notes'!A796 335
Total South Australian Government Revenues and Payments 9 888 8 973
NET RESULT 931 (118)
The net result is attributable to the SA Government as owner
INCOME STATEMENT
For the Year Ended 30 June 2007
EXPENSES
The accompanying notes from part of these statements
A-15

Note 2007 2006$’000 $’000
CURRENT ASSETSCash and Cash Equivalents 18 7 429 Notes'!A944 6 005Receivables 19 1 362 Notes'!A959 1 080Other Current Assets 21 69 Notes'!A103 44
Total Current Assets 8 860 7 129
NON-CURRENT ASSETSReceivables 19 15 Notes'!A994 15Financial Assets 20 5 Notes'!A102 5Property, Plant and Equipment 22 2 733 Notes'!A104 3 199Intangible Assets 23 721 695
Total Non-Current Assets 3 474 3 914
TOTAL ASSETS 12 334 11 043
CURRENT LIABILITIESPayables 24 1 096 Notes'!A114 1 581Employee Benefits 25 1 513 Notes'!A121 1 458Provisions 26 28 25Other Current Liabilities 27 299 Notes'!A127 146
Total Current Liabilities 2 936 3 210
NON-CURRENT LIABILITIESPayables 24 375 Notes'!A117 333Employee Benefits 25 3 525 Notes'!A123 2 942Provisions 26 77 69
Total Non-Current Liabilities 3 977 3 344
TOTAL LIABILITIES 6 913 6 554
NET ASSETS 5 421 4 489
EQUITYAsset Revaluation Reserve 28 1 221 Notes'!A131 1 221Retained Earnings 28 4 200 Notes'!A131 3 268
TOTAL EQUITY 5 421 4 489
The Total Equity is Attributable to the SA Government as Owner
Notes'!A1384Commitments 31 Notes'!A1391Contingent Assets and Liabilities 32 Notes'!A1406
Variance
BALANCE SHEET
As at 30 June 2007
The accompanying notes form part of these statements
A-16
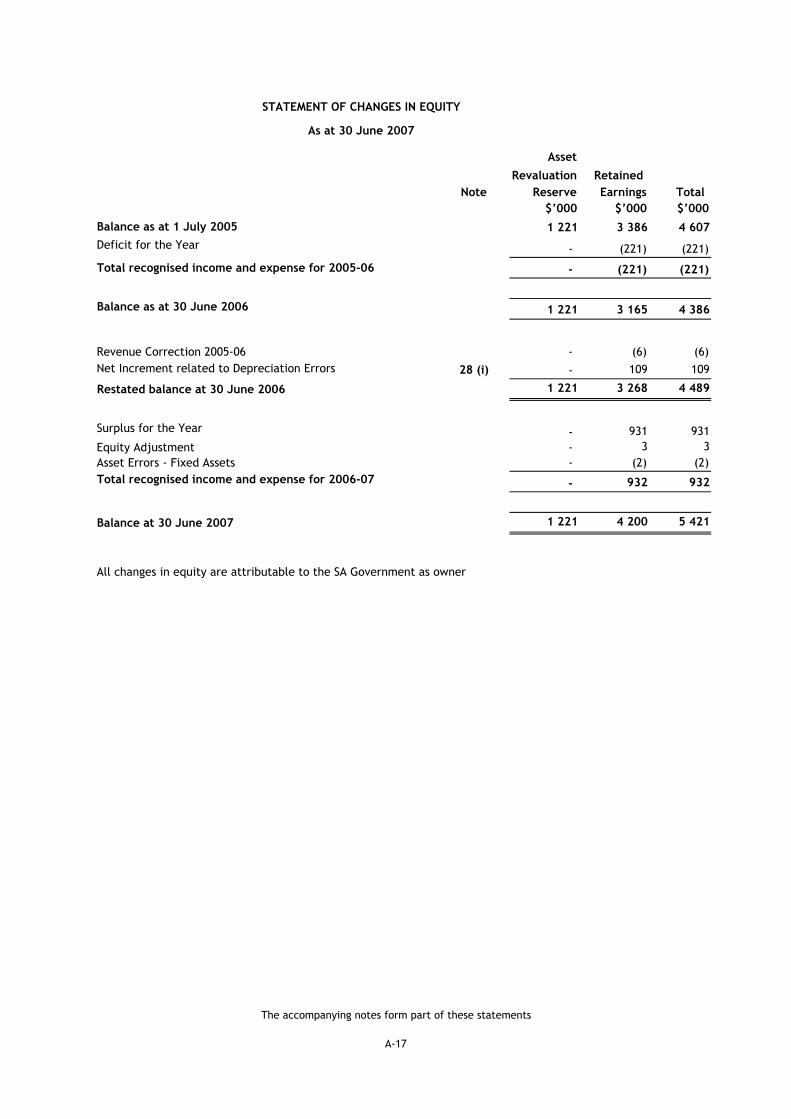
Asset
Revaluation Retained Note Reserve Earnings Total
$’000 $’000 $’000Balance as at 1 July 2005 1 221 3 386 4 607Deficit for the Year - (221) (221)
Total recognised income and expense for 2005-06 - (221) (221)
Balance as at 30 June 2006 1 221 3 165 4 386
Revenue Correction 2005-06 - (6) (6) Net Increment related to Depreciation Errors 28 (i) - 109 109
Restated balance at 30 June 2006 1 221 3 268 4 489
Surplus for the Year - 931 931Equity Adjustment - 3 3Asset Errors - Fixed Assets - (2) (2) Total recognised income and expense for 2006-07 - 932 932
Balance at 30 June 2007 1 221 4 200 5 421
-
STATEMENT OF CHANGES IN EQUITY
As at 30 June 2007
All changes in equity are attributable to the SA Government as owner
The accompanying notes form part of these statements
A-17
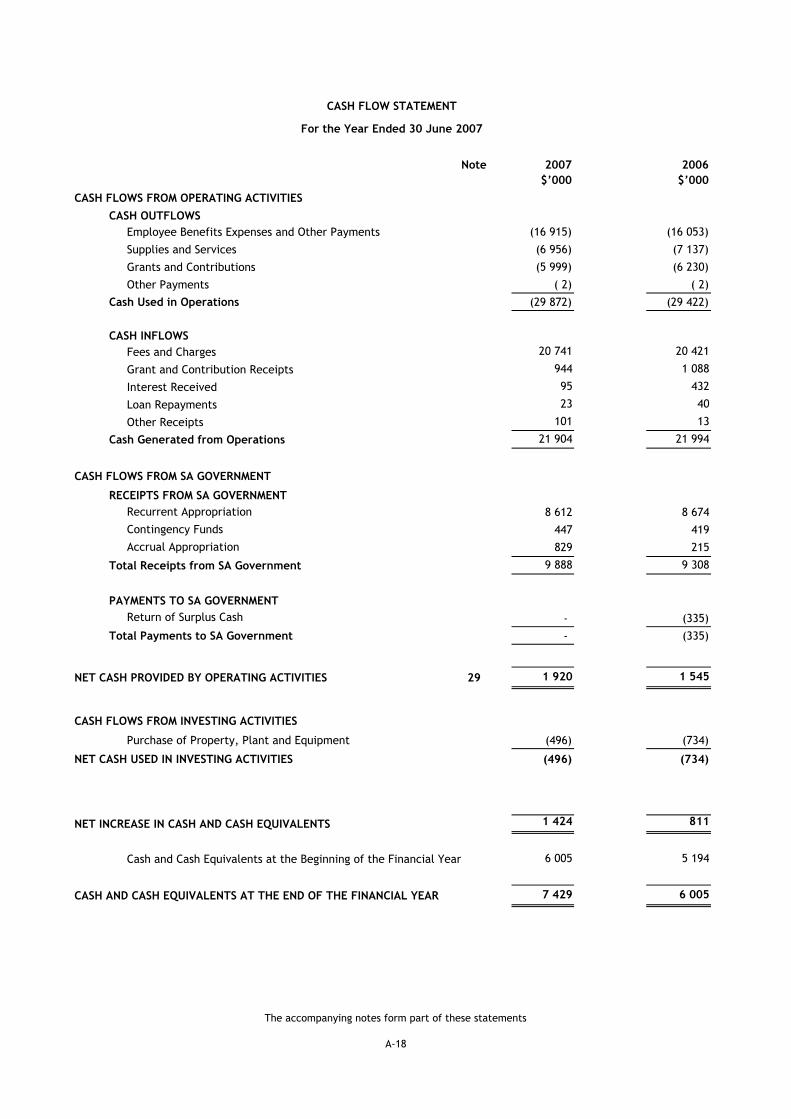
Note 2007 2006$’000 $’000
CASH FLOWS FROM OPERATING ACTIVITIESCASH OUTFLOWS
Employee Benefits Expenses and Other Payments (16 915) (16 053)
Supplies and Services (6 956) (7 137)
Grants and Contributions (5 999) (6 230)
Other Payments ( 2) ( 2)
Cash Used in Operations (29 872) (29 422)
CASH INFLOWSFees and Charges 20 741 20 421
Grant and Contribution Receipts 944 1 088
Interest Received 95 432
Loan Repayments 23 40
Other Receipts 101 13
Cash Generated from Operations 21 904 21 994
CASH FLOWS FROM SA GOVERNMENT
RECEIPTS FROM SA GOVERNMENT Recurrent Appropriation 8 612 8 674Contingency Funds 447 419Accrual Appropriation 829 215
Total Receipts from SA Government 9 888 9 308
PAYMENTS TO SA GOVERNMENT Return of Surplus Cash - (335)
Total Payments to SA Government - (335)
NET CASH PROVIDED BY OPERATING ACTIVITIES 29 1 920 Notes'!A1361 1 545
CASH FLOWS FROM INVESTING ACTIVITIES
Purchase of Property, Plant and Equipment (496) (734)
NET CASH USED IN INVESTING ACTIVITIES (496) (734)
NET INCREASE IN CASH AND CASH EQUIVALENTS 1 424 811
Cash and Cash Equivalents at the Beginning of the Financial Year 6 005 5 194
CASH AND CASH EQUIVALENTS AT THE END OF THE FINANCIAL YEAR 7 429 Notes'!A1361 6 005
CASH FLOW STATEMENT
For the Year Ended 30 June 2007
The accompanying notes form part of these statements
A-18
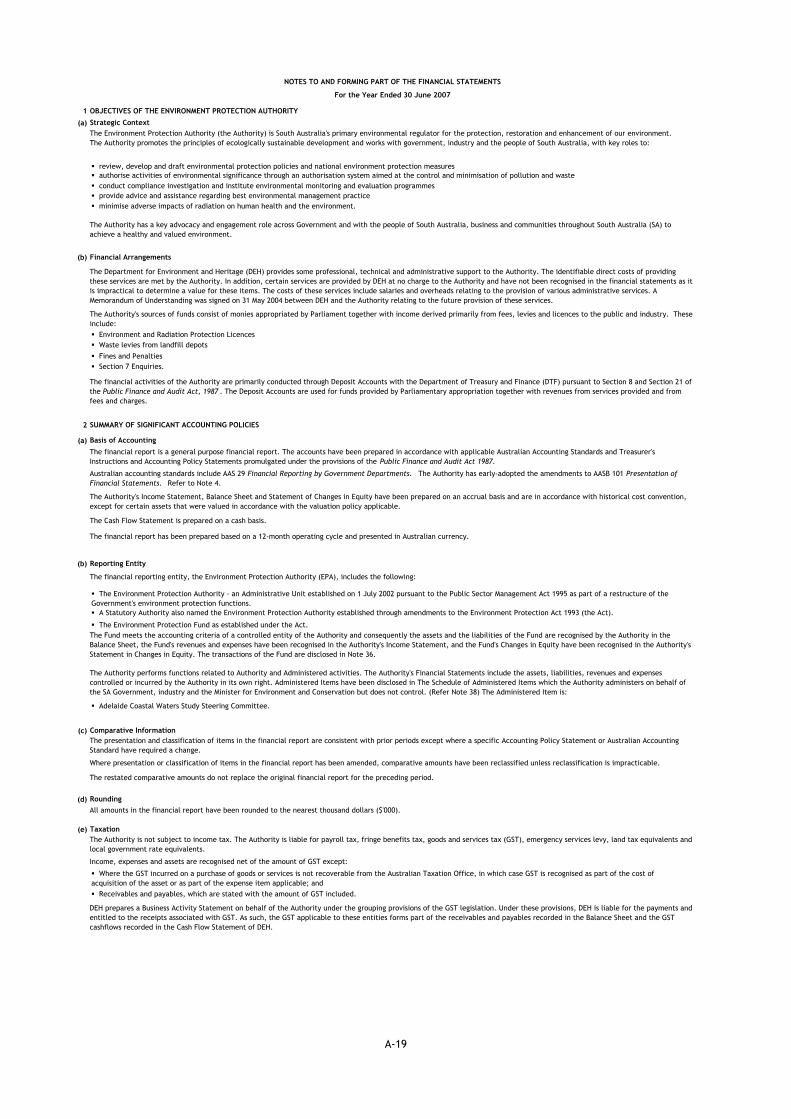
1 OBJECTIVES OF THE ENVIRONMENT PROTECTION AUTHORITY
(a)
(b)
2
(a)
(b)
(c)
(d)
(e)
Financial Arrangements
The Authority is not subject to income tax. The Authority is liable for payroll tax, fringe benefits tax, goods and services tax (GST), emergency services levy, land tax equivalents and local government rate equivalents.
Receivables and payables, which are stated with the amount of GST included.
Income, expenses and assets are recognised net of the amount of GST except:
The Environment Protection Fund as established under the Act.
DEH prepares a Business Activity Statement on behalf of the Authority under the grouping provisions of the GST legislation. Under these provisions, DEH is liable for the payments and entitled to the receipts associated with GST. As such, the GST applicable to these entities forms part of the receivables and payables recorded in the Balance Sheet and the GST cashflows recorded in the Cash Flow Statement of DEH.
Where presentation or classification of items in the financial report has been amended, comparative amounts have been reclassified unless reclassification is impracticable.
The restated comparative amounts do not replace the original financial report for the preceding period.
Adelaide Coastal Waters Study Steering Committee.
Comparative Information
Waste levies from landfill depots
The Authority's Income Statement, Balance Sheet and Statement of Changes in Equity have been prepared on an accrual basis and are in accordance with historical cost convention, except for certain assets that were valued in accordance with the valuation policy applicable.
The financial activities of the Authority are primarily conducted through Deposit Accounts with the Department of Treasury and Finance (DTF) pursuant to Section 8 and Section 21 of the Public Finance and Audit Act, 1987 . The Deposit Accounts are used for funds provided by Parliamentary appropriation together with revenues from services provided and from fees and charges.
Basis of Accounting
Australian accounting standards include AAS 29 Financial Reporting by Government Departments. The Authority has early-adopted the amendments to AASB 101 Presentation of Financial Statements. Refer to Note 4.
The Cash Flow Statement is prepared on a cash basis.
SUMMARY OF SIGNIFICANT ACCOUNTING POLICIES
The financial report has been prepared based on a 12-month operating cycle and presented in Australian currency.
Rounding
Taxation
All amounts in the financial report have been rounded to the nearest thousand dollars ($'000).
The presentation and classification of items in the financial report are consistent with prior periods except where a specific Accounting Policy Statement or Australian Accounting Standard have required a change.
The Environment Protection Authority - an Administrative Unit established on 1 July 2002 pursuant to the Public Sector Management Act 1995 as part of a restructure of the Government's environment protection functions.
The Authority performs functions related to Authority and Administered activities. The Authority's Financial Statements include the assets, liabilities, revenues and expenses controlled or incurred by the Authority in its own right. Administered Items have been disclosed in The Schedule of Administered Items which the Authority administers on behalf of the SA Government, industry and the Minister for Environment and Conservation but does not control. (Refer Note 38) The Administered Item is:
minimise adverse impacts of radiation on human health and the environment.
review, develop and draft environmental protection policies and national environment protection measures
The Fund meets the accounting criteria of a controlled entity of the Authority and consequently the assets and the liabilities of the Fund are recognised by the Authority in the Balance Sheet, the Fund's revenues and expenses have been recognised in the Authority's Income Statement, and the Fund's Changes in Equity have been recognised in the Authority's Statement in Changes in Equity. The transactions of the Fund are disclosed in Note 36.
Reporting Entity
The financial reporting entity, the Environment Protection Authority (EPA), includes the following:
A Statutory Authority also named the Environment Protection Authority established through amendments to the Environment Protection Act 1993 (the Act).
NOTES TO AND FORMING PART OF THE FINANCIAL STATEMENTS
For the Year Ended 30 June 2007
The Environment Protection Authority (the Authority) is South Australia's primary environmental regulator for the protection, restoration and enhancement of our environment. The Authority promotes the principles of ecologically sustainable development and works with government, industry and the people of South Australia, with key roles to:
Strategic Context
authorise activities of environmental significance through an authorisation system aimed at the control and minimisation of pollution and waste
The financial report is a general purpose financial report. The accounts have been prepared in accordance with applicable Australian Accounting Standards and Treasurer's Instructions and Accounting Policy Statements promulgated under the provisions of the Public Finance and Audit Act 1987.
The Department for Environment and Heritage (DEH) provides some professional, technical and administrative support to the Authority. The identifiable direct costs of providing these services are met by the Authority. In addition, certain services are provided by DEH at no charge to the Authority and have not been recognised in the financial statements as it is impractical to determine a value for these items. The costs of these services include salaries and overheads relating to the provision of various administrative services. A Memorandum of Understanding was signed on 31 May 2004 between DEH and the Authority relating to the future provision of these services.
Fines and Penalties
conduct compliance investigation and institute environmental monitoring and evaluation programmes provide advice and assistance regarding best environmental management practice
The Authority has a key advocacy and engagement role across Government and with the people of South Australia, business and communities throughout South Australia (SA) to achieve a healthy and valued environment.
Section 7 Enquiries.
The Authority's sources of funds consist of monies appropriated by Parliament together with income derived primarily from fees, levies and licences to the public and industry. These include:
Environment and Radiation Protection Licences
Where the GST incurred on a purchase of goods or services is not recoverable from the Australian Taxation Office, in which case GST is recognised as part of the cost of acquisition of the asset or as part of the expense item applicable; and
A-19

NOTES TO AND FORMING PART OF THE FINANCIAL STATEMENTS
For the Year Ended 30 June 2007
(f)
(g)
(h)
(i)
(j)
(k)
For contributions payable, the contribution will be recognised as a liability and expense when the entity has a present obligation to pay the contribution and the expense recognition criteria are met.
Income and expenses have been classified according to their nature in accordance with Accounting Policy Framework II General Purpose Financial Reporting Framework paragraph APS 3.5 and have not been offset unless required or permitted by a specific accounting standard, or where offsetting reflects the substance of the transaction or event.
Income and expense are recognised to the extent that it is probable that the flow of economic benefits to or from the Authority will occur and can be reliably measured.
Income and Expenses
Revenues from/payments to SA Government
The notes accompanying the financial statements disclose revenues, expenses, financial assets and financial liabilities where the counterparty/transaction is with an entity within the SA Government as at the reporting date.
The following are specific recognition criteria:
Generally the Authority has obtained control or the right to receive for:
Contributions with conditional stipulations - this will be when the enforceable stipulations specified in the agreement occur or are satisfied; that is income would be recognised for contributions received or receivable under the agreement.
Contributions with unconditional stipulations - this will be when the agreement becomes enforceable ie the earlier of when the receiving entity has formally been advised that the contribution (eg grant application) has been approved; agreement/contract is executed; and /or the contribution is received.
Assets held for sale are separately disclosed and measured at the lower of carrying amount and fair value less cost to sell.
Payments to the SA Government include the return of surplus cash pursuant to the cash alignment policy, taxation revenues and expiation fees received on behalf of the government and paid directly to the Department of Treasury and Finance consolidated account.
Resources received/provided free of charge are recorded as revenue and expenditure in the Income Statement at their fair value in accordance with the Accounting Policy Framework III Asset Accounting Framework paragraph APS 2.12. Resources provided free of charge are recorded in the expense line items to which they relate.
Disposal of Non Current Assets
Cash equivalents are comprised of cash held in the accrual appropriation account with DTF.
Cash and cash equivalents includes cash on hand, deposits held at call and other short-term highly liquid investments with maturities of three months or less that are readily converted to cash and are used in the cash management function on a day-to-day basis.
Income from the disposal of non current assets is recognised when control of the asset has passed to the buyer and is determined by comparing proceeds with carrying amount. When revalued assets are sold, the revaluation increments are transferred to retained earnings in accordance with Accounting Policy Framework III Asset Accounting Framework paragraph APS 3.11.
Contributions are recognised as an asset and income when the Authority obtains control of the contributions or obtains the right to receive the contributions and the income recognition criteria are met (ie the amount can be reliably measured and the flow of resources is probable).
Assets are initially recorded at cost or at the value of any liabilities assumed, plus any incidental cost involved with the acquisition. Where assets are acquired at no value or minimal value, they are recorded at their fair value in the Balance Sheet. If however, the assets are acquired at no or nominal value as part of a restructuring of administrative arrangements then the assets are recorded at the value recorded by the transferor prior to transfer.
Assets Deemed to be at Fair Value
Where asset and liability line items combine amounts expected to be realised within 12 months and more than 12 months, the Authority has separately disclosed the amounts expected to be recovered or settled after more than 12 months.
In accordance with Accounting Policy Framework (APF) III Asset Accounting Framework paragraph APS 2.15 and APS 7.2 all non-current tangible assets with a fair value of $5000 or greater are capitalised.
Other Financial Assets
Receivables include amounts receivable from trade, prepayments and other accruals.
In October 2003 the Government introduced a policy with respect to aligning agency cash balances with appropriation and expenditure authority. In the current reporting period the Authority did not return any monies to the DTF Consolidated Account (2006 $0.335 million).
For those classes of non-current assets where an independent revaluation has not been undertaken, as the criteria within APF III Asset Accounting Framework have not been met, these classes of non-current assets are deemed to be at fair value.
For all classes of assets, assets acquired within the last three years are reported at cost - deemed fair value.
Asset classes that did not satisfy the criteria and are therefore deemed to be at fair value include: Moveable Vehicles Computing Equipment Application Software Furniture and Fittings Plant and Equipment.
Non Current Asset Acquisition and Recognition
Current and Non-Current Classification
Revenues from fees and charges are derived from the provision of goods and services to other SA government agencies and to the public. This revenue is recognised upon delivery of the service to the clients.
The Authority measures financial assets and debt at historical cost in accordance with Accounting Policy Framework IV Financial Asset and Liability Framework paragraph APS 6.1.
Fees and Charges
Collectability of trade receivables is reviewed on an ongoing basis. Debts that are known to be uncollectible are written off when identified. An allowance for doubtful debts is raised when there is objective evidence that the Authority will not be able to collect the debt.
Receivables
Transactions with SA Government entities below the threshold of $100,000 have been included with the non-government transactions, classified according to their nature.
Resources received/provided free of charge
Contributions received/paid
Appropriations for program funding are recognised as revenues when the Authority obtains control over the funding. Control over appropriations is normally obtained upon receipt. Appropriation receipts are accounted for in accordance with Treasurer's Instruction 3 - Appropriation.
Trade receivables arise in the normal course of selling goods and services to other agencies and to the public. Trade receivables are generally receivable within 30 days after the issue of an invoice or the goods/services have been provided under a contractual arrangement.
Assets and liabilities are classified as either current or non-current in nature. The Authority has a clearly identifiable operating cycle of 12 months. Assets and liabilities that are sold, consumed or realised as part of the normal operating cycle even when they are not expected to be realised within 12 months after the reporting date have been classified as current assets or current liabilities. All other assets and liabilities have been classified as non-current.
Cash and cash equivalents
Cash is measured at nominal value.
A-20
NOTES TO AND FORMING PART OF THE FINANCIAL STATEMENTS
For the Year Ended 30 June 2007
(l)
(m)
(n) Depreciation and Amortisation of Non-Current Assets
Class of Asset
Computing Equipment 4-10 years Application Software 3-15 years Infrastructure 10-50 years Plant and Equipment 3-25 years Moveable Vehicles 10-25 years Furniture and Fittings 10-15 years Buildings and Improvements 30-50 years Other 7-10 years
(o)
(p) Payables
(q) Provisions for Employee Benefits
3
For revalued assets, an impairment loss is offset against the asset revaluation reserve.
In accordance with Accounting Policy Framework III Asset Accounting Framework :
all non-current tangible assets are valued at written down current cost (a proxy for fair value); and
Impairment
Any revaluation increment is credited to the asset revaluation reserve, except to the extent that it reversed a revaluation decrement of the same asset class previously recognised in the Income Statement, in which case the increase is recognised in the Income Statement.
Revaluation of Non Current Assets
revaluation of non-current assets or group of assets is only performed when its fair value at the time of acquisition is greater than $1 million and the estimated useful life is greater than three years.
The Authority has significant non-interest bearing assets (cash on hand and on call and receivables) and liabilities (payables) and interest bearing assets (held to maturity investments) and liabilities (borrowings from the SA Government). The Authority's exposure to market risk and cash flow interest risk is minimal.
The Authority has no significant concentration of credit risk. The Authority has policies and procedures in place to ensure that transactions occur with customers with appropriate credit history.
FINANCIAL RISK MANAGEMENT
In relation to liquidity/funding risk, the continued existence of the Authority in its present form, and with its present programs, is dependent on government policy and on continuing appropriations by Parliament for the Authority's administration and programs.
The liability for long service leave is leave recognised after an employee has completed 6.5 years of service as advised in Accounting Policy Framework IV Financial Assets and Liabilities . An actuarial assessment of long service leave undertaken by the Authority of Treasury and Finance based on a significant sample of employees throughout the South Australian public sector determined that the liability measured using the short hand method was not materially different from the liability measured using the present value of future payments. This calculation is consistent with the Authority's experience of employee retention and leave taken.
All payables are measured at their nominal amount and are normally settled within 30 days from the date of the invoice or the date the invoice is first received, in accordance with TI 11 Payment of Creditor Accounts .
Employment on-costs include superannuation contributions and payroll tax with respect to outstanding liabilities for salaries and wages, long service leave and annual leave.
The annual leave liability is expected to be payable within 12 months and is measured at the undiscounted amount expected to be paid. In the unusual event where salary and wages and annual leave are payable later than 12 months, the liability will be measured at present value.
Liabilities for salaries and wages are measured as the amount unpaid at the reporting date at remuneration rates current at reporting date.
These benefits accrue for employees as a result of services provided up to the reporting date that remain unpaid. Long-term employee benefits are measured at present value and short-term employee benefits are measured at nominal amounts.
Wages, salaries, annual leave and sick leave
The Authority makes contributions to several state government and externally managed superannuation schemes. These contributions are treated as an expense when they occur. There is no liability for payments to beneficiaries as they have been assumed by the respective superannuation schemes. The only liability outstanding at balance date relates to any contributions due but not yet paid to the South Australian Superannuation Board.
Depreciation/amortisation is calculated on a straight line basis over the estimated useful life of the following classes of assets as follows:
Payables include creditors, accrued expenses and employment on-costs.
Accrued expenses represent goods and services provided by other parties during the period that are unpaid at the end of the reporting period and where an invoice has not been received.
Creditors represent the amounts owing for goods and services received prior to the end of the reporting period that are unpaid at the end of the reporting period. Creditors include all unpaid invoices received relating to the normal operations of the Authority.
The acquisition of or internal development of software is capitalised only when the expenditure meets the definition criteria (identifiability, control and the existence of future economic benefits) and recognition criteria (probability of future economic benefits and cost can be reliably measured) and when the amount of expenditure is greater than or equal to $5000 in accordance with Accounting Policy Framework III Asset Accounting Framework APS 2.15.
Subsequent expenditure on intangible assets has not been capitalised. This is because the Authority has been unable to attribute this expenditure to the intangible asset rather than to the Authority as a whole.
The useful lives of intangible assets are assessed to be either finite or indefinite. The Authority only has intangible assets with finite lives. The amortisation period and the amortisation method for intangible assets is reviewed on an annual basis.
Useful Life
No provision has been made for sick leave as all sick leave is non-vesting and the average sick leave taken in future years by employees is estimated to be less than the annual entitlement of sick leave.Long service leave
Changes in the expected useful life or the expected pattern of consumption of future economic benefits embodied in the asset are accounted for prospectively by change in the time period or method, as appropriate, which is a change in accounting estimate.
An intangible asset is an identifiable non-monetary asset without physical substance. Intangible assets are measured at cost. Following initial recognition, intangible assets are carried at cost less any accumulated amortisation and any accumulated impairment losses.
Intangible Assets
Any revaluation decrement is recognised in the Income Statement, except to the extent that it offsets a previous revaluation increase for the same asset class, in which case the decrease is debited directly to the asset revaluation reserve to the extent of the credit balance existing in revaluation reserve for that asset class.
All non-current assets, having a limited useful life, are systematically depreciated/amortised over their useful lives in a manner that reflects the consumptions of their service potential. Amortisation is used in relation to intangible assets such as software, while depreciation is applied to tangible assets such as property, plant and equipment.
The useful lives of all major assets held by the Authority are reassessed on an annual basis.
Any accumulated depreciation as at the revaluation date is eliminated against the gross carrying amounts of the assets and the net amounts restated to the revalued amounts of the assets.Upon disposal or derecognition, any revaluation reserve relating to the asset is transferred to retained earnings.
All non current tangible and intangible assets are tested for indication of impairment at each reporting date. Where there is an indication of impairment, the recoverable amount is estimated. An amount by which the asset's carrying amount exceeds the recoverable amount is recorded as an impairment loss.
The Authority undertook a professional valuation in 2004-05 for Property, Plant & Equipment.
All research and development costs that do not meet the capitalisation criteria outlined in AASB 138 are expensed.
A-21

NOTES TO AND FORMING PART OF THE FINANCIAL STATEMENTS
For the Year Ended 30 June 2007
4
5 PROGRAMS OF THE AUTHORITY
2007 20066 EMPLOYEE BENEFITS EXPENSES AND OTHER COSTS $'000 $’000
Salaries and Wages (i) 12 694 11 699Annual Leave 1 225 1 147Long Service Leave 653 458Employment On Costs - Superannuation 1 726 1 523Employment On Costs - Other 941 850Sitting Fees Boards and Committees 113 117
17 352 15 794
Other Employment CostsOccupational Health, Safety and Welfare 41 80 Other On-costs 108 168 Staff Development 207 192
356 440
Total Employee Benefits and Other Costs 17 708 16 234
(i) Targeted Voluntary Separation Packages (TVSPs)
Employee RemunerationThe number of employees whose remuneration received or receivable falls within the following bands:
2007 2006$100 000 – 109 999 8 3 $110 000 – 119 999 2 3 $120 000 – 129 999 1 1 $130 000 – 139 999 1 2 $140 000 – 149 999 2 - $230 000 – 239 999 - 1 $240 000 – 249 999 1 -
Total Number of Employees 15 10
Number of Employees at Reporting Date
2007 20067 SUPPLIES AND SERVICES $'000 $’000
Accommodation and Property Management Services 1 874 1 762Travel and Accommodation 149 203Information Technology & Communication Expenses 698 1 083Contractors 459 597Consultant Fees 31 95Fee for Service 745 1 130Minor works, maintenance & equipment 456 564Vehicles 388 338Transportation 99 96General Administration 414 702Scientific and Technical Services 781 824Other 253 208
6 347 7 602
(i) The number and amount of Consultant Fees fell within the following bandwidths: 2007 2006No. $'000 No. $’000
Below $10 000 1 1 8 31Between $10 000 and $50 000 1 30 4 64Above $50 000 - - - - Total number and amount of Consultant Fees 2 31 12 95
2007 2006Supplies and Services provided by entities within the SA Government $'000 $’000Accommodation and Property Management Services 1 598 1 466
1 598 1 466
2007 20068 GRANTS AND CONTRIBUTIONS EXPENSE $'000 $’000
Private Industry & Community Organisations and Associations 164 347State Government (i) 5 682 5 732Individuals 38 84Other 115 67Commonwealth Government Grant Refund - 59
5 999 6 289
The table includes all employees who received remuneration of $100 000 or more during the year. Remuneration of employees reflects all costs of employment including salaries and wages, superannuation contributions, fringe benefits tax and any other salary sacrifice benefits. The total remuneration received by these employees for the year was $1.836 million. (2006: $1.293 million)
During the year a total of Nil (2006: 1) employees of the Authority accepted packages in line with the State Government’s policy.
The Authority is funded by appropriation for the provision of environment protection, policy and regulatory services. In line with the objective of establishing the Authority to focus on environment protection activities the Authority conducts its services through a single program, Environment and Radiation Protection. The purpose of this program is to achieve a clean, healthy and valued environment that supports social and economic prosperity for all South Australians.
The TVSP component of termination payments totalled Nil (2006: $136 000). These costs were reimbursed by the Department of Treasury and Finance.
TVSP amounts paid by the Authority are included within the salaries and wages expense.
Except for the amendments to AASB 101 Presentation of Financial Statements, which the Authority has early adopted, Australian Accounting Standards and Interpretations that have recently been issued or amended, but are not yet effective, have not been adopted by the Authority for the reporting period ending 30 June, 2007. The Authority has assessed the impact of the new and amended standards and interpretations and considers there will be no impact on the accounting policies for the financial report of the Authority.
The Authority had 229 employees (2006: 225) as at the reporting date.
In addition, accrued annual leave, leave loading and long service leave benefits amounting to Nil (2006: $61 000) were paid to employees who received a TVSP.
CHANGES IN ACCOUNTING POLICY
No. of Employees
A-22
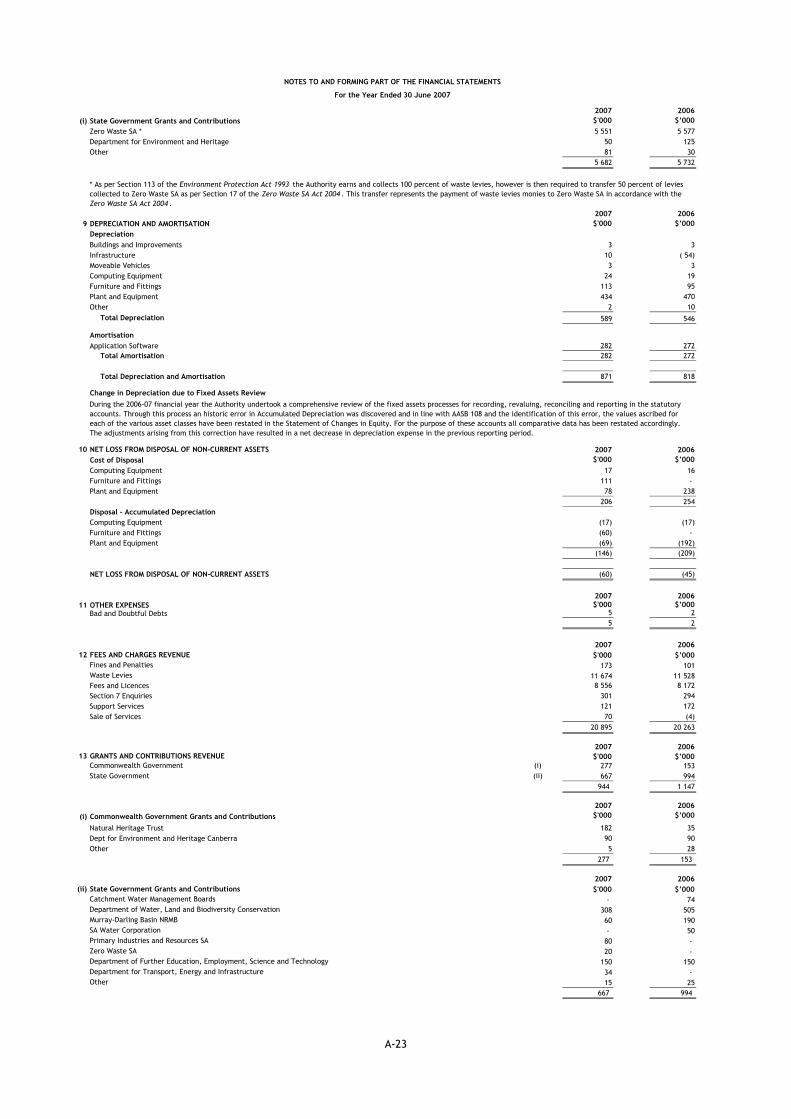
NOTES TO AND FORMING PART OF THE FINANCIAL STATEMENTS
For the Year Ended 30 June 2007
2007 2006(i) State Government Grants and Contributions $'000 $’000
Zero Waste SA * 5 551 5 577Department for Environment and Heritage 50 125Other 81 30
5 682 5 732
2007 20069 DEPRECIATION AND AMORTISATION $'000 $’000
DepreciationBuildings and Improvements 3 3Infrastructure 10 ( 54)Moveable Vehicles 3 3Computing Equipment 24 19Furniture and Fittings 113 95Plant and Equipment 434 470Other 2 10
Total Depreciation 589 546
AmortisationApplication Software 282 272
Total Amortisation 282 272
Total Depreciation and Amortisation 871 818
10 NET LOSS FROM DISPOSAL OF NON-CURRENT ASSETS 2007 2006Cost of Disposal $'000 $’000Computing Equipment 17 16Furniture and Fittings 111 - Plant and Equipment 78 238
206 254Disposal - Accumulated Depreciation $'000 $’000Computing Equipment (17) (17) Furniture and Fittings (60) - Plant and Equipment (69) (192)
(146) (209)
NET LOSS FROM DISPOSAL OF NON-CURRENT ASSETS (60) (45)
2007 200611 OTHER EXPENSES $'000 $’000
Bad and Doubtful Debts 5 2 5 2
2007 200612 FEES AND CHARGES REVENUE $'000 $’000
Fines and Penalties 173 101Waste Levies 11 674 11 528Fees and Licences 8 556 8 172Section 7 Enquiries 301 294Support Services 121 172Sale of Services 70 (4)
20 895 20 263
2007 200613 GRANTS AND CONTRIBUTIONS REVENUE $'000 $’000
Commonwealth Government (i) 277 153State Government (ii) 667 994
944 1 147
2007 2006(i) Commonwealth Government Grants and Contributions $'000 $’000
Natural Heritage Trust 182 35Dept for Environment and Heritage Canberra 90 90Other 5 28
277 153
2007 2006(ii) State Government Grants and Contributions $'000 $’000
Catchment Water Management Boards - 74Department of Water, Land and Biodiversity Conservation 308 505Murray-Darling Basin NRMB 60 190SA Water Corporation - 50Primary Industries and Resources SA 80 - Zero Waste SA 20 - Department of Further Education, Employment, Science and Technology 150 150Department for Transport, Energy and Infrastructure 34 - Other 15 25
667 994
During the 2006-07 financial year the Authority undertook a comprehensive review of the fixed assets processes for recording, revaluing, reconciling and reporting in the statutory accounts. Through this process an historic error in Accumulated Depreciation was discovered and in line with AASB 108 and the identification of this error, the values ascribed for each of the various asset classes have been restated in the Statement of Changes in Equity. For the purpose of these accounts all comparative data has been restated accordingly. The adjustments arising from this correction have resulted in a net decrease in depreciation expense in the previous reporting period.
* As per Section 113 of the Environment Protection Act 1993 the Authority earns and collects 100 percent of waste levies, however is then required to transfer 50 percent of levies collected to Zero Waste SA as per Section 17 of the Zero Waste SA Act 2004 . This transfer represents the payment of waste levies monies to Zero Waste SA in accordance with the Zero Waste SA Act 2004 .
Change in Depreciation due to Fixed Assets Review
A-23
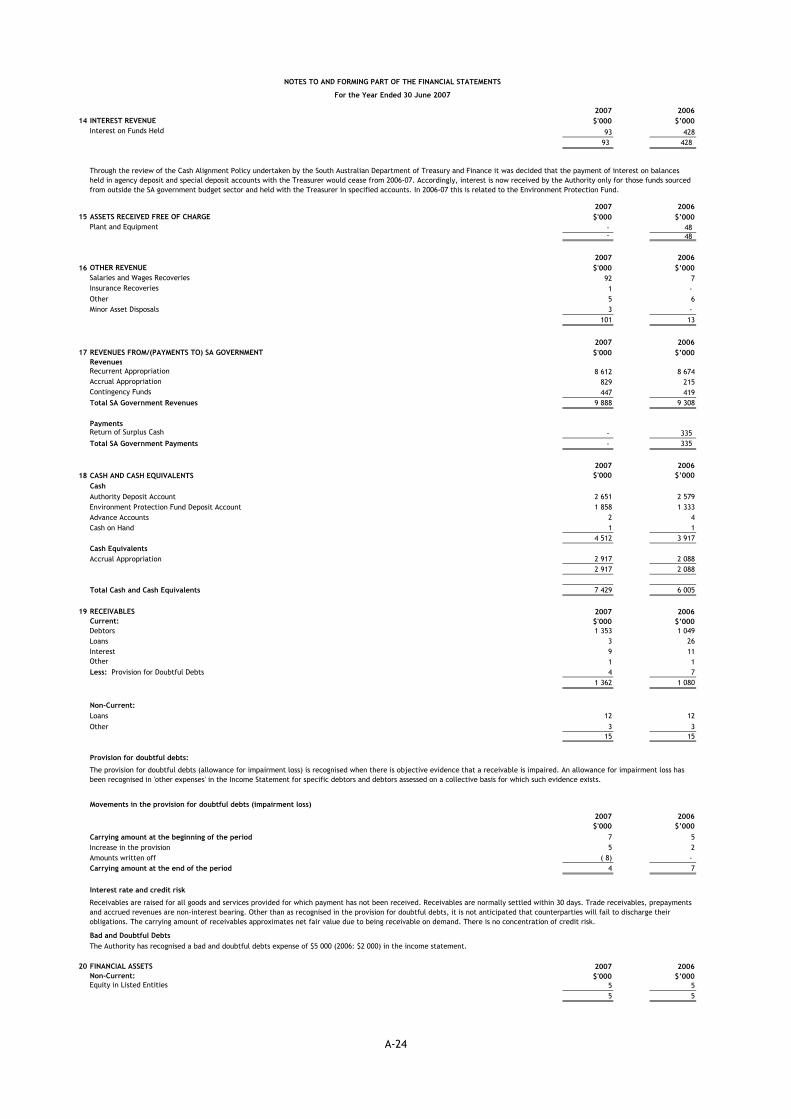
NOTES TO AND FORMING PART OF THE FINANCIAL STATEMENTS
For the Year Ended 30 June 2007
2007 200614 INTEREST REVENUE $'000 $’000
Interest on Funds Held 93 42893 428
2007 200615 ASSETS RECEIVED FREE OF CHARGE $'000 $’000
Plant and Equipment - 48 - 48
2007 200616 OTHER REVENUE $'000 $’000
Salaries and Wages Recoveries 92 7Insurance Recoveries 1 - Other 5 6Minor Asset Disposals 3 -
101 13
2007 200617 REVENUES FROM/(PAYMENTS TO) SA GOVERNMENT $'000 $’000
RevenuesRecurrent Appropriation 8 612 8 674Accrual Appropriation 829 215Contingency Funds 447 419Total SA Government Revenues 9 888 9 308
PaymentsReturn of Surplus Cash - 335 Total SA Government Payments - 335
2007 200618 CASH AND CASH EQUIVALENTS $'000 $’000
CashAuthority Deposit Account 2 651 2 579Environment Protection Fund Deposit Account 1 858 1 333Advance Accounts 2 4Cash on Hand 1 1
4 512 3 917Cash EquivalentsAccrual Appropriation 2 917 2 088
2 917 2 088
Total Cash and Cash Equivalents 7 429 6 005
19 RECEIVABLES 2007 2006Current: $'000 $’000Debtors 1 353 1 049Loans 3 26Interest 9 11Other 1 1Less: Provision for Doubtful Debts 4 7
1 362 1 080
Non-Current:Loans 12 12Other 3 3
15 15
Provision for doubtful debts:
2007 2006$'000 $’000
Carrying amount at the beginning of the period 7 5Increase in the provision 5 2Amounts written off ( 8) - Carrying amount at the end of the period 4 7
Interest rate and credit risk
Bad and Doubtful Debts
20 FINANCIAL ASSETS 2007 2006Non-Current: $'000 $’000Equity in Listed Entities 5 5
5 5
Through the review of the Cash Alignment Policy undertaken by the South Australian Department of Treasury and Finance it was decided that the payment of interest on balances held in agency deposit and special deposit accounts with the Treasurer would cease from 2006-07. Accordingly, interest is now received by the Authority only for those funds sourced from outside the SA government budget sector and held with the Treasurer in specified accounts. In 2006-07 this is related to the Environment Protection Fund.
The provision for doubtful debts (allowance for impairment loss) is recognised when there is objective evidence that a receivable is impaired. An allowance for impairment loss has been recognised in 'other expenses' in the Income Statement for specific debtors and debtors assessed on a collective basis for which such evidence exists.
Movements in the provision for doubtful debts (impairment loss)
Receivables are raised for all goods and services provided for which payment has not been received. Receivables are normally settled within 30 days. Trade receivables, prepayments and accrued revenues are non-interest bearing. Other than as recognised in the provision for doubtful debts, it is not anticipated that counterparties will fail to discharge their obligations. The carrying amount of receivables approximates net fair value due to being receivable on demand. There is no concentration of credit risk.
The Authority has recognised a bad and doubtful debts expense of $5 000 (2006: $2 000) in the income statement.
A-24
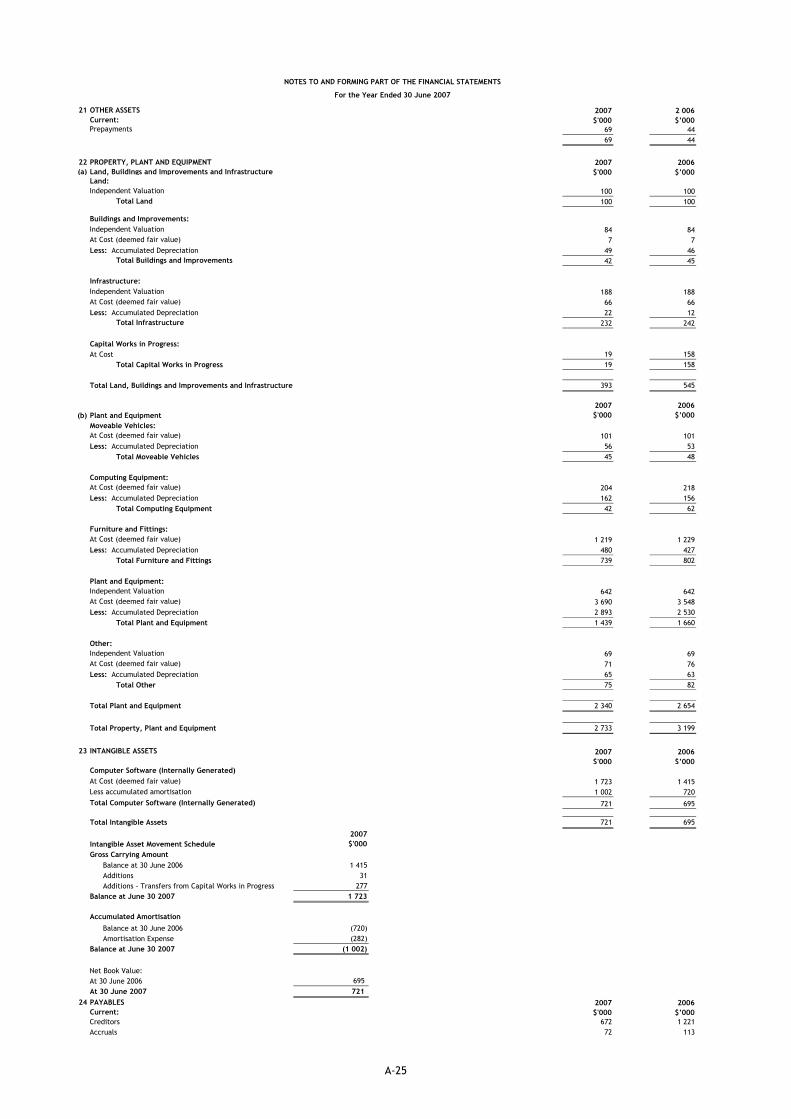
NOTES TO AND FORMING PART OF THE FINANCIAL STATEMENTS
For the Year Ended 30 June 2007
21 OTHER ASSETS 2007 2 006Current: $'000 $’000Prepayments 69 44
69 44
22 PROPERTY, PLANT AND EQUIPMENT 2007 2006(a) Land, Buildings and Improvements and Infrastructure $'000 $’000
Land:Independent Valuation 100 100
100 100
Buildings and Improvements:Independent Valuation 84 84At Cost (deemed fair value) 7 7Less: Accumulated Depreciation 49 46
42 45
Infrastructure:Independent Valuation 188 188At Cost (deemed fair value) 66 66Less: Accumulated Depreciation 22 12
232 242
Capital Works in Progress:At Cost 19 158
Total Capital Works in Progress 19 158
Total Land, Buildings and Improvements and Infrastructure 393 545
2007 2006(b) Plant and Equipment $'000 $’000
Moveable Vehicles:At Cost (deemed fair value) 101 101Less: Accumulated Depreciation 56 53
45 48
Computing Equipment:At Cost (deemed fair value) 204 218Less: Accumulated Depreciation 162 156
42 62
Furniture and Fittings:At Cost (deemed fair value) 1 219 1 229Less: Accumulated Depreciation 480 427
739 802
Plant and Equipment:Independent Valuation 642 642At Cost (deemed fair value) 3 690 3 548Less: Accumulated Depreciation 2 893 2 530
1 439 1 660
Other:Independent Valuation 69 69At Cost (deemed fair value) 71 76Less: Accumulated Depreciation 65 63
Total Other 75 82
Total Plant and Equipment 2 340 2 654
Total Property, Plant and Equipment 2 733 3 199
23 INTANGIBLE ASSETS 2007 2006$'000 $’000
Computer Software (Internally Generated)At Cost (deemed fair value) 1 723 1 415Less accumulated amortisation 1 002 720Total Computer Software (Internally Generated) 721 695
Total Intangible Assets 721 695
2007Intangible Asset Movement Schedule $'000Gross Carrying Amount Balance at 30 June 2006 1 415 Additions 31 Additions - Transfers from Capital Works in Progress 277Balance at June 30 2007 1 723
Accumulated Amortisation
Balance at 30 June 2006 (720) Amortisation Expense (282) Balance at June 30 2007 (1 002)
Net Book Value:At 30 June 2006 695 At 30 June 2007 721
24 PAYABLES 2007 2006Current: $'000 $’000Creditors 672 1 221Accruals 72 113
Total Moveable Vehicles
Total Plant and Equipment
Total Computing Equipment
Total Land
Total Buildings and Improvements
Total Infrastructure
Total Furniture and Fittings
A-25
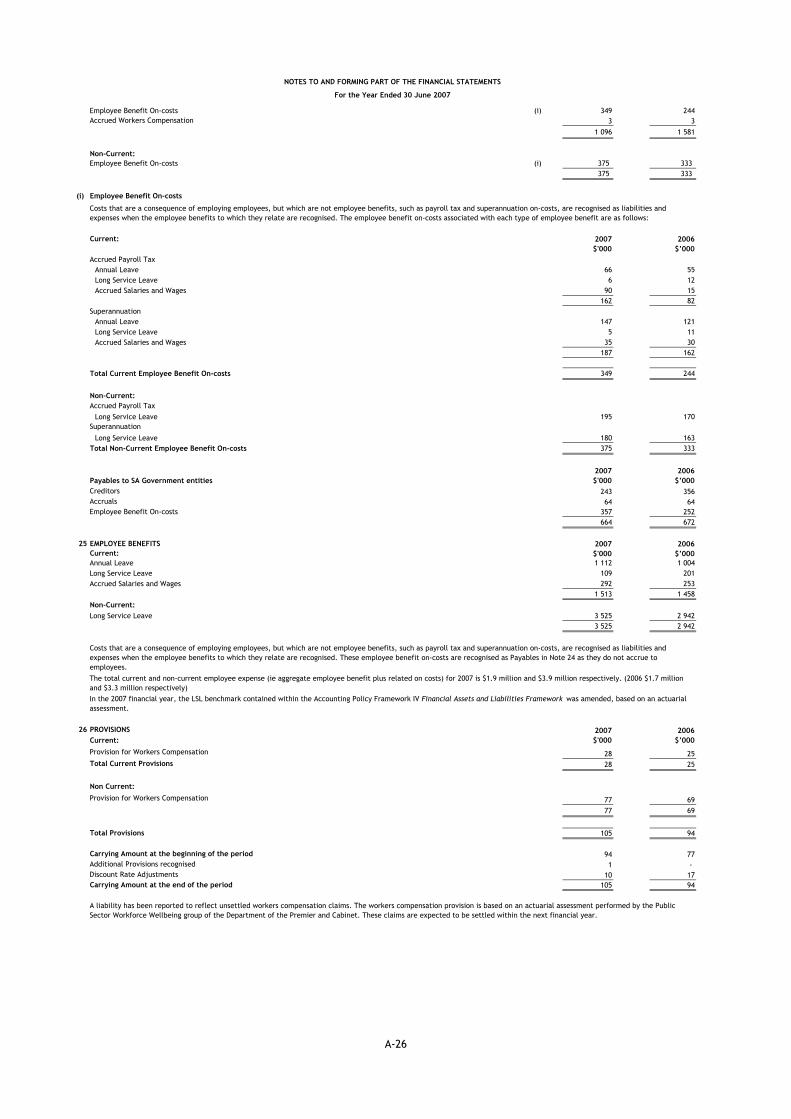
NOTES TO AND FORMING PART OF THE FINANCIAL STATEMENTS
For the Year Ended 30 June 2007
Employee Benefit On-costs (i) 349 244Accrued Workers Compensation 3 3
1 096 1 581
Non-Current:Employee Benefit On-costs (i) 375 333
375 333
(i) Employee Benefit On-costs
Current: 2007 2006$'000 $’000
Accrued Payroll TaxAnnual Leave 66 55Long Service Leave 6 12Accrued Salaries and Wages 90 15
162 82Superannuation
Annual Leave 147 121Long Service Leave 5 11Accrued Salaries and Wages 35 30
187 162
Total Current Employee Benefit On-costs 349 244
Non-Current:Accrued Payroll Tax
Long Service Leave 195 170Superannuation
Long Service Leave 180 163Total Non-Current Employee Benefit On-costs 375 333
2007 2006Payables to SA Government entities $'000 $’000Creditors 243 356Accruals 64 64Employee Benefit On-costs 357 252
664 672
25 EMPLOYEE BENEFITS 2007 2006Current: $'000 $’000Annual Leave 1 112 1 004Long Service Leave 109 201Accrued Salaries and Wages 292 253
1 513 1 458Non-Current:Long Service Leave 3 525 2 942
3 525 2 942
26 PROVISIONS 2007 2006Current: $'000 $’000
Provision for Workers Compensation 28 25Total Current Provisions 28 25
Non Current:
Provision for Workers Compensation 77 69 77 69
Total Provisions 105 94
Carrying Amount at the beginning of the period 94 77Additional Provisions recognised 1 - Discount Rate Adjustments 10 17Carrying Amount at the end of the period 105 94
In the 2007 financial year, the LSL benchmark contained within the Accounting Policy Framework IV Financial Assets and Liabilities Framework was amended, based on an actuarial assessment.
The total current and non-current employee expense (ie aggregate employee benefit plus related on costs) for 2007 is $1.9 million and $3.9 million respectively. (2006 $1.7 million and $3.3 million respectively)
Costs that are a consequence of employing employees, but which are not employee benefits, such as payroll tax and superannuation on-costs, are recognised as liabilities and expenses when the employee benefits to which they relate are recognised. These employee benefit on-costs are recognised as Payables in Note 24 as they do not accrue to employees.
A liability has been reported to reflect unsettled workers compensation claims. The workers compensation provision is based on an actuarial assessment performed by the Public Sector Workforce Wellbeing group of the Department of the Premier and Cabinet. These claims are expected to be settled within the next financial year.
Costs that are a consequence of employing employees, but which are not employee benefits, such as payroll tax and superannuation on-costs, are recognised as liabilities and expenses when the employee benefits to which they relate are recognised. The employee benefit on-costs associated with each type of employee benefit are as follows:
A-26
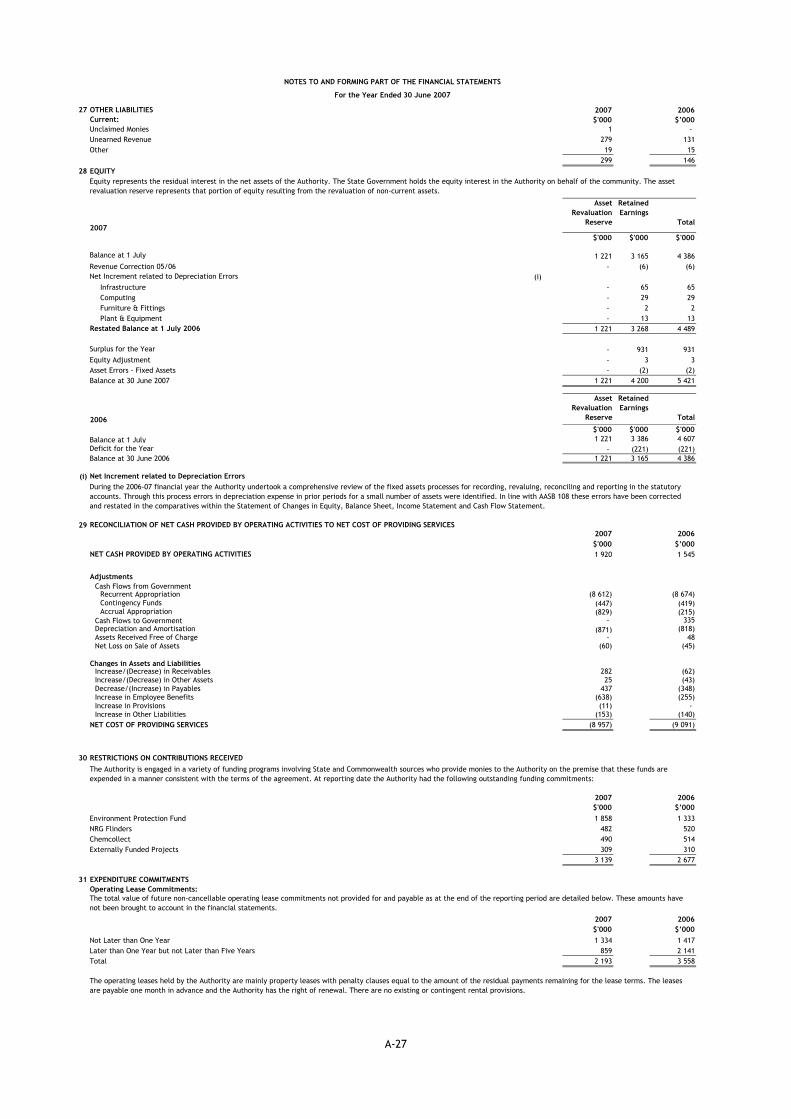
NOTES TO AND FORMING PART OF THE FINANCIAL STATEMENTS
For the Year Ended 30 June 2007
27 OTHER LIABILITIES 2007 2006Current: $'000 $’000Unclaimed Monies 1 - Unearned Revenue 279 131Other 19 15
299 14628 EQUITY
2007
Asset Revaluation
Reserve
Retained Earnings
Total
$'000 $'000 $'000
Balance at 1 July 1 221 3 165 4 386Revenue Correction 05/06 - (6) (6) Net Increment related to Depreciation Errors (i)
Infrastructure - 65 65Computing - 29 29Furniture & Fittings - 2 2Plant & Equipment - 13 13
Restated Balance at 1 July 2006 1 221 3 268 4 489
Surplus for the Year - 931 931Equity Adjustment - 3 3Asset Errors - Fixed Assets - (2) (2) Balance at 30 June 2007 1 221 4 200 5 421
2006
Asset Revaluation
Reserve
Retained Earnings
Total
$'000 $'000 $'000Balance at 1 July 1 221 3 386 4 607Deficit for the Year - (221) (221) Balance at 30 June 2006 1 221 3 165 4 386
(i) Net Increment related to Depreciation Errors
29 RECONCILIATION OF NET CASH PROVIDED BY OPERATING ACTIVITIES TO NET COST OF PROVIDING SERVICES2007 2006$'000 $’000
NET CASH PROVIDED BY OPERATING ACTIVITIES 1 920 1 545
AdjustmentsCash Flows from Government
Recurrent Appropriation (8 612) (8 674)Contingency Funds (447) (419) Accrual Appropriation (829) (215)
Cash Flows to Government - 335Depreciation and Amortisation (871) (818) Assets Received Free of Charge - 48Net Loss on Sale of Assets (60) (45)
Changes in Assets and LiabilitiesIncrease/(Decrease) in Receivables 282 (62) Increase/(Decrease) in Other Assets 25 (43) Decrease/(Increase) in Payables 437 (348) Increase in Employee Benefits (638) (255) Increase in Provisions (11) - Increase in Other Liabilities (153) (140)
NET COST OF PROVIDING SERVICES (8 957) (9 091)
- 0
(8,957) (9,091) 30 RESTRICTIONS ON CONTRIBUTIONS RECEIVED
2007 2006$'000 $’000
Environment Protection Fund 1 858 1 333NRG Flinders 482 520Chemcollect 490 514Externally Funded Projects 309 310
3 139 2 677
31 EXPENDITURE COMMITMENTSOperating Lease Commitments:
2007 2006$'000 $’000
Not Later than One Year 1 334 1 417Later than One Year but not Later than Five Years 859 2 141Total 2 193 3 558
During the 2006-07 financial year the Authority undertook a comprehensive review of the fixed assets processes for recording, revaluing, reconciling and reporting in the statutory accounts. Through this process errors in depreciation expense in prior periods for a small number of assets were identified. In line with AASB 108 these errors have been corrected and restated in the comparatives within the Statement of Changes in Equity, Balance Sheet, Income Statement and Cash Flow Statement.
The total value of future non-cancellable operating lease commitments not provided for and payable as at the end of the reporting period are detailed below. These amounts have not been brought to account in the financial statements.
The Authority is engaged in a variety of funding programs involving State and Commonwealth sources who provide monies to the Authority on the premise that these funds are expended in a manner consistent with the terms of the agreement. At reporting date the Authority had the following outstanding funding commitments:
Equity represents the residual interest in the net assets of the Authority. The State Government holds the equity interest in the Authority on behalf of the community. The asset revaluation reserve represents that portion of equity resulting from the revaluation of non-current assets.
The operating leases held by the Authority are mainly property leases with penalty clauses equal to the amount of the residual payments remaining for the lease terms. The leases are payable one month in advance and the Authority has the right of renewal. There are no existing or contingent rental provisions.
A-27
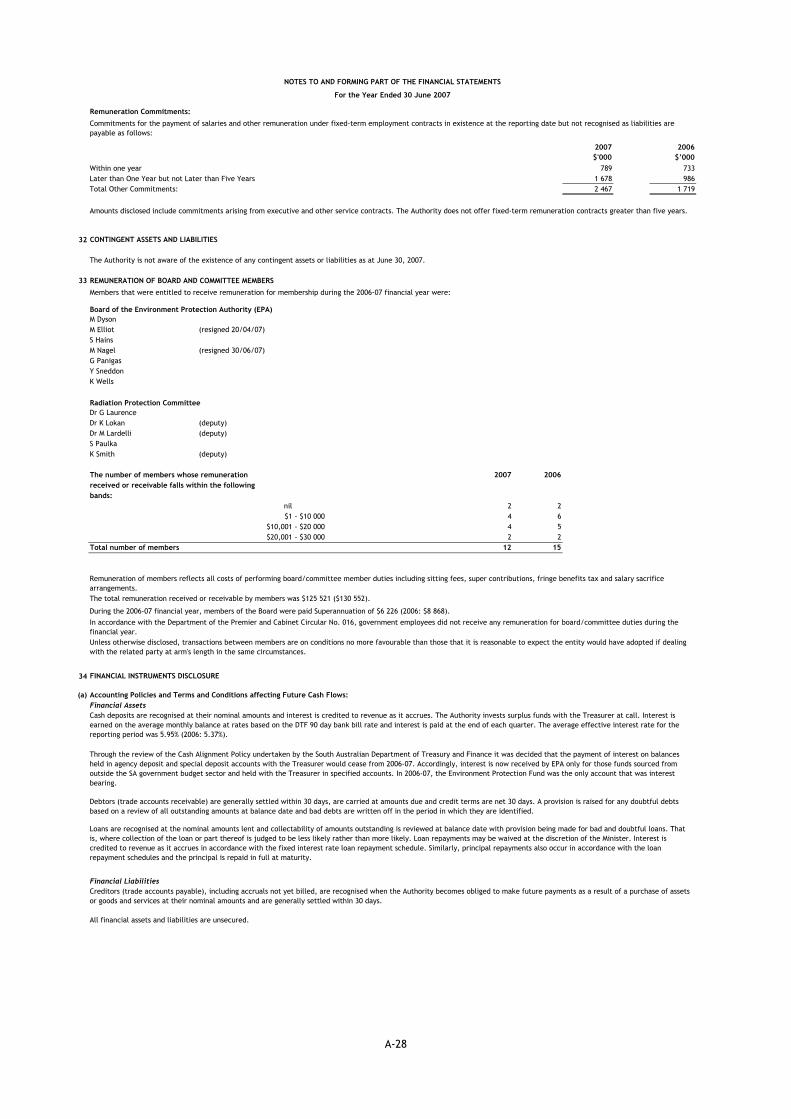
NOTES TO AND FORMING PART OF THE FINANCIAL STATEMENTS
For the Year Ended 30 June 2007
Remuneration Commitments:
2007 2006$'000 $’000
Within one year 789 733Later than One Year but not Later than Five Years 1 678 986Total Other Commitments: 2 467 1 719
32
33 REMUNERATION OF BOARD AND COMMITTEE MEMBERS
Board of the Environment Protection Authority (EPA)M DysonM Elliot (resigned 20/04/07)S HainsM Nagel (resigned 30/06/07)G PanigasY SneddonK Wells
Radiation Protection CommitteeDr G LaurenceDr K Lokan (deputy)Dr M Lardelli (deputy)S PaulkaK Smith (deputy)
The number of members whose remuneration 2007 2006received or receivable falls within the followingbands:
nil 2 2$1 - $10 000 4 6
$10,001 - $20 000 4 5$20,001 - $30 000 2 2
Total number of members 12 15
34 FINANCIAL INSTRUMENTS DISCLOSURE
(a) Accounting Policies and Terms and Conditions affecting Future Cash Flows:Financial Assets
Financial Liabilities
All financial assets and liabilities are unsecured.
Loans are recognised at the nominal amounts lent and collectability of amounts outstanding is reviewed at balance date with provision being made for bad and doubtful loans. That is, where collection of the loan or part thereof is judged to be less likely rather than more likely. Loan repayments may be waived at the discretion of the Minister. Interest is credited to revenue as it accrues in accordance with the fixed interest rate loan repayment schedule. Similarly, principal repayments also occur in accordance with the loan repayment schedules and the principal is repaid in full at maturity.
Creditors (trade accounts payable), including accruals not yet billed, are recognised when the Authority becomes obliged to make future payments as a result of a purchase of assets or goods and services at their nominal amounts and are generally settled within 30 days.
Debtors (trade accounts receivable) are generally settled within 30 days, are carried at amounts due and credit terms are net 30 days. A provision is raised for any doubtful debts based on a review of all outstanding amounts at balance date and bad debts are written off in the period in which they are identified.
Amounts disclosed include commitments arising from executive and other service contracts. The Authority does not offer fixed-term remuneration contracts greater than five years.
Commitments for the payment of salaries and other remuneration under fixed-term employment contracts in existence at the reporting date but not recognised as liabilities are payable as follows:
Cash deposits are recognised at their nominal amounts and interest is credited to revenue as it accrues. The Authority invests surplus funds with the Treasurer at call. Interest is earned on the average monthly balance at rates based on the DTF 90 day bank bill rate and interest is paid at the end of each quarter. The average effective interest rate for the reporting period was 5.95% (2006: 5.37%).
CONTINGENT ASSETS AND LIABILITIES
Through the review of the Cash Alignment Policy undertaken by the South Australian Department of Treasury and Finance it was decided that the payment of interest on balances held in agency deposit and special deposit accounts with the Treasurer would cease from 2006-07. Accordingly, interest is now received by EPA only for those funds sourced from outside the SA government budget sector and held with the Treasurer in specified accounts. In 2006-07, the Environment Protection Fund was the only account that was interest bearing.
During the 2006-07 financial year, members of the Board were paid Superannuation of $6 226 (2006: $8 868).
In accordance with the Department of the Premier and Cabinet Circular No. 016, government employees did not receive any remuneration for board/committee duties during the financial year.Unless otherwise disclosed, transactions between members are on conditions no more favourable than those that it is reasonable to expect the entity would have adopted if dealing with the related party at arm's length in the same circumstances.
The total remuneration received or receivable by members was $125 521 ($130 552).
The Authority is not aware of the existence of any contingent assets or liabilities as at June 30, 2007.
Members that were entitled to receive remuneration for membership during the 2006-07 financial year were:
Remuneration of members reflects all costs of performing board/committee member duties including sitting fees, super contributions, fringe benefits tax and salary sacrifice arrangements.
A-28
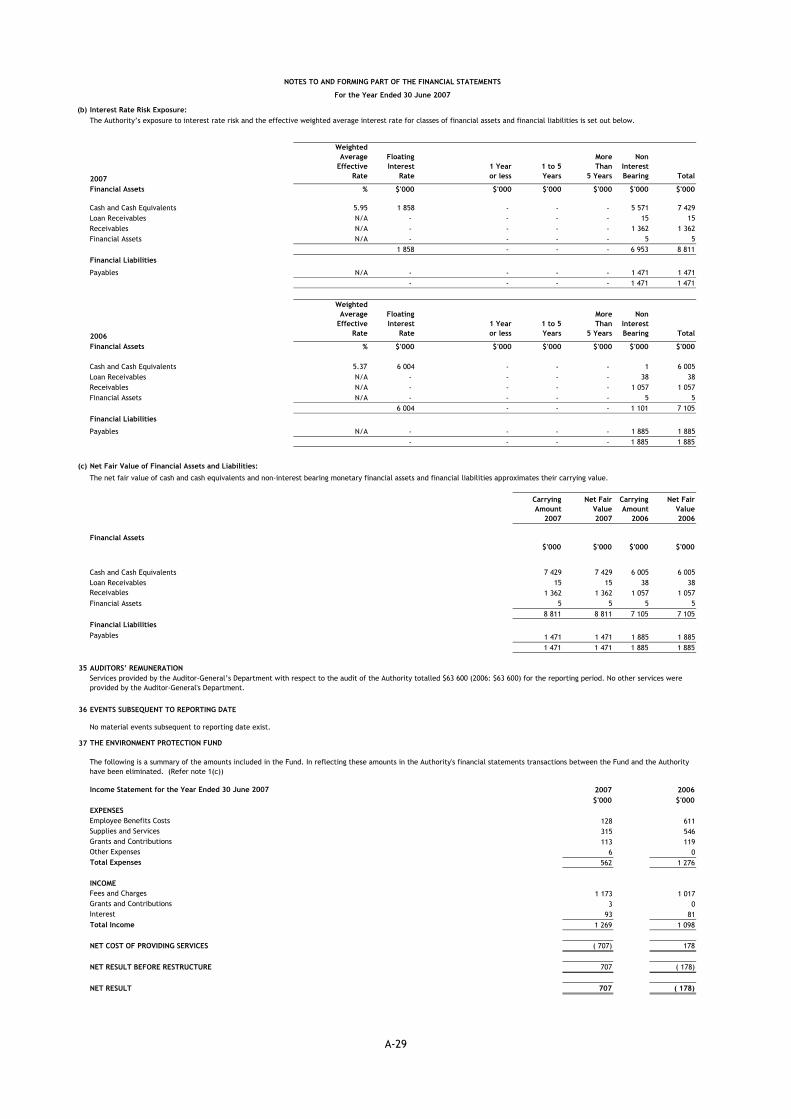
NOTES TO AND FORMING PART OF THE FINANCIAL STATEMENTS
For the Year Ended 30 June 2007
(b) Interest Rate Risk Exposure:
2007
Weighted Average
Effective Rate
Floating Interest
Rate1 Year or less
1 to 5 Years
More Than
5 Years
NonInterestBearing Total
Financial Assets % $'000 $'000 $'000 $'000 $'000 $'000
Cash and Cash Equivalents 5.95 1 858 - - - 5 571 7 429Loan Receivables N/A - - - - 15 15Receivables N/A - - - - 1 362 1 362Financial Assets N/A - - - - 5 5
1 858 - - - 6 953 8 811Financial Liabilities
Payables N/A - - - - 1 471 1 471- - - - 1 471 1 471
2006
Weighted Average
Effective Rate
Floating Interest
Rate1 Year or less
1 to 5 Years
More Than
5 Years
NonInterestBearing Total
Financial Assets % $'000 $'000 $'000 $'000 $'000 $'000
Cash and Cash Equivalents 5.37 6 004 - - - 1 6 005Loan Receivables N/A - - - - 38 38Receivables N/A - - - - 1 057 1 057Financial Assets N/A - - - - 5 5
6 004 - - - 1 101 7 105Financial Liabilities
Payables N/A - - - - 1 885 1 885- - - - 1 885 1 885
(c) Net Fair Value of Financial Assets and Liabilities:
Carrying Amount
2007
Net Fair Value2007
Carrying Amount
2006
Net Fair Value2006
Financial Assets$'000 $'000 $'000 $'000
Cash and Cash Equivalents 7 429 7 429 6 005 6 005Loan Receivables 15 15 38 38Receivables 1 362 1 362 1 057 1 057Financial Assets 5 5 5 5
8 811 8 811 7 105 7 105Financial LiabilitiesPayables 1 471 1 471 1 885 1 885
1 471 1 471 1 885 1 885
35 AUDITORS’ REMUNERATION
36 EVENTS SUBSEQUENT TO REPORTING DATE
37
Income Statement for the Year Ended 30 June 2007 2007 2006$'000 $'000
Employee Benefits Costs 128 611Supplies and Services 315 546Grants and Contributions 113 119Other Expenses 6 0
562 1 276
INCOMEFees and Charges 1 173 1 017Grants and Contributions 3 0Interest 93 81Total Income 1 269 1 098
NET COST OF PROVIDING SERVICES ( 707) 178
NET RESULT BEFORE RESTRUCTURE 707 ( 178)
NET RESULT 707 ( 178)
The net fair value of cash and cash equivalents and non-interest bearing monetary financial assets and financial liabilities approximates their carrying value.
The Authority’s exposure to interest rate risk and the effective weighted average interest rate for classes of financial assets and financial liabilities is set out below.
No material events subsequent to reporting date exist.
THE ENVIRONMENT PROTECTION FUND
Services provided by the Auditor-General’s Department with respect to the audit of the Authority totalled $63 600 (2006: $63 600) for the reporting period. No other services were provided by the Auditor-General's Department.
The following is a summary of the amounts included in the Fund. In reflecting these amounts in the Authority's financial statements transactions between the Fund and the Authority have been eliminated. (Refer note 1(c))
Total Expenses
EXPENSES
A-29
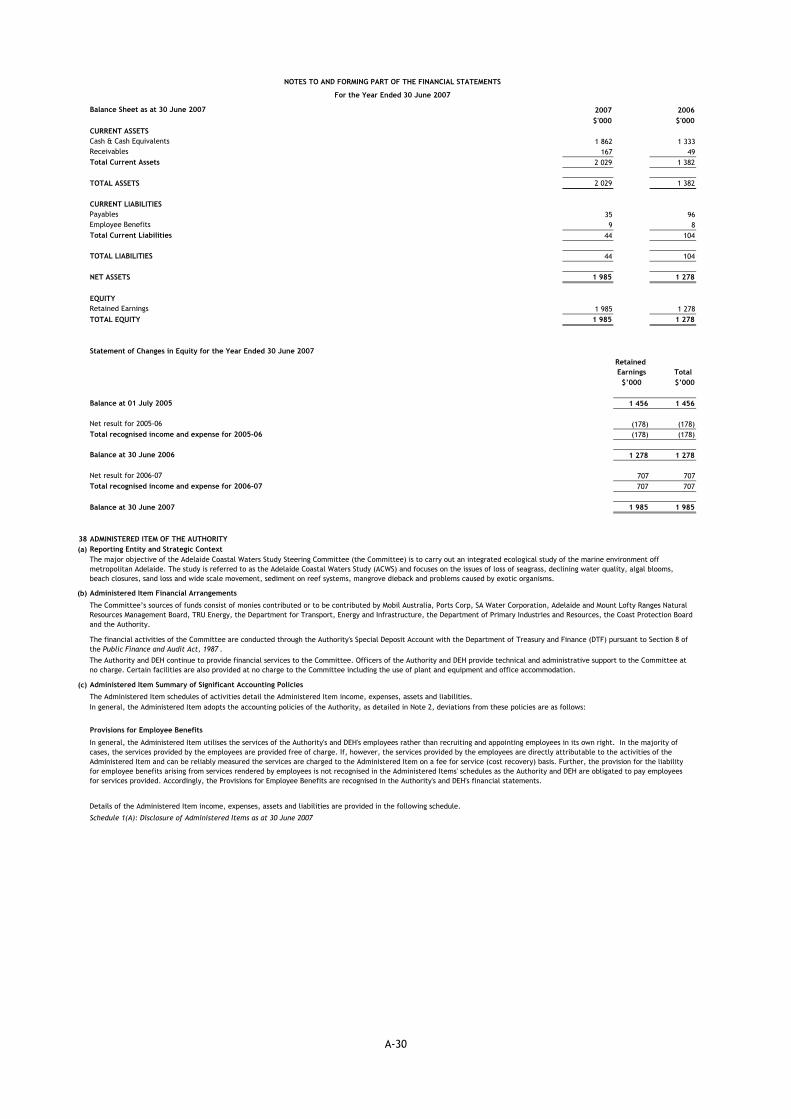
NOTES TO AND FORMING PART OF THE FINANCIAL STATEMENTS
For the Year Ended 30 June 2007
Balance Sheet as at 30 June 2007 2007 2006$'000 $'000
CURRENT ASSETSCash & Cash Equivalents 1 862 1 333Receivables 167 49Total Current Assets 2 029 1 382
TOTAL ASSETS 2 029 1 382
CURRENT LIABILITIESPayables 35 96Employee Benefits 9 8Total Current Liabilities 44 104
TOTAL LIABILITIES 44 104
NET ASSETS 1 985 1 278
EQUITYRetained Earnings 1 985 1 278TOTAL EQUITY 1 985 1 278
Statement of Changes in Equity for the Year Ended 30 June 2007Retained Earnings Total
$’000 $’000
Balance at 01 July 2005 1 456 1 456
Net result for 2005-06 (178) (178) Total recognised income and expense for 2005-06 (178) (178)
Balance at 30 June 2006 1 278 1 278
Net result for 2006-07 707 707Total recognised income and expense for 2006-07 707 707
Balance at 30 June 2007 1 985 1 985
38 ADMINISTERED ITEM OF THE AUTHORITY(a)
(b)
(c)
The major objective of the Adelaide Coastal Waters Study Steering Committee (the Committee) is to carry out an integrated ecological study of the marine environment off metropolitan Adelaide. The study is referred to as the Adelaide Coastal Waters Study (ACWS) and focuses on the issues of loss of seagrass, declining water quality, algal blooms, beach closures, sand loss and wide scale movement, sediment on reef systems, mangrove dieback and problems caused by exotic organisms.
Administered Item Financial Arrangements
Details of the Administered Item income, expenses, assets and liabilities are provided in the following schedule.
The Administered Item schedules of activities detail the Administered Item income, expenses, assets and liabilities. In general, the Administered Item adopts the accounting policies of the Authority, as detailed in Note 2, deviations from these policies are as follows:
Administered Item Summary of Significant Accounting Policies
Schedule 1(A): Disclosure of Administered Items as at 30 June 2007
In general, the Administered Item utilises the services of the Authority's and DEH's employees rather than recruiting and appointing employees in its own right. In the majority of cases, the services provided by the employees are provided free of charge. If, however, the services provided by the employees are directly attributable to the activities of the Administered Item and can be reliably measured the services are charged to the Administered Item on a fee for service (cost recovery) basis. Further, the provision for the liability for employee benefits arising from services rendered by employees is not recognised in the Administered Items' schedules as the Authority and DEH are obligated to pay employees for services provided. Accordingly, the Provisions for Employee Benefits are recognised in the Authority's and DEH's financial statements.
The Authority and DEH continue to provide financial services to the Committee. Officers of the Authority and DEH provide technical and administrative support to the Committee at no charge. Certain facilities are also provided at no charge to the Committee including the use of plant and equipment and office accommodation.
The Committee’s sources of funds consist of monies contributed or to be contributed by Mobil Australia, Ports Corp, SA Water Corporation, Adelaide and Mount Lofty Ranges Natural Resources Management Board, TRU Energy, the Department for Transport, Energy and Infrastructure, the Department of Primary Industries and Resources, the Coast Protection Board and the Authority.
Reporting Entity and Strategic Context
The financial activities of the Committee are conducted through the Authority's Special Deposit Account with the Department of Treasury and Finance (DTF) pursuant to Section 8 of the Public Finance and Audit Act, 1987 .
Provisions for Employee Benefits
A-30
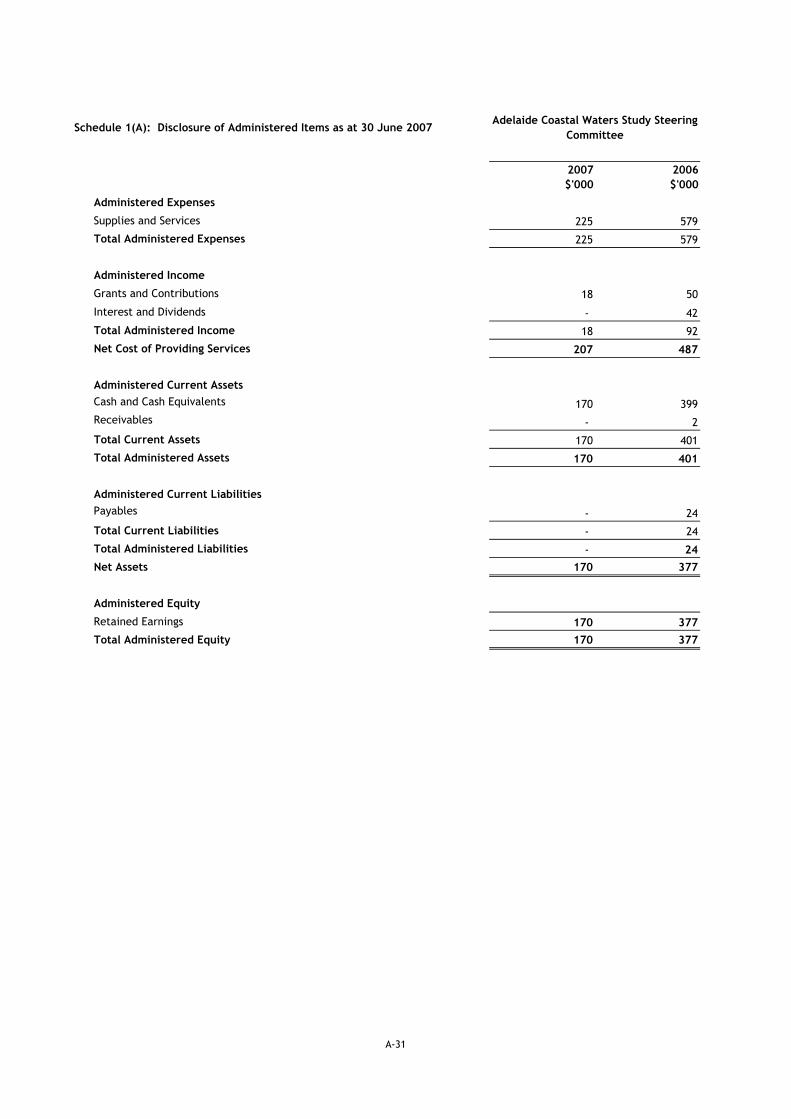
2007 2006 $'000 $'000
Administered Expenses
Supplies and Services 225 579
Total Administered Expenses 225 579
Administered Income
Grants and Contributions 18 50
Interest and Dividends - 42
Total Administered Income 18 92
Net Cost of Providing Services 207 487
Administered Current AssetsCash and Cash Equivalents 170 399Receivables - 2
Total Current Assets 170 401
Total Administered Assets 170 401
Administered Current LiabilitiesPayables - 24
Total Current Liabilities - 24
Total Administered Liabilities - 24Net Assets 170 377
Administered Equity
Retained Earnings 170 377Total Administered Equity 170 377
Adelaide Coastal Waters Study Steering Committee
Schedule 1(A): Disclosure of Administered Items as at 30 June 2007
A-31

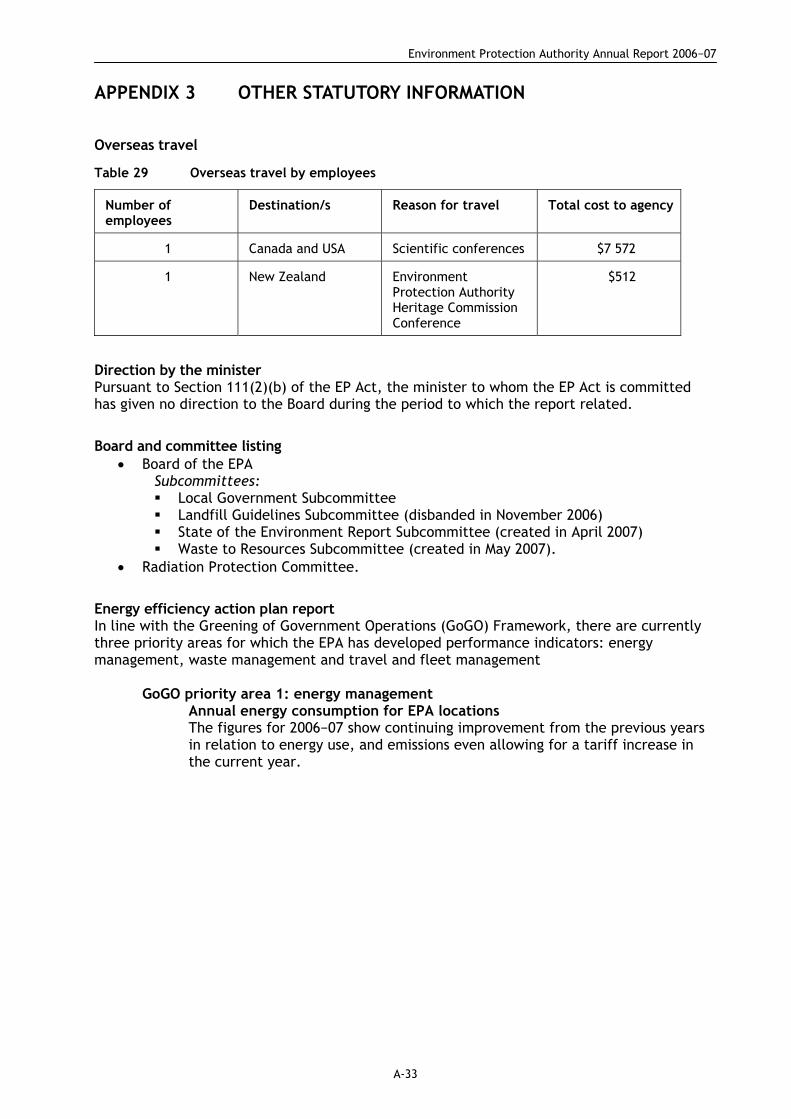
Environment Protection Authority Annual Report 2006−07
A-33
APPENDIX 3 OTHER STATUTORY INFORMATION
Overseas travel
Table 29 Overseas travel by employees
Number of employees
Destination/s Reason for travel Total cost to agency
1 Canada and USA Scientific conferences $7 572
1 New Zealand Environment Protection Authority Heritage Commission Conference
$512
Direction by the minister Pursuant to Section 111(2)(b) of the EP Act, the minister to whom the EP Act is committed has given no direction to the Board during the period to which the report related.
Board and committee listing • Board of the EPA
Subcommittees: Local Government Subcommittee Landfill Guidelines Subcommittee (disbanded in November 2006) State of the Environment Report Subcommittee (created in April 2007) Waste to Resources Subcommittee (created in May 2007).
• Radiation Protection Committee.
Energy efficiency action plan report In line with the Greening of Government Operations (GoGO) Framework, there are currently three priority areas for which the EPA has developed performance indicators: energy management, waste management and travel and fleet management
GoGO priority area 1: energy management
Annual energy consumption for EPA locations The figures for 2006−07 show continuing improvement from the previous years in relation to energy use, and emissions even allowing for a tariff increase in the current year.
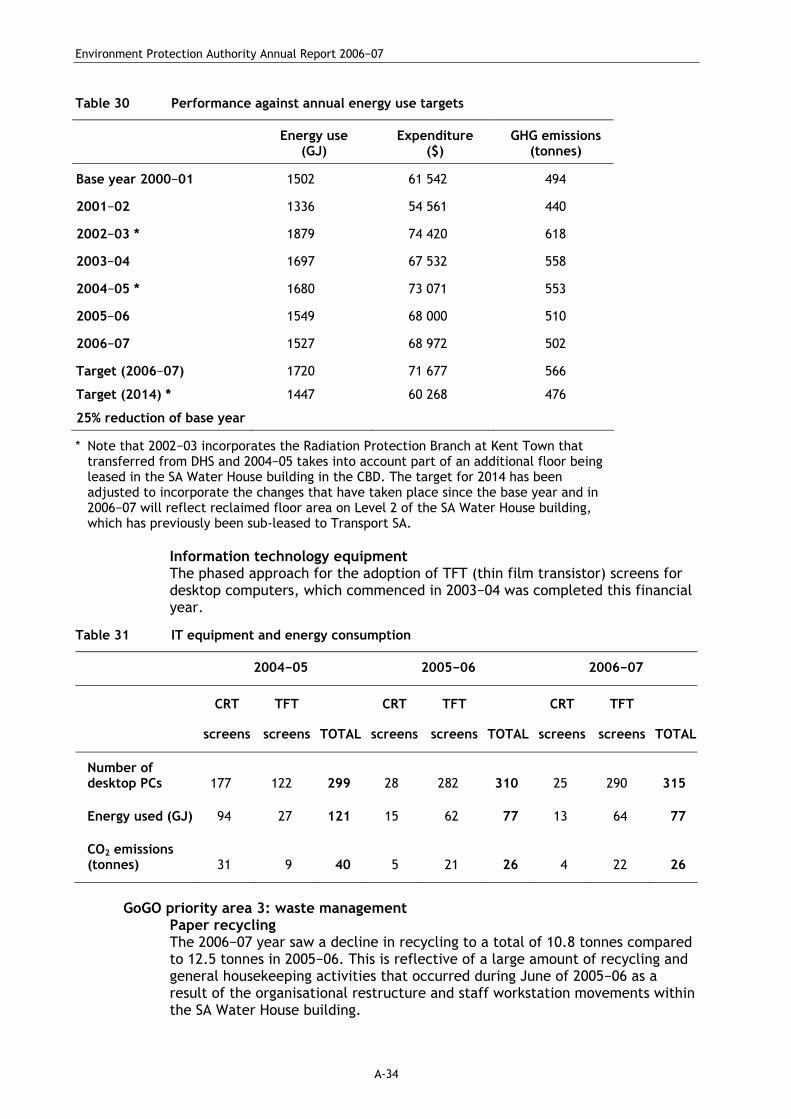
Environment Protection Authority Annual Report 2006−07
A-34
Table 30 Performance against annual energy use targets
Energy use (GJ)
Expenditure ($)
GHG emissions (tonnes)
Base year 2000−01 1502 61 542 494
2001−02 1336 54 561 440
2002−03 * 1879 74 420 618
2003−04 1697 67 532 558
2004−05 * 1680 73 071 553
2005−06 1549 68 000 510
2006−07 1527 68 972 502
Target (2006−07) 1720 71 677 566
Target (2014) * 1447 60 268 476
25% reduction of base year
* Note that 2002−03 incorporates the Radiation Protection Branch at Kent Town that transferred from DHS and 2004−05 takes into account part of an additional floor being leased in the SA Water House building in the CBD. The target for 2014 has been adjusted to incorporate the changes that have taken place since the base year and in 2006−07 will reflect reclaimed floor area on Level 2 of the SA Water House building, which has previously been sub-leased to Transport SA.
Information technology equipment The phased approach for the adoption of TFT (thin film transistor) screens for desktop computers, which commenced in 2003−04 was completed this financial year.
Table 31 IT equipment and energy consumption
2004−05 2005−06 2006−07
CRT TFT CRT TFT CRT TFT
screens screens TOTAL screens screens TOTAL screens screens TOTAL
Number of desktop PCs 177 122 299 28 282 310 25 290 315
Energy used (GJ) 94 27 121 15 62 77 13 64 77
CO2 emissions (tonnes) 31 9 40 5 21 26 4 22 26
GoGO priority area 3: waste management
Paper recycling The 2006−07 year saw a decline in recycling to a total of 10.8 tonnes compared to 12.5 tonnes in 2005−06. This is reflective of a large amount of recycling and general housekeeping activities that occurred during June of 2005−06 as a result of the organisational restructure and staff workstation movements within the SA Water House building.
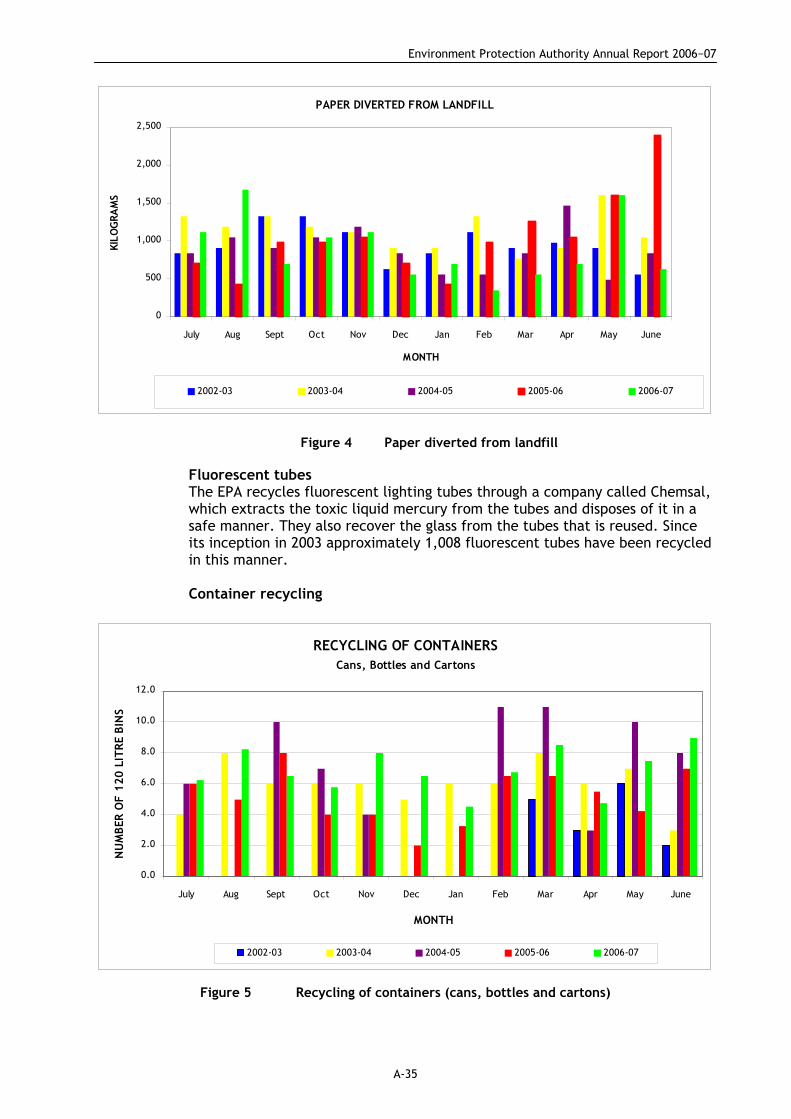
Environment Protection Authority Annual Report 2006−07
A-35
PAPER DIVERTED FROM LANDFILL
0
500
1,000
1,500
2,000
2,500
July Aug Sept Oct Nov Dec Jan Feb Mar Apr May June
MONTH
KILO
GRA
MS
2002-03 2003-04 2004-05 2005-06 2006-07
Figure 4 Paper diverted from landfill
Fluorescent tubes The EPA recycles fluorescent lighting tubes through a company called Chemsal, which extracts the toxic liquid mercury from the tubes and disposes of it in a safe manner. They also recover the glass from the tubes that is reused. Since its inception in 2003 approximately 1,008 fluorescent tubes have been recycled in this manner. Container recycling
RECYCLING OF CONTAINERSCans, Bottles and Cartons
0.0
2.0
4.0
6.0
8.0
10.0
12.0
July Aug Sept Oct Nov Dec Jan Feb Mar Apr May June
MONTH
NU
MBE
R O
F 12
0 LI
TRE
BIN
S
2002-03 2003-04 2004-05 2005-06 2006-07
Figure 5 Recycling of containers (cans, bottles and cartons)

Environment Protection Authority Annual Report 2006−07
A-36
Other recycled products Waste products such as cans, plastics, tins, glass, milk and juice cartons accounted for 9600 litres (or 80 bins) recycled from the CBD building in 2006−07 which is an increase on last year’s figures of 7440 (62 bins) that were collected for recycling.
Printing consumables The recycling initiative provided by Close The Loop Limited was extended further to include Murray Bridge, which has since relocated to Stirling. The Mount Gambier location is a shared facility with other Government Agencies and figures have been amended to reflect the proportion. Reports provided by the company are summarised below and show that a total of 1283 kilograms of waste printing consumables have been diverted from landfill since the initiative’s inception in April 2002.
Table 32 Printer consumables recycling
2001−02 2002−03 2003−04 2004−05 2005−06 2006−07 TOTAL
CBD Building Quantity Diverted (no. of items) 10 209 231 282 289 377 1398
Amount Diverted (kg) 8.6 183.7 212.3 194.8 209.0 203.4 1011.8
Stirling
Quantity Diverted (no. of items) 9 47 56
Amount Diverted (kg) 8.9 18.4 27.3
Kent Town Quantity Diverted (no. of items) 33 33
Amount Diverted (kg) 14.1 14.1
Mount Gambier Quantity Diverted (no. of items) 104 103 2 209
Amount Diverted (kg) 107.7 103.3 1.3 212
Murray Bridge Quantity Diverted (no. of items) 21 21
Amount Diverted (kg's) 17.1 17.1
Total items 10 209 231 386 401 480 1717
Total weight (kg) 8.6 183.7 212.3 302.5 321.2 254.4 1282.7
Other (non-recycled) products Organic waste such as food scraps, are collected in-house to be composted rather than sent to landfill. Over the past year, approximately 1125 kilograms of kitchen waste from the CBD building has been composted.

Environment Protection Authority Annual Report 2006−07
A-37
GoGO Priority Area 5: travel and fleet management Travel Smart Workplace Plan (TWP) In April 2007 the EPA became the first state government agency to implement a Travel Smart Workplace Plan (TWP). Implementation of the EPA TWP will enable the EPA to take a leadership role in advocating and acting in accordance with sustainability principles and practices and has clear links to the EPA Strategic Plan, State Strategic Plan and the South Australian Draft Transport Plan. The EPA TWP was developed in partnership with the Adelaide City Council and DTEI. The plan encourages sustainable travel by the initial introduction of TWP initiatives including:
− offers of discounted Metro Tickets for staff and families; − a 10,000 Step program encouraging walking, pedometers are available
to measure steps; − establishment of a Bicycle Users Group; and − Travel a ‘K’ the Green Way competition which is offering a random
prize to a staff member who participates in sustainable travel for work purposes during a specified period.
Table 33 EPA vehicle fleet
Vehicle types At 30 June
2003 At 30 June
2004 At 30 June
2005 At 30 June
2006 At 30 June
2007
Diesel only 4 3 3 3 3
Electric/unleaded (hybrid) 3 3 2 Nil Nil
Unleaded only 6 4 8 6 10
LPG only Nil 2 3 7 3
Combined dual fuel (unleaded and LPG) 24 25 21 19 19
Total long-term hire vehicles 37 37 37 35 35
Note: The table above shows the vehicle types that are currently on long-term leases to the EPA ie leases of two or three years duration. Of the total 35 vehicles at 30 June 2007, 64% have LPG or the ability to run on LPG, which is well in excess of the requirements of the SA Government Energy Efficiency Action Plan.
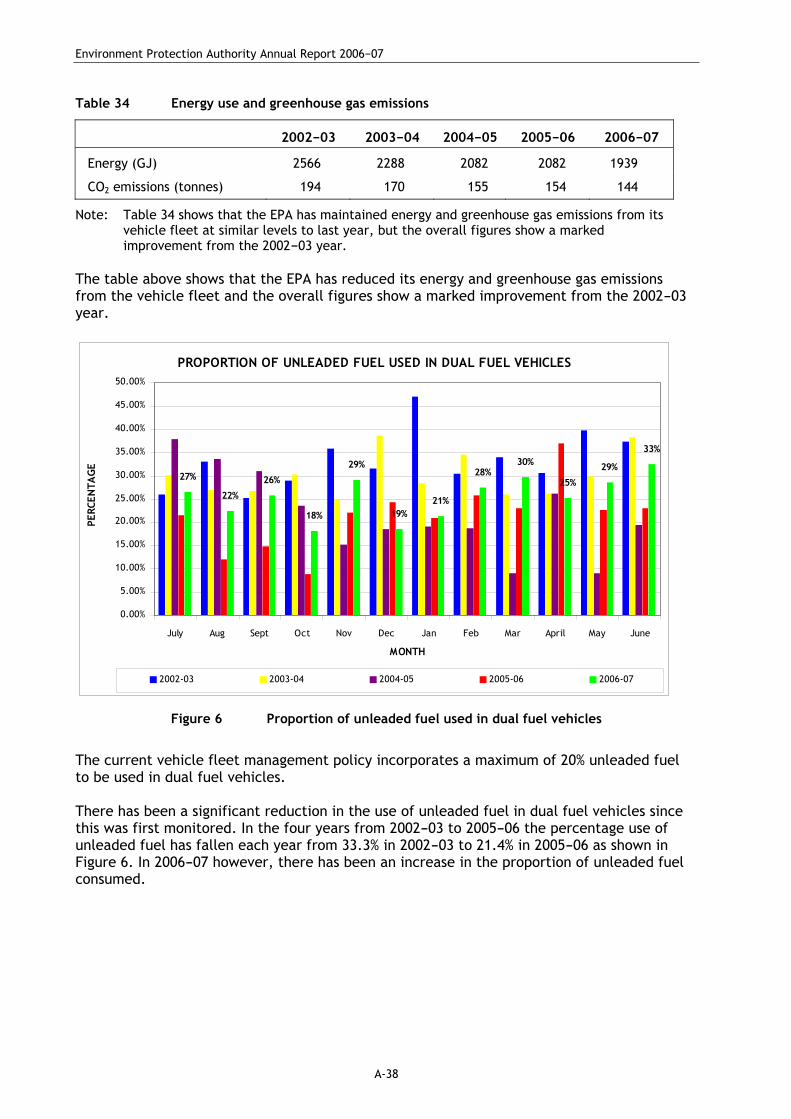
Environment Protection Authority Annual Report 2006−07
A-38
Table 34 Energy use and greenhouse gas emissions
2002−03 2003−04 2004−05 2005−06 2006−07
Energy (GJ) 2566 2288 2082 2082 1939
CO2 emissions (tonnes) 194 170 155 154 144
Note: Table 34 shows that the EPA has maintained energy and greenhouse gas emissions from its vehicle fleet at similar levels to last year, but the overall figures show a marked improvement from the 2002−03 year.
The table above shows that the EPA has reduced its energy and greenhouse gas emissions from the vehicle fleet and the overall figures show a marked improvement from the 2002−03 year.
PROPORTION OF UNLEADED FUEL USED IN DUAL FUEL VEHICLES
27%
22%
26%
18%
29%
19%21%
28%30%
25%
29%
33%
0.00%
5.00%
10.00%
15.00%
20.00%
25.00%
30.00%
35.00%
40.00%
45.00%
50.00%
July Aug Sept Oct Nov Dec Jan Feb Mar April May June
MONTH
PERC
ENTA
GE
2002-03 2003-04 2004-05 2005-06 2006-07
Figure 6 Proportion of unleaded fuel used in dual fuel vehicles
The current vehicle fleet management policy incorporates a maximum of 20% unleaded fuel to be used in dual fuel vehicles. There has been a significant reduction in the use of unleaded fuel in dual fuel vehicles since this was first monitored. In the four years from 2002−03 to 2005−06 the percentage use of unleaded fuel has fallen each year from 33.3% in 2002−03 to 21.4% in 2005−06 as shown in Figure 6. In 2006−07 however, there has been an increase in the proportion of unleaded fuel consumed.

Environment Protection Authority Annual Report 2006−07
A-39
GREENHOUSE GAS EMISSIONS (CO2)
0
20
40
60
80
100
120
Unleaded LPG Electric/
Unleaded
Diesel
FUEL TYPES
EMIS
SIO
NS
(TO
NN
ES)
2002-03 2003-04 2004-05 2005-06 2006-07
Figure 7 Greenhouse gas emissions
Note: Figure 7 reflects the proportion of greenhouse gas emissions by each fuel type and shows that whilst emissions from LPG vehicles has increased slightly during 2005−06, this is due to the increased use of this fuel type in our vehicle fleet. Unleaded fuel emissions are at a similar level to 2004−05, but still represent a significant reduction from the base year of 2002−03.
The graph above reflects greenhouse gas emissions by each fuel type and shows that whilst emissions from LPG vehicles has reduced slightly during 2006−07 this is due to the reduced use of this fuel type in our vehicle fleet. Unleaded fuel emissions have slightly increased, but this is also due to an increase in the number of these vehicle types. While there has been an overall reduction in emissions, they still represent a significant reduction on the base year of 2002−03.

Environment Protection Authority Annual Report 2006−07
A-41
APPENDIX 4 PUBLICATIONS RELEASED OR UPDATED DURING 2006−07
EPA Guidelines
Guidelines for composting works in South Australia
EPA Board Landfill Subcommittee: report on EPA landfill guidelines
Environment assessment guides for planners: wood processing works
Environment assessment guides for planners: truck/bus depots
Environment assessment guides for planners: surface coating (spray painting and powder coating)
Environment assessment guides for planners: saleyards
Environment assessment guides for planners: materials handling
Environment assessment guides for planners: dog keeping/dog kennels
Environment assessment guides for planners: composting works
Environment assessment guides for planners: cattle feedlots
Environment assessment guides for planners: aquaculture (marine)
Environment assessment guides for planners: abrasive blasting
Contingency Plans: a guide for wastewater producers and wastewater treatment plant operators
Environmental guidelines for completion of aquaculture licence applications (marine)
Environmental guidelines for completion of aquaculture licence applications (landbased)
Guidelines for management of aquaculture stock mortalities
Guidelines for PIRSA aquaculture lease conversion EPA requirements−information for applicants
Guidelines: Regulatory monitoring and testing−draft groundwater sampling
Groundwater guideline
NPI updates
SA EPA 2007 NPI Update
NPI South Australia summary report 2005−06
NPI industry survey report−collation of responses 2006
Reports
River Murray and Lower Lakes catchment risk assessment for water quality
• Introduction and methods • Results and management options

Environment Protection Authority Annual Report 2006−07
A-42
Update of South Australia’s National Pollutant Inventory−aggregate emission data 2005
Air quality monitoring hot spot report no. 5−Pt Stanvac/O'Sullivans Beach
Reporting to the community: industry environmental improvement project in the Kilburn and Gepps Cross area
Environment Protection (Beverage Container) Amendment Bill Explanatory Report
South Australia’s air quality 2005
South Australia’s air quality 2005−air quality monitoring datatables
Torrens Catchment stormwater audit summary
Mount Lofty Ranges Watershed Water Quality Snapshot 2001−2002
Annual reports
EPA Annual Report 2005−06 (includes reporting under the Radiation Protection Act 1982)
Round-table 2006 report
Information sheets
Information sheet−On-farm disposal of fire and drought affected carcasses
Information sheet−site contamination−use of an environmental consultant
Information sheet −site contamination−selecting an environmental auditor
Other publications
EPA Strategic Plan 2007
Odour diary kit
Industry compliance audit handbook (draft)
Civil penalty system under the Environment Protection Act 1993 and the Civil Penalties Calculation Policy
Regulatory reform in the South Australian EPA: progress and future
Draft Port Waterways water quality improvement plan
Air Quality in Port Pirie 2002−2005
Monitoring and testing: reporting
Monitoring and testing: plan requirements
Monitoring and testing guideline: independent verification
Hand-held dental x-ray apparatus
Personal monitoring devices

Environment Protection Authority Annual Report 2006−07
A-43
Calculations policy of civil penalties
Hand-held dental X-ray apparatus
Water quality website
Small winery environmental audit 2005
Soil bioremediation for contaminated sites
E2 Catchment Modelling Framework
Mount Lofty Ranges E2 Model
Gawler Air Quality Monitoring Campaign 2002−04
FORMS
Accredited licences and application form
BROCHURES
Kilburn audit brochure
Time to clean up household hazards
New amendments to the Act
HANDBOOKS
EPA handbook: herbicide use near waterbodies
MANUALS
Water and wastewater sampling manual
Estuarine monitoring manual

Environment Protection Authority Annual Report 2006−07
A-45
APPENDIX 5 FREEDOM OF INFORMATION STATEMENT The following details are provided as part of the information statement of the EPA under the provisions of Section 9 of the Freedom of Information Act 1991 (South Australia). Organisation structure and functions From 1 July 2002, the EPA became a separate administrative unit under the Environment and Conservation Portfolio. The EPA is South Australia’s primary environmental regulator. It is responsible for the protection of air and water quality, and the control of pollution, waste, noise and radiation, to ensure the protection and enhancement of the environment. The EPA’s organisational structure and functions are set out in this annual report. Boards and committees Information on the EPA’s boards and committees is set out in this annual report. Effect of organisation functions on members of the public The EPA encourages environmental responsibility throughout the business and community sectors and works collaboratively towards achieving a healthy environment alongside economic prosperity. The role and objectives of the EPA are detailed throughout this annual report and are published in the EPA Strategic Plan 2005–08. Public participation in environment policy The public is invited to participate in development of environment policy through:
• public consultation sessions during the development of specific EPPs and other policy initiatives
• the annual Round-table Conference • regional Round-table meetings • specific issue forums.
The EPA also supports a number of programs to assist business and industry, community volunteers and South Australian teachers and students to become involved in protecting and enhancing the environment. Public consultation and community monitoring programs undertaken in 2005–06 are detailed in this annual report.
Description of kinds of documents held by the EPA Publications produced by the EPA can be accessed through the department’s website at <www.epa.sa.gov.au/pub.html>, or requested, free of charge, by telephoning the Customer Service Desk on 08 8204 2004. A list of 2006−07 EPA publications is set out in this annual report. Other types of documents produced by the EPA include:
• administrative records • asset maintenance records • records and annual reports of boards and committees • corporate and strategic planning records • correspondence files • financial records • occupational health and safety records • personnel records • policy documents
Environment Protection Authority Annual Report 2006−07
A-46
• procedures and reference manuals • survey and environmental reports and records.
Please note that standard freedom of information charges for these documents may apply. Documents available for purchase from the EPA in accordance with Section 109 of the EP Act include:
• applications for environmental authorisations • environmental authorisations • development authorisations • beverage container approvals • details of prosecutions and other enforcement action under the EP Act.
Policy documents In relation to corporate policy, the EPA refers to existing DEH corporate policy except in instances where specific EPA policy has been developed. Enquiries about such policy should be directed to DEH. The following list details existing EPA internal operating policies.
IOP001 Guideline for the preparation of an internal office policy or procedure for the EPA
IOP002 Procedure for obtaining advice on sampling
IOP003 Procedure to be followed when requesting legal advice
IOP004 Overseas travel by EPA staff
IOP005 Conference attendance by EPA staff
IOP006 Guidelines for training and development expenditure
IOP007 Licence renewal process for A-class licences—this policy is now obsolete
IOP008 Guidelines for study assistance
IOP009 Accessing human resource development activities
IOP010 Induction • Attachment 1—Process for induction of new employees • Attachment 2—Induction checklist • Attachment 3—Reference lists
IOP011 Guideline in preparing EPA Board papers • Attachment 1 • Attachment 2
IOP012 Vaccination protocol for field-staff
IOP013 Licensing requirements for the transport and disposal of recyclable/reusable wastes
IOP014 WinTAP: Windows Time Allocation Program for EPA • Attachment 1—TOIL record sheet
IOP015 Responding to environmental emergencies and major pollution incidents • Attachment 1
IOP016 Threshold criteria—Matters for EPA Board consideration
IOP017 Guideline for the preparation of a Cabinet submission • Attachment 1—Cabinet submission development process flow chart • Attachment 2—Cabinet submission process checklist • Attachment 3—Guideline: When is a Cabinet submission required?

Environment Protection Authority Annual Report 2006−07
A-47
• Attachment 4—Guideline: Notification of intention to draft a Cabinet submission
• Attachment 5—Instructions for using Cabinet submission templates • Attachment 6—Preparing Cabinet submissions
IOP018 Hazard incident injury reporting, investigation and management • Attachment 1—Risk assessment
Hazard−incident−injury reporting risk rating
Risk assessment matrix • Attachment 2—Hazard incident injury reporting, investigation and
management policy
Hazard−incident−injury reporting policy • Attachment 3—Report forms
Hazard report forms
Incident report forms
Aggression report
Manual handling report
Needle stick injury report
Vehicle accident report
Notification of dangerous occurrence form
IOP019 Allocation and use of mobile telephones • Attachment—Request for mobile telephone
IOP020 Mobile telephone—Reimbursing personal call costs • Attachment—Mobile telephone personal calls−reimbursement form
IOP021 Vehicle management • Attachment—Non-employee application to drive government
vehicles • Attachment—Application for regular home and/or office travel
IOP022 Management of desk telephones
IOP023 Filling of positions during restructure
IOP024 Role and responsibilities of the Emergency Response Team
IOP025 Volumetric survey assessment
IOP026 Manifest audit process for liquid waste
IOP027 Weigh data audit process for solid waste
IOP028 A system for managing industry compliance audits
IOP029 Civil penalties • EPA policy for calculation of civil penalties under the EP Act
IOP030 Security Level 7 reception
IOP031 Accredited licensing system
Environment Protection Authority Annual Report 2006−07
A-48
IOP032 EPA risk management policy (draft) • Attachment—Government of South Australia (2003) risk management
policy statement
IOP033 The development and application of licence project plans
Access to organisation documents Requests for access to documents or amendment of personal records in the possession of the EPA should be directed in writing to:
Freedom of Information Coordinator Environment Protection Authority GPO Box 2607 ADELAIDE SA 5001 Telephone: 8204 9128
Policy documents may be inspected at Level 5, 77 Grenfell St, Adelaide between 9 am and 5 pm Monday to Friday.
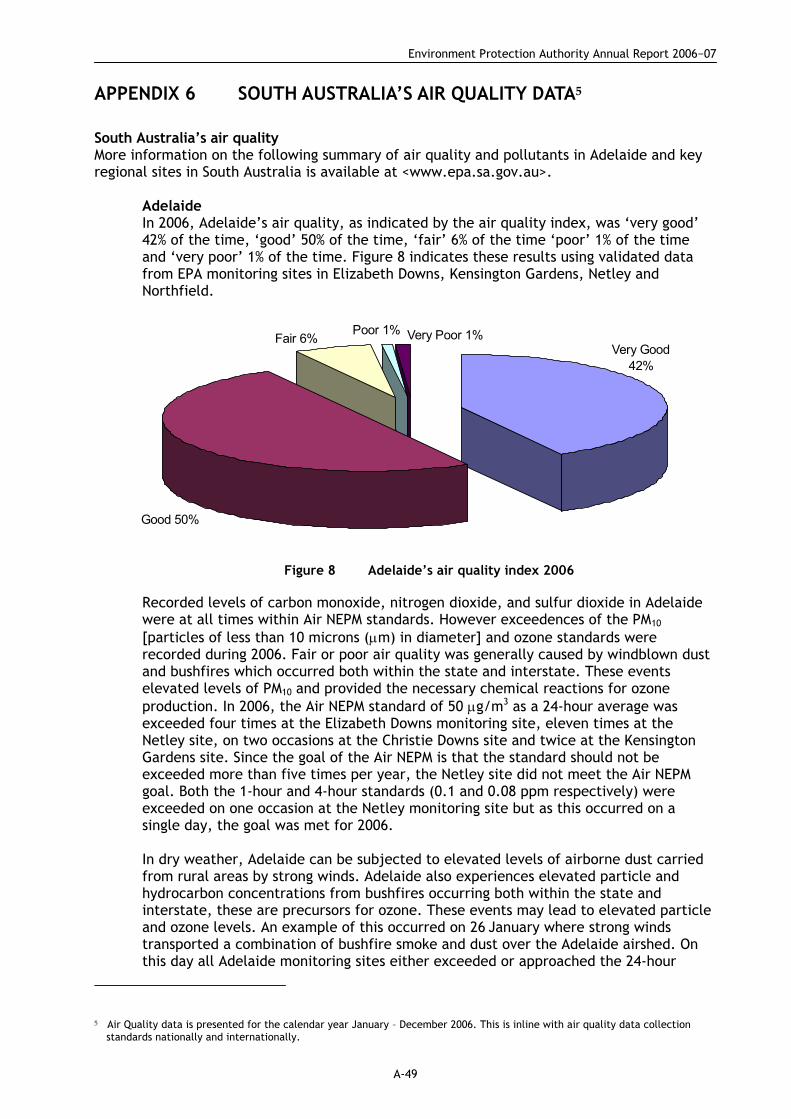
Environment Protection Authority Annual Report 2006−07
A-49
APPENDIX 6 SOUTH AUSTRALIA’S AIR QUALITY DATA5
South Australia’s air quality More information on the following summary of air quality and pollutants in Adelaide and key regional sites in South Australia is available at <www.epa.sa.gov.au>.
Adelaide In 2006, Adelaide’s air quality, as indicated by the air quality index, was ‘very good’ 42% of the time, ‘good’ 50% of the time, ‘fair’ 6% of the time ‘poor’ 1% of the time and ‘very poor’ 1% of the time. Figure 8 indicates these results using validated data from EPA monitoring sites in Elizabeth Downs, Kensington Gardens, Netley and Northfield.
Very Good 42%
Good 50%
Fair 6% Very Poor 1%Poor 1%
Figure 8 Adelaide’s air quality index 2006
Recorded levels of carbon monoxide, nitrogen dioxide, and sulfur dioxide in Adelaide were at all times within Air NEPM standards. However exceedences of the PM10 [particles of less than 10 microns (μm) in diameter] and ozone standards were recorded during 2006. Fair or poor air quality was generally caused by windblown dust and bushfires which occurred both within the state and interstate. These events elevated levels of PM10 and provided the necessary chemical reactions for ozone production. In 2006, the Air NEPM standard of 50 μg/m3 as a 24-hour average was exceeded four times at the Elizabeth Downs monitoring site, eleven times at the Netley site, on two occasions at the Christie Downs site and twice at the Kensington Gardens site. Since the goal of the Air NEPM is that the standard should not be exceeded more than five times per year, the Netley site did not meet the Air NEPM goal. Both the 1-hour and 4-hour standards (0.1 and 0.08 ppm respectively) were exceeded on one occasion at the Netley monitoring site but as this occurred on a single day, the goal was met for 2006.
In dry weather, Adelaide can be subjected to elevated levels of airborne dust carried from rural areas by strong winds. Adelaide also experiences elevated particle and hydrocarbon concentrations from bushfires occurring both within the state and interstate, these are precursors for ozone. These events may lead to elevated particle and ozone levels. An example of this occurred on 26 January where strong winds transported a combination of bushfire smoke and dust over the Adelaide airshed. On this day all Adelaide monitoring sites either exceeded or approached the 24-hour
5 Air Quality data is presented for the calendar year January – December 2006. This is inline with air quality data collection
standards nationally and internationally.

Environment Protection Authority Annual Report 2006−07
A-50
standard for PM10. In addition, both the 1-hour and 4-hour standards for ozone were exceeded at the Netley monitoring station and elevated levels were recorded elsewhere within the airshed. Whyalla Particulate pollution continued to be a problem at the eastern end of Whyalla. At the EPA monitoring site Hummock Hill, 15 (17%) of the 89 one-day samples obtained by high-volume sampling exceeded 50 μg/m3 before the site was closed in September. The site in Walls Street recorded 353 one-day average PM10 values; of these, 29 (8%) exceeded 50 μg/m3 (Figure 9).
0.0
20.0
40.0
60.0
80.0
100.0
120.0
140.0
160.0
180.0
Jan Feb Apr May Jul Sep Oct Dec
Date
PM
10 -
24hr
ave
rage
, mic
rogr
ams
per c
ubic
met
re
NEPM 24hr PM10 Standard (50.0μg/m3)
Figure 9 PM10 data for Walls Street monitoring site, Whyalla, 2006
Ozone, nitrogen dioxide and sulfur dioxide were monitored until June 2006 at a site in Nicolson Avenue, Whyalla Norrie. The values recorded for these pollutants were at all times less than the standards set by the Air NEPM. Port Pirie The major industry in Port Pirie is a lead smelter that processes lead sulfide ores, causing lead and sulfur dioxide pollution. Concentrations of airborne lead at most EPA monitoring sites in Port Pirie were below the 0.5 μg/m3 standard set for the annual average by the Air NEPM. The standard was exceeded at the Port Pirie Ellen Street site, adjacent to the smelters. In 2006, the annual average lead concentration was 0.38 μg/m3 at Port Pirie West, 0.49 μg/m3 at Port Pirie South, and 0.16 μg/m3 at Risdon Park. At a site close to the smelter in Ellen Street, the annual average was 2.13 μg/m3. Daily average lead levels for 2006 at the two NEPM monitoring sites, Port Pirie South and Risdon Park, are shown in Figures 10 and 11.
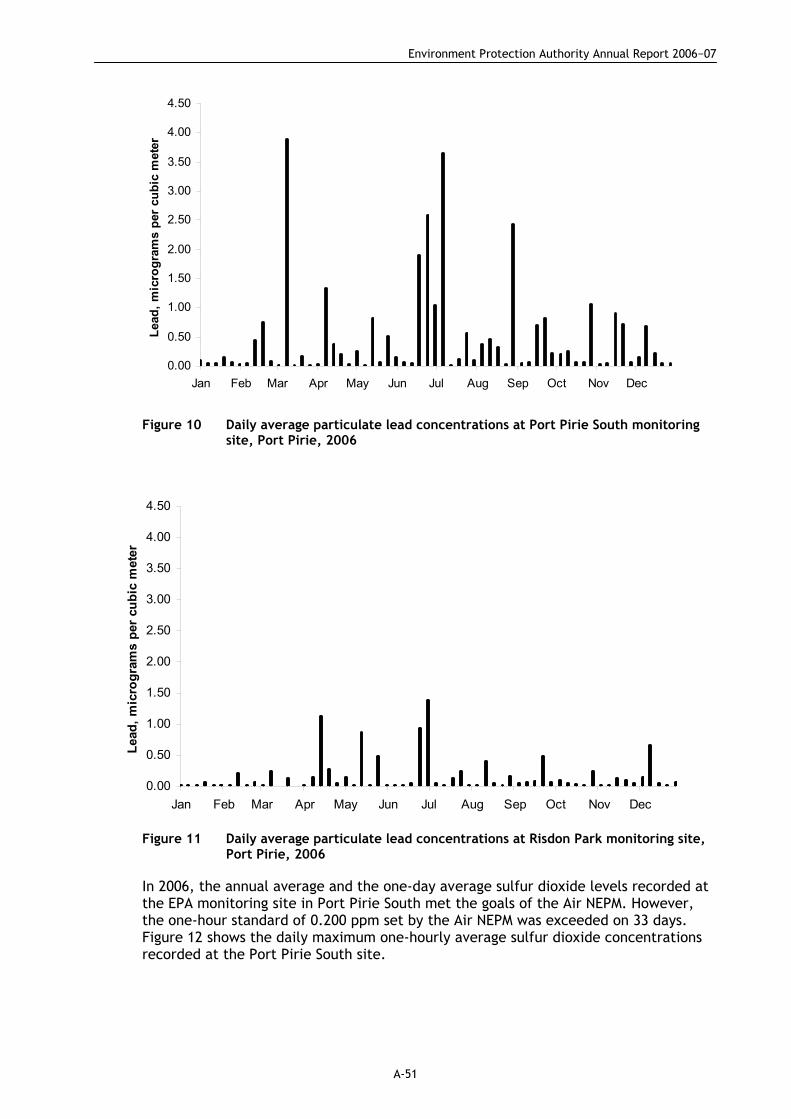
Environment Protection Authority Annual Report 2006−07
A-51
0.00
0.50
1.00
1.50
2.00
2.50
3.00
3.50
4.00
4.50
Jan Feb Mar Apr May Jun Jul Aug Sep Oct Nov Dec
Lead
, mic
rogr
ams
per c
ubic
met
er
Figure 10 Daily average particulate lead concentrations at Port Pirie South monitoring
site, Port Pirie, 2006
0.00
0.50
1.00
1.50
2.00
2.50
3.00
3.50
4.00
4.50
Jan Feb Mar Apr May Jun Jul Aug Sep Oct Nov Dec
Lead
, mic
rogr
ams
per
cubi
c m
eter
Figure 11 Daily average particulate lead concentrations at Risdon Park monitoring site,
Port Pirie, 2006
In 2006, the annual average and the one-day average sulfur dioxide levels recorded at the EPA monitoring site in Port Pirie South met the goals of the Air NEPM. However, the one-hour standard of 0.200 ppm set by the Air NEPM was exceeded on 33 days. Figure 12 shows the daily maximum one-hourly average sulfur dioxide concentrations recorded at the Port Pirie South site.

Environment Protection Authority Annual Report 2006−07
A-52
0.000
0.100
0.200
0.300
0.400
0.500
0.600
Jan Jan Feb Mar Mar Apr May May Jun Jun Jul Aug Aug Sep Oct Oct Nov Dec Dec
Sul
fur D
ioxi
de -
1hr d
aily
max
, par
ts p
er m
illio
n
NEPM 1hr Sulfur Dioxide Standard (0.200ppm)
Figure 12 Sulfur dioxide daily maximum 1-hour averages in Port Pirie, 2006
On 13 occasions in 2006, the Air NEPM standard of 50 μg/m3 for the one-day average concentration of particulate matter, as PM10, was exceeded at the Port Pirie South monitoring site. The Air NEPM goal has not been met as the NEPM permits the standard to be exceeded up to five days a year.
ENVIRONMENT PROTECTION AUTHORITY Annual Report on the administration of the Radiation Protection and Control Act 1982 2006−07

Annual Report on the administration of the
Radiation Protection and Control Act 1982
1 July 2006 to 30 June 2007

Environment Protection Authority Annual Report on the administration of the Radiation Protection and Control Act 1982 2006−2007 For further information please contact: Information Officer Environment Protection Authority GPO Box 2607 ADELAIDE SA 5001 Telephone: (08) 8204 2004 Facsimile: (08) 8204 9393 Freecall (country): 1800 623 445 E-mail: <[email protected]> Website: <www.epa.sa.gov.au> ISSN 1322−1662 ISBN 978-1-921125-56-0 September 2007 © Environment Protection Authority This document may be reproduced in whole or part for the purpose of study or training, subject to the inclusion of an acknowledgment of the source and to its not being used for commercial purposes or sale. Reproduction for purposes other than those given above requires the prior written permission of the Environment Protection Authority.
Printed on recycled paper

i
CONTENTS
LETTER OF TRANSMITTAL .............................................................................1 FOREWORD ...............................................................................................3 ABBREVIATIONS..........................................................................................5 INTRODUCTION...........................................................................................7 STRATEGIC DIRECTIONS ................................................................................8
EPA Radiation Protection Division’s strategic plan ...........................................8 HIGHLIGHTS AND MAJOR INITIATIVES ...............................................................9
Population dose reduction strategies in medical imaging ...................................9 Regulatory framework for uranium mining ....................................................9 Review of the Radiation Protection and Control Act .........................................9 Radioactive waste store and repository implementation project ........................ 10
RADIATION PROTECTION COMMITTEE ............................................................. 11 Functions and legislative responsibility ...................................................... 11 Membership ....................................................................................... 11 Meetings ........................................................................................... 11
ADMINISTRATION OF THE RPC ACT AND REGULATIONS........................................ 12 Exemptions granted under the Radiation Protection and Control Act................... 12 Radioactive waste management plans........................................................ 12 Radiation incidents and accidents............................................................. 12 Radiation emergency response ................................................................ 14 Registration of equipment and premises, and licensing of radiation users............. 14 Registration of mining operations ............................................................. 14 Registration of former uranium mining and milling sites .................................. 15 Licences to mine and mill radioactive ore ................................................... 15 Reporting procedures for incidents at uranium mines ..................................... 16 Olympic Dam operations ........................................................................ 16 Beverley uranium project....................................................................... 17 Honeymoon uranium project ................................................................... 17 Transport of uranium ore concentrate ....................................................... 17 Maralinga .......................................................................................... 17 Non-ionising radiation ........................................................................... 18
TRAINING AND EDUCATION .......................................................................... 19 Rural and remote X-ray operator’s radiography course.................................... 19 Emergency response training................................................................... 19
INTERNATIONAL AND NATIONAL ACTIVITIES ..................................................... 20 Joint Convention on Safety of Spent Fuel Management and on the Safety of
Radioactive Waste Management ........................................................ 20 Radiation Health Committee ................................................................... 20 Radiation Health and Safety Advisory Council............................................... 21 National Directory for Radiation Protection ................................................. 21
OTHER STATUTORY MATTERS ...................................................................... 22 APPENDIX 1 CONFERENCES ATTENDED ...................................................... 23

1
LETTER OF TRANSMITTAL The Hon Gail Gago, MLC Minister for Environment and Conservation Parliament House North Terrace ADELAIDE South Australia 5000 Dear Minister I am pleased to provide the Annual Report on the administration of the Radiation Protection and Control Act 1982 for the period 1 July 2006 to 30 June 2007, for tabling in Parliament in accordance with Section 22 of the RPC Act. Yours sincerely
Dr Paul Vogel Chief Executive Environment Protection Authority 28 September 2007


3
FOREWORD This report provides information on the administration of the Radiation Protection and Control Act 1982 (RPC Act) during the year 2006−07 by the staff of the Radiation Protection Division of the Environment Protection Authority in support of the Radiation Protection Committee. The Division continues to enhance its role to protect people and the environment from the harmful effects of radiation and to provide a high-quality service to its clients. The Division’s activities include assessment and inspections of uranium mining operations, X-ray apparatus, sealed radioactive sources and premises in which unsealed radioactive substances are handled; investigations of radiation accidents and incidents; assisting in the development of national standards and codes of practice for radiation protection; assessment and licensing of radiation users; providing expert advice on radiation incident response; and promoting good radiation protection practices among users of radiation. During 2006−07, the Division progressed its strategy for reducing doses to patients from medical imaging, and promoted best practice through sharing knowledge with operators, owners and suppliers of X-ray equipment. The Division made progress with the review of the RPC Act and worked with other agencies to develop a more effective and efficient regulatory regime for uranium mining. The Division also worked with Commonwealth, state and territory regulators to facilitate national approaches to emerging radiation technologies and issues. I wish to take this opportunity to thank the staff for their continued outstanding efforts during this year, and the members of the Radiation Protection Committee for their contribution and valued advice.
Dr Paul Vogel Chief Executive Environment Protection Authority 28 September 2007

5
ABBREVIATIONS
AHMC Australian Health Ministers’ Conference
ARPANSA Australian Radiation Protection and Nuclear Safety Agency
CBRN chemical, biological, radiological and nuclear
CEO chief executive officer
EIS environmental impact statement
EPA Environment Protection Authority
HDR high dose rate
mSv millisievert
NCP National Competition Policy
NDRP National Directory for Radiation Protection
PIRSA Department of Primary Industries and Resources SA
RPC Act Radiation Protection and Control Act 1982
RHC Radiation Health Committee
UIF Uranium Industry Framework

6
Annual Report 2006−07 Radiation Protection and Control Act 1982
7
INTRODUCTION The purpose of the Radiation Protection and Control Act 1982 (RPC Act) is to protect the environment, and the health and the safety of people against the harmful effects of radiation. It provides for the control of activities related to radioactive substances and radiation apparatus. Section 22 of the RPC Act requires the Environment Protection Authority (EPA) to present to the minister, for tabling in each House of Parliament, a report on the administration of the RPC Act following each financial year. The RPC Act is committed to the Minister for Environment and Conservation, who has delegated roles, functions and powers under the RPC Act and its regulations, pursuant to Section 8 of the RPC Act, to the Chief Executive of the EPA and to officers of the EPA Radiation Protection Division, the principal unit responsible for administering the RPC Act. The director of the Division reports to the Chief Executive of the EPA. The Division supports the Radiation Protection Committee, which is an expert advisory body established under Section 9 of the RPC Act. The committee advises the minister and the Division on the granting of licences under the RPC Act and on radiation protection matters that it considers significant, and on matters that have been referred to the committee. Officers of the Division who are appointed as authorised officers under Section 16 of the RPC Act carry out inspections of radiation apparatus, radioactive sources and premises where unsealed radioactive substances are kept or handled, and sites where radioactive ores are processed or have been processed in the past. They undertake surveillance of sources of radiation used in South Australia to ensure compliance with the RPC Act and its regulations. Officers of the Investigations Branch of the EPA Operations Division have also been appointed as authorised officers under the RPC Act. These officers assist the Division by investigating alleged breaches of the RPC Act and regulations. As at 30 June 2007, there were 15 positions in the Division (14.25 full-time equivalents), of which 12 were scientific and technical staff and three administrative and clerical staff.
Annual Report 2006−07 Radiation Protection and Control Act 1982
8
STRATEGIC DIRECTIONS EPA Radiation Protection Division’s strategic plan The goal of the Division is to protect the community from unacceptable radiation. This forms part of the EPA Strategic Plan 2005−2008, which has been developed to align the organisation with the strategic directions set out in South Australia’s Strategic Plan: Creating Opportunity. The Division’s strategies and key priorities to achieve its goal were to:
• develop effective legislation that incorporates national and international standards through updating the RPC Act and associated regulations
• develop strategies for the sustainable management of radioactive wastes by
implementing the government’s response to the 2003 Radioactive Materials Audit, including:
delivering feasibility studies for storage and long-term management of radioactive wastes
developing a policy on management of radioactive materials.
• develop systems to effectively regulate an expanding uranium mining industry through a regulatory framework in consultation with other departments and operators that allows cost-effective, risk-based and equitable regulation of uranium mines
• develop strategies that enable the control of doses to the public such that they are as
low as reasonably achievable by: undertaking an effective and efficient inspection and evaluation program for
radiation generating machines, facilities and radioactive sources establishing competency criteria and evaluate competencies for users of
radiation developing a strategy document to address the increasing doses from new
medical imaging technologies.
Annual Report 2006−07 Radiation Protection and Control Act 1982
9
HIGHLIGHTS AND MAJOR INITIATIVES Population dose reduction strategies in medical imaging There has been a rapid increase in the use of computed or digital radiography in medical, dental, veterinary, chiropractic and podiatry radiography. Whilst there have been many benefits from these technological advances, radiation doses can be higher. To address this, the Division has implemented a strategy involving dose reduction to the population as a key performance indicator. Dose reduction can be achieved through licensing of users, registration of apparatus and correction of deficiencies in equipment. However, best practice by the operators to achieve effective and efficient use of the equipment is also very important. In 2006−07, the Division effectively promoted best practice methods through knowledge sharing and educational sessions. Officers of the Division worked with stakeholders and were involved in conferences, seminars and numerous in-service programs at various radiography imaging departments. As an example, the findings of a comparative study of computed tomography scans by the Division were presented at the Australian Institute of Radiography conference in March 2007. As a result, a number of centres reduced doses from not only CT but also from other modalities. In addition, a manufacturer made adjustments to the factory preset programs to reduce doses to patients, with ongoing radiation dose reduction benefits to patients. Regulatory framework for uranium mining During 2006−07 the Division continued to work with the Department of Primary Industries and Resources SA (PIRSA) to improve the uranium mining regulatory framework. The Division was actively involved with the Uranium Industry Framework (UIF), an industry, and Commonwealth and state government group, that is also seeking to make regulatory arrangements congruent across jurisdictions, ensure an effective and transparent regulatory regime and ensure effective and efficient coordination between relevant regulatory agencies. The UIF is also considering the training and skills needs for an expanded uranium mining industry in Australia. Review of the Radiation Protection and Control Act The review of the RPC Act is a major project of the EPA, aimed to make necessary improvements to the RPC Act, including the adoption of provisions of the National Directory for Radiation Protection Edition 1 (NDRP) published by the Australian Radiation Protection and Nuclear Safety Agency (ARPANSA) and recommendations of the report on the National Competition Policy (NCP) Review of Radiation Protection Legislation, published in May 2001. During 2005−06 the Division prepared a discussion paper that outlined proposed changes to the RPC Act. The discussion paper was intended to facilitate consultation with stakeholders by advising them of the proposed changes to this Act. In 2006−07 the Division continued work on the review of the RPC Act by developing the foundations for drafting instructions for the new RPC Act. The discussion paper was revised to incorporate additional details arising from the development of the drafting instructions. Consultation with stakeholders had not commenced during 2006−07.
Annual Report 2006−07 Radiation Protection and Control Act 1982
10
Radioactive waste store and repository implementation project A feasibility study of South Australia establishing a store and repository for its radioactive waste, and the suitability of Olympic Dam and Radium Hill for locating the store and repository, was completed during 2005−06. The study recommended that implementing the store and repository at either site was preferable to existing multiple-site arrangements, but noted that Olympic Dam has advantages over Radium Hill. In response to the feasibility study, the government made a commitment to establish the store and repository for the state’s radioactive waste in the Olympic Dam region. The reports on the feasibility study are available at <www.epa.sa.gov.au>. During 2006−07, the EPA considered the requirements and processes for implementing the store and repository in the Olympic Dam region, and held discussions with other government agencies that may be involved in such a project.

Annual Report 2006−07 Radiation Protection and Control Act 1982
11
RADIATION PROTECTION COMMITTEE The Radiation Protection Committee consists of 10 members, one of whom is the Chair, appointed by the governor pursuant to Section 9 of the RPC Act. The Chair must be an officer or employee of the department of the minister to whom the RPC Act is committed (the EPA). The specific qualifications or expertise of other members relevant to the administration of the RPC Act are prescribed in Section 9. Section 10 of the RPC Act provides that the governor may appoint a suitable person to be a deputy member of the committee. The Division provides the committee with administrative support and professional advice. Functions and legislative responsibility The functions of the committee, as set out in Section 12 of the RPC Act, are to: (a) advise the minister in relation to the formulation of regulations under this Act
(b) advise the minister in relation to the granting of licences under this Act, including the conditions to which they should be subject
(c) investigate and report on any other matters relevant to the administration of this Act at the request of the minister or of its own motion.
Membership The current committee, with the exception of one member, Dr S Constantine, was appointed on 1 January 2005 for a three-year term ending on 31 December 2007. The members and deputy members, and the section of the RPC Act under which they were appointed, are listed below.
Members Deputy members Dr P Vogel (Chair) S9(2)(a) Dr S Constantine S9(2)(b) Vacant Ms LM Ingram S9(2)(c) Mr C Kapsis Ms SM Paulka S9(2)(d) Mr KG Smith Dr GS Laurence S9(2)(e) Mr PJ Collins Ms J Shearer S9(2)(f) Dr KH Lokan Dr MI Kitchener S9(2)(g) Dr BE Chatterton Mr S Caplygin S9(2)(h) Mrs TL Jenson Dr PJ Sykes S9(2)(i) Dr MT Lardelli Mr P Dolan S9(2)(j) Mr TF Whitworth
Dr S Constantine was appointed to the committee on 15 March 2007 to fill the position vacated by the radiologist member, Dr TM Cain, who moved interstate and resigned from the committee during the 2004−05 year. The position of deputy radiologist member, which became vacant when Dr Cain resigned, remained vacant. Meetings During 2006−07, the committee met on five occasions and considered many of the matters addressed in this report.

Annual Report 2006−07 Radiation Protection and Control Act 1982
12
ADMINISTRATION OF THE RPC ACT AND REGULATIONS Exemptions granted under the Radiation Protection and Control Act Under Section 44 of the RPC Act, the minister or her delegate is empowered to grant exemptions from any specified provision of the RPC Act, provided such action would not endanger the health or safety of any person. The authority to grant exemptions has been delegated to the director of the Division. After careful consideration by the Division, the director granted several exemptions from regulations under the RPC Act, subject to conditions specified in exemption notices published in the Government Gazette. The exemptions granted included: (a) conditional exemptions from regulation 40 of the Radiation Protection Control (Ionising
Radiation) Regulations 2000 (which specifies practitioners who may authorise exposures or treatments using ionising radiation), permitting diagnostic radiographers to take X-rays authorised by: (i) a neonatal nurse practitioner (ii) a nurse practitioner at an emergency department.
(b) a conditional exemption from regulation 40 permitting diagnostic radiographers to
operate an image intensifier for fluoroscopy at the Port Pirie Hospital and the Riverland Regional Health Service at Berri for certain treatment procedures that are authorised and performed by a general medical practitioner with admitting rights and clinical privileges at the hospitals
(c) a conditional exemption from regulation 40 permitting qualified and registered dental
therapists and hygienists to authorise plain diagnostic radiography on patients presenting with trauma to the dentition or intra-oral pathology
(d) a conditional exemption from regulation 18 (the requirement for employers to provide
personal radiation monitors) was granted to the Australian Water Quality Centre (at Bolivar in South Australia) with regard to staff handling only unsealed radioactive C-14 in Type C premises
(e) a conditional exemption from Section 31 of the RPC Act (licence to operate X-ray
apparatus) for any person undertaking certain courses of study conducted by the University of Adelaide, University of South Australia or the Institute of Technical and Further Education.
Radioactive waste management plans During the 2006-07 reporting period, the Division assessed annual radioactive waste management plans submitted by 24 organisations that use unsealed radioactive substances. Applications for approval of disposal of radioactive waste required under regulations 137 and 138 of the Radiation Protection and Control (Ionising Radiation) Regulations, were incorporated in many of the radioactive waste management plans. Applicants included hospitals, universities, pathology laboratories, commercial laboratories and Commonwealth and state government laboratories. Approval to dispose of unsealed radioactive waste was granted when the waste and the disposal method complied with the requirements of the National Health and Medical Research Council Code of practice for the disposal of radioactive wastes by the user 1985. Radiation incidents and accidents The regulations under the RPC Act require employers of radiation workers, owners of X-ray apparatus or sealed radioactive sources and occupiers of premises where unsealed radioactive substances are used or handled to promptly report any accidents to the Division. Accidents
Annual Report 2006−07 Radiation Protection and Control Act 1982
13
that relate to this requirement are those where a radiation source is no longer under control or a person has received or may have received an accidental exposure to ionising radiation. The Division investigates all radiation accidents and incidents to determine the cause and any remedial action that could be taken to prevent a recurrence. Details of accidents and incidents involving exposure, or potential exposure, to radiation are provided to ARPANSA for inclusion on the National Register of Radiation Accidents and Incidents. Several incidents were reported to the Division during the period of this report:
• An incident involved a high dose rate (HDR) brachytherapy remotely controlled unit that contained a sealed radioactive source. At completion of a patient’s treatment, the source became stuck inside the ‘transfer tube’ while the source was being retracted from the patient’s applicator to the source storage safe. When standard procedures failed to move the source, two medical physicists conducted an emergency procedure and took turns to enter the room to remove the applicator from the patient. Reviewed work protocols included a rigorous program in quality control testing of the whole HDR unit, a replacement of the ‘transfer tube’ at specified periods and the purchase of mobile radiation shields for additional protection of staff.
• A patient suffered a skin erythema (8 cm x 8 cm) on his back as a result of an
angiography procedure. The procedure involved percutaneous transluminal coronary angioplasty with stenting to a right coronary bypass graft. The hospital had taken appropriate steps to minimise exposures and risk from radiation burns during angiography procedures.
• A person assisting with industrial radiography of a storage tank was exposed to
radiation while removing radiographic film from the external surface of the tank. Two industrial radiographers had positioned a gamma camera and source holder on the inside of the tank and due to a communication failure, the assistant removed the film while it was being ‘exposed’ to radiation from the source. When alerted by a radiation detecting and warning device he was wearing the assistant immediately vacated the area. Safety procedures were reviewed and revised to prevent a recurrence.
• A nuclear medicine incident involved an administration of a radiopharmaceutical
tracer for a bone scan to the wrong patient. The referring doctor had placed the wrong patient’s details on the request form. That patient was called down to the Nuclear Medicine Department and as his name (and wrist band) matched the name on the request, the injection was given. The only clue to avoid this was that the clinical history written on the request did not closely match the patient's description of his own symptoms. The nuclear medicine department advised the Division that besides the standard protocol of checking the patient’s name against the name on the request form, the clinical history written on the request form must also be checked with the patient where possible and if there is any doubt the referring clinician needs to be contacted.
• A radiopharmaceutical tracer was spilt at a hospital’s angiography suite during an
injection procedure on a patient’s elbow joint. The needle became detached as pressure was applied to the syringe and the radiopharmaceutical sprayed over the floor, the surface of the C-arm fluoroscopy unit and onto the face and forearms of the nuclear medicine physician who was administering the radiopharmaceutical. The hospital investigated the incident and reviewed protocols and equipment used for the procedure to prevent a recurrence.
Annual Report 2006−07 Radiation Protection and Control Act 1982
14
Radiation emergency response The Division is the agency responsible for providing expert advice to the combatant agency in incidents and emergencies involving radioactive material. During 2006-07, there were two incidents that were attended by the Division in this role. One involved a person who presented at a hospital emergency department mistakenly believing that he had symptoms resulting from exposure to radiation at his workplace. The other involved a small sealed radioactive source, used to calibrate a radiation survey meter, that was found on the tarmac at Adelaide Airport. Officers of the Division participated in the following emergency response related committees:
• State Chemical, Biological, Radiological and Nuclear (CBRN) Committee • State CBRN Committee—Scientific Advisory Group • Health Emergency Management Advisory Committee • Health Emergency Management Response Subcommittee.
The Division provided training to emergency service personnel in response to incidents and emergencies involving radioactive substances, as outlined later in this report. Registration of equipment and premises, and licensing of radiation users Personal radiation licences and registrations of equipment and premises are renewed annually. The numbers of personal licences and registrations that were current, pending renewal or subject to applications under the RPC Act, as at 30 June 2007, are presented in Table 1. Table 1 Personal licences and registrations under the RPC Act
Type of licence or registration Section of RPC Act
Number licensed/ registered
Number subject to application
Licence to use or handle radioactive substances
28 801 43
Licence to operate ionising radiation apparatus
31 3688 66
Registration of ionising radiation apparatus 32 1775 273
Registration of sealed radioactive sources 30 660 39
Registration of premises in which unsealed radioactive substances are handled or kept
29 172 10
In addition to people holding personal radiation licences, it is estimated that 2000−3000 who are not required to be licensed were employed in occupations involving exposure to ionising radiation. These include workers at Olympic Dam, Beverley and Honeymoon uranium projects, workers in Type C premises, operators of cabinet X-ray units and fully enclosed industrial X-ray units, users of industrial radiation gauges and people assisting with medical, dental and veterinary X-ray procedures. Where required under the provisions of the RPC Act, radiation workers’ radiation doses were monitored using approved personal dosimeters. All radiation workers’ doses recorded were below the occupational limits prescribed in the regulations, and the average and median of doses received by all workers were well below occupational limits. Registration of mining operations Some new and proposed mining operations do not involve radioactive ore but may generate process streams and wastes that contain unsealed radioactive materials. Where there is
Annual Report 2006−07 Radiation Protection and Control Act 1982
15
sufficient radiological risk to warrant regulatory oversight, these operations are registered as premises under Section 29 of the RPC Act. Conditions of registration are similar to those attached to licences issued under Section 24 of the RPC Act, to protect people and the environment from radiological hazards. Prominent Hill Prospect was registered on 29 September 2006. Although the average ore grade is below the current regulatory definition of a radioactive ore, the operators (Oxiana Prominent Hill Pty Ltd) sought registration in order to ensure full regulatory compliance once the RPC Act is changed to incorporate NDRP recommendations. As Prominent Hill is considered to present a very Iow radiological risk, the mine will be subject to limited monitoring and reporting requirements to determine the nature and scale of any ongoing regulatory controls that may be required. Registration of former uranium mining and milling sites The former Radium Hill uranium mine, 100 km south-west of Broken Hill, was developed in the early 1950s and operated until its closure in the early 1960s. The northern end of the remaining tailings dam at Radium Hill has been used as a repository for low-level radioactive waste since April 1981 when it was gazetted under the Crown Lands Act 1929 and placed under the care, control and management of the (then) Minister of Mines and Energy. The Port Pirie Treatment Plant processed uranium ore from Radium Hill between 1953 and 1962 and was operated by the (then) Mines Department of SA. It is estimated that approximately 200 000 tonnes of radioactive tailings remain in tailings dams at Port Pirie, on land owned by the state government under the care of the Minister for Mineral Resources Development. Australia is a signatory to the international Joint Convention on the Safety of Spent Fuel Management and on the Safety of Radioactive Waste Management (Joint Convention). To comply with the requirements of the Joint Convention and South Australia’s legal framework for controlling radioactive waste in this state, the EPA sought registration of the Radium Hill and Port Pirie sites under Section 29 of the RPC Act, and both sites were first registered in 2003. The registered occupier of the sites is the Minister for Mineral Resources Development. Conditions that the Division attached to the registrations were the development of appropriate long-term management plans for the sites and site characterisation of both sites. Site characterisation work continued during the reporting period and is expected to be completed in 2007. Licences to mine and mill radioactive ore Licences to mine and mill radioactive ores, issued under Section 24 of the RPC Act, are currently held by:
• WMC (Olympic Dam Corporation) Pty Ltd • Heathgate Resources Pty Ltd (Beverley uranium project) • Southern Cross Resources Australia Pty Ltd (Honeymoon uranium project).
The licences are subject to conditions that include compliance with the Commonwealth Code of Practice on Radiation Protection and Radioactive Waste Management in Mining and Mineral Processing (2005). The Division conducts routine surveillance of uranium mining activities by auditing companies’ monitoring results and conducting inspections and independent monitoring. Each licensed company provides quarterly occupational and environmental radiation monitoring data, including dose assessments, to the EPA. These reports are examined, compared with the Division’s monitoring results where appropriate and reviewed with company officers at quarterly meetings.
Annual Report 2006−07 Radiation Protection and Control Act 1982
16
Reporting procedures for incidents at uranium mines Uranium mining operations in South Australia are required to record and report incidents (for example, spills of process materials) as part of approved radiation management plans. The requirement for radiation management plans arises from conditions attached to the licence to mine or mill radioactive ores granted under Section 24 of the RPC Act. Olympic Dam operations WMC (Olympic Dam Corporation Pty Ltd—now part of the BHP Billiton Group) holds a licence (LM1) for commercial operations under the RPC Act to mine and mill radioactive ores. Licence conditions stipulate annual reporting on the existing and proposed development of the project and details of the wastes produced. The LM1 Report for 2005−06, examined by the Radiation Protection Committee on 7 December 2006, included an annual dose assessment summary, and assessment of the adequacy and effectiveness of radiation protection measures. The dose summary indicated that the average dose for all designated workers in the mine and the processing plant was 3.5 millisieverts (mSv) and 2.2 mSv (17% and 11%, respectively, of the 20 mSv annual dose limit recommended for designated workers). The maximum individual dose received was assessed to be 7.7mSv (39% of the annual dose limit). BHP Billiton’s Annual Report of the Environmental Management and Monitoring Program for 2006 contained results of environmental radiation monitoring and confirmed that the radiological effects of the operation continue to be confined within the mining lease. In particular, any addition to the annual radiation dose to members of the public living in Olympic Dam Village and Roxby Downs was assessed to be less than the detection limit for the methods used (5% of the 1 mSv annual dose limit for members of the public). BHP Billiton is undertaking a pre-feasibility study to expand the existing Olympic Dam copper, uranium, gold and silver mine and processing plant, including all associated infrastructure. Current production rate of uranium is around 4000 tonnes per year, based on mining and processing of around 9 000 000 tonnes of ore per year. Anticipated production of the expanded mine would be 15 000 tonnes per year, based on mining and processing of 40 000 000 tonnes of ore per year. The process of developing an environmental impact statement (EIS) began in 2005. The Division will be one of the bodies that assess the EIS, which is expected to be completed in 2008. One incident was reported under the approved incident reporting procedures for uranium mines. Diesel from an overflowing storage tank nearby, found its way into the calciner building, causing a sump in the drum packing area to overflow. A small amount of product was washed outside the building with the diesel resulting in minor and localised soil contamination. The soil was removed and there was no environmental impact or hazard to workers. BHP Billiton reported the discovery, in April 2007, of 1.5 kg of uranium product samples outside of the lease area. The quality control samples of uranium product were held in 10 small jars and returned to Olympic Dam after analysis in the United States. There is no evidence the uranium product had been released from the containers. The samples presented only a minimal hazard in the packaged form. The unauthorised removal of the samples from the mine site is being investigated by EPA investigators. Officers of the Division visited the site on four occasions for radiation review meetings, inspections and/or workplace monitoring.
Annual Report 2006−07 Radiation Protection and Control Act 1982
17
Beverley uranium project Heathgate Resources Pty Ltd, operators of the Beverley project 600 km north of Adelaide, holds a licence (LM4) under the RPC Act to conduct commercial uranium mining operations, which was renewed for a further 12 months from 4 August 2006. The company’s Occupational Monitoring Program Annual Report 2006 indicated the average annual dose for workers at the Beverley mine was approximately 0.45 mSv (2% of the 20 mSv annual dose limit). The maximum dose received by a worker was approximately 7.6 mSv (38% of the annual dose limit). Environmental monitoring confirmed doses to members of the public as a result of the mining operations were indistinguishable from background radiation levels. Three incidents were reported during 2006−07 under the approved reporting procedures and subsequently considered by the committee. Two incidents involved very minor spills of process solutions. The third involved contamination of the plant potable water supply with uranium process solution following cleaning of the reverse osmosis plant. Equipment and procedure changes were made to prevent a recurrence of the incident. None of the incidents resulted in any injury to workers or represented a risk to the environment. Officers visited the site on two occasions during this reporting period. Honeymoon uranium project Uranium One Australia Pty Ltd was granted a licence under Section 24 of the RPC Act on 6 October 2006 for commercial operations at its Honeymoon site. The Honeymoon project, located around 75 km northwest of Broken Hill, is to be an in-situ leach uranium mine, producing around 400 tonnes per annum of uranium product. The licence was granted after an assessment by the Division and the Radiation Protection Committee. As part of the assessment process, the EPA published the application on its website and invited public submissions. Documents relating to the application and assessment can be found at <www.environment.sa.gov.au/epa/radiation.html>. Construction work was expected to commence at the site in July 2007. Transport of uranium ore concentrate Uranium ore concentrate from Olympic Dam and Beverley is transported by road to Outer Harbor in accordance with the regulations for the safe transport of radioactive substances. It is then exported either directly from Outer Harbor or transported via rail to Darwin for shipment overseas. Transport of uranium ore concentrate from the Olympic Dam and Beverley mines was conducted without incident in the reporting period. Maralinga The former British atomic weapons test site at Maralinga (section 400) is currently Australian Government and and is a licensed facility under the Australian Radiation Protection and Nuclear Safety Act 1998 (Maralinga Facility Licence FV0043). The site includes burial trenches containing radioactive materials, constructed during the Australian Government’s Maralinga Rehabilitation Project, completed in 2000. It is proposed that the Australian Government will return the Maralinga site, including Maralinga Village and the airfield, to the South Australian Government for addition to the Maralinga Tjarutja freehold lands. The Australian Government convenes the Maralinga Consultative Group, which has representation from the Australian Government, South Australian Government (including the Division) and traditional owners, the Maralinga Tjarutja.
Annual Report 2006−07 Radiation Protection and Control Act 1982
18
The consultative group’s tasks include developing a detailed, long-term management plan for the site, the Maralinga Land and Environment Management Plan, which provides for long-term radiation monitoring and surveillance of the site. The Maralinga site would be subject to the provisions of the RPC Act on the return of ownership to South Australia. The consultative group did not meet during this period. Non-ionising radiation The Division advises the government, industry and the public on radiation safety of non-ionising radiation, and continually reviews ongoing research on this issue. Sources of non-ionising radiation include mobile telephones and base stations, powerlines, lasers and solaria used for cosmetic purposes. The harmful effects from exposure to high levels of non-ionising radiation are well known, but whether there are harmful effects from chronic low-level exposure is less clear. The Division responded to a large number of enquiries about mobile telephone systems and powerlines throughout the year. It also contributed to the development of an ARPANSA standard limiting human exposure to the non-ionising radiation produced by powerlines and other electrical devices.
Annual Report 2006−07 Radiation Protection and Control Act 1982
19
TRAINING AND EDUCATION Rural and remote X-ray operator’s radiography course The Division conducted a five-day course in basic radiography for general practitioners and registered nurses who required licences to perform limited radiographic procedures. Fourteen participants successfully completed the course, which was conducted at the University of South Australia’s School of Health Sciences during 25 to 29 September 2006. The EPA commenced discussions with the Country Health SA regarding the future running of this course. Emergency response training The Division ran a series of half-day workshops for South Australian Police and Metropolitan Fire Service emergency service personnel on dealing with incidents and emergencies involving radioactive substances. The workshops were held fortnightly between January and mid-April 2007 and were attended by approximately 40 emergency service personnel. The Division also provided training on radioactive substances for the State Chemical Biological and Radiological Incidents and Emergencies course at the Country Fire Service Training Centre, Echunga, and four half-day workshops for Adelaide Airport Fire Service personnel on the emergency response capabilities of the Division for incidents involving radioactive substances.
Annual Report 2006−07 Radiation Protection and Control Act 1982
20
INTERNATIONAL AND NATIONAL ACTIVITIES Joint Convention on Safety of Spent Fuel Management and on the Safety of Radioactive Waste Management Australia is signatory to the international Joint Convention on the Safety of Spent Fuel Management and on the Safety of Radioactive Waste Management, developed under the auspices of the International Atomic Energy Agency. The Commonwealth Government radiation protection regulator, ARPANSA, collaborates with the radiation protection regulators of the states and territories to progress compliance with the Joint Convention and promote world’s best practice for management of radioactive waste. Australian national reports on compliance with the requirements of the Joint Convention are prepared by ARPANSA with input from state and territory regulators. Each provides information on measures being taken to achieve compliance within their jurisdiction. During the 2006−07 period, the EPA continued in its efforts to progress South Australia’s compliance with the Joint Convention. In this regard, the EPA has maintained surveillance of radioactive waste held in South Australia and taken steps to facilitate improvements in its management. The EPA has also reviewed and contributed to progress of the Radium Hill and Port Pirie remediation projects being undertaken by PIRSA. Radiation Health Committee The Radiation Health Committee (RHC) is established under the Australian Radiation Protection and Nuclear Safety Act. The RHC advises the Chief Executive Officer (CEO) of ARPANSA and the Radiation Health and Safety Advisory Council on matters relating to radiation protection, and develops policies and prepares draft publications for the promotion of uniform national standards for radiation protection throughout Australia and its states and territories. Membership on the RHC includes a radiation protection officer representing each of the states and territories. The South Australian representative is the director of the Division. The RHC met three times during the year and discussed the:
• second edition of the National Directory for Radiation Protection (NDRP) • Code of Practice for the Security of Radioactive Sources • draft code of practice for the pre-disposal management of radioactive waste • standard for limiting exposure to extremely low frequency electric and magnetic fields
(0 Hz−3 kHz) • management of naturally occurring radioactive material in Australia • Code of Practice for the Safe Use of Fixed Radiation Gauges • regulation of solaria and their inclusion in the NDRP as a non-ionising radiation
apparatus • draft code of practice for radiation protection in the medical applications of ionising
radiation • review of the Code of practice for the safe use of ionizing radiation in secondary
schools (1986) • establishment of a National Dose Register for Uranium Workers • strategies for management of Australia’s legacy radium wastes • annual report on the Australian Radiation Incident Register containing information on
incidents that occurred during 2006.

Annual Report 2006−07 Radiation Protection and Control Act 1982
21
Summaries of meetings of the RHC can be found on the ARPANSA website at: <www.arpansa.gov.au/AboutUs/Committees/rhcmt.cfm>. Radiation Health and Safety Advisory Council The Radiation Health and Safety Advisory Council is established under the Australian Radiation Protection and Nuclear Safety Act. It advises the CEO of ARPANSA on a range of matters including emerging issues, matters of major concern to the community and the adoption of codes, standards, recommendations and policies on radiation protection and nuclear safety. An officer of the Division is a member of the council. The council met three times during the year and discussed:
• naturally occurring radioactive material • emerging medical radiation issues • international developments in radiation protection and nuclear safety • progress in developing a standard for limiting exposure to extremely low frequency
electric and magnetic fields • the commissioning of the opal reactor • security of sources • code of practice for radiation protection in dentistry • recent reports on effects of low doses of ionising radiation • radioactive waste management.
National Directory for Radiation Protection In August 1999, the Australian Health Ministers’ Conference (AHMC) affirmed the intent for national uniformity of radiation protection frameworks in a national guidance document, the NDRP, under the management of the RHC. The 2001 NCP Review of Radiation Protection Legislation recommended (Annex 1, Recommendation 9) that jurisdictions participate fully and unconditionally in formulating and implementing the national directory, and reviewing its effectiveness and efficiency within three years of its commencement. ARPANSA published Edition 1 of the directory in August 2004, which was approved by the RHC and endorsed at the AHMC. Edition 1 of the national directory does not apply to the mining and mineral processing industries. The AHMC endorsement was conditional upon additional cost-benefit analysis sufficient to meet subordinate legislation requirements in all jurisdictions of Australia. The cost-benefit analysis was then completed, and by mid-December 2005 all health ministers had confirmed that the additional work satisfied the AHMC conditions. They agreed that adoption of the national directory should proceed. The Division incorporated provisions of the national directory in its review of the RPC Act that was discussed earlier in this report. Development of the draft Edition 2 of the NDRP continued under the guidance of the RHC.

Annual Report 2006−07 Radiation Protection and Control Act 1982
22
OTHER STATUTORY MATTERS The EPA provides resources for administration of the RPC Act and, therefore, statutory reporting requirements concerning the following issues are contained in the EPA Annual Report 2006−07:
• financial performance of the Radiation Protection Committee • account payment performance • contractual arrangements • detection of fraud • occupational health, safety and welfare • use of consultants • human resources • staffing • equal employment opportunity • disability action plan • energy efficiency action plan reports • freedom of information • overseas travel • regional impact assessment statement • sustainability reporting • list of radioactive waste store feasibility study reports.
Annual Report 2006−07 Radiation Protection and Control Act 1982
23
APPENDIX 1 CONFERENCES ATTENDED Two officers attended the Australasian Institute of Mining and Metallurgy conference in Adelaide in July 2006. The officers gave a presentation on the regulation of radiation protection aspects of uranium and mineral sand mining in South Australia. An officer attended the Engineering and Physical Sciences in Medicine EPSM 06 conference at Noosa, Sunshine Coast, Queensland in September 2006. The officer presented a paper on quality assurance testing of mammography X-ray machines. An officer attended the South Pacific Environmental Radioactivity Association conference (SPERA-6) in Melbourne in October 2006. The conference brought together scientists from the South Pacific region in the field of environmental radioactivity, arising from natural processes or human activities. Two officers attended the annual conference of the Australasian Radiation Protection Society in Sydney in November 2006. One officer gave a presentation on regulatory issues in uranium mining, the other gave a presentation on styles of regulation. An officer attended the annual conference of the Australian Institute of Radiography in Perth during March 2007. The officer presented a paper on a comparison of doses from computed tomography apparatus from two hospitals. Two officers attended the Australian Conservation Foundation’s ‘Connect−2007’ conference in May 2007, and gave a presentation on regulation of uranium mining in South Australia.