environment management framework - maharashtra pocra.pdf · environment management framework ......
TRANSCRIPT
Environment Management Framework
ENVIRONMENT MANAGEMENT FRAMEWORK
The Project Director Project on Climate Resilient Agriculture (POCRA)
Government of Maharashtra
30 Arcade, World Trade Center, Cuffe parade, Mumbai-05
Environment Management Framework
Table of Contents
ENVIRONMENT MANAGEMENT FRAMEWORK 6
Executive Summary 6
1.0 PROJECT INTRODUCTION 9
1.1 Background of the Project 9
1.2 Project Development Objective (PDO) 9
1.3 Project Area 9
1.4 Project Components / Sub-Components 9
1.5 Need of Environment Management Framework 10
1.6 Objective and Scope of EMF 10
1.8 Components of Environmental Management Framework (EMF) 11
1.9 Approach and Methodology 12
Key Findings/ suggestions from Consultations 13
2.1 Introduction 15
2.2 CENTRAL GOVERNMENT POLICIES AND LEGISLATION FOR ENVIRONMENT
REGULATION 15
2.2.1 National Water Policy 2012 15
2.2.2 The Water (Prevention and Control of Pollution) Act, 1974 15
2.2.3 The National Environment Policy 2006 15
2.2.4 The Environment (Protection) Act, 1986 16
2.2.5 The Plastic Waste Management Rules, 2016 16
2.2.6 Hazardous Wastes (Management and Handling) Rules, 1989 16
2.2.7 The Wildlife Protection Act, 1972 17
2.2.8 Insecticides Act 1968 and Insecticides Rule 1971 17
2.2.9 Policy for Abatement of Pollution, 1992 17
2.2.10 National Conservation Strategy & Policy on Environment & Development, 1992 17
2.2.11 National Research Centre For Integrated Pest Management (IPM) 18
National Innovations on Climate Resilient Agriculture (NICRA) 18
2.3 GOVERNMENT OF MAHARASHTRA’s POLICIES AND LEGISLATION FOR
ENVIRONMENT REGULATION 19
2.3.1 Integrated Pest Management (IPM) 19
Concept of IPM 19
Objectives 19
Activities 19
Environment Management Framework
Mandate of Central Integrated Pest Management Centers (CIPMCS) and Adoption in Project
Area 20
Approach of IPM for key crops of the state 20
Mobile Apps 21
2.3.2 Water Policy of Government of Maharashtra 21
2.4 APPLICABILITY OF ACTS / POLICIES 22
2.5 World Bank Safeguard Policies and its Implications 23
2.6 Relevant Programmes and Schemes of the Government 24
3.0 Environment Baseline 26
3.1 Topography and Physiography 26
3.2 Geology 26
3.3 Climate 27
3.4 Temperature 27
3.6 Evaporation and Evapotranspiration 30
3.7 Agro-Climatic Zone 30
3.8 Soils 31
3.9 Water Resource 32
3.9.1 Surface Water 33
3.9.2 Ground Water 34
3.11 Forest Cover 35
3.12 Land and Land Use Pattern 36
3.13 Agriculture 38
4.15.2 Pesticides 41
3.16 Climate Vulnerability 42
3.16.1 Climate Change Trends 42
3.16.2 Vulnerability of the State 43
3.16.3 Agrarian Distress 44
4.0 Potential Impact of Environmental Management Framework 47
4.1 Analysis of ‘no project’ Scenario 47
4.3 Analysis of Alternatives 50
4.4 Categorization of Intervention 51
Potential Impacts of the Project 51
4.6 Environment Improvement Measures 56
4.7 Interventions not complying with the Policies/Regulations 57

Environment Management Framework
5.0 Implementation Arrangement 57
5.1 Institutional Arrangement 57
5.2 Project level Institutional arrangement for IPM 57
5.3 Environmental Monitoring 58
5.5 Reporting Plan 58
5.6 Sustainability of Project Interventions 58
6.0 Pest and Nutrient Management Plan 59
6.1 Pest Management Plan 59
6.2 Integrated Plant Nutrient Management Plan 59
6.3 Integrated Plant Nutrient Management at Farm Level 60
6.4 IPM (Integrated Pest Management): 61
6.5 The World Bank Operational Guidelines 62
6.6 Objectives of IPM Plan 62
6.7 Salient Features of the Project Approach: 62
6.8 Capacity Building on IPM 65
6.9 Monitoring and Supervision 65
6.10 Pest and Disease Surveillance 66
Major Activities under IPM Strategy 66
Associated Risks and Mitigation Measures 67
Criteria for Pesticide Selection and Use 68
6.11 Major Insect / Pest by Cultivated Crops and IPM Strategy 69
List of Annexures:
S. No. Annexure No.
1. Screening Checklist of EMF 1
2. Environment Management Plan checklist 2
3. Environmental Guidelines 3

Environment Management Framework
Abbreviations
AMSL Above Mean Sea Level
APMC Agricultural Produce Market Committee
ATMA Agricultural Technology and Management Agency
BBF Broad Bed Furrow
BCM Billion Cubic Meter
BEE
CBO
Bureau of Energy Efficiency
Community Based Organisation
CC Cluster Committee
CGWB Central Ground Water Board
CHC Custom Hiring Centre
CIB & RC Central Insecticides Board and Registration Committee
CPCB
CRPP
Central Pollution Control Board
Climate Resilient Perspective Plan
CSIRO Commonwealth Scientists and Industrial Research Organisation
DPAP Drought Prone Area Programme
DPMU District Project Management Unit
DSAO District Superintending Agriculture Officer
DTR Diurnal Temperature Range
EAMF
EC
Environment Assessment and Mitigation Framework
Electrical Conductivity
EIA Environment Impact Assessment
EMF Environment Management Framework
EMP Environment Management Plan
ETL Economic Threshold Level
FAO Food and Agriculture Organisation
FFS Farmer’s Field School
FLD Field Level Demonstration
FPC Farmer Producer Company
FPO Farmer Producer Organisation
GCA Gross Cropped Area
GHG Greenhouse Gas
GM Genetically Modified
GP Gram Panchayat
ICT Information Communication and Technology
IMD Indian Meteorological Department
INM Integrated Nutrition Management
IPM Integrated Pest Management
IPNM Integrated Plant Nutrient Management
IWMP Integrated Watershed Management Program
JSA Jalayukt Shivar Abhiyan
KVK Krishi Vigyan Kendra
LGP Length of Growing Period
LP Linear Programming
MCIC / CIC Maharashtra Climate Innovation Centre
MCM Million Cubic Meter
MF Marginal Farmer
MGNREGS Mahatma Gandhi National Rural Employment Guarantee Scheme
MI Micro Irrigation
MSAMB Maharashtra State Agriculture Marketing Board

Environment Management Framework
MWRRA Maharashtra Water Resources Regulatory Authority
NBSSLUP National Bureau of Soil Survey and Land Use Planning
NIDM National Institute for Disaster Management
NPK Nitrogen, Phosphorous and Potash
NSA Net Sown Area
OC Organic Carbon
PCN Project Concept Note
PCR Physical Cultural Resource
PDO Project Development Objective
PMU / SPMU Project Management Unit (State)
PoCRA Project on Climate Resilient Agriculture
PPE
PRI
Personal Protective Equipment
Panchayati Raj Institution
RF Rain Fall
RKVY Rashtriya Krishi Vikas Yojana
SAU State Agriculture University
SDAO Sub-Divisional Agriculture Office
SF Small Farmer
SFAC Small Farmer Agri-Business Consortium
SOC Soil Organic Carbon
SOM Soil Organic Matter
SREP
SRR
Strategic Research and Extension Plan
Seed Replacement Rate
TAO Taluka Agriculture Officer
TDET Technology Development, Extension and Training
TDS Total Dissolved Solid
TMC Terminal Market Complex
TMC Technology Mission on Cotton
VCRMC
WHS
Village Climate Resilient Agriculture Management Committee
Water Harvesting Structure
WUA Water User Association
WUE Water use Efficiency

ENVIRONMENT MANAGEMENT FRAMEWORK
Executive Summary
Project Background:
The Government of Maharashtra has approved a project on Climate Resilient Agriculture (PoCRA) to
address the drought related vulnerability in the agriculture sector with the support of World Bank.
Essentially, it is proposed to enhance the resilience of the farmers practicing rainfed farming from vagaries
of climate change and thus ensure stable and secured livelihood, especially, to the poor and vulnerable
farming communities in the state.
The Project Development Objective (PDO) is “to enhance climate-resilience and profitability of smallholder
farming systems in selected districts of Maharashtra”. The project will be implemented in 4210 drought
prone villages and 932 salinity affected villages in Purna river basin spread across 15 districts of the State.
The project has main three components
(1) Promoting Climate Resilient Agriculture Systems
(2) Climate Smart Post-Harvest Management and Value Chain Promotion, and
(3) Institutional Development, Knowledge and Policies for a Climate-resilient Agriculture.
Objectives of the EMF:
Based on the project design, the overall environmental impacts of the project would be positive hence it has
been classified as “category B” (partial assessment) project as per the World Bank’s Operational Policy on
Environmental Assessment (OP 4.01). However, if any project intervention if not implemented properly
there may have some temporary and localized adverse impacts for which the suitable mitigations measures
outlined in the environment management plan and through the promotion of recommended package of
practices. Best practice measures and mitigation strategies are also recommended where appropriate to
improve the environmental performance of the project activities.
Thus Environment Mitigation Framework (EMF) has been prepared with the overall objective of guiding the
project in implementation of major activities in line with the identified risk mitigation strategies, making the
interventions socially and environmentally sustainable.
Approach and Methodology:
A participatory and consultative approach has been adopted to prepare EMF and its components. Project
stakeholders at various levels viz state, district and sub district level, including small and marginal farmers
(men and women), tribal, marginalized social groups, and experts were consulted. Their views and concerns
have been incorporated in EMF document.
Components of the EMF: Environment Management Framework will include: (i) basic criteria and procedures for screening all
interventions, and guide the design and implementation of activities; (ii) scope and application of the EMF
for similar impact typologies; (iii) mitigation action to contain, minimize and/or reverse identified adverse
impacts; (iv) good practices guidelines for specific investments; (v) Technical guidelines on specific
activities; and (vi) Specific strategies such as pest and nutrient management; NRM strategy to enhance
climate resilience of farmers including marginal and landless households; strategy to integrate mitigation
measures and other resilience enhancing approaches in cluster level plans, etc.
Apart from above capacity building plan, implementation arrangements, budget and monitoring & evaluation
system will be an integral part of environment management framework.
Legal and Regulatory Framework:
The key Policies, Laws and Regulations of Central and State Government, that are applicable to the project
are like (1) National Environment Policy 2006, (2)National Water Policy 2012, (3) Policy on Abatement of
Pollution 1992, (4) National Conservation Strategy & Policy on Environment & Development 1992, (5) The
Water (Prevention and Control of Pollution) Act, 1974 and the Air (Prevention & Control of Pollution) Act,
1981, (6) The Environment (Protection) Act, 1986, (7) The Solid Waste Management Rules, 2016, (8) The
Wildlife Protection Act, 1972, (9) Insecticides Act, 1968 and Insecticides Rules, 1971, (10) Water Policy
2003 of Government of Maharashtra, (11) Maharashtra Felling of Trees (Regulation) Act, 1964 and
Guidelines for Tree Felling and Transit Permission, 2017 etc.
Environment Management Framework
World Bank Safeguard Policies:
In line with World Bank Operational Policy OP 4.01, Environmental Assessment has been undertaken and
the Environment Management Framework is developed. In accordance to OP 4.09, a Pest Management Plan
(PMP) has been prepared. The screening activity will be taken up for OP 4.04 (Natural Habitat), 4.36
(Forest) and OP 4.11 (Physical Cultural Property) in the sub-project cycle to ensure that any Natural Habitat,
Forest and/or Physical Cultural property are not affected and appropriate avoidance or mitigation measures
are to be put in place.
Environmental Issues:
The key environmental issues that are having implications for the project are (1) high climate vulnerability of
some of the project districts (2) Variability of rainfall in pre-monsoon and post-monsoon period. Rainfall
confined to monsoon only. It has impact on agricultural activities (3) Decreasing trend in rainfall in monsoon
months in project districts; High evaporation / evapotranspiration in some of the project districts. (4) Soil of
most of the project districts have low Nitrogen and Phosphorous (5) Land not available for cultivation (non-
agricultural use and barren and uncultivable land) is gradually increasing; and the fallow land (current
fallow) is increasing. (6) Predominantly land holdings are small or marginal and 78.98 percent farmers
holding less than or equal to two ha land (7) deficient water availability with overexploited ground water in
some of the project talukas whereas less utilization of irrigation potential, (8) increasing use of chemical
fertilizers and pesticides for higher production / productivity etc.
Potential Environmental Impacts of Project Activities:
Based on the nature of activities framed under the project and categorized into “No Impact”, “Low Impact”
or “Moderate Impact” on the environment. Categorization of activities is largely based on the
implementation process and its expected impact. The impact categories may not be constant across the
project clusters and same activity may not have same level of impact across all the project districts and
clusters. Infrastructure development activities can be categorized under “Moderate Impact” level due to
associated construction related issues, energy consumption, expected generation of wastes etc. that require
appropriate management. Similarly, activities under ‘low impact’ are not expected to cause any significant
negative impact. Best practice measures and mitigation strategies are also recommended where appropriate
to improve the environmental performance of the project activities.
Interventions not complying with the Policies/Regulations:
Project interventions with severe environmental impacts and those not complying with the
policies/regulations of GoM, GoI, and World Bank’s safeguard policies should not be promoted under
HPHDP. These activities includes- Digging of bore well / deep bore well without ground water recharging
structure will not be supported; No activity will be carried out in Critical or Endangered Natural Habitats (as
certified); Embankment / check dam exceeding 10 meters in height will not be supported; Pesticides will not
be supported classified in Class Ia, Ib and II of WHO classification and banned by the GoI; purchase, stock,
sale, distribution or exhibition of pesticides and chemical fertilizers will not be supported without the
requisite licenses.
Mitigation Measures: Listing out the realistic, effective, and practical mitigation measures to address and
manage the spectrum of potential environmental risks and impacts, identified during assessment.
Pest Management Plan An appropriate strategy has been proposed to minimize the environmental impacts of pesticides and nutrition
deficiencies. This includes a detailed strategy on IPNM (Integrated Pest and Nutrition Management) and
IPM (integrated Pest Management) in project area. The project is conscious of the fact that there could be
several externalities (not necessarily related to project) may induce pesticide use with or without the project
interventions. The project will document those externalities during the 2nd
and 4th year of project
implementation.
Environment Management Framework
Integrated Plant Nutrient Management Plan (IPNMP):
Integrated Plant Nutrient Management (IPNM) includes soil, nutrient, water, crop, and vegetation
management practices, tailored to a cropping and farming system appropriate to Marathwada and Vidharbha
regions of Maharashtra. The IPNM aims at improving and sustaining soil fertility and land productivity and
reducing environmental degradation. IPNMP optimizes the condition of the soil, with regard to its physical,
chemical, biological and hydrological properties, for the purpose of enhancing farm productivity, while
minimizing land degradation. The field level management practices considered under IPNM would include
the use of farmyard manures, natural and mineral fertilizers, soil amendments, crop residues and farm
wastes, agro-forestry (suitable cases) and tillage practices, green manures, cover crops, legumes,
intercropping, crop rotations, irrigation, drainage, and a variety of other agronomic, vegetative and structural
measures designed to conserve both water and soil.
IPM (Integrated Pest Management):
IPM combines different approach to control the pests, minimize the economic loss and protect the
environment. IPM is a broad ecological approach of pest control employing different appropriate and
suitable methods and techniques in an integrated manner to keep pest population below Economic Threshold
Level (ETL) and also reduces the residual effects of chemicals on both plants and animals. The project will
adopt Integrated Pest Management (IPM) as the key strategy to combat pests and diseases in the project and
regulate its environmental impact. However, appropriate strategy to be adopted for its promotion among the
farmers like sensitization and awareness on environment impact of indiscriminate use of pesticides,
educating farmers on restricted and banned pesticides, regular orientation training and follow up, providing
hand holding / field guidance and monitoring the implementation of IPM.
Institutional Arrangement: The project will make required institutional arrangement to ensure EMF
compliance of the project components as per the EMF. A dedicated project official at the PMU level will be
the responsible person to guide the overall process related to environmental aspects. The district / sub-district
level implementing agencies will be given required training to execute and monitor the environmental
components in consultation with the PMU. They will be associated in the screening process of such activities
that require detail environmental plan and will monitor the processes followed in execution of the planned
activities and realization of the environment safeguard norms. It will be ensured that the project interventions
are consistent with the agreed strategies and framework.
Capacity Building Plan: The official/s dealing with environmental aspects at the project management unit
and district project management unit be oriented on environmental aspects with an objective to equipped
them well by which they can manage the concerned components of the project effectively and efficiently.
The capacity building on environmental aspects would take into account the current environmental issues in
the State / project districts, project specific initiatives to adapt to the changes and taking mitigating measures.
The project will also take up awareness and sensitization drive at community level (cluster / village level) to
educate people on impacts of climate variability on agriculture and measures to be taken.
Monitoring and Evaluation: Project has developed an M&E system and indicators for all components
which are to be monitored and evaluated, under which feedback from beneficiaries and data from the field is
systematically collected and analyzed. EMF will be integral part of such M&E mechanism and this will be
helpful in taking informed decisions and making any mid-course correction in implementation strategy and
activities. The M&E system will be closely linked with the project’s results framework also provides a
mechanism for third party audit to ensure that environmental due diligence is being conducted in accordance
with the provisions of the EMF.
Budget: EMF will be a part of complete implementation strategy at field level through FFS approach and
other climate resilient interventions. Various steps of EMF i.e. identification, screening, scrutiny, applicable
guidelines for particular activity/crop will be inbuilt steps under project interventions. There is sufficient
fund allocation for various component and subcomponents for project interventions. Thus, there is no need
for separate budget allocation for EMF activities.

Environment Management Framework
1.0 PROJECT INTRODUCTION
1.1 Background of the Project
The Government of Maharashtra has approve
address the drought related vulnerability in the agriculture sector. Essentially, it is proposed to enhance the
resilience of the farmers practicing rainfed farming from vagaries of climate change and
and secured livelihood, especially, to the poor and vulnerable farming communities in the state.
1.2 Project Development Objective (PDO)
The Project Development Objective (PDO) is “to enhance climate
farming systems in selected districts of Maharashtra”.
1.3 Project Area
The project is in the State of Maharashtra in India. Maharashtra is the second largest state in the country in
terms of population1 and has geographical area about 3.08 lakh sq
having a population density of about 365 persons per sq. km. The state is geographically located in the
western and central parts of the country and has a long coastline along the Arabian sea of about 720 km.
The project would promote adoption of climate resilient agriculture technologies, duly integrated with
community led soil and water
management practices, in the project
area. There are 18768 villages in the
project area. Out of these, PoCRA plans
to intervene in about 4000 drought
affected villages (3,000 in Marathwada
and 1000 in Vidarbha) and 932 salinity
affected villages in Purna river basin.
Thus, the total number of villages
proposed to be covered under the
project is about 5,000.
1.4 Project Components /
Components
The project has three components
namely (A) Promoting Climate Resilient Agriculture Systems (B) Climate Smart Post
and Value Chain Promotion and (C) Institutional Development, Knowledge and Policies for a Climate
resilient Agriculture.
Under component A, there are three sub component i.e. A.1: Participatory development of mini watershed
plans A.2: On-farm climate-resilient technologies and farming systems and A.3: Climate
development of catchment areas. Under Com
Farmer Producer Companies B.2: Strengthening emerging value
1 As per population census, 2011 the population of the State is 11.24 crore which is 9.3 per cent of the total population of In
2About 45.2 per cent people residing in urban areas
Environment Management Framework
PROJECT INTRODUCTION
The Government of Maharashtra has approved a Project on Climate Resilient Agriculture (PoCRA) to
address the drought related vulnerability in the agriculture sector. Essentially, it is proposed to enhance the
resilience of the farmers practicing rainfed farming from vagaries of climate change and
and secured livelihood, especially, to the poor and vulnerable farming communities in the state.
Project Development Objective (PDO)
The Project Development Objective (PDO) is “to enhance climate-resilience and profitability of smal
farming systems in selected districts of Maharashtra”.
The project is in the State of Maharashtra in India. Maharashtra is the second largest state in the country in
and has geographical area about 3.08 lakh sq. km. The state is highly urbanized
having a population density of about 365 persons per sq. km. The state is geographically located in the
western and central parts of the country and has a long coastline along the Arabian sea of about 720 km.
roject would promote adoption of climate resilient agriculture technologies, duly integrated with
community led soil and water
management practices, in the project
area. There are 18768 villages in the
these, PoCRA plans
n about 4000 drought
affected villages (3,000 in Marathwada
and 1000 in Vidarbha) and 932 salinity
affected villages in Purna river basin.
Thus, the total number of villages
proposed to be covered under the
Project Components / Sub-
The project has three components
namely (A) Promoting Climate Resilient Agriculture Systems (B) Climate Smart Post
and Value Chain Promotion and (C) Institutional Development, Knowledge and Policies for a Climate
Under component A, there are three sub component i.e. A.1: Participatory development of mini watershed
resilient technologies and farming systems and A.3: Climate
development of catchment areas. Under Component B, there are three sub components i.e. B.1: Promoting
Farmer Producer Companies B.2: Strengthening emerging value-chains for climate
As per population census, 2011 the population of the State is 11.24 crore which is 9.3 per cent of the total population of In
About 45.2 per cent people residing in urban areas
d a Project on Climate Resilient Agriculture (PoCRA) to
address the drought related vulnerability in the agriculture sector. Essentially, it is proposed to enhance the
resilience of the farmers practicing rainfed farming from vagaries of climate change and thus ensure stable
and secured livelihood, especially, to the poor and vulnerable farming communities in the state.
resilience and profitability of smallholder
The project is in the State of Maharashtra in India. Maharashtra is the second largest state in the country in
. km. The state is highly urbanized2 and
having a population density of about 365 persons per sq. km. The state is geographically located in the
western and central parts of the country and has a long coastline along the Arabian sea of about 720 km.
roject would promote adoption of climate resilient agriculture technologies, duly integrated with
namely (A) Promoting Climate Resilient Agriculture Systems (B) Climate Smart Post-Harvest Management
and Value Chain Promotion and (C) Institutional Development, Knowledge and Policies for a Climate-
Under component A, there are three sub component i.e. A.1: Participatory development of mini watershed
resilient technologies and farming systems and A.3: Climate-resilient
ponent B, there are three sub components i.e. B.1: Promoting
chains for climate-resilient commodities
As per population census, 2011 the population of the State is 11.24 crore which is 9.3 per cent of the total population of India

Environment Management Framework
and B.3: Improving the performance of the supply chain for climate-resilient seeds. Component C, consist of
three sub component i.e. C.1: Sustainability and institutional capacity development C.2: Maharashtra
Climate Innovation Center and C.3: Knowledge and policies
The project envisages increasing access to water, improving farm productivity by adopting climate resilient
agricultural practices, soil management and adoption of water conservation technologies, and providing
agro-meteorological services to farmers. In order to improve the market share of the agriculture produce at
the producer’s end, the project intends to promote / strengthen supply chain and value chain of select
agricultural / horticultural commodities, using Farmer Producer Organizations (FPOs) / Farmer Producer
Companies. Project intends to establish Maharashtra Climate Innovation Centre (MCIC) for knowledge
sharing and learning for climate resilient technologies and practices in different segments, including
agriculture and allied sectors.
1.5 Need of Environment Management Framework
It is anticipated that environmental issues and impacts would be minimal since the project’s underlying
objective is to improve the climate resilience of smallholder farming systems in selected districts of
Maharashtra. Overall, the project related impacts are mostly positive, hence, it has been classified as
category B project (partial assessment) under World Bank environmental classification of projects. The
project design ensures that it will not intervene in any critical natural habitats, wildlife sanctuaries, tiger
habitats located in Marathwada and Vidarbha regions.
Keeping in view the farmers’ vulnerability to climate variability and current biophysical & socio-economic
condition of the regions, an ‘Environmental Management Framework (EMF) has been prepared. The EMF is
in line with GoM and World Bank operational safeguards policies and addresses the potential environmental
impacts of the project along with mitigation strategy to minimize the concern, improve resilience and
adaptive capacity of stakeholders.
This EMF identifies the responsibilities of project stakeholders, procedures for environmental and social
safeguards screening and enhancing institutional capacity. The environment assessment will guide the
project in implementing major activities in line with the identified risk mitigation strategies, making the
interventions socially and environmentally sustainable.
1.6 Objective and Scope of EMF
The objective of the EMF is to “Comply with the legal framework, and establish procedures and methods for
environmental screening & assessment along with environmental impact of the project”.
The scope of EMF will be to provide essential baseline data, confirm policies that are triggered, and assess
likely impacts of the project interventions. The EMF will propose mitigation measures for any adverse
impacts that may be envisaged through the design and construction phases of various project interventions.
The participatory environment assessments will be conducted with due and extensive consultations with all
the stakeholders, especially, the poor and vulnerable farming community. Further, the EMF will also outline
arrangements for consultations with the stakeholders and disclosures thereof both during preparation as well
as implementation phases. Preparation of the ESMF included the following stages:
● Develop environmental baseline
Environment Management Framework
● Stakeholder analysis and consultation
● Legal and policy framework
● Analysis of Key Environmental and Climate Risks and Vulnerabilities
● Potential Mitigation Measures
Environmental Baseline: Developing a summary of existing environment baseline in the state of
Maharashtra with particular reference to the project areas from the existing literature and technical
documents. In particular, the assessment covered different environmental aspects, such as climate, land use
pattern, agriculture, fertilizers and pesticide consumption, forest cover, production and yield of different
crops, livestock, irrigation and water resources.
Stakeholder Analysis and Consultations: Identification of key stakeholders who are expected to be
associated in the project / benefitted due to the project, directly or indirectly, and describe their roles,
responsibilities and relationship with the project activities. In the assessment process, consultations with the
identified stakeholders helped to understand their concerns and their inputs helped in preparing the
management framework.
Legal and Policy Environment: Providing a brief coverage of the existing legal and policy environment in
relation to the project, (GoI and GoM) which may be applicable to the project investments. Also,
determining the World Bank safeguards policies that will be applicable to the project. Enlisting and
summarizing ongoing relevant development programs and schemes in the project districts is objectively
discussed to foster convergence in relevant areas.
Analysis of Key Environmental and Climate Risks and Vulnerabilities: Providing a summary of types of
risks and impacts that may result from the anticipated activities interacting with environmental baseline
typologies, and what probability, magnitude, duration and geographic scope these risks and impacts could
assume. The assessment would include cumulative and induced impacts (where applicable), highlighting the
positive environmental aspects of introducing such activities and the benefit linked to project outcomes.
Potential Mitigation Measures: Listing out the realistic, effective, and practical mitigation measures to
address and manage the spectrum of potential environmental risks and impacts, identified during assessment;
and rough estimates for the cost of mitigation measures.
1.8 Components of Environmental Management Framework (EMF)
Environment Management Framework will include:
(i) basic criteria and procedures for screening all interventions, and guide the design and implementation of
activities; (ii) scope and application of the EMF for similar impact typologies; (iii) mitigation action to
contain, minimize and/or reverse identified adverse impacts; (iv) good practices guidelines for specific
investments; (v) Technical guidelines on specific activities; and (vi) Specific strategies such as pest and
nutrient management; NRM strategy to enhance climate resilience of farmers including marginal and
landless households; strategy to integrate mitigation measures and other resilience enhancing approaches in
cluster level plans, etc.
The EMF includes the following arrangements in an integrated manner.

Environment Management Framework
Capacity Building Plan: Given that the objective is to mainstream environmental safeguards in planning
and implementation, a robust capacity building plan for various levels of stakeholders is suggested which
may be suitably modified in the course of implementation, taking into account the project requirement.
EMF Implementation Arrangements: Establish a clear understanding of the institutional requirements,
roles and responsibilities for adopting and implementing the EMF. Importantly, this includes a thorough
review of the authority and capability of institutions at different levels (e.g. block, district and state) and their
capacity to manage and monitor EMF implementation.
Budget for EMF: EMF will be a part of complete implementation strategy at field level through FFS
approach and other climate resilient interventions. Various steps of EMF i.e. identification, screening,
scrutiny, applicable guidelines for particular activity/crop will be inbuilt steps under project interventions.
There is sufficient fund allocation for various component and subcomponents for project interventions. Thus,
there is no need for separate budget allocation for EMF activities.
Monitoring and Evaluation System for EMF: Project has developed an M&E system and indicators for all
components which are to be monitored and evaluated, under which feedback from beneficiaries and data
from the field is systematically collected and analyzed. EMF will be integral part of such M&E mechanism
and this will be helpful in taking informed decisions and making any mid-course correction in
implementation strategy and activities. The M&E system will be closely linked with the project’s results
framework and avoid duplication in collection of similar information. The M&E system also provides a
mechanism for third party audit to ensure that environmental due diligence is being conducted in accordance
with the provisions of the EMF. Thus there is no need to develop separate monitoring and evaluation
mechanism for EMF part and will be taken care under project’s Monitoring and Evaluation system.
1.9 Approach and Methodology
A participatory and consultative approach has been adopted to prepare EMF and its components. Project
stakeholders at various levels, including small and marginal farmers (men and women), tribal, marginalized
social groups, and experts were consulted. Their views and concerns have been incorporated in this
document.
Literature Review- A detailed & in-depth literature review on existing information helped in gaining a
further and deeper understanding of the proposed project. A desk review of the central & state govt. legal
framework and policies was also conducted in order to get information on the relevant legislations and policy
documents that should be considered during project implementation. ➢ World Bank Related Documents -Aide Memoires; World Bank Safeguards Policies and Procedures ➢ Central and Govt. of Maharashtra Legislative Documents-National Water Policy, National Policy on
Environment, Health and Sanitation policy, Plastic Waste Management, Wildlife Protection Act etc.
Review of Secondary data and collection of primary data- Collection and review of the existing
secondary data sources mainly consisted of reports, statistics including census information and online
publications of the Government of India and the Government of Maharashtra. These datasets was analyzed to
illustrate the existing environmental situation, prepare the respective management plans including screening
mechanism for the proposed interventions, and prepare plan for capacity building of stakeholders. Primary

Environment Management Framework
data collection consisted of field visit to existing interventions of the Government of Maharashtra that have
close resemblance with the climate resilient interventions.
Field visits and Interactive Discussions
Stakeholder consultations were conducted as following-
S. No. District Taluka Date Stakeholders
1. Amravati Dharni 16/11/2016 ● Government officials including DSAO, ATC
● Research institutes like KVKs, VNMK
● APMC
● Farmers (small, marginal and large) including
women
● Tribal communities
● Communities based organizations- SHGs,
Common Interest Groups, Farmer Producer
Organizations
● Input suppliers
● Local Bodies / PRIs
2. Amravati Dharni 17/11/2016
3. Akola Telhara 18/11/2016
4. Akola Telhara 19/11/2016
5. Jalna Ghansavangi 20/11/2016
6. Latur Latur 21/11/2016
7. Latur Latur 22/11/2016
To understand the expected project risks and people’s perception on the project, field visits were conducted
in different agro-climatic zones of Maharashtra wherein the project area lies. The field visit and stakeholder
consultations were conducted in four districts out of 15 project districts. One taluka (block) each was visited
in 4 districts. The selection of the districts for field visit and stakeholder’s consultation was based on the
vulnerability index as calculated in Maharashtra State Adaptation Action Plan on Climate Change
(MSAAPCC), 2014. Similarly, the Human Development Index (2012) of all project districts was considered
for the selection of districts. In addition to the community level consultations, different service providing
agencies like MAHABEEJ (Maharashtra State Seeds Corporation Ltd.), officials of ATMA, private input
suppliers, KVK officials etc. were consulted.
Apart from field level consultations, state level consultations were carried out with different state
level institutions, organizations, FPCs etc. and their views were also examined and suitably incorporated in
the management framework.
Key Findings/ suggestions from Consultations
1. Lack of access to irrigation facilities coupled with long dry spells affect the production and
productivity of crops. Farmers normally suffer from non-availability of water, even during Kharif.
Protective irrigation is essential to save standing crops in dry spells and the project can take this up
as one area of intervention.
2. The current practice of groundwater exploitation and filling up of the farm pond is to be evaluated
scientifically to understand the evaporation rate. People normally extract the charged ground water in
monsoon to fill the ponds. However, current practice is less sensitive to recommended adaptation
measures as exposed surface area of the water increases evaporation.
3. The current initiative to deepen the natural drainages may be scientifically examined.
Environment Management Framework
4. The project may take concrete measures to prevent burning of farm residues.
5. Current practices of fertiliser and pesticide use may pose risk to human health. The project may
promote safety measures through orientation and demonstration.
6. In the Saline-Sodic track, special measures are required. As utilisation of groundwater for irrigation
increases sodicity of the soil, maximum use of surface water is to be promoted. The groundwater
may be treated with Gypsum before field application.
7. Promotion of BBF, deep drainage line (taking the whole area into account) and green manuring
methods can reduce soil sodicity. Integrated reclamation technology would be beneficial to the
saline-sodic track.
8. Use of polythene in farm fields (except saline-sodic track) for mulching may be discouraged and
appropriate dispose-off plan to be prepared for recycling / destroying the polythene sheets.
Vegetative / dry leaves / plant residues may be used instead of polythene sheets.
9. Protected cultivation with drip and sprinkler irrigation system should be promoted widely.
10. Village / cluster level water budgeting may be helpful to understand the water requirement and
preparing water conservation plans accordingly.
11. Artificial ground water recharging methods can be introduced in project villages / clusters.
12. Some of the advance farmers have adopted modern techniques along with traditional techniques.
One of the means they have adapted is to save input cost by utilizing farm byproducts and biomass
as mulching and manuring material. Some of them have resorted to using organic fertilizers and
pesticides instead of synthetic ones. Project may think of promoting such approaches which will
reduce cost of cultivation.
Environment Management Framework
2.0 LEGAL AND REGULATORY FRAMEWORK
2.1 Introduction
Under legal and regulatory framework, various policies and legislation of the Government of India and the
Government of Maharashtra that may have bearing on the Project are presented. This is followed by a brief
description of the relevant development programmes and schemes being implemented by the Government of
India and the Government of Maharashtra. Later, at the end of the section, the World Bank Safeguard
Policies are presented.
2.2 CENTRAL GOVERNMENT POLICIES AND LEGISLATION FOR ENVIRONMENT
REGULATION
2.2.1 National Water Policy 2012
The policy notes that climate change is likely to increase the variability of water resources affecting human
health and livelihoods. Therefore, special impetus is to be given towards mitigation at micro level by
enhancing the capabilities of community to adopt climate resilient technological options. According to the
policy, water should be treated as an economic good so as to promote its conservation and efficient use. In
the preamble, it is stated that water availability for various users including agriculture will be under strain in
future due to a range of causatives like increasing needs of growing population, wastage, inefficient use and
pollution etc. The policy mentions that, depletion of groundwater should be arrested by introducing
improved technologies of water use, incentivizing efficient water use and encouraging community based
management of aquifers.
2.2.2 The Water (Prevention and Control of Pollution) Act, 1974
The Water Act provides for the prevention and control of water pollution. As per this Act, Central Pollution
Control Board and State Pollution Control Boards are established at the National and State level as
implementation mechanism. Main functions of the State Boards are, (a) to plan a comprehensive programme
for the prevention, control or abatement of pollution of streams and wells in the State and to secure the
execution thereof; (b) to advise the State Government on any matter concerning the prevention, control or
abatement of water pollution; (c) to collect and disseminate information relating to water pollution and the
prevention, control or abatement thereof; (d) to encourage, conduct and participate in investigations and
research relating to problems of water pollution and prevention, control or abatement of water pollution.
2.2.3 The National Environment Policy 2006
It is formulated in response to citizen's' right to clean environment, mandated in the Constitution in Articles
48 A and 51 A (g), strengthened by judicial interpretation of Article 21. It is recognized that maintaining a
healthy environment is not the state's responsibility alone, but also that of every citizen. It is intended to
mainstream environmental concerns in all development activities. The policy states that Environmental
degradation is a major causal factor in enhancing and perpetuating poverty, particularly among the rural
poor, when such degradation impacts soil fertility, quantity and quality of water, air quality, forests, wildlife
and fisheries. It is stated that the poor are also more vulnerable to loss of resilience in ecosystems. Large
reductions in resilience may mean that the ecosystems, on which livelihoods are based, break down, causing
distress.
Environment Management Framework
In response to the rapid depletion of groundwater, the policy intends to promote efficient water use
techniques, such as sprinkler or drip irrigation, among farmers. Similarly, it intends to provide necessary
pricing, inputs, and extension support to feasible and remunerative alternative crops which may be raised by
efficient water use. One of the important action points in the policy with reference to the climate change is to
assess the need for adaptation to future climate change, and the scope for incorporating these in relevant
programmes, including watershed management, coastal zone planning and regulation, forestry management,
agricultural technologies and practices, and health programmes
2.2.4 The Environment (Protection) Act, 1986
The genesis of the Environmental (Protection) Act, 1986, is in Article 48A (Directive Principles of State
Policy) and Article 51A (g) (Fundamental Duties) of the Indian Constitution. The Act empowers the Central
Government to take all appropriate measures to prevent and control pollution and to establish effective
machinery for the purpose of protecting and improving the quality of the environment and protecting
controlling and abating environmental pollution. This Act also empowers and authorizes the Central
Government to issue directions for the operation or process, prohibition, closure, or regulation of any
industry. The Central Government is also authorized to stop, regulate the supply of electricity or water or any
other service directly without obtaining the order of the Court in this regard.
2.2.5 The Plastic Waste Management Rules, 2016
The rules are meant to exercise the powers conferred by sections 3, 6 and 25 of the Environment (Protection)
Act, 1986. These rules apply to every waste generator, local body, Gram Panchayat, manufacturer, Importers
and producer. Rule 3 defines, among other definitions, plastic waste management as ‘the collection, storage,
transportation reduction, re-use, recovery, recycling, composting or disposal of plastic waste in an
environmentally safe manner’. Rule 4 sets conditions for manufacture, stocking, distribution, sale and use of
carry bags and plastic sheets. As per rule 6(1) ‘Every local body shall be responsible for development and
setting up of infrastructure for segregation, collection, storage, transportation, processing and disposal of the
plastic waste either on its own or by engaging agencies or producers’. Rule 8 provides for responsibility of
waste generator that includes not to litter the plastic waste, segregation, storage of waste at source and
handover segregated waste to the appropriate agency appointed by the local body or gram panchayat. As per
the rule 9, the producers need to establish a system for collecting back the plastic waste generated due to
their products.
2.2.6 Hazardous Wastes (Management and Handling) Rules, 1989
The Hazardous Wastes (Management and Handling) Rules, 1989 are to exercise the powers conferred by
sections 6, 8 and 25 of the Environment (Protection) Act, 1986 (29 of 1986). These rules apply to hazardous
wastes as specified in the Schedule appended to the rules. There are 18 categories of the hazardous waste
listed in the schedule. As per the rule 4(1), the person generating hazardous wastes shall take all practical
steps to ensure that such wastes are properly handled and disposed of without any adverse effects which may
result from such wastes and he shall also be responsible for proper collection, reception, treatment, storage
and disposal of these wastes.
Environment Management Framework
2.2.7 The Wildlife Protection Act, 1972
The Wildlife (Protection) Act of 1972 provides the basic framework to ensure the protection and
management of wildlife. The Act was amended subsequently in 1982, 1986, 1991 and 1993 to accommodate
provision for its effective implementation. Animals included in the schedule are to be provided total
protection from hunting and the trade and commerce related to such animals are strictly regulated. Specified
plant species to be protected by the Wildlife (Protection) Amendment Act of 1991 (The schedule VI).
Further by addition of provision, immunization of livestock within a radius of 5 km from a national park or
sanctuary has been made compulsory. Amendments to the act provide greater protection to wildlife through
prohibiting hunting of wild animals and provision to prohibit collection and exploitation of wild plants which
are threatened with extinction.
2.2.8 Insecticides Act 1968 and Insecticides Rule 1971
The Insecticides Act, 1968 and Insecticides Rules 1971 regulate the import, registration process,
manufacture, sale, transport, distribution and use of insecticides (pesticides) with a view to prevent risk to
human beings or animals and for all connected matters, throughout India. All insecticides (pesticides) must
undergo the registration process with the Central Insecticides Board and Registration Committees (CIB &
RC) before they can be made available for use or sale.
2.2.9 Policy for Abatement of Pollution, 1992
This policy looks at abatement of pollution for preventing deterioration of the environment. The policy focus
is on the long-term solution to pollution. The emphasis is on increased use of regulations and an increase in
the development and application of financial incentives. The objective of the policy is to integrate
environmental considerations into decision making at all levels. To achieve this, different steps are suggested
in the policy, i.e., (1) preventing pollution at source; (2) encourage, develop and apply the best available
practicable technical solutions; (3) ensure that the polluter pays for the pollution and control arrangements;
(4) focus protection on heavily polluted areas and river stretches; and (5) involvement of public in decision
making.
2.2.10 National Conservation Strategy & Policy on Environment & Development, 1992
The National Conservation Strategy and the Policy Statement on Environment and Development respond to
the need of environmental considerations and development process. The agenda for action in the policy looks
into the followings;
1. To ensure sustainable and equitable use of resources for meeting the basic needs of the present and future
generations without causing damage to the environment;
2. To prevent and control future deterioration in land, water and air which constitute our life-support
systems;
3. To take steps for restoration of ecologically degraded areas and for environmental improvement in our
rural and urban settlements;
4. To prevent further damage to and conserve natural and man-made heritage;
5. To ensure that development projects are correctly sited to minimize their adverse environmental
Environment Management Framework
consequences;
6. To ensure that the environment and productivity of coastal areas and marine ecosystems are protected;
7. To conserve and nurture the biological diversity, genepool and other resources through environmentally
sustainable development and management of ecosystems, with special emphasis on our mountain, marine
and coastal, desert, wetlands, riverine and island ecosystems; and,
8. To protect the scenic landscapes, areas of geomorphological significance, unique and representative
biomass and ecosystems and wildlife habitats, heritage sites/structures and areas of cultural heritage
importance.
2.2.11 National Research Centre For Integrated Pest Management (IPM)
ICAR-National Research Centre for Integrated Pest Management (NCIPM), India was established in
February, 1988 to cater to the plant protection needs of different agro-ecological zones of the country.
Integrated Pest Management Package is developed for cotton, maize, ground nut, rice, chick pea and
soybean. The Centre has a strong institutional network in place to take on the challenges of plant protection
in the country in a harmonized manner.
● National Innovations on Climate Resilient Agriculture (NICRA)
● Horti. Pest Surveillance and Advisory Project (HORTSAP) - Maha.(2016-17)
● Crop Pest Surveillance and Advisory Project (CROPSAP) - Maharashtra (2015-16)
● e-Pest Surveillance and Advisory Services for Rice in Tripura
The vision of the centre is minimization of crop losses due to pests through creation and harmonization of
plant protection knowledge base and evolution of effective, economically viable and eco-friendly pest
management technologies
National Innovations on Climate Resilient Agriculture (NICRA)
National Innovations on Climate Resilient Agriculture (NICRA) was launched during February 2011 by
Indian Council of Agricultural Research (ICAR) with the funding from Ministry of Agriculture, Government
of India. The project has three major objectives: strategic research, technology demonstrations and capacity
building. Assessment of the impact of climate change simultaneously with formulation of adaptive strategies
is the prime approach under strategic research across all sectors of agriculture, dairying and fisheries.
Evolving climate resilient agricultural technologies that would increase farm production and productivity vis-
à-vis continuous management of natural and manmade resources constitute an integral part of sustaining
agriculture in the era of climate change.
Objectives
● To enhance the resilience of Indian agriculture covering crops, livestock and fisheries to climatic
variability and climate change through development and application of improved production and risk
management technologies.
● To demonstrate site specific technology packages on farmers’ fields for adapting to current climate risks.
● To enhance the capacity of scientists and other stakeholders in climate resilient agricultural research and

Environment Management Framework
its application.
2.3 GOVERNMENT OF MAHARASHTRA’s POLICIES AND LEGISLATION FOR
ENVIRONMENT REGULATION
2.3.1 Integrated Pest Management (IPM)
Agriculture Department of Maharashtra State is entrusted with the responsibility of sustainable Agriculture
Development. For increasing crop production and productivity various activities like promoting use of
improved / hybrid seeds, balanced use of fertilizers, Integrated Pest Management, land development, micro-
irrigation, mechanizations, technology transfer through extension services are carried out by the Department
of Agriculture.
In order to minimize the use of hazardous chemical pesticides up to the extent possible & to prevent,
manage the insect pests /diseases attack as well as to increase the crop productivity, Government of India,
through the Department of Agriculture &Cooperation (DAC) in Ministry of Agriculture has launched a
scheme “Strengthening and Modernization of Pest Management Approach in India” since 1991-92 by
adopting Integrated Pest Management (IPM) as cardinal principle and main plank of plant protection strategy
in overall crop production programme. Under the ambit of IPM programme, the Govt. of India has
established 35 Central IPM Centers in 28 States and one UT. In Maharashtra IPM centre is located in Nashik
and Nagpur.
Concept of IPM
The Integrated Pest Management (IPM) is an ecological approach, which aims at keeping pests below
economic thresholds level by employing all available alternate pest control methods and techniques such as
cultural, mechanical and biological control with greater emphasis on use of bio-pesticides and pesticides of
plant-origin like Neem formulation. The use of chemical pesticides is advised as a last resort when pest
crosses economic threshold level (ETL).
Objectives
● Maximize crop production with minimum input costs;
● Minimize environmental pollution in soil, water and air due to pesticides;
● Minimize occupational health hazards due to chemical pesticides;
● Conserve ecosystem and maintain ecological equilibrium;
● Judicious use of chemical pesticides for reducing pesticide residues.
Activities
The Central Integrated Pest Management Centers (CIPMCs) undertake following programme and activities:
● Surveillance & Monitoring of insect-pest & diseases.
● Augmentation and Conservation of Natural enemies.
● Production and releases of bio-control agents.

Environment Management Framework
● Human Resources Development (HRD) through Farmers’ Field Schools (FFSs), Season-long
training programmes, orientation training programme and refresher courses.
Apart from CIPMCs, State Bio-control Laboratories (SBCLs) have been established in Aurangabad and
Nandurbar.
Mandate of Central Integrated Pest Management Centers (CIPMCS) and Adoption in Project Area
The mandate of the CIPMC Centers is pest/disease monitoring, production and release of bio-control agents/
bio-pesticides, conservation of bio-control agents and Human Resource Development in IPM by imparting
training to Agriculture / Horticulture Extension Officers and farmers at Grass Root Level by organizing
Farmers Field Schools (FFSs) in farmers’ fields. Basic aim of FFS is to train the farmers on the latest IPM
technologies so that they are able to take decision in pest management operation. In FFS the farmers are also
trained about the judicious use of pesticides on their crops so that the crop can be grown with minimum use
of pesticides.
FFS approach is inbuilt mechanism for project implementation phase. The IPM advisory and other
necessary guidelines for the specific crop during kharif and rabi season will be disseminated at grass root
level to all farmers of project area through FFS. Department of agriculture with technical support of Krishi
Vigyan Kendras (KVKs) of concern districts will be responsible to execute FFS approach in their respective
project areas.
Approach of IPM for key crops of the state
In Maharashtra Soybean, cotton, rice, tur, sorghum and bajra are major Kharif crops while, sorghum, gram
are the major crops grown in the Rabi season. Farmers are shifting towards cotton and soybean crops in last
few years due to good average per hectare yield and market prices. Pest disease management is the crucial
factor in crop production. In general, 20-30% loss in yield occurs due to pests and diseases. Vulnerability of
rainfall and changes in weather creates congenial conditions for pest and disease attacks. If pest and disease
problem is not managed in time, farmers incur heavy economic losses.
To avoid the crop losses due to pest and diseases recurrence as a long term strategy, Department of
Agriculture has taken an initiative and formulated and implemented “Awareness-cum Surveillance
Programme for management of major pests in cotton-soybean based cropping system in Maharashtra” in
2009-10 under technical guidance of National Integrated Pest Management Centre (NCIPM), New Delhi.
This scheme has now been renamed as “Crop Pest Surveillance and Advisory Project” (CROPSAP). The
project has been further extended to cover Tur, Gram and Rice crops. A software was developed and
implemented for data feeding, interpretation, report generation, GIS based pest mapping and advisory
dissemination.
For regular pest surveillance, Pest Scouts are appointed and pre-seasonal trainings are imparted at SAUs.
Pest Scouts and Pest Monitors collect pest data and feed it online in the software through their mobile. The
data is processed and reports are generated. These reports are scientifically interpreted and necessary real
time detail and short advisories are issued by the experts at State Agricultural University (SAUs).
Talukawise advisories with hot spot locations are issued on-line to DSAOs on every Thursday and Monday.
DSAOs transmit the messages in form of detailed advisories through e-mail to Taluka Level offices. The
advisories are displayed at Gram Panchayats and also published in local newspapers and other print and
Environment Management Framework
electronic media. Pest situation is discussed in farmers meetings conducted by field staff. Short advisories
are sent through SMSes to registered farmers. Awareness is created among the farmers through various
training programmes, rallies, village meetings etc. to identify pest, their nature of damage and management.
Software has a facility to generate Taluka-wise GIS mapping system for soybean, cotton, paddy, tur and
gram pests. The maps generated through this system can be used for identifying epidemic area of particular
pest. Wherever the pest population crosses Economic Threshold Level (ETL), subsidized pesticides are
supplied on priority through different programmes. Apart from this, correlation of weather parameters is
carried out and superimposed on GIS maps. Analysis of weather parameters and pest population dynamics
by scientists will be useful in future to develop pest-forecasting modules. In this way, massive statewide
campaign is organized and implemented in the state. Through this project, Information and Communication
Technology (ICT) has been widely used in the field of plant protection for first time in the country.
Mobile Apps
Under the Department of Agriculture, State of Maharashtra, following mobile apps are available-
● M-Crop - M-Cropsap is mobile-based data entry application used for Crop-Pest Surveillance and
Advisory Project (CROPSAP). (details about the app are available
athttp://mahaagriiqc.gov.in/cropsap/Mcropsap/)
● Crop clinic mobile - Crop Clinic Mobile App is helpful to search crop insects and insecticide details
(details about the app are available at http://mahaagriiqc.gov.in/cropsap/index.php)
2.3.2 Water Policy of Government of Maharashtra
The Water Policy, 2003 of the Government of Maharashtra focusses on Integrated Development and
Management of Water Resources. Some of the important provisions of the policy are:
1. Mandatory public participation in planning, construction and management of water infrastructure.
2. Supply of water to the users on gross volumetric basis.
3. Delegation of irrigation management system to Water User Associations (WUA).
4. Development and dissemination of new technology for improving productivity.
5. Preparation of perspective plan for eradication of poverty and elimination of regional imbalance.
6. Transfer of water from 'water-abundant' regions to 'water-deficit' regions.
Policies of the Government of Maharashtra on water sector are;
1. State Water Policy, 2003;
2. Maharashtra Management of Irrigation Systems by Farmers Act, 2005;
3. The Maharashtra Water Resources Regulatory Authority (MWRRA) Act, 2005:
4. Maharashtra Groundwater (Development & Management) Act, 2009.
2.3.3 Agrarian crisis and agricultural crisis: issues and solutions
Many parts of the country have been facing agrarian distress due to a host of factors, including climate
vulnerability and shocks. According to the records of National Crime Bureau, more than 2 lakh farmers
across India have committed suicides over the last two decades. Andhra Pradesh, Maharashtra, Karnataka,
Kerala, and Punjab witnessed more than 65% of farmers' indebtedness in 2011, which is highest in India.In
this regard, Vidarbha is one of the most affected regions in India and Yavatmal is the most affected district in
Vidarbha.

Environment Management Framework
Project on climate resilience agriculture (PoCRA) has been designed primarily for small and marginal
farmers. Apart from PoCRA, the GoM had declared a special package to help farmers in crisis and natural
calamities in Vidarbha region. The details of this initiative are:
S. No. Item Implementing Department
1. Emergency help Revenue and forest (Relief and
Rehabilitation)
2. Loan rescheduling Co-operation , Marketing and Textile
Department 3. Regulation of loan from private money lender
4. Apply doublization rule to all co-operative loan
5. Loan disbursement through farmers self help group
6. Regeneration of loan distribution system Co-operation , Marketing and Textile
Department and Agriculture and ADF
7. Waive of premium of crop insurance scheme Agriculture and ADF
8. Financial help to farmers for more production
9. Promotion of Agri-allied business
10. Promotion of agri-processing industries Co-operation , Marketing and Textile
Department and Agriculture and ADF
11. Promotion of cotton compound farming Agriculture and ADF
12. Community marriage scheme for farmers
daughters marriage
Women and Child Development
13. Reimbursement of capital development fund Co-operation , Marketing and Textile
Department
14. Relief to cotton grower farmers Agriculture and ADF
15. Organic farming technology mission Agriculture and ADF
16. Vidarbha watershed mission Water Conservation Department
17. Starting helpline for farmers guidance Agriculture and ADF
18. Monitoring of declared programme General Administration Department
2.4 APPLICABILITY OF ACTS / POLICIES
Table 1: Applicability of Policies
Policy Why it is applicable for the Project
National Environment Policy,
2006
The Policy supports the environmental restoration measures and
prescribe effective environment safeguard instruments
Environment Protection Act,
1986
The Act suggests to take all appropriate measures to prevent and
control pollution and to establish effective machinery for the purpose
of protecting and improving the quality of the environment and
protecting controlling and abating environmental pollution
Plastic Waste Management
Rules
It is applicable to all the GPs / producers apart from other entities.
Applicability of Plastic Waste Management Rule is mostly related to
current use of people in the project area and expected augmentation
due to project intervention.
Hazardous Waste Management
Rule, 1989
Waste category No. 18, i.e., discarded containers of hazardous and
toxic wastes is particularly applicable to the project, especially with
regard to pesticides.
The Wildlife Protection Act,
1972
Some of the project areas having wild life prevalence. Public and
private protective measures are in place with compensation provision.
Insecticides Act, 1968 Use of registered and recommended insecticides and non-use of
insecticides banned by GoI and WHO
Policy for abatement of This policy looks at abatement of pollution for preventing
Environment Management Framework
pollution, 1992 deterioration of the environment. The policy suggests preventing
pollution at source.
National Conservation Strategy
& Policy on Environment &
Development, 1992
The project adheres to the policy prescription in terms of prevention
of deterioration of natural resource base like land, water etc. &
ecological restoration.
State Water Policy, 2003 The policy looks at participatory planning, construction and
management of water use which the project intends to do in its
intervention
Maharashtra Management of
Irrigation Systems by Farmers
Act 2005
Formation of Water User Association (WUA) for irrigation
The Maharashtra Water
Resources Regulatory Authority
(MWRRA) Act
Water tariff and water use entitlement, promotion of water
conservation and management practices
Maharashtra Groundwater
(Development & Management)
Act 2009
Groundwater regulation for irrigation, drinking and other uses
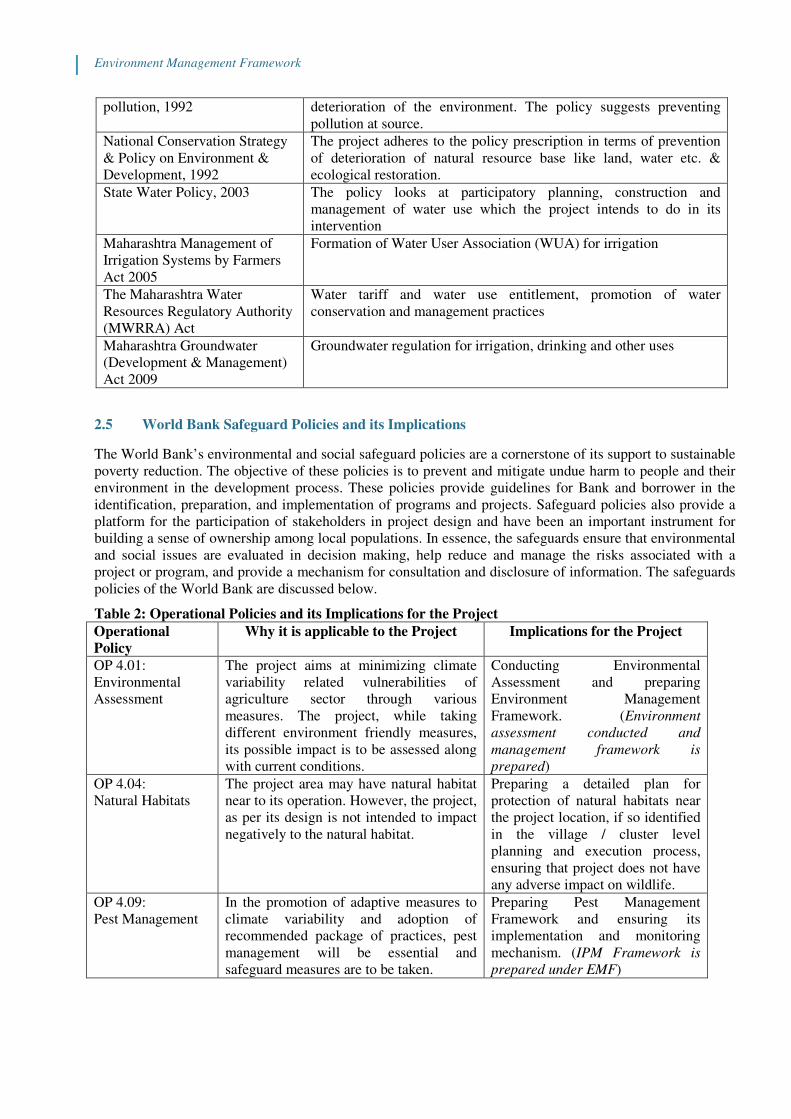
2.5 World Bank Safeguard Policies and its Implications
The World Bank’s environmental and social safeguard policies are a cornerstone of its support to sustainable
poverty reduction. The objective of these policies is to prevent and mitigate undue harm to people and their
environment in the development process. These policies provide guidelines for Bank and borrower in the
identification, preparation, and implementation of programs and projects. Safeguard policies also provide a
platform for the participation of stakeholders in project design and have been an important instrument for
building a sense of ownership among local populations. In essence, the safeguards ensure that environmental
and social issues are evaluated in decision making, help reduce and manage the risks associated with a
project or program, and provide a mechanism for consultation and disclosure of information. The safeguards
policies of the World Bank are discussed below.
Table 2: Operational Policies and its Implications for the Project
Operational
Policy
Why it is applicable to the Project Implications for the Project
OP 4.01:
Environmental
Assessment
The project aims at minimizing climate
variability related vulnerabilities of
agriculture sector through various
measures. The project, while taking
different environment friendly measures,
its possible impact is to be assessed along
with current conditions.
Conducting Environmental
Assessment and preparing
Environment Management
Framework. (Environment
assessment conducted and
management framework is
prepared)
OP 4.04:
Natural Habitats
The project area may have natural habitat
near to its operation. However, the project,
as per its design is not intended to impact
negatively to the natural habitat.
Preparing a detailed plan for
protection of natural habitats near
the project location, if so identified
in the village / cluster level
planning and execution process,
ensuring that project does not have
any adverse impact on wildlife.
OP 4.09:
Pest Management
In the promotion of adaptive measures to
climate variability and adoption of
recommended package of practices, pest
management will be essential and
safeguard measures are to be taken.
Preparing Pest Management
Framework and ensuring its
implementation and monitoring
mechanism. (IPM Framework is
prepared under EMF)

Environment Management Framework
2.6 Relevant Programmes and Schemes of the Government
Both Central and State Governments have been implementing a number of schemes / programmes under
Central Schemes, Centrally Sponsored Schemes and State Schemes, that are relevant to the project. Some of
these schemes and their salient features are discussed below.
Table 3: Relevant Programmes / Schemes
S. No. Scheme Schematic Provisions and Linkage Potential
1 Strengthening of
Agmark Grading
Facilities
1. Analysis of samples / research samples for developing and
promoting grading and standardization of agricultural commodities
under Agmark
2 Development /
Strengthening of
Agricultural
Marketing
Infrastructure,
Grading &
Standardization
1. The scheme is for those States which have amended the APMC Act
(Maharashtra included);
2. Direct marketing, contract farming and permit to set up of markets
in private and cooperative sectors;
3. Credit linked back-ended subsidy on capital cost of general or
commodity specific infrastructure for marketing of agricultural
commodities and for strengthening and modernization of existing
agricultural markets, wholesale, weekly markets in rural areas
3 Gramin Bhandaran
Yojana:
1. Creation of scientific storage capacity with allied facilities in rural
areas.
4 Agriculture-Business
Development
(SFAC):
1. Setting up of agribusiness ventures,
2. Catalyzing private investment in setting up of agribusiness projects
3. Strengthen backward linkages of agri-business projects with
producers;
4. Assist farmers, producer groups to enhance their participation in
value chain through Project Development Facility;
5. Training and visits of agri-entrepreneurs in setting up identified
agribusiness projects.
5 Setting up of
Terminal Market
Complex (TMC):
1. Backward linkages with farmers through collection centers
2. Forward linkages through wholesalers, distribution centers, retail
cash and carry stores, processing units for exporters etc.
6 National Agriculture
Market (NAM)
through Agri-Tech
Infrastructure Fund
(ATIF):
1. Setting up of common e-market platform that would be deployable
in selected regulated wholesale markets (SFAC implements the
national e-platform).
7 Integrated Scheme
for Agricultural
Marketing:
1. Creation of agricultural marketing infrastructure by providing
backend subsidy support to State, cooperative and private sector
investments;
2. Creation of scientific storage capacity;
3. Promote Integrated Value Chains (up to primary processing);
4. ICT as a vehicle of extension for agricultural marketing;
5. Establishing a nation-wide information network system for speedy
collection and dissemination of market information;
6. Support framing of grade standards and quality certification of
agricultural commodities;
7. Catalyze private investment in agribusiness projects;
8. Training, research, education, extension and consultancy in the
agri-marketing sector.
8 National Agricultural
Insurance Scheme
(NAIS):
1. Insurance coverage and financial support to the farmers in the event
of failure of any of the notified crops as a result of natural
calamities, pests and diseases;
2. Encouraging farmers to adopt progressive farming practices, high

Environment Management Framework
S. No. Scheme Schematic Provisions and Linkage Potential
value inputs and higher technology in agriculture;
3. Stabilize farm incomes, particularly in disaster years.
9 Sub-Mission on
Agricultural
Mechanization:
1. Increasing reach of farm mechanization to small and marginal
farmers and to the regions where availability of farm power is low;
2. Promoting Custom Hiring Centres;
3. Creating hubs for hi-tech & high value farm equipment;
4. Awareness among stakeholders through demonstration and capacity
building activities.
10 National Mission for
Sustainable
Agriculture (NMSA):
1. Promotion of Integrated / Composite Farming Systems;
2. Conservation of natural resources through appropriate soil and
moisture conservation measures;
3. Comprehensive soil health management practices based on soil
fertility maps,
4. Soil test based application of macro µnutrients;
5. Judicious use of fertilizers;
6. Efficient water management to expand coverage for achieving
‘more crop per drop’;
7. Developing capacity of farmers & stakeholders on climate change
adaptation and mitigation measures;
8. Pilot models in select blocks for improving productivity of rain-fed
farming by mainstreaming rainfed technologies refined through
NICRA;
11 Rashtriya Krishi
Vikas Yojana
(RKVY):
1. Preparation of agriculture plan;
2. Focused intervention to reduce yield gap in important crops;
3. Distribution of ag. Inputs, extension, soil health management and
IPM promotion;
4. Dairy development;
5. Fishery promotion;
6. Information dissemination;
7. Infrastructure development under Infrastructure and Assets.
12 National Food
Security Mission:
1. Extension of improved technologies i.e. seed, Integrated Nutrient
Management including micronutrients, soil amendments, IPM and
resource conservation technologies;
2. Capacity building of farmers.
13 Development and
Strengthening of
Infrastructure
Facilities for
Production and
Distribution of
Quality Seeds:
1. Establishing seed bank and its maintenance;
2. Development of seed village;
3. Assistance for Creation / Strengthening of Infrastructure Facilities
in Public Sector;
4. Strengthening State Seed Testing Laboratories for quality control;
5. Awareness campaign through SAUs, scientific
organisations/Institutes;
6. Promotion of tissue culture through SAUs/specialised
institutions/seed corporations;
7. Boosting Seed Production in Private Sector.
14 Pradhan Mantri
Krishi Sinchayee
Yojana (PMKSY)
1. Creation of new water sources; repair, restoration and renovation of
defunct water sources; construction of water harvesting structures,
secondary & micro storage, groundwater development, enhancing
potentials of traditional water bodies at village level, etc.
2. Developing/augmenting distribution network where irrigation
sources (both assured and protective) are available or created;
3. Promotion of scientific moisture conservation and runoff control
measures to improve groundwater recharge so as to create
opportunities for farmer to access recharged water through shallow

Environment Management Framework
S. No. Scheme Schematic Provisions and Linkage Potential
tube/dug wells;
4. Promoting efficient water conveyance and field application devices
within the farm viz, underground piping system, Drip & Sprinklers,
pivots, rain-guns and other application devices etc.;
5. Encouraging community irrigation through registered user
groups/farmer producers’ organizations/NGOs; and
6. Farmer oriented activities like capacity building, training and
exposure visits, demonstrations, farm schools, skill development in
efficient water and crop management practices (crop alignment)
including large scale awareness on more crop per drop of water
through mass media campaign, exhibitions, field days, and
extension activities through short animation films etc.
15 Mahatma Gandhi
National Rural
Employment
Guarantee Act, 2005
(MGNREGA)
1. Supplementary livelihood in rural areas through unskilled manual
work,
2. Categories of work permitted to be taken up for providing
employment are water conservation, drought proofing, irrigation,
land development, rejuvenation of traditional water bodies, flood
control and drainage work, rural connectivity and work on the land
of Scheduled Castes (SCs), Scheduled Tribes (STs), Families
Below Poverty Line (BPL) and Indira Awas Yojana (IAY)
beneficiaries, land reform beneficiaries and individual small and
marginal farmers.
3.0 Environment Baseline
3.1 Topography and Physiography
Maharashtra State is spread over a geographical area of 3,07,713 sq. km. Its geographic location is latitude
15°40’ N to 22°00’ N and longitude is 72°30’E to 80°30’E. Based on topography and physical features, the
state can be divided into three physical divisions, viz. The Konkan Coastal Lowland, the Western Ghats and
the Maharashtra plateau.
3.2 Geology
The geology of Maharashtra is famous for the Deccan Traps, which occurs in all the districts of the State,
except Bhandara, Gondia and Gadchiroli. The other geological formations, older and younger than Deccan
Traps, occur in the northeast and as isolated patches in the Sindhudurg and Ratnagiri districts. The
stratigraphic succession of the geologic formations in the State is given in the Table No. 8. The variation in
hydrological properties is due to inherent physical characteristics of the rocks.
Table 4: Geology of Maharashtra
Formation Area (in sq km) Percentage
Quaternary Alluvium 14498 5.71
Deccan Trap lava flows 250026 81.25
Gondwana Rock 4808 1.56
Proterozoic 6190 2.01
Precambrian Basement 32191 10.46
Source: Report on the Dynamic Groundwater Resources of Maharashtra, 201-12; Ground Water Survey and
Development Agency, Pune, February 2014
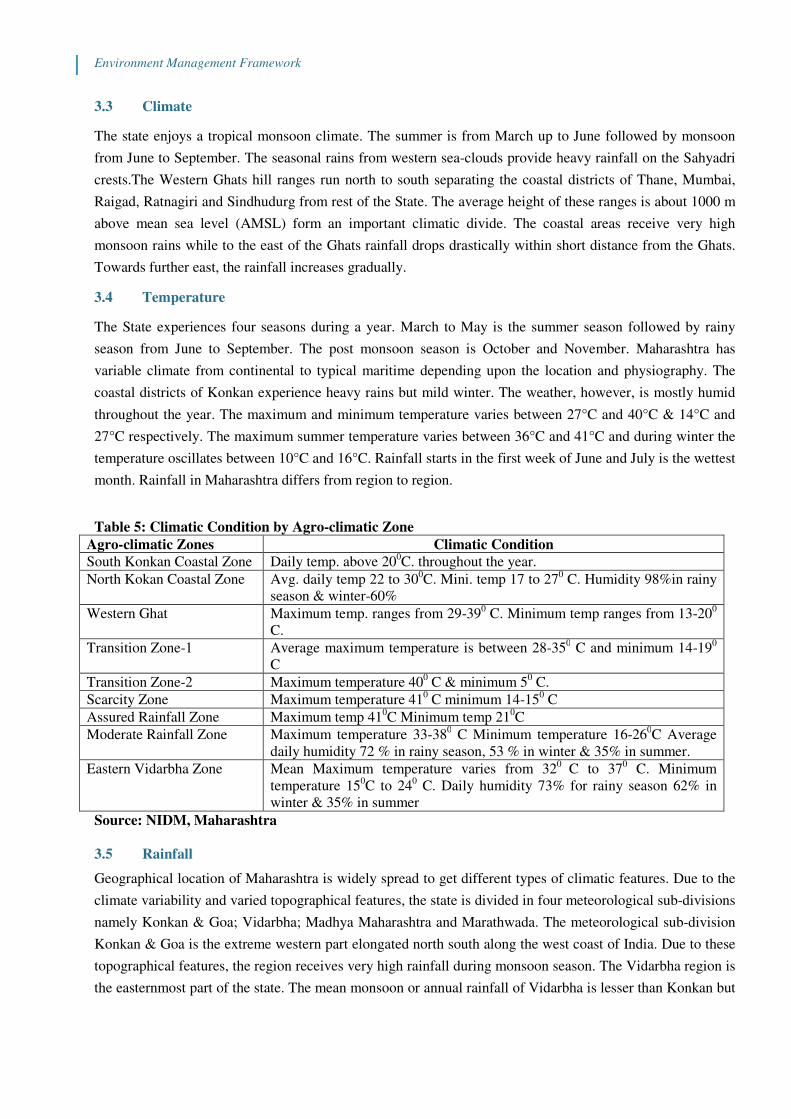
Environment Management Framework
3.3 Climate
The state enjoys a tropical monsoon climate. The summer is from March up to June followed by monsoon
from June to September. The seasonal rains from western sea-clouds provide heavy rainfall on the Sahyadri
crests.The Western Ghats hill ranges run north to south separating the coastal districts of Thane, Mumbai,
Raigad, Ratnagiri and Sindhudurg from rest of the State. The average height of these ranges is about 1000 m
above mean sea level (AMSL) form an important climatic divide. The coastal areas receive very high
monsoon rains while to the east of the Ghats rainfall drops drastically within short distance from the Ghats.
Towards further east, the rainfall increases gradually.
3.4 Temperature
The State experiences four seasons during a year. March to May is the summer season followed by rainy
season from June to September. The post monsoon season is October and November. Maharashtra has
variable climate from continental to typical maritime depending upon the location and physiography. The
coastal districts of Konkan experience heavy rains but mild winter. The weather, however, is mostly humid
throughout the year. The maximum and minimum temperature varies between 27°C and 40°C & 14°C and
27°C respectively. The maximum summer temperature varies between 36°C and 41°C and during winter the
temperature oscillates between 10°C and 16°C. Rainfall starts in the first week of June and July is the wettest
month. Rainfall in Maharashtra differs from region to region.
Table 5: Climatic Condition by Agro-climatic Zone
Agro-climatic Zones Climatic Condition
South Konkan Coastal Zone Daily temp. above 200C. throughout the year.
North Kokan Coastal Zone Avg. daily temp 22 to 300C. Mini. temp 17 to 27
0 C. Humidity 98%in rainy
season & winter-60%
Western Ghat Maximum temp. ranges from 29-390 C. Minimum temp ranges from 13-20
0
C.
Transition Zone-1 Average maximum temperature is between 28-350 C and minimum 14-19
0
C
Transition Zone-2 Maximum temperature 400 C & minimum 5
0 C.
Scarcity Zone Maximum temperature 410 C minimum 14-15
0 C
Assured Rainfall Zone Maximum temp 410C Minimum temp 21
0C
Moderate Rainfall Zone Maximum temperature 33-380 C Minimum temperature 16-26
0C Average
daily humidity 72 % in rainy season, 53 % in winter & 35% in summer.
Eastern Vidarbha Zone Mean Maximum temperature varies from 320
C to 370 C. Minimum
temperature 150C to 24
0 C. Daily humidity 73% for rainy season 62% in
winter & 35% in summer
Source: NIDM, Maharashtra
3.5 Rainfall
Geographical location of Maharashtra is widely spread to get different types of climatic features. Due to the
climate variability and varied topographical features, the state is divided in four meteorological sub-divisions
namely Konkan & Goa; Vidarbha; Madhya Maharashtra and Marathwada. The meteorological sub-division
Konkan & Goa is the extreme western part elongated north south along the west coast of India. Due to these
topographical features, the region receives very high rainfall during monsoon season. The Vidarbha region is
the easternmost part of the state. The mean monsoon or annual rainfall of Vidarbha is lesser than Konkan but
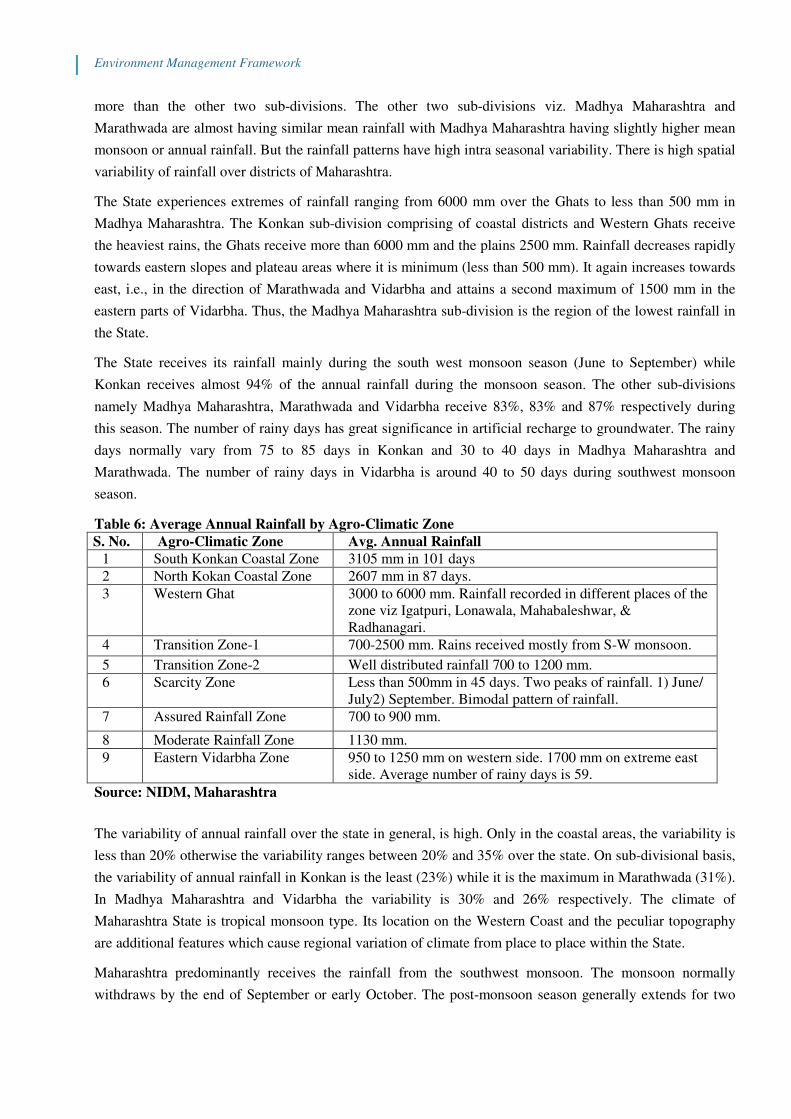
Environment Management Framework
more than the other two sub-divisions. The other two sub-divisions viz. Madhya Maharashtra and
Marathwada are almost having similar mean rainfall with Madhya Maharashtra having slightly higher mean
monsoon or annual rainfall. But the rainfall patterns have high intra seasonal variability. There is high spatial
variability of rainfall over districts of Maharashtra.
The State experiences extremes of rainfall ranging from 6000 mm over the Ghats to less than 500 mm in
Madhya Maharashtra. The Konkan sub-division comprising of coastal districts and Western Ghats receive
the heaviest rains, the Ghats receive more than 6000 mm and the plains 2500 mm. Rainfall decreases rapidly
towards eastern slopes and plateau areas where it is minimum (less than 500 mm). It again increases towards
east, i.e., in the direction of Marathwada and Vidarbha and attains a second maximum of 1500 mm in the
eastern parts of Vidarbha. Thus, the Madhya Maharashtra sub-division is the region of the lowest rainfall in
the State.
The State receives its rainfall mainly during the south west monsoon season (June to September) while
Konkan receives almost 94% of the annual rainfall during the monsoon season. The other sub-divisions
namely Madhya Maharashtra, Marathwada and Vidarbha receive 83%, 83% and 87% respectively during
this season. The number of rainy days has great significance in artificial recharge to groundwater. The rainy
days normally vary from 75 to 85 days in Konkan and 30 to 40 days in Madhya Maharashtra and
Marathwada. The number of rainy days in Vidarbha is around 40 to 50 days during southwest monsoon
season.
Table 6: Average Annual Rainfall by Agro-Climatic Zone
S. No. Agro-Climatic Zone Avg. Annual Rainfall
1 South Konkan Coastal Zone 3105 mm in 101 days
2 North Kokan Coastal Zone 2607 mm in 87 days.
3 Western Ghat 3000 to 6000 mm. Rainfall recorded in different places of the
zone viz Igatpuri, Lonawala, Mahabaleshwar, &
Radhanagari.
4 Transition Zone-1 700-2500 mm. Rains received mostly from S-W monsoon.
5 Transition Zone-2 Well distributed rainfall 700 to 1200 mm.
6 Scarcity Zone Less than 500mm in 45 days. Two peaks of rainfall. 1) June/
July2) September. Bimodal pattern of rainfall.
7 Assured Rainfall Zone 700 to 900 mm.
8 Moderate Rainfall Zone 1130 mm.
9 Eastern Vidarbha Zone 950 to 1250 mm on western side. 1700 mm on extreme east
side. Average number of rainy days is 59.
Source: NIDM, Maharashtra
The variability of annual rainfall over the state in general, is high. Only in the coastal areas, the variability is
less than 20% otherwise the variability ranges between 20% and 35% over the state. On sub-divisional basis,
the variability of annual rainfall in Konkan is the least (23%) while it is the maximum in Marathwada (31%).
In Madhya Maharashtra and Vidarbha the variability is 30% and 26% respectively. The climate of
Maharashtra State is tropical monsoon type. Its location on the Western Coast and the peculiar topography
are additional features which cause regional variation of climate from place to place within the State.
Maharashtra predominantly receives the rainfall from the southwest monsoon. The monsoon normally
withdraws by the end of September or early October. The post-monsoon season generally extends for two
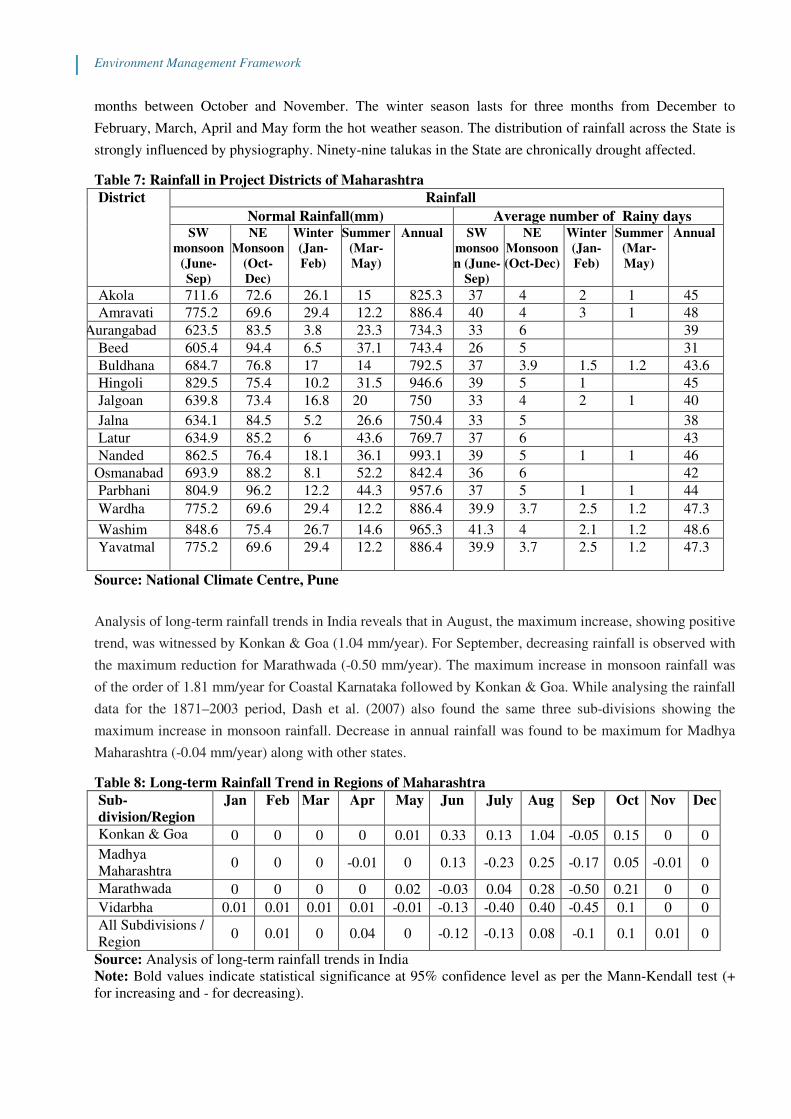
Environment Management Framework
months between October and November. The winter season lasts for three months from December to
February, March, April and May form the hot weather season. The distribution of rainfall across the State is
strongly influenced by physiography. Ninety-nine talukas in the State are chronically drought affected.
Table 7: Rainfall in Project Districts of Maharashtra
District
Rainfall
Normal Rainfall(mm) Average number of Rainy days SW
monsoon
(June-
Sep)
NE
Monsoon
(Oct-
Dec)
Winter
(Jan-
Feb)
Summer
(Mar-
May)
Annual SW
monsoo
n (June-
Sep)
NE
Monsoon
(Oct-Dec)
Winter
(Jan-
Feb)
Summer
(Mar-
May)
Annual
Akola 711.6 72.6 26.1 15 825.3 37 4 2 1 45
Amravati 775.2 69.6 29.4 12.2 886.4 40 4 3 1 48
Aurangabad 623.5 83.5 3.8 23.3 734.3 33 6 39
Beed 605.4 94.4 6.5 37.1 743.4 26 5 31
Buldhana 684.7 76.8 17 14 792.5 37 3.9 1.5 1.2 43.6
Hingoli 829.5 75.4 10.2 31.5 946.6 39 5 1 45
Jalgoan 639.8 73.4 16.8 20 750 33 4 2 1 40
Jalna 634.1 84.5 5.2 26.6 750.4 33 5 38
Latur 634.9 85.2 6 43.6 769.7 37 6 43
Nanded 862.5 76.4 18.1 36.1 993.1 39 5 1 1 46
Osmanabad 693.9 88.2 8.1 52.2 842.4 36 6 42
Parbhani 804.9 96.2 12.2 44.3 957.6 37 5 1 1 44
Wardha 775.2 69.6 29.4 12.2 886.4 39.9 3.7 2.5 1.2 47.3
Washim 848.6 75.4 26.7 14.6 965.3 41.3 4 2.1 1.2 48.6
Yavatmal 775.2 69.6 29.4 12.2 886.4 39.9 3.7 2.5 1.2 47.3
Source: National Climate Centre, Pune
Analysis of long-term rainfall trends in India reveals that in August, the maximum increase, showing positive
trend, was witnessed by Konkan & Goa (1.04 mm/year). For September, decreasing rainfall is observed with
the maximum reduction for Marathwada (-0.50 mm/year). The maximum increase in monsoon rainfall was
of the order of 1.81 mm/year for Coastal Karnataka followed by Konkan & Goa. While analysing the rainfall
data for the 1871–2003 period, Dash et al. (2007) also found the same three sub-divisions showing the
maximum increase in monsoon rainfall. Decrease in annual rainfall was found to be maximum for Madhya
Maharashtra (-0.04 mm/year) along with other states.
Table 8: Long-term Rainfall Trend in Regions of Maharashtra
Sub-
division/Region
Jan Feb Mar Apr May Jun July Aug Sep Oct Nov Dec
Konkan & Goa 0 0 0 0 0.01 0.33 0.13 1.04 -0.05 0.15 0 0
Madhya
Maharashtra 0 0 0 -0.01 0 0.13 -0.23 0.25 -0.17 0.05 -0.01 0
Marathwada 0 0 0 0 0.02 -0.03 0.04 0.28 -0.50 0.21 0 0
Vidarbha 0.01 0.01 0.01 0.01 -0.01 -0.13 -0.40 0.40 -0.45 0.1 0 0
All Subdivisions /
Region 0 0.01 0 0.04 0 -0.12 -0.13 0.08 -0.1 0.1 0.01 0
Source: Analysis of long-term rainfall trends in India
Note: Bold values indicate statistical significance at 95% confidence level as per the Mann-Kendall test (+
for increasing and - for decreasing).
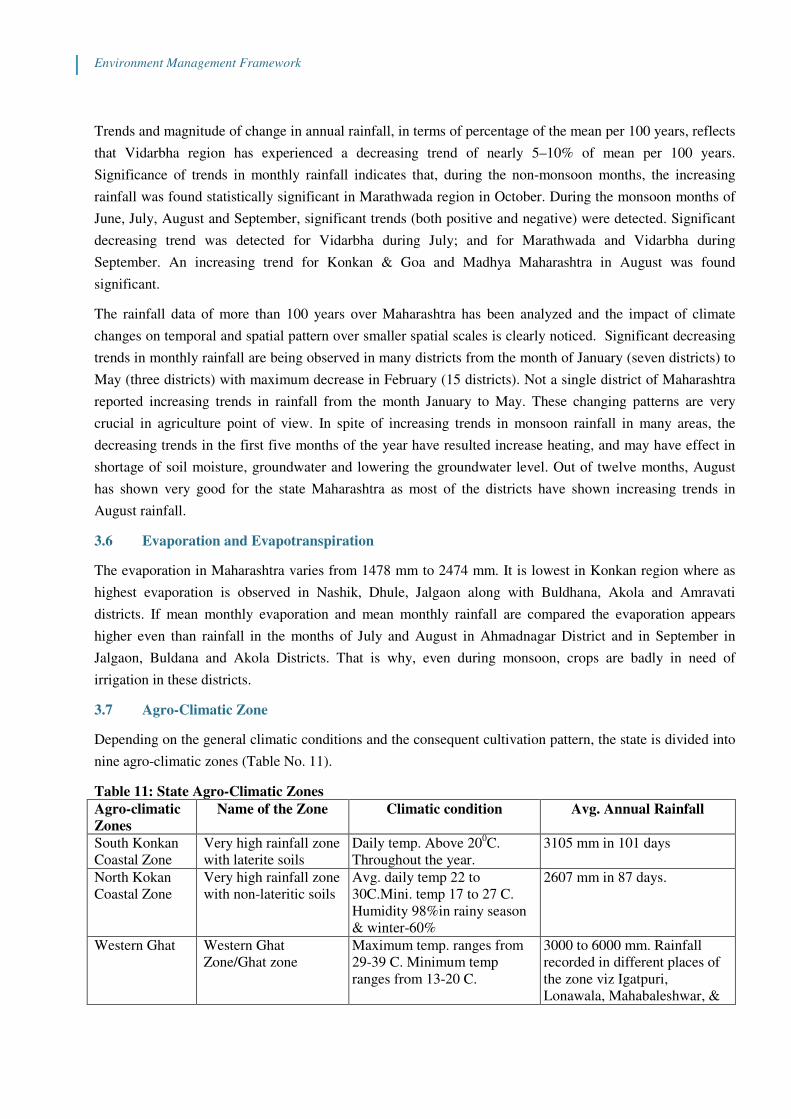
Environment Management Framework
Trends and magnitude of change in annual rainfall, in terms of percentage of the mean per 100 years, reflects
that Vidarbha region has experienced a decreasing trend of nearly 5–10% of mean per 100 years.
Significance of trends in monthly rainfall indicates that, during the non-monsoon months, the increasing
rainfall was found statistically significant in Marathwada region in October. During the monsoon months of
June, July, August and September, significant trends (both positive and negative) were detected. Significant
decreasing trend was detected for Vidarbha during July; and for Marathwada and Vidarbha during
September. An increasing trend for Konkan & Goa and Madhya Maharashtra in August was found
significant.
The rainfall data of more than 100 years over Maharashtra has been analyzed and the impact of climate
changes on temporal and spatial pattern over smaller spatial scales is clearly noticed. Significant decreasing
trends in monthly rainfall are being observed in many districts from the month of January (seven districts) to
May (three districts) with maximum decrease in February (15 districts). Not a single district of Maharashtra
reported increasing trends in rainfall from the month January to May. These changing patterns are very
crucial in agriculture point of view. In spite of increasing trends in monsoon rainfall in many areas, the
decreasing trends in the first five months of the year have resulted increase heating, and may have effect in
shortage of soil moisture, groundwater and lowering the groundwater level. Out of twelve months, August
has shown very good for the state Maharashtra as most of the districts have shown increasing trends in
August rainfall.
3.6 Evaporation and Evapotranspiration
The evaporation in Maharashtra varies from 1478 mm to 2474 mm. It is lowest in Konkan region where as
highest evaporation is observed in Nashik, Dhule, Jalgaon along with Buldhana, Akola and Amravati
districts. If mean monthly evaporation and mean monthly rainfall are compared the evaporation appears
higher even than rainfall in the months of July and August in Ahmadnagar District and in September in
Jalgaon, Buldana and Akola Districts. That is why, even during monsoon, crops are badly in need of
irrigation in these districts.
3.7 Agro-Climatic Zone
Depending on the general climatic conditions and the consequent cultivation pattern, the state is divided into
nine agro-climatic zones (Table No. 11).
Table 11: State Agro-Climatic Zones
Agro-climatic
Zones
Name of the Zone Climatic condition Avg. Annual Rainfall
South Konkan
Coastal Zone
Very high rainfall zone
with laterite soils
Daily temp. Above 200C.
Throughout the year.
3105 mm in 101 days
North Kokan
Coastal Zone
Very high rainfall zone
with non-lateritic soils
Avg. daily temp 22 to
30C.Mini. temp 17 to 27 C.
Humidity 98%in rainy season
& winter-60%
2607 mm in 87 days.
Western Ghat Western Ghat
Zone/Ghat zone
Maximum temp. ranges from
29-39 C. Minimum temp
ranges from 13-20 C.
3000 to 6000 mm. Rainfall
recorded in different places of
the zone viz Igatpuri,
Lonawala, Mahabaleshwar, &
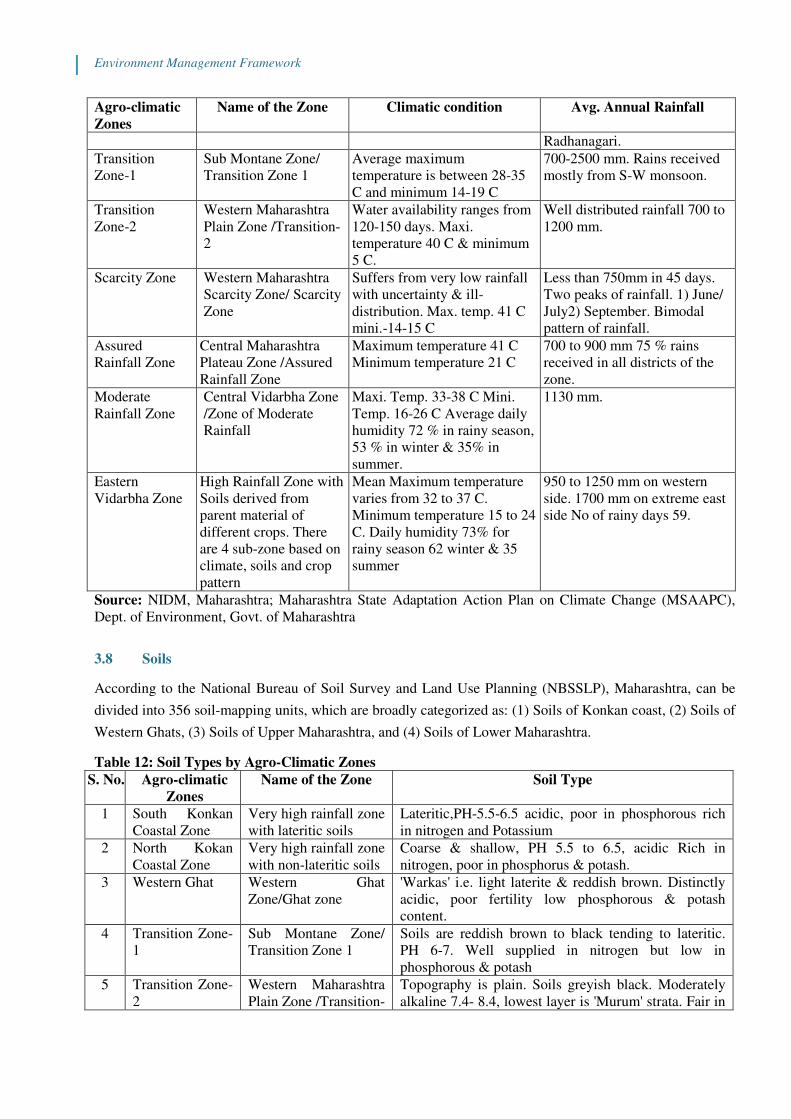
Environment Management Framework
Agro-climatic
Zones
Name of the Zone Climatic condition Avg. Annual Rainfall
Radhanagari.
Transition
Zone-1
Sub Montane Zone/
Transition Zone 1
Average maximum
temperature is between 28-35
C and minimum 14-19 C
700-2500 mm. Rains received
mostly from S-W monsoon.
Transition
Zone-2
Western Maharashtra
Plain Zone /Transition-
2
Water availability ranges from
120-150 days. Maxi.
temperature 40 C & minimum
5 C.
Well distributed rainfall 700 to
1200 mm.
Scarcity Zone Western Maharashtra
Scarcity Zone/ Scarcity
Zone
Suffers from very low rainfall
with uncertainty & ill-
distribution. Max. temp. 41 C
mini.-14-15 C
Less than 750mm in 45 days.
Two peaks of rainfall. 1) June/
July2) September. Bimodal
pattern of rainfall.
Assured
Rainfall Zone
Central Maharashtra
Plateau Zone /Assured
Rainfall Zone
Maximum temperature 41 C
Minimum temperature 21 C
700 to 900 mm 75 % rains
received in all districts of the
zone.
Moderate
Rainfall Zone
Central Vidarbha Zone
/Zone of Moderate
Rainfall
Maxi. Temp. 33-38 C Mini.
Temp. 16-26 C Average daily
humidity 72 % in rainy season,
53 % in winter & 35% in
summer.
1130 mm.
Eastern
Vidarbha Zone
High Rainfall Zone with
Soils derived from
parent material of
different crops. There
are 4 sub-zone based on
climate, soils and crop
pattern
Mean Maximum temperature
varies from 32 to 37 C.
Minimum temperature 15 to 24
C. Daily humidity 73% for
rainy season 62 winter & 35
summer
950 to 1250 mm on western
side. 1700 mm on extreme east
side No of rainy days 59.
Source: NIDM, Maharashtra; Maharashtra State Adaptation Action Plan on Climate Change (MSAAPC),
Dept. of Environment, Govt. of Maharashtra
3.8 Soils
According to the National Bureau of Soil Survey and Land Use Planning (NBSSLP), Maharashtra, can be
divided into 356 soil-mapping units, which are broadly categorized as: (1) Soils of Konkan coast, (2) Soils of
Western Ghats, (3) Soils of Upper Maharashtra, and (4) Soils of Lower Maharashtra.
Table 12: Soil Types by Agro-Climatic Zones
S. No. Agro-climatic
Zones
Name of the Zone Soil Type
1 South Konkan
Coastal Zone
Very high rainfall zone
with lateritic soils
Lateritic,PH-5.5-6.5 acidic, poor in phosphorous rich
in nitrogen and Potassium
2 North Kokan
Coastal Zone
Very high rainfall zone
with non-lateritic soils
Coarse & shallow, PH 5.5 to 6.5, acidic Rich in
nitrogen, poor in phosphorus & potash.
3 Western Ghat Western Ghat
Zone/Ghat zone
'Warkas' i.e. light laterite & reddish brown. Distinctly
acidic, poor fertility low phosphorous & potash
content.
4 Transition Zone-
1
Sub Montane Zone/
Transition Zone 1
Soils are reddish brown to black tending to lateritic.
PH 6-7. Well supplied in nitrogen but low in
phosphorous & potash
5 Transition Zone-
2
Western Maharashtra
Plain Zone /Transition-
Topography is plain. Soils greyish black. Moderately
alkaline 7.4- 8.4, lowest layer is 'Murum' strata. Fair in
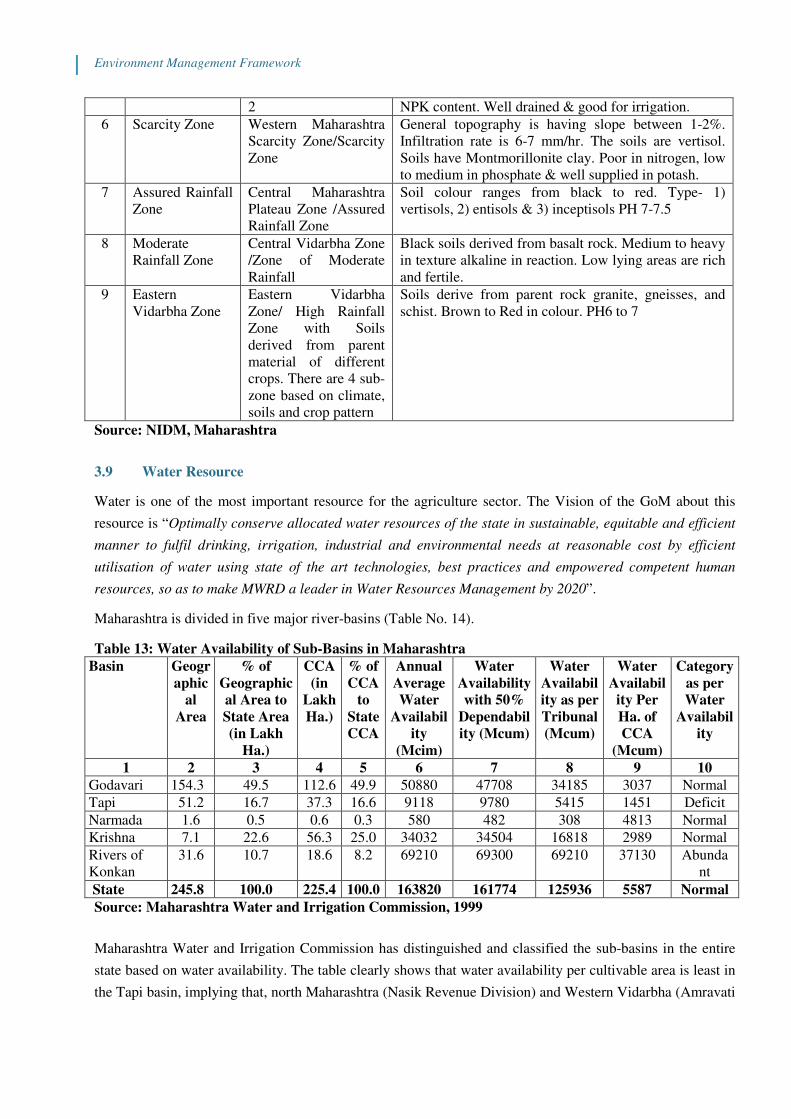
Environment Management Framework
2 NPK content. Well drained & good for irrigation.
6 Scarcity Zone Western Maharashtra
Scarcity Zone/Scarcity
Zone
General topography is having slope between 1-2%.
Infiltration rate is 6-7 mm/hr. The soils are vertisol.
Soils have Montmorillonite clay. Poor in nitrogen, low
to medium in phosphate & well supplied in potash.
7 Assured Rainfall
Zone
Central Maharashtra
Plateau Zone /Assured
Rainfall Zone
Soil colour ranges from black to red. Type- 1)
vertisols, 2) entisols & 3) inceptisols PH 7-7.5
8 Moderate
Rainfall Zone
Central Vidarbha Zone
/Zone of Moderate
Rainfall
Black soils derived from basalt rock. Medium to heavy
in texture alkaline in reaction. Low lying areas are rich
and fertile.
9 Eastern
Vidarbha Zone
Eastern Vidarbha
Zone/ High Rainfall
Zone with Soils
derived from parent
material of different
crops. There are 4 sub-
zone based on climate,
soils and crop pattern
Soils derive from parent rock granite, gneisses, and
schist. Brown to Red in colour. PH6 to 7
Source: NIDM, Maharashtra
3.9 Water Resource
Water is one of the most important resource for the agriculture sector. The Vision of the GoM about this
resource is “Optimally conserve allocated water resources of the state in sustainable, equitable and efficient
manner to fulfil drinking, irrigation, industrial and environmental needs at reasonable cost by efficient
utilisation of water using state of the art technologies, best practices and empowered competent human
resources, so as to make MWRD a leader in Water Resources Management by 2020”.
Maharashtra is divided in five major river-basins (Table No. 14).
Table 13: Water Availability of Sub-Basins in Maharashtra
Basin Geogr
aphic
al
Area
% of
Geographic
al Area to
State Area
(in Lakh
Ha.)
CCA
(in
Lakh
Ha.)
% of
CCA
to
State
CCA
Annual
Average
Water
Availabil
ity
(Mcim)
Water
Availability
with 50%
Dependabil
ity (Mcum)
Water
Availabil
ity as per
Tribunal
(Mcum)
Water
Availabil
ity Per
Ha. of
CCA
(Mcum)
Category
as per
Water
Availabil
ity
1 2 3 4 5 6 7 8 9 10
Godavari 154.3 49.5 112.6 49.9 50880 47708 34185 3037 Normal
Tapi 51.2 16.7 37.3 16.6 9118 9780 5415 1451 Deficit
Narmada 1.6 0.5 0.6 0.3 580 482 308 4813 Normal
Krishna 7.1 22.6 56.3 25.0 34032 34504 16818 2989 Normal
Rivers of
Konkan
31.6 10.7 18.6 8.2 69210 69300 69210 37130 Abunda
nt
State 245.8 100.0 225.4 100.0 163820 161774 125936 5587 Normal
Source: Maharashtra Water and Irrigation Commission, 1999
Maharashtra Water and Irrigation Commission has distinguished and classified the sub-basins in the entire
state based on water availability. The table clearly shows that water availability per cultivable area is least in
the Tapi basin, implying that, north Maharashtra (Nasik Revenue Division) and Western Vidarbha (Amravati

Environment Management Framework
Revenue Division) suffer from water scarcity. It may be noted that in other river-basins, as well, the
availability among sub-basins differs widely. Hence in planning of water-resources, the criterion cannot be
uniform or identical across all regions. The 'regions with water scarcity' and 'regions with extreme scarcity'
should be considered separately and distinctly from other regions. These regions of scarcity and extreme
scarcity account for 13 percent and 33 percent of the total cultivable area (i.e.46 percent of the total
cultivable area).
Table 14: Water Availability by Revenue Division
Region Area
(Lakh
Ha.)
CCA
(Lakh
Ha,)
Average
Water
Availability
(Mcum)
Water
Availability as
per Tribunal
(Mcum)
Water
Availability per
Ha. (Cum) (Col.
6/3)
Category as per
Water Availability
1 2 3 4 6 7 9
Konkan 30.7 17.6 64501 65357 36507 Very High
Nashik 57.5 40.2 17478 13635 3395 Normal
Pune 57.3 45.6 32696 16087 3531 Normal
Aurangabad 64.8 59.3 15254 8202 1383 Deficit
Amravati 46.0 35.6 9813 7033 1974 Deficit
Nagpur 51.3 26.8 24077 15622 5818 Abundant
State 307.7 225.4 163820 125936 5587 Normal
Source: Water Resource Subgroup of the High-Power Committee for Balanced Regional Development in
Maharashtra, 2013
Except the Konkan and Nagpur division, the natural availability of water in Maharashtra is not very good.
Use of Water resources for economic development should, therefore, be planned with extreme care,
efficiency and caution. In particular, the regions with 'less than 3000 cubic meter of water per hectare' will
have to be seriously re-considered about the appropriate crop-pattern under irrigation. The low rainfall
regions should have an appropriate remunerative crop-pattern duly supported by relevant incentives and
provision of agriculture extension services.
In the context of the revenue divisions, Aurangabad and Amravati divisions have irrigation water availability
less than 3000 cubic meters per hectare. Such low availability of water has been having significant impact on
agriculture. Variability in the annual rainfall causes sharp fluctuations in “water stored” and “irrigated area”.
On an average, variations have been within the range of 30%. Variations are relatively much less and
subdued in the Konkan region. However, in Nashik Division the storage was 3811 million cubic metres in
2006 and it declined to 2723 million cubic metres in 2009. This implies reduction of 25%. Similarly, in
Aurangabad division water storage in 2006 was 6204 million cubic meters but declined to 2000 million cubic
meters in 2009. In 2008 irrigated area was 2.99 lakh hectares but it declined to 1.27 lakh hectares in 2009.
3.9.1 Surface Water
The 5 river basins are further subdivided into 15 sub-basins and 1505 watersheds.
The average water availability in the state of Maharashtra is 163.82 km3. According to inter-state water
tribunal awards, the allotted quantity of water to the state is 125.94 km3. Out of the five major river basin
systems, 55% of the dependable yield is available in the four river basins (Krishna, Godavari, Tapi and
Narmada) east of the Western Ghats. These four river basins comprise 92% of the cultivable land and more
than 60% of the population in rural areas. Remaining 45% of state's water resources are from West Flowing
Environment Management Framework
Rivers which are mainly monsoon specific rivers emanating from the Ghats and draining into the Arabian
Sea, which is not utilised due to geological constraints. However, state aggregates and averages are
misleading figures as there is wide variation, both temporal and spatial in the availability of water in the
state. Much of the rainfall occurs within a period of a few months during a year, and even during that period
the intensity is concentrated within a few weeks.
3.9.2 Ground Water
On the basis of geological formations, the State can be divided into five groundwater provinces, (1)
Precambrian metamorphic groundwater province (2) Proterozoic sedimentary groundwater province (3)
Gondwana groundwater province (4) Deccan Trap volcanic groundwater province and (5) Alluvial
groundwater province.
Some of the project districts viz., Akola, Aurangabad, Hingoli, Jalgaon, Latur, Osmanabad, Parbhani have
relatively deeper groundwater levels (>10 m) and the mean groundwater level is below 15 m in these
districts. However, in Akola, Jalgaon, and Latur, the coefficient of variation is relatively higher (>70%),
which suggests that there is high spatial variability and there could be regions with both deeper as well as
shallower groundwater levels in these districts with respect to the mean level and may present higher
uncertainty in the spatial variability of groundwater levels. On the other hand, in Hingoli, Jalna, Wardha, and
Washim the coefficient of variation is lower than 40% and hence it suggests that uncertainty in the spatial
variability of groundwater level with respect to the district mean is relatively lower. In most of the PoCRA
districts the mean groundwater levels are below 10 m indicating that the groundwater is relatively in good
situation. Large fraction of the monitoring stations is dug wells, which also suggest that the groundwater
table is shallow (Shekhar, 2017)3. The report further suggests that it appears feasible to utilize the
groundwater resources for development of key plans in PoCRA districts. The approaches towards this would
be develop the groundwater resources in the rainfed areas of the PoCRA districts for one supplementary
irrigation combining with Kharif rainfall through state-of-art irrigation technologies, which will limit least
use of groundwater resources. Since this additional development proposed would result in additional increase
to the stage of groundwater development in the watersheds the complementary approach that need to be
addressed would be to reduce the current irrigation drafts in these watersheds in higher intensive cultivated
areas through improved irrigation methods, reduced use in non-Kharif seasons and alteration in cropping
choices in such a manner that the stage of groundwater development is maintained overall in the watersheds
at or around the current levels.
Purna basin covers 4.70 lakh ha. of saline land having shrink-swell black soils with low hydraulic
conductivity. Poor quality of groundwater (saline) has resulted in low cropping intensity of 112% in this
region. Several studies (Raja et.al.) have concluded that the river water is suitable for irrigation with
moderate salinity and low sodicity. The dug well and bore well waters have high salinity in pre- and post-
monsoon seasons but show perceptible variations with medium to high sodicity in pre-monsoon and low to
medium sodicity in post-monsoon samples. This water is unsuitable for irrigation and requires management
techniques such as artificial recharge and other soil-management measures.
3 Hydrology & Hydrogeology of the PoCRA districts and Summary of Observations. Prof Sekhar Muddu. IISc Bengaluru

Environment Management Framework
Reducing existing yield gaps and increasing crop productivity in the semi-arid areas of Maharashtra requires
first and foremost an increase in the supply of water for agriculture, especially during the period of soil
moisture stress. To that effect, proposed activities (demonstrations, knowledge sharing and skills
development, building farm/community assets) will: (i) help significantly scale up the adoption by small and
marginal farmers of micro irrigation systems (specifically, drip and sprinkler irrigation systems) and
associated water storage, delivery systems and drainage facilities; and (ii) improve water availability through
a sustainable management of water resources at farm, community and mini watershed level. This sub
component will also promote "protective irrigation" and support efforts to monitor the quality of the water
available for agriculture.
3.10 Watersheds
Measures to conserve recharge and storage of rainwater forms the basic strategy of water resource
management. Watersheds are proven and technologically sound option of in-situ and ex-situ conservation of
rainwater. Maharashtra has 241.0 lakh ha area suitable for watershed development4.
Table 19: Number of Watersheds by River Basin
S.
No.
Basin No. of
Watersheds
Area
(sq. km)
S.
No.
Basin No. of
Watersheds
Area
(sq. km)
1 Narmada 8 1595 9 Godavari Purna 105 16362
2 Tapi East 194 32770 10 Penganga 108 22972
3 Godavari 189 43283 11 PurnaTapi 106 16732
4 Krishna 96 20237 12 Manjara 79 15835
5 Westerly Flowing 99 31933 13 Sina 59 12234
6 Bhima 160 35922 14 Indravati 31 5488
7 Wainganga 166 27558 15 Pranhita 16 3395
8 Wardha 115 21397 Total 1531 307713
Source: Assessment of Dynamic Groundwater Resources of Maharashtra - 2011-2012
3.11 Forest Cover According to the India State of Forest Report 2009, the recorded forest area of the State was 61,939 sq. km.
Reserve forest was constituting 79.47 percent, 13.23 percent under protected forest and unclassed forest was
constituting 7.30 percent of the total forest area of the State. Forest Statistics, 2013 reveals that the forest
area in Vidarbha region is 10.79 percent of the total geographical area. The forest cover in the Marathwada
region is 0.94 percent of the total geographical area, whereas 8.21 percent of the total geographical area is
covered under forest in Western Maharashtra. So, of the total geographical area of the State, 19.94 percent
was under forest cover during 2013.
Table 20: Forest Cover in Different Regions of the State
S. No. Region Forest Area Percentage to Total Geographical Area
1 Vidarbha 33198 10.79
2 Marathwada 2883 0.94
3 Western Maharashtra 25277 8.21
Total 61358 19.94
Source: Statistical Outline, Forest Statistics, 2013; Forest Department, Government of Maharashtra
Note: Total Geographical Area of the State: 3, 07, 713 Sq. Km
Forest cover in project districts is presented in Table No.21.
4Report of The High-Level Committee on Balanced Regional Development Issues in Maharashtra, Government of Maharashtra,
Planning Department, October 2013.
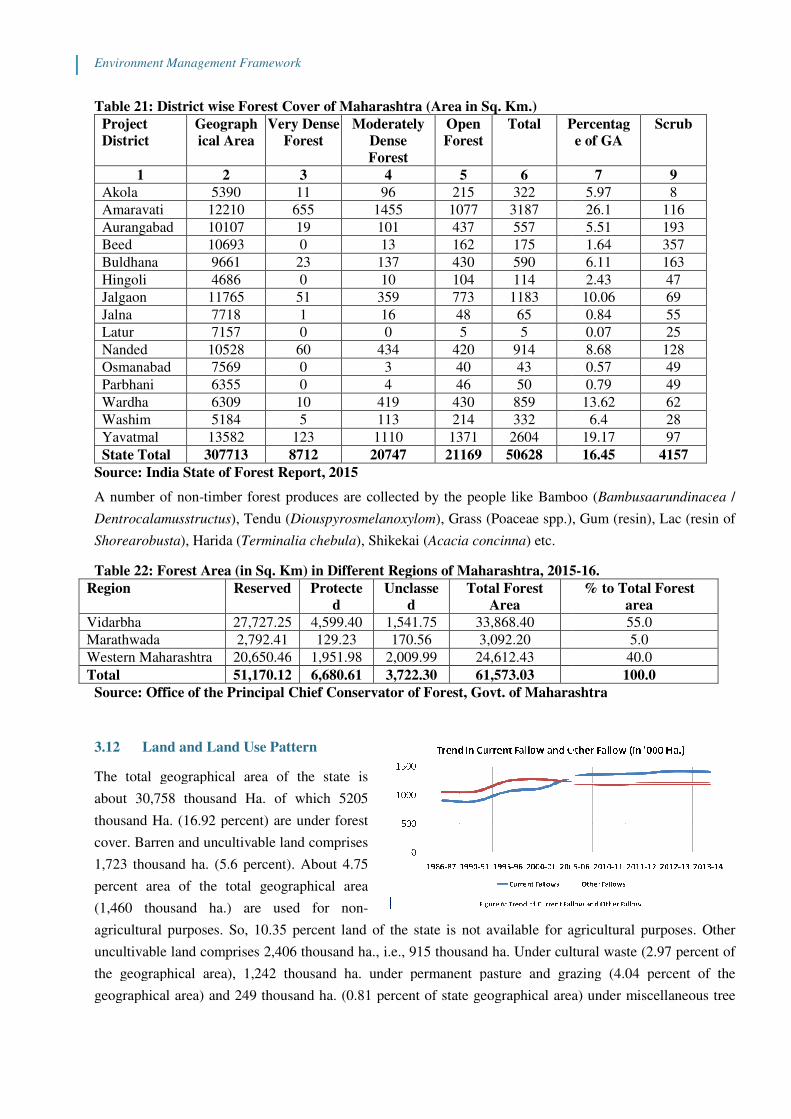
Environment Management Framework
Table 21: District wise Forest Cover of Maharashtra (Area in Sq. Km.)
Project
District
Geograph
ical Area
Very Dense
Forest
1 2
Akola 5390
Amaravati 12210
Aurangabad 10107
Beed 10693
Buldhana 9661
Hingoli 4686
Jalgaon 11765
Jalna 7718
Latur 7157
Nanded 10528
Osmanabad 7569
Parbhani 6355
Wardha 6309
Washim 5184
Yavatmal 13582
State Total 307713
Source: India State of Forest Report, 2015
A number of non-timber forest produces are collected by the people like Bamboo (
Dentrocalamusstructus), Tendu (
Shorearobusta), Harida (Terminalia chebula
Table 22: Forest Area (in Sq. Km) in Different Regions of Maharashtra, 2015
Region Reserved
Vidarbha 27,727.25
Marathwada 2,792.41
Western Maharashtra 20,650.46
Total 51,170.12
Source: Office of the Principal Chief
3.12 Land and Land Use Pattern
The total geographical area of the state is
about 30,758 thousand Ha. of which 5205
thousand Ha. (16.92 percent) are under forest
cover. Barren and uncultivable land comprises
1,723 thousand ha. (5.6 percent). About 4.75
percent area of the total geographical area
(1,460 thousand ha.) are used for non
agricultural purposes. So, 10.35 percent land of the state is not available for agricultural purposes. Other
uncultivable land comprises 2,406 thousand ha., i.e., 915 thousand ha. Under cultural waste (2.97 percent of
the geographical area), 1,242 thousand ha. under permanent pasture and grazing (4.04 percent of the
geographical area) and 249 thousand ha. (0.81 percent of state geograp
Environment Management Framework
ict wise Forest Cover of Maharashtra (Area in Sq. Km.)
Very Dense
Forest
Moderately
Dense
Forest
Open
Forest
Total Percentag
3 4 5 6
11 96 215 322
655 1455 1077 3187
19 101 437 557
0 13 162 175
23 137 430 590
0 10 104 114
51 359 773 1183
1 16 48 65
0 0 5 5
60 434 420 914
0 3 40 43
0 4 46 50
10 419 430 859
5 113 214 332
123 1110 1371 2604
8712 20747 21169 50628
Source: India State of Forest Report, 2015
timber forest produces are collected by the people like Bamboo (
), Tendu (Diouspyrosmelanoxylom), Grass (Poaceae spp.), Gum (resi
Terminalia chebula), Shikekai (Acacia concinna) etc.
Table 22: Forest Area (in Sq. Km) in Different Regions of Maharashtra, 2015
Reserved Protecte
d
Unclasse
d
Total Forest
Area
27,727.25 4,599.40 1,541.75 33,868.40
2,792.41 129.23 170.56 3,092.20
20,650.46 1,951.98 2,009.99 24,612.43
51,170.12 6,680.61 3,722.30 61,573.03
Source: Office of the Principal Chief Conservator of Forest, Govt. of Maharashtra
Land and Land Use Pattern
The total geographical area of the state is
about 30,758 thousand Ha. of which 5205
thousand Ha. (16.92 percent) are under forest
cover. Barren and uncultivable land comprises
23 thousand ha. (5.6 percent). About 4.75
percent area of the total geographical area
(1,460 thousand ha.) are used for non-
agricultural purposes. So, 10.35 percent land of the state is not available for agricultural purposes. Other
ises 2,406 thousand ha., i.e., 915 thousand ha. Under cultural waste (2.97 percent of
the geographical area), 1,242 thousand ha. under permanent pasture and grazing (4.04 percent of the
geographical area) and 249 thousand ha. (0.81 percent of state geographical area) under miscellaneous tree
Percentag
e of GA
Scrub
7 9
5.97 8
26.1 116
5.51 193
1.64 357
6.11 163
2.43 47
10.06 69
0.84 55
0.07 25
8.68 128
0.57 49
0.79 49
13.62 62
6.4 28
19.17 97
16.45 4157
timber forest produces are collected by the people like Bamboo (Bambusaarundinacea /
), Grass (Poaceae spp.), Gum (resin), Lac (resin of
Table 22: Forest Area (in Sq. Km) in Different Regions of Maharashtra, 2015-16.
% to Total Forest
area
55.0
5.0
40.0
100.0
Conservator of Forest, Govt. of Maharashtra
agricultural purposes. So, 10.35 percent land of the state is not available for agricultural purposes. Other
ises 2,406 thousand ha., i.e., 915 thousand ha. Under cultural waste (2.97 percent of
the geographical area), 1,242 thousand ha. under permanent pasture and grazing (4.04 percent of the
hical area) under miscellaneous tree
Environment Management Framework
crops and grooves. Current fallow and other fallow together comprise 8.43 percent of the geographical area
of the state, i.e., 2,593 thousand ha. (current fallow: 1401 thousand ha.; other fallow:1192 thousand ha.)
(reference: land use statistics of 2013-14) (Table No. 23).
Table 23: Land Utilization in the State, 1986-87 to 2013-14 (Area in ‘000 Ha.) Year Geogra
phical
Area
Area
Under
Forest
Land Not
Available for
Cultivation
Other Uncultivated
Land
Fallow Land Cropped Area Gross
Cropped
Area
Barr
en &
Unc
ultiv
able
Lan
d
Land
Put
to
Non-
Ag.
Use
Cu
ltu
ra
ble
W
ast
e
Perma
nent
Pastur
e &
Grazi
ng
Land
Land
Under
Miscella
neous
Tree
Crops
&
Groves
Curr
ent
Fallo
ws
Othe
r
Fallo
ws
Net
Area
Sown
Area
Sow
n
Mor
e
than
Onc
e
1 2 3 4 5 6 7 8 9 10 11 12 13
1986-87 30,758 5,350 1,679 1,152 1,04
4
1,367 196 909 1,057 18,004 2,320 20,324
1990-91 30,758 5,128 1,622 1,091 966 1,125 301 898 1,063 18,565 3,295 21,859
1995-96 30,758 5,148 1,544 1,349 960 1,166 292 1,072 1,248 17,980 3,524 21,504
2000-01 30,758 5,150 1,544 1,364 959 1,168 327 1,126 1,276 17,844 3,775 21,619
2005-06 30,758 5,212 1,720 1,407 914 1,252 249 1,327 1,204 17,473 5,083 22,556
2010-11 30,758 5,216 1,731 1,449 919 1,242 250 1,366 1,179 17,406 5,769 23,175
2011-12 30,758 5,211 1,728 1,451 919 1,244 250 1,378 1,192 17,386 5,720 23,106
2012-13 30,758 5,207 1,722 1,456 916 1,245 251 1,418 1,200 17,344 5,772 23,116
2013-14 30,758 5,205 1,723 1,460 915 1,242 249 1,401 1,192 17,368 6,012 23,380
Source: Dept. of Agriculture, Govt. of Maharashtra
Present land use pattern reflects that out of total 1255.62 Ha of geographical area, total net sown area is
9753.72 Ha. (Table No. 24).
Table 24: Land use Pattern in Project Districts (area in 000’ Ha.)
District total_ge
ographi
cal_area
Agricultu
ral Land/
Total
culturabl
e Land /
Total
Cultivabl
e Area
Total
Cultivat
ed
Area/La
nd
Net Area
Sown
Forest
Area
Area
under
Non-
Agricult
ural
Uses
Barren
&Unculti
vable
Land
Area
Permanen
t Pastures
and Other
Grazing
Land Area
Land Under
Miscellaneo
us Tree
Crops etc.
Akola 540.74 443.96 429.30 421.48 45.17 45.17 16.49 13.43 1.21
Amravati 959.26 758.96 717.27 702.53 86.65 86.65 31.17 31.58 12.70
Aurangabad 1038.52 855.46 812.68 804.29 89.84 89.84 15.85 25.54 2.09
Beed 1088.59 968.99 928.97 912.32 20.56 20.56 28.62 25.94 4.12
Buldana 961.66 767.18 739.09 724.00 84.50 84.50 33.15 27.81 2.68
Hingoli 478.06 415.84 397.58 394.03 16.45 16.45 8.12 8.79 1.20
Jalgaon 775.09 847.84 812.50 799.26 93.57 93.57 58.80 31.99 4.92
Jalna 1091.35 703.76 680.13 671.74 9.09 9.09 15.86 16.68 1.76
Latur 726.80 676.12 655.38 639.59 2.32 2.32 14.98 8.12 1.93
Nanded 1061.92 854.86 815.49 789.26 102.90 102.90 26.64 36.29 4.47
Environment Management Framework
District total_ge
ographi
cal_area
Agricultu
ral Land/
Total
culturabl
e Land /
Total
Cultivabl
e Area
Total
Cultivat
ed
Area/La
nd
Net Area
Sown
Forest
Area
Area
under
Non-
Agricult
ural
Uses
Barren
&Unculti
vable
Land
Area
Permanen
t Pastures
and Other
Grazing
Land Area
Land Under
Miscellaneo
us Tree
Crops etc.
Osmanab
ad
772.55 729.14 709.97 700.74 6.67 6.67 10.81 6.61 1.52
Prabhani 621.92 575.88 566.01 561.49 6.40 6.40 11.93 6.26 0.84
Wardha 575.34 457.83 414.04 400.27 36.68 36.68 17.78 17.68 4.94
Washim 507.26 407.06 388.65 382.12 39.89 39.89 17.92 25.51 2.12
Yevatmal 1351.55 930.76 873.77 850.59 242.63 242.63 41.31 45.86 7.90
GT 12550.62 10393.64 9940.81 9753.72 883.33 883.33 349.44 328.09 54.39
Source: Dept. of Agriculture, Govt. of Maharashtra
3.13 Agriculture
The project districts are selected based on its/their overall vulnerability to climate variability. Agriculture,
including horticulture, sector has been and expected to be more vulnerable in coming days in these districts
due to poor irrigation infrastructure and rain-fed condition. Area under different crops has been decreasing
and crop yield rate is significantly impacted due to dry spells.
The cropping intensity of the project districts varies between 102 percent to 161 percent. The project district
of Osmanabad is having the highest cropping intensity (161 percent) followed by Jalgaon (157 percent) and
Wardha (156 percent). Lowest cropping intensity is observed in Yavatmal (102 percent), followed by
Buldana (106 percent) and Washim (110 percent) (Table No. 25).
Table 25: Gross Cropped Area and Cropping Intensity (area in ‘000 Ha.)
District Net Sown
Area
(NSA)
NSA to
CA
Area Sown
More than
Once
Area sown more
than once to Net
Sown Area
Gross
Cropped
Area
Cropping
Intensity
(CI) %
CI Rank
Akola 434.9 95.58 91.1 20.95 526.0 121 7
Amravati 602.0 78.59 110.0 18.27 712.0 118 11
Aurangabad 654.0 80.54 130.4 19.94 784.4 120 8
Beed 876.0 85.97 175.2 20.00 1051.2 120 8
Buldhana 712.0 96.22 44.0 6.18 756.0 106 14
Hingoli 382.1 86.51 120.4 31.51 502.5 132 4
Jalgoan 844.2 99.03 480.6 56.93 1324.8 157 2
Jalna 529.0 74.21 159.0 30.06 688.0 130 5
Latur 529.0 80.46 159.0 30.06 688.0 130 5
Nanded 711.0 87.92 100.1 14.08 811.1 114 12
Osmanabad 519.3 89.09 321.9 61.98 841.2 161 1
Parbhani 518.8 88.88 103.8 20.00 622.5 120 8
Wardha 284.0 60.04 158.0 55.63 442.0 156 3
Washim 386.0 100.00 38.0 9.84 424.0 110 13
Yavatmal 884.0 100.00 15.0 1.70 899.0 102 15
Source: Agriculture Statistics, 2013-14, Maharashtra
Area (A) and productivity (P) of some of the crops by project districts are presented in the Table No. 26.

Environment Management Framework
Table 26: Area (A) and Production (P) of Selected Field Crops in the Project Districts
Area and Production of Major crops in Project districts ( Av of 2010-11 To 2014-15) (Area in "00" Ha
& Production in ‘000Kg)
S.
No.
District Kh Sorghum Pigeon pea Soyabeen Cotton (Lint) Gram
A P A P A P A P A P
1 Jalgaon 803 1794 170 135 167 290 5294 10526 454 497
2 Aurangabad 52 82 389 259 107 108 3873 6469 431 285
3 Jalna 21 23 487 304 712 755 2984 4669 244 134
4 Beed 257 280 560 262 860 1112 3293 3792 530 312
5 Latur 1028 1449 1054 1048 2741 4750 44 112 744 680
6 Osmanabad 496 360 975 638 1069 1372 247 374 765 487
7 Nanded 1124 1117 685 362 1963 2249 3237 4096 557 496
8 Parbhani 709 732 684 379 1333 1460 2572 4260 559 366
9 Hingoli 458 486 363 303 1506 1906 926 1593 616 854
10 Buldhana 409 556 662 327 2879 3777 2329 3752 606 503
11 Akola 365 545 606 541 1677 1916 1602 2637 799 715
12 Washim 170 171 538 298 2403 2562 475 749 671 609
13 Amravati 376 418 1142 951 3233 3541 1932 4095 930 942
14 Yavatmal 573 484 1121 820 2497 2429 4532 6917 417 440
15 Wardha 35 20 701 580 1655 1359 1852 2727 306 241
Source: Crop statistics, Department of Agriculture, GoM
According to the Report of the High-Level Committee on Balanced Regional Development Issues in
Maharashtra (Government of Maharashtra, Planning Department, October 2013), The state has created 48.25
lakh ha irrigation potential out of which 29.54 lakh ha is actually irrigated. Maharashtra has 82% rainfed area
and region wise distribution shows 92.6% area in Konkan, 77.0% in Western Maharashtra, 95.2% in
Marathwada and 81.2% in Vidarbha. Efficient use of stored water and its distribution becomes a key area of
intervention. Marathwada has very high percentage of non-irrigated land and approximately 40% area of
Marathwada is drought prone.
The report finds that Water requirement for surface irrigation of crops is 1,97,958 million cubic meters
(Mm3) and adoption of micro irrigation methods will reduce the water requirement to 1,01,240 Mm
3 i.e.
saving of 49% water. Maharashtra has 36% deficit of water needed for agriculture. If water requirement for
drinking and industry is considered then water deficit for agriculture will further fall.
Table 27: Irrigation Status and Rate of Growth
Item Year 1960-
61
Year 2010-
11
Rate of Growth (Times)
Designed Water Storage (Mcum) 1574.4 33385 21.2
Irrigation potential created (Lakh Ha.) 3.96 47.4 11.96
Irrigated Area (in lakh Ha.) 2.26 29.55 13.06
Water Use Non-Irrigation (in Mcum) - 6955 -
Source and Ref: Irrigation Status Report, Government of Maharashtra, 2010.
Data on Region-wise water use indicates sizable large disparity in the use of available water. Western
Maharashtra with 36% crop area uses 47% of the water, Vidarbha with 30% crop area uses 28% water,
Marathwada with 31% crop area uses 14% water and Konkan with 3% crop area uses 11% water.

Environment Management Framework
Table 28: Irrigation Potential Created by Revenue Division, 2010-11
S.
No.
Revenue
Division
Cultural Area (in Lakh
Ha.)
Irrigation Potential
Created as in 2010
Percentage of Cultural
Area
1 Konkan 17.93 0.98 5.46
2 Nashik 40.16 9.7 24.15
3 Pune 45.56 15.41 33.82
4 Aurangabad 59.30 10.50 17.70
5 Amravati 35.62 4.6 12.91
6 Nagpur 26.85 6.1 22.71
Maharashtra 225.42 47.4 21.02
Source: Report of The High-Level Committee on Balanced Regional Development Issues in
Maharashtra, Government of Maharashtra, Planning Department, October 2013, with reference to
Irrigation Status Report, Govt. of Maharashtra, 2010.
So, managing the available water more efficiently seems an essentiality. The report highlights that
converting irrigated crops to micro irrigation, implementation of watershed program at much accelerated
rate, building water conservation and storage structures, saving conveyance losses by using conduit pipes,
shifting to crops with low water requirement are the important and priority initiatives required for sustainable
growth of agriculture. Efficient use of surface water and groundwater will be helpful in this regard.
3.15 Pesticide and Fertilizer Usage
The fertilizer consumption for the year 2014-15 was 60.13 lakh MT in the State, with an average of 125.9 kg
per hectare. For the year 2015-16, Consumption of chemical fertilizers in the State was anticipated to be
58.25 lakh MT with average per hectare consumption of 107 Kg. The year wise use of chemical fertilizers is
presented in the Table No. 29 along with use of chemical and bio-pesticides.
Table 29: Use of Chemical Fertiliser and Pesticides in the State, 2013-14 to 2015-16
S. No. Year Fertilizer Consumption
(Lakh MT)
Per Ha. Fertilizer
Consumption
(Kg)
Pesticides
Chemical Bio
1 2013-14 59.90 119.4 10,969 1,433
2 2014-15 60.13 125.9 11,239 1,124
3 2015-16 58.25 107.0 11,280 4,292
Source: Economic Survey, 2015-16 as Reported by Commissionerate of Agriculture, GoM
3.15.1 Fertilizer Consumption
In the State, about 60 % of the total area is cultivated during Kharif season. Accordingly, 60-70 % of the
annual fertilizer consumption is effected in the Kharif season. Almost 40 Lakh M.T. of fertilizers are
consumed in Kharif season and 30-lakh MT are consumed in Rabi season. Normal area in Rabi is 58.60 lakh
ha, while it is 139.42 lakh ha in Kharif season.
Table 30: Fertilizer Consumption in Maharashtra (Lakh MT)
Year Urea DAP MOP NPK SSP Others Total
2001-02 16.48 4.17 2.27 8.7 5.3 0.53 37.45
2002-03 15.62 4.25 2.18 8.79 5.21 0.42 36.47
2003-04 14.02 3.51 1.41 7.91 5.14 0.43 32.42
2004-05 15.41 5.47 2.21 8.71 5.11 0.55 37.46
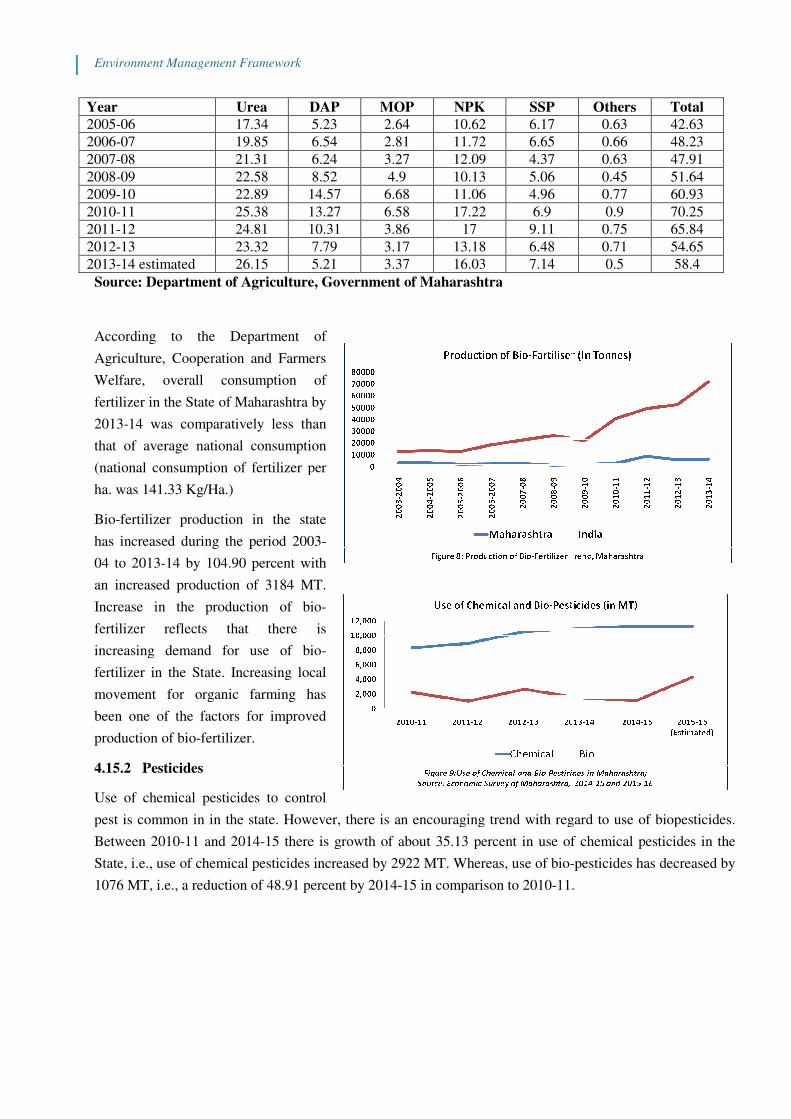
Environment Management Framework
Year Urea
2005-06 17.34
2006-07 19.85
2007-08 21.31
2008-09 22.58
2009-10 22.89
2010-11 25.38
2011-12 24.81
2012-13 23.32
2013-14 estimated 26.15
Source: Department of Agriculture, Government of Maharashtra
According to the Department of
Agriculture, Cooperation and Farmers
Welfare, overall consumption of
fertilizer in the State of Maharashtra by
2013-14 was comparatively less than
that of average national consumption
(national consumption of fertilizer per
ha. was 141.33 Kg/Ha.)
Bio-fertilizer production in the state
has increased during the period 2003
04 to 2013-14 by 104.90 percent with
an increased production of 3184 MT.
Increase in the production of bio
fertilizer reflects that there is
increasing demand for use of bio
fertilizer in the State. Increasing local
movement for organic farming has
been one of the factors for improved
production of bio-fertilizer.
4.15.2 Pesticides
Use of chemical pesticides to control
pest is common in in the state. However, there is an encouraging trend with regard to use of biopesticides.
Between 2010-11 and 2014-15 there is growth of about 35.13 percent in use of chemical pesticides i
State, i.e., use of chemical pesticides increased by 2922 MT. Whereas, use of bio
1076 MT, i.e., a reduction of 48.91 percent by 2014
Environment Management Framework
DAP MOP NPK SSP
5.23 2.64 10.62 6.17
6.54 2.81 11.72 6.65
6.24 3.27 12.09 4.37
8.52 4.9 10.13 5.06
14.57 6.68 11.06 4.96
13.27 6.58 17.22 6.9
10.31 3.86 17 9.11
7.79 3.17 13.18 6.48
5.21 3.37 16.03 7.14
Source: Department of Agriculture, Government of Maharashtra
According to the Department of
Agriculture, Cooperation and Farmers
Welfare, overall consumption of
fertilizer in the State of Maharashtra by
ly less than
that of average national consumption
(national consumption of fertilizer per
fertilizer production in the state
has increased during the period 2003-
14 by 104.90 percent with
84 MT.
Increase in the production of bio-
fertilizer reflects that there is
increasing demand for use of bio-
fertilizer in the State. Increasing local
movement for organic farming has
been one of the factors for improved
Use of chemical pesticides to control
pest is common in in the state. However, there is an encouraging trend with regard to use of biopesticides.
15 there is growth of about 35.13 percent in use of chemical pesticides i
State, i.e., use of chemical pesticides increased by 2922 MT. Whereas, use of bio-
1076 MT, i.e., a reduction of 48.91 percent by 2014-15 in comparison to 2010-11.
Others Total
0.63 42.63
0.66 48.23
0.63 47.91
0.45 51.64
0.77 60.93
0.9 70.25
0.75 65.84
0.71 54.65
0.5 58.4
pest is common in in the state. However, there is an encouraging trend with regard to use of biopesticides.
15 there is growth of about 35.13 percent in use of chemical pesticides in the
-pesticides has decreased by
11.
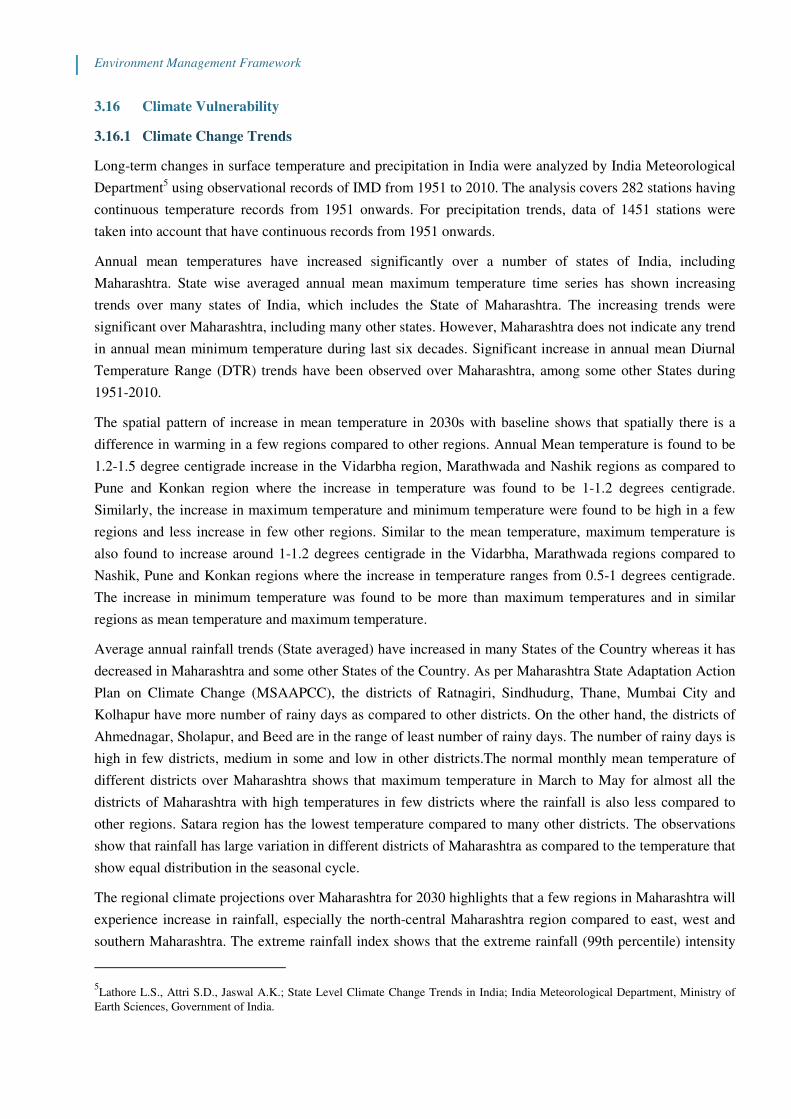
Environment Management Framework
3.16 Climate Vulnerability
3.16.1 Climate Change Trends
Long-term changes in surface temperature and precipitation in India were analyzed by India Meteorological
Department5 using observational records of IMD from 1951 to 2010. The analysis covers 282 stations having
continuous temperature records from 1951 onwards. For precipitation trends, data of 1451 stations were
taken into account that have continuous records from 1951 onwards.
Annual mean temperatures have increased significantly over a number of states of India, including
Maharashtra. State wise averaged annual mean maximum temperature time series has shown increasing
trends over many states of India, which includes the State of Maharashtra. The increasing trends were
significant over Maharashtra, including many other states. However, Maharashtra does not indicate any trend
in annual mean minimum temperature during last six decades. Significant increase in annual mean Diurnal
Temperature Range (DTR) trends have been observed over Maharashtra, among some other States during
1951-2010.
The spatial pattern of increase in mean temperature in 2030s with baseline shows that spatially there is a
difference in warming in a few regions compared to other regions. Annual Mean temperature is found to be
1.2-1.5 degree centigrade increase in the Vidarbha region, Marathwada and Nashik regions as compared to
Pune and Konkan region where the increase in temperature was found to be 1-1.2 degrees centigrade.
Similarly, the increase in maximum temperature and minimum temperature were found to be high in a few
regions and less increase in few other regions. Similar to the mean temperature, maximum temperature is
also found to increase around 1-1.2 degrees centigrade in the Vidarbha, Marathwada regions compared to
Nashik, Pune and Konkan regions where the increase in temperature ranges from 0.5-1 degrees centigrade.
The increase in minimum temperature was found to be more than maximum temperatures and in similar
regions as mean temperature and maximum temperature.
Average annual rainfall trends (State averaged) have increased in many States of the Country whereas it has
decreased in Maharashtra and some other States of the Country. As per Maharashtra State Adaptation Action
Plan on Climate Change (MSAAPCC), the districts of Ratnagiri, Sindhudurg, Thane, Mumbai City and
Kolhapur have more number of rainy days as compared to other districts. On the other hand, the districts of
Ahmednagar, Sholapur, and Beed are in the range of least number of rainy days. The number of rainy days is
high in few districts, medium in some and low in other districts.The normal monthly mean temperature of
different districts over Maharashtra shows that maximum temperature in March to May for almost all the
districts of Maharashtra with high temperatures in few districts where the rainfall is also less compared to
other regions. Satara region has the lowest temperature compared to many other districts. The observations
show that rainfall has large variation in different districts of Maharashtra as compared to the temperature that
show equal distribution in the seasonal cycle.
The regional climate projections over Maharashtra for 2030 highlights that a few regions in Maharashtra will
experience increase in rainfall, especially the north-central Maharashtra region compared to east, west and
southern Maharashtra. The extreme rainfall index shows that the extreme rainfall (99th percentile) intensity
5Lathore L.S., Attri S.D., Jaswal A.K.; State Level Climate Change Trends in India; India Meteorological Department, Ministry of
Earth Sciences, Government of India.

Environment Management Framework
increases in all regions, and with large amount of increase in Aurangabad and northern regions of Nashik
division compared to Konkan belt and Vidarbha region.The projection reveals that there may increase in the
number of days of rainfall in some parts of south central Maharashtra region.
3.16.2 Vulnerability of the State
Maharashtra is prone to various disasters such as drought, floods, cyclones, earthquake and accidents. While
low rainfall areas of the state are under the constant risk of droughts, high rainfall zones of eastern and
western Maharashtra are prone to flash floods and landslides.
From environment point of view, the state has suffered huge losses, both direct and indirect, caused by
various disasters. For example, the infamous Latur earthquake of 1993, resulted in the loss of several
thousands of human and animals lives. In addition, it caused damage to entire infrastructure such as
buildings, roads, railways, pipelines, and electricity network, etc. In order to avoid such losses due to
disasters, the GoM has established a mechanism for disaster preparedness and mitigation by integrating
science and technology with communication network facilitates.
In 2001, droughts affected about 20,000 villages in 23 districts; 28.4 million people and 4.5 million hectares
of crops in the State.Number of districts affected by droughts in the year 2002-03 and 2003-04 were 33 and
11, respectively. The situation of droughts in Maharashtra continued to deteriorate in 2004. Following the
failure of monsoon in 2003, the Govt. of Maharashtra (GoM) declared droughts in 11 districts namely, Pune,
Satara, Sangli, and Solapur (Pune Division), Nashik and Ahmednagar (Nashik Division) and Beed, Latur,
Dharashiv and Aurangabad (Aurangabad Division). Altogether 71 talukas in these 11 districts are seriously
affected by the droughts.
Apart from these extreme events, state is susceptible to agriculture vulnerability that includes temperature
and precipitation. Both are undergoing rapid changes due to anthropogenic and climatic reasons. Other
biophysical factors that affect productivity in agriculture are soil and water conditions. There are inherent
structural constraints largely in the domain of social structure, demography, dependency and counter-
dependence that contributes to the backwardness of certain regions. There are environmental conditions that
degrade water quality, increase pollution and causes higher greenhouse gas emission due to certain types of
agricultural practices or energy use. Together these factors contribute to the vulnerability.
To include various vulnerability criteria project has developed vulnerability assessment indicators for the
selection of project villages under two broad categories i.e. Sensitivity Indicator and Adaptive Capacity
Indicator. The sensitive indicators includes (i) Net sown area as % to geographical area (ii) Degraded land as
% to geographical area (iii) Drought proneness (paisewari < 50 paisa) (iv) Groundwater Prospects (v) Area
operated by small & marginal farmers. The adaptive capacity indicators includes (i) Agrarian distress (ii)
Proportion of SC/ ST farmers (iii) Agriculture workers (iv) Proportion of Rural poor (v) Female Literacy
Gap and (vi) Livestock population.
The impact of disaster vulnerability and district-wise vulnerability of the state is given in table:
Table 32: Vulnerability of Project Districts (Extreme events)
Districts Flood Earthquake Cyclone Drought
Akola Patur taluka has the largest flood-prone
area (57%), followed by BarsiTakli
(48%), Akot (45%), Balapur (40%) etc.
Yes No Yes
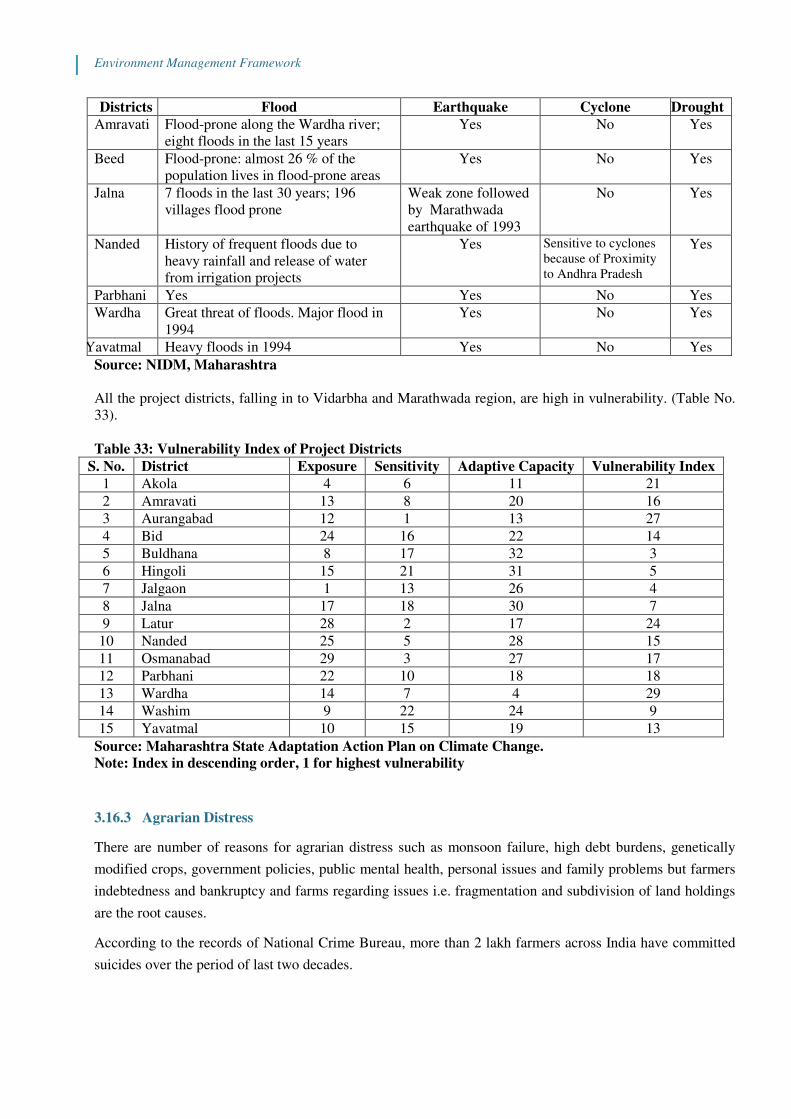
Environment Management Framework
Districts Flood Earthquake Cyclone Drought
Amravati Flood-prone along the Wardha river;
eight floods in the last 15 years
Yes No Yes
Beed Flood-prone: almost 26 % of the
population lives in flood-prone areas
Yes No Yes
Jalna 7 floods in the last 30 years; 196
villages flood prone
Weak zone followed
by Marathwada
earthquake of 1993
No Yes
Nanded History of frequent floods due to
heavy rainfall and release of water
from irrigation projects
Yes Sensitive to cyclones
because of Proximity
to Andhra Pradesh
Yes
Parbhani Yes Yes No Yes
Wardha Great threat of floods. Major flood in
1994
Yes No Yes
Yavatmal Heavy floods in 1994 Yes No Yes
Source: NIDM, Maharashtra
All the project districts, falling in to Vidarbha and Marathwada region, are high in vulnerability. (Table No.
33).
Table 33: Vulnerability Index of Project Districts
S. No. District Exposure Sensitivity Adaptive Capacity Vulnerability Index
1 Akola 4 6 11 21
2 Amravati 13 8 20 16
3 Aurangabad 12 1 13 27
4 Bid 24 16 22 14
5 Buldhana 8 17 32 3
6 Hingoli 15 21 31 5
7 Jalgaon 1 13 26 4
8 Jalna 17 18 30 7
9 Latur 28 2 17 24
10 Nanded 25 5 28 15
11 Osmanabad 29 3 27 17
12 Parbhani 22 10 18 18
13 Wardha 14 7 4 29
14 Washim 9 22 24 9
15 Yavatmal 10 15 19 13
Source: Maharashtra State Adaptation Action Plan on Climate Change.
Note: Index in descending order, 1 for highest vulnerability
3.16.3 Agrarian Distress
There are number of reasons for agrarian distress such as monsoon failure, high debt burdens, genetically
modified crops, government policies, public mental health, personal issues and family problems but farmers
indebtedness and bankruptcy and farms regarding issues i.e. fragmentation and subdivision of land holdings
are the root causes.
According to the records of National Crime Bureau, more than 2 lakh farmers across India have committed
suicides over the period of last two decades.
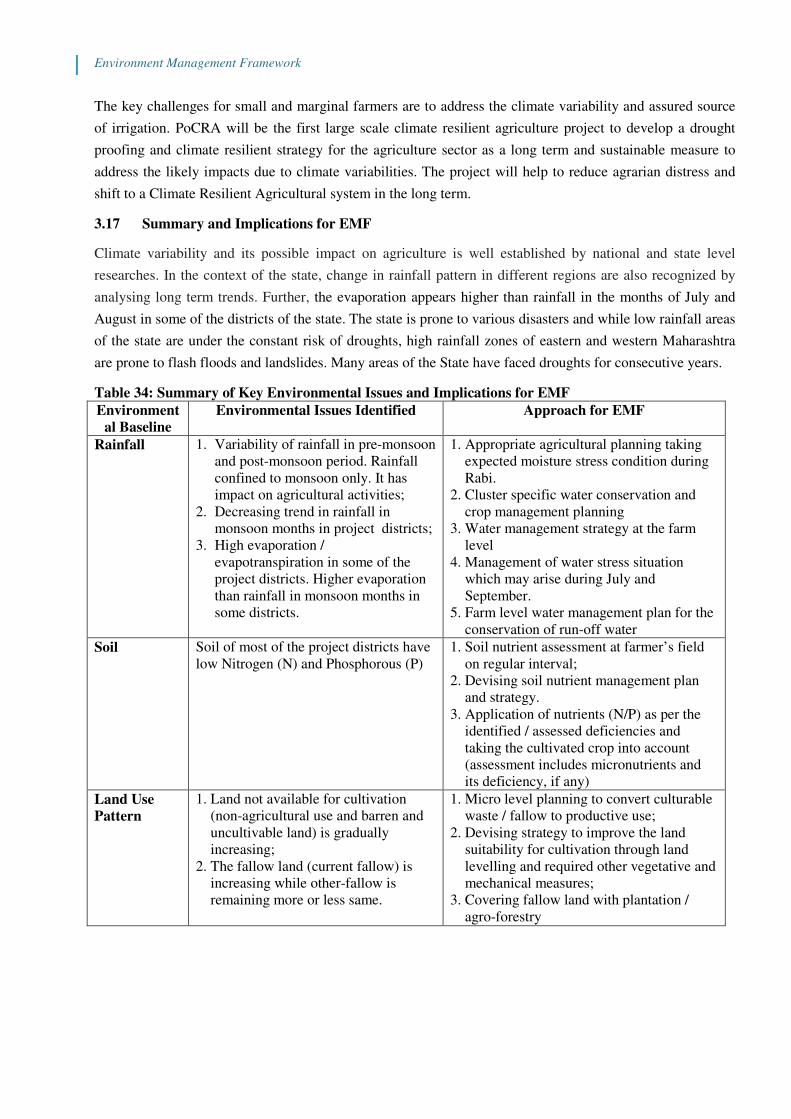
Environment Management Framework
The key challenges for small and marginal farmers are to address the climate variability and assured source
of irrigation. PoCRA will be the first large scale climate resilient agriculture project to develop a drought
proofing and climate resilient strategy for the agriculture sector as a long term and sustainable measure to
address the likely impacts due to climate variabilities. The project will help to reduce agrarian distress and
shift to a Climate Resilient Agricultural system in the long term.
3.17 Summary and Implications for EMF
Climate variability and its possible impact on agriculture is well established by national and state level
researches. In the context of the state, change in rainfall pattern in different regions are also recognized by
analysing long term trends. Further, the evaporation appears higher than rainfall in the months of July and
August in some of the districts of the state. The state is prone to various disasters and while low rainfall areas
of the state are under the constant risk of droughts, high rainfall zones of eastern and western Maharashtra
are prone to flash floods and landslides. Many areas of the State have faced droughts for consecutive years.
Table 34: Summary of Key Environmental Issues and Implications for EMF
Environment
al Baseline
Environmental Issues Identified Approach for EMF
Rainfall 1. Variability of rainfall in pre-monsoon
and post-monsoon period. Rainfall
confined to monsoon only. It has
impact on agricultural activities;
2. Decreasing trend in rainfall in
monsoon months in project districts;
3. High evaporation /
evapotranspiration in some of the
project districts. Higher evaporation
than rainfall in monsoon months in
some districts.
1. Appropriate agricultural planning taking
expected moisture stress condition during
Rabi.
2. Cluster specific water conservation and
crop management planning
3. Water management strategy at the farm
level
4. Management of water stress situation
which may arise during July and
September.
5. Farm level water management plan for the
conservation of run-off water
Soil Soil of most of the project districts have
low Nitrogen (N) and Phosphorous (P)
1. Soil nutrient assessment at farmer’s field
on regular interval;
2. Devising soil nutrient management plan
and strategy.
3. Application of nutrients (N/P) as per the
identified / assessed deficiencies and
taking the cultivated crop into account
(assessment includes micronutrients and
its deficiency, if any)
Land Use
Pattern
1. Land not available for cultivation
(non-agricultural use and barren and
uncultivable land) is gradually
increasing;
2. The fallow land (current fallow) is
increasing while other-fallow is
remaining more or less same.
1. Micro level planning to convert culturable
waste / fallow to productive use;
2. Devising strategy to improve the land
suitability for cultivation through land
levelling and required other vegetative and
mechanical measures;
3. Covering fallow land with plantation /
agro-forestry
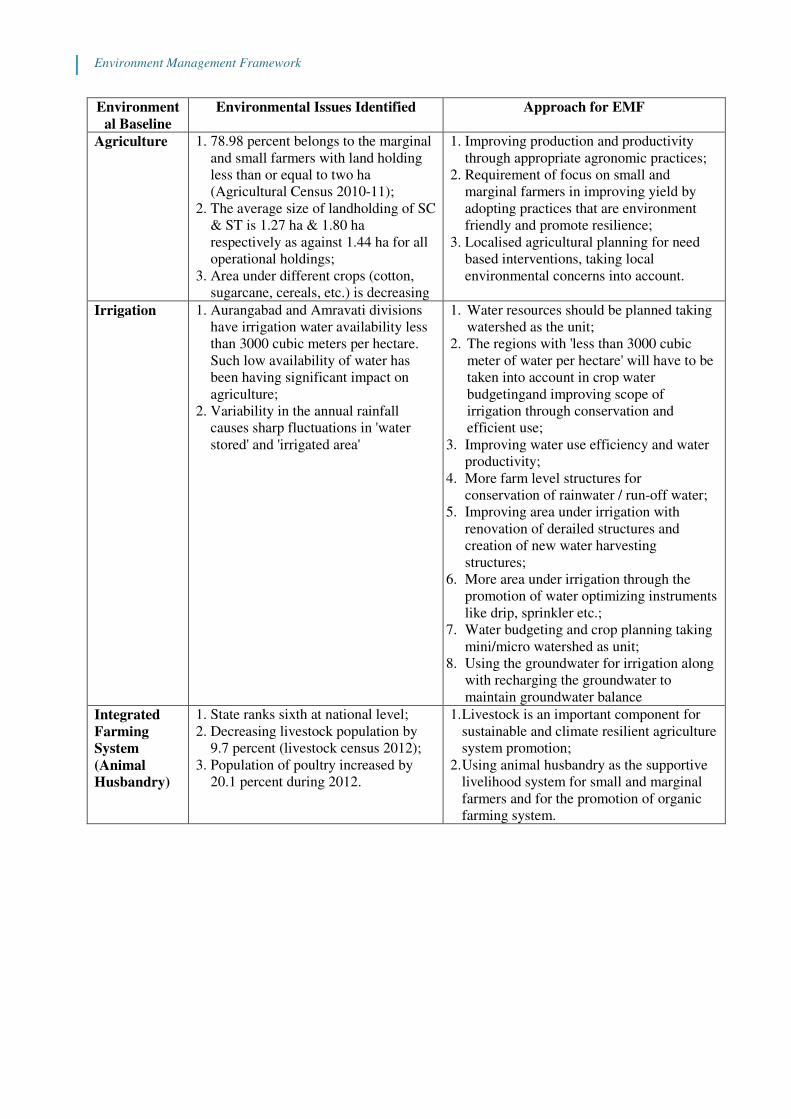
Environment Management Framework
Environment
al Baseline
Environmental Issues Identified Approach for EMF
Agriculture 1. 78.98 percent belongs to the marginal
and small farmers with land holding
less than or equal to two ha
(Agricultural Census 2010-11);
2. The average size of landholding of SC
& ST is 1.27 ha & 1.80 ha
respectively as against 1.44 ha for all
operational holdings;
3. Area under different crops (cotton,
sugarcane, cereals, etc.) is decreasing
1. Improving production and productivity
through appropriate agronomic practices;
2. Requirement of focus on small and
marginal farmers in improving yield by
adopting practices that are environment
friendly and promote resilience;
3. Localised agricultural planning for need
based interventions, taking local
environmental concerns into account.
Irrigation 1. Aurangabad and Amravati divisions
have irrigation water availability less
than 3000 cubic meters per hectare.
Such low availability of water has
been having significant impact on
agriculture;
2. Variability in the annual rainfall
causes sharp fluctuations in 'water
stored' and 'irrigated area'
1. Water resources should be planned taking
watershed as the unit;
2. The regions with 'less than 3000 cubic
meter of water per hectare' will have to be
taken into account in crop water
budgetingand improving scope of
irrigation through conservation and
efficient use;
3. Improving water use efficiency and water
productivity;
4. More farm level structures for
conservation of rainwater / run-off water;
5. Improving area under irrigation with
renovation of derailed structures and
creation of new water harvesting
structures;
6. More area under irrigation through the
promotion of water optimizing instruments
like drip, sprinkler etc.;
7. Water budgeting and crop planning taking
mini/micro watershed as unit;
8. Using the groundwater for irrigation along
with recharging the groundwater to
maintain groundwater balance
Integrated
Farming
System
(Animal
Husbandry)
1. State ranks sixth at national level;
2. Decreasing livestock population by
9.7 percent (livestock census 2012);
3. Population of poultry increased by
20.1 percent during 2012.
1. Livestock is an important component for
sustainable and climate resilient agriculture
system promotion;
2. Using animal husbandry as the supportive
livelihood system for small and marginal
farmers and for the promotion of organic
farming system.

Environment Management Framework
Environment
al Baseline
Environmental Issues Identified Approach for EMF
Climate
Vulnerability
1. Some project districts are high to
medium in exposure, sensitivity and
adaptive capacity indicators;
2. Some districts are high in
vulnerability6 index and most are in
the lower middle to middle range
1. Micro level planning based on local
vulnerability parameters and its
consolidation at district / state level for
devising measures for vulnerability
reduction;
2. Vulnerability reduction through scientific
management of natural resources;
3. Using ICT and providing weather
information to farmers for agricultural
planning;
4. Drought contingency planning at micro /
watershed level and provision of required
agricultural support system accordingly.
Use of
Fertilizer &
Pesticides
1. Application of fertilizer (Kg/Ha.)
has reduced in 2015-16 (107.0) in
comparison to 2013-14 (119.4) and
2014-15 (125.9);
2. Use of chemical pesticides is
increasing along with use of
biopesticides.
1. Increasing trend of using organic / bio-
fertilizer / pesticides can be further
augmented and consolidated to reduce
the cost of cultivation and improve the
environmental parameters;
2. Adoption of scientific method of
nutrition and pest management (INM and
IPM) can help the farmers and the
environment;
3. An approach that helps to take up using
both organic and synthetic fertilizer and
pesticides can help the farmers and the
environment in longer run.
The findings related to climate vulnerability of the state have implications of long term changes rather than
the short term. However, such changes are likely to have negative impacts on agriculture and production
system in the long run. While the EMF looks into expected adverse impacts due to the implementation of the
project, the planned activities will be supportive to minimize the current impacts of climate variability on
agriculture and improve the resilience. So, the EMF will look into some specific aspects contextually, that
are linked to agriculture like improving water use efficiency, improving soil health, managing plant nutrient,
recharging ground water, etc. Such measures will have long term benefit to the ecosystem and environment
and will promote resilience in agriculture system. So, the EMF will also look into adaptation and mitigation
measures and bringing overall improvement in the current farming conditions.
4.0 Potential Impact of Environmental Management Framework
Environmental Management Framework elaborated the potential negative and positive impacts of project
activities on environment. This assessment based on the secondary data and stakeholder consultations. This
section deals with the potential impacts of the project interventions on the local environment and suggests
relevant measures that may be required for mitigation of any adverse impact, if so arises.
4.1 Analysis of ‘no project’ Scenario
This section gives an overview of no project scenario, taking into account the current interventions and value
addition to be made by the project. It is expected that the current “as-is” situation may prevail and
agricultural practices will continue the way it has been for years. A change in positive direction is expected
6 as per MSAPCC

Environment Management Framework
to happen in due course as a part of natural adaptation instinct of farmers. Scientific way of making
agriculture resilient and adaptive through demonstrative effects, cross learning and technology
transformation can augment the adaptation process across the project districts and at the State level. Now, it
is important to promote adaptation measures in agriculture sector to the climate variability using different
package of practices and driving the agriculture sector to a new height where expected level of growth is
attained without hampering the natural capital base. With project and without project scenario is presented in
the Table No. 35.
Table 35: With and Without Project Scenario
Particulars “No Project” Scenario “With Project” Scenario
Component A-A.1: Participatory Development of Mini Watershed Plans
Development
of Mini
Watershed Plan
Such plans would not have developed
which captures key needs to promote
climate resilient activities which is
more localized.
Project improves the following-
1. Efficiency leading to improve
resilience to all land based
interventions
2. Mini watershed plan allows people to
undertake comprehensive watershed
treatment at cluster level
3. Multi disciplinary teams helping &
guiding the community to preparing
the plan - owned by the community .
Component A-A.2: Climate Smart Agriculture and Resilient Farming System
Soil and Water
Conservation
Current interventions under other
schemes may not adequately focus on
the overall perspective of climate
resilient agriculture in an integrated
manner
Focused intervention and integrating soil &
water conservation measures with allied
climate resilient agricultural practices will
improve the soil cover and water availability
Erosion of topsoil due to lack of
scientific conservation measures
leading to soil nutrition deficiency
Project is primarily aimed at undertaking
runoff management thus significantly
enhancing topsoil conservation, helping in
restoring soil fertility
Integrated
Nutrition and
Pest
Management
Current level of adoption of INM &
IPM is low because of low awareness
about the proper package of practices at
the farm level
The project will promote INM and IPM which
will improve fertilizer and pesticide use
efficiency.
The project will not support and discourage
use of banned pesticides (WHO Class I and
II).
Use of pesticides that are either
inappropriate or in low / high doses.
Farmers will be aware of recommended doses
as per label claims by crop type and use it in a
more scientific manner.
May continue polluting local
environment due to unscientific
application
Reduced risk to environmental pollution due
to appropriate application
Poor adherence to recommended
storage, handling and application with
respect to human and animal safety
measures.
Project will promote ICAR recommended
storage, handling, application with required
safety measures.
Protected
Cultivation
Current level of coverage may not
fulfill the requirement and aspiration of
the farmers.
Improved coverage of area under protective
cultivation will improve resource use
efficiency.
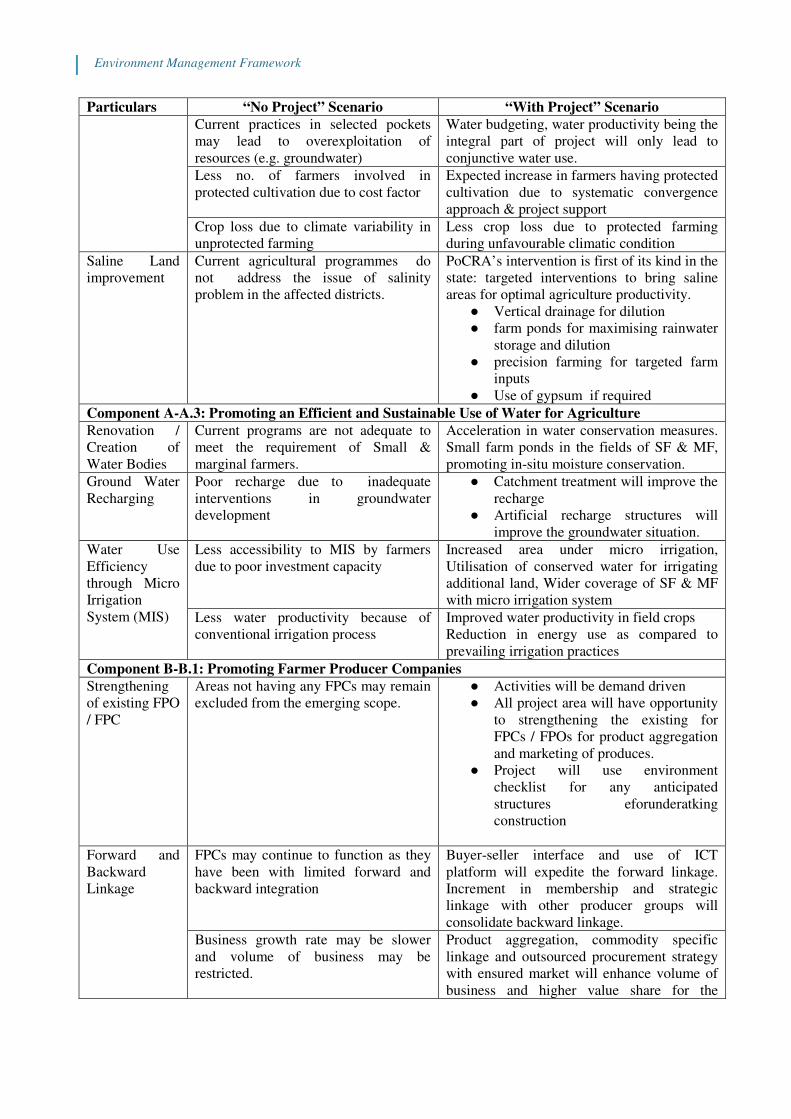
Environment Management Framework
Particulars “No Project” Scenario “With Project” Scenario
Current practices in selected pockets
may lead to overexploitation of
resources (e.g. groundwater)
Water budgeting, water productivity being the
integral part of project will only lead to
conjunctive water use.
Less no. of farmers involved in
protected cultivation due to cost factor
Expected increase in farmers having protected
cultivation due to systematic convergence
approach & project support
Crop loss due to climate variability in
unprotected farming
Less crop loss due to protected farming
during unfavourable climatic condition
Saline Land
improvement
Current agricultural programmes do
not address the issue of salinity
problem in the affected districts.
PoCRA’s intervention is first of its kind in the
state: targeted interventions to bring saline
areas for optimal agriculture productivity.
● Vertical drainage for dilution
● farm ponds for maximising rainwater
storage and dilution
● precision farming for targeted farm
inputs
● Use of gypsum if required
Component A-A.3: Promoting an Efficient and Sustainable Use of Water for Agriculture
Renovation /
Creation of
Water Bodies
Current programs are not adequate to
meet the requirement of Small &
marginal farmers.
Acceleration in water conservation measures.
Small farm ponds in the fields of SF & MF,
promoting in-situ moisture conservation.
Ground Water
Recharging
Poor recharge due to inadequate
interventions in groundwater
development
● Catchment treatment will improve the
recharge
● Artificial recharge structures will
improve the groundwater situation.
Water Use
Efficiency
through Micro
Irrigation
System (MIS)
Less accessibility to MIS by farmers
due to poor investment capacity
Increased area under micro irrigation,
Utilisation of conserved water for irrigating
additional land, Wider coverage of SF & MF
with micro irrigation system
Less water productivity because of
conventional irrigation process
Improved water productivity in field crops
Reduction in energy use as compared to
prevailing irrigation practices
Component B-B.1: Promoting Farmer Producer Companies
Strengthening
of existing FPO
/ FPC
Areas not having any FPCs may remain
excluded from the emerging scope.
● Activities will be demand driven
● All project area will have opportunity
to strengthening the existing for
FPCs / FPOs for product aggregation
and marketing of produces.
● Project will use environment
checklist for any anticipated
structures eforunderatking
construction
Forward and
Backward
Linkage
FPCs may continue to function as they
have been with limited forward and
backward integration
Buyer-seller interface and use of ICT
platform will expedite the forward linkage.
Increment in membership and strategic
linkage with other producer groups will
consolidate backward linkage.
Business growth rate may be slower
and volume of business may be
restricted.
Product aggregation, commodity specific
linkage and outsourced procurement strategy
with ensured market will enhance volume of
business and higher value share for the
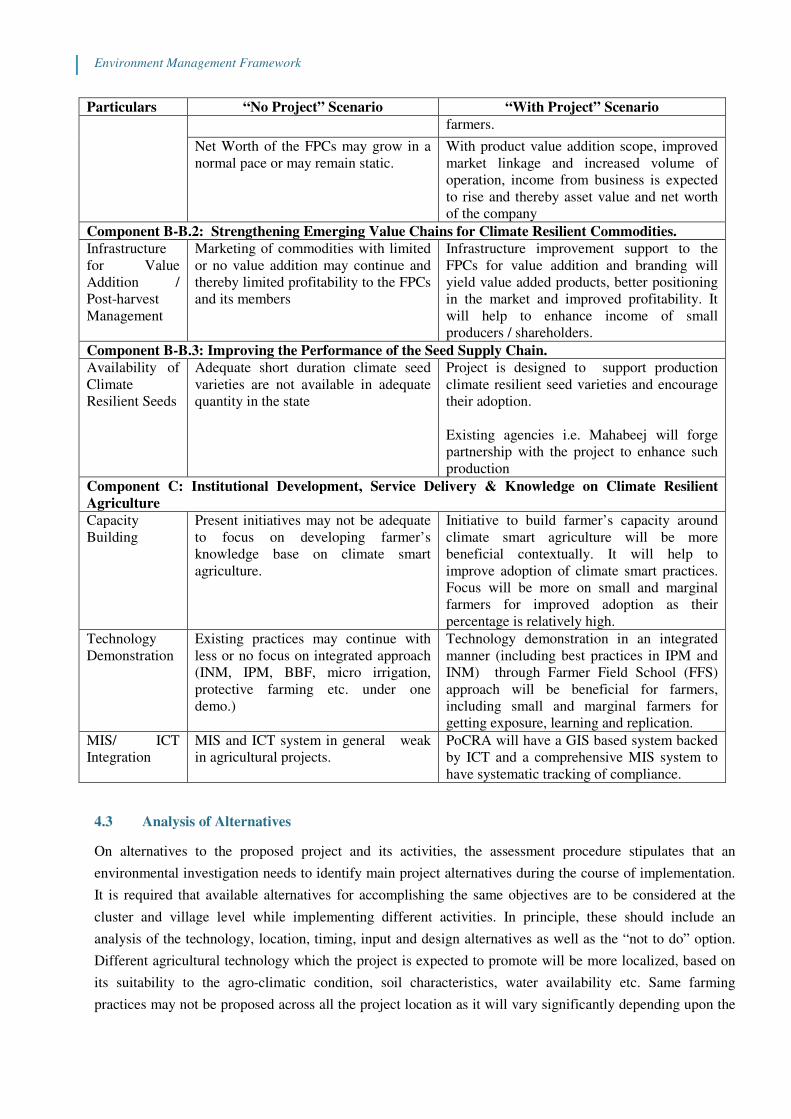
Environment Management Framework
Particulars “No Project” Scenario “With Project” Scenario
farmers.
Net Worth of the FPCs may grow in a
normal pace or may remain static.
With product value addition scope, improved
market linkage and increased volume of
operation, income from business is expected
to rise and thereby asset value and net worth
of the company
Component B-B.2: Strengthening Emerging Value Chains for Climate Resilient Commodities.
Infrastructure
for Value
Addition /
Post-harvest
Management
Marketing of commodities with limited
or no value addition may continue and
thereby limited profitability to the FPCs
and its members
Infrastructure improvement support to the
FPCs for value addition and branding will
yield value added products, better positioning
in the market and improved profitability. It
will help to enhance income of small
producers / shareholders.
Component B-B.3: Improving the Performance of the Seed Supply Chain.
Availability of
Climate
Resilient Seeds
Adequate short duration climate seed
varieties are not available in adequate
quantity in the state
Project is designed to support production
climate resilient seed varieties and encourage
their adoption.
Existing agencies i.e. Mahabeej will forge
partnership with the project to enhance such
production
Component C: Institutional Development, Service Delivery & Knowledge on Climate Resilient
Agriculture
Capacity
Building
Present initiatives may not be adequate
to focus on developing farmer’s
knowledge base on climate smart
agriculture.
Initiative to build farmer’s capacity around
climate smart agriculture will be more
beneficial contextually. It will help to
improve adoption of climate smart practices.
Focus will be more on small and marginal
farmers for improved adoption as their
percentage is relatively high.
Technology
Demonstration
Existing practices may continue with
less or no focus on integrated approach
(INM, IPM, BBF, micro irrigation,
protective farming etc. under one
demo.)
Technology demonstration in an integrated
manner (including best practices in IPM and
INM) through Farmer Field School (FFS)
approach will be beneficial for farmers,
including small and marginal farmers for
getting exposure, learning and replication.
MIS/ ICT
Integration
MIS and ICT system in general weak
in agricultural projects.
PoCRA will have a GIS based system backed
by ICT and a comprehensive MIS system to
have systematic tracking of compliance.
4.3 Analysis of Alternatives
On alternatives to the proposed project and its activities, the assessment procedure stipulates that an
environmental investigation needs to identify main project alternatives during the course of implementation.
It is required that available alternatives for accomplishing the same objectives are to be considered at the
cluster and village level while implementing different activities. In principle, these should include an
analysis of the technology, location, timing, input and design alternatives as well as the “not to do” option.
Different agricultural technology which the project is expected to promote will be more localized, based on
its suitability to the agro-climatic condition, soil characteristics, water availability etc. Same farming
practices may not be proposed across all the project location as it will vary significantly depending upon the
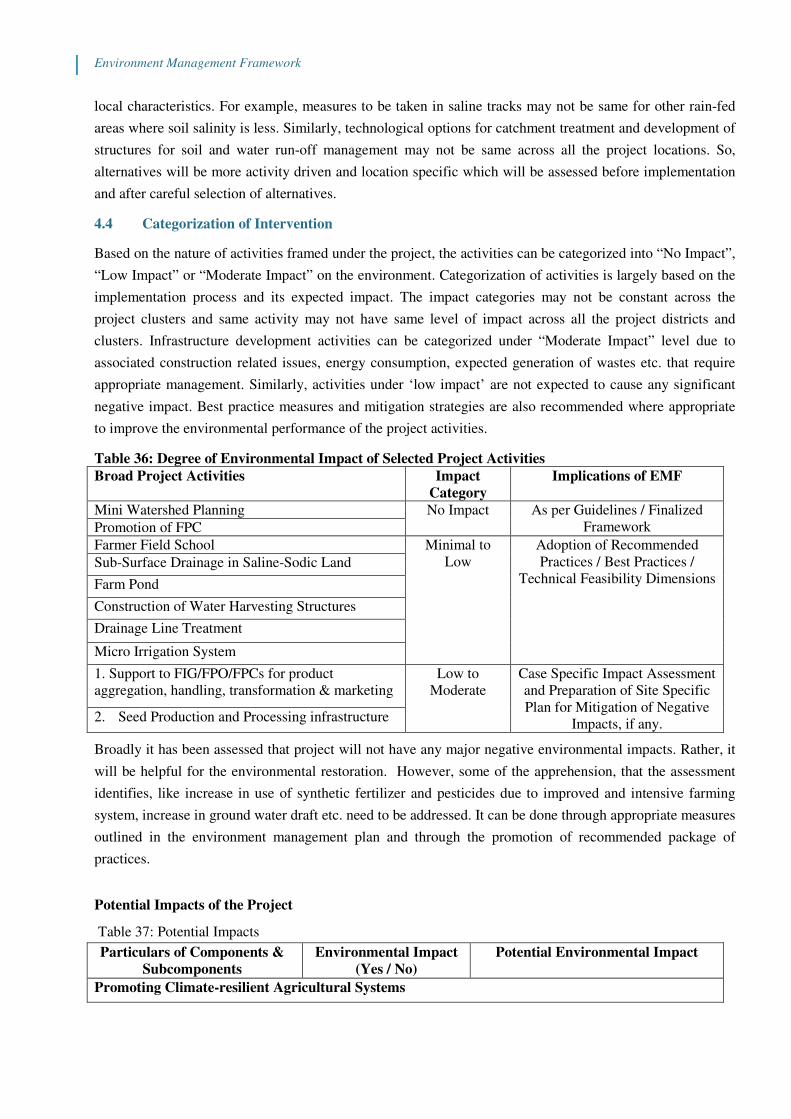
Environment Management Framework
local characteristics. For example, measures to be taken in saline tracks may not be same for other rain-fed
areas where soil salinity is less. Similarly, technological options for catchment treatment and development of
structures for soil and water run-off management may not be same across all the project locations. So,
alternatives will be more activity driven and location specific which will be assessed before implementation
and after careful selection of alternatives.
4.4 Categorization of Intervention
Based on the nature of activities framed under the project, the activities can be categorized into “No Impact”,
“Low Impact” or “Moderate Impact” on the environment. Categorization of activities is largely based on the
implementation process and its expected impact. The impact categories may not be constant across the
project clusters and same activity may not have same level of impact across all the project districts and
clusters. Infrastructure development activities can be categorized under “Moderate Impact” level due to
associated construction related issues, energy consumption, expected generation of wastes etc. that require
appropriate management. Similarly, activities under ‘low impact’ are not expected to cause any significant
negative impact. Best practice measures and mitigation strategies are also recommended where appropriate
to improve the environmental performance of the project activities.
Table 36: Degree of Environmental Impact of Selected Project Activities
Broad Project Activities Impact
Category
Implications of EMF
Mini Watershed Planning No Impact As per Guidelines / Finalized
Framework Promotion of FPC
Farmer Field School Minimal to
Low
Adoption of Recommended
Practices / Best Practices /
Technical Feasibility Dimensions Sub-Surface Drainage in Saline-Sodic Land
Farm Pond
Construction of Water Harvesting Structures
Drainage Line Treatment
Micro Irrigation System
1. Support to FIG/FPO/FPCs for product
aggregation, handling, transformation & marketing
Low to
Moderate
Case Specific Impact Assessment
and Preparation of Site Specific
Plan for Mitigation of Negative
Impacts, if any. 2. Seed Production and Processing infrastructure
Broadly it has been assessed that project will not have any major negative environmental impacts. Rather, it
will be helpful for the environmental restoration. However, some of the apprehension, that the assessment
identifies, like increase in use of synthetic fertilizer and pesticides due to improved and intensive farming
system, increase in ground water draft etc. need to be addressed. It can be done through appropriate measures
outlined in the environment management plan and through the promotion of recommended package of
practices.
Potential Impacts of the Project
Table 37: Potential Impacts
Particulars of Components &
Subcomponents
Environmental Impact
(Yes / No)
Potential Environmental Impact
Promoting Climate-resilient Agricultural Systems
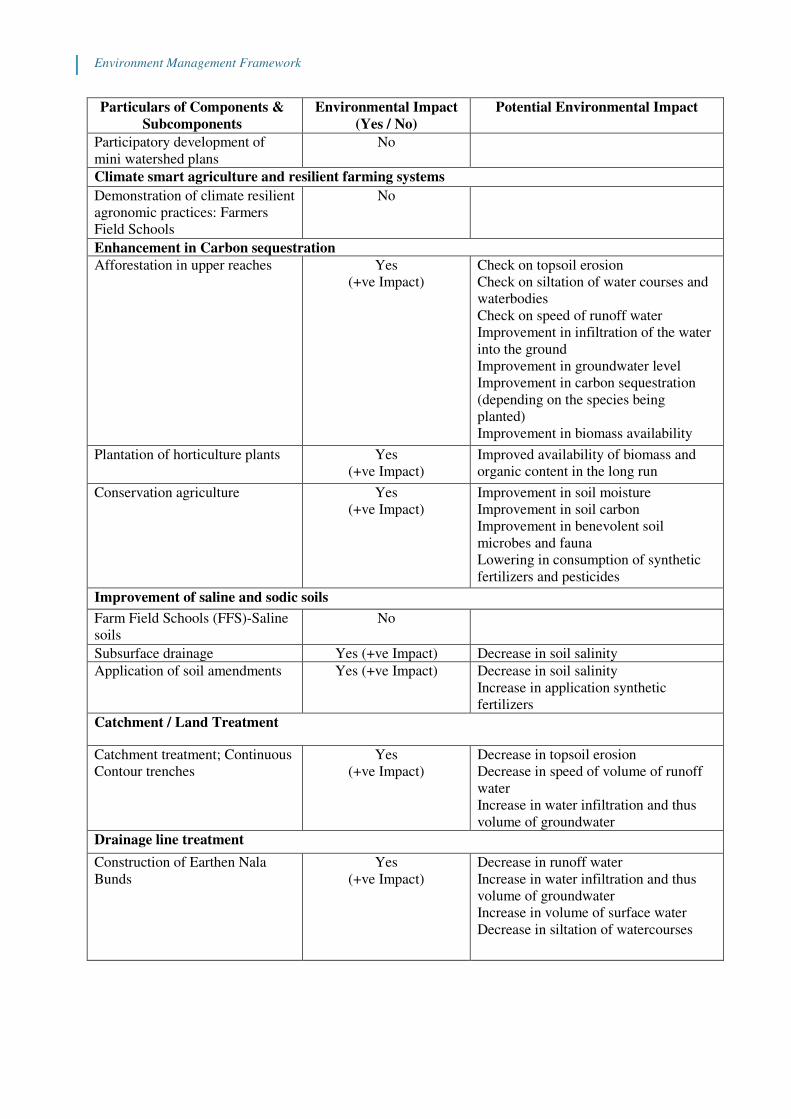
Environment Management Framework
Particulars of Components &
Subcomponents
Environmental Impact
(Yes / No)
Potential Environmental Impact
Participatory development of
mini watershed plans
No
Climate smart agriculture and resilient farming systems
Demonstration of climate resilient
agronomic practices: Farmers
Field Schools
No
Enhancement in Carbon sequestration
Afforestation in upper reaches Yes
(+ve Impact)
Check on topsoil erosion
Check on siltation of water courses and
waterbodies
Check on speed of runoff water
Improvement in infiltration of the water
into the ground
Improvement in groundwater level
Improvement in carbon sequestration
(depending on the species being
planted)
Improvement in biomass availability
Plantation of horticulture plants Yes
(+ve Impact)
Improved availability of biomass and
organic content in the long run
Conservation agriculture Yes
(+ve Impact)
Improvement in soil moisture
Improvement in soil carbon
Improvement in benevolent soil
microbes and fauna
Lowering in consumption of synthetic
fertilizers and pesticides
Improvement of saline and sodic soils
Farm Field Schools (FFS)-Saline
soils
No
Subsurface drainage Yes (+ve Impact) Decrease in soil salinity
Application of soil amendments Yes (+ve Impact) Decrease in soil salinity
Increase in application synthetic
fertilizers
Catchment / Land Treatment
Catchment treatment; Continuous
Contour trenches
Yes
(+ve Impact)
Decrease in topsoil erosion
Decrease in speed of volume of runoff
water
Increase in water infiltration and thus
volume of groundwater
Drainage line treatment
Construction of Earthen Nala
Bunds
Yes
(+ve Impact)
Decrease in runoff water
Increase in water infiltration and thus
volume of groundwater
Increase in volume of surface water
Decrease in siltation of watercourses
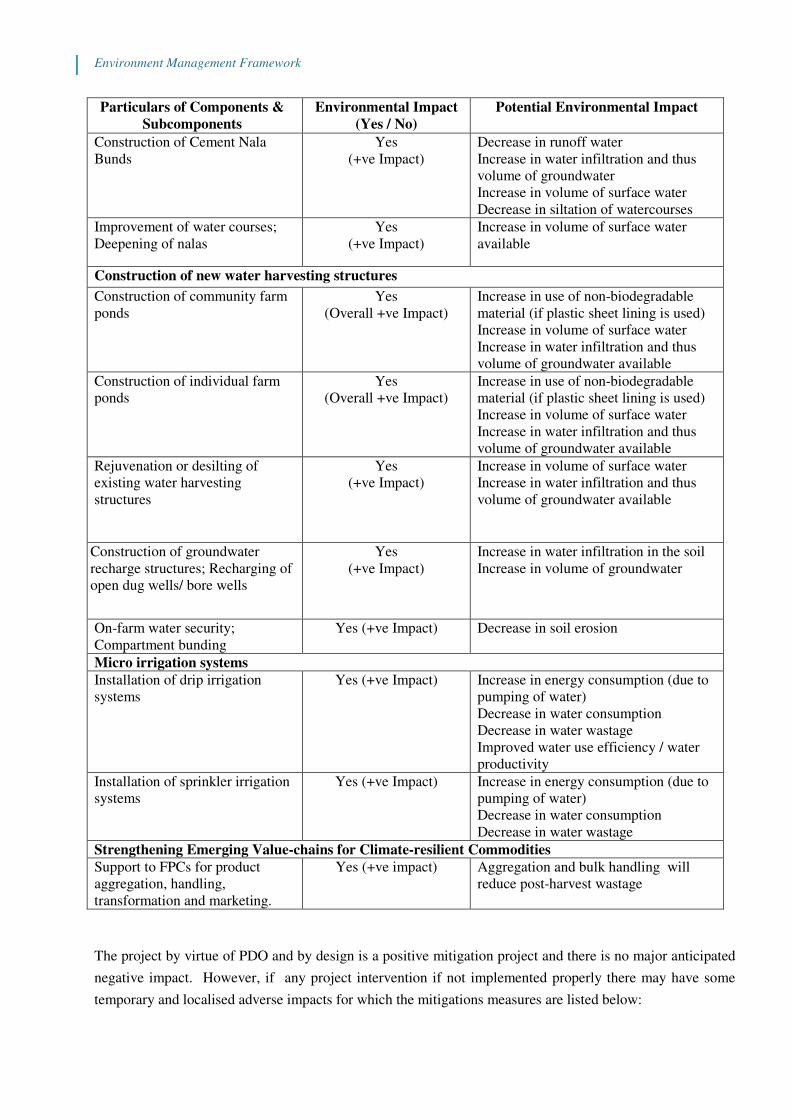
Environment Management Framework
Particulars of Components &
Subcomponents
Environmental Impact
(Yes / No)
Potential Environmental Impact
Construction of Cement Nala
Bunds
Yes
(+ve Impact)
Decrease in runoff water
Increase in water infiltration and thus
volume of groundwater
Increase in volume of surface water
Decrease in siltation of watercourses
Improvement of water courses;
Deepening of nalas
Yes
(+ve Impact)
Increase in volume of surface water
available
Construction of new water harvesting structures
Construction of community farm
ponds
Yes
(Overall +ve Impact)
Increase in use of non-biodegradable
material (if plastic sheet lining is used)
Increase in volume of surface water
Increase in water infiltration and thus
volume of groundwater available
Construction of individual farm
ponds
Yes
(Overall +ve Impact)
Increase in use of non-biodegradable
material (if plastic sheet lining is used)
Increase in volume of surface water
Increase in water infiltration and thus
volume of groundwater available
Rejuvenation or desilting of
existing water harvesting
structures
Yes
(+ve Impact)
Increase in volume of surface water
Increase in water infiltration and thus
volume of groundwater available
Construction of groundwater
recharge structures; Recharging of
open dug wells/ bore wells
Yes
(+ve Impact)
Increase in water infiltration in the soil
Increase in volume of groundwater
On-farm water security;
Compartment bunding
Yes (+ve Impact) Decrease in soil erosion
Micro irrigation systems
Installation of drip irrigation
systems
Yes (+ve Impact) Increase in energy consumption (due to
pumping of water)
Decrease in water consumption
Decrease in water wastage
Improved water use efficiency / water
productivity
Installation of sprinkler irrigation
systems
Yes (+ve Impact) Increase in energy consumption (due to
pumping of water)
Decrease in water consumption
Decrease in water wastage
Strengthening Emerging Value-chains for Climate-resilient Commodities
Support to FPCs for product
aggregation, handling,
transformation and marketing.
Yes (+ve impact) Aggregation and bulk handling will
reduce post-harvest wastage
The project by virtue of PDO and by design is a positive mitigation project and there is no major anticipated
negative impact. However, if any project intervention if not implemented properly there may have some
temporary and localised adverse impacts for which the mitigations measures are listed below:
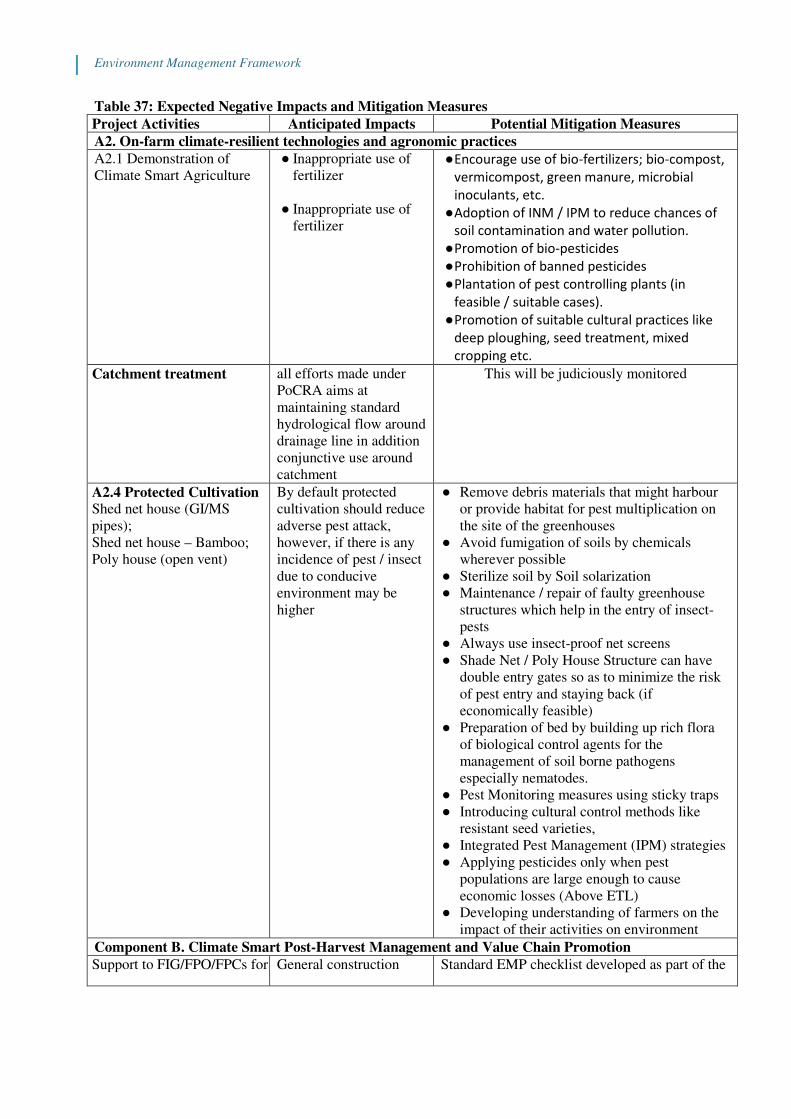
Environment Management Framework
Table 37: Expected Negative Impacts and Mitigation Measures
Project Activities Anticipated Impacts Potential Mitigation Measures
A2. On-farm climate-resilient technologies and agronomic practices
A2.1 Demonstration of
Climate Smart Agriculture
● Inappropriate use of
fertilizer
● Inappropriate use of
fertilizer
● Encourage use of bio-fertilizers; bio-compost,
vermicompost, green manure, microbial
inoculants, etc.
● Adoption of INM / IPM to reduce chances of
soil contamination and water pollution.
● Promotion of bio-pesticides
● Prohibition of banned pesticides
● Plantation of pest controlling plants (in
feasible / suitable cases).
● Promotion of suitable cultural practices like
deep ploughing, seed treatment, mixed
cropping etc.
Catchment treatment all efforts made under
PoCRA aims at
maintaining standard
hydrological flow around
drainage line in addition
conjunctive use around
catchment
This will be judiciously monitored
A2.4 Protected Cultivation Shed net house (GI/MS
pipes);
Shed net house – Bamboo;
Poly house (open vent)
By default protected
cultivation should reduce
adverse pest attack,
however, if there is any
incidence of pest / insect
due to conducive
environment may be
higher
● Remove debris materials that might harbour
or provide habitat for pest multiplication on
the site of the greenhouses
● Avoid fumigation of soils by chemicals
wherever possible
● Sterilize soil by Soil solarization
● Maintenance / repair of faulty greenhouse
structures which help in the entry of insect-
pests
● Always use insect-proof net screens
● Shade Net / Poly House Structure can have
double entry gates so as to minimize the risk
of pest entry and staying back (if
economically feasible)
● Preparation of bed by building up rich flora
of biological control agents for the
management of soil borne pathogens
especially nematodes.
● Pest Monitoring measures using sticky traps
● Introducing cultural control methods like
resistant seed varieties,
● Integrated Pest Management (IPM) strategies
● Applying pesticides only when pest
populations are large enough to cause
economic losses (Above ETL)
● Developing understanding of farmers on the
impact of their activities on environment
Component B. Climate Smart Post-Harvest Management and Value Chain Promotion
Support to FIG/FPO/FPCs for General construction Standard EMP checklist developed as part of the

Environment Management Framework
Project Activities Anticipated Impacts Potential Mitigation Measures
product aggregation,
handling, transformation &
marketing
related safeguards project will meet the compliance requirement
B3. Improving the
Performance of the Seed
Supply Chain B3.2 Development of seed
hub- infrastructure support
General construction
related safeguards
Standard EMP checklist developed as part of the
project will meet the compliance requirement
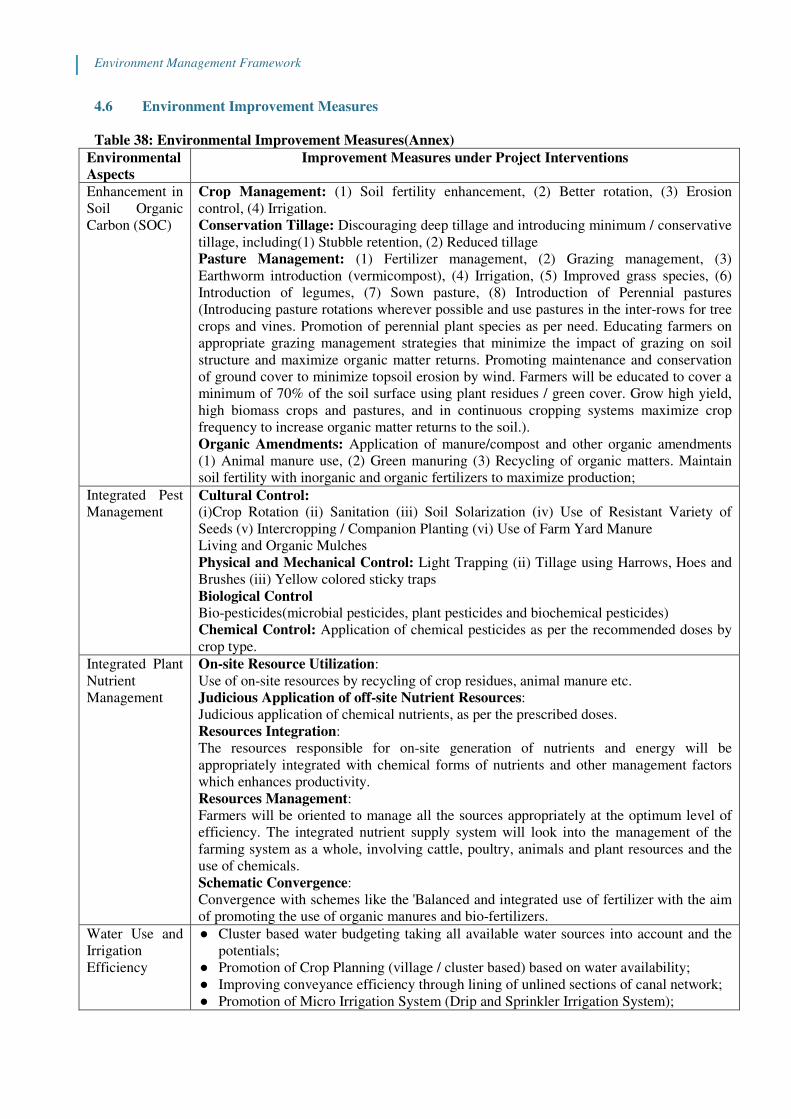
Environment Management Framework
4.6 Environment Improvement Measures
Table 38: Environmental Improvement Measures(Annex)
Environmental
Aspects
Improvement Measures under Project Interventions
Enhancement in
Soil Organic
Carbon (SOC)
Crop Management: (1) Soil fertility enhancement, (2) Better rotation, (3) Erosion
control, (4) Irrigation.
Conservation Tillage: Discouraging deep tillage and introducing minimum / conservative
tillage, including(1) Stubble retention, (2) Reduced tillage
Pasture Management: (1) Fertilizer management, (2) Grazing management, (3)
Earthworm introduction (vermicompost), (4) Irrigation, (5) Improved grass species, (6)
Introduction of legumes, (7) Sown pasture, (8) Introduction of Perennial pastures
(Introducing pasture rotations wherever possible and use pastures in the inter-rows for tree
crops and vines. Promotion of perennial plant species as per need. Educating farmers on
appropriate grazing management strategies that minimize the impact of grazing on soil
structure and maximize organic matter returns. Promoting maintenance and conservation
of ground cover to minimize topsoil erosion by wind. Farmers will be educated to cover a
minimum of 70% of the soil surface using plant residues / green cover. Grow high yield,
high biomass crops and pastures, and in continuous cropping systems maximize crop
frequency to increase organic matter returns to the soil.).
Organic Amendments: Application of manure/compost and other organic amendments
(1) Animal manure use, (2) Green manuring (3) Recycling of organic matters. Maintain
soil fertility with inorganic and organic fertilizers to maximize production;
Integrated Pest
Management Cultural Control: (i)Crop Rotation (ii) Sanitation (iii) Soil Solarization (iv) Use of Resistant Variety of
Seeds (v) Intercropping / Companion Planting (vi) Use of Farm Yard Manure
Living and Organic Mulches
Physical and Mechanical Control: Light Trapping (ii) Tillage using Harrows, Hoes and
Brushes (iii) Yellow colored sticky traps
Biological Control
Bio-pesticides(microbial pesticides, plant pesticides and biochemical pesticides)
Chemical Control: Application of chemical pesticides as per the recommended doses by
crop type.
Integrated Plant
Nutrient
Management
On-site Resource Utilization:
Use of on-site resources by recycling of crop residues, animal manure etc.
Judicious Application of off-site Nutrient Resources:
Judicious application of chemical nutrients, as per the prescribed doses.
Resources Integration:
The resources responsible for on-site generation of nutrients and energy will be
appropriately integrated with chemical forms of nutrients and other management factors
which enhances productivity.
Resources Management:
Farmers will be oriented to manage all the sources appropriately at the optimum level of
efficiency. The integrated nutrient supply system will look into the management of the
farming system as a whole, involving cattle, poultry, animals and plant resources and the
use of chemicals.
Schematic Convergence:
Convergence with schemes like the 'Balanced and integrated use of fertilizer with the aim
of promoting the use of organic manures and bio-fertilizers.
Water Use and
Irrigation
Efficiency
● Cluster based water budgeting taking all available water sources into account and the
potentials;
● Promotion of Crop Planning (village / cluster based) based on water availability;
● Improving conveyance efficiency through lining of unlined sections of canal network;
● Promotion of Micro Irrigation System (Drip and Sprinkler Irrigation System);

Environment Management Framework
● Fostering convergence with existing schemes of Govt. for micro irrigation promotion;
● Monitoring and field assessment of improvement in irrigation efficiency.
4.7 Interventions not complying with the Policies/Regulations
Project interventions with severe environmental impacts and those not complying with the
policies/regulations of GoM, GoI, and World Bank’s safeguard policies should not be promoted under
HPHDP. A list of these activities is given below:
1. Digging of bore well / deep bore well without ground water recharging structure will not be supported;
2. No activity will be carried out in Critical or Endangered Natural Habitats (as certified);
3. Construction of processing & value addition structures, check dams, embankments, etc., will not be
supported without prior approval of the design by a qualified engineer;
4. Instruments to be purchased for processing / value addition should adhere to the recommended
Government Standards and energy consumption rating. Project will not support any such instruments
which does not comply with the Government recommended specification;
5. Embankment / check dam exceeding 10 meters in height will not be supported by the project;
6. Activities involving direct/untreated discharge into any water body (beyond the threshold /
recommended/ permissible limit) will not be supported;
7. Purchase, stock, sale or distribution of the following pesticides will not be supported:
a. Pesticides classified in Class Ia, Ib and II of WHO classification;
b. Pesticides banned by the Government of India;
c. Purchase, stock, sale, distribution or exhibition of pesticides and chemical fertilizers will not
be supported without the requisite licenses.
5.0 Implementation Arrangement
5.1 Institutional Arrangement
The project will make required institutional arrangement to ensure EMF compliance of the project
components as per the EMF. A dedicated project official at the PMU level will be the responsible person to
guide the overall process related to environmental aspects. The district / sub-district level implementing
agencies will be given required training to execute and monitor the environmental components in
consultation with the PMU. They will be associated in the screening process of such activities that require
detail environmental plan and will monitor the processes followed in execution of the planned activities and
realisation of the environment safeguard norms. It will be ensured that the project interventions are
consistent with the agreed strategies and framework.
5.2 Project level Institutional arrangement for IPM
● As Department of Agriculture is the implementing agency for PoCRA, IPM strategy designed by
department and project will be implemented in project area.
● IPM package will be adopted by the project as a part of FFS approach (sub component A2) and
various other interventions at field level and all necessary arrangements to demonstrate IPM
technology for respective crops will be made. The critical inputs required for IPM will be availed by
the beneficiary and the cost of the inputs will be reimbursed by the project through Direct Benefit
Transfer (DBT) mode.
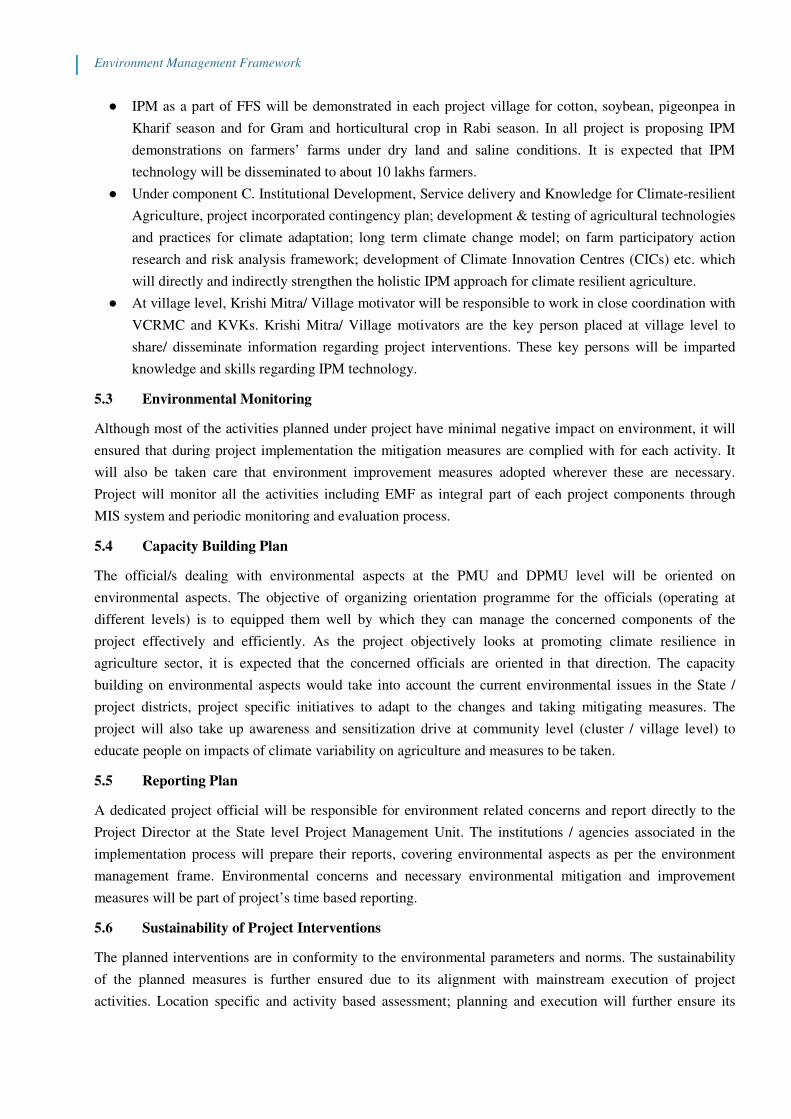
Environment Management Framework
● IPM as a part of FFS will be demonstrated in each project village for cotton, soybean, pigeonpea in
Kharif season and for Gram and horticultural crop in Rabi season. In all project is proposing IPM
demonstrations on farmers’ farms under dry land and saline conditions. It is expected that IPM
technology will be disseminated to about 10 lakhs farmers.
● Under component C. Institutional Development, Service delivery and Knowledge for Climate-resilient
Agriculture, project incorporated contingency plan; development & testing of agricultural technologies
and practices for climate adaptation; long term climate change model; on farm participatory action
research and risk analysis framework; development of Climate Innovation Centres (CICs) etc. which
will directly and indirectly strengthen the holistic IPM approach for climate resilient agriculture.
● At village level, Krishi Mitra/ Village motivator will be responsible to work in close coordination with
VCRMC and KVKs. Krishi Mitra/ Village motivators are the key person placed at village level to
share/ disseminate information regarding project interventions. These key persons will be imparted
knowledge and skills regarding IPM technology.
5.3 Environmental Monitoring
Although most of the activities planned under project have minimal negative impact on environment, it will
ensured that during project implementation the mitigation measures are complied with for each activity. It
will also be taken care that environment improvement measures adopted wherever these are necessary.
Project will monitor all the activities including EMF as integral part of each project components through
MIS system and periodic monitoring and evaluation process.
5.4 Capacity Building Plan
The official/s dealing with environmental aspects at the PMU and DPMU level will be oriented on
environmental aspects. The objective of organizing orientation programme for the officials (operating at
different levels) is to equipped them well by which they can manage the concerned components of the
project effectively and efficiently. As the project objectively looks at promoting climate resilience in
agriculture sector, it is expected that the concerned officials are oriented in that direction. The capacity
building on environmental aspects would take into account the current environmental issues in the State /
project districts, project specific initiatives to adapt to the changes and taking mitigating measures. The
project will also take up awareness and sensitization drive at community level (cluster / village level) to
educate people on impacts of climate variability on agriculture and measures to be taken.
5.5 Reporting Plan
A dedicated project official will be responsible for environment related concerns and report directly to the
Project Director at the State level Project Management Unit. The institutions / agencies associated in the
implementation process will prepare their reports, covering environmental aspects as per the environment
management frame. Environmental concerns and necessary environmental mitigation and improvement
measures will be part of project’s time based reporting.
5.6 Sustainability of Project Interventions
The planned interventions are in conformity to the environmental parameters and norms. The sustainability
of the planned measures is further ensured due to its alignment with mainstream execution of project
activities. Location specific and activity based assessment; planning and execution will further ensure its

Environment Management Framework
sustainability after the life of the project. The involvement of people from identification to planning and
execution will enhance ownership and sustainability. The project is attempting viability gap through a
sharing mechanism and not fully grant based unlike many other projects. This will help in their
sustainability.
6.0 Pest and Nutrient Management Plan
6.1 Pest Management Plan
The state has gone through series of droughts since 1971. As reported, thecurrent level of fertilizer and
pesticide use are low in project areas as compared to the national average. While there is no evidence to
suggest that the use of pesticide may increase due to the project interventions, yet the project would like to
promote bio-pesticides and organic farming across the project areas. Hence, appropriate strategy has been
proposed to minimize the environmental impacts of pesticides and nutrition deficiencies. This includes a
detailed strategy on IPNM (Integrated Pest and Nutrition Management) and IPM (integrated Pest
Management) in project locations. The project is conscious of the fact that there could be several
externalities (not necessarily related to project) may induce pesticide use with or without the project
interventions. The project will document those externalities during the 2nd
and 4th year of project
implementation.
6.2 Integrated Plant Nutrient Management Plan
Integrated Plant Nutrient Management (IPNM) includes soil, nutrient, water, crop, and vegetation
management practices, tailored to a cropping and farming system appropriate to Marathwada and Vidharbha
regions of Maharashtra. The IPNM aims at improving and sustaining soil fertility and land productivity and
reducing environmental degradation. Integrated Plant Nutrient Management optimizes the condition of the
soil, with regard to its physical, chemical, biological and hydrological properties, for the purpose of
enhancing farm productivity, while minimizing land degradation. It not only provides tangible benefits in
terms of higher yields, but also conserves the soil resource. The field level management practices considered
under IPNM would include the use of farmyard manures, natural and mineral fertilizers, soil amendments,
crop residues and farm wastes, agro-forestry (suitable cases) and tillage practices, green manures, cover
crops, legumes, intercropping, crop rotations, irrigation, drainage, and a variety of other agronomic,
vegetative and structural measures designed to conserve both water and soil. The underlying principles on
how best to manage soils, nutrients, water, crops and vegetation to improve and sustain soil fertility and land
productivity and their processes are derived from the essential soil functions necessary for plant growth. The
following are fundamental to the approach under the project outlined in these guidelines.
Soil Productivity: Promotion of soil and plant nutrient management as an integral part of a productive
farming system. Focus for IPNM would be on sustaining the productive potential of the soil resource.
Rain Water Harvesting and Conservation: Under rain-fed dry land farming, soil moisture availability is
the primary limiting factor on crop yields. Hence IPNM strategy will adopt improved rainwater conservation
and management practices, in-situ water conservation and improve water use efficiency.
Soil Organic Matter: With declining soil organic matter levels following cultivation, the adoption of
improved organic matter management practices are a prerequisite for restoring and maintaining soil

Environment Management Framework
productivity (improved soil nutrient levels, soil moisture retention, soil structure and resistance to erosion).
So, restoration and improvement of soil organic matter be the essential part of the IPNM strategy.
Agricultural Practices for Nutrient Management
Integrated plant nutrient management also contributes to pest management (refer annexure I for IPM).
Stressed crops are more susceptible to disease and to the effects of pest attacks. Crops growing in poorly
structured soil, under low or unbalanced nutrient conditions or with inadequate water supply will be stressed.
Responding to disease or pest attacks by applying pesticides is a costly symptomatic approach to a syndrome
which is better addressed by improving the ecological conditions and systems within which the crops are
cultivated. In addition, agricultural products with less pesticides residues are less risky to consume, and
healthy plants with a properly balanced nutrient supply provide better quality feed and food, improving
animal and human health.
To achieve this, the project will promote Integrated Pest Management (IPM) approaches for the selected
crops in the project locations. Crop wise IPM plans (discussed in Annexure I) will be prepared and farmers
will be oriented on such practices. This will help to minimize the environmental and social risk from
pesticide residues and improving the cost-effectiveness of farming.
Attempt will be made to improve production efficiencies through integrated nutrient management practices
promoting combined use of inorganic, organic and biological resources in a reasonable way to balance
efficient use of limited resources and ensure ecosystem sustainability. Efficient fertilizer use will be
promoted with application of appropriate quantities and method of application to minimizes losses. Rather
than broadcasting, project will educate farmers to apply fertilizer into the soil directly. Plant nutrient status
during the growing season will be monitored using leaf-colour charts and managing fertilizer application
accordingly.
Nutrients are also linked to different other practices that are related to sustainable crop production and
intensification. Management of nutrient cycling will be the main focus of “Conservation Agriculture” in
which minimum soil disturbance, intercropping, crop rotations and a permanent soil cover will be promoted
to minimize the need for chemical fertilizers. Promotion of such practices will help the crops to have
required nutrients by which their susceptibility to pests will reduce and thus will be helpful to Integrated Pest
Management. As it is expected that application of fertilizers may increase the occurrence of harmful
weeds,project will promote “Integrated Weed Management” by improving the timing, dosing and application
method of nutrients and thus minimizing the potential impact on weed growth. Application of nutrients is a
regulated and scientific manner will contribute in maintaining the overall agricultural biodiversity and will
be supportive to pollination. The project will also promote crop-livestock system, as a part of nutrient
management.
6.3 Integrated Plant Nutrient Management at Farm Level
Farmers can get higher benefit from the supply of additional plant nutrients, in the form of organic /
inorganic fertilizer, only after they have made improvement in the biological, physical and hydrological
properties of their soil. At the farm level, integrated and synergistic approach will be adopted under IPNM,
involving the following.
Environment Management Framework
1. Matching the land use requirements with the land qualities present in the area, i.e., the biological,
chemical and physical properties of the soil, and the local climatic conditions (temperature, rainfall
etc.);
2. Seeking to improve yield by identifying and overcoming the most limiting factors that influence
yield;
3. Better plant management, i.e., (i) planting at the beginning of the rain to increase protective ground
cover to enhance infiltration and biological activity and (ii) timely weeding to reduce crop yield
losses;
4. Promotion of complementary crop, livestock and land husbandry practices in combination to
maximize addition of organic materials and recycle farm wastes, so as to maintain and enhance soil
organic matter levels;
5. Land management practices that ensure favorable soil moisture conditions for the proposed land use
(e.g. moisture conservation in low rainfall areas, drainage in high rainfall areas);
6. The replenishment of soil nutrients through an integrated plant nutrition management approach like
organic manuring, application of crop residues, rhizoidal N-fixation, Phosphorous and other nutrient
uptake;
7. Combinations of crop, livestock and land husbandry practices that reduce rainfall impact, improve
surface infiltration, and reduce the velocity of surface run-off thereby ensuring soil loss below the
‘tolerable’ level;
8. Conservation tillage, crop rotation, agro-forestry and soil restorative practices that maintain and
enhance the soils physical properties thereby encouraging root development and rainfall infiltration;
9. Promotion of crop-livestock system in project clusters as a part of integrated nutrient management
strategy;
10. Nutrient monitoring during growing stage by using colour chart and application of nutrients
accordingly.
11. Apart from IPNM, details on Integrated Pest Management (IPM) are outlined below.
6.4 IPM (Integrated Pest Management):
IPM combines different approach to control the pests, minimize the economic loss and protect the
environment. While the importance of chemical pesticides in controlling pests and its use by the farmers
cannot be fully denied, better management approach can be promoted to ensure that its adverse impact on the
environment is minimized. IPM is a broad ecological approach of pest control (insects, diseases, weeds,
rodents etc.) employing different appropriate and suitable methods and techniques in an integrated manner to
keep pest population below Economic Threshold Level (ETL) and also reduces the residual effects of
chemicals on both plants and animals. The project will adopt Integrated Pest Management (IPM) as the key
strategy to combat pests and diseases in the project and regulate its environmental impact. However,
appropriate strategy to be adopted for its promotion among the farmers like sensitization on environment,
awareness on environmental impact of indiscriminate use of pesticides, educating farmers on restricted and
banned pesticides, regular orientation training and follow up, providing hand holding / field guidance and
monitoring the implementation of IPM.
Environment Management Framework
6.5 The World Bank Operational Guidelines
The World Bank & IFC pesticide guidelines aim to ensure that;
1. It should have negligible adverse human health effects
2. Should be effective against target pests and minimal effect on non-target species
3. Development of pest resistance to be kept in view
4. Public health pesticides must be safe for inhabitants and animals
5. Integrated pesticide management specifically identifies the following as the key in pest control.
6. A categorical preference for bio control methods along with institutional and capacity building for
the same.
7. Reducing reliance on synthetic chemical pesticides and only if approved by IPM approach.
8. Does not permit under any circumstance the use IA, IB and II classified pesticides. Listing of these
chemicals and provided by the World Health Organization is given at the end of the report.
9. Recommends the use of Participatory IPM along with specific investment components for the same.
10. Permits category III type chemicals as a part of the IPM strategy.
6.6 Objectives of IPM Plan
The objective of IPM is to promote and support safe, effective and environmentally sound pest management
under the project. Along with regulating the use of synthetic pesticides (based on prescribed doses and type
of pesticides to be used), the objective of IPM is to promote the use of biological and environmental control
methods and the reduction in reliance on synthetic chemical pesticides. Promotion of IPM is objectively
driven to achieve the followings.
1. Minimize crop loss, augment farm production with scientific application of synthetic pesticides;
2. Reduce environmental pollution caused due to the application of synthetic pesticides;
3. Introduction and adoption of biological and cultural methods and managing pests below ETL;
4. Reduction in health hazards arising due to chemical pesticides during handling;
5. Minimizing pesticide residues through the application of appropriate doses;
6. Promotion of bio pesticides
6.7 Salient Features of the Project Approach:
All IPM measures proposed in this project will be used after the second year of project implementation as
most of the interventions pertaining to crop and production system will strt after the first year of
mobilization.
1. Popularizing IPM approach among farming community through demonstration, awareness, training
and exposure;
2. Organizing regular pest surveillance and monitoring to assess pest/disease situation and study agro-
eco-system to advise timely IPM control measures;
3. Encourage farmers to rear biological control agents for their field use and conservation of naturally
occurring biological control agents for control of crop pests;
4. Promoting use of bio-pesticides, neem based pesticides, bacillus based bio-pesticides, insect
pathogen as alternative to chemical pesticides;

Environment Management Framework
5. To play a catalytic role in transfer of innovative IPM skills/methods/ techniques to farmers through
extension services and App based applications.
6. Human Resource Development in IPM by imparting training to master trainers, extension workers
and farmers by conduct of trainings and establishment of Farmers' Field Schools (FFSs).
7. Issuing insect-pest and disease related information (app based / agri-watch / agri-met services) and
control measures to farmers.
Alternative pest control strategies such as IPM that deploys a combination of different control measures such
as cultural control, use of resistant genotype, physical and mechanical control, and rational use of pesticide
would reduce the number and amount of pesticide applications. Sensitization, awareness and extension
support would educate and encourage farmers to adopt the innovative IPM strategies that would be key to
reduce the harmful impact of pesticides on life and environment.
Table 1: Insect Scouting Chart (Use it after the second year)
S. No. Insect / Pest June July Aug. Sept. Oct. Nov Dec. Jan
1
2
3
4
The project intervention may result with agricultural intensification for which the project needs to have a
strategy to manage pest. As the project, would encourage farmers to take up better farm practices that are
climate resilient without compromising farm-based productivity, it would be crucial to introduce IPM at the
farmer end. Effective implementation of IPM practices will reduce the risk of water pollution through
leaching of chemicals residues from farmlands to water sources, both surface and sub-surface. A detailed
strategy for implementing IPM is presented below.
Table 2: Integrated Pest Management Approach
S. No. Standard Pest Control Measures Integrated Pest Management
1 Use of synthetic pesticides is common and
widespread
More knowledge intensive
Less emphasis on preventive approach Emphasis on prevention of pest problems
More reactive to pest outbreaks Systematic approach for long-term pest control
2 Pesticide application is more chemical intensive Change in field conditions that prevent pest
attack
3 Use of synthetic pesticides focus more on killing
pests directly
Regular inspection / monitor and taking
recommended actions
4 Use of Higher Doses Doses and type of pesticides use as per need
The project will adopt the suggested steps for IPM implementation. A baselinesurvey (benchmarking) will be
undertaken after the first year of mobilisation phase of the project to assess knowledge, attitude and practice
of farmers and identification of major pest problems by location. Specific IPM measures that the project will
promote are;
• Deep summer ploughing (only in suitable cases).
• Recycling and appropriate disposal of crop residues, weeds etc.
• Seed treatment.
• Growing pest and disease resistant/tolerant varieties.
• Timely and synchronous sowing operation.
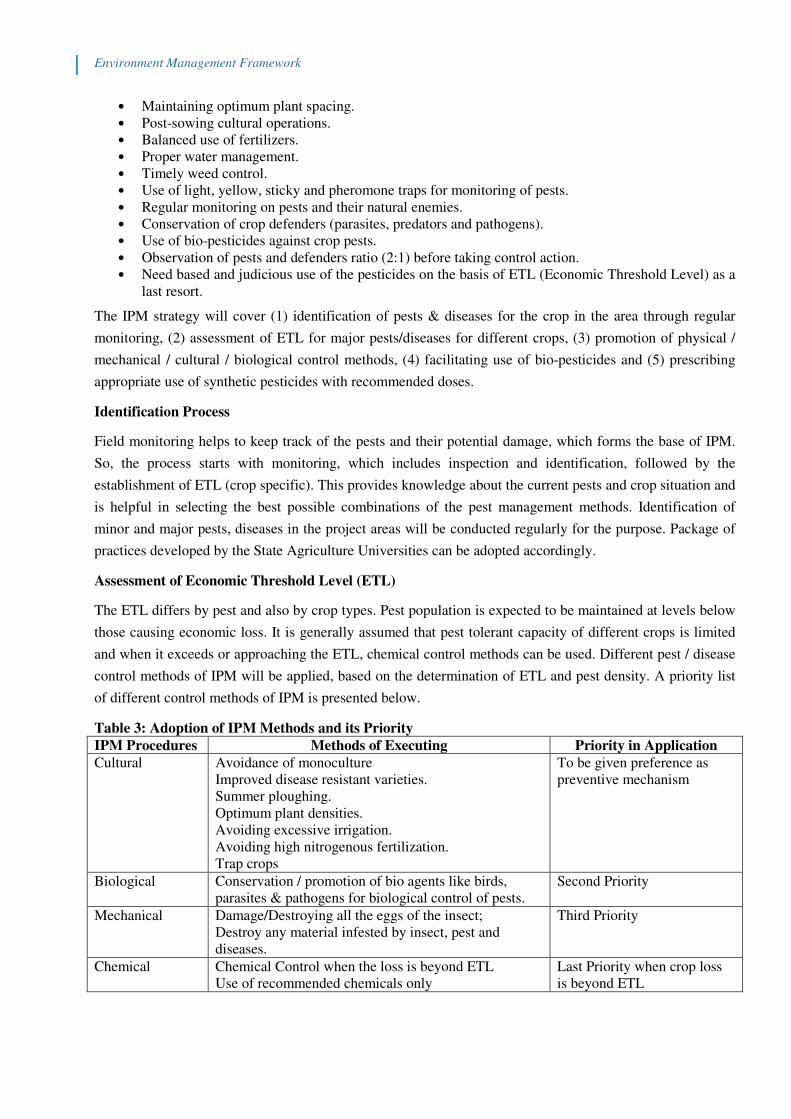
Environment Management Framework
• Maintaining optimum plant spacing.
• Post-sowing cultural operations.
• Balanced use of fertilizers.
• Proper water management.
• Timely weed control.
• Use of light, yellow, sticky and pheromone traps for monitoring of pests.
• Regular monitoring on pests and their natural enemies.
• Conservation of crop defenders (parasites, predators and pathogens).
• Use of bio-pesticides against crop pests.
• Observation of pests and defenders ratio (2:1) before taking control action.
• Need based and judicious use of the pesticides on the basis of ETL (Economic Threshold Level) as a
last resort.
The IPM strategy will cover (1) identification of pests & diseases for the crop in the area through regular
monitoring, (2) assessment of ETL for major pests/diseases for different crops, (3) promotion of physical /
mechanical / cultural / biological control methods, (4) facilitating use of bio-pesticides and (5) prescribing
appropriate use of synthetic pesticides with recommended doses.
Identification Process
Field monitoring helps to keep track of the pests and their potential damage, which forms the base of IPM.
So, the process starts with monitoring, which includes inspection and identification, followed by the
establishment of ETL (crop specific). This provides knowledge about the current pests and crop situation and
is helpful in selecting the best possible combinations of the pest management methods. Identification of
minor and major pests, diseases in the project areas will be conducted regularly for the purpose. Package of
practices developed by the State Agriculture Universities can be adopted accordingly.
Assessment of Economic Threshold Level (ETL)
The ETL differs by pest and also by crop types. Pest population is expected to be maintained at levels below
those causing economic loss. It is generally assumed that pest tolerant capacity of different crops is limited
and when it exceeds or approaching the ETL, chemical control methods can be used. Different pest / disease
control methods of IPM will be applied, based on the determination of ETL and pest density. A priority list
of different control methods of IPM is presented below.
Table 3: Adoption of IPM Methods and its Priority
IPM Procedures Methods of Executing Priority in Application
Cultural Avoidance of monoculture
Improved disease resistant varieties.
Summer ploughing.
Optimum plant densities.
Avoiding excessive irrigation.
Avoiding high nitrogenous fertilization.
Trap crops
To be given preference as
preventive mechanism
Biological Conservation / promotion of bio agents like birds,
parasites & pathogens for biological control of pests.
Second Priority
Mechanical Damage/Destroying all the eggs of the insect;
Destroy any material infested by insect, pest and
diseases.
Third Priority
Chemical Chemical Control when the loss is beyond ETL
Use of recommended chemicals only
Last Priority when crop loss
is beyond ETL

Environment Management Framework
6.8 Capacity Building on IPM
Under the promotion of IPM, it is important that farmers understand its importance and adopt it in their field,
following the prescribed procedures. To improve the understanding of farmers, it is essential to develop their
knowledge base through training, exposures, handholding and extension services. While the Farmer’s Field
School (FFS) will be a good place for exposure of farmers for practical learning (demonstration of IPM),
classroom teaching and field level support is also essential. For the capacity building of farmers, the project
will adopt a cascading approach where resource farmers will be developed through Training of Trainers
(TOT) programme. The ground force available for agriculture support, i.e., KrsihiMitras will also be trained
and exposed to IPM initiatives. They will be providing hand holding support to farmers at the time of need in
consultation with the SAO.
6.9 Monitoring and Supervision
The IPM approaches adopted for different crops in project locations will be monitored on regular intervals
by the executing entities and the farmers. The participatory monitoring system will help to understand the
key challenges and emerging good practices. The challenges will be taken up for amicable solution at
implementation level, with the support of technical institutions / SAUs whereas the learning will be
replicated in different other clusters / villages. The project will also evaluate the impact of adopting IPM
approaches (change in use of different IPM methods, incidence of pest attack, application of pesticide vis-a-
vis pollination, economic damage, success of the package of practices including IPM, crop production and
productivity etc.), with the support of technical institutions / SAUs. Key monitoring indicators covering both
adoption as well as knowledge of IPM among the farmers will be assessed periodically as part of internal
monitoring and periodic monitoring by third party.
Table 4: Monitoring of IPM
S. No. Activity Monitoring Areas Responsibility Time Frame
1 Development of
IPM Related
Learning
Materials and its
Distribution to
Farmers /
Farmer’s
Organisations
Learning materials cover
crop specific IPM
practices
District Project
Management Unit
6 Months from project
inception (printed
materials)
Availability of reading /
reference materials with
the farmers (distributed at
village level)
Cluster
Coordinator at
SAO level
• 1 month from printing
of documents
• Monitoring of adoption
by farmers during field
visits
2 Promotion of
Cultural
Procedures
Availability of resistant
varieties of seeds, plant
density maintenance etc.
Cluster
Coordinator at
SAO level
Extending support
(physical / technical) prior
to sowing
Regular monitoring
3 Promotion of Bio-
Control Agents
Support to farmers in
getting bio-control agents
SAO at Sub-
division level
During initial
identification of pest /
disease, within 7-10 days
of such identification
Application of bio-control
agents by the farmers
Ground level Staff
with Cluster
Coordinator
Regular field visit and
preparation of report
4 Purchase and use
of Pesticides
Purchase and use of
banned pesticides
SAO at sub-
division level
Periodic field visits
Use of pesticides as per Agriculture Expert Periodic field visits

Environment Management Framework
S. No. Activity Monitoring Areas Responsibility Time Frame
the crop specific
prescription of doses.
5 Use of Bio-
fertilizers and
vermi-compost
• Awareness inputs
• Extension of Required
Technical Support
• Use of bio-fertiliser /
pesticides / vermi-
compost
SAO at sub-
division level
Periodic field visits,
physical observation and
consultations
6 Training and
awareness
creation
• Organisation of Training
on IPM;
• Understanding of
farmers on IPM
• Organisation of
awareness camps
SAO at sub-
division level • Periodic field visits,
consultation with
farmers and their
organisation
• Review of training
materials
• Assessment of
application of training
inputs
6.10 Pest and Disease Surveillance
As part of IPM strategy, a pest and disease surveillance will be undertaken electronically. Pest surveillance is
an effective tool as an information system, which renders all pest control methods more effective. It aims at
monitoring and forewarning of likely build-up of pests in order to facilitate planning and adoption of suitable
control strategy based on ETL. It acts as a guiding principle in determining the areas and time needing the
pest control. The proposed pest and disease surveillance system in EMF is based on practices followed by
the Government of Marashtra and recommended by ICAR (Indian Council of Agriculture Research) for this
project.
Major Activities under IPM Strategy Table 5: IPM Strategy and Key Activities
Key Activities Execution Strategy Cropping Season (Kharif / Rabi)
K R K R K R K R
Training of project officials
on IPM (all levels)
Orientation training by crop type
Training of Farmers and
their organizations
Crop specific orientation on IPM
in phased manner
Developing IEC materials
and distribution with list of
banned pesticides
IEC materials (crop specific IPM)
in local language with visual
display; Using these materials in
orientation
Organising awareness camps
at village level (crop specific
during seasons)
Awareness camps covering IPM
concept, safe use, handling and
disposal of insecticides /
pesticides, IPM methods, vermi-
composting etc.
Demonstration of IPM in
demonstration plots / FFS
(Crop Specific IPM
Practices)
Involving farmers, irrespective of
land holding size

Environment Management Framework
Key Activities Execution Strategy Cropping Season (Kharif / Rabi)
K R K R K R K R
Extending technical inputs
and support to farmers
Inputs support, i.e., bio-pesticides,
bio-weedicides, bio-fungicides,
bio-fertilizers, bio-control agents
(predators) etc.; Converge with
relevant departments and schemes
Conduct study and preparing
checklist of pests/pathogens
by crop types
As part of pest surveillance for
adopting appropriate INM by crop
type
Legume plantations (in farm
bunds and fields), promoting
use of mulch, setting up of
vermi-compost units
Encouraging farmers for inter-
cropping / planting of legume
plants; technical support for
vermi-compost establishment.
Providing / supporting
farmers with bio-control
agents
Collaboration with other agencies
/ state bio-control labs.
Process monitoring and
documentation of learning
cases / best practices
Periodic on-field assessment and
documentation of economic gain.
Note: K: Kharif, R: Rabi
Associated Risks and Mitigation Measures
The plan for implementation of IPM may be constrains due to various factors which are discussed below.
However, the project will take multi prong remedial measures to minimize the associated risks, in
collaboration with different other research institutions, agricultural universities and technical support
organizations.
Table 6: Risks and Mitigation Measures
Constraint/Risks Mitigation
Availability of prescribed / selective
pesticides, effective against pests but not
against natural enemies of pests.
Making available selective bio-pesticides to farmers, as per
their requirements through linkage and collaboration.
Determining the ETL for different crops taking
location specific characteristics, pest species
and pest density.
Support participatory research programs with farmers and
research organizations to work out ETL for various pests
within different project districts
Potential of bio-control agents to deal with
different insects / pests / diseases.
Use of only duly approved bio-control agents.
Techniques of mass rearing of several bio-
agents are still not well developed.
Fostering collaboration / convergence with different
institutions / universities for timely supply of bio-agents to
farmers.
Limited access to new technologies may result
with non-adoption of technology.
Ensuring availability of technologies at village / farmer end
as per the demonstrations conducted in FFS or their
exposure to such technologies.
On field guidance and providing hand holding
support to the farmers during different
cropping seasons through extension services.
Project envisages to develop a cadre at the cluster level
who are trained in IPM for extending support. Apart from
this, the existing extension mechanism of ATMA will be
useful for supporting farmers in adopting IPM.

Environment Management Framework
Criteria for Pesticide Selection and Use
The criteria to be followed for the selection and use of pesticides are (1) they must have negligible adverse
human health effects, (2) they must be shown to be effective against the target species and (3) they must
have minimal effect on non-target species and the natural environment.
Pesticide Storage, Handling and Disposal
The project will monitor (after 2 yearof implementation) the compliance of the dose response and safety
measures prescribed on the pesticides packages (or recommended by the Government of Maharashtra).
Please note that there could be many externalities influencing such factors.
Precautionary Measures
When administering the pesticides, general precautions to be taken are:
1. Wearing protective body cover by the operator;
2. While applying pesticide, restraining from taking food items, drink or smoke;
3. Washing hands, face and other body parts with soap after spraying;
4. Wash overalls and other protective clothing at the end of every working day in soap and water and
keep them separate from the rest of the family’s clothes.
5. In case if any part of the body is exposed and come in contact with the pesticide, it should be
washed-off immediately;
6. Change clothes immediately after spray and cleaning body properly.
7. Visit to doctor in case of feeling unwell.
Storage
Precautions to be taken in storing the pesticides are (1) keeping the place of storing of pesticides away from
human and animals, (2) keeping away from water sources, (3) keeping at a height which should be out of
reach of children, (4) keeping away from exposure to sunlight and moisture, (5) well ventilated place of
storing, (6) well stacking to avoid of spillage, (7) the place of storage should be out of reach of children.
Transportation
Pesticides should be transported (1) in well-sealed and labelled containers, (2) should be transported
separately, i.e. not with any other consumable items, cloths, drugs etc., (3) proper stacking to prevent
leakage, (4) display of warning notice on the vehicle transporting pesticides, if transported in bulk with
regular checking during transportation.
Disposal System
1. At the end of the day’s work, the inside of the spray pump should be washed and any residual
pesticides should be flushed out.
2. The rinsing water should be collected and carefully contained in clearly marked drums with a tightly
fitted lid. This should be used to dilute the next day’s tank loads or disposed properly by the
supervisor at disposal sites like pits or digs.
3. Pour the remaining pesticides into surface water sources like stream, nala, rivers, wells or any
drinking-water sources is strictly prohibited.
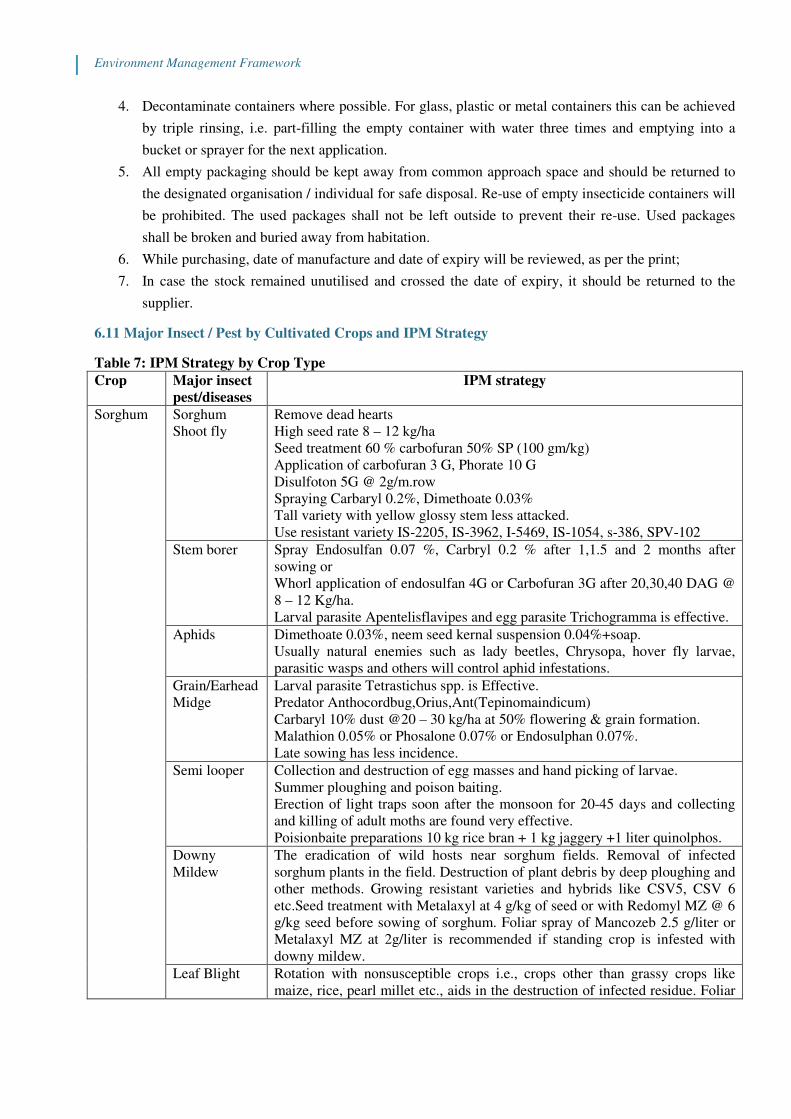
Environment Management Framework
4. Decontaminate containers where possible. For glass, plastic or metal containers this can be achieved
by triple rinsing, i.e. part-filling the empty container with water three times and emptying into a
bucket or sprayer for the next application.
5. All empty packaging should be kept away from common approach space and should be returned to
the designated organisation / individual for safe disposal. Re-use of empty insecticide containers will
be prohibited. The used packages shall not be left outside to prevent their re-use. Used packages
shall be broken and buried away from habitation.
6. While purchasing, date of manufacture and date of expiry will be reviewed, as per the print;
7. In case the stock remained unutilised and crossed the date of expiry, it should be returned to the
supplier.
6.11 Major Insect / Pest by Cultivated Crops and IPM Strategy
Table 7: IPM Strategy by Crop Type
Crop Major insect
pest/diseases
IPM strategy
Sorghum Sorghum
Shoot fly
Remove dead hearts
High seed rate 8 – 12 kg/ha
Seed treatment 60 % carbofuran 50% SP (100 gm/kg)
Application of carbofuran 3 G, Phorate 10 G
Disulfoton 5G @ 2g/m.row
Spraying Carbaryl 0.2%, Dimethoate 0.03%
Tall variety with yellow glossy stem less attacked.
Use resistant variety IS-2205, IS-3962, I-5469, IS-1054, s-386, SPV-102
Stem borer Spray Endosulfan 0.07 %, Carbryl 0.2 % after 1,1.5 and 2 months after
sowing or
Whorl application of endosulfan 4G or Carbofuran 3G after 20,30,40 DAG @
8 – 12 Kg/ha.
Larval parasite Apentelisflavipes and egg parasite Trichogramma is effective.
Aphids Dimethoate 0.03%, neem seed kernal suspension 0.04%+soap.
Usually natural enemies such as lady beetles, Chrysopa, hover fly larvae,
parasitic wasps and others will control aphid infestations.
Grain/Earhead
Midge
Larval parasite Tetrastichus spp. is Effective.
Predator Anthocordbug,Orius,Ant(Tepinomaindicum)
Carbaryl 10% dust @20 – 30 kg/ha at 50% flowering & grain formation.
Malathion 0.05% or Phosalone 0.07% or Endosulphan 0.07%.
Late sowing has less incidence.
Semi looper Collection and destruction of egg masses and hand picking of larvae.
Summer ploughing and poison baiting.
Erection of light traps soon after the monsoon for 20-45 days and collecting
and killing of adult moths are found very effective.
Poisionbaite preparations 10 kg rice bran + 1 kg jaggery +1 liter quinolphos.
Downy
Mildew
The eradication of wild hosts near sorghum fields. Removal of infected
sorghum plants in the field. Destruction of plant debris by deep ploughing and
other methods. Growing resistant varieties and hybrids like CSV5, CSV 6
etc.Seed treatment with Metalaxyl at 4 g/kg of seed or with Redomyl MZ @ 6
g/kg seed before sowing of sorghum. Foliar spray of Mancozeb 2.5 g/liter or
Metalaxyl MZ at 2g/liter is recommended if standing crop is infested with
downy mildew.
Leaf Blight Rotation with nonsusceptible crops i.e., crops other than grassy crops like
maize, rice, pearl millet etc., aids in the destruction of infected residue. Foliar

Environment Management Framework
Crop Major insect
pest/diseases
IPM strategy
application of fungicides may be needed in seed production fields but it is not
economical in grain production fields.
Rust growing less-susceptible or resistant cultivars like PSH 1, SPH 837, CSV 17
etc. is the only solution. Selective fungicides that suppress the disease are
usually not economical.
Anthracnose Clean cultivation, elimination of weed hosts, removal of crop residues will
help in controlling this disease. A 2-year crop rotation with crops other than
sorghum. Growing resistant cultivars like SPV 462, CSV 17 etc.
Pigeon
pea
Pod borer
Blister beetle
Mealybug
Plume moth
Installation of bird perches @ 50/ha for rigorous feeding of insects.
Use H. armigera pheromone trap @ 12/ha.;
Hand collection and destruction of fully grown larvae. Mechanical collection
of grown up larva and blister beetle is effective.
Practice crop rotation, planting non-leguminous crops every cropping season
breaks the life cycle of bean pod borers.
Spraying Neem seed kernel extract (NSKE) 5 per cent at 50% flowering stage
to manage the insect’s populations.
Spraying HaNPV at (500 larval equivalent per hectare) at 15 days after first
spray.
Spraying of NSKE 5% twice followed by triazophos 0.05% is also effective.
The recommended action threshold for Helicoverpa to initiate protection
operations in pigeonpea when one notices.
1 small larva or 3 eggs per plant in short-duration, 3 small larvae or 5 eggs per
plant in medium-duration and 5 small larvae or 10 eggs per plant in long-
duration.
Apply Ha NPV 3 x10¹² POB/ha in 0.1% teepol for Helicoverpa. Apply
chlorpyriphos @ 2.5 l/ha or quinalphos @ 2.0 l/ha or acephate @ 1.0kg/ha
alternatively during flowering & pod formation stage. Ensure thorough
coverage (900-1000 l/ha). Insecticide / Ha NPV spray should be made when
the larvae are upto third instar.
Two sprays of Spinosad @ 75 g a.i. /ha, first at grain filling stage of pods and
second at full grain stage followed by Indoxacarb @ 60 g a.i. /ha. were found
best in pod fly suppression,
Fusarium wilt
Phytophthora
Blight
Powdery
mildew
Cercospora
leaf spot
Sterility
Mosaic
Long crop rotations for 3-4 year with non-host crop like tobacco, sorghum,
pearl millet, cotton is recommended and has been found very effective for wilt
and sterility mosaic disease management.
Selection of disease-free fields, soil solarization or summer ploughing and
wide row interspacing are good agricultural cultural practices advocated for
disease management.
Mixed cropping with sorghum, amendment of soil with oil cakes, appliances
of trace elements such as boron, zinc and manganese and heavy dose of green
leaf manure crops are remedial measures helps in checking the severity of wilt
and blight diseases.
Cultivation of pigeonpea on ridges with proper drainage system and avoiding
the sowing in heavy soil helpful in disease management.
Soil amendment with Trichoderma @ 1.0 kg + 100 kg FYM at the time of
field preparation to reduce the incidence of wilt disease.
Treat the seeds with hexaconazole + captan @ 2.5g/kg seed or metalaxyl @
2.0 g per kg of seeds (or) carbendazim or thiram @ 2 g/kg of seed 24 hours
before sowing (or) with talc formulation of Trichoderma viride @ 4 g/kg of
seed (or) Pseudomonas fluorescens @ 10 g/kg seed for better management of
diseases.
First treat the seeds with biocontrol agents and then with Rhizobium.

Environment Management Framework
Crop Major insect
pest/diseases
IPM strategy
Fungicides and biocontrol agents are incompatible. There should be an
interval of atleast 24 hours after fungicidal treatment for giving the bacterial
culture treatment.
Preventive sprays of mancozeb, wettablesulphur or metalaxyl at 15-20 days
interval starting from 15 days after germination reduces the incidences of
diseases.
Cultivation of disease tolerant varieties is the most effective method to
manage wilt and other diseases of pigeonpea such as Pusa- 9, NP 15, NP 38,
AL 1430, which are resistant or relatively less susceptible.
Soyabean Girdle beetle
Hairy
caterpillar
Stem fly
Whiteflies
Where possible, avoid successive plantings of summer legumes.
Good agronomy and soil moisture are crucial as large, vigorously-growing
plants suffer less defoliation for a given helicoverpa population and have less
risk of terminal damage.
In water-stressed crops, terminals are more attractive to larvae than wilted
leaves. Vigorously growing plants with adequate available moisture are better
able to replace damaged leaves and compensate for flower and pod damage
Prior to flowering, biopesticides, particularly
Helicoverpanucleopolyhedrovirus (NPV), are recommended in preference to
chemical insecticides. This helps conserve beneficial insects to buffer crops
against helicoverpa attack during the susceptible reproductive stages, and
avoids flaring of other pests such as silverleaf whitefly and mites.
For best results, all ingestion type products require thorough plant coverage.
For biopesticides, addition of Amino Feed or an equivalent product is
recommended
Phytophthora
seedling blight
Plant in good seedbed conditions.
Phytophthora is more likely to occur in low, wet areas, poorly drained
areas or compacted areas of a field. Tiling to improve drainage and
taking steps to reduce or prevent compaction may help minimize
disease problems.
Avoid the application of high levels of manure or fertilizer (KCl) just
before planting.
Rotate crops to prevent the increase of inoculum levels in a field.
Use an appropriate fungicide seed treatment or an at-planting
fungicide treatment. Products containing either metalaxyl or
mefenoxam as an active ingredient are particularly effective against
water mold fungi such as Phytophthora sojae
Rhizoctonia
seedling blight
Plant good-quality seed with a good germination rate.
Plant in good seedbed conditions.
Minimize or avoid stresses that delay germination or emergence,
i.e., avoid or prevent herbicide injury and insect injury, correct soil
compaction and hard pan layer problems and reduce injury from
soybean cyst nematode.
Use an appropriate fungicide seed treatment.
Cultivate to ridge soil around the base of plants, thereby promoting root
growth above the area of the stem that is diseased. This may be helpful
only if there is sufficient soil moisture after cultivation for roots to grow
leaf spot Plant disease-free seed.
Select resistant varieties.
Rotate crops with at least one year between soybean crops.
Use of a foliar fungicide is seldom warranted, except on high-value fields
(e.g., seed production fields) or in years when weather is especially favorable
for disease development

Environment Management Framework
Crop Major insect
pest/diseases
IPM strategy
Downy
mildew
Plant disease-free seed.
Rotate crops with at least one year between soybean crops.
If infected seed must be planted, use a fungicide seed treatment.
Powdery
mildew
Select resistant varieties.
Use of foliar fungicides is seldom warranted.
Gram Pod borer spray Endosulfan 35 Ec @ 1.25 litres/hectare in 1000 litres of water or
Monocrotophos @ 1 ml in 1 l litre of water using 800 litres of water/hectar,
Spray neem seed extract (5%)
Cut worm Deep ploughing, Crop rotation, Inter-cropping with wheat or linseed or
mustard, Grow marigold on bunds
Dust Heptachlor @ 25 kg! hectare or Aldrin 5% @ 20 kg/hectare on the
appearance of the pest, Spray Endosulfan @ 2 ml/L
Fusarium wilt Use disease-free seed, avoid late sowing, Follow 4 years crop rotations;
Seed treatment with carbendazim @ 2 g/kg or benomyl @ 3 g/kg
Seed treatment with Pseudomonas fluorescens, Trichoderma harzianum, T.
viride, Bacillus subtilis etc @ 4 g/kg see
Collar rot Soil solarization in summer, Avoid high soil moisture at sowing and seedling
stage
Seed treatment with carboxin @ 3 g/kg of seed
Use of biocontrol agents such as Trichoderma harzianum, T. viride, Bacillus
subtilis etc.
Black root rot Avoid high soil moisture and water logging
Seed treatment with thiram or captan @ 3 g/kg see
Blight Late sowing, Remove and destroy debris of dead plants, Crop rotation,
intercropping with barley, wheat, mustard
Seed treatment with thiram @ 3 g/kg, Foliar spray of chlorothalonil @ 2 ml/L
Safflower Leaf Eating
Caterpillar
Collect and destroy the caterpillars.
Dusting of 10% carbaryl @ 20 kg/ha. or spraying of 0.05% endosulfan
Aphids Spraying of 0.03% dimethoate or 0.02% thiometon for two times at 15 days
interval.
Dusting of 10% carbaryl or 4% endosulfan @ 20 kg/ha.
Timely sowing of safflower
Rust Treat the seed with thiram @ 3 g/kg or captan 2.5 g/kg seed.
Grow resistant varieties.
Spray 0.3% dithane M-45 at 15 days interval for 3 to 4 times
Bacterial
Bligh
Spray streptocyclin 500 ppm of 2 to 3 time
Cotton Jassids /
Aphids /
Thrips
Neem products (1500 ppm ) 2.5 lit / ha Early phase of crop growth
Oxydemeton methyl 25 EC 300 Early phase of crop growth Phoshamidon 85
WSC 200 Early phase of crop growth Acephate 75 SP 290 Above 60 days
Monocrotophos 36 SL 350-600 Above 60 days
Whitefly Neem products (1500 ppm) 2.5 lit Triazophos 40 EC 600 – 800 Acetamiprid
30 – 40 Imidacloprid 25 Thiomethoxam 25
Bollworm Neem products (1500 ppm) 2.5 lit 40 – 60 day Endosulfan 65 EC 35 EC 875 –
1050 40 – 60 day Phosalone 65 EC 35 EC 700 – 900 40 – 60 day Quinalphos
20 A F 500 – 700 During fruiting stages Chlorpyriphos 20 EC 500 – 700
During fruiting stages Profenofos 50 EC 1000 – 1250 During fruiting stages
Thiodicharb 75 SP 500 During fruiting stages
Angular Leaf Field sanitation.
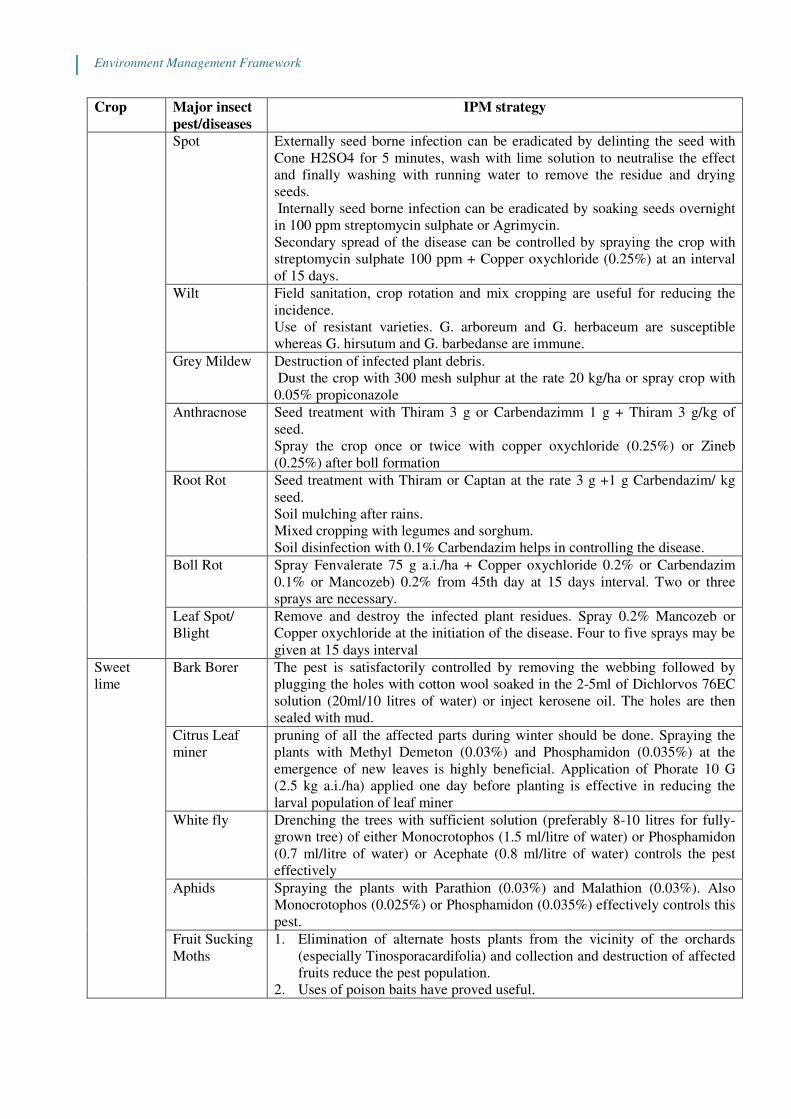
Environment Management Framework
Crop Major insect
pest/diseases
IPM strategy
Spot Externally seed borne infection can be eradicated by delinting the seed with
Cone H2SO4 for 5 minutes, wash with lime solution to neutralise the effect
and finally washing with running water to remove the residue and drying
seeds.
Internally seed borne infection can be eradicated by soaking seeds overnight
in 100 ppm streptomycin sulphate or Agrimycin.
Secondary spread of the disease can be controlled by spraying the crop with
streptomycin sulphate 100 ppm + Copper oxychloride (0.25%) at an interval
of 15 days.
Wilt Field sanitation, crop rotation and mix cropping are useful for reducing the
incidence.
Use of resistant varieties. G. arboreum and G. herbaceum are susceptible
whereas G. hirsutum and G. barbedanse are immune.
Grey Mildew Destruction of infected plant debris.
Dust the crop with 300 mesh sulphur at the rate 20 kg/ha or spray crop with
0.05% propiconazole
Anthracnose Seed treatment with Thiram 3 g or Carbendazimm 1 g + Thiram 3 g/kg of
seed.
Spray the crop once or twice with copper oxychloride (0.25%) or Zineb
(0.25%) after boll formation
Root Rot Seed treatment with Thiram or Captan at the rate 3 g +1 g Carbendazim/ kg
seed.
Soil mulching after rains.
Mixed cropping with legumes and sorghum.
Soil disinfection with 0.1% Carbendazim helps in controlling the disease.
Boll Rot Spray Fenvalerate 75 g a.i./ha + Copper oxychloride 0.2% or Carbendazim
0.1% or Mancozeb) 0.2% from 45th day at 15 days interval. Two or three
sprays are necessary.
Leaf Spot/
Blight
Remove and destroy the infected plant residues. Spray 0.2% Mancozeb or
Copper oxychloride at the initiation of the disease. Four to five sprays may be
given at 15 days interval
Sweet
lime
Bark Borer The pest is satisfactorily controlled by removing the webbing followed by
plugging the holes with cotton wool soaked in the 2-5ml of Dichlorvos 76EC
solution (20ml/10 litres of water) or inject kerosene oil. The holes are then
sealed with mud.
Citrus Leaf
miner
pruning of all the affected parts during winter should be done. Spraying the
plants with Methyl Demeton (0.03%) and Phosphamidon (0.035%) at the
emergence of new leaves is highly beneficial. Application of Phorate 10 G
(2.5 kg a.i./ha) applied one day before planting is effective in reducing the
larval population of leaf miner
White fly Drenching the trees with sufficient solution (preferably 8-10 litres for fully-
grown tree) of either Monocrotophos (1.5 ml/litre of water) or Phosphamidon
(0.7 ml/litre of water) or Acephate (0.8 ml/litre of water) controls the pest
effectively
Aphids Spraying the plants with Parathion (0.03%) and Malathion (0.03%). Also
Monocrotophos (0.025%) or Phosphamidon (0.035%) effectively controls this
pest.
Fruit Sucking
Moths
1. Elimination of alternate hosts plants from the vicinity of the orchards
(especially Tinosporacardifolia) and collection and destruction of affected
fruits reduce the pest population.
2. Uses of poison baits have proved useful.
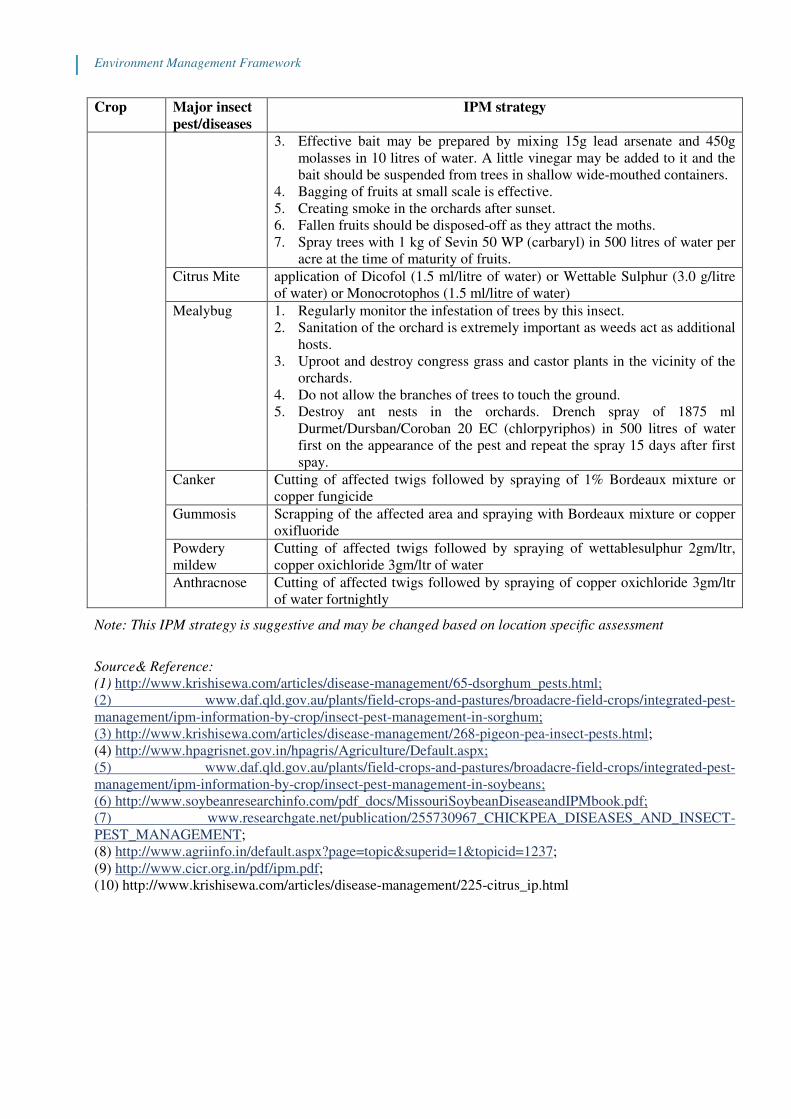
Environment Management Framework
Crop Major insect
pest/diseases
IPM strategy
3. Effective bait may be prepared by mixing 15g lead arsenate and 450g
molasses in 10 litres of water. A little vinegar may be added to it and the
bait should be suspended from trees in shallow wide-mouthed containers.
4. Bagging of fruits at small scale is effective.
5. Creating smoke in the orchards after sunset.
6. Fallen fruits should be disposed-off as they attract the moths.
7. Spray trees with 1 kg of Sevin 50 WP (carbaryl) in 500 litres of water per
acre at the time of maturity of fruits.
Citrus Mite application of Dicofol (1.5 ml/litre of water) or Wettable Sulphur (3.0 g/litre
of water) or Monocrotophos (1.5 ml/litre of water)
Mealybug 1. Regularly monitor the infestation of trees by this insect.
2. Sanitation of the orchard is extremely important as weeds act as additional
hosts.
3. Uproot and destroy congress grass and castor plants in the vicinity of the
orchards.
4. Do not allow the branches of trees to touch the ground.
5. Destroy ant nests in the orchards. Drench spray of 1875 ml
Durmet/Dursban/Coroban 20 EC (chlorpyriphos) in 500 litres of water
first on the appearance of the pest and repeat the spray 15 days after first
spay.
Canker Cutting of affected twigs followed by spraying of 1% Bordeaux mixture or
copper fungicide
Gummosis Scrapping of the affected area and spraying with Bordeaux mixture or copper
oxifluoride
Powdery
mildew
Cutting of affected twigs followed by spraying of wettablesulphur 2gm/ltr,
copper oxichloride 3gm/ltr of water
Anthracnose Cutting of affected twigs followed by spraying of copper oxichloride 3gm/ltr
of water fortnightly
Note: This IPM strategy is suggestive and may be changed based on location specific assessment
Source& Reference:
(1) http://www.krishisewa.com/articles/disease-management/65-dsorghum_pests.html;
(2) www.daf.qld.gov.au/plants/field-crops-and-pastures/broadacre-field-crops/integrated-pest-
management/ipm-information-by-crop/insect-pest-management-in-sorghum;
(3) http://www.krishisewa.com/articles/disease-management/268-pigeon-pea-insect-pests.html;
(4) http://www.hpagrisnet.gov.in/hpagris/Agriculture/Default.aspx;
(5) www.daf.qld.gov.au/plants/field-crops-and-pastures/broadacre-field-crops/integrated-pest-
management/ipm-information-by-crop/insect-pest-management-in-soybeans;
(6) http://www.soybeanresearchinfo.com/pdf_docs/MissouriSoybeanDiseaseandIPMbook.pdf;
(7) www.researchgate.net/publication/255730967_CHICKPEA_DISEASES_AND_INSECT-
PEST_MANAGEMENT;
(8) http://www.agriinfo.in/default.aspx?page=topic&superid=1&topicid=1237;
(9) http://www.cicr.org.in/pdf/ipm.pdf;
(10) http://www.krishisewa.com/articles/disease-management/225-citrus_ip.html
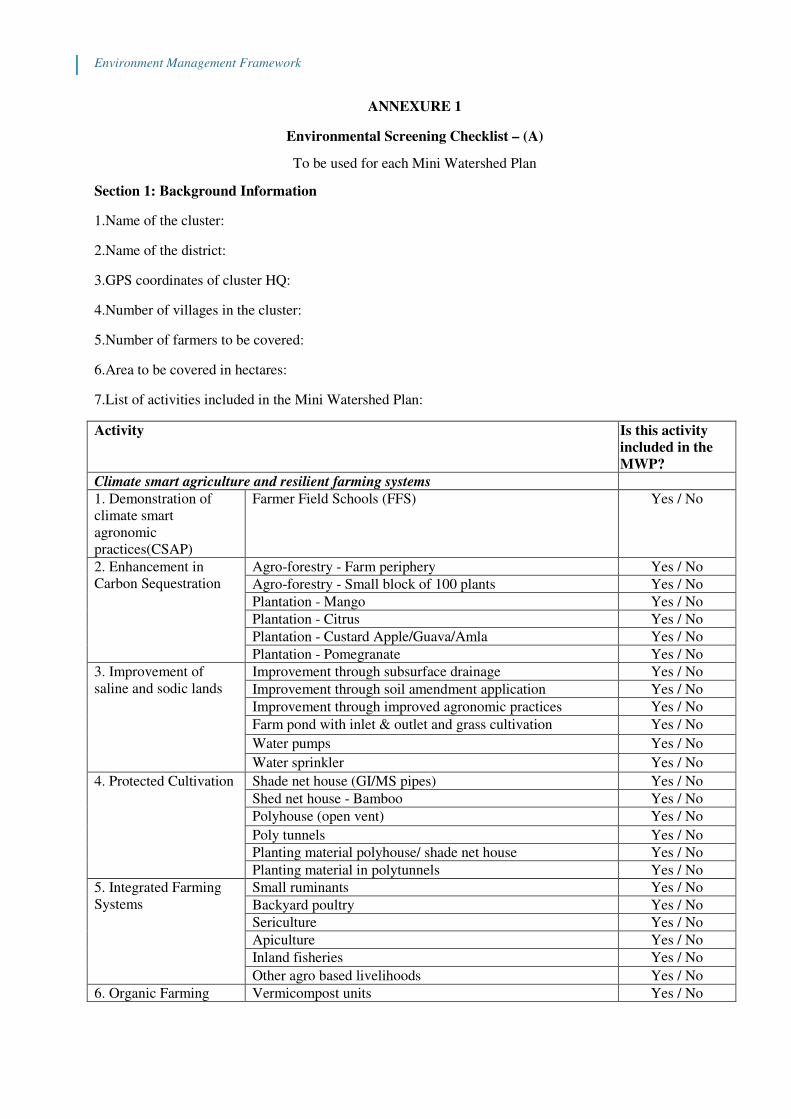
Environment Management Framework
ANNEXURE 1
Environmental Screening Checklist – (A)
To be used for each Mini Watershed Plan
Section 1: Background Information
1.Name of the cluster:
2.Name of the district:
3.GPS coordinates of cluster HQ:
4.Number of villages in the cluster:
5.Number of farmers to be covered:
6.Area to be covered in hectares:
7.List of activities included in the Mini Watershed Plan:
Activity Is this activity
included in the
MWP?
Climate smart agriculture and resilient farming systems
1. Demonstration of
climate smart
agronomic
practices(CSAP)
Farmer Field Schools (FFS) Yes / No
2. Enhancement in
Carbon Sequestration
Agro-forestry - Farm periphery Yes / No
Agro-forestry - Small block of 100 plants Yes / No
Plantation - Mango Yes / No
Plantation - Citrus Yes / No
Plantation - Custard Apple/Guava/Amla Yes / No
Plantation - Pomegranate Yes / No
3. Improvement of
saline and sodic lands
Improvement through subsurface drainage Yes / No
Improvement through soil amendment application Yes / No
Improvement through improved agronomic practices Yes / No
Farm pond with inlet & outlet and grass cultivation Yes / No
Water pumps Yes / No
Water sprinkler Yes / No
4. Protected Cultivation Shade net house (GI/MS pipes) Yes / No
Shed net house - Bamboo Yes / No
Polyhouse (open vent) Yes / No
Poly tunnels Yes / No
Planting material polyhouse/ shade net house Yes / No
Planting material in polytunnels Yes / No
5. Integrated Farming
Systems
Small ruminants Yes / No
Backyard poultry Yes / No
Sericulture Yes / No
Apiculture Yes / No
Inland fisheries Yes / No
Other agro based livelihoods Yes / No
6. Organic Farming Vermicompost units Yes / No

Environment Management Framework
Activity Is this activity
included in the
MWP?
Systems Organic input production unit Yes / No
Efficient and sustainable use of water for agriculture
1. Catchment treatment Continuous Contour trenches Model 1 Yes / No
Continuous Contour trenches Model 2 Yes / No
2. Drainage Line
Treatment
Construction of Loose Boulder Structures Yes / No
Construction of Earthen Nala Bunds Yes / No
Construction of Cement Nala Bunds Yes / No
3. Construction of new
water harvesting
structures
Construction of community farm ponds Yes / No
Construction of Farm Ponds (without lining) Yes / No
Construction of Farm ponds (with lining) Yes / No
Open Dug well Yes / No
4. Rejuvenation by
desilting/repairs of old
water harvesting
structures
Desilting of old water storage structure Yes / No
5. Construction of
groundwater recharge
structures
Open dug wells/bore wells Yes / No
6. On-farm water
security
Compartment /graded bunding Yes / No
7. Micro irrigation
systems
Drip irrigation systems Yes / No
Sprinklers Yes / No
8. Protective Irrigation Water pumps Yes / No
Water carrying pipes Yes / No
Section 2: Check if the activities are in the ‘list of non-permissible activities’
8.Does the Mini Watershed Plan (MWP) include any of the following non-permissible activities?
S. No. List of non-permissible activities Is this type of activity in
the MWP?
i Digging of deep wells (borewells/tubewells) that are 60 meters
or more in depth in notified areas[1].
Yes / No
ii Construction or repair of check dams or embankments more
than 10 meters in height.
Yes / No
iii Any activities located within National Parks[2]. Yes / No
iv Any activities located within a notified Eco Sensitive Zone
(ESZ) and prohibited within ESZ[3]?
Yes / No
v Any activities involving pesticides that are banned by the
Government of India[4].
Yes / No
vi Any activities involving pesticides that are in Classes Ia, Ib
and II of the WHO Recommended Classification of Pesticides
by Hazard[5].
Yes / No
vii Any activities involving construction within 100 meters from
an archeological site/monument[6].
Yes / No
viii Any activities involving use of Asbestos Containing Materials
(e.g., AC pipes for irrigation).
Yes / No
Section 3: Check compliance with regulatory requirements
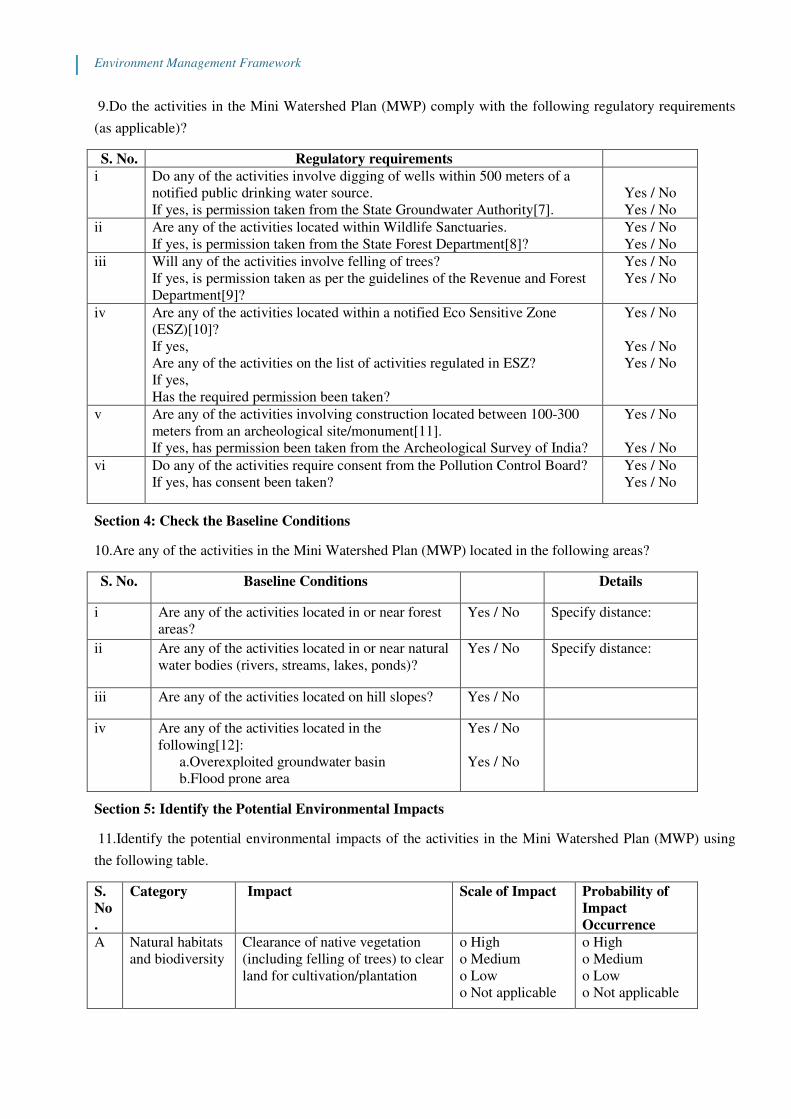
Environment Management Framework
9.Do the activities in the Mini Watershed Plan (MWP) comply with the following regulatory requirements
(as applicable)?
S. No. Regulatory requirements
i Do any of the activities involve digging of wells within 500 meters of a
notified public drinking water source.
If yes, is permission taken from the State Groundwater Authority[7].
Yes / No
Yes / No
ii Are any of the activities located within Wildlife Sanctuaries.
If yes, is permission taken from the State Forest Department[8]?
Yes / No
Yes / No
iii Will any of the activities involve felling of trees?
If yes, is permission taken as per the guidelines of the Revenue and Forest
Department[9]?
Yes / No
Yes / No
iv Are any of the activities located within a notified Eco Sensitive Zone
(ESZ)[10]?
If yes,
Are any of the activities on the list of activities regulated in ESZ?
If yes,
Has the required permission been taken?
Yes / No
Yes / No
Yes / No
v Are any of the activities involving construction located between 100-300
meters from an archeological site/monument[11].
If yes, has permission been taken from the Archeological Survey of India?
Yes / No
Yes / No
vi Do any of the activities require consent from the Pollution Control Board?
If yes, has consent been taken?
Yes / No
Yes / No
Section 4: Check the Baseline Conditions
10.Are any of the activities in the Mini Watershed Plan (MWP) located in the following areas?
S. No. Baseline Conditions Details
i Are any of the activities located in or near forest
areas?
Yes / No Specify distance:
ii Are any of the activities located in or near natural
water bodies (rivers, streams, lakes, ponds)?
Yes / No Specify distance:
iii Are any of the activities located on hill slopes? Yes / No
iv Are any of the activities located in the
following[12]:
a.Overexploited groundwater basin
b.Flood prone area
Yes / No
Yes / No
Section 5: Identify the Potential Environmental Impacts
11.Identify the potential environmental impacts of the activities in the Mini Watershed Plan (MWP) using
the following table.
S.
No
.
Category Impact Scale of Impact Probability of
Impact
Occurrence
A Natural habitats
and biodiversity
Clearance of native vegetation
(including felling of trees) to clear
land for cultivation/plantation
o High
o Medium
o Low
o Not applicable
o High
o Medium
o Low
o Not applicable

Environment Management Framework
S.
No
.
Category Impact Scale of Impact Probability of
Impact
Occurrence
Degradation of natural vegetation
due to open grazing by livestock
o High
o Medium
o Low
o Not applicable
o High
o Medium
o Low
o Not applicable
Human wildlife conflict (in areas
close to forests)
o High
o Medium
o Low
o Not applicable
o High
o Medium
o Low
o Not applicable
Transmission of livestock diseases
to wildlife (in areas close to
forests)
o High
o Medium
o Low
o Not applicable
o High
o Medium
o Low
o Not applicable
Introduction of exotic species of
animals or plants
o High
o Medium
o Low
o Not applicable
o High
o Medium
o Low
o Not applicable
B Solid Waste Pollution due to improper disposal
of solid waste (e.g., plastic mulch)
o High
o Medium
o Low
o Not applicable
o High
o Medium
o Low
o Not applicable
Pollution and safety risk due to
improper disposal of hazardous
waste (e.g., pesticide containers)
o High
o Medium
o Low
o Not applicable
o High
o Medium
o Low
o Not applicable
Pollution and health risk due to
improper disposal of biological
waste (e.g., dead animal
carcasses)
o High
o Medium
o Low
o Not applicable
o High
o Medium
o Low
o Not applicable
Pollution and health risk due to
improper disposal of organic
waste (e.g., burning of crop
residues, open dumping of
manure)
o High
o Medium
o Low
o Not applicable
o High
o Medium
o Low
o Not applicable
C Water Quality Pollution of water bodies due to
release of wastewater
o High
o Medium
o Low
o Not applicable
o High
o Medium
o Low
o Not applicable
Pollution of water bodies due to
leaching of excess fertilizer or
manure
o High
o Medium
o Low
o Not applicable
o High
o Medium
o Low
o Not applicable
Pollution of water bodies due to
excess fish feed
o High
o Medium
o Low
o Not applicable
o High
o Medium
o Low
o Not applicable

Environment Management Framework
S.
No
.
Category Impact Scale of Impact Probability of
Impact
Occurrence
D Water
Availability
Depletion of groundwater due to
over-extraction (water intensive
crops, evaporation losses from
well-fed farm ponds, etc.)
o High
o Medium
o Low
o Not applicable
o High
o Medium
o Low
o Not applicable
Reduction in yield in nearby wells
due to over-extraction or close
spacing of wells
o High
o Medium
o Low
o Not applicable
o High
o Medium
o Low
o Not applicable
Reduction in downstream flows
due to
diversion/damming/bunding of
streams/rivulets/nalas
o High
o Medium
o Low
o Not applicable
o High
o Medium
o Low
o Not applicable
E Health & Safety Safety risk from improper storage
and/or handling of hazardous
chemicals (e.g., pesticides)
o High
o Medium
o Low
o Not applicable
o High
o Medium
o Low
o Not applicable
Safety risk from unguarded wells,
borewell holes, farm ponds, etc.
o High
o Medium
o Low
o Not applicable
o High
o Medium
o Low
o Not applicable
Risk of transmission of zoonotic
diseases (e.g., bird flu, anthrax)
o High
o Medium
o Low
o Not applicable
o High
o Medium
o Low
o Not applicable
Accidental injury (e.g., from agri-
machinery)
o High
o Medium
o Low
o Not applicable
o High
o Medium
o Low
o Not applicable
12. Any other significant information:
Section 6: Screening Details
13. Date of filing this screening checklist:
14. Name, Designation and Signature of individual who filled this screening checklist:
Name: Designation: Signature:
15. Name, Designation and Signature of individual who verified this screening checklist:
Name: Designation: Signature:
[1] Maharashtra Groundwater (Development and Management) Act, 2009.
[2] For list of National Parks and Wildlife Sanctuaries in Maharashtra, refer
to:http://www.wiienvis.nic.in/Database/Maharashtra_7829.aspx
[3] For list of Eco Sensitive Zones in Maharashtra and lists of prohibited and regulated activities, refer
to:http://envfor.nic.in/content/esz-notifications
[4] For list of pesticides banned in India, refer to:http://cibrc.nic.in/ibr2012.doc

Environment Management Framework
[5] For list of pesticides in WHO classes Ia, Ib and II, refer
to:http://www.who.int/ipcs/publications/pesticides_hazard_2009.pdf
[6] For list of protected monuments in Maharashtra, refer
to:http://asi.nic.in/asi_monu_alphalist_maharashtra.asp
[7] Maharashtra Groundwater (Development and Management) Act, 2009.
[8] For list of National Parks and Wildlife Sanctuaries in Maharashtra, refer
to:http://www.wiienvis.nic.in/Database/Maharashtra_7829.aspx
[9] For Guidelines for Tree Felling and Transit Permission, refer
to:http://mahaforest.gov.in/fckimagefile/Ease%20of%20Doing%20Business%20Guidelines%20for%20Tree
%20Felling(1).pdf
[10] For list of Eco Sensitive Zones in Maharashtra and lists of prohibited and regulated activities, refer
to:http://envfor.nic.in/content/esz-notifications
[11] For list of protected monuments in Maharashtra, refer
to:http://asi.nic.in/asi_monu_alphalist_maharashtra.asp
[12] For district-wise details on vulnerability to floods and earthquake, refer
to:http://nidm.gov.in/PDF/DP/MAHARASHTRA.PDF
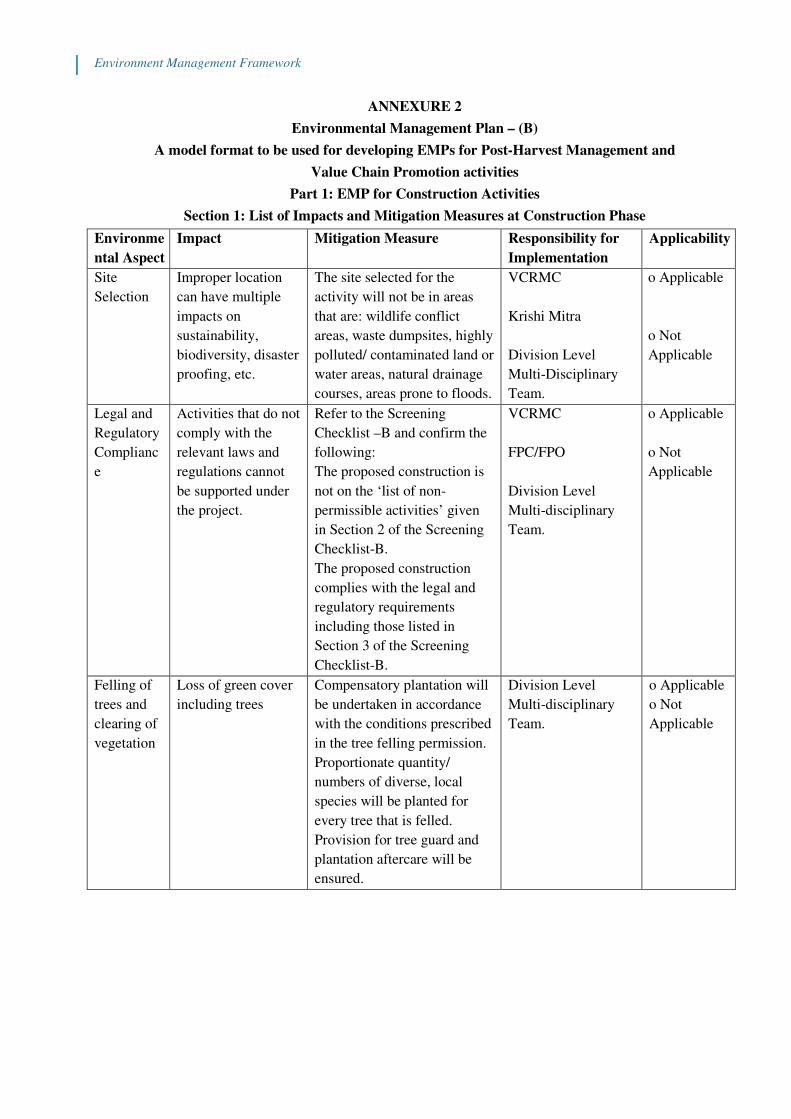
Environment Management Framework
ANNEXURE 2
Environmental Management Plan – (B)
A model format to be used for developing EMPs for Post-Harvest Management and
Value Chain Promotion activities
Part 1: EMP for Construction Activities
Section 1: List of Impacts and Mitigation Measures at Construction Phase
Environme
ntal Aspect
Impact Mitigation Measure Responsibility for
Implementation
Applicability
Site
Selection
Improper location
can have multiple
impacts on
sustainability,
biodiversity, disaster
proofing, etc.
The site selected for the
activity will not be in areas
that are: wildlife conflict
areas, waste dumpsites, highly
polluted/ contaminated land or
water areas, natural drainage
courses, areas prone to floods.
VCRMC
Krishi Mitra
Division Level
Multi-Disciplinary
Team.
o Applicable
o Not
Applicable
Legal and
Regulatory
Complianc
e
Activities that do not
comply with the
relevant laws and
regulations cannot
be supported under
the project.
Refer to the Screening
Checklist –B and confirm the
following:
The proposed construction is
not on the ‘list of non-
permissible activities’ given
in Section 2 of the Screening
Checklist-B.
The proposed construction
complies with the legal and
regulatory requirements
including those listed in
Section 3 of the Screening
Checklist-B.
VCRMC
FPC/FPO
Division Level
Multi-disciplinary
Team.
o Applicable
o Not
Applicable
Felling of
trees and
clearing of
vegetation
Loss of green cover
including trees
Compensatory plantation will
be undertaken in accordance
with the conditions prescribed
in the tree felling permission.
Proportionate quantity/
numbers of diverse, local
species will be planted for
every tree that is felled.
Provision for tree guard and
plantation aftercare will be
ensured.
Division Level
Multi-disciplinary
Team.
o Applicable
o Not
Applicable
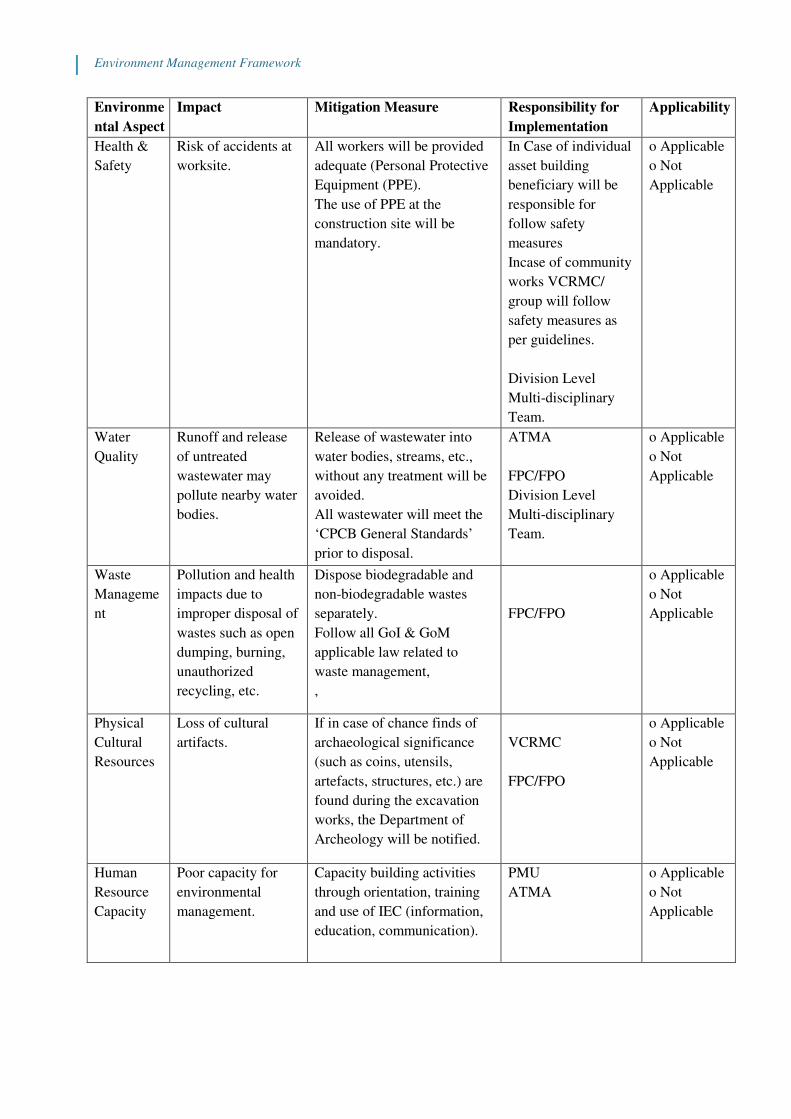
Environment Management Framework
Environme
ntal Aspect
Impact Mitigation Measure Responsibility for
Implementation
Applicability
Health &
Safety
Risk of accidents at
worksite.
All workers will be provided
adequate (Personal Protective
Equipment (PPE).
The use of PPE at the
construction site will be
mandatory.
In Case of individual
asset building
beneficiary will be
responsible for
follow safety
measures
Incase of community
works VCRMC/
group will follow
safety measures as
per guidelines.
Division Level
Multi-disciplinary
Team.
o Applicable
o Not
Applicable
Water
Quality
Runoff and release
of untreated
wastewater may
pollute nearby water
bodies.
Release of wastewater into
water bodies, streams, etc.,
without any treatment will be
avoided.
All wastewater will meet the
‘CPCB General Standards’
prior to disposal.
ATMA
FPC/FPO
Division Level
Multi-disciplinary
Team.
o Applicable
o Not
Applicable
Waste
Manageme
nt
Pollution and health
impacts due to
improper disposal of
wastes such as open
dumping, burning,
unauthorized
recycling, etc.
Dispose biodegradable and
non-biodegradable wastes
separately.
Follow all GoI & GoM
applicable law related to
waste management,
,
FPC/FPO
o Applicable
o Not
Applicable
Physical
Cultural
Resources
Loss of cultural
artifacts.
If in case of chance finds of
archaeological significance
(such as coins, utensils,
artefacts, structures, etc.) are
found during the excavation
works, the Department of
Archeology will be notified.
VCRMC
FPC/FPO
o Applicable
o Not
Applicable
Human
Resource
Capacity
Poor capacity for
environmental
management.
Capacity building activities
through orientation, training
and use of IEC (information,
education, communication).
PMU
ATMA
o Applicable
o Not
Applicable

Environment Management Framework
Environme
ntal Aspect
Impact Mitigation Measure Responsibility for
Implementation
Applicability
Complianc
e
Monitoring
Weak compliance of
the environmental
management plan
will lead to
aggravated impacts
and undermine
sustainability.
Monitoring and reporting OF
as per project’s M&E
strategy.
As per project’s
monitoring and
evaluation system
o Applicable
o Not
Applicable
Part 2: EMP for Operation and Maintenance Phase
Section 1: List of Impacts and Mitigation Measures at O&M Phase
Environmenta
l Aspect
Impact Mitigation Measure Responsibility for
Implementation
Legal and
Regulatory
Compliance
Activities that do not
comply with the
relevant laws and
regulations cannot be
supported.
Refer to the Screening Checklist
–B and confirm the following:
The proposed activity is not on
the ‘list of non-permissible
activities’ given in Section 2 of
the Screening Checklist-B.
The proposed activity complies
with the legal and regulatory
requirements including those
listed in Section 3 of the
Screening Checklist-B.
VCRMC
Board of Directors and
CEO of the FPO/FPC.
Air and Water
Pollution
Air and water pollution
from processing units
(grain and pulse
processing, flour mills,
etc.)
All manufacturing processes will
comply with the relevant CPCB
standards: industry specific
standards for ‘Grain Processing,
Flour Mills, Paddy Processing,
Pulse Making or Grinding
Mills[5]’, or, in cases where
industry-specific standards are
not relevant/available, with the
CPCB General Standards[6].
State Coordinator –
Environment in the
PMU.
Division Level Multi-
disciplinary Team.
Health &
Safety
Equipment, machinery,
vehicles, etc., that do
not comply with
relevant safety and
environmental
standards may pose risk
to human and
environmental health
and safety.
All procured equipment and
machinery will comply with
relevant BIS standards.
All vehicles (carriers, reefer vans,
etc.) will comply with the
relevant Bharat Stage (BS)
emission norms.
State Coordinator –
Environment in the
PMU.
VCRMC
Board of Directors and
CEO of the FPO.
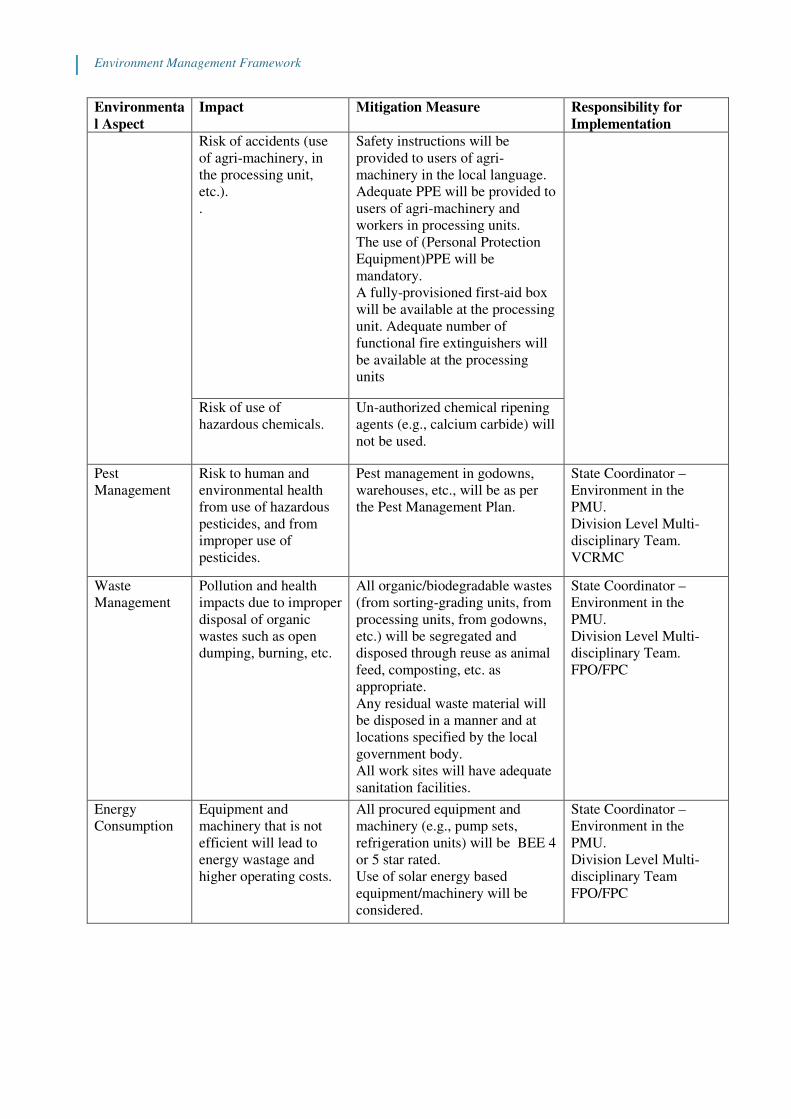
Environment Management Framework
Environmenta
l Aspect
Impact Mitigation Measure Responsibility for
Implementation
Risk of accidents (use
of agri-machinery, in
the processing unit,
etc.).
.
Safety instructions will be
provided to users of agri-
machinery in the local language.
Adequate PPE will be provided to
users of agri-machinery and
workers in processing units.
The use of (Personal Protection
Equipment)PPE will be
mandatory.
A fully-provisioned first-aid box
will be available at the processing
unit. Adequate number of
functional fire extinguishers will
be available at the processing
units
Risk of use of
hazardous chemicals.
Un-authorized chemical ripening
agents (e.g., calcium carbide) will
not be used.
Pest
Management
Risk to human and
environmental health
from use of hazardous
pesticides, and from
improper use of
pesticides.
Pest management in godowns,
warehouses, etc., will be as per
the Pest Management Plan.
State Coordinator –
Environment in the
PMU.
Division Level Multi-
disciplinary Team.
VCRMC
Waste
Management
Pollution and health
impacts due to improper
disposal of organic
wastes such as open
dumping, burning, etc.
All organic/biodegradable wastes
(from sorting-grading units, from
processing units, from godowns,
etc.) will be segregated and
disposed through reuse as animal
feed, composting, etc. as
appropriate.
Any residual waste material will
be disposed in a manner and at
locations specified by the local
government body.
All work sites will have adequate
sanitation facilities.
State Coordinator –
Environment in the
PMU.
Division Level Multi-
disciplinary Team.
FPO/FPC
Energy
Consumption
Equipment and
machinery that is not
efficient will lead to
energy wastage and
higher operating costs.
All procured equipment and
machinery (e.g., pump sets,
refrigeration units) will be BEE 4
or 5 star rated.
Use of solar energy based
equipment/machinery will be
considered.
State Coordinator –
Environment in the
PMU.
Division Level Multi-
disciplinary Team
FPO/FPC

Environment Management Framework
Environmenta
l Aspect
Impact Mitigation Measure Responsibility for
Implementation
Human
Resource
Capacity
Poor capacity for
environmental
management.
Capacity building activities
through orientation, training and
use of IEC (information,
education, communication) for
farmers, FPO staff and board
members, etc.
State Coordinator –
Environment in the
PMU.
Division Level Multi-
disciplinary Team.
Board of Directors and
CEO of the FPO.
Compliance
Monitoring
Weak compliance of the
environmental
management plan will
lead to aggravated
impacts and undermine
sustainability.
EMP monitoring as a part of
project’s over all Monitoring and
Evaluation strategy
State Coordinator –
Environment in the PMU
Third party monitoring
[1] Refer
to:http://www.cgwb.gov.in/CGWA/Documents/Guidelines%20Supreme%20Court%20fatal%20Accid
ent.pdf
[2] Refer to:http://www.moef.gov.in/sites/default/files/C%20&D%20rules%202016.pdf
[3] Refer
to:http://www.moef.gov.in/sites/default/files/Final%20HWM%20Rules%202016%20(English)_0.pdf
[4] Refer to:http://wdra.nic.in/WAREHOUSEMANUAL30012013.pdf
[5] Refer to:http://www.cpcb.nic.in/Industry-Specific-Standards/Effluent/458-1.pdf
[6] Refer to:http://cpcb.nic.in/GeneralStandards.pdf
ANNEXURE 3
Project on Climate Resilient Agriculture (PoCRA)
Environmental Guidelines – (A)
To be used for Mini Watershed Plans
Part 1: General Environmental Guidelines (applicable to all activities)
Site Selection & Materials
·The site selected for the activity must not be in areas that are: wildlife conflict areas, waste dumpsites,
highly polluted/contaminated land or water areas, areas prone to floods.
·Ensure that material required for construction of bunds, nala bunds, water harvesting structures, etc., is
procured on-site or from authorized quarries.
Resource Conservation
·Adopt water conservation practices (e.g., use of efficient irrigation methods such as drip and sprinkler
irrigation, mulching, alternate furrow irrigation, etc.).
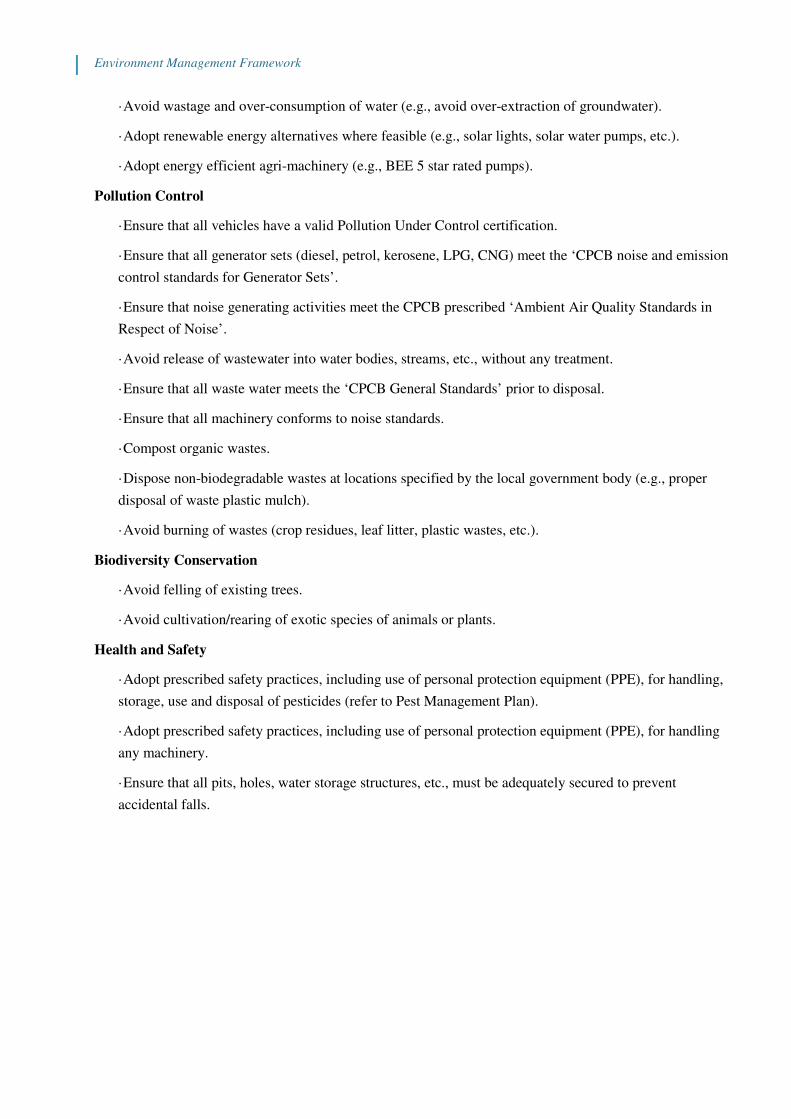
Environment Management Framework
·Avoid wastage and over-consumption of water (e.g., avoid over-extraction of groundwater).
·Adopt renewable energy alternatives where feasible (e.g., solar lights, solar water pumps, etc.).
·Adopt energy efficient agri-machinery (e.g., BEE 5 star rated pumps).
Pollution Control
·Ensure that all vehicles have a valid Pollution Under Control certification.
·Ensure that all generator sets (diesel, petrol, kerosene, LPG, CNG) meet the ‘CPCB noise and emission
control standards for Generator Sets’.
·Ensure that noise generating activities meet the CPCB prescribed ‘Ambient Air Quality Standards in
Respect of Noise’.
·Avoid release of wastewater into water bodies, streams, etc., without any treatment.
·Ensure that all waste water meets the ‘CPCB General Standards’ prior to disposal.
·Ensure that all machinery conforms to noise standards.
·Compost organic wastes.
·Dispose non-biodegradable wastes at locations specified by the local government body (e.g., proper
disposal of waste plastic mulch).
·Avoid burning of wastes (crop residues, leaf litter, plastic wastes, etc.).
Biodiversity Conservation
·Avoid felling of existing trees.
·Avoid cultivation/rearing of exotic species of animals or plants.
Health and Safety
·Adopt prescribed safety practices, including use of personal protection equipment (PPE), for handling,
storage, use and disposal of pesticides (refer to Pest Management Plan).
·Adopt prescribed safety practices, including use of personal protection equipment (PPE), for handling
any machinery.
·Ensure that all pits, holes, water storage structures, etc., must be adequately secured to prevent
accidental falls.
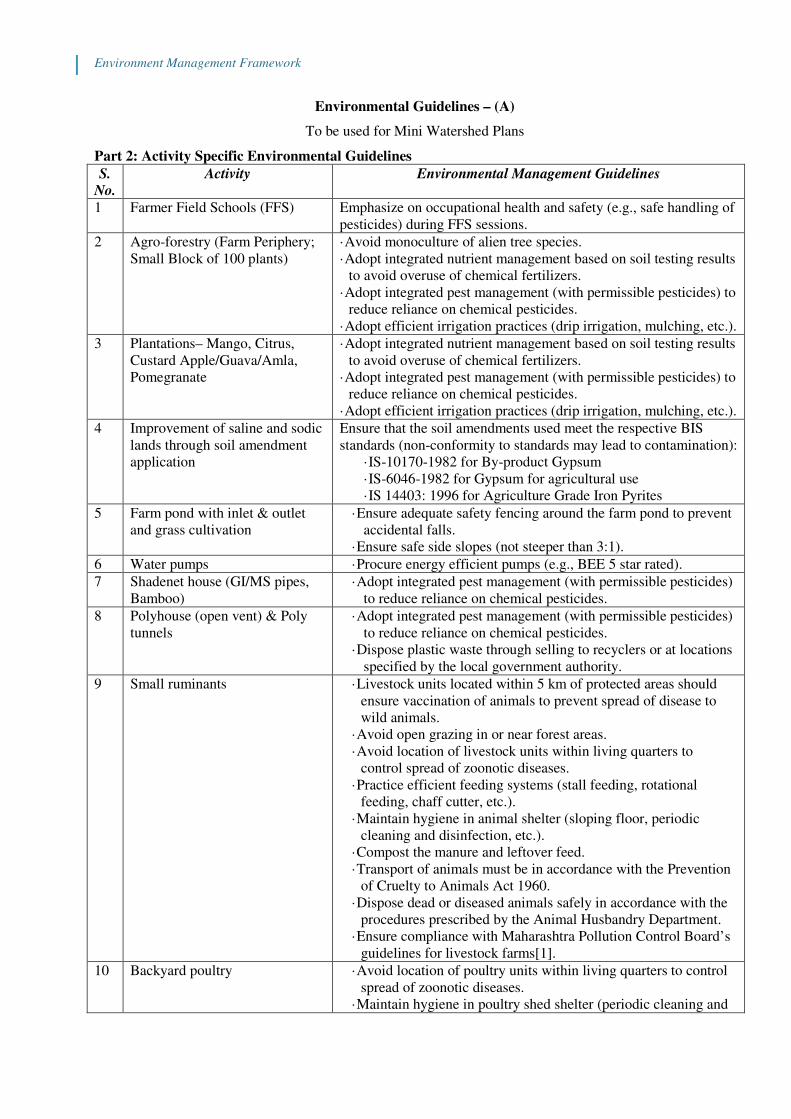
Environment Management Framework
Environmental Guidelines – (A)
To be used for Mini Watershed Plans
Part 2: Activity Specific Environmental Guidelines
S.
No.
Activity Environmental Management Guidelines
1 Farmer Field Schools (FFS) Emphasize on occupational health and safety (e.g., safe handling of
pesticides) during FFS sessions.
2 Agro-forestry (Farm Periphery;
Small Block of 100 plants)
·Avoid monoculture of alien tree species.
·Adopt integrated nutrient management based on soil testing results
to avoid overuse of chemical fertilizers.
·Adopt integrated pest management (with permissible pesticides) to
reduce reliance on chemical pesticides.
·Adopt efficient irrigation practices (drip irrigation, mulching, etc.).
3 Plantations– Mango, Citrus,
Custard Apple/Guava/Amla,
Pomegranate
·Adopt integrated nutrient management based on soil testing results
to avoid overuse of chemical fertilizers.
·Adopt integrated pest management (with permissible pesticides) to
reduce reliance on chemical pesticides.
·Adopt efficient irrigation practices (drip irrigation, mulching, etc.).
4 Improvement of saline and sodic
lands through soil amendment
application
Ensure that the soil amendments used meet the respective BIS
standards (non-conformity to standards may lead to contamination):
·IS-10170-1982 for By-product Gypsum
·IS-6046-1982 for Gypsum for agricultural use
·IS 14403: 1996 for Agriculture Grade Iron Pyrites
5 Farm pond with inlet & outlet
and grass cultivation
·Ensure adequate safety fencing around the farm pond to prevent
accidental falls.
·Ensure safe side slopes (not steeper than 3:1).
6 Water pumps ·Procure energy efficient pumps (e.g., BEE 5 star rated).
7 Shadenet house (GI/MS pipes,
Bamboo)
·Adopt integrated pest management (with permissible pesticides)
to reduce reliance on chemical pesticides.
8 Polyhouse (open vent) & Poly
tunnels
·Adopt integrated pest management (with permissible pesticides)
to reduce reliance on chemical pesticides.
·Dispose plastic waste through selling to recyclers or at locations
specified by the local government authority.
9 Small ruminants ·Livestock units located within 5 km of protected areas should
ensure vaccination of animals to prevent spread of disease to
wild animals.
·Avoid open grazing in or near forest areas.
·Avoid location of livestock units within living quarters to
control spread of zoonotic diseases.
·Practice efficient feeding systems (stall feeding, rotational
feeding, chaff cutter, etc.).
·Maintain hygiene in animal shelter (sloping floor, periodic
cleaning and disinfection, etc.).
·Compost the manure and leftover feed.
·Transport of animals must be in accordance with the Prevention
of Cruelty to Animals Act 1960.
·Dispose dead or diseased animals safely in accordance with the
procedures prescribed by the Animal Husbandry Department.
·Ensure compliance with Maharashtra Pollution Control Board’s
guidelines for livestock farms[1].
10 Backyard poultry ·Avoid location of poultry units within living quarters to control
spread of zoonotic diseases.
·Maintain hygiene in poultry shed shelter (periodic cleaning and
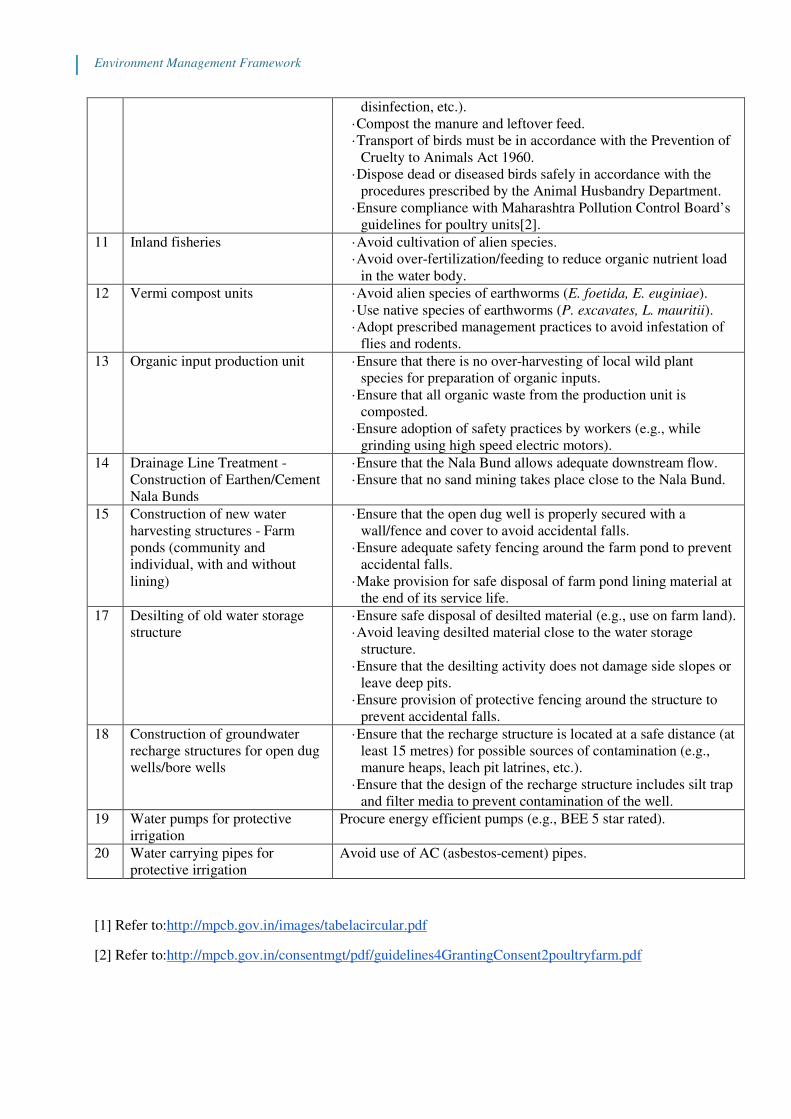
Environment Management Framework
disinfection, etc.).
·Compost the manure and leftover feed.
·Transport of birds must be in accordance with the Prevention of
Cruelty to Animals Act 1960.
·Dispose dead or diseased birds safely in accordance with the
procedures prescribed by the Animal Husbandry Department.
·Ensure compliance with Maharashtra Pollution Control Board’s
guidelines for poultry units[2].
11 Inland fisheries ·Avoid cultivation of alien species.
·Avoid over-fertilization/feeding to reduce organic nutrient load
in the water body.
12 Vermi compost units ·Avoid alien species of earthworms (E. foetida, E. euginiae).
·Use native species of earthworms (P. excavates, L. mauritii).
·Adopt prescribed management practices to avoid infestation of
flies and rodents.
13 Organic input production unit ·Ensure that there is no over-harvesting of local wild plant
species for preparation of organic inputs.
·Ensure that all organic waste from the production unit is
composted.
·Ensure adoption of safety practices by workers (e.g., while
grinding using high speed electric motors).
14 Drainage Line Treatment -
Construction of Earthen/Cement
Nala Bunds
·Ensure that the Nala Bund allows adequate downstream flow.
·Ensure that no sand mining takes place close to the Nala Bund.
15 Construction of new water
harvesting structures - Farm
ponds (community and
individual, with and without
lining)
·Ensure that the open dug well is properly secured with a
wall/fence and cover to avoid accidental falls.
·Ensure adequate safety fencing around the farm pond to prevent
accidental falls.
·Make provision for safe disposal of farm pond lining material at
the end of its service life.
17 Desilting of old water storage
structure
·Ensure safe disposal of desilted material (e.g., use on farm land).
·Avoid leaving desilted material close to the water storage
structure.
·Ensure that the desilting activity does not damage side slopes or
leave deep pits.
·Ensure provision of protective fencing around the structure to
prevent accidental falls.
18 Construction of groundwater
recharge structures for open dug
wells/bore wells
·Ensure that the recharge structure is located at a safe distance (at
least 15 metres) for possible sources of contamination (e.g.,
manure heaps, leach pit latrines, etc.).
·Ensure that the design of the recharge structure includes silt trap
and filter media to prevent contamination of the well.
19 Water pumps for protective
irrigation
Procure energy efficient pumps (e.g., BEE 5 star rated).
20 Water carrying pipes for
protective irrigation
Avoid use of AC (asbestos-cement) pipes.
[1] Refer to:http://mpcb.gov.in/images/tabelacircular.pdf
[2] Refer to:http://mpcb.gov.in/consentmgt/pdf/guidelines4GrantingConsent2poultryfarm.pdf