environment canada proficiency testing program - usgs · g13:2007, guidelines for the requirements...
TRANSCRIPT
Environment Canada Proficiency Testing Program
Study #0094
Trace Elements in Water
Environnement Canada Programme d’essais d’aptitude
Études #0094
Éléments traces dans l’eau
June/Juin to September/Septembre 2009 C. Tinson
WSTD Contribution No. 09-065

Information and Quality Management Emergencies, Operational Analytical Laboratories and Research Support Division Water Science and Technology Directorate, Environment Canada 867 Lakeshore Road, P.O. Box 5050 Burlington, ON, Canada, L7R 4A6 September 21, 2009 To: Participants of the Environment Canada Proficiency Testing (PT) Program Re: Distribution of the Final Report for PT Study 0094 (June to September 2009) Dear Participant,
We thank you for your co-operation and punctual responses with respect to this study. It is the aim of the PT program to give prompt evaluations and reports, and effective remedial assistance. Our PT Program is accredited by the American Association for Laboratory Accreditation (A2LA) and conforms to ILAC G13:2007, Guidelines for the Requirements for the Competence of Providers of Proficiency Testing. The scope of accreditation (A2LA 2867.01) can be viewed on the A2LA website (http://www.a2la.org/scopepdf/2867-01.pdf). This final report includes results and evaluations for trace elements in natural waters. The evaluation includes systemic bias and precision, a laboratory proficiency appraisal and a summary of z-scores. The reported data for sample #8, silver (47095) has not been assessed as this sample parameter did not meet the stability criteria for the PT program. The flagging criteria, stipulated in ISO 13528:2005, Annex C, are calculated separately for each study. Each laboratory is encouraged to compare its results and evaluations with others. A complete listing of all laboratory results is included. Laboratory managers are encouraged to discuss the attached report openly with those who manage their programs and those who use their laboratory data. Systemic bias is a major fault whose root cause can be uncovered. Systemic bias and its degree are given for each parameter in the Data Summary. In the event you disagree with any of our data evaluations, please contact us and we will discuss the item with you. The matter may also be brought forward to our annual Advisory Group meeting. The laboratories listed in this report submitted their data with a confidential laboratory code. This confidentiality is fully respected by our staff. Access to these codes is possible through the relevant laboratories or program authorities. Should you have any questions or comments regarding this study, please contact us at your earliest convenience. Your comments are an instrumental part of the improvement process to our PT program. Sincerely, Cheryl Tinson Study Coordinator
Attachments (2) 1) Laboratory Proficiency Appraisal 2) Z-Score Summary
Information and Quality Management Proficiency Testing Program
Inorganic Environmental Substances

WSTD Contribution No. 09-065
Environment Canada Proficiency Testing Program
Final Report
for
Trace Elements in Water
PT Study 0094* – June to September 2009
Contributors
C. Tinson - Study Coordinator J. Simser - Quality Assurance Chemist
H. Agemian - Chief, Information and Quality Management
Information and Quality Management Water Science and Technology Directorate
Burlington, Ontario, CANADA <[email protected]>
September 2009
*companion studies: Rain and Soft Waters: WSTD Contribution No. 09-063; Major Ions and Nutrients, Total Phosphorus and Turbidity in Water: WSTD Contribution No. 09-064;
Trace Elements in Sediment: Contribution No. 09-066

Version 3.0 2009-09-10
Information and Quality Management Proficiency Testing Program
Inorganic Environmental Substances
Environment Canada Proficiency Testing Program
Program Description: Environment Canada (EC) provides accredited proficiency testing (PT) studies for a wide range of inorganic constituents in water. These PT Studies are designed to quantify laboratory performance and improve the quality of environmental data. Reports produced from the client data provide a powerful tool for the continual improvement of the quality of analytical results. The EC PT program includes:
• all lab codes are strictly confidential • two months to analyze and submit laboratory data • preliminary data assessment is sent three weeks after results are due • laboratory proficiency appraisals are sent to participants • z-score summaries are sent to participants • a final report is mailed to participants and concludes the study
The studies are offered twice a year and consist of six 'sample sets' per study with ten samples in each set (see Table 1). The samples are prepared in natural background waters from lakes, rivers or rainwater, and are fortified or preserved as necessary. The trace elements in water samples are generally divided to reflect both low and high concentration ranges. Participating laboratories submit results for parameters they routinely analyze. Analytical results are submitted electronically for assessment.
Table 1 'Sample Sets' offered in the Summer and Winter Studies
SUMMER STUDY WINTER STUDY
1. rain and soft waters (RN) 2. major ions and nutrients (MI) 3. trace elements in water (TE) 4. total phosphorus in water (TP) 5. turbidity in water (TU) 6. (a)trace elements in sediment (SED)*
1. rain and soft waters (RN) 2. major ions and nutrients (MI) 3. trace elements in water (TE) 4. total phosphorus in water (TP) 5. turbidity in water (TU) 6. (b)total mercury in water (HG)
*five samples per set PT study reports feature tabulation of all results and provide extensive evaluations. All analytical and data results are listed in the data summary. Of particular interest to laboratories, proficiency is ranked in terms of the number of biased parameters (systemic bias) and flagged results (precision measurement). Each laboratory receives a formal appraisal and z-score summary indicating the proficiency for each parameter submitted. The Environment Canada PT program conforms to the requirements of the American Association for Laboratory Accreditation (A2LA). The program meets the ILAC G-13:2007 Guidelines for the Requirements for the Competence of Providers of Proficiency Testing. Environment Canada is the A2LA accredited Proficiency Testing Provider with scope of accreditation 2867.01.
Version 3.0 2009-09-10
Information and Quality Management Proficiency Testing Program
Inorganic Environmental Substances
Programme d’essais d’aptitude d’Environnement Canada
Description du programme: Environnement Canada offre un programme accrédité d'études d’essais d’aptitude (EA) pour un large éventail de substances inorganiques présentes dans l'eau. Ces études sont conçues de façon à quantifier la performance des laboratoires et à améliorer la qualité des données sur l’environnement. Les rapports établis à partir des données des clients constituent un outil très puissant d'amélioration permanente de la qualité des résultats d'analyse. Le programme de EA d’Environnement Canada prévoit :
• la stricte confidentialité de tous les codes de laboratoire; • une période de deux mois pour l’analyse et la présentation des données de laboratoire; • la communication d’une évaluation préliminaire des données trois semaines après la date prévue de
présentation des résultats; • la communication aux participants des évaluations de compétences; • la communication aux participants des résumés des scores z; • l’envoi par la poste d’un rapport final des données, qui met fin à l’étude.
Les études peuvent être réalisées deux fois par an et chaque étude comporte six « ensembles d'échantillons » formés de dix échantillons (voir le tableau 1). Les échantillons sont préparés à l’aide d’eau de lacs, de cours d’eau ou de pluie représentative des conditions naturelles de fond et sont au besoin enrichis ou préservés. Les éléments traces des échantillons sont généralement répartis de façon à refléter des gammes de concentrations faibles et élevées. Les laboratoires participants présentent les résultats obtenus pour les paramètres qu’ils analysent généralement. Les résultats d’analyse sont soumis par voie électronique aux fins d’évaluation.
Tableau 1 « Ensembles d’échantillons » offerts pour les études d’été et d’hiver
ÉTUDE D’ÉTÉ ÉTUDE D’HIVER 1. eau de pluie et eau douce (EP-ED) 2. principaux ions et substances nutritives (PI) 3. éléments traces dans l’eau (ET) 4. phosphore total dans l’eau (PT) 5. turbidité dans l’eau (TU) 6. (a)éléments traces dans les sédiments (ETS)*
1. eau de pluie et eau douce (EP-ED) 2. principaux ions et substances nutritives (PI) 3. éléments traces dans l’eau (ET) 4. phosphore total dans l’eau (PT) 5. turbidité dans l’eau (TU) 6. (b)mercure total dans l’eau (MT)
*cinq échantillons par ensemble Les rapports des études de EA présentent tous les résultats sous forme de tableaux et des évaluations détaillées. Tous les résultats obtenus pour les analyses et les données sont présentés dans l’annexe des données. Le niveau d’aptitude est indiqué en fonction du nombre de paramètres présentant un biais (biais systématique) et de résultats anormaux (mesure de l’exactitude), ce qui est particulièrement intéressant pour les laboratoires. Chaque laboratoire reçoit une évaluation formelle et un résumé du score z indiquant le niveau d’aptitude pour chacun des paramètres présentés. Le programme EA d’Environnement Canada satisfait aux exigences du ILAC G13:2007 du l'association américaine pour l'accréditation de laboratoire (A2AL). Environnement Canada est le fournisseur de services d'essais d'aptitude avec la portée d’accréditation 2867.01.

Management Perspective The Information and Quality Management Group of Environment Canada (EC) provides a Proficiency Testing (PT) program for inorganic substances in water at environmental levels. This program offers parameters and concentration ranges not covered by any other PT program in Canada. Participation in these PT studies assists laboratories in assuring the quality of analytical results. Quality assured analytical results are critical when providing scientific advice. Laboratories receive a preliminary data assessment which discloses systemic bias and precision. The final reports provide a complete listing of current and historical performance. Individual proficiency appraisals indicate areas and parameters where remedial action is required to improve accuracy and performance. In this way, the PT studies are an effective means to improve data quality. Participants include EC laboratories, public and private laboratories in Canada and around the world.
v3.1 2009-09-10

Perspective de gestion Le Groupe de la gestion de l'information et de la qualité d’Environnement Canada (EC) offre un programme d’essais d’aptitude (EA) pour l’analyse des substances inorganiques présentes dans l’eau aux concentrations normales dans l’environnement. Ce programme vise des paramètres et des gammes de concentrations dont l’analyse n’est offerte par aucun autre programme du genre au Canada. La participation à ces études de EA aide les laboratoires à garantir la qualité de leurs résultats d’analyse. L’assurance de la qualité des résultats d’analyse est un élément essentiel de la prestation d’avis scientifiques. Les laboratoires reçoivent tout d’abord une évaluation préliminaire des données qui fait état des biais systémiques et des erreurs. Les rapports finaux donnent un état détaillé de la performance actuelle et antérieure. Des évaluations individuelles de la performance précisent les secteurs et les paramètres pour lesquels des mesures correctives doivent être prises pour améliorer l’exactitude et la performance. Les études de EA constituent ainsi un moyen efficace d’améliorer la qualité des données. Des laboratoires d’EC de même que des laboratoires publics et privés au Canada et à l’étranger participent à ce programme.
v3.1 2009-09-10

Abstract Interlaboratory proficiency testing (PT) studies are an important part of assuring the accuracy and comparability of analytical results. In this study, results are evaluated for systemic bias and precision. Systemic bias is tested with the non-parametric method of Youden and precision is tested with the “robust analysis algorithm A” found in Annex C of ISO 13528:2005. The total of flagged results and biased methods gives the proficiency rating for each laboratory. The former is extremely important for comparing data sets from different origins and the latter measures the reliability of the data. Proficiency ratings for laboratories are given in relative terms. In real terms, laboratories with good performance have few flagged results and laboratories with poor performance may have many flagged results. Results are summarized in individual laboratory appraisals and z-score summaries, which are sent to the laboratory managers. The PT program provides an objective, third-party performance assessment as a tool to help laboratories generate reliable and accurate analytical measurements.
V3.1 2009-09-10

Résumé Les programmes d’essais d’aptitude (EA) sont un élément important de l’assurance de l’exactitude et de la comparabilité des résultats d’analyse. Dans le cadre de ces études, les résultats font l’objet d’une évaluation de leur biais systémique et de leur exactitude. Le biais systémique est testé par la méthode non paramétrique de Youden et l’exactitude par l’algorithme A d’analyse robuste présenté dans l’annexe C de la norme ISO 13528:2005. La cote des compétences, ou d’aptitude, de chaque laboratoire est donnée par le total des résultats recensés anormaux et des méthodes biaisées. Le premier élément est extrêmement important pour la comparaison des ensembles de données d’origines diverses et le second détermine la fiabilité des données. Les cotes des compétences des laboratoires sont assignées de façon relative. Concrètement, les laboratoires dont la performance est bonne présentent peu de résultats anormaux tandis que les laboratoires dont la performance est mauvaise présentent plusieurs résultats anormaux. Les résultats de chaque laboratoire sont résumés par des évaluations individuelles et un résumé des scores z est communiqué aux gestionnaires du laboratoire. Le programme EA est un outil objectif d’évaluation de la performance par un tiers qui aide les laboratoires à effectuer des mesures d’analyse fiables et exactes.
V3.1 2009-09-10
2009-09-08FPTM Program Name: 0094 Study Code: Range of Samples: 1 to 10
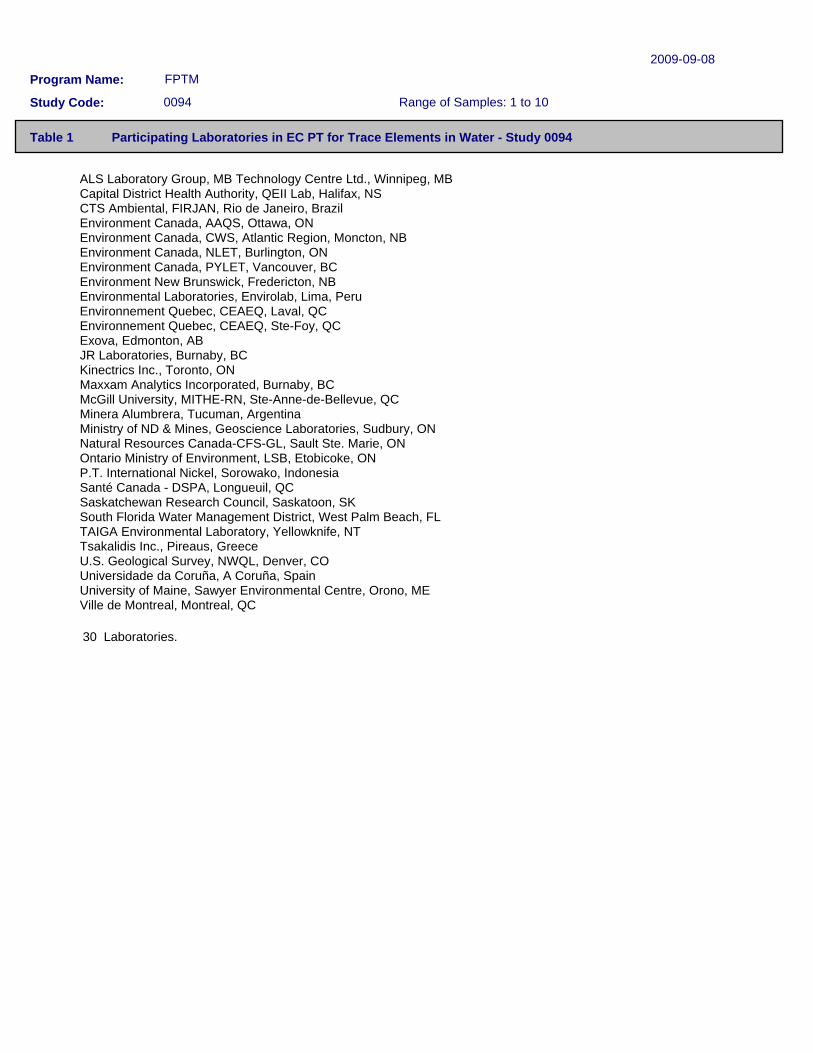
Table 1 Participating Laboratories in EC PT for Trace Elements in Water - Study 0094
ALS Laboratory Group, MB Technology Centre Ltd., Winnipeg, MBCapital District Health Authority, QEII Lab, Halifax, NSCTS Ambiental, FIRJAN, Rio de Janeiro, BrazilEnvironment Canada, AAQS, Ottawa, ON Environment Canada, CWS, Atlantic Region, Moncton, NBEnvironment Canada, NLET, Burlington, ONEnvironment Canada, PYLET, Vancouver, BCEnvironment New Brunswick, Fredericton, NBEnvironmental Laboratories, Envirolab, Lima, PeruEnvironnement Quebec, CEAEQ, Laval, QCEnvironnement Quebec, CEAEQ, Ste-Foy, QCExova, Edmonton, AB JR Laboratories, Burnaby, BC Kinectrics Inc., Toronto, ON Maxxam Analytics Incorporated, Burnaby, BCMcGill University, MITHE-RN, Ste-Anne-de-Bellevue, QCMinera Alumbrera, Tucuman, Argentina Ministry of ND & Mines, Geoscience Laboratories, Sudbury, ONNatural Resources Canada-CFS-GL, Sault Ste. Marie, ONOntario Ministry of Environment, LSB, Etobicoke, ONP.T. International Nickel, Sorowako, IndonesiaSanté Canada - DSPA, Longueuil, QC Saskatchewan Research Council, Saskatoon, SKSouth Florida Water Management District, West Palm Beach, FLTAIGA Environmental Laboratory, Yellowknife, NTTsakalidis Inc., Pireaus, Greece U.S. Geological Survey, NWQL, Denver, COUniversidade da Coruña, A Coruña, Spain University of Maine, Sawyer Environmental Centre, Orono, MEVille de Montreal, Montreal, QC
30 Laboratories.

2009-09-02 38 FPTM Program Name: Number of Labs:
1 to 10 0094 Study Code: Range of Samples:
Table 2 Laboratory Performance Scores - EC PT for Trace Elements in Water - Study 0094
Systemic Bias Flagged Results
280230280180270290
79150170190
90270230180160260260280180240150
20160230250240230210280240240160280190
30240239
90
0.180.220.540.831.111.211.271.331.471.581.671.852.613.063.444.234.426.616.676.677.007.508.449.789.80
10.4210.8714.5215.7116.8717.7121.5623.0423.9538.3340.0046.3462.78
0.18 0.22 0.54 0.83 1.11 1.21 1.27 1.33 1.47 1.58 1.67 1.85 0.43 3.06 0.31 2.31 0.58 1.25 1.11 0.42 3.67 7.50 2.19 1.09 5.80 4.17 6.52 7.38 6.79 6.46 3.13 9.06
14.11 13.42
5.00 23.33 21.34 29.44
11336724563
102
111
123742
11375
29203031383115297951
3112102
53
0.000.000.000.000.000.000.000.000.000.000.000.002.170.003.131.923.855.365.566.253.330.006.258.704.006.254.357.148.93
10.4214.5812.50
8.9310.5333.3316.6725.0033.33
0 0 0 0 0 0 0 0 0 0 0 0 1 0 1 1 2 3 2 3 1 0 2 4 2 3 2 3 5 5 7 4 5 4 2 8
12 6
28 23 28 18 27 29
9 15 17 19
9 27 23 18 16 26 26 28 18 24 15
2 16 23 25 24 23 21 28 24 24 16 28 19
3 24 24
9
F003 F032d F024 F193 F011 F022 F223 F026 F169 F223b F207 F060 F032c F021b F014 F020 F015 F139 F021c F010 F032g F273 F069b F021 F196 F069 F068 F248 F183 F009 F158 F032a F154 F042 F032 F186 F287 F144
% Score (Sum of Parameters Biased & Results Flagged)
ResultsFlagged
(50%)
No. ofFlags
Assigned
No. of Results
Reported
ParametersBiased
(50%)
No. ofParameters
Biased
No. ofParameters
Analyzed
Lab Code
Laboratory Performance Rating
% Score*Rating
GoodSatisfactory
Moderate Poor
0 - 5> 5 - 12.5 > 12.5 - 30
> 30
*Sum of Parameters Biased & Results Flagged

2009-09-10 FPTM Program Name:
0094 Study Code:
Moderate 17.1 17.7 9.2 16.5 18.1 20.2 13.5 18.3 21.5 15.2 11.9 Moderate 23.0 23.0
Poor 51.2 62.8 39.6 80.0Satisfactory 8.9 6.6 17.9 17.6 11.1
25.0 1.1 13.8 4.4 10.0 7.8 3.7
Satisfactory 8.4 8.4Moderate 13.5 10.4 11.3 13.5 20.2
Satisfactory 5.2 10.9 1.1 20.2 4.1 6.4 3.4 23.1 3.9 Satisfactory 9.6 1.9 11.9 8.7 13.9
0.7 12.2 12.4 9.6 3.8
Moderate 21.8 24.0 36.0 48.8 10.0 21.8 12.3 24.1 13.9 2.6
12.0 22.9
15.8 Satisfactory 7.0 7.0
Good 2.4 0.2 2.4 0.0 33.4Good 4.9 2.6 0.0 6.5 8.0 3.3
Satisfactory 7.2 21.6 1.9 3.1 7.9Satisfactory 11.7 38.3 10.0 13.3 6.7 5.0 1.3 16.8
Good 1.5 1.3 0.7 5.0 1.0 1.7 3.0 5.5 1.2 8.4
Satisfactory 8.9 0.5 2.5 5.2 11.1 28.4 18.2 14.5Good 4.0 1.2 2.4 9.3 7.8
8.9 0.7
21.7 7.2
16.7 4.6
0.9 3.5 2.4 4.6 6.2 39.6 7.7 4.9
27.1
Satisfactory 6.7 6.7Good 3.9 3.1 3.9 21.5
Satisfactory 10.6 9.8 2.2 36.7 11.3 9.0 14.2 17.0Satisfactory 8.5 4.2 8.7 6.4 5.6 6.2 21.7 11.7Satisfactory 9.0 4.4 2.3 8.1 13.5
36.5 11.8
4.0
9.4 15.0 39.0 8.7Good 2.9 3.4 2.2 6.3 1.6 6.3 0.0
Moderate 19.1 1.1 17.4 29.4 40.7 28.3 6.7 22.6Good 3.6 6.7 2.3 3.1 2.1 1.1 7.1 2.9
Moderate 17.2 16.9 13.5 22.2 20.5 17.5 16.2 7.7GoodF003
F009 F010 F011 F014 F015 F020 F021 F021b F021c F022 F024 F026 F032 F032a F032c F032d F032g F042 F060 F068 F069 F069b F139 F144 F154 F158
1.1 0.2 0.4 0.4 1.4 0.4 3.2 8.1Summer 2009Winter 2008Summer 2008Summer 2007Winter 2006Summer 2006
% Score Per Study (Sum of Parameters Biased & Results Flagged)
Five-Year Historical Laboratory Performance - EC PT for Trace Elements in Water - Study 0094
0094009300920091Winter 2007
0.7 30.4
9.4 17.2
0090008900880087 Winter 2005
0086 Summer 2005
8.8 25.1
4.2 20.8
2.4 14.9
8.3 8.1
0085 Winter 2004
5.0 11.4
5.0 11.0 16.1
7.0 10.5
5.1
Table 3
RATINGMEDIANLAB CODE

2009-09-10 FPTM Program Name:
0094 Study Code:
Table 3 Five-Year Historical Laboratory Performance - EC PT for Trace Elements in Water - Study 0094
LAB CODE % Score Per Study (Sum of Parameters Biased & Results Flagged) MEDIAN RATING
0085 Winter 2004
0086 Summer 2005
0087 Winter 2005
0088 0089 0090 0091Winter 2007
0.3
0092 0093 0094Summer 2006 Winter 2006 Summer 2007 Summer 2008 Winter 2008 Summer 2009
F169 F183 F186 F193 F196 F207 F223 F223b F248 F273 F287 Interlab Median
0.7 0.0 1.2 0.0 0.3 1.5 0.3 Good 15.4 12.8 8.5 15.7 14.1 Moderate
40.0 40.0 Poor 37.9 4.0 6.7 7.6 0.8 1.8 10.5 0.3 0.8 4.0 Good
9.8 9.8 Satisfactory 9.1 5.6 6.3 10.7 8.2 1.7 7.3 Satisfactory
19.6 17.0 1.8 5.6 1.3 5.6 Satisfactory 1.6 1.6 Good
19.5 10.2 21.0 14.5 17.0 Moderate 7.5 7.5 Satisfactory
46.3 46.3 Poor 11.0 8.4 11.1 8.9 7.6 6.4 7.4 8.6 2.5 6.7
Laboratory Performance Rating
Rating % Score
GoodSatisfactory
Moderate Poor
0 - 5> 5 - 12.5 > 12.5 - 30
> 30

Program Name: FPTM 2009-09-02
Study Code: 0094
Table 4 Sample Design - EC PT for Trace Elements in Water - Study 0094
276.500 TMDA-64.2 10
94.1 TMDA-62.2 9
392 TMDA-65 8
112 TM-16 7
34.7 TM-09 6
26.8 TM25.4 5
7.07 TMRain-04 4
17.4 TM-15.2 3
15.0 TM-26.4 2
8.60 TM-23.4 1
Copper (µg/L) Sample Number Sample Name

FPTM 2009-09-02 Program Name: 1 to 10Range of Samples:
0094 Study Code:
Summary of Interlaboratory Median Values - EC PT for Trace Elements in Water - Study 0094Table 5
TM-23.4 Sample 1
TM-26.4Sample 2
TM-15.2Sample 3
TMRain-04Sample 4
TM25.4Sample 5
TM-09Sample 6
TM-16Sample 7
TMDA-65Sample 8
TMDA-62.2Sample 9
TMDA-64.2 Sample 10
Aluminum (ug/L) 94.5 74.0 33.0 2.00 29.9 31.0 54.1 360 118 290.500 Antimony (ug/L) 3.2700 2.8300 16.3000 0.366 23.7000 4.08 15.2 197 62.80 130Arsenic (ug/L) 8.10 8.77 15.8 1.13 27.3 20.1 41.5 200 57.3 162Barium (ug/L) 14.3 26.2 13.3 0.853 27.0 57.5 210 400 114 290.500 Beryllium (ug/L) 2.02 3.44 15.1 0.383 25.9 5.99 8.00 185 56.0 159.500 Bismuth (ug/L) 3.34 2.72 13.20 0.622 19.0 1.70 5.20 169 51.4 133Boron (ug/L) 18.3 46.4 23.8 1.200 40.9 31.2 47.5 398 124 286Cadmium (ug/L) 2.90 7.14 13.0 0.520 23.7 3.87 14.8 303 93.3 266Chromium (ug/L) 6.90 12.4 16.5 0.900 24.0 4.09 13.0 403 94.3 292Cobalt (ug/L) 7.12 8.15 15.1 0.244 27.6 2.00 8.80 383 95.8 257Copper (ug/L) 8.60 15.0 17.4 7.07 26.8 34.7 112 392 94.1 276.500 Gallium (ug/L) 2.09 5.40 0.100 0.022 8.82 3.00 6.78 0.0848 33.8 52.6Iron (ug/L) 15.0 21.1 26.0 24.9 31.0 118 210 418 118 308Lead (ug/L) 3.00 10.40 11.9 0.335 27.0 8.76 24.0 423 96.6 285Lithium (ug/L) 2.09 5.00 15.0 0.528 24.4 4.26 9.96 180 60.0 154Manganese (ug/L) 8.85 10.9 18.1 6.74 25.4 9.98 28.5 412 95.0 295.500 Molybdenum (ug/L) 4.18 7.62 14.2 0.217 27.0 12.5 30.9 384 101 292.500 Nickel (ug/L) 4.98 11.20 17.7 0.906 16.0 19.5 68.7 391 97.0 263.500 Rubidium (ug/L) 0.753 10.7 0.760 0.0300 19.6 4.52 12.3 0.433 15.8 30.8Selenium (ug/L) 4.60 5.35 14.9 0.810 29.4 14.7 22.8 198 53.5 153Silver (ug/L) 4.80 6.80 11.00 0.100 21.8 3.80 7.50 12.00 12.0000 Strontium (ug/L) 112 107 112 1.800 73.9 107 253 390 150 644Thallium (ug/L) 3.98 5.30 18.1 0.395 30.9 2.00 6.73 202 52.1 148Tin (ug/L) 2.72 5.71 15.0 0.750 23.8 2.90 8.46 387 108.5 291Titanium (ug/L) 3.18 6.10 14.7 0.507 25.6 8.19 12.0 188 58.6 128.500 Tungsten (ug/L) 5.05 6.38 6.88 0.042 9.95 1.94 3.36 0.115 0.094 0.080Uranium (ug/L) 5.12 7.57 15.6 0.300 27.7 1.99 4.88 209 56.6 145Vanadium (ug/L) 1.90 12.7 13.2 0.700 27.5 3.00 15.2 370 116 289Zinc (ug/L) 2.40 38.0 35.0 8.40 44.0 46.1 100 398 120 312
Parameters
Appendix A
Glossary of Terms and Definitions

Environment Canada Proficiency Testing Program
Glossary of Terms and Definitions A. Statistics listed in Data Summary (Appendix B)
1. Assigned Value The median value of test results for a parameter and sample 2. R-Std Dev Robust Standard Deviation [1] 3. Acceptable Limits See ‘Limits & Flags’ and Table 1 4. Warning Limits See ‘Limits & Flags’ and Table 1 5. Action Limits See ‘Limits & Flags’ and Table 1 6. N The number of usable test results for calculating the assigned value
B. Calculation of Performance Statistics (Appendix B)
Laboratory Bias: Laboratory Bias [2] D = x-X, where D is the deviation, x is the test result and X is the
assigned value. This deviation is normalized with the robust standard deviation (R-Std Dev) and evaluated by the z-score [3] (see attachment).
Limits & Flags: Acceptable Limits/No Flags: When a test result is within 2 R-Std Dev of the assigned value,
flags are not assigned (see Table 1).
Warning Limits/Warning Flags: When a test result is between 2 and 3 R-Std Dev, the flags ‘WH’ or ‘WL’ indicate a WARNING flag, for a high or low result respectively (see Table 1). Action Limits/Action Flags: When a test result deviates by more than 3 R-Std Dev from the assigned value, the flags ‘AH’ or ‘AL’ indicate an ACTION flag, high or low respectively (see Table 1). Table 1 Evaluating test results, determining limits and assigning flags [2]
Criteria Limits Flags
Assigned value ± 2 ^σ * Acceptable Limits No Flag
2 ^σ - 3
^σ from assigned value Warning Limits Warning Flag (W)
> 3^σ from assigned value Action Limits Action Flag (A)
^ *σ is the R-Std Dev
Systemic Bias: Systemic bias is indicated when a laboratory’s test results for an individual parameter are
ranked, by the Youden non-parametric analysis [4], to be consistently and significantly higher or lower than the assigned value. Ranks are assigned to each test result for each sample, from 1 for the lowest, to N for the highest, where N is the number of usable test results. These ranks are totalled for each laboratory (Total Rank), and divided by the number of samples ranked (No. Samples Ranked). Total Rank and Average Rank for each laboratory, are displayed on page 2 of the Data Summary. The Overall Average Rank for each parameter is shown at the bottom of the same page. Systemic bias may be indicated by the Youden rankings even when the test results have not been flagged (W or A) for deviation from the assigned value.
No. Samples This is the number of test results used to calculate systemic bias. A laboratory must Ranked: report five or more test results (not including ‘<’) and there must be ten or more participating
laboratories. The two measured components of ‘systemic’ bias are 1) Bias Blank and 2) Bias % Slope.
These components are illustrated in Figure 1: Parameter Performance. All ‘systemic’ biases are correctable with the investigation of the following two analytical components.
v1.2 September 2008

1) Bias Blank: The first component is the y-intercept of the linear regression plot (-0.0329 in Figure 1). These bias blanks are stated in the Data Summary and Evaluations for each parameter.
2) Bias % Slope: The second measured component is the % deviation of the laboratory test results versus the
assigned values for a parameter. This is calculated as [ (m-1) x 100 ], where 1 is the slope of the “ideal” line (assigned values) and m is the slope of the linear regression plot (laboratory test results). The Bias % Slope in Figure 1 is minus 1.55 per cent (-1.55%). For most parameters, a Bias % Slope greater than the absolute value of 5 is considered unacceptable and requires action.
v1.2 September 2008
Figure 1: Parameter Performance
y = 0.9845x - 0.0329
-0.1
-0.05 0
0.05
0.1
0.15
0.2
0.25
0.3
0.35
0 0.0 0. 0.1 0. 0.2 0. 0.3
Assigned Value (mg/L)
Ideal y = x
Systemic bias, low
Test Result (mg/L)
Bias Statement: Systemic bias is noted with the ‘BIASED HIGH’ or ‘BIASED LOW’ notations. An asterisk
with the statement indicates that the bias is considered minor, yet worthy of evaluation. The minor biases are not recorded in the database and are not noted in the laboratory proficiency appraisal (see attachment). In Table 2 of the Final Report (Laboratory Performance Scores), systemic biases are calculated as the equivalent of five flagged values.
Method Coding: Method codes are an important part of quality assurance. These definitions are provided on
the Data Reporting Forms to assist with uniform descriptions. C. Attachments included with the Final Report
1. Z-Score Summaries [3] 2. Laboratory Proficiency Appraisal (see Table 2 for definitions)
References: [1] ISO 13528:2005(E), Statistical Methods for the use in Proficiency Testing by Interlaboratory Comparisons, Annex C, Robust Analysis, Section C.1: Algorithm A, p64. [2] ISO 13528:2005(E), Statistical Methods for the use in Proficiency Testing by Interlaboratory Comparisons, Calculation of Performance Statistics, Section 7.1.1 and 7.1.2, p18-19. [3] ISO 13528:2005(E), Statistical Methods for the use in Proficiency Testing by Interlaboratory Comparisons, z-scores, Section 7.4.1 and 7.4.2, p25-26. [4] Ranking Laboratories by Round-Robin Tests, W.J. Youden, Precision Measurement and Calibration, H.H. Ku, Editor, NBS Special Publication 300-Volume 1, U.S. Government Printing Office, Washington, D.C., 1969.

Appendix B
Data Summary

FPTM STUDY 0094 DATA SUMMARY 2009-09-02 PAGE 1 PARAMETER: 13095 Aluminum ug/L WATER SCIENCE & TECHNOLOGY ENVIRONMENT CANADA EC PT for Trace Elements in Water --------------------------------- SAMPLE 1= 2= 3= 4= 5= 6= 7= 8= 9= 10= TM-23.4 TM-26.4 TM-15.2 TMRain-04 TM25.4 TM-09 TM-16 TMDA-65 TMDA-62.2 TMDA-64.2 LAB NO LAB RESULT LAB RESULT LAB RESULT LAB RESULT LAB RESULT LAB RESULT LAB RESULT LAB RESULT LAB RESULT LAB RESULT ---------- ---------- ---------- ---------- ---------- ---------- ---------- ---------- ---------- ---------- F003 97.0 77.3 34.3 2.18 30.9 31.3 55.0 345. 117. 287. F009 97. 78. 35. <10. 31. 32. 58. 376. 125. 305. F010 92. 74. 33. 1.9 30. 31. 52. 370. 123. 295. F011 88.7 73.6 32.1 2.0 28.7 29.4 53.4 347. 116. 280. F014 93. 72. 33. 2. 29. 32. 53. 365. 115. 293. F015 98.2 77.7 34.7 2.2 31.4 32.5 56.7 361. 123. 291. F020 107. WH 86.1 AH 39.2 WH 2.4 34.8 WH 36.2 WH 63.7 AH 423. AH 135. WH 342. WH F021 93.4 68.3 32.6 1.8 29.8 29.5 51.7 360. 112. 287. F021b 92. 74. 33. <4. 31. 31. 53. 358. 115. 285. F022 86.9 70.7 33.1 3.01 29.7 31.5 56.9 360. 111. 283. F024 96.0 73.5 33.4 2.1 29.1 30.5 54.3 364. 118. 291. F026 94. 75. 35. <5. 32. 33. 56. 376. 122. 297. F032a 101. 78.6 37.3 3.6 32.4 34.2 58.4 379. 126. 311. F032c 94.5 72.7 32.5 2.0 29.2 29.9 52.2 345. 113. 281. F032d 92.5 72.3 32.2 1.93 30.0 30.2 53.0 359. 115. 284. F032g 95. 76. 36. 6. AH 33. 33. 56. 356. 115. 283. F042 97.7 75.9 36.9 <10. 32.4 33.4 57.7 409. WH 130. 327. WH F060 97.0 75.9 35.0 <5. 31.0 31.9 54.8 364. 118. 290. F068 94. 74. 29. 1.9 26. 27.6 53.2 330. 106. 264. F069 81.3 WL 66.4 WL 30.2 <4.0 27.6 28.2 48.7 350. 104. 263. F069b 93.4 66.8 <50.0 <50.0 <50.0 <50.0 <50.0 374. 113. 292. F139 98.3 77.9 34.1 <0.05 WL 29.5 31. 55.4 355. 117. 321. F144 99.9 92.3 AH 51.6 AH 5.37 AH 39.0 AH 44.3 AH 72.2 AH 332. 149. AH 326. F154 93.3 72.4 32.8 <2.0 29.3 31. 52.7 363. 285. AH 118. AL F158 94.6 75.8 34.0 3.8 30.4 31.2 54.1 395. 121. 299. F169 96.1 74.8 31.1 1.85 25.7 WL 26.6 WL 54.4 375. 121. 296. F183 94.1 74.1 32.1 2.79 29.2 31.4 52.9 362. 118. 275. F186 94. 74. 33. 1.0 30. 31. 54. 353. 118. 285. F193 89.5 71.0 31.5 <2.0 28.6 29.7 52.1 351. 113. 282. F196 93. 73. 33. <20. 29. 30. 54. 353. 116. 282. F207 100. 76. 33. <4. 28. 29. 55. 383. 123. 315. F223b 100. <100. <100. <100. <100. <100. <100. 350. 120. 280. F248 106. WH 86.1 AH 38.9 WH <25.0 34.6 WH 36.0 WH 62.3 WH 394. 126. 313. F287 59. AL 43. AL <10. AL 40. AH <10. AL <10. AL 27.2 AL 290. AL 79. AL 0.220 AL ASSIGNED VALUE * 94.5 74.0 33.0 2.00 29.9 31.0 54.1 360 118 290.500 R-STD DEV * 4.31 3.63 2.21 1.031 2.01 2.06 2.73 17.4 7.1 18.8438 ACCEPTABLE LIMITS(+-) * 8.62 7.26 4.42 2.062 4.02 4.12 5.46 34.8 14.2 37.6876 WARNING LIMITS(+-) * 8.62- 12.93 7.26- 10.89 4.42- 6.63 2.062- 3.0934.02- 6.03 4.12- 6.18 5.46- 8.19 34.8- 52.2 14.2- 21.3 37.6876- 56. ACTION LIMITS(<>) * 12.93 10.89 6.63 3.093 6.03 6.18 8.19 52.2 21.3 56.5314 N * 34 33 31 20 31 31 32 34 34 34 * NOTE: SEE GLOSSARY FOR DEFINITIONS
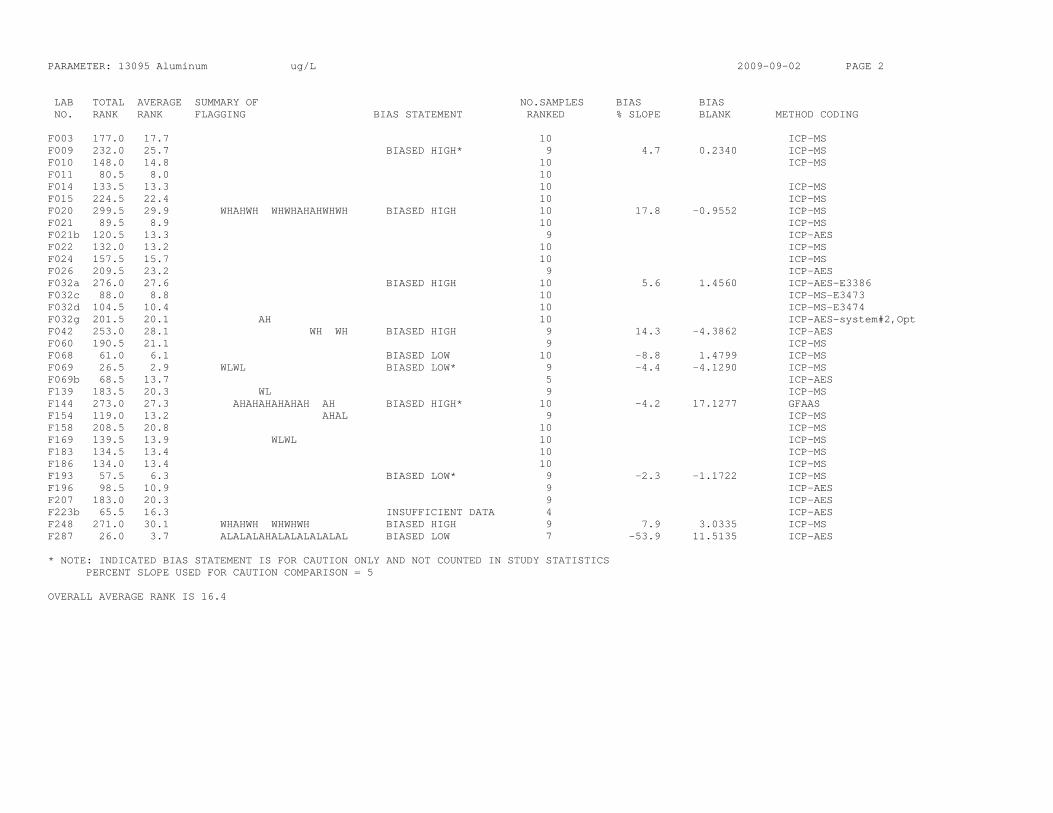
PARAMETER: 13095 Aluminum ug/L 2009-09-02 PAGE 2 LAB TOTAL AVERAGE SUMMARY OF NO.SAMPLES BIAS BIAS NO. RANK RANK FLAGGING BIAS STATEMENT RANKED % SLOPE BLANK METHOD CODING F003 177.0 17.7 10 ICP-MS F009 232.0 25.7 BIASED HIGH* 9 4.7 0.2340 ICP-MS F010 148.0 14.8 10 ICP-MS F011 80.5 8.0 10 F014 133.5 13.3 10 ICP-MS F015 224.5 22.4 10 ICP-MS F020 299.5 29.9 WHAHWH WHWHAHAHWHWH BIASED HIGH 10 17.8 -0.9552 ICP-MS F021 89.5 8.9 10 ICP-MS F021b 120.5 13.3 9 ICP-AES F022 132.0 13.2 10 ICP-MS F024 157.5 15.7 10 ICP-MS F026 209.5 23.2 9 ICP-AES F032a 276.0 27.6 BIASED HIGH 10 5.6 1.4560 ICP-AES-E3386 F032c 88.0 8.8 10 ICP-MS-E3473 F032d 104.5 10.4 10 ICP-MS-E3474 F032g 201.5 20.1 AH 10 ICP-AES-system#2,Opt F042 253.0 28.1 WH WH BIASED HIGH 9 14.3 -4.3862 ICP-AES F060 190.5 21.1 9 ICP-MS F068 61.0 6.1 BIASED LOW 10 -8.8 1.4799 ICP-MS F069 26.5 2.9 WLWL BIASED LOW* 9 -4.4 -4.1290 ICP-MS F069b 68.5 13.7 5 ICP-AES F139 183.5 20.3 WL 9 ICP-MS F144 273.0 27.3 AHAHAHAHAHAH AH BIASED HIGH* 10 -4.2 17.1277 GFAAS F154 119.0 13.2 AHAL 9 ICP-MS F158 208.5 20.8 10 ICP-MS F169 139.5 13.9 WLWL 10 ICP-MS F183 134.5 13.4 10 ICP-MS F186 134.0 13.4 10 ICP-MS F193 57.5 6.3 BIASED LOW* 9 -2.3 -1.1722 ICP-MS F196 98.5 10.9 9 ICP-AES F207 183.0 20.3 9 ICP-AES F223b 65.5 16.3 INSUFFICIENT DATA 4 ICP-AES F248 271.0 30.1 WHAHWH WHWHWH BIASED HIGH 9 7.9 3.0335 ICP-MS F287 26.0 3.7 ALALALAHALALALALALAL BIASED LOW 7 -53.9 11.5135 ICP-AES * NOTE: INDICATED BIAS STATEMENT IS FOR CAUTION ONLY AND NOT COUNTED IN STUDY STATISTICS PERCENT SLOPE USED FOR CAUTION COMPARISON = 5 OVERALL AVERAGE RANK IS 16.4

FPTM STUDY 0094 DATA SUMMARY 2009-09-02 PAGE 3 PARAMETER: 51095 Antimony ug/L WATER SCIENCE & TECHNOLOGY ENVIRONMENT CANADA EC PT for Trace Elements in Water --------------------------------- SAMPLE 1= 2= 3= 4= 5= 6= 7= 8= 9= 10= TM-23.4 TM-26.4 TM-15.2 TMRain-04 TM25.4 TM-09 TM-16 TMDA-65 TMDA-62.2 TMDA-64.2 LAB NO LAB RESULT LAB RESULT LAB RESULT LAB RESULT LAB RESULT LAB RESULT LAB RESULT LAB RESULT LAB RESULT LAB RESULT ---------- ---------- ---------- ---------- ---------- ---------- ---------- ---------- ---------- ---------- F003 3.30 2.88 16.3 0.269 24.0 4.10 15.2 201. 63.4 132. F009 3.6 3.0 18. WH <1. 24. 4.4 16. 201. 66. 138. F010 3.18 2.75 16.1 0.355 23.4 3.99 14.8 185. 60.2 121. F011 3.1 2.7 15.8 0.3 20.8 AL 4.0 14.3 185. 64.4 127. F014 3.4 2.9 16. <1.0 23. 4.5 15. 189. 66. 131. F015 3.2 2.72 15.9 0.355 23.6 3.96 14.9 199. 60.4 128. F020 3.28 2.83 16.4 0.35 22.6 4.01 15.3 171. WL 65.8 126. F021 3.3 2.8 16.8 0.4 25.2 4.2 15.2 206. 64.3 133. F021c 3.0 2.6 15.4 0.4 22.8 3.7 14.3 197. 62.2 129. F022 3.30 2.83 16.3 0.374 23.7 4.76 15.6 210. 60.5 129. F024 3.2 2.9 16.7 0.4 23.3 4.2 15.2 189. 64.0 132. F032 3.2 2.9 15.8 0.5 WH 23.0 3.9 14.1 195. 60.1 124. F032c 3.0 2.6 15.2 <0.5 23.2 3.8 14.2 191. 59.4 124. F032d 3.20 2.72 16.0 <1. 23.3 3.84 14.5 193. 60.4 125. F042 4.29 AH 3.00 16.8 <2. 23.7 5.18 AH 15.3 193. 64.9 131. F060 3.30 2.85 16.4 0.372 23.3 4.24 15.2 182. 60.9 124. F068 3.26 2.8 16. 0.356 24. 4.08 14.8 204. 61.6 136. F069 3.36 2.89 16.9 0.375 25.4 WH 4.13 15.5 198. 64.3 132. F139 3.20 2.76 16. 0.36 23.6 3.95 15. 198. 61.1 126. F154 3.5 2.9 17.1 <1.0 24.8 4.4 16.2 216. 140. AH 65.8 AL F158 3.4 3.0 17.0 <2. 23.9 4.2 15.8 198. 65.8 138. F183 3.90 WH 3.26 WH 18.3 WH 0.405 25.9 WH 4.76 16.6 195. 72.3 WH 139. F186 4. AH 3.5 AH 17.4 0.8 AH 24.4 4.6 16.2 207. 66.5 137. F193 3.26 2.83 15.9 <0.4 23.7 3.98 15.1 189. 61.4 129. F196 3. 3. 17. <2. 24. 4. 16. 201. 60. 137. F223b <10.0 <10.0 14.9 <10.0 24.6 <10.0 14.7 214. 65.5 139. F248 3.40 2.80 15.8 <0.50 23.1 3.60 13.9 192. 59.5 127. F287 0.0023 AL 0.0040 AL 0.0175 AL 0.267 0.0492 AL 1.63 AL 14.4 0.384 AL 1.30 AL 0.252 AL ASSIGNED VALUE * 3.2700 2.8300 16.3000 0.366 23.7000 4.08 15.2 197 62.80 130 R-STD DEV * 0.21504 0.14449 0.78316 0.0534 0.84608 0.351 0.75 10.0947 3.190 6.6326 ACCEPTABLE LIMITS(+-) * 0.43008 0.28898 1.56632 0.1068 1.69216 0.702 1.50 20.1894 6.380 13.2652 WARNING LIMITS(+-) * .43008- .645.28898- .4331.56632- 2.3.1068- .16021.69216- 2.5.702- 1.053 1.50- 2.25 20.1894- 30.6.380- 9.57013.2652- 19. ACTION LIMITS(<>) * 0.64512 0.43347 2.34948 0.1602 2.53824 1.053 2.25 30.2841 9.570 19.8978 N * 27 27 28 17 28 27 28 28 28 28 * NOTE: SEE GLOSSARY FOR DEFINITIONS

PARAMETER: 51095 Antimony ug/L 2009-09-02 PAGE 4 LAB TOTAL AVERAGE SUMMARY OF NO.SAMPLES BIAS BIAS NO. RANK RANK FLAGGING BIAS STATEMENT RANKED % SLOPE BLANK METHOD CODING F003 157.0 15.7 10 ICP-MS F009 212.0 23.5 WH BIASED HIGH* 9 3.6 0.5207 ICP-MS F010 77.5 7.7 10 ICP-MS F011 70.0 7.0 AL 10 F014 141.0 15.6 9 ICP-MS F015 99.5 9.9 10 ICP-MS F020 117.0 11.7 WL 10 ICP-MS F021 183.0 18.3 10 ICP-MS F021c 77.0 7.7 10 ICP-MS F022 167.5 16.7 10 ICP-MS F024 147.0 14.7 10 ICP-MS F032 87.5 8.7 WH 10 AAS hydride-E3089 F032c 39.5 4.3 BIASED LOW* 9 -2.8 -0.4371 ICP-MS-E3473 F032d 74.0 8.2 9 ICP-MS-E3474 F042 181.5 20.1 AH AH 9 ICP-AES F060 122.5 12.2 10 ICP-MS F068 143.0 14.3 10 ICP-MS F069 186.5 18.6 WH 10 ICP-MS F139 106.0 10.6 10 ICP-MS F154 198.5 22.0 AHAL BIASED HIGH* 9 -3.3 5.8331 ICP-MS F158 192.0 21.3 9 ICP-MS F183 243.5 24.3 WHWHWH WH WH BIASED HIGH* 10 1.6 1.8836 ICP-MS F186 244.0 24.4 AHAH AH BIASED HIGH 10 5.6 0.2637 ICP-MS F193 106.0 11.7 9 ICP-MS F196 155.0 17.2 9 ICP-AES F223b 109.5 18.2 6 ICP-AES F248 70.5 7.8 9 ICP-MS F287 15.0 1.5 ALALAL ALAL ALALAL BIASED LOW 10 -101.0 2.3049 ICP-AES * NOTE: INDICATED BIAS STATEMENT IS FOR CAUTION ONLY AND NOT COUNTED IN STUDY STATISTICS PERCENT SLOPE USED FOR CAUTION COMPARISON = 5 OVERALL AVERAGE RANK IS 13.9

FPTM STUDY 0094 DATA SUMMARY 2009-09-02 PAGE 5 PARAMETER: 33095 Arsenic ug/L WATER SCIENCE & TECHNOLOGY ENVIRONMENT CANADA EC PT for Trace Elements in Water --------------------------------- SAMPLE 1= 2= 3= 4= 5= 6= 7= 8= 9= 10= TM-23.4 TM-26.4 TM-15.2 TMRain-04 TM25.4 TM-09 TM-16 TMDA-65 TMDA-62.2 TMDA-64.2 LAB NO LAB RESULT LAB RESULT LAB RESULT LAB RESULT LAB RESULT LAB RESULT LAB RESULT LAB RESULT LAB RESULT LAB RESULT ---------- ---------- ---------- ---------- ---------- ---------- ---------- ---------- ---------- ---------- F003 8.06 8.77 15.9 1.13 26.9 19.8 41.5 200. 58.0 165. F009 9.6 AH 9.9 17. 1.6 AH 29. 22. 43. 212. 61. 171. F010 7.84 8.37 15.2 1.08 26.1 18.9 39.8 191. 52.2 152. F011 8.0 8.5 15.1 1.2 26.1 19.4 40.5 198. 56.2 158. F014 8.0 8.5 15. 1.1 26. 20. 41. 194. 57. 160. F015 8.1 8.8 15.6 1.2 27.4 20.0 41.5 191. 57.8 164. F020 7.98 8.42 15.2 1.09 27.7 19.6 41. 197. 57.1 158. F021 7.8 8.0 15.1 1.1 26.2 18.9 38.9 198. 55.5 156. F021c 8.1 8.5 15.2 1.1 26.7 19.3 41.0 199. 56.7 162. F022 8.25 8.83 15.8 1.13 27.2 20.3 42.2 202. 59.0 169. F024 8.4 8.7 15.6 1.1 27.0 19.8 41.3 202. 55.8 160. F026 <15. <15. 16. <15. 28. 21. 42. 208. 55. 159. F032 7.4 7.9 14.0 WL 1.1 24.8 18.9 37.1 WL 188. 52.1 150. F032c 8.3 9.0 16.1 1.1 28.6 20.4 42.2 211. 61.5 168. F032d 8.22 8.77 15.9 1.16 28.6 20.2 41.0 207. 59.3 166. F060 8.64 9.40 16.4 1.19 29.0 20.8 42.4 204. 59.5 167. F068 8.26 8.76 14.6 1.2 26.6 19.2 41.2 196. 55.4 156. F069 8.73 9.31 16.7 1.20 29.2 20.9 44.7 WH 205. 61.6 167. F139 8.08 8.75 15.9 1.16 26.6 20.1 41.6 197. 59.1 164. F144 10.6 AH 11.1 AH 22.1 AH 1.06 36.0 AH 28.2 AH 54.0 AH 240. AH 78.7 AH 209. AH F154 8.64 9.05 16.2 1.15 28.4 21.2 42.7 212. 168. AH 60.1 AL F158 8.8 9.7 17.3 <2. 30.8 WH 22.0 45.6 WH 211. 63.6 180. WH F169 8.17 8.43 15.5 1.13 27.1 19.0 40.2 200. 57.3 160. F183 8.25 9.51 16.7 1.11 29.6 20.7 42.6 208. 60.3 163. F186 6.2 AL 6.4 AL 12.9 AL <0.5 AL 25.7 16.3 AL 40.3 193. 53.0 151. F193 8.04 8.66 15.3 1.14 26.6 19.5 40.7 198. 55.7 162. F196 8. 9. 16. <2. 29. 21. 46. AH 199. 56. 156. F207 8.8 9.3 16.7 1.2 28.1 21.3 42. 196. 57.4 160. F223 8.7 9.3 16.2 <4. 28.7 20.6 42.2 60.6 178. F223b <20.0 <20.0 <20.0 <20.0 27.6 <20.0 41.6 207. 59.4 167. F248 8.10 8.60 15.4 1.30 WH 27.1 19.5 40.3 204. 57.0 162. F287 7.44 9.76 15. 5.61 AH 22.7 AL 20.7 36.6 AL 420. AH 1110. AH 834. AH ASSIGNED VALUE * 8.10 8.77 15.8 1.13 27.3 20.1 41.5 200 57.3 162 R-STD DEV * 0.441 0.596 0.84 0.061 1.51 1.04 1.46 8.1 3.45 8.00 ACCEPTABLE LIMITS(+-) * 0.882 1.192 1.68 0.122 3.02 2.08 2.92 16.2 6.90 16.00 WARNING LIMITS(+-) * .882- 1.323 1.192- 1.7881.68- 2.52 .122- .183 3.02- 4.53 2.08- 3.12 2.92- 4.38 16.2- 24.3 6.90- 10.35 16.00- 24.00 ACTION LIMITS(<>) * 1.323 1.788 2.52 0.183 4.53 3.12 4.38 24.3 10.35 24.00 N * 30 30 31 26 32 31 32 31 32 32 * NOTE: SEE GLOSSARY FOR DEFINITIONS

PARAMETER: 33095 Arsenic ug/L 2009-09-02 PAGE 6 LAB TOTAL AVERAGE SUMMARY OF NO.SAMPLES BIAS BIAS NO. RANK RANK FLAGGING BIAS STATEMENT RANKED % SLOPE BLANK METHOD CODING F003 152.0 15.2 10 ICP-MS F009 279.0 27.9 AH AH BIASED HIGH 10 5.6 0.3641 ICP-MS F010 41.0 4.1 BIASED LOW 10 -5.2 -0.1679 ICP-MS F011 94.5 9.4 10 F014 87.0 8.7 10 ICP-MS F015 153.5 15.3 10 ICP-MS F020 95.5 9.5 10 ICP-MS F021 56.0 5.6 BIASED LOW* 10 -1.8 -0.7317 ICP-MS F021c 107.5 10.7 10 ICP-MS F022 185.0 18.5 10 ICP-MS F024 133.5 13.3 10 ICP-MS F026 125.0 17.8 7 ICP-AES F032 23.5 2.3 WL WL BIASED LOW 10 -6.3 -0.6660 AAS hydride-E3089 F032c 214.0 21.4 10 ICP-MS-E3473 F032d 184.5 18.4 10 ICP-MS-E3474 F060 233.0 23.3 10 ICP-MS F068 104.5 10.4 10 ICP-MS F069 253.0 25.3 WH BIASED HIGH* 10 2.5 0.8610 ICP-MS F139 151.0 15.1 10 ICP-MS F144 278.0 27.8 AHAHAH AHAHAHAHAHAH BIASED HIGH 10 22.7 2.5510 AAS hydride F154 219.5 21.9 AHAL 10 ICP-MS F158 260.5 28.9 WH WH WH BIASED HIGH 9 7.3 0.8973 ICP-MS F169 114.5 11.4 10 ICP-MS F183 225.5 22.5 10 ICP-MS F186 23.5 2.6 ALALALAL AL BIASED LOW* 9 -3.7 -1.7917 ICP-MS F193 107.5 10.7 10 ICP-MS F196 160.0 17.7 AH 9 ICP-AES F207 202.5 20.2 10 GFAAS F223 193.0 24.1 8 AAS hydride F223b 105.0 21.0 5 ICP-AES F248 138.5 13.8 WH 10 ICP-MS F287 180.0 18.0 AHAL ALAHAHAH 10 ICP-AES * NOTE: INDICATED BIAS STATEMENT IS FOR CAUTION ONLY AND NOT COUNTED IN STUDY STATISTICS PERCENT SLOPE USED FOR CAUTION COMPARISON = 5 OVERALL AVERAGE RANK IS 15.8

FPTM STUDY 0094 DATA SUMMARY 2009-09-02 PAGE 7 PARAMETER: 56095 Barium ug/L WATER SCIENCE & TECHNOLOGY ENVIRONMENT CANADA EC PT for Trace Elements in Water --------------------------------- SAMPLE 1= 2= 3= 4= 5= 6= 7= 8= 9= 10= TM-23.4 TM-26.4 TM-15.2 TMRain-04 TM25.4 TM-09 TM-16 TMDA-65 TMDA-62.2 TMDA-64.2 LAB NO LAB RESULT LAB RESULT LAB RESULT LAB RESULT LAB RESULT LAB RESULT LAB RESULT LAB RESULT LAB RESULT LAB RESULT ---------- ---------- ---------- ---------- ---------- ---------- ---------- ---------- ---------- ---------- F003 14.0 26.3 13.0 0.919 27.2 59.5 210. 398. 114. 292. F009 15. 27. 14. <3. 28. 60. 216. 418. 118. 303. F010 14.2 25.1 13.1 0.85 26.0 56.7 207. 396. 115. 281. F011 13.4 25.1 13.0 0.8 25.8 56.2 199. 392. 110. 285. F014 14. 26. 13. <10. 27. 56. 205. 392. 114. 289. F015 14.3 25.9 13.2 0.87 26.6 57.5 209. 401. 114. 291. F020 15. 26.7 13.8 0.93 27.6 57.4 205. 395. 111. 290. F021 13.5 24.7 12.7 0.8 25.8 54.1 197. 384. 107. 270. F021b 14. 25. 13. <1. 26. 56. 202. 382. 110. 278. F022 14.7 26.8 13.3 0.837 26.9 57.5 208. 401. 113. 290. F024 14.6 26.8 13.8 0.9 27.5 59.9 214. 413. 114. 303. F032a 15.8 WH 28.2 WH 14.7 AH 0.9 29.0 WH 62.3 WH 225. WH 418. 123. WH 313. F032c 14.1 25.3 13.0 0.8 26.3 56.7 205. 391. 112. 282. F032d 14.4 26.0 13.3 0.85 26.6 57.4 207. 396. 114. 289. F032g 13.9 25.3 13. 0.9 26. 56.1 207. 396. 114. 287. F042 10.0 AL 16.4 AL <10. AL <10. 11.3 AL 37.1 AL 124. AL 255. AL 63.3 AL 181. AL F060 14.9 27.2 14.0 <1. 27.7 59.0 205. 400. 115. 292. F068 14. 25.3 13. 0.853 26. 58. 210. 418. 110. 308. F069 14.3 26.2 13.3 0.86 27.0 57.6 212. 409. 116. 300. F069b 14.8 26.2 13.4 0.83 27.3 58.5 209. 410. 114. 291. F139 14.9 27.0 13.6 0.854 27.6 60.3 216. 416. 118. 304. F154 15.3 26.6 13.5 0.87 27.7 60.3 220. 434. WH 300. AH 120. AL F158 13.8 25.8 13.4 <2. 27.0 57.2 211. 408. 116. 294. F169 14.5 26.3 13.5 0.82 26.9 58.3 208. 404. 114. 299. F183 14.0 26.8 12.5 0.664 AL 27.6 57.4 220. 392. 114. 289. F186 14.2 26.5 13.4 0.6 AL 26.9 59.1 212. 408. 118. 300. F193 14.6 26.2 13.5 0.84 26.9 58.8 211. 391. 113. 281. F196 14. 26. 14. <6. 28. 59. 211. 395. 114. 286. F223b <100. <100. <100. <100. <100. <100. 210. 400. 110. 290. F248 <25.0 28.0 <25.0 <25.0 27.1 56.5 211. 403. 118. 300. F287 <20. 24. WL <20. <20. 25. WL 53.5 WL 197. 384. 107. 0.276 AL ASSIGNED VALUE * 14.3 26.2 13.3 0.853 27.0 57.5 210 400 114 290.500 R-STD DEV * 0.58 0.96 0.45 0.0505 0.87 1.90 6.1 12.7 3.57 11.7804 ACCEPTABLE LIMITS(+-) * 1.16 1.92 0.90 0.1010 1.74 3.80 12.2 25.4 7.14 23.5608 WARNING LIMITS(+-) * 1.16- 1.74 1.92- 2.88 .90- 1.35 .1010- .15151.74- 2.61 3.80- 5.70 12.2- 18.3 25.4- 38.1 7.14- 10.71 23.5608- 35. ACTION LIMITS(<>) * 1.74 2.88 1.35 0.1515 2.61 5.70 18.3 38.1 10.71 35.3412 N * 28 30 27 21 30 30 31 31 31 31 * NOTE: SEE GLOSSARY FOR DEFINITIONS

PARAMETER: 56095 Barium ug/L 2009-09-02 PAGE 8 LAB TOTAL AVERAGE SUMMARY OF NO.SAMPLES BIAS BIAS NO. RANK RANK FLAGGING BIAS STATEMENT RANKED % SLOPE BLANK METHOD CODING F003 168.0 16.8 10 ICP-MS F009 244.0 27.1 BIASED HIGH* 9 4.4 -0.3444 ICP-MS F010 108.5 10.8 10 ICP-MS F011 54.5 5.4 BIASED LOW* 10 -2.1 -0.7366 F014 94.0 10.4 9 ICP-MS F015 148.0 14.8 10 ICP-MS F020 170.0 17.0 10 ICP-MS F021 31.0 3.1 BIASED LOW 10 -5.0 -0.5414 ICP-MS F021b 47.0 5.2 BIASED LOW* 9 -4.4 0.5779 ICP-AES F022 153.5 15.3 10 ICP-MS F024 228.0 22.8 10 ICP-MS F032a 284.0 28.4 WHWHAH WHWHWH WH BIASED HIGH 10 5.6 1.3170 ICP-AES-E3386 F032c 78.5 7.8 10 ICP-MS-E3473 F032d 130.5 13.0 10 ICP-MS-E3474 F032g 101.0 10.1 10 ICP-AES-system#2,Opt F042 10.0 1.2 ALALAL ALALALALALAL BIASED LOW 8 -36.5 -3.0673 ICP-AES F060 192.5 21.3 9 ICP-MS F068 141.5 14.1 10 ICP-MS F069 190.5 19.0 10 ICP-MS F069b 177.5 17.7 10 ICP-AES F139 247.5 24.7 BIASED HIGH* 10 4.2 -0.2327 ICP-MS F154 231.0 23.1 WHAHAL 10 ICP-MS F158 148.5 16.5 9 ICP-MS F169 168.0 16.8 10 ICP-MS F183 139.5 13.9 AL 10 ICP-MS F186 187.5 18.7 AL 10 ICP-MS F193 142.0 14.2 10 ICP-MS F196 156.0 17.3 9 ICP-AES F223b 56.0 14.0 INSUFFICIENT DATA 4 ICP-AES F248 150.0 21.4 7 ICP-MS F287 15.5 2.2 WL WLWL AL BIASED LOW 7 -32.5 4.5626 ICP-AES * NOTE: INDICATED BIAS STATEMENT IS FOR CAUTION ONLY AND NOT COUNTED IN STUDY STATISTICS PERCENT SLOPE USED FOR CAUTION COMPARISON = 5 OVERALL AVERAGE RANK IS 15.1
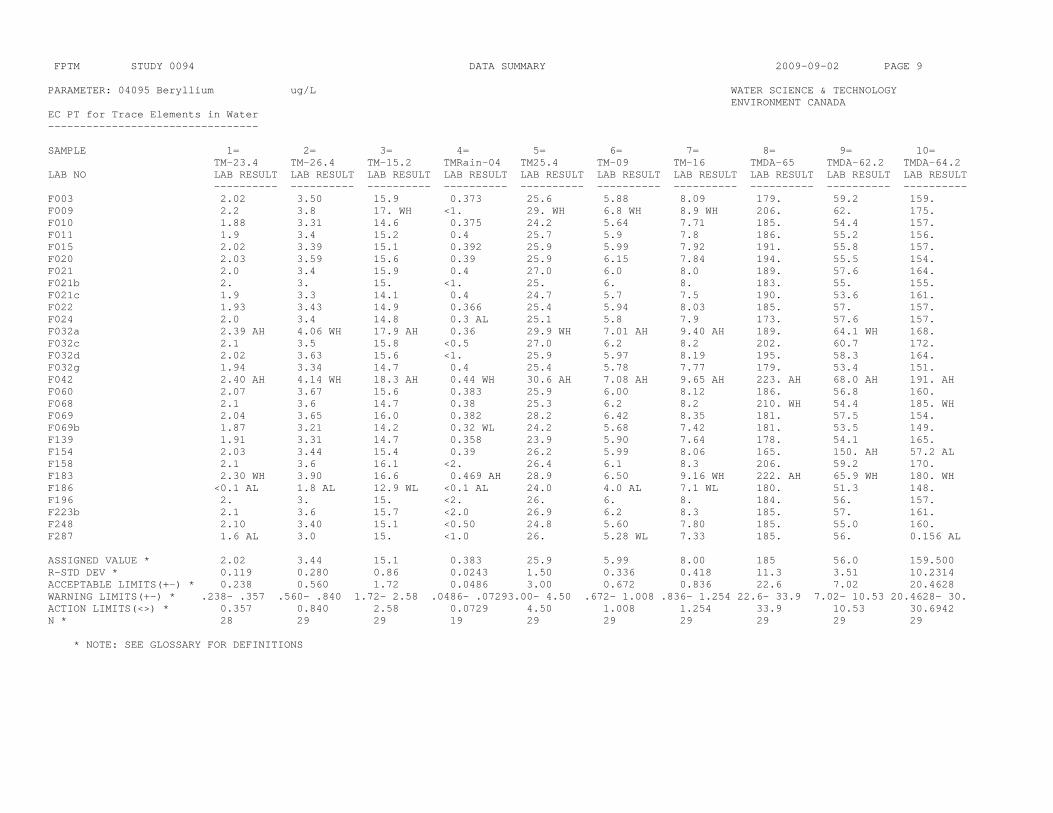
FPTM STUDY 0094 DATA SUMMARY 2009-09-02 PAGE 9 PARAMETER: 04095 Beryllium ug/L WATER SCIENCE & TECHNOLOGY ENVIRONMENT CANADA EC PT for Trace Elements in Water --------------------------------- SAMPLE 1= 2= 3= 4= 5= 6= 7= 8= 9= 10= TM-23.4 TM-26.4 TM-15.2 TMRain-04 TM25.4 TM-09 TM-16 TMDA-65 TMDA-62.2 TMDA-64.2 LAB NO LAB RESULT LAB RESULT LAB RESULT LAB RESULT LAB RESULT LAB RESULT LAB RESULT LAB RESULT LAB RESULT LAB RESULT ---------- ---------- ---------- ---------- ---------- ---------- ---------- ---------- ---------- ---------- F003 2.02 3.50 15.9 0.373 25.6 5.88 8.09 179. 59.2 159. F009 2.2 3.8 17. WH <1. 29. WH 6.8 WH 8.9 WH 206. 62. 175. F010 1.88 3.31 14.6 0.375 24.2 5.64 7.71 185. 54.4 157. F011 1.9 3.4 15.2 0.4 25.7 5.9 7.8 186. 55.2 156. F015 2.02 3.39 15.1 0.392 25.9 5.99 7.92 191. 55.8 157. F020 2.03 3.59 15.6 0.39 25.9 6.15 7.84 194. 55.5 154. F021 2.0 3.4 15.9 0.4 27.0 6.0 8.0 189. 57.6 164. F021b 2. 3. 15. <1. 25. 6. 8. 183. 55. 155. F021c 1.9 3.3 14.1 0.4 24.7 5.7 7.5 190. 53.6 161. F022 1.93 3.43 14.9 0.366 25.4 5.94 8.03 185. 57. 157. F024 2.0 3.4 14.8 0.3 AL 25.1 5.8 7.9 173. 57.6 157. F032a 2.39 AH 4.06 WH 17.9 AH 0.36 29.9 WH 7.01 AH 9.40 AH 189. 64.1 WH 168. F032c 2.1 3.5 15.8 <0.5 27.0 6.2 8.2 202. 60.7 172. F032d 2.02 3.63 15.6 <1. 25.9 5.97 8.19 195. 58.3 164. F032g 1.94 3.34 14.7 0.4 25.4 5.78 7.77 179. 53.4 151. F042 2.40 AH 4.14 WH 18.3 AH 0.44 WH 30.6 AH 7.08 AH 9.65 AH 223. AH 68.0 AH 191. AH F060 2.07 3.67 15.6 0.383 25.9 6.00 8.12 186. 56.8 160. F068 2.1 3.6 14.7 0.38 25.3 6.2 8.2 210. WH 54.4 185. WH F069 2.04 3.65 16.0 0.382 28.2 6.42 8.35 181. 57.5 154. F069b 1.87 3.21 14.2 0.32 WL 24.2 5.68 7.42 181. 53.5 149. F139 1.91 3.31 14.7 0.358 23.9 5.90 7.64 178. 54.1 165. F154 2.03 3.44 15.4 0.39 26.2 5.99 8.06 165. 150. AH 57.2 AL F158 2.1 3.6 16.1 <2. 26.4 6.1 8.3 206. 59.2 170. F183 2.30 WH 3.90 16.6 0.469 AH 28.9 6.50 9.16 WH 222. AH 65.9 WH 180. WH F186 <0.1 AL 1.8 AL 12.9 WL <0.1 AL 24.0 4.0 AL 7.1 WL 180. 51.3 148. F196 2. 3. 15. <2. 26. 6. 8. 184. 56. 157. F223b 2.1 3.6 15.7 <2.0 26.9 6.2 8.3 185. 57. 161. F248 2.10 3.40 15.1 <0.50 24.8 5.60 7.80 185. 55.0 160. F287 1.6 AL 3.0 15. <1.0 26. 5.28 WL 7.33 185. 56. 0.156 AL ASSIGNED VALUE * 2.02 3.44 15.1 0.383 25.9 5.99 8.00 185 56.0 159.500 R-STD DEV * 0.119 0.280 0.86 0.0243 1.50 0.336 0.418 11.3 3.51 10.2314 ACCEPTABLE LIMITS(+-) * 0.238 0.560 1.72 0.0486 3.00 0.672 0.836 22.6 7.02 20.4628 WARNING LIMITS(+-) * .238- .357 .560- .840 1.72- 2.58 .0486- .07293.00- 4.50 .672- 1.008 .836- 1.254 22.6- 33.9 7.02- 10.53 20.4628- 30. ACTION LIMITS(<>) * 0.357 0.840 2.58 0.0729 4.50 1.008 1.254 33.9 10.53 30.6942 N * 28 29 29 19 29 29 29 29 29 29 * NOTE: SEE GLOSSARY FOR DEFINITIONS

PARAMETER: 04095 Beryllium ug/L 2009-09-02 PAGE 10 LAB TOTAL AVERAGE SUMMARY OF NO.SAMPLES BIAS BIAS NO. RANK RANK FLAGGING BIAS STATEMENT RANKED % SLOPE BLANK METHOD CODING F003 141.0 14.1 10 ICP-MS F009 234.5 26.0 WH WHWHWH BIASED HIGH 9 10.8 -0.0319 ICP-MS F010 66.5 6.6 BIASED LOW* 10 -0.4 -0.5853 ICP-MS F011 115.0 11.5 10 F015 137.5 13.7 10 ICP-MS F020 151.0 15.1 10 ICP-MS F021 174.5 17.4 10 ICP-MS F021b 88.5 9.8 9 ICP-AES F021c 85.5 8.5 10 ICP-MS F022 116.0 11.6 10 ICP-MS F024 92.5 9.2 AL 10 ICP-MS F032a 238.5 23.8 AHWHAH WHAHAH WH BIASED HIGH* 10 3.2 1.5739 ICP-AES-E3386 F032c 201.5 22.3 9 ICP-MS-E3473 F032d 168.0 18.6 9 ICP-MS-E3474 F032g 74.5 7.4 10 ICP-AES-system#2,Opt F042 277.0 27.7 AHWHAHWHAHAHAHAHAHAH BIASED HIGH 10 20.4 -0.1318 ICP-AES F060 172.0 17.2 10 ICP-MS F068 172.0 17.2 WH WH 10 ICP-MS F069 182.0 18.2 10 ICP-MS F069b 38.0 3.8 WL BIASED LOW* 10 -3.8 -0.3915 ICP-AES F139 69.0 6.9 BIASED LOW* 10 -0.6 -0.4304 ICP-MS F154 143.5 14.3 AHAL 10 ICP-MS F158 204.5 22.7 BIASED HIGH 9 9.8 -0.9748 ICP-MS F183 259.0 25.9 WH AH WHAHWHWH BIASED HIGH 10 17.4 -0.6490 ICP-MS F186 16.0 2.0 ALALWLAL ALWL BIASED LOW* 8 -3.6 -1.6879 ICP-MS F196 110.0 12.2 9 ICP-AES F223b 179.5 19.9 9 ICP-AES F248 103.5 11.5 9 ICP-MS F287 65.0 7.2 AL WL AL 9 ICP-AES * NOTE: INDICATED BIAS STATEMENT IS FOR CAUTION ONLY AND NOT COUNTED IN STUDY STATISTICS PERCENT SLOPE USED FOR CAUTION COMPARISON = 5 OVERALL AVERAGE RANK IS 14.6

FPTM STUDY 0094 DATA SUMMARY 2009-09-02 PAGE 11 PARAMETER: 83095 Bismuth ug/L WATER SCIENCE & TECHNOLOGY ENVIRONMENT CANADA EC PT for Trace Elements in Water --------------------------------- SAMPLE 1= 2= 3= 4= 5= 6= 7= 8= 9= 10= TM-23.4 TM-26.4 TM-15.2 TMRain-04 TM25.4 TM-09 TM-16 TMDA-65 TMDA-62.2 TMDA-64.2 LAB NO LAB RESULT LAB RESULT LAB RESULT LAB RESULT LAB RESULT LAB RESULT LAB RESULT LAB RESULT LAB RESULT LAB RESULT ---------- ---------- ---------- ---------- ---------- ---------- ---------- ---------- ---------- ---------- F003 3.76 3.17 14.8 0.698 21.2 1.89 5.70 178. 55.9 140. F009 2.9 2.3 9.2 <2. 12. <2. 3.7 126. WL 33. WL 91. WL F011 3.4 2.9 14.7 0.7 21.1 1.7 5.4 177. 58.0 146. F015 2.46 WL 2.02 8.60 0.37 12.3 1.30 3.60 171. 40.0 131. F020 3.82 3.18 14.9 0.715 21. 1.9 5.71 166. 52.8 131. F022 3.28 3.19 13.2 1.24 WH 19. 6.6 AH 7.4 WH 244. AH 54.3 137. F024 3.1 2.5 11.0 0.4 15.5 1.6 4.2 160. 45.6 123. F060 3.34 2.72 12.9 0.546 17.4 1.95 5.01 167. 49.9 135. F139 3.17 2.68 12.5 0.783 17.9 1.54 4.76 152. 46.5 119. F154 3.47 2.79 14. 0.51 20.4 1.82 5.2 196. 152. AH 56.6 AL F183 3.67 2.68 15.0 0.35 21.0 1.25 5.62 182. 55.9 151. F196 <200. <200. <200. <200. <200. <200. <200. <200. <200. <200. ASSIGNED VALUE * 3.34 2.72 13.20 0.622 19.0 1.70 5.20 169 51.4 133 R-STD DEV * 0.387 0.393 2.495 0.2215 3.79 0.346 1.046 20.2 9.28 18.86 ACCEPTABLE LIMITS(+-) * 0.774 0.786 4.990 0.4430 7.58 0.692 2.092 40.4 18.56 37.72 WARNING LIMITS(+-) * .774- 1.161 .786- 1.179 4.990- 7.485.4430- .66457.58- 11.37 .692- 1.038 2.092- 3.13840.4- 60.6 18.56- 27.8437.72- 56.58 ACTION LIMITS(<>) * 1.161 1.179 7.485 0.6645 11.37 1.038 3.138 60.6 27.84 56.58 N * 11 11 11 10 11 10 11 11 11 11 * NOTE: SEE GLOSSARY FOR DEFINITIONS

PARAMETER: 83095 Bismuth ug/L 2009-09-02 PAGE 12 LAB TOTAL AVERAGE SUMMARY OF NO.SAMPLES BIAS BIAS NO. RANK RANK FLAGGING BIAS STATEMENT RANKED % SLOPE BLANK METHOD CODING F003 86.5 8.6 10 ICP-MS F009 13.0 1.6 WLWLWL BIASED LOW 8 -27.7 -0.9806 ICP-MS F011 79.0 7.9 10 F015 23.5 2.3 WL BIASED LOW* 10 0.7 -3.0885 ICP-MS F020 81.0 8.1 10 ICP-MS F022 85.0 8.5 WH AHWHAH 10 ICP-MS F024 32.0 3.2 BIASED LOW* 10 -6.1 -0.9270 ICP-MS F060 57.0 5.7 10 ICP-MS F139 42.5 4.2 10 ICP-MS F154 67.0 6.7 AHAL 10 ICP-MS F183 71.5 7.1 10 ICP-MS F196 0.0 0.0 INSUFFICIENT DATA 0 ICP-AES * NOTE: INDICATED BIAS STATEMENT IS FOR CAUTION ONLY AND NOT COUNTED IN STUDY STATISTICS PERCENT SLOPE USED FOR CAUTION COMPARISON = 10 OVERALL AVERAGE RANK IS 5.9

FPTM STUDY 0094 DATA SUMMARY 2009-09-02 PAGE 13 PARAMETER: 05095 Boron ug/L WATER SCIENCE & TECHNOLOGY ENVIRONMENT CANADA EC PT for Trace Elements in Water --------------------------------- SAMPLE 1= 2= 3= 4= 5= 6= 7= 8= 9= 10= TM-23.4 TM-26.4 TM-15.2 TMRain-04 TM25.4 TM-09 TM-16 TMDA-65 TMDA-62.2 TMDA-64.2 LAB NO LAB RESULT LAB RESULT LAB RESULT LAB RESULT LAB RESULT LAB RESULT LAB RESULT LAB RESULT LAB RESULT LAB RESULT ---------- ---------- ---------- ---------- ---------- ---------- ---------- ---------- ---------- ---------- F003 18.4 48.4 25.0 0.871 41.6 30.4 48.4 385. 124. 281. F009 <40. 43. <40. <40. <40. <40. 43. AL 385. 119. 277. F010 18.2 45.4 23.5 1.2 39.6 30.8 46.8 382. 120. 279. F011 17.1 45.5 23.8 1.3 40.3 30.6 46.5 422. 122. 282. F015 20. 50. 20. WL <10. 40. 30. 50. 390. 120. 290. F020 <50. <50. <50. <50. <50. <50. <50. 429. 132. WH 298. F022 17.3 44.7 21.7 1.24 38.6 30.6 47.8 388. 120. 283. F024 18. 44. 22. <10. 39. 29. 47. 375. 124. 282. F026 20. 47. 24. <20. 42. 32. 47. 392. 125. 282. F032c 19. 47. 24. <2. 42. 32. 48. 406. 124. 292. F032d 18.1 45.7 22.9 1.09 41.3 31.7 46.8 402. 123. 287. F060 18.4 45.0 24.6 <2. 39.7 31.4 47.5 401. 124. 290. F069 18.3 47.8 24.2 <4.0 43.1 32.6 48.4 406. 125. 291. F069b 19.1 47. 23.7 <2.0 42. 31.8 46.9 411. 125. 297. F154 18. 45. 23. <10. 40. 30. 46. 381. 278. AH 123. AL F158 18.3 46.6 24.5 <5. 40.8 31.5 47.7 396. 125. 281. F183 19.8 52.5 WH 25.5 1.57 44.2 35.9 AH 50.5 WH 457. WH 136. AH 310. WH F186 13. AL 36. AL 17. AL <2. 34. AL 23. AL 42. AL 344. WL 101. AL 241. AL F193 17.7 46.2 23.2 1.10 40.9 31.1 47.4 420. 122. 284. F196 <30. 49. <30. <30. 44. 34. 49. 406. 127. 297. F287 <100. <100. <100. <100. <100. <100. <100. <100. AL <100. AL <100. AL ASSIGNED VALUE * 18.3 46.4 23.8 1.200 40.9 31.2 47.5 398 124 286 R-STD DEV * 1.08 2.33 1.44 0.2365 1.89 1.40 1.35 19.6 3.9 9.5 ACCEPTABLE LIMITS(+-) * 2.16 4.66 2.88 0.4730 3.78 2.80 2.70 39.2 7.8 19.0 WARNING LIMITS(+-) * 2.16- 3.24 4.66- 6.99 2.88- 4.32 .4730- .70953.78- 5.67 2.80- 4.20 2.70- 4.05 39.2- 58.8 7.8- 11.7 19.0- 28.5 ACTION LIMITS(<>) * 3.24 6.99 4.32 0.7095 5.67 4.20 4.05 58.8 11.7 28.5 N * 17 19 17 7 18 18 19 20 20 20 * NOTE: SEE GLOSSARY FOR DEFINITIONS

PARAMETER: 05095 Boron ug/L 2009-09-02 PAGE 14 LAB TOTAL AVERAGE SUMMARY OF NO.SAMPLES BIAS BIAS NO. RANK RANK FLAGGING BIAS STATEMENT RANKED % SLOPE BLANK METHOD CODING F003 98.5 9.8 10 ICP-MS F009 14.5 2.9 AL BIASED LOW* 5 -2.6 -2.0997 ICP-MS F010 56.5 5.6 10 ICP-MS F011 77.0 7.7 10 F015 90.0 10.0 WL 9 ICP-MS F020 56.0 18.6 WH INSUFFICIENT DATA 3 ICP-MS F022 57.5 5.7 10 ICP-MS F024 46.5 5.1 9 ICP-MS F026 109.5 12.1 9 ICP-AES F032c 120.5 13.3 9 ICP-MS-E3473 F032d 83.5 8.3 10 ICP-MS-E3474 F060 93.0 10.3 9 ICP-MS F069 128.5 14.2 9 ICP-MS F069b 118.0 13.1 9 ICP-AES F154 54.0 6.0 AHAL 9 ICP-MS F158 96.5 10.7 9 ICP-MS F183 172.0 17.2 WH AHWHWHAHWH BIASED HIGH 10 13.1 -1.5749 ICP-MS F186 10.0 1.1 ALALAL ALALALWLALAL BIASED LOW 9 -13.5 -2.9750 ICP-MS F193 87.5 8.7 10 ICP-MS F196 116.5 16.6 BIASED HIGH* 7 2.1 1.8598 ICP-AES F287 0.0 0.0 ALALAL INSUFFICIENT DATA 0 ICP-AES * NOTE: INDICATED BIAS STATEMENT IS FOR CAUTION ONLY AND NOT COUNTED IN STUDY STATISTICS PERCENT SLOPE USED FOR CAUTION COMPARISON = 5 OVERALL AVERAGE RANK IS 9.6

FPTM STUDY 0094 DATA SUMMARY 2009-09-02 PAGE 15 PARAMETER: 48095 Cadmium ug/L WATER SCIENCE & TECHNOLOGY ENVIRONMENT CANADA EC PT for Trace Elements in Water --------------------------------- SAMPLE 1= 2= 3= 4= 5= 6= 7= 8= 9= 10= TM-23.4 TM-26.4 TM-15.2 TMRain-04 TM25.4 TM-09 TM-16 TMDA-65 TMDA-62.2 TMDA-64.2 LAB NO LAB RESULT LAB RESULT LAB RESULT LAB RESULT LAB RESULT LAB RESULT LAB RESULT LAB RESULT LAB RESULT LAB RESULT ---------- ---------- ---------- ---------- ---------- ---------- ---------- ---------- ---------- ---------- F003 2.85 6.81 12.6 0.499 22.5 3.82 14.2 300. 92.8 263. F009 3.1 7.3 13. <1. 24. 4.2 15. 323. 95. 276. F010 287. AH 6.97 12.7 0.526 23.0 3.87 14.7 304. 91.7 262. F011 2.71 7.02 12.6 0.52 22.7 3.83 14.2 300. 90.0 261. F014 2.9 7.0 13. 0.5 24. 3.9 15. 317. 94. 268. F015 3.09 7.57 13.7 0.55 24.9 4.16 15.8 317. 99.4 274. F020 2.89 7.12 12.7 0.526 23.5 3.81 14.3 302. 92.6 261. F021 2.7 6.6 12.4 0.5 22.3 3.8 13.7 290. 88.4 252. F021b 3. 7. 13. <3. 23. 4. 15. 305. 93. 264. F021c 2.7 6.7 12.0 0.5 21.9 3.6 13.7 303. 93.1 260. F022 2.90 7.16 12.7 0.521 23.4 4.03 15.5 307. 93. 268. F024 2.9 7.1 13.0 0.5 23.9 3.9 14.7 311. 95.8 270. F026 3. 8. WH 14. <1. 25. 4. 16. 313. 97. 273. F032a 3.6 AH 7.5 13.1 <0.8 23.2 3.9 15.5 298. 93.8 266. F032c 2.8 6.7 12.2 0.5 22.7 3.8 14.0 291. 89.3 253. F032d 2.95 7.22 12.9 <1. 23.4 3.87 14.6 301. 92.6 259. F032g 2.8 6.9 12.6 0.7 AH 23.1 3.7 14.7 301. 92. 260. F042 3.16 7.54 13.4 0.58 24.3 4.19 15.4 317. 96.9 274. F060 2.88 7.06 12.7 0.522 22.8 3.87 14.6 309. 90.1 268. F068 3. 7.2 13. 0.52 23.7 4. 14.8 302. 94. 264. F069 3.05 7.36 13.4 0.547 24.5 4.07 15.4 321. 102. WH 286. WH F069b 2.9 7.2 13. <0.6 24.5 3.6 14.9 312. 95.5 268. F139 2.79 6.82 12.3 0.513 22.3 3.82 14.2 296. 89.8 251. F144 2.83 7.02 13.6 0.48 23.9 3.79 14.3 300. 94.3 291. WH F154 3.01 7.23 13.5 0.581 24.8 4.07 14.8 319. 290. AH 96. AL F158 3.2 7.5 13.6 <1. 25.3 4.1 16.0 324. WH 100. 276. F169 2.93 7.10 12.8 0.53 24.1 3.92 14.6 306. 93.9 269. F183 3.29 7.61 13.9 0.705 AH 25.6 4.22 16.3 WH 286. 94.2 256. F186 1.9 AL 7.5 14.7 AH <0.1 AL 28.1 AH 3.1 AL 16.2 WH 295. 108. AH 264. F193 2.97 7.31 12.9 0.54 23.7 3.97 15.1 302. 93.3 260. F196 <6. 7. 13. <6. 24. <6. 15. 295. 92. 257. F207 2.8 6.6 12.7 0.5 22.3 3.7 14.1 304. 94.4 278. F223 2.6 7.3 13.1 <1. 25.3 3.8 15.3 F223b <4.0 7.2 13.2 <4.0 24.4 <4.0 15.1 299. 96.4 269. F248 3.00 7.20 13.3 0.050 AL 22.7 3.60 14.5 299. 92.4 269. F287 2.4 WL 6.9 12. <2.0 23. 3.46 14.8 305. 93. 0.261 AL ASSIGNED VALUE * 2.90 7.14 13.0 0.520 23.7 3.87 14.8 303 93.3 266 R-STD DEV * 0.196 0.308 0.52 0.0335 1.12 0.207 0.68 10.0 3.10 9.4574 ACCEPTABLE LIMITS(+-) * 0.392 0.616 1.04 0.0670 2.24 0.414 1.36 20.0 6.20 18.9148 WARNING LIMITS(+-) * .392- .588 .616- .924 1.04- 1.56 .0670- .10052.24- 3.36 .414- .621 1.36- 2.04 20.0- 30.0 6.20- 9.30 18.9148- 28. ACTION LIMITS(<>) * 0.588 0.924 1.56 0.1005 3.36 0.621 2.04 30.0 9.30 28.3722 N * 34 36 36 24 36 34 36 35 35 35 * NOTE: SEE GLOSSARY FOR DEFINITIONS

PARAMETER: 48095 Cadmium ug/L 2009-09-02 PAGE 16 LAB TOTAL AVERAGE SUMMARY OF NO.SAMPLES BIAS BIAS NO. RANK RANK FLAGGING BIAS STATEMENT RANKED % SLOPE BLANK METHOD CODING F003 89.5 8.9 10 ICP-MS F009 244.5 27.1 9 ICP-MS F010 152.0 15.2 AH 10 ICP-MS F011 93.5 9.3 10 F014 191.5 19.1 10 ICP-MS F015 299.5 29.9 BIASED HIGH* 10 4.2 0.2569 ICP-AES F020 135.0 13.5 10 ICP-MS F021 39.0 3.9 BIASED LOW* 10 -4.4 -0.2564 ICP-MS F021b 165.5 18.3 9 ICP-AES F021c 66.5 6.6 BIASED LOW* 10 -0.4 -0.6430 ICP-MS F022 192.0 19.2 10 ICP-MS F024 195.0 19.5 10 ICP-MS F026 271.0 30.1 WH BIASED HIGH* 9 3.2 0.3906 ICP-AES F032a 197.0 21.8 AH 9 ICP-AES-E3386 F032c 52.0 5.2 BIASED LOW* 10 -4.0 -0.1430 ICP-MS-E3473 F032d 136.0 15.1 9 ICP-MS-E3474 F032g 112.0 11.2 AH 10 ICP-AES-system#2,Opt F042 287.5 28.7 BIASED HIGH* 10 4.3 -0.1195 ICP-AES F060 142.5 14.2 10 ICP-MS F068 191.5 19.1 10 ICP-MS F069 289.0 28.9 WHWH BIASED HIGH 10 7.1 -0.0852 ICP-MS F069b 185.0 20.5 9 ICP-AES F139 61.5 6.1 BIASED LOW* 10 -3.4 -0.2621 ICP-MS F144 164.0 16.4 WH 10 GFAAS F154 248.5 24.8 AHAL 10 ICP-MS F158 289.0 32.1 WH BIASED HIGH 9 5.9 0.0571 ICP-MS F169 192.5 19.2 10 ICP-MS F183 259.0 25.9 AH WH 10 ICP-MS F186 195.5 21.7 AL AHALAHALWH AH 9 ICP-MS F193 192.5 19.2 10 ICP-MS F196 95.5 13.6 7 ICP-AES F207 118.0 11.8 10 GFAAS F223 124.5 20.7 6 GFAAS F223b 161.5 23.0 7 ICP-AES F248 136.5 13.6 AL 10 ICP-MS F287 78.5 8.7 WL AL 9 ICP-AES * NOTE: INDICATED BIAS STATEMENT IS FOR CAUTION ONLY AND NOT COUNTED IN STUDY STATISTICS PERCENT SLOPE USED FOR CAUTION COMPARISON = 5 OVERALL AVERAGE RANK IS 17.7

FPTM STUDY 0094 DATA SUMMARY 2009-09-02 PAGE 17 PARAMETER: 24095 Chromium ug/L WATER SCIENCE & TECHNOLOGY ENVIRONMENT CANADA EC PT for Trace Elements in Water --------------------------------- SAMPLE 1= 2= 3= 4= 5= 6= 7= 8= 9= 10= TM-23.4 TM-26.4 TM-15.2 TMRain-04 TM25.4 TM-09 TM-16 TMDA-65 TMDA-62.2 TMDA-64.2 LAB NO LAB RESULT LAB RESULT LAB RESULT LAB RESULT LAB RESULT LAB RESULT LAB RESULT LAB RESULT LAB RESULT LAB RESULT ---------- ---------- ---------- ---------- ---------- ---------- ---------- ---------- ---------- ---------- F003 6.92 12.9 17.2 0.879 24.3 4.10 13.2 394. 98.8 293. F009 7.1 13. 18. WH <1. 26. WH 4.4 14. 414. 99. 306. F010 7.10 12.8 16.6 0.91 24.7 4.42 13.7 384. 96.2 280. F011 6.8 12.0 16.0 0.9 23.4 4.0 12.6 398. 93.0 288. F014 7.0 13. 17. 1.0 25. 5.2 AH 14. 398. 97. 299. F015 6.6 12.4 16.2 0.8 24.0 4.2 13.0 400. 93.0 288. F020 6.8 12.6 16.6 0.9 25.4 4. 13.1 413. 96. 301. F021 6.7 11.7 15.8 0.9 23.9 4.1 12.4 383. 90.4 277. F021b 7. 13. 16. <2. 24. 4. 13. 405. 95. 292. F021c 6.4 11.9 15.5 0.9 23.1 3.9 12.4 401. 91.2 294. F022 6.96 13.0 17.0 0.807 24.7 4.42 13.7 410. 94. 294. F024 6.5 12.2 16.2 0.6 AL 23.7 3.8 12.6 406. 93.8 291. F026 7. 12. 16. <1. 24. 4. 13. 402. 94. 289. F032a 7. 13. 17. 1. 25. 4. 14. 410. 98. 305. F032c 6.6 12.3 16.2 0.8 24.1 4.3 13.1 390. 94.3 287. F032d 6.88 12.6 16.7 <1. 23.9 4.09 12.7 407. 95.2 291. F032g 7.1 12.6 16.4 1.2 AH 23.7 4.3 13.1 408. 95.5 292. F042 5.70 AL 10.9 WL 15.0 WL <2. 22.1 WL 3.22 AL 11.7 393. 89.0 286. F060 6.89 12.4 16.7 0.888 24.5 4.01 12.8 393. 93.4 287. F068 7.2 13. 17. 0.9 24. 4.3 13. 407. 97. 300. F069 6.93 12.9 17.1 0.9 24.4 4.0 13.2 402. 92.6 293. F069b 6.61 11.9 16.1 <1.20 23.9 3.87 12.4 412. 94.2 294. F139 6.73 11.8 15.8 0.802 22.6 3.96 12.2 379. WL 90.2 147. AL F144 6.71 12.3 15.1 WL <3. 20.4 AL 4.24 11.9 348. AL 75.2 AL 287. F154 6.69 12.5 16.8 0.87 24.6 4.31 12.8 424. 314. AH 95.7 AL F158 6.7 12.4 16.3 <2. 24.0 4.1 12.9 410. 96.0 296. F169 6.94 12.4 16.5 0.86 24.0 4.09 13.0 401. 94.3 287. F183 7.37 12.6 17.2 0.87 24.9 4.24 13.9 407. 95.8 282. F186 23.3 AH 41.4 AH 53.5 AH 3.0 AH 77.9 AH 11.8 AH 36.3 AH 777. AH 197. AH 445. AH F193 6.56 12.2 16.1 <0.4 AL 23.8 3.42 WL 12.4 403. 95.1 290. F196 7. 13. 17. <4. 24. 4. 13. 390. 94. 282. F207 7.7 WH 13.5 17.2 1.1 WH 25.3 4.9 AH 14.0 404. 92.4 296. F223 6.6 12.4 16.5 <5. 23.6 <5. 12.6 95.1 F223b <10.0 12.1 16. <10.0 24.1 <10.0 12.5 405. 95.9 295. F248 7.30 13.4 17.3 <1.50 26.2 WH 4.20 13.5 429. WH 97.8 308. F287 5.9 AL <10. AL 16. <4.0 23. <4.0 11.5 WL 394. 90. 0.282 AL ASSIGNED VALUE * 6.90 12.4 16.5 0.900 24.0 4.09 13.0 403 94.3 292 R-STD DEV * 0.307 0.54 0.65 0.0909 0.86 0.241 0.71 11.1 3.04 9.3131 ACCEPTABLE LIMITS(+-) * 0.614 1.08 1.30 0.1818 1.72 0.482 1.42 22.2 6.08 18.6262 WARNING LIMITS(+-) * .614- .921 1.08- 1.62 1.30- 1.95 .1818- .27271.72- 2.58 .482- .723 1.42- 2.13 22.2- 33.3 6.08- 9.12 18.6262- 27. ACTION LIMITS(<>) * 0.921 1.62 1.95 0.2727 2.58 0.723 2.13 33.3 9.12 27.9393 N * 35 35 36 22 36 33 36 35 36 35 * NOTE: SEE GLOSSARY FOR DEFINITIONS

PARAMETER: 24095 Chromium ug/L 2009-09-02 PAGE 18 LAB TOTAL AVERAGE SUMMARY OF NO.SAMPLES BIAS BIAS NO. RANK RANK FLAGGING BIAS STATEMENT RANKED % SLOPE BLANK METHOD CODING F003 216.0 21.6 10 ICP-MS F009 287.5 31.9 WH WH BIASED HIGH* 9 3.4 0.7425 ICP-MS F010 213.0 21.3 10 ICP-MS F011 105.0 10.5 10 F014 265.5 26.5 AH 10 ICP-MS F015 131.5 13.1 10 ICP-MS F020 225.5 22.5 10 ICP-MS F021 80.0 8.0 BIASED LOW 10 -5.0 0.2345 ICP-MS F021b 167.5 18.6 9 ICP-AES F021c 85.0 8.5 10 ICP-MS F022 235.5 23.5 10 ICP-MS F024 102.5 10.2 AL 10 ICP-MS F026 131.5 14.6 9 ICP-AES F032a 265.5 26.5 10 ICP-AES-E3386 F032c 139.0 13.9 10 ICP-MS-E3473 F032d 164.0 18.2 9 ICP-MS-E3474 F032g 213.5 21.3 AH 10 ICP-AES-system#2,Opt F042 25.5 2.8 ALWLWL WLAL BIASED LOW* 9 -1.9 -1.3797 ICP-AES F060 148.0 14.8 10 ICP-MS F068 245.5 24.5 10 ICP-MS F069 194.5 19.4 10 ICP-MS F069b 117.5 13.0 9 ICP-AES F139 47.5 4.7 WL AL BIASED LOW 10 -20.2 -0.1595 ICP-MS F144 65.5 7.2 WL AL ALAL BIASED LOW 9 -9.9 0.0480 GFAAS F154 198.0 19.8 AHAL 10 ICP-MS F158 175.5 19.5 9 ICP-MS F169 155.0 15.5 10 ICP-MS F183 230.0 23.0 10 ICP-MS F186 338.0 33.8 AHAHAHAHAHAHAHAHAHAH BIASED HIGH 10 76.1 14.0174 ICP-MS F193 99.0 11.0 AL WL 9 ICP-MS F196 153.5 17.0 9 ICP-AES F207 270.0 27.0 WH WH AH 10 ICP-AES F223 79.0 13.1 6 GFAAS F223b 118.0 16.8 7 ICP-AES F248 281.5 31.2 WH WH BIASED HIGH 9 6.3 -0.3563 ICP-MS F287 28.5 4.0 ALAL WL AL BIASED LOW 7 -33.3 -3.6698 ICP-AES * NOTE: INDICATED BIAS STATEMENT IS FOR CAUTION ONLY AND NOT COUNTED IN STUDY STATISTICS PERCENT SLOPE USED FOR CAUTION COMPARISON = 5 OVERALL AVERAGE RANK IS 17.6
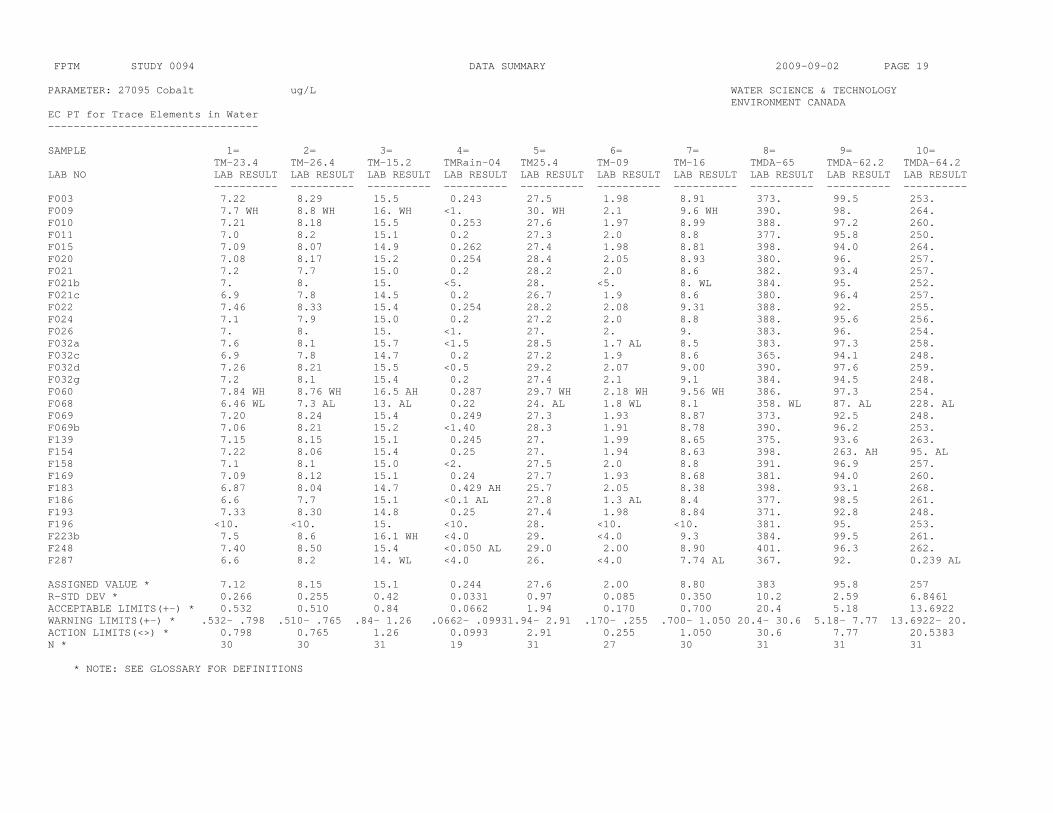
FPTM STUDY 0094 DATA SUMMARY 2009-09-02 PAGE 19 PARAMETER: 27095 Cobalt ug/L WATER SCIENCE & TECHNOLOGY ENVIRONMENT CANADA EC PT for Trace Elements in Water --------------------------------- SAMPLE 1= 2= 3= 4= 5= 6= 7= 8= 9= 10= TM-23.4 TM-26.4 TM-15.2 TMRain-04 TM25.4 TM-09 TM-16 TMDA-65 TMDA-62.2 TMDA-64.2 LAB NO LAB RESULT LAB RESULT LAB RESULT LAB RESULT LAB RESULT LAB RESULT LAB RESULT LAB RESULT LAB RESULT LAB RESULT ---------- ---------- ---------- ---------- ---------- ---------- ---------- ---------- ---------- ---------- F003 7.22 8.29 15.5 0.243 27.5 1.98 8.91 373. 99.5 253. F009 7.7 WH 8.8 WH 16. WH <1. 30. WH 2.1 9.6 WH 390. 98. 264. F010 7.21 8.18 15.5 0.253 27.6 1.97 8.99 388. 97.2 260. F011 7.0 8.2 15.1 0.2 27.3 2.0 8.8 377. 95.8 250. F015 7.09 8.07 14.9 0.262 27.4 1.98 8.81 398. 94.0 264. F020 7.08 8.17 15.2 0.254 28.4 2.05 8.93 380. 96. 257. F021 7.2 7.7 15.0 0.2 28.2 2.0 8.6 382. 93.4 257. F021b 7. 8. 15. <5. 28. <5. 8. WL 384. 95. 252. F021c 6.9 7.8 14.5 0.2 26.7 1.9 8.6 380. 96.4 257. F022 7.46 8.33 15.4 0.254 28.2 2.08 9.31 388. 92. 255. F024 7.1 7.9 15.0 0.2 27.2 2.0 8.8 388. 95.6 256. F026 7. 8. 15. <1. 27. 2. 9. 383. 96. 254. F032a 7.6 8.1 15.7 <1.5 28.5 1.7 AL 8.5 383. 97.3 258. F032c 6.9 7.8 14.7 0.2 27.2 1.9 8.6 365. 94.1 248. F032d 7.26 8.21 15.5 <0.5 29.2 2.07 9.00 390. 97.6 259. F032g 7.2 8.1 15.4 0.2 27.4 2.1 9.1 384. 94.5 248. F060 7.84 WH 8.76 WH 16.5 AH 0.287 29.7 WH 2.18 WH 9.56 WH 386. 97.3 254. F068 6.46 WL 7.3 AL 13. AL 0.22 24. AL 1.8 WL 8.1 358. WL 87. AL 228. AL F069 7.20 8.24 15.4 0.249 27.3 1.93 8.87 373. 92.5 248. F069b 7.06 8.21 15.2 <1.40 28.3 1.91 8.78 390. 96.2 253. F139 7.15 8.15 15.1 0.245 27. 1.99 8.65 375. 93.6 263. F154 7.22 8.06 15.4 0.25 27. 1.94 8.63 398. 263. AH 95. AL F158 7.1 8.1 15.0 <2. 27.5 2.0 8.8 391. 96.9 257. F169 7.09 8.12 15.1 0.24 27.7 1.93 8.68 381. 94.0 260. F183 6.87 8.04 14.7 0.429 AH 25.7 2.05 8.38 398. 93.1 268. F186 6.6 7.7 15.1 <0.1 AL 27.8 1.3 AL 8.4 377. 98.5 261. F193 7.33 8.30 14.8 0.25 27.4 1.98 8.84 371. 92.8 248. F196 <10. <10. 15. <10. 28. <10. <10. 381. 95. 253. F223b 7.5 8.6 16.1 WH <4.0 29. <4.0 9.3 384. 99.5 261. F248 7.40 8.50 15.4 <0.050 AL 29.0 2.00 8.90 401. 96.3 262. F287 6.6 8.2 14. WL <4.0 26. <4.0 7.74 AL 367. 92. 0.239 AL ASSIGNED VALUE * 7.12 8.15 15.1 0.244 27.6 2.00 8.80 383 95.8 257 R-STD DEV * 0.266 0.255 0.42 0.0331 0.97 0.085 0.350 10.2 2.59 6.8461 ACCEPTABLE LIMITS(+-) * 0.532 0.510 0.84 0.0662 1.94 0.170 0.700 20.4 5.18 13.6922 WARNING LIMITS(+-) * .532- .798 .510- .765 .84- 1.26 .0662- .09931.94- 2.91 .170- .255 .700- 1.050 20.4- 30.6 5.18- 7.77 13.6922- 20. ACTION LIMITS(<>) * 0.798 0.765 1.26 0.0993 2.91 0.255 1.050 30.6 7.77 20.5383 N * 30 30 31 19 31 27 30 31 31 31 * NOTE: SEE GLOSSARY FOR DEFINITIONS

PARAMETER: 27095 Cobalt ug/L 2009-09-02 PAGE 20 LAB TOTAL AVERAGE SUMMARY OF NO.SAMPLES BIAS BIAS NO. RANK RANK FLAGGING BIAS STATEMENT RANKED % SLOPE BLANK METHOD CODING F003 175.0 17.5 10 ICP-MS F009 256.0 28.4 WHWHWH WH WH BIASED HIGH* 9 2.0 0.7462 ICP-MS F010 196.5 19.6 10 ICP-MS F011 122.0 12.2 10 F015 157.5 15.7 10 ICP-MS F020 177.0 17.7 10 ICP-MS F021 122.0 12.2 10 ICP-MS F021b 89.0 11.1 WL 8 ICP-AES F021c 83.0 8.3 10 ICP-MS F022 203.5 20.3 10 ICP-MS F024 128.5 12.8 10 ICP-MS F026 120.5 13.3 9 ICP-AES F032a 164.0 18.2 AL 9 ICP-AES-E3386 F032c 57.5 5.7 BIASED LOW* 10 -4.3 0.5135 ICP-MS-E3473 F032d 220.0 24.4 BIASED HIGH* 9 1.6 0.1811 ICP-MS-E3474 F032g 156.5 15.6 10 ICP-AES-system#2,Opt F060 252.0 25.2 WHWHAH WHWHWH BIASED HIGH* 10 0.1 0.7391 ICP-MS F068 22.0 2.2 WLALAL ALWL WLALAL BIASED LOW 10 -7.7 -0.8169 ICP-MS F069 126.0 12.6 10 ICP-MS F069b 148.0 16.4 9 ICP-AES F139 131.5 13.1 10 ICP-MS F154 153.0 15.3 AHAL 10 ICP-MS F158 153.5 17.0 9 ICP-MS F169 134.0 13.4 10 ICP-MS F183 130.0 13.0 AH 10 ICP-MS F186 107.5 11.9 AL AL 9 ICP-MS F193 125.0 12.5 10 ICP-MS F196 68.0 13.6 5 ICP-AES F223b 212.5 26.5 WH BIASED HIGH* 8 0.5 1.1779 ICP-AES F248 217.0 24.1 AL BIASED HIGH* 9 4.1 -0.6145 ICP-MS F287 34.5 4.3 WL AL AL BIASED LOW 8 -30.9 -3.9693 ICP-AES * NOTE: INDICATED BIAS STATEMENT IS FOR CAUTION ONLY AND NOT COUNTED IN STUDY STATISTICS PERCENT SLOPE USED FOR CAUTION COMPARISON = 5 OVERALL AVERAGE RANK IS 15.2

FPTM STUDY 0094 DATA SUMMARY 2009-09-02 PAGE 21 PARAMETER: 29095 Copper ug/L WATER SCIENCE & TECHNOLOGY ENVIRONMENT CANADA EC PT for Trace Elements in Water --------------------------------- SAMPLE 1= 2= 3= 4= 5= 6= 7= 8= 9= 10= TM-23.4 TM-26.4 TM-15.2 TMRain-04 TM25.4 TM-09 TM-16 TMDA-65 TMDA-62.2 TMDA-64.2 LAB NO LAB RESULT LAB RESULT LAB RESULT LAB RESULT LAB RESULT LAB RESULT LAB RESULT LAB RESULT LAB RESULT LAB RESULT ---------- ---------- ---------- ---------- ---------- ---------- ---------- ---------- ---------- ---------- F003 8.65 15.0 17.8 6.96 27.0 35.1 116. 389. 98.5 282. F009 9.1 16. 18. 7.6 28. 37. 122. WH 404. 100. 290. F010 8.32 14.5 17.0 7.01 26.0 34.1 111. 395. 95.0 279. F011 8.9 15.0 17.4 7.4 26.9 35.4 113. 390. 95.0 276. F014 8.4 15. 17. 6.7 25. 34. 107. 394. 93. 266. F015 8.59 14.9 17.0 7.30 26.7 34.3 111. 394. 92.5 278. F020 8.45 15.1 17.4 7.14 27.5 34.8 112. 383. 92.7 274. F021 9.1 15.0 17.8 7.4 27.8 35.4 110. 397. 95.9 275. F021b 8. 16. 18. 7. 28. 36. 117. 410. 99. 288. F021c 8.6 15.1 17.6 7.5 27.4 34.8 115. 412. 95.3 295. F022 8.81 15.1 17.4 7.06 26.9 35.3 113. 402. 97. 281. F024 8.5 14.9 17.0 6.9 26.1 34.1 110. 394. 94.6 278. F026 9. 15. 18. 7. 27. 35. 114. 410. 96. 290. F032a 8.6 12.9 AL 14.8 AL 6.1 WL 23.1 AL 32.7 115. 387. 90.2 281. F032c 8.6 14.9 17.1 7.0 26.2 34.0 108. 383. 91.6 262. F032d 8.56 14.8 17.2 7.38 27.3 35.1 111. 390. 93.6 272. F032g 9. 14. 17. 7. 26. 33. 111. 373. 95. 274. F042 <10. 12.7 AL 15.5 WL <10. 24.0 WL 32.4 113. 378. 94.5 274. F060 8.94 15.2 17.7 7.22 27.1 35.2 110. 383. 95.6 266. F068 8.66 15. 17. 7.2 25.3 36. 112. 398. 92. 280. F069 8.57 15.2 17.5 7.18 26.1 33.4 114. 375. 87.8 266. F069b 7.7 14.3 16.6 7.1 26.1 34.7 112. 384. 93.7 275. F139 10.1 AH 14.6 16.8 6.81 25.6 33.7 107. 378. 89.9 275. F144 7.25 WL 12.4 AL 14.3 AL 4.80 AL 21.9 AL 28.5 AL 98.7 AL 313. AL 82.4 AL 225. AL F154 9.09 15.5 18.1 7.51 27.5 36.1 120. 424. WH 304. AH 97.6 AL F158 9.1 15.6 18.2 7.5 28.1 36.0 118. 422. WH 99.4 300. WH F169 8.62 15.0 17.4 6.74 28.2 34.4 111. 395. 92.8 272. F183 8.14 14.7 16.2 7.37 24.3 WL 33.6 99.2 WL 370. 86.2 WL 259. F186 7.8 13.8 WL 16.5 6.5 26.4 33.5 110. 384. 93.4 275. F193 8.45 15.1 17.2 7.08 26.8 34.7 108. 375. 90.4 263. F196 <10. 15. 18. <10. 26. 34. 110. 383. 92. 270. F207 8.7 15.0 17.2 6.9 26.8 34.2 112. 391. 90.2 279. F223 <100. <100. <100. <100. <100. <100. 118. 392. <100. 277. F223b 8.6 14.9 17.4 6.1 WL 26.8 35.2 119. 392. 96.3 279. F248 9.40 15.8 17.7 7.00 27.8 35.7 114. 394. 94.9 278. F273 9.11 15.6 17.5 7.95 WH 27.4 35.6 115. 392. 96.6 284. F287 6.6 AL 14. 15. AL 5.78 AL 26. 31.4 WL 104. 372. 90. 0.261 AL ASSIGNED VALUE * 8.60 15.0 17.4 7.07 26.8 34.7 112 392 94.1 276.500 R-STD DEV * 0.449 0.56 0.66 0.384 1.14 1.20 4.24 13.4 3.60 10.2382 ACCEPTABLE LIMITS(+-) * 0.898 1.12 1.32 0.768 2.28 2.40 8.48 26.8 7.20 20.4764 WARNING LIMITS(+-) * .898- 1.347 1.12- 1.68 1.32- 1.98 .768- 1.152 2.28- 3.42 2.40- 3.60 8.48- 12.72 26.8- 40.2 7.20- 10.80 20.4764- 30. ACTION LIMITS(<>) * 1.347 1.68 1.98 1.152 3.42 3.60 12.72 40.2 10.80 30.7146 N * 34 36 36 34 36 36 37 37 36 37 * NOTE: SEE GLOSSARY FOR DEFINITIONS

PARAMETER: 29095 Copper ug/L 2009-09-02 PAGE 22 LAB TOTAL AVERAGE SUMMARY OF NO.SAMPLES BIAS BIAS NO. RANK RANK FLAGGING BIAS STATEMENT RANKED % SLOPE BLANK METHOD CODING F003 237.5 23.7 10 ICP-MS F009 339.0 33.9 WH BIASED HIGH* 10 3.9 1.1767 ICP-MS F010 158.0 15.8 10 ICP-MS F011 227.0 22.7 10 F014 113.5 11.3 10 ICP-MS F015 171.5 17.1 10 ICP-MS F020 185.0 18.5 10 ICP-MS F021 251.5 25.1 10 ICP-MS F021b 285.0 28.5 10 ICP-AES F021c 272.5 27.2 10 ICP-MS F022 251.5 25.1 10 ICP-MS F024 149.5 14.9 10 ICP-MS F026 260.5 26.0 10 ICP-AES F032a 111.0 11.1 ALALWLAL 10 ICP-AES-E3386 F032c 116.0 11.6 10 ICP-MS-E3473 F032d 177.5 17.7 10 ICP-MS-E3474 F032g 128.0 12.8 10 ICP-AES-system#2,Opt F042 75.5 9.4 ALWL WL 8 ICP-AES F060 211.0 21.1 10 ICP-MS F068 202.5 20.2 10 ICP-MS F069 150.5 15.0 10 ICP-MS F069b 137.0 13.7 10 ICP-AES F139 108.5 10.8 AH 10 ICP-MS F144 13.0 1.3 WLALALALALALALALALAL BIASED LOW 10 -19.4 1.7157 GFAAS F154 301.5 30.1 WHAHAL BIASED HIGH 10 -14.6 22.1071 ICP-MS F158 337.5 33.7 WH WH BIASED HIGH 10 8.4 -1.0474 ICP-MS F169 188.0 18.8 10 ICP-MS F183 69.0 6.9 WL WL WL BIASED LOW 10 -5.6 -0.7814 ICP-MS F186 99.0 9.9 WL 10 ICP-MS F193 135.5 13.5 10 ICP-MS F196 114.0 14.2 8 ICP-AES F207 173.5 17.3 10 ICP-AES F223 75.5 25.1 INSUFFICIENT DATA 3 AAS F223b 210.0 21.0 WL 10 ICP-AES F248 265.5 26.5 10 ICP-MS F273 292.5 29.2 WH BIASED HIGH* 10 1.0 0.9028 ICP-AES F287 35.0 3.5 AL ALAL WL AL BIASED LOW 10 -34.2 1.9299 ICP-AES * NOTE: INDICATED BIAS STATEMENT IS FOR CAUTION ONLY AND NOT COUNTED IN STUDY STATISTICS PERCENT SLOPE USED FOR CAUTION COMPARISON = 5 OVERALL AVERAGE RANK IS 18.4

FPTM STUDY 0094 DATA SUMMARY 2009-09-02 PAGE 23 PARAMETER: 31095 Gallium ug/L WATER SCIENCE & TECHNOLOGY ENVIRONMENT CANADA EC PT for Trace Elements in Water --------------------------------- SAMPLE 1= 2= 3= 4= 5= 6= 7= 8= 9= 10= TM-23.4 TM-26.4 TM-15.2 TMRain-04 TM25.4 TM-09 TM-16 TMDA-65 TMDA-62.2 TMDA-64.2 LAB NO LAB RESULT LAB RESULT LAB RESULT LAB RESULT LAB RESULT LAB RESULT LAB RESULT LAB RESULT LAB RESULT LAB RESULT ---------- ---------- ---------- ---------- ---------- ---------- ---------- ---------- ---------- ---------- F003 2.09 5.36 0.100 <0.001 8.78 2.90 6.76 0.0816 33.0 52.4 F022 2. 5.26 0.11 <0.01 9.14 3.02 7.23 0.088 33.8 53.8 F024 2.1 5.4 0.1 <0.1 8.8 3.0 6.6 <0.1 33.9 52.7 F139 2.00 5.42 0.099 <0.002 8.82 2.96 6.78 0.078 32.3 51.8 F183 2.13 5.64 0.126 0.022 8.89 3.02 6.82 0.09 34.0 52.6 ASSIGNED VALUE * 2.09 5.40 0.100 0.022 8.82 3.00 6.78 0.0848 33.8 52.6 R-STD DEV * 0.068 0.158 0.0103 - 0.117 0.058 0.220 0.00632 0.83 0.82 ACCEPTABLE LIMITS(+-) * - - - - - - - - - - WARNING LIMITS(+-) * - - - - - - - - - - ACTION LIMITS(<>) * - - - - - - - - - - N * 5 5 5 1 5 5 5 4 5 5 * NOTE: SEE GLOSSARY FOR DEFINITIONS

PARAMETER: 31095 Gallium ug/L 2009-09-02 PAGE 24 LAB TOTAL AVERAGE SUMMARY OF NO.SAMPLES BIAS BIAS NO. RANK RANK FLAGGING BIAS STATEMENT RANKED % SLOPE BLANK METHOD CODING F003 17.5 1.9 9 ICP-MS F022 32.0 3.5 9 ICP-MS F024 23.5 2.9 8 ICP-MS F139 17.5 1.9 9 ICP-MS F183 40.5 4.0 10 ICP-MS NOTE: BIAS WAS NOT ASSESSED BECAUSE STATISTICS FOR FEWER THAN 10 LABS WERE AVAILABLE OVERALL AVERAGE RANK IS 2.9

FPTM STUDY 0094 DATA SUMMARY 2009-09-02 PAGE 25 PARAMETER: 26095 Iron ug/L WATER SCIENCE & TECHNOLOGY ENVIRONMENT CANADA EC PT for Trace Elements in Water --------------------------------- SAMPLE 1= 2= 3= 4= 5= 6= 7= 8= 9= 10= TM-23.4 TM-26.4 TM-15.2 TMRain-04 TM25.4 TM-09 TM-16 TMDA-65 TMDA-62.2 TMDA-64.2 LAB NO LAB RESULT LAB RESULT LAB RESULT LAB RESULT LAB RESULT LAB RESULT LAB RESULT LAB RESULT LAB RESULT LAB RESULT ---------- ---------- ---------- ---------- ---------- ---------- ---------- ---------- ---------- ---------- F003 15.2 22.1 27.1 25.9 31.2 118. 217. 414. 121. 311. F009 <20. <20. 21. 24. 25. 119. 212. 407. 114. 303. F010 15.0 21.7 26.7 24.5 31.6 120. 205. 393. 118. 292. F011 16. 22. 28. 26. 35. 134. 212. 409. 119. 319. F014 16. 21. 26. 27. 32. 124. 220. 432. 121. 319. F015 15. 22. 28. 26. 33. 127. 226. 444. 127. 327. F020 16. 23. 28. 27. 33. 119. 210. 426. 121. 310. F021 <20. <20. <20. <20. WL <20. WL 93.7 WL 180. WL 417. 96.3 AL 290. F021b <20. 23. 27. 25. 31. 117. 208. 417. 118. 304. F022 13. 19. 24. 23. 31. 119. 211. 420. 119. 308. F024 14.4 21.1 25.9 24.9 30.6 118. 208. 418. 118. 302. F026 15. 22. 27. 25. 32. 122. 214. 427. 123. 314. F032a 16.0 22.6 27.9 22.9 32.9 122. 217. 426. 123. 319. F032c <20. <20. <20. <20. WL 23. 110. 201. 438. 111. 317. F032d <50. <50. <50. <50. <50. 110. 205. 435. 117. 309. F032g 13. 20. 25. 24. 28. 116. 249. AH 438. 120. 308. F042 11.7 17.6 22.3 22.9 27.5 109. 196. 422. 110. 297. F060 <20. <20. <20. 24.1 22.5 106. 201. 418. 108. 304. F068 14. 21. 26. 26. 31. 117. 213. 413. 110. 310. F069 15.3 20.7 25.5 23.9 29.6 115. 205. 414. 114. 301. F139 16.2 22.8 28.1 26.5 32.3 126. 217. 442. 128. 168. AL F144 11.4 17.5 20.1 18.8 WL 23.2 105. 190. 343. AL 119. 295. F154 <10. WL <10. AL 17. WL 22. 23. 109. 195. 409. 291. AH 106. AL F158 <50. <50. <50. <50. <50. 97.4 WL 186. WL 404. 98.1 WL 284. F169 14.8 20.6 25.4 24.5 32.0 115. 211. 422. 117. 309. F183 14.3 21.1 26.0 25.0 29.7 118. 204. 414. 118. 295. F186 21. AH 27. AH 31. 33. AH 35. 132. 226. 340. AL 123. 260. WL F193 14.3 21.4 25.9 26.0 31.0 121. 206. 405. 117. 294. F196 9. AL 13. AL 17. WL 15. AL 21. WL 83. AL 162. AL 373. WL 91. AL 259. AL F207 15. 21. 26. 25. 31. 119. 211. 430. 116. 309. F223 <200. <200. <200. <200. <200. <200. 214. 404. <200. 307. F223b <20.0 <20.0 23.9 22.6 29.2 121. 216. 425. 120. 312. F248 <50. <50. <50. <50. <50. 130. 212. 430. 122. 321. F287 7.6 AL 14. AL 18. WL 18.6 AL 23. 106. 198. 397. 106. 0.286 AL ASSIGNED VALUE * 15.0 21.1 26.0 24.9 31.0 118 210 418 118 308 R-STD DEV * 1.80 1.86 2.99 1.98 4.42 9.13 10.9 16.4 6.89 15.1628 ACCEPTABLE LIMITS(+-) * 3.60 3.72 5.98 3.96 8.84 18.26 21.8 32.8 13.78 30.3256 WARNING LIMITS(+-) * 3.60- 5.40 3.72- 5.58 5.98- 8.97 3.96- 5.94 8.84- 13.26 18.26- 27.3921.8- 32.7 32.8- 49.2 13.78- 20.6730.3256- 45. ACTION LIMITS(<>) * 5.40 5.58 8.97 5.94 13.26 27.39 32.7 49.2 20.67 45.4884 N * 23 24 27 28 29 33 34 34 33 34 * NOTE: SEE GLOSSARY FOR DEFINITIONS

PARAMETER: 26095 Iron ug/L 2009-09-02 PAGE 26 LAB TOTAL AVERAGE SUMMARY OF NO.SAMPLES BIAS BIAS NO. RANK RANK FLAGGING BIAS STATEMENT RANKED % SLOPE BLANK METHOD CODING F003 206.0 20.6 10 ICP-MS F009 98.5 12.3 8 ICP-MS F010 143.5 14.3 10 ICP-MS F011 228.0 22.8 10 F014 237.5 23.7 10 ICP-AES F015 265.0 26.5 BIASED HIGH 10 6.6 0.1567 ICP-AES F020 230.5 23.0 10 ICP-MS F021 29.5 5.9 WLWLWLWL AL BIASED LOW 5 7.2 -35.5010 ICP-MS F021b 155.0 17.2 9 ICP-AES F022 141.5 14.1 10 ICP-AES F024 144.5 14.4 10 ICP-MS F026 224.5 22.4 10 ICP-AES F032a 233.0 23.3 10 ICP-AES-E3386 F032c 90.5 15.0 WL 6 ICP-MS-E3473 F032d 86.5 17.3 5 ICP-MS-E3474 F032g 160.5 16.0 AH 10 ICP-AES-system#2,Opt F042 82.0 8.2 10 ICP-AES F060 68.0 9.7 7 ICP-MS F068 152.5 15.2 10 ICP-MS F069 116.0 11.6 10 ICP-AES F139 244.0 24.4 AL BIASED HIGH 10 -10.1 4.8646 ICP-MS F144 59.5 5.9 WL AL BIASED LOW 10 -12.6 1.7085 GFAAS F154 67.5 8.4 WLALWL AHAL 8 ICP-MS F158 21.5 4.3 WLWL WL BIASED LOW* 5 1.8 -24.3239 ICP-MS F169 150.5 15.0 10 ICP-MS F183 134.0 13.4 10 ICP-MS F186 230.0 23.0 AHAH AH AL WL 10 ICP-MS F193 142.0 14.2 10 ICP-MS F196 16.5 1.6 ALALWLALWLALALWLALAL BIASED LOW 10 -11.3 -9.9210 ICP-AES F207 172.5 17.2 10 ICP-AES F223 50.0 16.6 INSUFFICIENT DATA 3 AAS F223b 146.0 18.2 8 ICP-AES F248 140.5 28.1 BIASED HIGH* 5 2.2 3.8492 ICP-MS F287 34.5 3.4 ALALWLAL AL BIASED LOW 10 -32.1 1.3875 ICP-AES * NOTE: INDICATED BIAS STATEMENT IS FOR CAUTION ONLY AND NOT COUNTED IN STUDY STATISTICS PERCENT SLOPE USED FOR CAUTION COMPARISON = 5 OVERALL AVERAGE RANK IS 15.7

FPTM STUDY 0094 DATA SUMMARY 2009-09-02 PAGE 27 PARAMETER: 82095 Lead ug/L WATER SCIENCE & TECHNOLOGY ENVIRONMENT CANADA EC PT for Trace Elements in Water --------------------------------- SAMPLE 1= 2= 3= 4= 5= 6= 7= 8= 9= 10= TM-23.4 TM-26.4 TM-15.2 TMRain-04 TM25.4 TM-09 TM-16 TMDA-65 TMDA-62.2 TMDA-64.2 LAB NO LAB RESULT LAB RESULT LAB RESULT LAB RESULT LAB RESULT LAB RESULT LAB RESULT LAB RESULT LAB RESULT LAB RESULT ---------- ---------- ---------- ---------- ---------- ---------- ---------- ---------- ---------- ---------- F003 3.05 10.6 11.9 0.352 27.4 8.91 24.4 430. 98.4 289. F009 3.0 11. 12. <1. 28. 8.8 25. 423. 100. 285. F010 2.94 10.2 11.4 0.34 26.2 8.53 23.3 392. 91.1 263. F011 2.9 10.6 11.9 0.4 27.1 8.8 24.3 412. 99.3 290. F014 3.1 10. 12. <1.0 27. 8.9 24. 408. 101. 292. F015 3.01 10.4 11.6 0.35 27.2 8.70 23.9 439. 96.2 307. F020 3.09 11. 12.1 0.359 28.1 8.9 24.8 402. 96.6 274. F021 2.9 10.2 11.6 0.3 27.0 8.3 23.0 417. 93.9 276. F021b <20. <20. <20. <20. 23. AL <20. 20. WL 417. 90. 281. F021c 2.9 10.1 11.2 0.3 26.2 8.4 23.1 428. 96.2 291. F022 3.01 10.7 11.7 0.327 27.5 8.87 25.1 432. 96. 297. F024 3.1 10.6 12.0 0.3 27.7 9.0 24.4 436. 101. 297. F026 4. AH 10. 13. <2. 28. 8. 25. 429. 104. 287. F032a <11. 11. <11. <11. 26. <11. 12. AL 411. 98. 284. F032c 2.9 10.2 11.6 0.3 26.9 8.6 23.7 405. 96.4 280. F032d 2.99 10.4 11.6 <1. 26.7 8.65 23.6 417. 96.5 290. F032g <2. AL 8. AL 9. AL 3. AH 25. 7. AL 22. 393. 95. 276. F042 <2. AL 9.11 WL 10.4 WL <2. 26.5 7.43 AL 22.8 453. 100. 302. F060 3.09 10.7 12.0 0.365 27.6 9.16 24.2 432. 94.6 295. F068 3. 10. 11. 0.3 26. 8.9 24. 454. 100. 308. F069 2.46 AL 8.97 WL 12.4 0.335 29.6 7.99 25.7 219. AL 102. 150. AL F139 3.05 10.4 11.5 0.314 26.8 8.59 23.8 423. 94.9 282. F144 3.61 AH 9.58 11.5 <3. 23.9 WL 8.73 22.6 436. 118. AH 282. F154 3.28 11. 12.2 0.37 28.9 9.18 25.7 471. WH 313. AH 105. AL F158 3.0 10.9 12.1 <2. 28.5 9.0 24.8 447. 102. 309. F169 3.00 10.1 11.1 <0.50 26.8 8.55 23.1 413. 98.2 279. F183 2.64 WL 10.3 11.2 0.062 AL 26.0 8.44 22.9 430. 90.8 283. F186 2.1 AL 9.2 10.5 WL <0.1 AL 24.7 7.5 AL 21.4 390. 90.3 261. F193 3.03 10.7 12.0 <0.4 28.0 8.97 24.5 422. 96.9 284. F196 <10. <10. <10. WL <10. 18. AL <10. 15. AL 419. 88. 280. F207 3. 11. 12.5 <0.8 27.5 9.0 24.7 439. 106. 299. F223 <10. 12.6 AH 12.8 <10. 30.4 WH <10. 26.6 F223b <20.0 <20.0 <20.0 <20.0 26.8 <20.0 23.3 441. 102. 301. F248 3.30 WH 11.1 12.3 <1.00 27.0 8.60 24.1 355. AL 95.8 257. F287 <10. <10. 13. <10. 26. <10. 19.8 WL 417. 92. 0.285 AL ASSIGNED VALUE * 3.00 10.40 11.9 0.335 27.0 8.76 24.0 423 96.6 285 R-STD DEV * 0.140 0.608 0.64 0.0413 1.29 0.394 1.43 21.0 5.02 16.3715 ACCEPTABLE LIMITS(+-) * 0.280 1.216 1.28 0.0826 2.58 0.788 2.86 42.0 10.04 32.7430 WARNING LIMITS(+-) * .280- .420 1.216- 1.8241.28- 1.92 .0826- .12392.58- 3.87 .788- 1.182 2.86- 4.29 42.0- 63.0 10.04- 15.0632.7430- 49. ACTION LIMITS(<>) * 0.420 1.824 1.92 0.1239 3.87 1.182 4.29 63.0 15.06 49.1145 N * 27 31 31 17 35 29 35 34 34 34 * NOTE: SEE GLOSSARY FOR DEFINITIONS

PARAMETER: 82095 Lead ug/L 2009-09-02 PAGE 28 LAB TOTAL AVERAGE SUMMARY OF NO.SAMPLES BIAS BIAS NO. RANK RANK FLAGGING BIAS STATEMENT RANKED % SLOPE BLANK METHOD CODING F003 201.0 20.1 10 ICP-MS F009 197.5 21.9 9 ICP-MS F010 86.0 8.6 10 ICP-MS F011 173.0 17.3 10 F014 168.5 18.7 9 ICP-MS F015 184.0 18.4 10 ICP-MS F020 194.5 19.4 10 ICP-MS F021 98.0 9.8 10 ICP-MS F021b 34.5 6.9 AL WL 5 ICP-AES F021c 112.0 11.2 10 ICP-MS F022 200.0 20.0 10 ICP-MS F024 223.5 22.3 10 ICP-MS F026 201.0 22.3 AH 9 ICP-AES F032a 81.0 13.5 AL 6 ICP-AES-E3386 F032c 113.0 11.3 10 ICP-MS-E3473 F032d 131.5 14.6 9 ICP-MS-E3474 F032g 54.5 6.0 ALALALAH AL BIASED LOW 9 -5.8 0.3436 ICP-AES-system#2,Opt F042 114.0 14.2 ALWLWL AL 8 ICP-AES F060 211.0 21.1 10 ICP-MS F068 165.0 16.5 10 ICP-MS F069 144.5 14.4 ALWL AL AL 10 ICP-MS F139 136.0 13.6 10 ICP-MS F144 140.5 15.6 AH WL AH 9 GFAAS F154 256.5 25.6 WHAHAL BIASED HIGH 10 -9.2 17.2043 ICP-MS F158 240.0 26.6 BIASED HIGH 9 6.6 -0.1564 ICP-MS F169 104.0 11.5 9 ICP-MS F183 91.5 9.1 WL AL 10 ICP-MS F186 31.0 3.4 AL WLAL AL BIASED LOW 9 -7.8 -0.3446 ICP-MS F193 190.5 21.1 9 ICP-MS F196 31.5 6.3 WL AL AL BIASED LOW* 5 1.4 -9.4129 ICP-AES F207 234.0 26.0 9 GFAAS F223 130.0 32.5 AH WH INSUFFICIENT DATA 4 GFAAS F223b 117.5 23.5 5 ICP-AES F248 150.5 16.7 WH AL 9 ICP-MS F287 61.5 10.2 WL AL 6 ICP-AES * NOTE: INDICATED BIAS STATEMENT IS FOR CAUTION ONLY AND NOT COUNTED IN STUDY STATISTICS PERCENT SLOPE USED FOR CAUTION COMPARISON = 5 OVERALL AVERAGE RANK IS 16.2

FPTM STUDY 0094 DATA SUMMARY 2009-09-02 PAGE 29 PARAMETER: 03095 Lithium ug/L WATER SCIENCE & TECHNOLOGY ENVIRONMENT CANADA EC PT for Trace Elements in Water --------------------------------- SAMPLE 1= 2= 3= 4= 5= 6= 7= 8= 9= 10= TM-23.4 TM-26.4 TM-15.2 TMRain-04 TM25.4 TM-09 TM-16 TMDA-65 TMDA-62.2 TMDA-64.2 LAB NO LAB RESULT LAB RESULT LAB RESULT LAB RESULT LAB RESULT LAB RESULT LAB RESULT LAB RESULT LAB RESULT LAB RESULT ---------- ---------- ---------- ---------- ---------- ---------- ---------- ---------- ---------- ---------- F003 2.14 5.23 16.4 0.539 24.9 4.20 10.6 179. 61.9 156. F010 2.10 4.96 15.5 0.56 25.2 4.43 10.3 182. 61.3 152. F011 1.9 4.8 14.7 0.6 23.3 4.0 9.6 179. 59.3 152. F015 2.22 5.43 WH 16.3 0.56 25.6 4.59 10.7 198. 64.1 169. F020 1.8 5. 15. <0.5 24.2 4.2 9.6 195. 60.7 149. F022 2.2 5.07 14.5 0.496 22.9 4.42 10.2 180. 57.5 148. F024 2.1 4.9 14.2 0.5 22.8 4.0 9.4 177. 55.9 147. F060 2.01 4.94 15.3 <1. 23.4 4.09 9.56 176. 57.2 150. F069 1.98 5.04 15.1 <1.0 24.9 4.26 9.96 164. 54.4 137. F069b 2.21 5.4 15.9 0.446 24.4 4.61 10.4 186. 63.9 164. F139 1.89 4.81 14.4 0.516 22.2 4.34 9.69 165. 57.5 154. F154 1.79 4.85 14.8 0.44 24.4 4.37 11. 194. 162. AH 60.4 AL F183 2.09 5.04 15.4 0.569 25.6 4.16 9.95 196. 61.2 171. F196 <40. <40. <40. <40. <40. <40. <40. <40. AL 67. 174. F223b <10.0 <10.0 12.6 WL <10.0 19.7 AL <10.0 <10.0 179. 52.9 161. F287 <60. <60. <60. <60. <60. <60. <60. 186. <60. 157. ASSIGNED VALUE * 2.09 5.00 15.0 0.528 24.4 4.26 9.96 180 60.0 154 R-STD DEV * 0.171 0.201 0.87 0.0600 1.40 0.227 0.554 11.5 4.93 12.33 ACCEPTABLE LIMITS(+-) * 0.342 0.402 1.74 0.1200 2.80 0.454 1.108 23.0 9.86 24.66 WARNING LIMITS(+-) * .342- .513 .402- .603 1.74- 2.61 .1200- .18002.80- 4.20 .454- .681 1.108- 1.66223.0- 34.5 9.86- 14.79 24.66- 36.99 ACTION LIMITS(<>) * 0.513 0.603 2.61 0.1800 4.20 0.681 1.662 34.5 14.79 36.99 N * 13 13 14 10 14 13 13 15 15 16 * NOTE: SEE GLOSSARY FOR DEFINITIONS

PARAMETER: 03095 Lithium ug/L 2009-09-02 PAGE 30 LAB TOTAL AVERAGE SUMMARY OF NO.SAMPLES BIAS BIAS NO. RANK RANK FLAGGING BIAS STATEMENT RANKED % SLOPE BLANK METHOD CODING F003 95.0 9.5 10 ICP-MS F010 91.5 9.1 10 ICP-MS F011 50.5 5.0 10 F015 126.0 12.6 WH BIASED HIGH 10 10.2 -0.4942 ICP-MS F020 58.0 6.4 9 ICP-MS F022 67.5 6.7 10 ICP-MS F024 34.0 3.4 BIASED LOW* 10 -2.6 -0.5389 ICP-MS F060 44.0 4.8 9 ICP-MS F069 51.0 5.6 9 ICP-MS F069b 105.0 10.5 10 ICP-AES F139 44.5 4.4 10 ICP-MS F154 69.5 6.9 AHAL 10 ICP-MS F183 96.0 9.6 10 ICP-MS F196 30.0 15.0 AL INSUFFICIENT DATA 2 ICP-AES F223b 21.0 4.2 WL AL 5 ICP-AES F287 21.5 10.7 INSUFFICIENT DATA 2 ICP-AES * NOTE: INDICATED BIAS STATEMENT IS FOR CAUTION ONLY AND NOT COUNTED IN STUDY STATISTICS PERCENT SLOPE USED FOR CAUTION COMPARISON = 5 OVERALL AVERAGE RANK IS 7.3

FPTM STUDY 0094 DATA SUMMARY 2009-09-02 PAGE 31 PARAMETER: 25095 Manganese ug/L WATER SCIENCE & TECHNOLOGY ENVIRONMENT CANADA EC PT for Trace Elements in Water --------------------------------- SAMPLE 1= 2= 3= 4= 5= 6= 7= 8= 9= 10= TM-23.4 TM-26.4 TM-15.2 TMRain-04 TM25.4 TM-09 TM-16 TMDA-65 TMDA-62.2 TMDA-64.2 LAB NO LAB RESULT LAB RESULT LAB RESULT LAB RESULT LAB RESULT LAB RESULT LAB RESULT LAB RESULT LAB RESULT LAB RESULT ---------- ---------- ---------- ---------- ---------- ---------- ---------- ---------- ---------- ---------- F003 8.84 10.9 18.2 6.58 25.8 10.0 28.4 402. 94.3 296. F009 9.2 11. 19. 7.2 27. WH 11. AH 31. AH 423. 98. 304. F010 8.99 10.9 18.1 6.93 25.2 10.0 28.0 410. 90.7 296. F011 8.4 10.8 17.8 6.8 24.7 9.8 27.9 405. 95.6 292. F014 9. 11. 18. 7. 25. 10. 28. 415. 93. 291. F015 8.84 10.8 18.1 6.85 25.4 9.98 28.6 429. 94.6 294. F020 8.98 11.3 18.7 6.63 26.7 WH 9.94 28.9 419. 95.6 301. F021 8.7 10.3 17.4 6.6 25.2 9.8 27.0 406. 91.7 293. F021b 9. 11. 18. 7. 25. 10. 29. 412. 95. 296. F022 9.13 11.1 18.3 6.73 25.8 10.2 30.0 413. 95. 295. F024 9.0 11.2 18.2 6.8 25.6 10.2 28.7 419. 94.8 299. F026 8. WL 11. 19. 7. 26. 10. 29. 417. 97. 298. F032a 9.0 11.0 18.8 5.9 WL 26.2 10.0 29.4 417. 98.7 307. F032c 8.6 10.6 17.9 6.7 25.0 9.8 27.7 392. 93.7 288. F032d 8.87 10.9 18.3 6.83 25.1 9.99 28.7 414. 96.2 299. F032g 8.78 10.9 18.3 6.88 25.5 9.87 29.5 410. 100. 294. F042 8.93 11.0 18.2 7.06 25.5 10.0 28.5 416. 93.0 293. F060 9.1 11.7 WH 18.5 6.1 25.6 9.3 WL 29.1 422. 97.5 307. F068 7.9 WL 9.8 AL 16. AL 6. WL 22. AL 9.1 WL 27. 396. 88. WL 284. F069 8.41 10.7 17.8 6.49 24.7 9.77 27.6 391. 90.0 284. F069b 8.85 10.7 17.6 6.77 25. 9.8 28.1 408. 93.1 289. F139 8.8 10.9 18.3 6.6 25.3 10.1 28.8 409. 95.1 301. F144 10.6 AH 14.0 AH 20.9 AH 7.63 WH 31.2 AH 11.8 AH 33.3 AH 537. AH 122. AH 385. AH F154 9.34 10.9 18.4 6.68 25.6 10.3 28.2 445. WH 314. AH 98.5 AL F158 8.6 11.0 17.9 7.1 25.4 9.8 28.2 421. 97.3 301. F169 8.96 10.9 18.2 6.74 25.9 9.93 28.6 408. 96.8 293. F183 8.18 11.4 17.9 6.21 25.9 10.5 29.5 387. 98.3 265. AL F186 8.5 10.7 17.7 6.1 25.5 9.5 28.4 412. 101. 297. F193 8.53 10.6 17.9 6.44 25.2 9.73 28.2 401. 94.5 290. F196 9. 11. 18. 7. 25. 10. 28. 401. 93. 288. F223 <100. <100. <100. <100. <100. <100. <100. 421. <100. 293. F223b 8.3 10.3 17.5 6.6 25.1 9.3 WL 28.5 405. 95.2 300. F248 9.20 11.4 18.7 6.70 26.9 WH 10.5 29.0 428. 97.5 305. F287 <100. 9.9 AL 17. WL 182. AH 24. WL 8.71 AL 26.6 WL 394. 90. 0.279 AL ASSIGNED VALUE * 8.85 10.9 18.1 6.74 25.4 9.98 28.5 412 95.0 295.500 R-STD DEV * 0.356 0.31 0.49 0.340 0.61 0.316 0.80 12.4 3.37 8.1332 ACCEPTABLE LIMITS(+-) * 0.712 0.62 0.98 0.680 1.22 0.632 1.60 24.8 6.74 16.2664 WARNING LIMITS(+-) * .712- 1.068 .62- .93 .98- 1.47 .680- 1.020 1.22- 1.83 .632- .948 1.60- 2.40 24.8- 37.2 6.74- 10.11 16.2664- 24. ACTION LIMITS(<>) * 1.068 0.93 1.47 1.020 1.83 0.948 2.40 37.2 10.11 24.3996 N * 32 33 33 33 33 33 33 34 33 34 * NOTE: SEE GLOSSARY FOR DEFINITIONS

PARAMETER: 25095 Manganese ug/L 2009-09-02 PAGE 32 LAB TOTAL AVERAGE SUMMARY OF NO.SAMPLES BIAS BIAS NO. RANK RANK FLAGGING BIAS STATEMENT RANKED % SLOPE BLANK METHOD CODING F003 156.5 15.6 10 ICP-MS F009 297.5 29.7 WHAHAH BIASED HIGH* 10 2.7 0.5726 ICP-MS F010 158.5 15.8 10 ICP-MS F011 102.0 10.2 10 F014 161.5 16.1 10 ICP-MS F015 176.0 17.6 10 ICP-MS F020 230.5 23.0 WH 10 ICP-MS F021 82.5 8.2 10 ICP-MS F021b 193.5 19.3 10 ICP-AES F022 230.0 23.0 10 ICP-MS F024 225.0 22.5 10 ICP-MS F026 226.5 22.6 WL 10 ICP-AES F032a 241.0 24.1 WL 10 ICP-AES-E3386 F032c 81.5 8.1 10 ICP-MS-E3473 F032d 190.0 19.0 10 ICP-MS-E3474 F032g 197.0 19.7 10 ICP-AES-system#2,Opt F042 188.5 18.8 10 ICP-AES F060 229.0 22.9 WH WL 10 ICP-AES F068 21.0 2.1 WLALALWLALWL WL BIASED LOW* 10 -3.5 -1.2134 ICP-MS F069 52.0 5.2 BIASED LOW* 10 -4.7 0.3134 ICP-MS F069b 103.5 10.3 10 ICP-AES F139 183.5 18.3 10 ICP-MS F144 329.0 32.9 AHAHAHWHAHAHAHAHAHAH BIASED HIGH 10 30.9 -1.8090 GFAAS F154 216.0 21.6 WHAHAL 10 ICP-MS F158 190.5 19.0 10 ICP-MS F169 177.5 17.7 10 ICP-MS F183 167.5 16.7 AL 10 ICP-MS F186 133.5 13.3 10 ICP-MS F193 88.5 8.8 10 ICP-MS F196 143.5 14.3 10 ICP-AES F223 41.0 20.5 INSUFFICIENT DATA 2 AAS F223b 105.5 10.5 WL 10 ICP-AES F248 277.0 27.7 WH BIASED HIGH* 10 3.8 -0.1674 ICP-MS F287 48.5 5.3 ALWLAHWLALWL AL BIASED LOW 9 -44.3 27.8640 ICP-AES * NOTE: INDICATED BIAS STATEMENT IS FOR CAUTION ONLY AND NOT COUNTED IN STUDY STATISTICS PERCENT SLOPE USED FOR CAUTION COMPARISON = 5 OVERALL AVERAGE RANK IS 17.0

FPTM STUDY 0094 DATA SUMMARY 2009-09-02 PAGE 33 PARAMETER: 42095 Molybdenum ug/L WATER SCIENCE & TECHNOLOGY ENVIRONMENT CANADA EC PT for Trace Elements in Water --------------------------------- SAMPLE 1= 2= 3= 4= 5= 6= 7= 8= 9= 10= TM-23.4 TM-26.4 TM-15.2 TMRain-04 TM25.4 TM-09 TM-16 TMDA-65 TMDA-62.2 TMDA-64.2 LAB NO LAB RESULT LAB RESULT LAB RESULT LAB RESULT LAB RESULT LAB RESULT LAB RESULT LAB RESULT LAB RESULT LAB RESULT ---------- ---------- ---------- ---------- ---------- ---------- ---------- ---------- ---------- ---------- F003 4.08 7.56 14.2 0.204 27.3 12.2 30.7 384. 102. 295. F009 <5. 6.9 WL 13. <5. 26. 12. 29. 370. 100. 280. F010 4.20 7.78 14.6 0.25 27.8 12.7 31.7 385. 100. 289. F011 3.8 WL 7.3 13.8 0.4 AH 26.3 12.0 29.7 379. 100. 292. F015 4.16 7.62 14.3 0.24 27.8 12.6 31.7 388. 102. 297. F020 4.16 7.75 14.4 0.23 28.5 12.7 31.4 386. 106. 296. F021 4.1 7.2 14.0 0.2 26.8 12.0 29.2 380. 97.6 286. F021b <5. 8. 13. <5. 26. 12. 29. 374. 99. 280. F021c 4. 7. 13. <4. 25. 12. 28. 370. 100. 280. F022 4.24 7.92 14.7 0.233 28.3 13.5 32.8 381. 103. 288. F024 4.0 7.1 13.6 0.2 26.4 11.8 29.4 372. 100. 281. F026 <5. 8. 14. <5. 28. 13. 31. 390. 103. 292. F032a 4.5 7.7 15.0 <1.5 28.7 13.3 32.0 392. 104. 301. F032c 4.1 7.5 14.1 <1.0 27.6 12.5 30.9 373. 102. 293. F032d 4.24 7.80 14.5 <1. 28.0 12.6 31.4 393. 103. 297. F032g 4.4 7.5 14.2 <0.7 26.7 12.3 30. 369. 99.2 280. F060 4.25 7.69 14.6 <1. 27.9 12.6 31.2 384. 99.9 288. F068 4.2 7.7 14. 0.2 27. 12. 31. 418. WH 98. 328. WH F069 4.25 7.81 14.6 0.202 28.2 12.7 32.4 393. 106. 306. F069b 4.4 7.6 14.6 <2.0 29.8 WH 13.4 32.6 414. WH 105. 304. F139 4.18 7.61 14.3 0.262 27.1 12.6 30.9 389. 101. 300. F154 4.27 7.7 14.6 0.25 28.2 12.9 31.3 442. AH 317. AH 106. AL F158 <10. <10. 13.8 <10. 26.7 12.2 30.5 393. 100. 294. F183 3.83 7.12 14.1 0.184 26.6 11.7 31.2 393. 101. 294. F186 3.4 AL 6.4 AL 12.1 AL <0.1 AL 23.6 WL 10.2 AL 26.1 WL 343. AL 89.7 AL 262. WL F193 4.10 7.72 13.7 <0.6 26.8 12.3 30.9 381. 101. 293. F196 <20. <20. <20. <20. <20. AL <20. 22. AL 352. WL 98. 273. F223b <20.0 <20.0 <20.0 <20.0 26. <20.0 29.5 392. 102. 296. F248 <5.0 7.4 13.2 <5.0 24.2 WL 10.4 AL 27.4 345. WL 90.6 AL 269. F287 <7. <100. <100. 0. AL <100. 10.4 AL 27.0 WL 381. <100. 0.284 AL ASSIGNED VALUE * 4.18 7.62 14.2 0.217 27.0 12.5 30.9 384 101 292.500 R-STD DEV * 0.178 0.345 0.64 0.0360 1.20 0.62 1.73 13.1 2.85 12.7020 ACCEPTABLE LIMITS(+-) * 0.356 0.690 1.28 0.0720 2.40 1.24 3.46 26.2 5.70 25.4040 WARNING LIMITS(+-) * .356- .534 .690- 1.035 1.28- 1.92 .0720- .10802.40- 3.60 1.24- 1.86 3.46- 5.19 26.2- 39.3 5.70- 8.55 25.4040- 38. ACTION LIMITS(<>) * 0.534 1.035 1.92 0.1080 3.60 1.86 5.19 39.3 8.55 38.1060 N * 22 26 27 14 28 28 30 30 29 30 * NOTE: SEE GLOSSARY FOR DEFINITIONS

PARAMETER: 42095 Molybdenum ug/L 2009-09-02 PAGE 34 LAB TOTAL AVERAGE SUMMARY OF NO.SAMPLES BIAS BIAS NO. RANK RANK FLAGGING BIAS STATEMENT RANKED % SLOPE BLANK METHOD CODING F003 138.0 13.8 10 ICP-MS F009 49.5 6.1 WL BIASED LOW* 8 -3.7 0.0274 ICP-MS F010 177.5 17.7 10 ICP-MS F011 95.0 9.5 WL AH 10 F015 177.5 17.7 10 ICP-MS F020 197.0 19.7 10 ICP-MS F021 83.0 8.3 10 ICP-MS F021b 71.0 8.8 8 ICP-AES F021c 51.5 5.7 BIASED LOW* 9 -3.6 -0.2677 ICP-MS F022 206.0 20.6 10 ICP-MS F024 69.0 6.9 BIASED LOW* 10 -3.3 0.0905 ICP-MS F026 161.0 20.1 8 ICP-AES F032a 220.5 24.5 BIASED HIGH* 9 2.3 0.5513 ICP-AES-E3386 F032c 125.0 13.8 9 ICP-MS-E3473 F032d 194.0 21.5 9 ICP-MS-E3474 F032g 101.0 11.2 9 ICP-AES-system#2,Opt F060 150.5 16.7 9 ICP-MS F068 150.0 15.0 WH WH 10 ICP-MS F069 225.0 22.5 BIASED HIGH* 10 3.2 0.3985 ICP-MS F069b 221.5 24.6 WH WH BIASED HIGH 9 6.6 -0.5591 ICP-AES F139 167.0 16.7 10 ICP-MS F154 201.0 20.1 AHAHAL 10 ICP-MS F158 101.0 14.4 7 ICP-MS F183 118.0 11.8 10 ICP-MS F186 12.0 1.3 ALALALALWLALWLALALWL BIASED LOW 9 -10.3 -0.7131 ICP-MS F193 123.5 13.7 9 ICP-MS F196 13.5 3.3 AL ALWL INSUFFICIENT DATA 4 ICP-AES F223b 79.5 15.9 5 ICP-AES F248 29.5 3.6 WLAL WLAL BIASED LOW 8 -9.3 -0.0736 ICP-MS F287 20.5 4.1 AL ALWL AL BIASED LOW 5 -33.2 -12.4411 ICP-AES * NOTE: INDICATED BIAS STATEMENT IS FOR CAUTION ONLY AND NOT COUNTED IN STUDY STATISTICS PERCENT SLOPE USED FOR CAUTION COMPARISON = 5 OVERALL AVERAGE RANK IS 14.1

FPTM STUDY 0094 DATA SUMMARY 2009-09-02 PAGE 35 PARAMETER: 28095 Nickel ug/L WATER SCIENCE & TECHNOLOGY ENVIRONMENT CANADA EC PT for Trace Elements in Water --------------------------------- SAMPLE 1= 2= 3= 4= 5= 6= 7= 8= 9= 10= TM-23.4 TM-26.4 TM-15.2 TMRain-04 TM25.4 TM-09 TM-16 TMDA-65 TMDA-62.2 TMDA-64.2 LAB NO LAB RESULT LAB RESULT LAB RESULT LAB RESULT LAB RESULT LAB RESULT LAB RESULT LAB RESULT LAB RESULT LAB RESULT ---------- ---------- ---------- ---------- ---------- ---------- ---------- ---------- ---------- ---------- F003 4.85 11.2 17.7 0.911 16.0 19.5 70.5 396. 97.8 268. F009 5.1 11. 19. <1. 17. 20. 71. 407. 99. 274. F010 5.00 11.0 17.9 0.92 16.3 19.3 68.0 384. 95. 254. F011 5.0 10.9 17.3 0.9 15.8 19.5 68.5 390. 97.0 261. F014 <5. 11. 18. <5. 16. 19. 68. 390. 99. 269. F015 5.68 11.8 18.1 0.94 16.4 19.7 68.2 387. 95.1 257. F020 4.8 11.2 17.7 0.9 16.7 19.5 69.9 396. 97.9 265. F021 4.9 10.6 17.3 0.8 15.9 18.4 64.6 377. 92.5 252. F021b <6. 9. AL 16. WL <6. 16. 20. 68. 397. 96. 263. F021c 4.6 10.6 16.4 0.9 15.3 18.2 65.7 395. 92.8 249. F022 4.84 11.4 17.6 0.853 15.7 19.6 69.9 403. 98. 264. F024 4.7 10.9 17.3 0.9 15.7 18.9 67.4 393. 97.8 262. F026 5. 11. 18. <2. 17. 20. 71. 403. 101. 270. F032a 5.8 WH 11.6 19.1 <1.5 15.9 19.6 72.2 399. 99.5 273. F032c 5.6 12.1 18.2 <1.0 16.3 20.0 68.7 391. 96.8 256. F032d 4.91 11.0 17.7 1.01 16.9 19.6 68.9 395. 98.3 261. F032g 5.3 11.2 18.1 0.6 AL 16.2 19.4 69.8 381. 99.2 262. F042 3.97 WL 9.45 WL 15.9 WL <2. 14.7 WL 17.2 AL 64.7 379. 89.5 WL 250. F060 4.83 11.2 17.5 0.928 16.2 19.1 68.0 379. 96.0 258. F068 4.9 11. 17. 0.9 15. 19. 70. 400. 94. 264. F069 5.05 11.7 18.4 0.941 16.4 19.3 70.6 385. 94.5 258. F069b <4.0 WL 10.4 16.3 <4.0 15.3 18.1 WL 64.1 WL 370. 90.6 WL 242. F139 5.00 11.5 18.0 0.844 16.0 19.7 68.7 389. 96.6 278. F144 4.01 WL 9.95 15.8 WL <0.3 AL 13.9 AL 17.0 AL 65.3 355. WL 93.2 218. AL F154 5.16 11.5 18. 0.92 16.2 20. 69.2 417. WH 271. AH 99.8 AL F158 5.3 11.9 18.6 <2. 17.2 20.0 71.0 420. WH 101. 282. F169 5.06 11.2 17.7 0.93 16.2 18.6 69.5 397. 97.5 264. F183 4.96 11.5 17.5 1.40 AH 15.8 19.6 67.1 387. 98.2 266. F186 4.2 WL 10.6 18.3 <0.2 AL 16.0 19.1 72. 397. 98.9 271. F193 5.26 11.5 18.1 1.43 AH 16.6 19.7 68.7 375. 94.3 254. F196 5. 11. 18. <1. 16. 19. 68. 379. 95. 254. F223b 4.1 WL 10.6 17.4 <4.0 15.8 19.6 71.5 384. 102. 265. F248 4.80 11.4 17.6 <1.00 16.9 19.4 69.3 401. 96.9 264. F273 6.38 AH 11.6 17.5 1.72 AH 16.1 19.1 69.8 408. 100. 267. F287 <7.0 9.2 AL 16. WL <7.0 15. 17.1 AL 64.5 377. 94. 0.250 AL ASSIGNED VALUE * 4.98 11.20 17.7 0.906 16.0 19.5 68.7 391 97.0 263.500 R-STD DEV * 0.357 0.549 0.73 0.0733 0.63 0.63 2.23 12.3 3.10 10.0282 ACCEPTABLE LIMITS(+-) * 0.714 1.098 1.46 0.1466 1.26 1.26 4.46 24.6 6.20 20.0564 WARNING LIMITS(+-) * .714- 1.071 1.098- 1.6471.46- 2.19 .1466- .21991.26- 1.89 1.26- 1.89 4.46- 6.69 24.6- 36.9 6.20- 9.30 20.0564- 30. ACTION LIMITS(<>) * 1.071 1.647 2.19 0.2199 1.89 1.89 6.69 36.9 9.30 30.0846 N * 31 35 35 20 35 35 35 35 35 35 * NOTE: SEE GLOSSARY FOR DEFINITIONS

PARAMETER: 28095 Nickel ug/L 2009-09-02 PAGE 36 LAB TOTAL AVERAGE SUMMARY OF NO.SAMPLES BIAS BIAS NO. RANK RANK FLAGGING BIAS STATEMENT RANKED % SLOPE BLANK METHOD CODING F003 196.0 19.6 10 ICP-MS F009 261.5 29.0 BIASED HIGH* 9 4.2 -0.2578 ICP-MS F010 147.5 14.7 10 ICP-MS F011 139.5 13.9 10 F014 149.5 18.6 8 ICP-MS F015 212.0 21.2 10 ICP-MS F020 198.5 19.8 10 ICP-MS F021 67.0 6.7 BIASED LOW* 10 -3.7 -0.2269 ICP-MS F021b 122.0 15.2 ALWL 8 ICP-AES F021c 71.5 7.1 BIASED LOW* 10 -0.5 -1.6144 ICP-MS F022 186.0 18.6 10 ICP-MS F024 113.0 11.3 10 ICP-MS F026 247.0 27.4 BIASED HIGH* 9 3.1 0.1012 ICP-AES F032a 256.0 28.4 WH BIASED HIGH* 9 2.5 0.6013 ICP-AES-E3386 F032c 213.0 23.6 9 ICP-MS-E3473 F032d 200.0 20.0 10 ICP-MS-E3474 F032g 195.5 19.5 AL 10 ICP-AES-system#2,Opt F042 29.0 3.2 WLWLWL WLAL WL BIASED LOW* 9 -3.1 -1.7274 ICP-AES F060 136.5 13.6 10 ICP-MS F068 138.0 13.8 10 ICP-MS F069 207.5 20.7 10 ICP-MS F069b 28.5 3.5 WL WLWL WL BIASED LOW 8 -5.9 -0.4441 ICP-AES F139 198.0 19.8 10 ICP-MS F144 23.0 2.5 WL WLALALAL WL AL BIASED LOW 9 -11.3 0.5506 GFAAS F154 233.0 23.3 WHAHAL 10 ICP-MS F158 294.5 32.7 WH BIASED HIGH 9 7.6 -0.9236 ICP-MS F169 192.5 19.2 10 ICP-MS F183 178.0 17.8 AH 10 ICP-MS F186 188.0 20.8 WL AL 9 ICP-MS F193 193.5 19.3 AH 10 ICP-MS F196 121.0 13.4 9 ICP-AES F223b 157.5 17.5 WL 9 ICP-AES F248 185.0 20.5 9 ICP-MS F273 242.0 24.2 AH AH 10 ICP-AES F287 25.0 3.1 ALWL AL AL BIASED LOW 8 -30.7 -2.3393 ICP-AES * NOTE: INDICATED BIAS STATEMENT IS FOR CAUTION ONLY AND NOT COUNTED IN STUDY STATISTICS PERCENT SLOPE USED FOR CAUTION COMPARISON = 5 OVERALL AVERAGE RANK IS 17.3
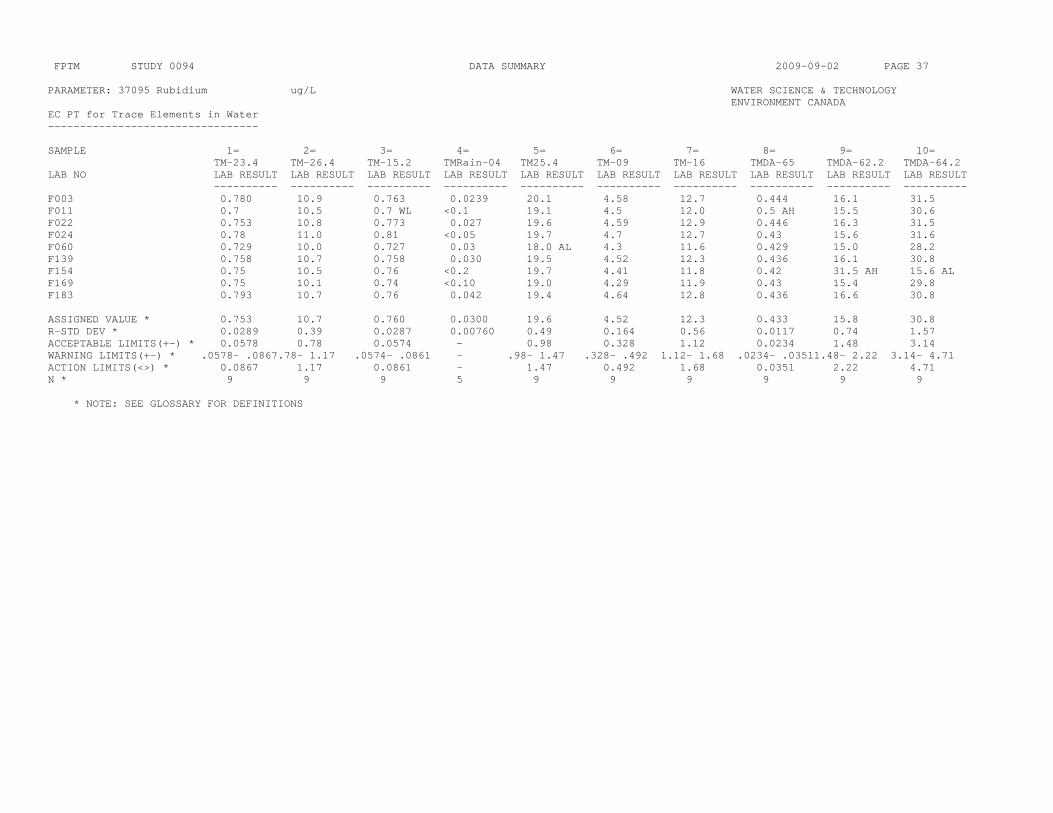
FPTM STUDY 0094 DATA SUMMARY 2009-09-02 PAGE 37 PARAMETER: 37095 Rubidium ug/L WATER SCIENCE & TECHNOLOGY ENVIRONMENT CANADA EC PT for Trace Elements in Water --------------------------------- SAMPLE 1= 2= 3= 4= 5= 6= 7= 8= 9= 10= TM-23.4 TM-26.4 TM-15.2 TMRain-04 TM25.4 TM-09 TM-16 TMDA-65 TMDA-62.2 TMDA-64.2 LAB NO LAB RESULT LAB RESULT LAB RESULT LAB RESULT LAB RESULT LAB RESULT LAB RESULT LAB RESULT LAB RESULT LAB RESULT ---------- ---------- ---------- ---------- ---------- ---------- ---------- ---------- ---------- ---------- F003 0.780 10.9 0.763 0.0239 20.1 4.58 12.7 0.444 16.1 31.5 F011 0.7 10.5 0.7 WL <0.1 19.1 4.5 12.0 0.5 AH 15.5 30.6 F022 0.753 10.8 0.773 0.027 19.6 4.59 12.9 0.446 16.3 31.5 F024 0.78 11.0 0.81 <0.05 19.7 4.7 12.7 0.43 15.6 31.6 F060 0.729 10.0 0.727 0.03 18.0 AL 4.3 11.6 0.429 15.0 28.2 F139 0.758 10.7 0.758 0.030 19.5 4.52 12.3 0.436 16.1 30.8 F154 0.75 10.5 0.76 <0.2 19.7 4.41 11.8 0.42 31.5 AH 15.6 AL F169 0.75 10.1 0.74 <0.10 19.0 4.29 11.9 0.43 15.4 29.8 F183 0.793 10.7 0.76 0.042 19.4 4.64 12.8 0.436 16.6 30.8 ASSIGNED VALUE * 0.753 10.7 0.760 0.0300 19.6 4.52 12.3 0.433 15.8 30.8 R-STD DEV * 0.0289 0.39 0.0287 0.00760 0.49 0.164 0.56 0.0117 0.74 1.57 ACCEPTABLE LIMITS(+-) * 0.0578 0.78 0.0574 - 0.98 0.328 1.12 0.0234 1.48 3.14 WARNING LIMITS(+-) * .0578- .0867.78- 1.17 .0574- .0861 - .98- 1.47 .328- .492 1.12- 1.68 .0234- .03511.48- 2.22 3.14- 4.71 ACTION LIMITS(<>) * 0.0867 1.17 0.0861 - 1.47 0.492 1.68 0.0351 2.22 4.71 N * 9 9 9 5 9 9 9 9 9 9 * NOTE: SEE GLOSSARY FOR DEFINITIONS

PARAMETER: 37095 Rubidium ug/L 2009-09-02 PAGE 38 LAB TOTAL AVERAGE SUMMARY OF NO.SAMPLES BIAS BIAS NO. RANK RANK FLAGGING BIAS STATEMENT RANKED % SLOPE BLANK METHOD CODING F003 65.0 6.5 10 ICP-MS F011 32.5 3.6 WL AH 9 F022 66.5 6.6 10 ICP-MS F024 65.0 7.2 9 ICP-MS F060 17.5 1.7 AL 10 ICP-MS F139 50.5 5.0 10 ICP-MS F154 36.0 4.0 AHAL 9 ICP-MS F169 23.0 2.5 9 ICP-MS F183 64.0 6.4 10 ICP-MS NOTE: BIAS WAS NOT ASSESSED BECAUSE STATISTICS FOR FEWER THAN 10 LABS WERE AVAILABLE OVERALL AVERAGE RANK IS 4.8

FPTM STUDY 0094 DATA SUMMARY 2009-09-02 PAGE 39 PARAMETER: 34095 Selenium ug/L WATER SCIENCE & TECHNOLOGY ENVIRONMENT CANADA EC PT for Trace Elements in Water --------------------------------- SAMPLE 1= 2= 3= 4= 5= 6= 7= 8= 9= 10= TM-23.4 TM-26.4 TM-15.2 TMRain-04 TM25.4 TM-09 TM-16 TMDA-65 TMDA-62.2 TMDA-64.2 LAB NO LAB RESULT LAB RESULT LAB RESULT LAB RESULT LAB RESULT LAB RESULT LAB RESULT LAB RESULT LAB RESULT LAB RESULT ---------- ---------- ---------- ---------- ---------- ---------- ---------- ---------- ---------- ---------- F003 4.47 5.34 15.0 0.804 28.6 14.1 22.6 196. 54.1 156. F009 4.7 5.7 17. <1. 34. 16. 25. 229. WH 60. 178. WH F010 4.52 5.29 14.4 0.81 27.1 13.6 20.3 189. 47.7 145. F011 4.5 5.0 14.6 0.9 30.0 14.8 21.3 184. 51.4 146. F014 4.7 5.1 14. <1.5 29. 14. 22. 187. 53. 153. F015 4.8 5.7 14.9 0.9 29.5 15.0 22.8 193. 53.5 154. F020 4.42 5.26 14.5 0.8 28.4 13.8 21.9 194. 52.4 152. F021 4.3 4.9 14.3 0.7 28.1 13.9 21.4 193. 51.1 145. F021c 4.4 5.3 14.7 0.8 29.2 14.0 22.2 197. 54.3 153. F022 4.92 4.97 14.8 1.1 WH 29.6 15.7 24.1 203. 54.8 159. F024 4.6 5.7 15.4 0.8 29.8 14.6 23.6 196. 55.0 151. F026 <15. <15. 17. <15. 27. 15. 24. 188. 51. 148. F032 4.2 5.0 13.7 0.8 27.0 13.2 22.3 188. 49.4 143. F032c 5. 6. 16. <1. 32. 16. 24. 213. 58. 164. F032d 4.6 5.40 15.5 <1. 31.5 15.0 23.3 204. 55.2 158. F042 7.22 AH 7.87 AH 16.1 <1. 27.9 15.9 23.9 184. 50.6 141. F060 4.71 5.84 15.9 0.874 31.4 15.4 24.0 211. 58.0 162. F068 4.6 5.7 15. 0.9 29. 14. 22. 200. 55. 153. F069 5.21 6.14 17.1 0.954 33.9 16.4 25.9 211. 66.3 AH 165. F139 4.11 5.07 14.3 0.69 27.2 14.1 21.2 188. 51.8 144. F154 5.2 6.2 16.6 1.1 WH 33. 16.5 24.6 213. 154. AH 59.8 AL F158 5.3 6.2 17.6 WH <2. 34.8 16.3 26.8 WH 209. 62.5 WH 179. WH F169 4.82 5.17 14.9 0.81 29.4 14.3 22.4 197. 53.5 155. F183 4.61 6.06 15.7 <1.0 33.4 16.7 24.4 203. 56.4 164. F186 4.0 3.0 AL 14. <1.0 31. 13. 24. 210. 55. 161. F193 4.54 5.36 14.7 0.79 29.2 14.4 22.4 199. 53.4 156. F196 4. 5. 14. <2. 24. 17. 21. 202. 51. 147. F223 4.4 5.1 14.9 <4. 30.0 14.8 23.5 56.6 F248 4.50 5.40 14.5 <2.50 27.5 13.7 21.8 199. 51.7 148. F287 1.09 AL 13.8 AH 28. AH 0. AL 50.9 AH 13.0 36.2 AH 441. AH 1235. AH 0.181 AL ASSIGNED VALUE * 4.60 5.35 14.9 0.810 29.4 14.7 22.8 198 53.5 153 R-STD DEV * 0.404 0.542 1.19 0.1084 2.72 1.29 1.61 11.2 3.97 9.7241 ACCEPTABLE LIMITS(+-) * 0.808 1.084 2.38 0.2168 5.44 2.58 3.22 22.4 7.94 19.4482 WARNING LIMITS(+-) * .808- 1.212 1.084- 1.6262.38- 3.57 .2168- .32525.44- 8.16 2.58- 3.87 3.22- 4.83 22.4- 33.6 7.94- 11.91 19.4482- 29. ACTION LIMITS(<>) * 1.212 1.626 3.57 0.3252 8.16 3.87 4.83 33.6 11.91 29.1723 N * 29 29 30 18 30 30 30 29 30 29 * NOTE: SEE GLOSSARY FOR DEFINITIONS

PARAMETER: 34095 Selenium ug/L 2009-09-02 PAGE 40 LAB TOTAL AVERAGE SUMMARY OF NO.SAMPLES BIAS BIAS NO. RANK RANK FLAGGING BIAS STATEMENT RANKED % SLOPE BLANK METHOD CODING F003 132.0 13.2 10 ICP-MS F009 227.0 25.2 WH WH BIASED HIGH 9 15.9 -0.9196 ICP-MS F010 66.0 6.6 BIASED LOW 10 -5.0 -0.6370 ICP-MS F011 97.0 9.7 10 F014 89.0 9.8 9 ICP-MS F015 159.5 15.9 10 ICP-MS F020 90.0 9.0 10 ICP-MS F021 57.5 5.7 BIASED LOW* 10 -3.7 -0.4212 ICP-MS F021c 115.5 11.5 10 ICP-MS F022 179.0 17.9 WH 10 ICP-MS F024 154.5 15.4 10 ICP-MS F026 89.5 12.7 7 ICP-AES F032 45.0 4.5 BIASED LOW 10 -5.8 -0.3616 AAS hydride-E3089 F032c 217.5 24.1 BIASED HIGH 9 7.0 0.0567 ICP-MS-E3473 F032d 173.5 19.2 9 ICP-MS-E3474 F042 137.5 15.2 AHAH 9 ICP-AES F060 214.5 21.4 10 ICP-MS F068 147.0 14.7 10 ICP-MS F069 257.5 25.7 AH BIASED HIGH 10 6.3 1.7264 ICP-MS F139 57.0 5.7 BIASED LOW 10 -5.6 -0.0821 ICP-MS F154 231.5 23.1 WH AHAL BIASED HIGH 10 -17.3 11.6963 ICP-MS F158 245.5 27.2 WH WH WHWH BIASED HIGH 9 8.6 1.8153 ICP-MS F169 144.0 14.4 10 ICP-MS F183 210.0 23.3 BIASED HIGH* 9 3.4 1.0162 ICP-MS F186 115.5 12.8 AL 9 ICP-MS F193 131.5 13.1 10 ICP-MS F196 75.0 8.3 9 ICP-AES F223 107.0 15.2 7 AAS hydride F248 87.5 9.7 9 ICP-MS F287 182.5 18.2 ALAHAHALAH AHAHAHAL 10 ICP-AES * NOTE: INDICATED BIAS STATEMENT IS FOR CAUTION ONLY AND NOT COUNTED IN STUDY STATISTICS PERCENT SLOPE USED FOR CAUTION COMPARISON = 5 OVERALL AVERAGE RANK IS 14.9

FPTM STUDY 0094 DATA SUMMARY 2009-09-02 PAGE 41 PARAMETER: 47095 Silver ug/L WATER SCIENCE & TECHNOLOGY ENVIRONMENT CANADA EC PT for Trace Elements in Water --------------------------------- SAMPLE 1= 2= 3= 4= 5= 6= 7= 0= 9= 10= TM-23.4 TM-26.4 TM-15.2 TMRain-04 TM25.4 TM-09 TM-16 TMDA-62.2 TMDA-64.2 LAB NO LAB RESULT LAB RESULT LAB RESULT LAB RESULT LAB RESULT LAB RESULT LAB RESULT LAB RESULT LAB RESULT LAB RESULT ---------- ---------- ---------- ---------- ---------- ---------- ---------- ---------- ---------- ---------- F003 4.74 6.76 11.1 <0.001 22.4 3.81 7.47 12.0 12.0 F009 5.0 7.2 11. <1. 22. 3.8 7.8 12. 12. F010 4.7 6.7 11.0 <0.001 21.0 3.7 7.4 11.9 11.7 F011 4.5 6.8 11.2 0.1 21.7 3.7 7.3 11.9 12.1 F015 4.70 6.71 11.0 <0.02 21.7 3.77 7.50 11.9 11.9 F020 4.88 7.1 11.4 0.04 22.9 3.92 7.72 12.5 12.5 F021 4.8 6.8 11.6 <0.1 22.3 3.9 7.7 12.4 12.2 F021b 5. 6. WL 11. <2. 22. 3. AL 7. 12. 12. F021c 4.6 6.8 11.0 <0.03 21.5 3.8 7.5 11.8 11.9 F022 4.94 7.07 11.4 <0.05 22.2 3.98 7.49 12.2 12.1 F024 4.8 6.9 11.4 <0.1 21.9 3.8 7.6 12.3 11.9 F032c 4.6 6.5 10.6 <0.1 21.1 3.6 7.2 11.5 11.3 F032d 4.80 6.85 11.0 <0.5 21.8 3.77 7.44 11.8 11.7 F042 4.89 6.98 11.4 <2. 21.8 3.72 7.67 12.4 12.5 F060 4.45 7.02 11.3 0.209 21.8 3.97 7.67 12.3 12.4 F068 4.9 6.9 11. <0.04 22. 3.9 7.8 11.8 11.4 F069 5.30 WH 7.64 WH 12.5 AH <0.008 25.4 AH 4.27 WH 8.40 WH 12.9 WH 13.1 F069b 4.7 6.7 11. <4.0 21.3 <4.0 7.4 11.8 11. F139 4.54 6.61 10.8 <0.05 21.1 3.76 7.37 11.7 11.7 F154 1.23 AL 2.19 AL 4.51 AL <0.5 16.8 AL 0.62 AL 1.81 AL 4.63 AL 5.92 AL F158 4.7 6.8 11.3 <2. 22.8 3.9 7.7 12.4 12.4 F183 5.23 8.30 AH 10.6 <0.05 25.0 AH 3.89 8.53 AH 13.6 AH 12.4 F186 4.7 6.7 11.3 <0.2 21.8 3.8 7.6 11.9 12.0 F196 6. AH 8. AH 13. AH <2. 26. AH 5. AH 8. 12. 8. AL F248 5.0 7.10 11.4 <0.50 21.7 3.60 7.50 12.2 12.3 F287 <5.0 6.4 11. <5.0 22. <5.0 36.2 AH 11. WL 0.0103 AL ASSIGNED VALUE * 4.80 6.80 11.00 0.100 21.8 3.80 7.50 0. 12.00 12.0000 R-STD DEV * 0.242 0.319 0.334 0.0972 0.71 0.159 0.299 - 0.380 0.55868 ACCEPTABLE LIMITS(+-) * 0.484 0.638 0.668 - 1.42 0.318 0.598 - 0.760 1.11736 WARNING LIMITS(+-) * .484- .726 .638- .957 .668- 1.002 - 1.42- 2.13 .318- .477 .598- .897 - .760- 1.140 1.11736- 1.6 ACTION LIMITS(<>) * 0.726 0.957 1.002 - 2.13 0.477 0.897 - 1.140 1.67604 N * 25 26 26 3 26 24 26 0 26 26 * NOTE: SEE GLOSSARY FOR DEFINITIONS

PARAMETER: 47095 Silver ug/L 2009-09-02 PAGE 42 LAB TOTAL AVERAGE SUMMARY OF NO.SAMPLES BIAS BIAS NO. RANK RANK FLAGGING BIAS STATEMENT RANKED % SLOPE BLANK METHOD CODING F003 110.0 13.7 8 ICP-MS F009 132.5 16.5 8 ICP-MS F010 57.5 7.1 8 ICP-MS F011 78.0 8.6 9 F015 78.0 9.7 8 ICP-MS F020 171.0 19.0 9 ICP-MS F021 148.0 18.5 8 ICP-MS F021b 81.5 10.1 WL AL 8 ICP-AES F021c 75.0 9.3 8 ICP-MS F022 146.0 18.2 8 ICP-MS F024 123.0 15.3 8 ICP-MS F032c 30.0 3.7 BIASED LOW* 8 -3.6 -0.0792 ICP-MS-E3473 F032d 81.5 10.1 8 ICP-MS-E3474 F042 137.5 17.1 8 ICP-AES F060 131.5 14.6 9 ICP-MS F068 112.0 14.0 8 ICP-MS F069 196.0 24.5 WHWHAHAHWHWHWH BIASED HIGH 8 15.9 -0.3890 ICP-MS F069b 47.0 6.7 7 ICP-AES F139 41.5 5.1 BIASED LOW* 8 -3.6 0.0693 ICP-MS F154 9.0 1.1 ALALALALALALALAL BIASED LOW 8 -12.0 -4.0754 ICP-MS F158 141.0 17.6 8 ICP-MS F183 164.5 20.5 AH AH AHAH BIASED HIGH 8 13.1 -0.3551 ICP-MS F186 96.5 12.0 8 ICP-MS F196 166.5 20.8 AHAHAHAHAH AL BIASED HIGH 8 10.5 -0.2813 ICP-AES F248 124.5 15.5 8 ICP-MS F287 57.5 9.5 AHWLAL 6 ICP-AES * NOTE: INDICATED BIAS STATEMENT IS FOR CAUTION ONLY AND NOT COUNTED IN STUDY STATISTICS PERCENT SLOPE USED FOR CAUTION COMPARISON = 5 OVERALL AVERAGE RANK IS 13.1

FPTM STUDY 0094 DATA SUMMARY 2009-09-02 PAGE 43 PARAMETER: 38095 Strontium ug/L WATER SCIENCE & TECHNOLOGY ENVIRONMENT CANADA EC PT for Trace Elements in Water --------------------------------- SAMPLE 1= 2= 3= 4= 5= 6= 7= 8= 9= 10= TM-23.4 TM-26.4 TM-15.2 TMRain-04 TM25.4 TM-09 TM-16 TMDA-65 TMDA-62.2 TMDA-64.2 LAB NO LAB RESULT LAB RESULT LAB RESULT LAB RESULT LAB RESULT LAB RESULT LAB RESULT LAB RESULT LAB RESULT LAB RESULT ---------- ---------- ---------- ---------- ---------- ---------- ---------- ---------- ---------- ---------- F003 113. 107. 114. 1.74 73.9 109. 258. 389. 150. 640. F009 117. 111. 115. <20. 77. 111. 259. 398. 153. 660. F010 110. 105. 114. 1.84 73.1 107. 249. 387. 150. 640. F011 104. WL 104. 109. 1.8 72.1 104. 244. 380. 143. 630. F015 115. 109. 113. 1.69 68.8 109. 257. 396. 152. 659. F020 110. 105. 109. 1.87 72.7 103. 247. 389. 145. 651. F021 113. 104. 112. 1.8 73.9 106. 248. 392. 149. 640. F021b 112. 106. 111. 2. 73. 105. 249. 388. 146. 632. F022 112. 107. 112. 1.79 74. 106. 254. 394. 149. 644. F024 116. 108. 114. 1.8 74.9 108. 256. 396. 150. 650. F026 108. 103. 108. 2. 72. 103. 241. 377. 143. 612. WL F032a 119. 112. 118. 1.7 77.4 111. 268. 406. 156. 686. WH F032c 114. 111. 114. 1.9 81.3 WH 110. 259. 393. 156. 657. F032d 114. 113. 114. 1.86 83.3 AH 110. 261. 399. 157. 660. F032g 115. 108. 112. 1.9 74.6 109. 255. 396. 149. 643. F060 112. 105. 110. 2.07 74.3 104. 248. 388. 148. 635. F068 107. 100. 103. WL 1.5 WL 72. 98. WL 242. 378. 130. AL 624. F069 107. 101. 105. 1.72 69.9 100. 239. 388. 147. 645. F069b 115. 109. 114. 1.73 73.8 108. 253. 404. 148. 669. F139 114. 109. 115. 1.80 75.2 109. 260. 405. 152. 652. F154 119. 115. 121. WH 1.76 76.3 113. 262. 424. AH 651. AH 158. AL F158 114. 108. 113. <2. 74.7 108. 254. 399. 152. 647. F169 113. 96. WL 100. AL 1.79 70.0 99. WL 254. 391. 156. 646. F183 112. 108. 107. 0.183 AL 71.5 107. 244. 384. 151. 631. F186 112. 106. 111. 1.7 74.8 106. 248. 381. 151. 637. F196 112. 106. 111. 2. 74. 106. 250. 384. 146. 633. F207 109. 104. 110. 1.8 71.3 103. 249. 384. 144. 625. F223b 110. 110. 110. <100. <100. 110. 260. 400. 150. 650. F287 105. 100. 105. 1.33 AL 70. 99.1 235. WL 369. WL 138. WL ASSIGNED VALUE * 112 107 112 1.800 73.9 107 253 390 150 644 R-STD DEV * 3.7 4.1 3.8 0.1382 2.66 3.95 8.0 10.0 5.1 14.9 ACCEPTABLE LIMITS(+-) * 7.4 8.2 7.6 0.2764 5.32 7.90 16.0 20.0 10.2 29.8 WARNING LIMITS(+-) * 7.4- 11.1 8.2- 12.3 7.6- 11.4 .2764- .41465.32- 7.98 7.90- 11.85 16.0- 24.0 20.0- 30.0 10.2- 15.3 29.8- 44.7 ACTION LIMITS(<>) * 11.1 12.3 11.4 0.4146 7.98 11.85 24.0 30.0 15.3 44.7 N * 29 29 29 26 28 29 29 29 29 28 * NOTE: SEE GLOSSARY FOR DEFINITIONS

PARAMETER: 38095 Strontium ug/L 2009-09-02 PAGE 44 LAB TOTAL AVERAGE SUMMARY OF NO.SAMPLES BIAS BIAS NO. RANK RANK FLAGGING BIAS STATEMENT RANKED % SLOPE BLANK METHOD CODING F003 164.0 16.4 10 ICP-MS F009 226.5 25.1 BIASED HIGH* 9 2.1 1.1800 ICP-MS F010 135.5 13.5 10 ICP-MS F011 66.0 6.6 WL BIASED LOW* 10 -2.1 -1.8098 F015 178.0 17.8 10 ICP-MS F020 109.0 10.9 10 ICP-MS F021 132.0 13.2 10 ICP-MS F021b 121.0 12.1 10 ICP-AES F022 147.5 14.7 10 ICP-AES F024 198.0 19.8 10 ICP-MS F026 64.0 6.4 WL BIASED LOW* 10 -4.9 1.2413 ICP-AES F032a 253.5 25.3 WH BIASED HIGH 10 6.2 -1.6720 ICP-AES-E3386 F032c 231.5 23.1 WH BIASED HIGH* 10 1.4 1.8998 ICP-MS-E3473 F032d 247.0 24.7 AH BIASED HIGH* 10 2.0 2.1928 ICP-MS-E3474 F032g 186.5 18.6 10 ICP-AES-system#2,Opt F060 124.5 12.4 10 ICP-MS F068 30.5 3.0 WLWL WL AL BIASED LOW* 10 -2.6 -4.6063 ICP-MS F069 62.0 6.2 BIASED LOW* 10 0.6 -5.9026 ICP-MS F069b 186.0 18.6 10 ICP-AES F139 225.0 22.5 10 ICP-MS F154 236.5 23.6 WH AHAHAL BIASED HIGH 10 -72.4 150.3126 ICP-MS F158 176.0 19.5 9 ICP-MS F169 111.0 11.1 WLAL WL 10 ICP-MS F183 96.5 9.6 AL 10 ICP-MS F186 121.0 12.1 10 ICP-MS F196 128.0 12.8 10 ICP-AES F207 77.0 7.7 10 ICP-AES F223b 153.5 19.1 8 ICP-AES F287 20.5 2.2 AL WLWLWL BIASED LOW 9 -5.9 -0.9716 ICP-AES * NOTE: INDICATED BIAS STATEMENT IS FOR CAUTION ONLY AND NOT COUNTED IN STUDY STATISTICS PERCENT SLOPE USED FOR CAUTION COMPARISON = 5 OVERALL AVERAGE RANK IS 14.7

FPTM STUDY 0094 DATA SUMMARY 2009-09-02 PAGE 45 PARAMETER: 81095 Thallium ug/L WATER SCIENCE & TECHNOLOGY ENVIRONMENT CANADA EC PT for Trace Elements in Water --------------------------------- SAMPLE 1= 2= 3= 4= 5= 6= 7= 8= 9= 10= TM-23.4 TM-26.4 TM-15.2 TMRain-04 TM25.4 TM-09 TM-16 TMDA-65 TMDA-62.2 TMDA-64.2 LAB NO LAB RESULT LAB RESULT LAB RESULT LAB RESULT LAB RESULT LAB RESULT LAB RESULT LAB RESULT LAB RESULT LAB RESULT ---------- ---------- ---------- ---------- ---------- ---------- ---------- ---------- ---------- ---------- F003 3.96 5.24 18.1 0.347 31.4 1.93 6.73 202. 52.8 147. F009 <10. <10. 19. <10. 32. <10. <10. 202. 52. 148. F010 3.81 5.14 17.9 0.37 30.9 1.98 6.58 190. 50.5 140. F011 3.8 5.2 18.2 0.4 29.9 2.0 6.7 191. 52.0 146. F014 4.0 5.2 19. <1.0 31. 1.9 6.7 210. 56. 148. F015 3.79 5.01 17.1 0.377 29.1 1.93 6.37 205. 48.6 152. F020 4.04 5.42 18. 0.379 30.4 1.97 6.82 187. 50. 138. F021 3.7 5.0 17.4 0.4 29.6 1.9 6.2 191. 48.4 137. F021b <25. <25. <25. <25. <25. AL <25. <25. 192. 39. AL 138. F021c 3.8 5.0 17.3 0.4 29.2 1.9 6.5 201. 52.7 148. F022 4.01 5.47 18.1 0.373 30.7 2.03 7.05 209. 52. 152. F024 4.1 5.4 19.0 0.4 31.5 2.1 6.9 208. 54.1 154. F032c 4.1 5.4 18.6 0.4 31.2 2.2 6.9 200. 52.4 147. F032d 4.25 5.52 18.6 <0.5 30.9 2.18 6.94 203. 52.7 148. F042 <10. <10. 21.7 AH <10. 33.8 <10. 11.1 AH 206. 55.5 150. F060 4.32 5.63 18.9 0.427 31.1 2.17 7.05 195. 51.4 146. F068 3.7 4.9 16. 0.35 28. 1.9 6.3 194. 50. 148. F069 4.31 5.73 20.7 WH 0.413 34.7 WH 2.18 7.40 215. 55.9 160. F139 3.96 5.25 18.0 0.390 30.3 1.95 6.66 200. 50.7 145. F154 4.17 5.45 18.7 0.41 31.7 2.04 6.91 217. 158. AH 53.8 AL F158 4.0 5.4 18.7 <2. 31.5 2.0 6.9 210. 52.7 153. F169 3.81 5.01 17.0 <0.50 29.0 1.91 6.25 201. 52.2 134. F183 3.94 5.37 18.7 0.36 30.6 2.08 6.90 211. 51.1 156. F186 2.7 AL 3.9 AL 16.2 <0.1 AL 27.8 0.8 AL 5.0 AL 184. 48.7 135. F196 <40. <40. <40. <40. <40. <40. <40. 209. 53. 148. F223b <10.0 <10.0 19.1 <10.0 32.4 <10.0 <10.0 211. 54.6 154. F248 4.80 AH 5.30 17.2 <1.00 27.5 WL 2.00 6.10 153. AL 45.9 WL 119. AL F287 3.1 AL 7.0 AH 16. <3.0 32. 0. AL 9.56 AH 193. 54. 0.139 AL ASSIGNED VALUE * 3.98 5.30 18.1 0.395 30.9 2.00 6.73 202 52.1 148 R-STD DEV * 0.259 0.278 1.09 0.0259 1.54 0.130 0.441 10.4 2.79 8.7957 ACCEPTABLE LIMITS(+-) * 0.518 0.556 2.18 0.0518 3.08 0.260 0.882 20.8 5.58 17.5914 WARNING LIMITS(+-) * .518- .777 .556- .834 2.18- 3.27 .0518- .07773.08- 4.62 .260- .390 .882- 1.323 20.8- 31.2 5.58- 8.37 17.5914- 26. ACTION LIMITS(<>) * 0.777 0.834 3.27 0.0777 4.62 0.390 1.323 31.2 8.37 26.3871 N * 23 23 26 16 26 23 24 28 28 28 * NOTE: SEE GLOSSARY FOR DEFINITIONS

PARAMETER: 81095 Thallium ug/L 2009-09-02 PAGE 46 LAB TOTAL AVERAGE SUMMARY OF NO.SAMPLES BIAS BIAS NO. RANK RANK FLAGGING BIAS STATEMENT RANKED % SLOPE BLANK METHOD CODING F003 122.5 12.2 10 ICP-MS F009 90.5 18.1 5 ICP-MS F010 83.0 8.3 10 ICP-MS F011 102.5 10.2 10 F014 142.0 15.7 9 ICP-MS F015 85.5 8.5 10 ICP-MS F020 101.5 10.1 10 ICP-MS F021 55.0 5.5 BIASED LOW* 10 -6.0 -0.0280 ICP-MS F021b 15.5 5.1 AL AL INSUFFICIENT DATA 3 ICP-AES F021c 94.5 9.4 10 ICP-MS F022 157.0 15.7 10 ICP-MS F024 188.0 18.8 10 ICP-MS F032c 155.5 15.5 10 ICP-MS-E3473 F032d 162.0 18.0 9 ICP-MS-E3474 F042 140.0 23.3 AH AH BIASED HIGH* 6 -0.1 3.5225 ICP-AES F060 168.0 16.8 10 ICP-MS F068 54.5 5.4 BIASED LOW* 10 -2.3 -0.5049 ICP-MS F069 233.5 23.3 WH WH BIASED HIGH* 10 6.9 0.4720 ICP-MS F139 99.5 9.9 10 ICP-MS F154 183.0 18.3 AHAL 10 ICP-MS F158 161.0 17.8 9 ICP-MS F169 65.5 7.2 9 ICP-MS F183 151.0 15.1 10 ICP-MS F186 22.0 2.4 ALAL AL ALAL BIASED LOW* 9 -8.3 -0.6525 ICP-MS F196 60.0 20.0 INSUFFICIENT DATA 3 ICP-AES F223b 123.0 24.6 BIASED HIGH* 5 4.4 0.1495 ICP-AES F248 64.0 7.1 AH WL ALWLAL 9 ICP-MS F287 104.0 11.5 ALAH ALAH AL 9 ICP-AES * NOTE: INDICATED BIAS STATEMENT IS FOR CAUTION ONLY AND NOT COUNTED IN STUDY STATISTICS PERCENT SLOPE USED FOR CAUTION COMPARISON = 10 OVERALL AVERAGE RANK IS 12.9

FPTM STUDY 0094 DATA SUMMARY 2009-09-02 PAGE 47 PARAMETER: 50095 Tin ug/L WATER SCIENCE & TECHNOLOGY ENVIRONMENT CANADA EC PT for Trace Elements in Water --------------------------------- SAMPLE 1= 2= 3= 4= 5= 6= 7= 8= 9= 10= TM-23.4 TM-26.4 TM-15.2 TMRain-04 TM25.4 TM-09 TM-16 TMDA-65 TMDA-62.2 TMDA-64.2 LAB NO LAB RESULT LAB RESULT LAB RESULT LAB RESULT LAB RESULT LAB RESULT LAB RESULT LAB RESULT LAB RESULT LAB RESULT ---------- ---------- ---------- ---------- ---------- ---------- ---------- ---------- ---------- ---------- F003 2.76 5.79 15.3 0.703 23.8 2.85 8.56 390. 109. 300. F009 <5. <5. WL 12. AL <5. 19. AL <5. 7.6 368. 102. 279. F010 2.88 5.72 15.1 0.90 25.4 3.17 8.81 390. 116. 300. F011 2.6 5.7 15.0 0.8 23.7 2.9 8.3 387. 112. 295. F015 2.62 5.45 14.3 0.75 22.7 2.82 8.24 408. 105. 311. F020 2.78 5.89 15.2 0.71 24.7 2.86 8.6 371. 111. 277. F021 2.7 5.5 15.0 0.7 23.2 2.9 7.9 373. 106. 279. F021c 2.7 5.6 14.5 0.7 22.9 2.7 8.3 388. 113. 294. F022 2.80 5.94 15.0 0.772 23.8 3.91 AH 9.23 384. 108. 291. F024 2.6 5.6 14.8 0.7 23.6 3.0 8.6 375. 109. 281. F042 <10. <10. <10. AL <10. 10.9 AL <10. <10. 387. 102. 291. F060 2.80 5.85 15.1 <1. 23.7 2.94 8.37 356. 105. 273. F068 2.8 5.9 15. 0.77 24. 2.9 8.8 396. 108. 308. F139 2.73 5.81 15.2 0.756 24.1 2.90 8.78 394. 113. 292. F154 2.71 5.68 15.3 0.82 24.4 3.07 8.61 411. 315. AH 115. AL F158 2.5 5.3 14.2 <2. 22.9 2.7 8.2 397. 109. 295. F183 2.59 5.61 15.8 0.64 23.9 2.62 8.60 342. WL 109. 266. F186 2.9 4.6 AL 9.6 AL 2.1 AH 14.8 AL 3.4 WH 6.8 AL 306. AL 82.2 AL 236. WL F196 <80. <80. <80. <80. <80. <80. <80. 283. AL 92. WL 206. AL F223b <8.0 <8.0 14.8 <8.0 24.5 <8.0 8.1 395. 117. 299. F248 4.80 AH 6.30 WH 14.6 1.10 AH 21.8 2.90 7.90 362. 104. 282. F287 <10. <10. <10. AL <10. <10. AL 15.8 AH 47.8 AH 385. 88. WL 0.273 AL ASSIGNED VALUE * 2.72 5.71 15.0 0.750 23.8 2.90 8.46 387 108.5 291 R-STD DEV * 0.131 0.234 0.49 0.0975 1.27 0.230 0.480 21.2 6.87 21.5732 ACCEPTABLE LIMITS(+-) * 0.262 0.468 0.98 0.1950 2.54 0.460 0.960 42.4 13.74 43.1464 WARNING LIMITS(+-) * .262- .393 .468- .702 .98- 1.47 .1950- .29252.54- 3.81 .460- .690 .960- 1.440 42.4- 63.6 13.74- 20.6143.1464- 64. ACTION LIMITS(<>) * 0.393 0.702 1.47 0.2925 3.81 0.690 1.440 63.6 20.61 64.7196 N * 17 17 19 15 20 18 20 22 22 22 * NOTE: SEE GLOSSARY FOR DEFINITIONS

PARAMETER: 50095 Tin ug/L 2009-09-02 PAGE 48 LAB TOTAL AVERAGE SUMMARY OF NO.SAMPLES BIAS BIAS NO. RANK RANK FLAGGING BIAS STATEMENT RANKED % SLOPE BLANK METHOD CODING F003 120.5 12.0 10 ICP-MS F009 26.0 4.3 WLAL AL BIASED LOW* 6 -3.4 -2.1045 ICP-MS F010 159.5 15.9 10 ICP-MS F011 108.0 10.8 10 F015 85.5 8.5 10 ICP-MS F020 114.5 11.4 10 ICP-MS F021 70.0 7.0 10 ICP-MS F021c 85.0 8.5 10 ICP-MS F022 131.0 13.1 AH 10 ICP-MS F024 87.0 8.7 10 ICP-MS F042 30.5 7.6 AL AL INSUFFICIENT DATA 4 ICP-AES F060 89.5 9.9 9 ICP-MS F068 139.0 13.9 10 ICP-MS F139 135.0 13.5 10 ICP-MS F154 137.5 13.7 AHAL 10 ICP-MS F158 71.0 7.8 9 ICP-MS F183 78.5 7.8 WL 10 ICP-MS F186 59.0 5.9 ALALAHALWHALALALWL 10 ICP-MS F196 7.0 2.3 ALWLAL INSUFFICIENT DATA 3 ICP-AES F223b 87.5 14.5 6 ICP-AES F248 92.5 9.2 AHWH AH 10 ICP-MS F287 52.0 10.4 AL ALAHAH WLAL 5 ICP-AES * NOTE: INDICATED BIAS STATEMENT IS FOR CAUTION ONLY AND NOT COUNTED IN STUDY STATISTICS PERCENT SLOPE USED FOR CAUTION COMPARISON = 10 OVERALL AVERAGE RANK IS 10.2

FPTM STUDY 0094 DATA SUMMARY 2009-09-02 PAGE 49 PARAMETER: 22095 Titanium ug/L WATER SCIENCE & TECHNOLOGY ENVIRONMENT CANADA EC PT for Trace Elements in Water --------------------------------- SAMPLE 1= 2= 3= 4= 5= 6= 7= 8= 9= 10= TM-23.4 TM-26.4 TM-15.2 TMRain-04 TM25.4 TM-09 TM-16 TMDA-65 TMDA-62.2 TMDA-64.2 LAB NO LAB RESULT LAB RESULT LAB RESULT LAB RESULT LAB RESULT LAB RESULT LAB RESULT LAB RESULT LAB RESULT LAB RESULT ---------- ---------- ---------- ---------- ---------- ---------- ---------- ---------- ---------- ---------- F003 3.18 6.37 15.0 0.519 25.5 8.18 11.8 183. 58.6 129. F011 2.9 6.0 14.2 0.5 24.6 7.9 11.6 185. 57.5 127. F015 3. 6. 15. <2. 26. 8. 12. 190. 60. 130. F020 2.7 6. 14.1 <0.5 26.6 8.8 13. 196. 59.8 131. F021 3.3 5.8 14.3 0.5 24.4 7.6 11.1 177. 54.9 119. F021b 3. 6. 14. <1. 25. 8. 12. 185. 57. 125. F021c 3.0 5.8 13.7 0.5 23.5 WL 7.0 WL 11.3 176. 55.9 123. F022 3.68 6.45 15.1 0.561 25.5 8.42 12.4 188. 57. 127. F024 3.0 5.9 13.7 0.4 WL 24.9 7.8 12.2 191. 59.2 127. F032a 3.7 6.8 16.0 0.8 AH 27.0 8.7 13.0 195. 62.3 137. F032c 3.6 6.4 15.4 0.5 26.2 8.4 12.5 194. 60.3 132. F032d 3.66 6.85 15.5 <1. 25.9 8.44 12.6 194. 60.8 133. F032g 3.3 6.4 15. 0.5 25.6 8.3 12.7 193. 61.5 132. F042 2.12 WL 5.27 WL 14.4 <2. 26.2 7.23 WL 11.5 200. 61.4 134. F060 3.2 6.26 14.7 0.525 25.6 8.19 11.9 183. 57.7 127. F068 3.1 6.2 14. 0.6 24. 8.2 12. 180. 56.4 120. F139 3.28 6.41 14.9 0.542 25.4 8.29 11.8 187. 58.4 137. F154 3.24 6.02 14.9 0.51 25.8 8.26 11.9 194. 130. AH 60.8 AL F158 3.0 6.1 14.6 <2. 25.6 8.0 11.9 188. 58.9 128. F183 3.13 6.83 15.5 0.567 26.1 8.68 12.4 204. 64.4 131. F186 11.8 AH 20.6 AH 47.6 AH 1.6 AH 81.8 AH 24.6 AH 33.9 AH 368. AH 123. AH 201. AH F196 <10. <10. 12. AL <10. 21. AL <10. 11. 184. 55. 124. F287 3.6 6.1 14. 0.504 25. 7.85 11.8 182. 57. 0.123 AL ASSIGNED VALUE * 3.18 6.10 14.7 0.507 25.6 8.19 12.0 188 58.6 128.500 R-STD DEV * 0.365 0.411 0.79 0.0513 1.01 0.443 0.64 8.3 3.10 6.7625 ACCEPTABLE LIMITS(+-) * 0.730 0.822 1.58 0.1026 2.02 0.886 1.28 16.6 6.20 13.5250 WARNING LIMITS(+-) * .730- 1.095 .822- 1.233 1.58- 2.37 .1026- .15392.02- 3.03 .886- 1.329 1.28- 1.92 16.6- 24.9 6.20- 9.30 13.5250- 20. ACTION LIMITS(<>) * 1.095 1.233 2.37 0.1539 3.03 1.329 1.92 24.9 9.30 20.2875 N * 22 22 23 16 23 22 23 23 23 23 * NOTE: SEE GLOSSARY FOR DEFINITIONS

PARAMETER: 22095 Titanium ug/L 2009-09-02 PAGE 50 LAB TOTAL AVERAGE SUMMARY OF NO.SAMPLES BIAS BIAS NO. RANK RANK FLAGGING BIAS STATEMENT RANKED % SLOPE BLANK METHOD CODING F003 107.0 10.7 10 ICP-MS F011 63.5 6.3 10 F015 108.5 12.0 9 ICP-AES F020 128.5 14.2 9 ICP-MS F021 46.0 4.6 BIASED LOW 10 -6.3 0.0599 ICP-MS F021b 67.5 7.5 9 ICP-AES F021c 30.0 3.0 WLWL BIASED LOW 10 -5.5 -0.0863 ICP-MS F022 139.0 13.9 10 ICP-MS F024 75.0 7.5 WL 10 ICP-MS F032a 201.0 20.1 AH BIASED HIGH* 10 4.5 0.5163 ICP-AES-E3386 F032c 160.0 16.0 10 ICP-MS-E3473 F032d 166.5 18.5 BIASED HIGH* 9 3.3 0.1631 ICP-MS-E3474 F032g 150.5 15.0 10 ICP-AES-system#2,Opt F042 96.5 10.7 WLWL WL 9 ICP-AES F060 105.0 10.5 10 ICP-MS F068 79.0 7.9 10 ICP-MS F139 127.0 12.7 10 ICP-MS F154 123.5 12.3 AHAL 10 ICP-MS F158 94.0 10.4 9 ICP-MS F183 175.5 17.5 10 ICP-MS F186 219.0 21.9 AHAHAHAHAHAHAHAHAHAH BIASED HIGH 10 78.2 12.0650 ICP-MS F196 18.0 3.0 AL AL BIASED LOW* 6 -0.9 -2.7459 ICP-AES F287 70.5 7.0 AL 10 ICP-AES * NOTE: INDICATED BIAS STATEMENT IS FOR CAUTION ONLY AND NOT COUNTED IN STUDY STATISTICS PERCENT SLOPE USED FOR CAUTION COMPARISON = 5 OVERALL AVERAGE RANK IS 11.5

FPTM STUDY 0094 DATA SUMMARY 2009-09-02 PAGE 51 PARAMETER: 74095 Tungsten ug/L WATER SCIENCE & TECHNOLOGY ENVIRONMENT CANADA EC PT for Trace Elements in Water --------------------------------- SAMPLE 1= 2= 3= 4= 5= 6= 7= 8= 9= 10= TM-23.4 TM-26.4 TM-15.2 TMRain-04 TM25.4 TM-09 TM-16 TMDA-65 TMDA-62.2 TMDA-64.2 LAB NO LAB RESULT LAB RESULT LAB RESULT LAB RESULT LAB RESULT LAB RESULT LAB RESULT LAB RESULT LAB RESULT LAB RESULT ---------- ---------- ---------- ---------- ---------- ---------- ---------- ---------- ---------- ---------- F022 4.78 6.19 6.72 0.034 9.50 1.89 3.26 0.112 0.117 0.075 F069 4.80 6.18 3.83 <0.020 4.45 1.88 2.68 <0.040 <0.020 <0.040 F139 5.36 7.03 7.36 0.049 10.6 2.03 3.57 0.119 0.070 0.085 F154 5.3 6.56 7.04 <0.2 10.4 2. 3.47 <0.2 <0.2 <0.2 ASSIGNED VALUE * 5.05 6.38 6.88 0.042 9.95 1.94 3.36 0.115 0.094 0.080 R-STD DEV * 0.355 0.455 1.798 - 3.159 0.086 0.452 - - - ACCEPTABLE LIMITS(+-) * - - - - - - - - - - WARNING LIMITS(+-) * - - - - - - - - - - ACTION LIMITS(<>) * - - - - - - - - - - N * 4 4 4 2 4 4 4 2 2 2 * NOTE: SEE GLOSSARY FOR DEFINITIONS
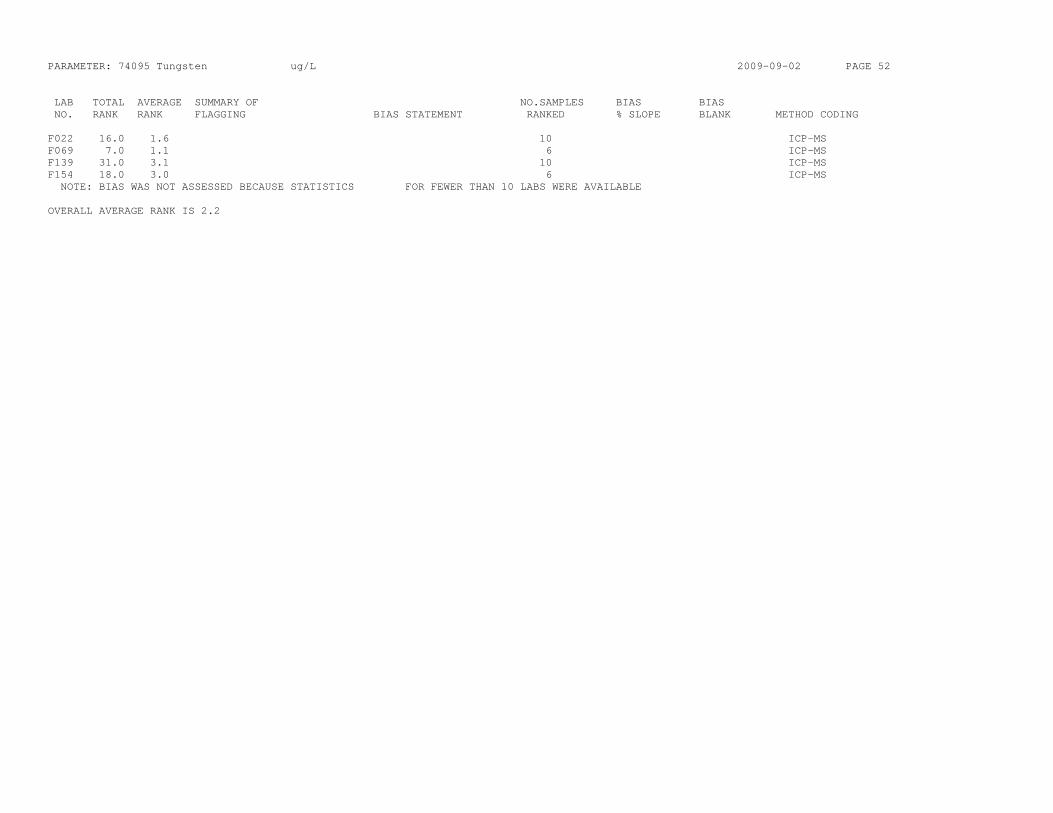
PARAMETER: 74095 Tungsten ug/L 2009-09-02 PAGE 52 LAB TOTAL AVERAGE SUMMARY OF NO.SAMPLES BIAS BIAS NO. RANK RANK FLAGGING BIAS STATEMENT RANKED % SLOPE BLANK METHOD CODING F022 16.0 1.6 10 ICP-MS F069 7.0 1.1 6 ICP-MS F139 31.0 3.1 10 ICP-MS F154 18.0 3.0 6 ICP-MS NOTE: BIAS WAS NOT ASSESSED BECAUSE STATISTICS FOR FEWER THAN 10 LABS WERE AVAILABLE OVERALL AVERAGE RANK IS 2.2
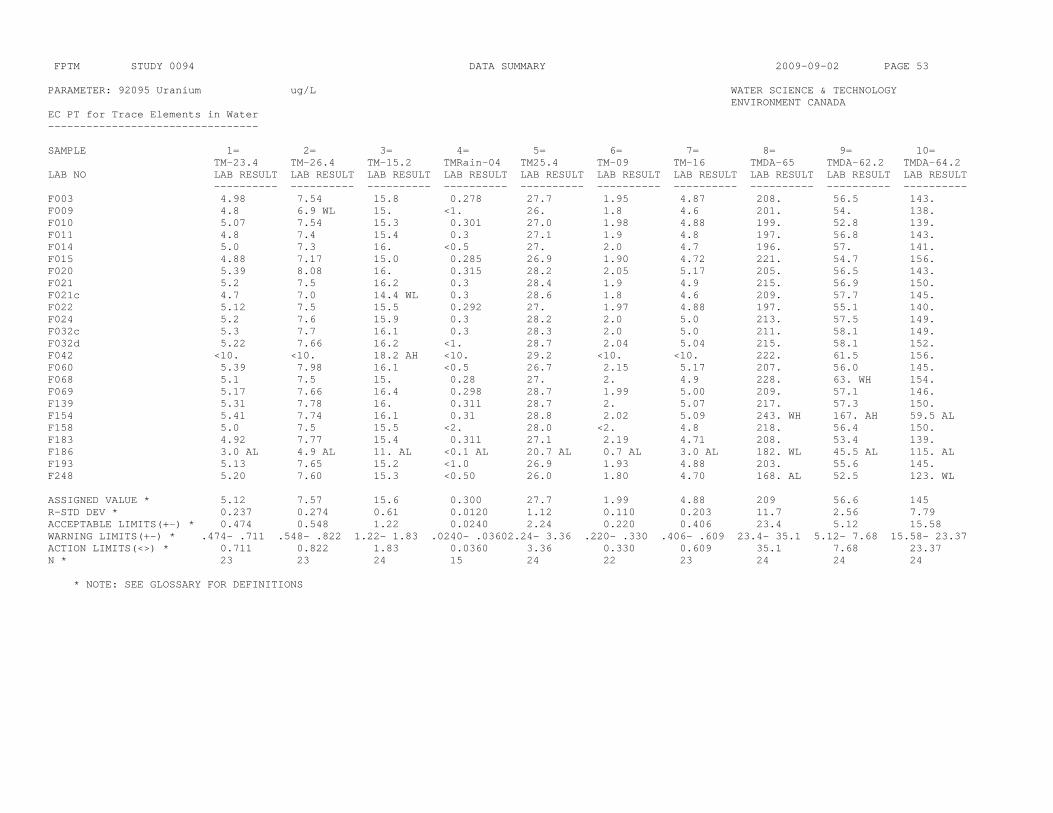
FPTM STUDY 0094 DATA SUMMARY 2009-09-02 PAGE 53 PARAMETER: 92095 Uranium ug/L WATER SCIENCE & TECHNOLOGY ENVIRONMENT CANADA EC PT for Trace Elements in Water --------------------------------- SAMPLE 1= 2= 3= 4= 5= 6= 7= 8= 9= 10= TM-23.4 TM-26.4 TM-15.2 TMRain-04 TM25.4 TM-09 TM-16 TMDA-65 TMDA-62.2 TMDA-64.2 LAB NO LAB RESULT LAB RESULT LAB RESULT LAB RESULT LAB RESULT LAB RESULT LAB RESULT LAB RESULT LAB RESULT LAB RESULT ---------- ---------- ---------- ---------- ---------- ---------- ---------- ---------- ---------- ---------- F003 4.98 7.54 15.8 0.278 27.7 1.95 4.87 208. 56.5 143. F009 4.8 6.9 WL 15. <1. 26. 1.8 4.6 201. 54. 138. F010 5.07 7.54 15.3 0.301 27.0 1.98 4.88 199. 52.8 139. F011 4.8 7.4 15.4 0.3 27.1 1.9 4.8 197. 56.8 143. F014 5.0 7.3 16. <0.5 27. 2.0 4.7 196. 57. 141. F015 4.88 7.17 15.0 0.285 26.9 1.90 4.72 221. 54.7 156. F020 5.39 8.08 16. 0.315 28.2 2.05 5.17 205. 56.5 143. F021 5.2 7.5 16.2 0.3 28.4 1.9 4.9 215. 56.9 150. F021c 4.7 7.0 14.4 WL 0.3 28.6 1.8 4.6 209. 57.7 145. F022 5.12 7.5 15.5 0.292 27. 1.97 4.88 197. 55.1 140. F024 5.2 7.6 15.9 0.3 28.2 2.0 5.0 213. 57.5 149. F032c 5.3 7.7 16.1 0.3 28.3 2.0 5.0 211. 58.1 149. F032d 5.22 7.66 16.2 <1. 28.7 2.04 5.04 215. 58.1 152. F042 <10. <10. 18.2 AH <10. 29.2 <10. <10. 222. 61.5 156. F060 5.39 7.98 16.1 <0.5 26.7 2.15 5.17 207. 56.0 145. F068 5.1 7.5 15. 0.28 27. 2. 4.9 228. 63. WH 154. F069 5.17 7.66 16.4 0.298 28.7 1.99 5.00 209. 57.1 146. F139 5.31 7.78 16. 0.311 28.7 2. 5.07 217. 57.3 150. F154 5.41 7.74 16.1 0.31 28.8 2.02 5.09 243. WH 167. AH 59.5 AL F158 5.0 7.5 15.5 <2. 28.0 <2. 4.8 218. 56.4 150. F183 4.92 7.77 15.4 0.311 27.1 2.19 4.71 208. 53.4 139. F186 3.0 AL 4.9 AL 11. AL <0.1 AL 20.7 AL 0.7 AL 3.0 AL 182. WL 45.5 AL 115. AL F193 5.13 7.65 15.2 <1.0 26.9 1.93 4.88 203. 55.6 145. F248 5.20 7.60 15.3 <0.50 26.0 1.80 4.70 168. AL 52.5 123. WL ASSIGNED VALUE * 5.12 7.57 15.6 0.300 27.7 1.99 4.88 209 56.6 145 R-STD DEV * 0.237 0.274 0.61 0.0120 1.12 0.110 0.203 11.7 2.56 7.79 ACCEPTABLE LIMITS(+-) * 0.474 0.548 1.22 0.0240 2.24 0.220 0.406 23.4 5.12 15.58 WARNING LIMITS(+-) * .474- .711 .548- .822 1.22- 1.83 .0240- .03602.24- 3.36 .220- .330 .406- .609 23.4- 35.1 5.12- 7.68 15.58- 23.37 ACTION LIMITS(<>) * 0.711 0.822 1.83 0.0360 3.36 0.330 0.609 35.1 7.68 23.37 N * 23 23 24 15 24 22 23 24 24 24 * NOTE: SEE GLOSSARY FOR DEFINITIONS

PARAMETER: 92095 Uranium ug/L 2009-09-02 PAGE 54 LAB TOTAL AVERAGE SUMMARY OF NO.SAMPLES BIAS BIAS NO. RANK RANK FLAGGING BIAS STATEMENT RANKED % SLOPE BLANK METHOD CODING F003 97.5 9.7 10 ICP-MS F009 33.5 3.7 WL BIASED LOW* 9 -4.0 -0.2365 ICP-MS F010 86.0 8.6 10 ICP-MS F011 80.5 8.0 10 F014 83.5 9.2 9 ICP-MS F015 85.0 8.5 10 ICP-MS F020 164.0 16.4 10 ICP-MS F021 143.0 14.3 10 ICP-MS F021c 85.0 8.5 WL 10 ICP-MS F022 85.0 8.5 10 ICP-MS F024 149.5 14.9 10 ICP-MS F032c 165.0 16.5 10 ICP-MS-E3473 F032d 174.0 19.3 BIASED HIGH* 9 3.4 0.0371 ICP-MS-E3474 F042 115.5 23.1 AH BIASED HIGH 5 6.0 1.1590 ICP-AES F060 142.0 15.7 9 ICP-MS F068 131.5 13.1 WH 10 ICP-MS F069 153.0 15.3 10 ICP-MS F139 181.5 18.1 10 ICP-MS F154 184.0 18.4 WHAHAL BIASED HIGH* 10 -4.1 8.0592 ICP-MS F158 100.0 12.5 8 ICP-MS F183 109.5 10.9 10 ICP-MS F186 11.0 1.2 ALALALALALALALWLALAL BIASED LOW 9 -14.3 -2.1892 ICP-MS F193 88.5 9.8 9 ICP-MS F248 53.0 5.8 AL WL 9 ICP-MS * NOTE: INDICATED BIAS STATEMENT IS FOR CAUTION ONLY AND NOT COUNTED IN STUDY STATISTICS PERCENT SLOPE USED FOR CAUTION COMPARISON = 5 OVERALL AVERAGE RANK IS 11.9

FPTM STUDY 0094 DATA SUMMARY 2009-09-02 PAGE 55 PARAMETER: 23095 Vanadium ug/L WATER SCIENCE & TECHNOLOGY ENVIRONMENT CANADA EC PT for Trace Elements in Water --------------------------------- SAMPLE 1= 2= 3= 4= 5= 6= 7= 8= 9= 10= TM-23.4 TM-26.4 TM-15.2 TMRain-04 TM25.4 TM-09 TM-16 TMDA-65 TMDA-62.2 TMDA-64.2 LAB NO LAB RESULT LAB RESULT LAB RESULT LAB RESULT LAB RESULT LAB RESULT LAB RESULT LAB RESULT LAB RESULT LAB RESULT ---------- ---------- ---------- ---------- ---------- ---------- ---------- ---------- ---------- ---------- F003 1.92 12.5 13.1 0.660 WL 26.7 2.95 14.9 361. 118. 289. F009 1.9 13. 14. <1. 29. 3.0 16. 385. 122. 305. F010 2.09 12.7 13.0 0.69 27.5 3.01 15.0 370. 114. 290. F011 1.9 12.2 12.8 0.7 26.3 2.9 14.7 372. 112. 286. F014 2.1 12. 14. <1.0 27. 3.1 16. 370. 114. 295. F015 1.89 12.7 13.2 0.71 27.6 3.03 15.3 389. 116. 296. F020 1.8 12.7 13.2 0.7 28.7 3. 15.7 379. 117. 299. F021 1.9 11.7 13.0 0.7 27.5 2.9 14.4 370. 111. 291. F021b <4. 10. AL 12. <4. 26. <4. 13. WL 365. 111. 282. F021c 1.8 12.0 12.4 0.6 AL 25.9 2.8 14.4 366. 110. 289. F022 1.95 13.0 13.6 0.38 AL 27.9 2.95 15.8 385. 116. 296. F024 1.9 12.7 13.3 0.7 27.5 3.0 15.2 376. 116. 291. F032a 2. 14. 16. AH 2. AH 30. 4. AH 17. WH 388. 123. 310. F032c 1.8 12.5 13.2 0.7 27.5 3.0 15.2 356. 115. 282. F032d 1.79 12.9 13.2 <1. 27.5 2.85 15.2 378. 118. 298. F042 <5. 11.2 12.1 <5. 25.8 <5. 13.9 367. 109. 287. F060 2.07 13.6 14.2 0.729 29.2 3.28 WH 15.8 362. 116. 285. F068 1.9 11. WL 11. WL 0.7 24. WL 3. 13. WL 366. 103. AL 280. F069 1.89 12.8 13.5 0.692 27.2 2.89 15.2 367. 114. 285. F069b 1.99 12.4 12.7 <1. 26.8 2.88 14.3 375. 114. 289. F139 2.10 13.6 14.6 0.708 29.4 3.17 16.0 383. 116. 159. AL F154 1.9 12.6 13.3 <1.0 27.3 3.2 15. 376. 293. AH 118. AL F158 <2. 12.3 12.9 <2. 26.7 2.9 14.8 365. 116. 284. F169 1.99 12.7 13.3 0.70 27.4 3.04 15.3 375. 116. 295. F183 1.85 12.8 12.9 0.693 27.8 2.94 15.2 393. 116. 277. F186 6.6 AH 42.9 AH 43.4 AH 1.9 AH 89.6 AH 8.5 AH 42.6 AH 733. AH 252. AH 456. AH F193 1.94 13.1 13.9 0.69 28.2 3.02 15.6 368. 114. 281. F196 <15. <15. <15. <15. 27. <15. <15. 364. 114. 285. F248 2.00 13.4 13.7 <1.00 29.3 3.10 15.7 392. 119. 303. F287 <4.0 15. WH 14. <4.0 26. <4.0 14.3 367. 118. 0.285 AL ASSIGNED VALUE * 1.90 12.7 13.2 0.700 27.5 3.00 15.2 370 116 289 R-STD DEV * 0.112 0.78 0.77 0.0194 1.33 0.133 0.81 11.3 3.8 10.6605 ACCEPTABLE LIMITS(+-) * 0.224 1.56 1.54 0.0388 2.66 0.266 1.62 22.6 7.6 21.3210 WARNING LIMITS(+-) * .224- .336 1.56- 2.34 1.54- 2.31 .0388- .05822.66- 3.99 .266- .399 1.62- 2.43 22.6- 33.9 7.6- 11.4 21.3210- 31. ACTION LIMITS(<>) * 0.336 2.34 2.31 0.0582 3.99 0.399 2.43 33.9 11.4 31.9815 N * 25 29 29 19 30 26 29 30 30 30 * NOTE: SEE GLOSSARY FOR DEFINITIONS

PARAMETER: 23095 Vanadium ug/L 2009-09-02 PAGE 56 LAB TOTAL AVERAGE SUMMARY OF NO.SAMPLES BIAS BIAS NO. RANK RANK FLAGGING BIAS STATEMENT RANKED % SLOPE BLANK METHOD CODING F003 107.5 10.7 WL 10 ICP-MS F009 199.5 22.1 9 ICP-MS F010 137.0 13.7 10 ICP-MS F011 89.5 8.9 10 F014 155.0 17.2 9 ICP-MS F015 175.5 17.5 10 ICP-MS F020 171.0 17.1 10 ICP-MS F021 102.5 10.2 10 ICP-MS F021b 26.5 3.7 AL WL BIASED LOW* 7 -1.4 -1.9783 ICP-AES F021c 51.5 5.1 AL BIASED LOW* 10 -0.8 -0.8409 ICP-MS F022 179.0 17.9 AL 10 ICP-MS F024 155.0 15.5 10 ICP-MS F032a 258.5 25.8 AHAH AHWH BIASED HIGH 10 5.3 1.1139 ICP-AES-E3386 F032c 104.5 10.4 10 ICP-MS-E3473 F032d 138.5 15.3 9 ICP-MS-E3474 F042 37.0 5.2 BIASED LOW* 7 -0.5 -2.0001 ICP-AES F060 194.5 19.4 WH 10 ICP-MS F068 53.5 5.3 WLWL WL WL AL BIASED LOW* 10 -1.9 -2.0847 ICP-MS F069 111.5 11.1 10 ICP-MS F069b 91.0 10.1 9 ICP-AES F139 210.5 21.0 AL 10 ICP-MS F154 138.5 15.3 AHAL 9 ICP-MS F158 70.0 8.7 8 ICP-MS F169 168.5 16.8 10 ICP-MS F183 132.5 13.2 10 ICP-MS F186 275.0 27.5 AHAHAHAHAHAHAHAHAHAH BIASED HIGH 10 80.1 14.5695 ICP-MS F193 152.0 15.2 10 ICP-MS F196 35.0 8.7 INSUFFICIENT DATA 4 ICP-AES F248 214.5 23.8 9 ICP-MS F287 96.0 13.7 WH AL 7 ICP-AES * NOTE: INDICATED BIAS STATEMENT IS FOR CAUTION ONLY AND NOT COUNTED IN STUDY STATISTICS PERCENT SLOPE USED FOR CAUTION COMPARISON = 5 OVERALL AVERAGE RANK IS 14.5

FPTM STUDY 0094 DATA SUMMARY 2009-09-02 PAGE 57 PARAMETER: 30095 Zinc ug/L WATER SCIENCE & TECHNOLOGY ENVIRONMENT CANADA EC PT for Trace Elements in Water --------------------------------- SAMPLE 1= 2= 3= 4= 5= 6= 7= 8= 9= 10= TM-23.4 TM-26.4 TM-15.2 TMRain-04 TM25.4 TM-09 TM-16 TMDA-65 TMDA-62.2 TMDA-64.2 LAB NO LAB RESULT LAB RESULT LAB RESULT LAB RESULT LAB RESULT LAB RESULT LAB RESULT LAB RESULT LAB RESULT LAB RESULT ---------- ---------- ---------- ---------- ---------- ---------- ---------- ---------- ---------- ---------- F003 2.37 37.9 35.7 8.94 43.4 43.5 99.0 384. 119. 309. F009 <5. 42. 38. 9.9 49. 51. 110. 445. WH 131. 345. WH F010 231. AH 35.0 32.2 8.67 41.1 44.0 91.3 379. 112. 292. F011 2.4 37.3 34.1 8.7 43.3 51.6 96.4 384. 117. 302. F014 <5. 36. 33. 8. 41. 46. 93. 376. 117. 292. F015 2.4 38.2 34.4 9.2 43.4 45.6 99.2 397. 121. 312. F020 2.3 36.6 32.6 8.2 43.4 47.7 95.4 385. 114. 300. F021 2.7 33.7 31.8 7.6 40.9 43.6 92.8 383. 114. 296. F021b 2. 37. 34. 8. 42. 46. 95. 380. 114. 298. F021c 2.4 34.4 31.9 7.9 40.0 43.8 93.9 372. 112. 294. F022 2.21 38. 35. 7.8 44. 47. 101. 403. 121. 317. F024 2.4 38.1 35.0 9.6 43.2 43.8 98.5 401. 121. 314. F026 <5. 39. 36. 10. 45. 47. 100. 405. 121. 316. F032a 2.9 39.5 37.1 7.4 44.2 49.8 101. 398. 123. 317. F032c 2.7 40.9 37.0 9.0 46.0 54.0 104. 414. 124. 320. F032d 2.99 38.7 35.1 8.63 46.0 52.0 105. 407. 123. 316. F032g 2. 38. 36. 5. AL 44. 48. 101. 410. 126. 323. F042 1.66 37.6 34.7 8.40 46.8 42.8 99.7 402. 117. 317. F060 2.77 42.1 38.5 8.87 48.0 47.9 105. 415. 127. 320. F068 3. 38. 33. 8. 44. 56. WH 99. 414. 110. 320. F069 2.5 40.4 36.6 8.8 45.9 44.7 105. 383. 126. 301. F069b <2. 37. 34.4 7.1 43. 43. 98.7 389. 117. 307. F139 3.56 WH 37.4 34.4 8.18 43.4 43.2 98.6 390. 117. 307. F154 4.4 AH 45.6 AH 40. WH 11.1 WH 49.4 WH 51.9 105. 334. AL 267. AH 128. AL F158 <5. 39.8 36.4 9.0 46.1 56.5 WH 104. 410. 128. 320. F169 2.91 38.0 35.4 7.69 44.1 45.7 102. 404. 117. 313. F183 2.05 43.2 WH 37.0 10.4 48.7 47.4 110. 458. AH 135. WH 341. WH F186 <0.5 AL 33.7 31.9 5.7 WL 43.7 38.8 104. 401. 113. 301. F193 <3.0 36.8 34.1 7.97 42.5 46.9 99.2 399. 116. 309. F196 <2. 38. 35. 8. 44. 45. 100. 395. 121. 311. F207 <4. 38. 34. 9. 43. 43. 99. 390. 118. 306. F223 <100. <100. <100. <100. <100. <100. 105. 409. 127. 323. F223b <10.0 38.4 35.3 <10.0 44.6 46.1 103. 391. 127. 312. F248 <15.0 43.1 WH 39.9 WH <15.0 48.9 61.2 AH 107. 423. 128. 330. F287 <3.0 36. 32. 5.65 WL 41. 46.8 93.6 383. 116. 0.303 AL ASSIGNED VALUE * 2.40 38.0 35.0 8.40 44.0 46.1 100 398 120 312 R-STD DEV * 0.521 2.44 2.21 1.048 2.52 3.99 4.97 16.3 6.7 13.0889 ACCEPTABLE LIMITS(+-) * 1.042 4.88 4.42 2.096 5.04 7.98 9.94 32.6 13.4 26.1778 WARNING LIMITS(+-) * 1.042- 1.5634.88- 7.32 4.42- 6.63 2.096- 3.1445.04- 7.56 7.98- 11.97 9.94- 14.91 32.6- 48.9 13.4- 20.1 26.1778- 39. ACTION LIMITS(<>) * 1.563 7.32 6.63 3.144 7.56 11.97 14.91 48.9 20.1 39.2667 N * 22 34 34 32 34 34 35 35 35 35 * NOTE: SEE GLOSSARY FOR DEFINITIONS

PARAMETER: 30095 Zinc ug/L 2009-09-02 PAGE 58 LAB TOTAL AVERAGE SUMMARY OF NO.SAMPLES BIAS BIAS NO. RANK RANK FLAGGING BIAS STATEMENT RANKED % SLOPE BLANK METHOD CODING F003 141.5 14.1 10 ICP-MS F009 286.5 31.8 WH WH BIASED HIGH 9 11.5 -0.9283 ICP-MS F010 76.0 7.6 AH BIASED LOW 10 -20.3 38.4989 ICP-MS F011 132.0 13.2 10 F014 66.5 7.3 BIASED LOW 9 -5.9 0.5223 ICP-MS F015 170.0 17.0 10 ICP-MS F020 103.5 10.3 10 ICP-MS F021 52.0 5.2 BIASED LOW* 10 -4.0 -1.5339 ICP-MS F021b 79.5 7.9 BIASED LOW* 10 -4.6 0.1793 ICP-AES F021c 48.0 4.8 BIASED LOW 10 -6.1 -0.4987 ICP-MS F022 176.5 17.6 10 ICP-AES F024 165.5 16.5 10 ICP-MS F026 210.0 23.3 9 ICP-AES F032a 212.5 21.2 10 ICP-AES-E3386 F032c 263.5 26.3 10 ICP-MS-E3473 F032d 238.5 23.8 10 ICP-MS-E3474 F032g 196.5 19.6 AL 10 ICP-AES-system#2,Opt F042 154.5 15.4 10 ICP-AES F060 273.5 27.3 BIASED HIGH* 10 3.3 1.3073 ICP-MS F068 180.0 18.0 WH 10 ICP-MS F069 197.0 19.7 10 ICP-MS F069b 88.5 9.8 9 ICP-AES F139 129.0 12.9 WH 10 ICP-MS F154 252.0 25.2 AHAHWHWHWH ALAHAL 10 ICP-MS F158 253.5 28.1 WH BIASED HIGH* 9 2.3 2.4504 ICP-MS F169 178.0 17.8 10 ICP-MS F183 287.0 28.7 WH AHWHWH BIASED HIGH 10 13.4 -2.0221 ICP-MS F186 84.0 9.3 AL WL 9 ICP-MS F193 114.0 12.6 9 ICP-MS F196 150.0 16.6 9 ICP-AES F207 118.5 13.1 9 ICP-AES F223 117.5 29.3 INSUFFICIENT DATA 4 AAS F223b 170.5 21.3 8 ICP-AES F248 261.5 32.6 WHWH AH BIASED HIGH* 8 4.8 4.3241 ICP-MS F287 53.5 5.9 WL AL BIASED LOW 9 -40.8 11.3048 ICP-AES * NOTE: INDICATED BIAS STATEMENT IS FOR CAUTION ONLY AND NOT COUNTED IN STUDY STATISTICS PERCENT SLOPE USED FOR CAUTION COMPARISON = 5 OVERALL AVERAGE RANK IS 17.2

Printed on 100% recycled paper Emergencies, Analytical Operations Laboratories and Research Support Division (EAOLRSD) Water Science & Technology Directorate Science & Technology Branch Environment Canada Canada Centre for Inland Waters PO Box 5050 867 Lakeshore Road Burlington, Ontario L7R 4A6
Urgences, laboratories d’analyses opérationelles et soutien à la recherche division (ULAOSRD)
Direction générale des sciences et de la technologie, eau Branches des Sciences et technologie
Environnement Canada Centre canadien des eaux intérieures
Case postale 5050 867, chemin Lakeshore
Burlington (Ontario) L7R 4A6 Canada