entry patterns of low-cost airlinesleea.recherche.enac.fr/steve...
TRANSCRIPT

Entry Patterns of Low-Cost Airlines
Mara Lederman and Silke Januszewski
Massachusetts Institute of Technology
This Draft: August 8, 2003

I. Introduction
The airline industry has recently experienced an unprecedented expansion of so-
called "low-cost carriers" (LCCs). These are small airlines that are characterized by
point-to-point service, low fares, few ticket restrictions and limited in-flight service.1
LCCs now transport approximately 20% of U.S. domestic passengers. They compete with
the major network carriers on more than 50% of the routes that the majors serve.2 Most
strikingly, LCCs have managed to be profitable at exactly the time when the largest and
most established network carriers have found themselves in serious financial difficulty.
The recent success of LCCs has attracted the attention of industry analysts, researchers,
travelers and the executives of the network carriers. In fact, as part of their restructuring
plans, large network carriers in several different countries have launched or are planning
to launch low cost spin-offs of their own. However, despite all the attention that LCCs
have drawn, research into why LCCs have been successful while the established network
carriers have struggled is still in its early stages.
One hypothesis explaining the success that LCCs have achieved is that they offer
a new and differentiated product not previously available to consumers. It is well known
that product differentiation softens price competition and, as a result, may allow a larger
number of firms to profitably operate in the market. However, at first glance, the airline
industry is not an obvious one in which to pursue this type of strategy because a large
number of product varieties already exist. Indeed, the airline industry has long been
characterized as an industry with a small number of firms, each of which offers a large
number of products differentiated on price and ticket characteristics. For example, a
ticket for a given route will be offered by an airline for many different prices, depending
on the time of purchase, date and time of flight, length of stay and degree of flexibility
with respect to schedule changes.
Given this, LCCs could pursue two avenues. On the one hand, they could choose
to enter markets with a small number of existing products and offer new service on these
routes. In these markets, the need to differentiate in order to generate demand would be
less strong. Alternatively, LCCs could enter markets with a large number of existing
1 We discuss the characteristics of LCCs in greater detail in Section III. 2 USA Today, April 17, 2003

products and attempt to offer new product varieties - for example, a ticket with few
restrictions for a low fare. Despite the large number of existing products, LCCs may be
particularly successful in introducing new combinations of price and quality dimensions
because of their cost structure, which differs from that of the established network carriers.
This research is interested in understanding the extent to which product
differentiation is part of the entry strategies of LCCs. As a first step, we investigate the
characteristics of routes entered by LCCs from 1996 to 2000. We look for evidence that
the types of routes that LCCs are entering are ones on which we would expect them to
pursue a strategy of product differentiation. For example, a finding that LCCs enter high
density routes with a large number of existing carriers would be consistent with this
strategy. On the other hand, a finding that LCCs enter small airports with only a small
presence by other carriers could be consistent with a strategy of targeting markets where
the number of products and extent of differentiation is lower.
Estimating firm entry decisions poses an econometric difficulty because the entry
decision of any one firm depends on the simultaneous entry decisions and the competitive
behavior of all other firms in the market. The existing literature has dealt with the
simultaneity problem in two ways. One approach has been to estimate reduced form
models that explain the probability of entry as a function of the firm's own characteristics
and characteristics of the market. In many cases, these models omit any measures of
competitors' behavior in the market. The second approach has been to estimate an
equilibrium model of entry which estimates the joint probability of all possible
combinations of firms entering.
In this paper, we follow the reduced form approach in order to gather preliminary
evidence that may suggest whether LCCs are pursuing a strategy of differentiating
themselves from the existing products in the market. Recognizing that the number of
competitors in a market is endogenous to the entry decision, we include in the models
variables that proxy for the level of competition on a route. A more complete analysis of
this question will include the estimation of an equilibrium model of entry which will
allow us to understand the relationship between market structure and LCC entry
behavior, building on existing work by Berry (1992) and Mazzeo (2002).
Here, we analyze the entry decisions of 12 LCCs on 3977 routes in each quarter
between 1996 and 2000. The primary source of data is a detailed database of carriers'
direct flights schedules, prepared by the Official Airlines Guide (OAG). To our
knowledge, this paper is the first to analyze entry decision using OAG flight schedule
data.3 We estimate probit models which explain a carrier's decision to enter a route that it
previously had not served as a function of its own characteristics, exogenous market
characteristics, and the presence of competitors at the endpoint airports of the route.
Several findings stand out. First, entry by LCCs is positively related to their
existing presence at the endpoint airports of a route. Second, LCCs are more likely to
enter larger airports and short- and medium-haul routes. These are both characteristics
which are associated with high traffic density. To the extent that the LCCs' strategy is to
offer a combination of quality and price that is targeted at more price-sensitive
consumers, high density routes may be the ones where there is sufficient demand for the
LCCs to concentrate on offering only these products. Third, our results indicate that
LCCs are more likely to enter routes which have a larger number of established network
carriers serving both endpoints. We also find weak evidence that LCCs avoid routes that
depart from heavily dominated airports. However, overall, we find no evidence that
LCCs pursue a strategy of entering routes which have little existing service.
The remainder of the paper is organized as follows. In Section II, we briefly
review the existing empirical literature on airline entry. Section III describes the sources
of data and the construction of the sample. In Section IV, we present descriptive facts
about the entry patterns of LCCs. In Section V, we motivate our empirical approach with
a simple model of carriers' entry and service decisions and discuss the variables included
3 Previous work on entry has primarily used the Department of Transportation Databank 1A which is a 10% sample of domestic tickets in a quarter. The DOT data allow fares and market shares to be observed; however, these data provide no information on flight schedules or frequency. As a result, in these studies, a carrier's presence at an airport must be inferred from the number of passengers it carries on routes departing from the airport. This measure necessarily depends on the passengers' choice to fly with a particular airline and is therefore likely to be influenced by the competitive behavior of carriers who are serving a route. The OAG data have the advantage of allowing us to observe exact flight schedules and frequencies so that we can construct measures of a carrier's dominance at an airport based on the number (or fraction) of flights or destinations that it serves out of that airport without having to rely on an outcome variable such as the number of transported passengers.
in the model. Regression results are presented and discussed in Section VI. A final
section concludes.
II. Previous Literature on Entry into Airline Markets
Firms are modeled as entering markets if their profits from entering are greater
than zero. A firm's profits will depend on its own characteristics, market characteristics,
the presence of other firms in the market and their competitive behavior. If firms make
their entry decsions at the same then, then a simultaneity problem will exist. As
mentioned in the introduction, previous work on entry has followed two different
approaches. One set of papers have estimated the likelihood of entry as a function of firm
and market characteristics, typically using probit models. Among the studies of entry into
airline markets that have used this approach are Sinclair (1995), who examines the
importance of hub-and-spoke networks for route- level entry and exit decisions, and
Boguslaski et al. (2002), who analyze entry by one of the oldest and the most successful
low-cost carriers, Southwest Airlines. They look at markets which Southwest had not
entered by 1990 and estimate the probability of subsequent entry by Southwest into those
markets. Ito and Lee (2003) extend this work to include a larger set of LCCs. Their
study aims to predict the vulnerability of routes to future LCC entry.
The other strand of the entry literature estimates structural models of entry
decisions. Bresnahan and Reiss (1990, 1991) estimate the relationship between market
size and the number of firms in the market for several industries in small, isolated cities.
From their results, they infer entry thresholds above which an additional firm would be
able to profitably operate in the market. Reiss and Spiller (1989) estimate entry into small
airline markets in which at most one airline provides direct service. They set up a
structural model of cost and demand conditions and assume a particular form of
competitive behavior. From this, they estimate the probability of one airline offering
direct service as a function of route and endpoint characteristics.
Berry (1992) further develops the approach of estimating the equilibrium number
of firms in the market. He models the simultaneous decisions of airlines to provide
service on a particular route. His paper considers routes between the fifty largest U.S.
cities. Berry estimates the number of airlines providing direct service on a route as a

function of route and endpoint characteristics and the carriers' presence at the endpoint
airports, taking the carriers' network structure as given. He assumes that, after controlling
for their airport presence, the airlines in his sample are identical up to an identically and
independently distributed error term in the profit equation, which represents unobserved
firm heterogeneity. One implication of this assumption is that - again after controlling for
observables and unobserved firm heterogeneity - all airlines have the same competitive
effect on other firms in the market.
Mazzeo (2002) extends the previous work by developing a framework which allows for
the presence of heterogeneous types of firms in the market. He uses this framework to
estimate the entry decisions of low-quality and high-quality motels. The advantage of this
approach is that it allows different types of firms to have systematically different effects
on the profits of other firms in the market. This is particularly important if product
differentiation softens competition between firms of different types. In the context of the
airline industry, this approach would allow us to test whether the presence of network
carriers and low-cost carriers in a market have different effects on the profitability of
entry by an airline of a particular type.4 For example, if LCCs are differentiating
themselves from network carriers but not from other LCCs, then we might expect that
LCCs are less likely to enter markets with existing LCC presence and more likely to enter
markets only served by network carriers.
III. Data
This section provides a brief discussion of the sources of data and the construction
of the sample. A discussion of the variables used in the regression models is left until
section 5 where it is combined with our presentation of the empirical model. A detailed
discussion of the construction of the data set and variables can be found in the Appendix.
III.A. Sources of Data
The primary source of data used for our analysis of LCCs' entry decisions is a
detailed database of airline flight schedules prepared by the Official Airlines Guide 4 See also Greenstein and Mazzeo (2003), who test whether entry behavior in the local telecommunications industry depends on the types of services offered by the firms
(OAG). The OAG database contains, for each quarter between 1996 and 2000, a weekly
schedule of all direct flights operated by all domestic and international carriers. Each
observation in this database represents a particular flight by a carrier in a quarter and
includes information on the identity of the carrier, the origin and destination airports, the
arrival, departure and flying times, the days of the week on which the flight operates,
whether the flight is a codeshare flight and, for codeshare flights, the identities of the
operating and codesharing carriers. The OAG data are used to determine the exact routes
that are served by each carrier in each quarter and to identify the quarter in which carriers
enter particular routes. These data are also used to construct several of our explanatory
variables.
We supplement the OAG data with a number of other data sources which are used
to construct additional explanatory variables. Data on hotel and manufacturing sales for
each MSA in our sample and 1999 MSA-level population estimates are taken from the
U.S. Census Bureau. Data on average annual wages by MSA are taken from the U.S.
Department of Commerce, Bureau of Economic Analysis. A dataset purchased online at
http://www.airportcitycodes.com/aaa/CCDBFrame.html provides the latitude and
longitude coordinates of each airport, which are used to calculate approximate distances
between airports.
III.B. Construction of the Sample
We analyze entry at the airport-pair level, using the term "airport-pair" to refer to
service between two endpoint airports in either direction. Because it is very rare for a
carrier to serve an airport-pair in one direction and not the other, we do not separately
analyze the two directions of the pair. Throughout the paper, we will often use the term
"route" interchangeably with "airport-pair". To investigate the factors affecting LCCs'
entry decisions, we need to observe not only the routes that a carrier actually enters, but
also those routes that a carrier chooses not to enter. To do this, we construct a set of
"potential routes" that a carrier may choose to enter. We use the OAG data to rank all
U.S. airports, based on the number of flights departing from the airport in a week. We
restrict our sample to the top 100 ranked airports and consider all routes between these
100 ranked U.S. airports to be potential routes, excluding the ones that are less than 50
miles apart. This results in a dataset of 3977 distinct airport-pairs.
For these 3977 routes, we consider the entry decisions of 12 domestic airlines, in
each quarter between 1996 and 2000. The airlines we consider are those that are typically
referred to in the industry and popular press as "low-cost carriers". We adopt this term
here but recognize that it may be somewhat misleading. It is not the case that these "low-
cost carriers" have inherently lower marginal costs for all types of air transportation
services, but rather that they may choose to specialize in those services which they are
able to provide at a low marginal cost.
While we use the term "LCC" throughout the paper, we prefer to describe our
group our carriers based on a set of characteristics that they share. First, with the
exception of Southwest Airlines, the carriers in our group are substantially smaller than
the established network carriers. Second, the carriers that we analyze offer only one class
of service on a route. This is contrast to the large network carriers which generally offer
two or more classes of service on most flights.5
Third, anecdotal evidence suggests that, within the single class of service that they
offer, the carriers in our group generally offer a smaller number of varieties (where
different varieties of a ticket would refer to different combinations of price and ticket
restrictions). In particular, offering a fewer number of restrictions on their tickets seems
to be one of the dimensions on which the LCCs differentiate themselves from the
established network carriers. For example, at the time that this paper was written, we
conducted internet search for a roundtrip ticket between Denver and San Francisco, for
the purpose of illustrating the differences in the number and types of varieties offered by
United Airlines (network carrier) and Frontier (LCC). A three-week advanced purchase
ticket for travel between Denver and San Francisco on a Tuesday cost $287 on Frontier
and $318 on United. The same ticket purchased one week in advance still cost $287 on
Frontier but the fare increased to $510 on United. To buy the ticket one day in advance
cost $419 on Frontier and $584 on United. A first-class ticket for this route could be
5 This is based on the DOT DB1A data in 1996. The DB1A data identify the "class" of a ticket which allows us to calculate whether or not a carrier offers more than one ticket class. The large network carriers usually offer coach and business class.

purchased only from United and cost $1639. This example suggests that not only does
Frontier offer lower fares but, in addition, it offers fewer varieties of tickets and, in
particular, is less likely to differentiate its product based on advance purchase
requirements. In addition, we compare the ratio of the 80th and 20th percentile fare
received by a carrier on route and find that the network carriers generally have greater
dispersion in the fares that they receive on a particular. Although the data used for this
exercise do not allow the ticket characteristics to be observed, the finding of greater
dispersion among the network carriers is consistent with them offering a larger number of
varieties on a given route.
Finally, relative to the network carriers, the LCCs in sample tend to transport a
larger fraction of passengers using direct flights, suggesting that they rely less on a hub-
and-spoke system. A list of the 12 LCCs and the year in which they begin operations
appears in Table 1. In Table 2, we compare the characteristics of our LCCs with eight
major network carriers, for the purpose of illustrating differences between the two types
of airlines.
Each of the 12 LCCs is considered to be a potential entrant in each airport-pair
that it did not serve in the previous quarter. Thus, the level of observation in our dataset is
the airline-route-quarter. After a small number of data restrictions, which are described in
the Appendix, the final entry dataset has 830,989 observations.
IV. Facts on Service and Entry
IV.A. Service at the Beginning and End of the Sample
We begin this section by documenting the extent of service at the beginning and
end of our sample. The purpose of this exercise is to illustrate the change in the extent of
service by LCCs over our five year period and to compare this to any change in the
overall level of service over this period. The patterns described here are summarized in
Table 3. The dataset used to construct Table 3 includes our 12 LCCs and the eight large
network carriers.6
Overall, there is a small increase over our sample period in the number of routes
that are served by at least one carrier. In the second quarter of 1996, 38% of our 3977
6 These are America West, American, Continental, Delta, Northwest, TWA, United, and US Airways.

routes are served by at least one carrier. In the final quarter of 2000, this fraction had
increased to 40%. There is a larger increase in the number of routes that are served by at
least one of our 12 LCCs. At the start of the sample, 11.5% of our routes were served by
at least one LCC, while at the end of the sample, 14.4% were served by at least one LCC.
There are also small increases in both the average number of total carriers and LCCs
serving a route. Most strikingly, there is a very large increase in the average number of
routes served by LCCs over the course of the sample period. At the start of 1996, a LCC
served, on average, 41 different routes. By the end of the sample, this number had
increased by 50% to 60 routes. In contrast, the average number of routes served by all
carriers increased by a much smaller fraction.
IV. C. Entry by LCCs
In this section, we document the extent of entry by our 12 LCCs over the sample
period. We then summarize the characteristics of the routes that they choose to enter.
Table 3 describes the entry behavior that we observe over the sample period. Table 4
presents the characteristics of routes that are entered and compares them to the
characteristics of the sample as a whole.
Recall that we consider all routes that a carrier did not serve in the previous quarter to
be "potential entry observations". As a result, we exclude from the dataset observations
from the first quarter of 1996 (since we do not observe whether a carrier served a route in
the previous quarter) and observations on routes that the carrier served in the previous
period. Over the full sample, 0.05% of all potential entry observations experience
positive entry. In the second quarter of 1996, 40 routes are entered by at least one LCC.
In the final quarter, the comparable figure is 31 routes. The average number of routes
entered in a quarter by a LCC is fairly constant over the sample.
Table 4 summarizes the characteristics of routes that are entered by LCCs during
our sample period. Two main patterns emerge. The first is that the LCCs that entered new
routes during our sample primarily entered routes out of airports at which they already
had a presence. Only 6% of the entry observations in our sample are entry into routes on
which a carrier did not previously have a presence at either endpoint airport.
Approximately half of the entry that took place was into routes on which the carrier
already served other routes out of both endpoint airports. The size of an airline's
operations at the endpoint airports of routes that it enters shows a similar picture. On
average, the maximum share of flights that the LCCs in our sample had at either endpoint
of a route was only 2.2%. However, on routes that they chose to enter, the maximum
share of flights that they had at either endpoint was 11%. Similarly, the number of
destinations that LCCs served out of the endpoint airports of routes that they entered is
substantially larger than the average in sample as a whole.
The second significant pattern that emerges in Table 4 is that LCCs are entering
routes between large airports which are already being served by other carriers. The mean
population of routes entered by LCCs is higher than the mean population on all potential
entry observations. Furthermore, the descriptive statistics suggest that LCCs are not
avoiding routes that are already being served by other carriers. In fact, the average
number of network carriers serving a route entered by a LCC is slightly higher than the
average in the sample as a whole. On routes that LCCs entered, the maximum share of
flights that any rival had at either endpoint was 55% and the maximum number of
destinations served by a rival out of either endpoint was 43.
V. An Empirical Model of Entry
We estimate a reduced form model of entry into airport-pair markets. We assume
that an airline offers service on a route if its expected incremental profits from serving
that route are positive. Profits depend on demand, cost and expected competitive
characteristics of the route. Since the presence of other firms on the route depends on
their demand and cost characteristics, a reduced form model will explain entry as a
function of the airline's own characteristics and the characteristics of all actual and
potential competitors on the route. In a dynamic context, a firm would enter a market if
the present discounted value (PDV) of its expected future profits was greater than zero
and greater than the PDV of not entering now but entering in a later period instead. Here,
we will only look at one-period decisions. We leave the treatment of the dynamic aspects
of the entry decision for future work.

Firm j will enter market m at time t if its expected profits from entering the route
are positive: 0)( >−Π ejmtjmt CE , )(ΠE is the expected variable profit and eC is the sunk
cost of entry. We parameterize the expected profit from entry as:
jmtjmtejmtjmt XCE εβ +=−Π )(
where jmtX contains explanatory variables and jmtε is an i.i.d error term. Both )( jmtE Π
and ejmtC may vary with jmtX .
We then estimate the probability of entry by a carrier on a route using probit
models based on the following equation:
)|Pr()|Pr( jmtjmtjmtjmtjmt XXXEntry βε >=
As potential entrants for a route, we consider all airlines in our sample that did not
serve the route in the previous period. We construct the dependent variable, ENTRY,
which equals one if a carrier serves a route in a quarter and did not serve that route in the
previous quarter. Carriers are considered to serve a route if they are observed in the OAG
data as operating at least one direct flight per week on a route in a quarter.
The jmtX matrix contain the carrier's own as well as the competitors'
characteristics at the endpoint airports of the route and characteristics of the route itself.
A detailed description of how each of our variables is constructed can be found in the
Appendix. Here, we provide a brief description of the variables that we use. Summary
statistics are reported in Table 5.
Specifically, we control for the carrier's existing presence at the endpoint airports
with the following variables: first, we construct indicators for whether the carrier serves
at least one or both endpoints of the route. The descriptive statistics in Section II (and the
economics of networks) suggest that existing presence at one or both endpoints should
have a strong positive effect on the likelihood of entry into a route. Next, we calculate a
carrier's share of flights at the endpoint airports of the route and include in the model the
maximum share of flights that it has at either endpoint airport. The share of flights at the

endpoint airports is a measure of airport dominance. Since previous work has provided
evidence that a dominant position at the endpoint airports creates market power on the
route (Borenstein, 1989, 1991, Evans and Kessides, 1993), we expect that the share of
flights should have a positive effect on the likelihood of entry. 7 As alternative measures
of the carrier's presence at the airport, we calculate the number of destinations served by
the carrier out of the endpoint at which it is larger.
We control for the size of the endpoint airports with two variables - the total
number of flights (for all carriers) departing from the larger endpoint airport and from the
smaller endpoint airport. Furthermore, we include in our estimation a measure of the
importance of the route for the carrier's network. To capture the contribution of an
airport-pair to an airline's existing network, we calculate the total number of new one-
stop connections created if the route is added to a carrier's existing network. The variable
only counts new connections between cities that previously had no direct or one-stop
connecting service offered by the carrier.
As the actual or potential competitors' characteristics on the route, we include
measures of their presence at the endpoint airports. First, we control for the number of
competitors who served both endpoints in the previous quarter. In some specifications,
we separately control for the number of network carriers (NC) and the number of LCC
competitors to allow for differential effects of these two different types of airlines. Next,
we include the largest share of flights of any competitor at the endpoint airports. A large
share of flights by a competitor at an endpoint airport is a measure of that carrier's
dominance which we expect to reduce the likelihood of entry by another carrier.
Alternatively, we use the number of destinations served out of the airport as measures of
the competitors' presence at the airport. All these variables proxy for the likelihood that a
given competitor will be serving the route.
We further include several route-specific variables that are related to demand and cost
conditions on the route. First, we use the geometric mean of the city populations at the
endpoint airports as a measure of market size. We also use the average annual wage or
salary of the endpoint MSAs as additional explanatory variables. Both average population
and average wage or salary are expected to have a positive effect on demand and,
7 However, these studies do focus on network carriers.
therefore, on the likelihood of entry. As a measure of the proportion of business and
leisure travelers on the route, we use an indicator variable for one of the endpoints being
a tourist destination. 8 We control for the distance of the route with dummy variables for
short-haul routes of less than 600 miles and for medium-haul routes of 600-1200 miles.
To capture the fact that small airports in cities with other larger airports (for example,
Midway Airport vs. O'Hare in Chicago) may be, for reasons not measured by our other
explanatory variables, easier to enter than the larger airport in the same city, we construct
a periphery variable which equals one when a route involves an endpoint airport that is
within 50 miles of a larger airport. We also include an indicator for whether one of the
endpoints is a slot-controlled airport. All regressions are estimated with carrier and time
fixed effects.
VI. Estimation Results
VI.A. Service Patterns at the Beginning of our Sample
We begin with an analysis of the characteristics of routes served by LCCs in the
the second quarter of 1996. The purpose of this exercise is to provide a picture of the
types of routes that LCCs were serving at the start of our sample. These regressions will
reveal any significant differences between the characteristics of routes that LCCs were
serving at the beginning of our sample and the characteristics of routes that we observe
them entering.
We estimate probit regressions with a dummy for whether a route is served by the
carrier as the dependent variable. The explanatory variables are the ones described in the
previous section. All our results are reported as marginal effects for continuous variables,
computed at the mean of the variable. For indicator variables, the effect of a change in the
variable from zero to one on the entry probability is reported. The standard errors are
clustered at the route level.
Table 6 reports the results of the service regressions. The first column shows the
results for the estimation of service by our 12 LCCs. Columns 2 and 3 distinguish within
the sample of LCCs between the smaller LCCs, excluding Southwest (Column 2) and a
8 See the data appendix for the construction of this variable.

regression only for Southwest Airlines (Column 3). In column 4, we provide the results
of the same regression estimated for the eight network carriers listed in Table 1B.
The first three explanatory variables capture characteristics of the carrier at the
endpoint airports. LCCs are 12% more likely to serve routes on which they serve at least
one other route out of each endpoint. A comparison of the coefficients in Columns 2 and
3 shows that the effect of existing service at both endpoints has no significantly different
effect for service by Southwest than for the other LCCs.
The next explanatory variable is our measure of the importance of the route for
the carrier's network. This variable has a positive effect and statistically significant effect.
Interestingly, the effect of this variable on the likelihood of service by Southwest Airlines
is very similar to its effect on service by NCs. This suggests that the size of this effect
may be related to the size of the existing network.
The coefficients for the carrier's share of flights at the endpoint where it has the
larger presence are positive in all four regressions, but are significantly different from
zero only for NCs. The point estimate is also much larger for NCs than for LCCs. This
reflects the fact that NCs tend to serve many of their routes out of hub airports at which
they have a large share of all flights at the airport. The small LCCs tend to operate at
airports at which they have a very small share of all flights. Southwest tends to operate at
airports at which it has a moderate share of flights, but not as large as a typical NC has at
its hubs.
As a measure of the potential or actual competitors on the route, we use the
largest competitor's share of flights at the endpoints. This variable is negative in all four
specifications but statistically significant only for network carriers. These results provide
weak evidence that all carriers are less likely to serve routes out of airports where a
competitor is highly dominant.
Our measures of airport size have mixed effects for LCCs. The geometric mean of
the endpoint populations has no significant effect on service for the full group of LCCs
but has a large and positive effect on service by Southwest. The other endpoint or route
characteristics also have no significant effect on service by LCCs at the beginning of our
sample period. The effects of these characteristics on service by Southwest are similar to
the rest of the LCCs, with two exceptions. First, compared to other LCCs, Southwest is
more likely to serve routes out of periphery airports. Second, Southwest is more likely to
serve short and medium-haul routes than long-haul routes.
VI.B. Entry by Low-Cost Carriers
In this section, we present the results of our estimations of entry by low-cost
carriers. We start with estimations for the entire group of LCCs, which are reported in
Table 7. We then explore whether there is heterogeneity in entry patterns within our
group of LCCs. First, we separate out Southwest Airlines as the largest and most
established carrier within our group.9 Second, we separate 'young' carriers, which started
operating after 1990, and older carriers and test whether there are differences in their
entry patterns. All of the older LCCs in our sample started operating either before
deregulation or in the first half of the 1980s (see Table 1). We estimate probit regressions
on the dataset of all potential entry observations. The dependent variable is a dummy
variable that is equal to one if the airport-pair is entered in this period and zero otherwise.
The estimated coefficients are generally quite small. Recall that less than 1 percent of all
potential entry observations are entries.
Column 1 of Table 7 shows our base case. Again, our first set of explanatory
variables are the carrier's own characteristics at the endpoints of the route. We begin with
the dummy variables indicating the carrier's presence at at least one and at both of the
endpoints. Both variables are positive and statistically highly significant. All else equal,
LCCs are 0.08% more likely to enter a route of which they serve at least one of the
endpoints. If carriers serve both endpoints as opposed to only one, the likelihood of entry
increases by an additional 0.04%.
Our network variable also has a positive and statistically significant effect on
entry. This means that LCCs are more likely to enter routes which add a larger number of
new connections to their network. This is interesting because it reflects the strategy of
some of the smaller LCCs to establish 'mini-hubs' out of which they operate most of their
flights.10 As we will show below, the network variable has no significant effect on entry
9 For the first quarter of 1996, the DB1A reports over a million passengers for Southwest Airlines; the remaining LCCs are reported to have between 2,500 and 90,000 passengers in that quarter. 10 Among these carriers are Midwest Express and Frontier.

by Southwest Airlines, which has a declared strategy of operating a point-to-point and not
a hub-and-spoke system. The carrier's share of flights at the endpoint where it has the
larger share has a negative effect on entry in this specification. However, this variable is
highly correlated with the network variable. As the results in Column 2 demonstrate, the
carrier's share of flights is estimated to have a positive effect on entry if the network
variable is excluded from the regression.
As a measure of the presence of a big competitor at the endpoints, we include the
largest competitor's share of flights in this base regression. The point estimate of this
variable is negative, indicating that LCCs are less likely to enter routes which have a
dominant carrier at one of the endpoints. However, the effect is statistically
indistinguishable from zero.
Next, we turn to the effects of the characteristics of the route itself. The
coefficients on the size of the endpoints, measured as total number of flights of all
carriers from that airport, indicate that LCCs are most likely to enter large or medium-
sized airports. When we control for airport size, we find no statistically significant effects
of either the geometric mean of the endpoint populations or the average wage level of the
endpoint cities, both measures of potential demand. Routes with a tourist destination at
the endpoints are more likely to be entered, but the effect is quite small. Short and
medium-haul routes are more likely to be entered than long-haul routes. The indicator
variables for slot-controlled and periphery airports have no statistically significant effect.
Columns 2 and 3 of Table 7 show alternate specifications that we estimate as
robustness checks. The regression reported in Column 2 excludes the network variable.
This increases the size of the coefficients of the other variables that capture the carrier's
presence at the endpoints, and the effects of the airport size variables. The carrier's own
share of flights at an endpoint now has a positive effect on entry, rather than the negative
effect found in the base specification.
Column 3 replaces the share of flights, used as a measure of the carrier's presence
at the endpoints, with the total number of destinations served by the carrier out of the
larger endpoint. The carrier's own number of destinations has a positive effect on entry.
The point estimate for the largest competitor's number of destinations is positive, but

statistically indistinguishable from zero. There is no statistically significant change in any
of the other variables.
Column 4 of Table 7 reports an alternative regression which includes the number
of competitors who serve both endpoints as a regressor. We distinguish here between NC
and LCC competitors. We find that the number of network carriers serving both
endpoints has a positive and highly significant effect on entry by LCCs, while the number
of other LCCs serving both endpoints is estimated to have a negative effect on LCC
entry. However, the latter effect is statistically indistinguishable from zero. The first
finding is very interesting because it shows that LCCs tend to enter routes on which
network carriers are likely to be present. The finding for LCC rivals is harder to interpret
because although it provides some indication that LCCs are less likely to enter routes on
which other LCCs are present, there are many fewer routes with any LCC presence at
both endpoints.
We also performed additional robustness checks that we do not report separately
in our tables. First, we included the mean population of the largest MSAs within 100
miles of the endpoint airports. Second, we replaced the distance dummies with
continuous variables for the distance and the square of the distance of the route. Neither
of these changes had a statistically significant effect on the other variables in the
regression.
We now turn to Tables 8 and 9 in which we explore the heterogeneity of the entry
patterns within our sample of LCCs. Table 8 shows the results of regressions in which we
interact all explanatory variables with a dummy variable that is equal to one if the carrier
is Southwest Airlines. We first report the base case, and then a specification including the
number of NC and LCC competitors, as in Column 4 of Table 7. We find small
differences between the entry patterns of Southwest and the other LCCs. The indicator
for serving at least one endpoint has a larger coefficient for Southwest, while the other
measures of the carrier's airport presence have a smaller effect for Southwest. In
particular, the network variable and the carrier's share of flights at the larger endpoint
have a significantly positive effect on entry by the smaller LCCs while they have a
negative on entry by Southwest. Again, this reflects the fact that some of the smaller
LCCs establish small 'mini-hubs', while Southwest operates a point-to-point system.
Interestingly, the results of the second specification suggest that Southwest is more likely
than the other LCCs to enter routes with a larger number of competitors serving both
endpoints; however, though the difference of this effect between Southwest and the rest
of the sample is statistically indistinguishable from zero.
Table 9 shows the result of regressions in which we interact the explanatory
variables with a dummy for whether the carrier is a 'young' carrier which began
operations after 1990. We are interested in these results in order to test whether carriers
behave differently in the early years of their operations. The main difference that we find
is that the variables capturing the carrier's presence at the endpoints have a larger effect
on entry by young carriers than on entry by older carriers. This suggests that carriers
expand from a small number of airports in the early years of their operations and enter
routes involving airports at which they have a smaller presence later in their life cycle.
Also, while the largest competitor's share of flights has a negative effect on entry
by the older LCCs in specification (1), it does not have a significant effect on entry by the
younger carriers. This suggests that the younger LCCs are less deterred by the presence
of a large carrier at an endpoint of a route. The results from the second specification
show, in addition, that the number of NCs serving both endpoints has a positive effect on
entry by both types of LCCs, but the effect is not significant for the young ones.
To summarize, we find strong evidence that a carrier's own presence at the
endpoint airports has a positive effect on the likelihood of entry. We find only weak
evidence that LCCs avoid airports at which another carrier is highly dominant. In
addition, LCCs tend to enter routes on which network carriers are likely to be present,
while there is weak evidence that LCCs avoid routes with a higher likelihood of being
served by another LCC. We also test for heterogeneity in the entry patterns of subsets of
LCCs and find only small differences. Our main findings suggest two things. First, the
type of the potential competitors on a route appears to matter for the entry decision of
LCCs. Second, LCCs tend to enter routes which already have existing service by other
carriers and, in particular, LCCs do not seem to avoid routes which are likely to be served
by NCs. Both of these findings are consistent with LCCs pursuing a strategy in which
they enter routes with a potentially la rge number of existing differentiated products and

attempt to offer a product that is itself differentiated from those already offered by the
NCs.
VII. Conclusion and Directions for Future Research
This paper is the beginning of a research agenda which attempts to understand the
entry strategy that has allowed low-cost carriers to perform so successfully over the last
decade. In particular, we are interested in exploring the hypothesis that LCCs have been
successful because they offer a unique combination of price and quality attributes which
were not previously available to consumers. While the relationship between product
differentiation and market structure has been studied before, we find it especially
interesting to study in the context of LCC entry because airline markets are already
characterized by extensive product differentiation. While the potential for LCCs to offer
additional differentiation might seem limited in this type of market, their success suggests
that they nevertheless manage to offer a new price-quality combination which attracts
high demand. Their ability to offer to profitably provide a price-quality combination not
offered by the established networks may stem from differences in the cost structures of
the two types of carriers.
In this paper, we investigate the characteristics of routes that are entered by LCCs.
We look for evidence that suggests that the types of routes that LCCs enter are consistent
with the hypothesis that they pursue a differentiation strategy. While we recognize that
the conclusions that we can draw from our reduced form analysis are limited, the results
do provide some preliminary evidence consistent with the hypothesis that LCCs may be
entering with the intent to expand the variety of products offered in the market.
Specifically, we find that LCCs are more likely to enter routes with a larger degree of
potential competition from established network carriers. This suggests that LCCs do not
avoid markets where many product varieties already exist. In order to be successful in
these types of markets, LCCs must either offer a differentiated product or provide
products similar to existing ones but at lower prices. Anecdotal evidence suggests that
LCCs do have a cost advantage but are not simply providing similar products at lower
prices. For example, LCCs differentiate their flights on dimensions such as reduced in-
flight service and little or no frequent- flyer benefits and many fewer restrictions on

advance purchase and schedule changes. Indeed, the fact that the established network
carriers are attempting to launch low-cost spinoffs of their own indicates that they view
the LCCs as providing a product that they do not already offer.
There are several possible extensions of the current work. First, one could use an
equilibrium model of entry to investigate whether LCCs are in fact offering a new
differentiated product. This type of model would allow us to test whether different types
of firms have different impacts on each other's profits and entry decisions. The limitation
of this approach is that while it can establish that different types of firms have different
competitive effects on each other, these models do not provide an explanation as to how
these firms are differentiating themselves.
Second, existing work studying the impact of LCC entry has found that LCC
entry lowers average prices in the market (for example, Whinston and Collins, 1992,
Windle and Dresner, 1999, and Richards, 1996). However, these studies ignore the effect
of changes in product variety that may result from LCC entry. In addition, given that the
established network carriers offer a variety of products some of which may be more
similar to the products introduced by LCCs than are others, it would be interesting to
study not only the impact of LCC entry on average fares but rather the impact on the
distribution of fares charged by incumbents.
Finally, we are interested in the question of how LCCs are positioning their
products relative to the products offered by the major carriers. Specifically, what is the
combination of price and quality that they are offering and how does it affect the pricing
strategies that the network carriers have pursued?

Appendix A Construction of the Dataset
A.1 Selection of Carriers We start with all domestic carriers which we observe in the OAG database and which are recorded to have carried at least 500 passengers in at least one quarter of the Department of Transportation's Database 1A, a 10 percent sample of all domestic airline tickets. We eliminate carriers which offer only short-haul flights less than 600 miles and carriers which are subsidiaries of other airlines or which exclusively operate regional flights for other carriers. We exclude carriers that largely operate outside the contiguous United States, such as Alaska Airlines and Hawaiian Airlines. We exclude National Airlines and JetBlue Airlines because they begin operations late in our sample period. We exclude Legend Airlines and Tahoe Air because they are missing from the OAG database for several quarters of our sample. We exclude Midway Airlines because its strategy of focusing on business travelers is very different from the other LCCs. Finally, we exclude Valujet Airlines because it stopped flying shortly after its crash in May of 1996. We are left with 20 carriers, eight of which are large network carriers and 12 of which are considered LCCs.
A.2. Selection of Airports We use the OAG database of all scheduled direct flights to calculate the total number of flights (both domestic and international) that depart from an airport in a week. We then calculate the minimum of this value over the four quarters of 1996. We use the minimum number of departing flights in 1996 to rank U.S. airports and then keep airports that fall into the top 100, based on these rankings. We consider all routes between these top 100 ranked airports to be the "potential routes" that a carrier may serve. We consider service between two endpoint airports in either direction to be the same route (that is, we analyze service and entry decisions at the airport-pair level). We eliminate routes that have an airport in Hawaii or Alaska at either endpoint. We also eliminate routes that are less than 50 miles apart. This drops routes such as LaGuardia and JFK and Miami and Ft. Lauderdale. We are left with 3977 distinct routes.
A.3. Preparation of Dataset We consider the entry and service decisions of each of the 12 carriers on each of the 3977 routes in each quarter between 1996 and 2000. To do this, we construct an observation for each carrier-route-quarter. This produces a dataset with a total of 954,480 carrier-route-quarters (12 carriers * 3977 routes * 20 quarters). We then merge in the OAG database, which allows us to observe whether each carrier serves each route in a particular quarter. For codeshare flights (flights that are operated by one carrier but on which other carriers may sell tickets under their own codes), we consider only the operating carrier, and not the codesharing carriers, to be providing service on the route. We also merge in a dataset of demographic characteristics of the MSA in which each endpoint airport is located. We eliminate all quarters for carrier-route combinations in which the carrier serves the route during our sample period with gaps. We then restrict this dataset to include only "potential entry observations". To do this, we keep only

observations on carrier-route-quarters that the carrier did not serve in the previous quarter. We exclude all observations from the first quarter of 1996 because we do not observe the carriers' service in prior quarter.
A.4. Variable Definitions and Sources This section provides variable definitions. The data source for the variable appears in parentheses after the definition. i. Service Variables SERVE = 1 if carrier is observed in the OAG data as operating at least one direct flight per week on the route in the current quarter (OAG) ENTRY = 1 if carrier serves the route in the current quarter and did not serve the route in the previous quarter. This variable is only defined on routes that a carrier is observed not serving in the previous quarter (OAG) ii. Route Characteristics MEAN_POP = Geometric mean of the populations of the MSAs in which the two endpoint airports of the route are located. Measured in 000,000s. Estimates for 1999 (U.S. Census Bureau) AVE_WAGE = Geometric mean of the average annual wage or salary received in the MSAs in which the endpoint airports of the route are located. Measured in 000s. (U.S. Department of Commerce, Bureau of Economic Analysis) TOURIST = 1 if either endpoint of the route is designated as a "tourist MSA". MSAs are designated as "tourist" if their ratio of hotel to manufacturing sales is greater than 0.04. Four airports - San Francisco, Washington Dulles, Washington National, and Baltimore International - are located in MSAs that meet the "tourist" designation, but are not considered by us to be "tourist MSAs" (U.S. Census Bureau) DISTANCE = distance (in miles) between the endpoint airports of a route. Measured in 000s (LAT-LONG data) DIST600 = 1 if DISTANCE<600. These are considered "short-haul" routes DIST1200 = 1 if 600<DISTANCE<1200. These are considered "medium-haul" routes PERIPHERY = 1 if either endpoint airport of the route is designated as "periphery". An airport is designated as "periphery" if there exists another airport within 50 miles of the airport which is larger than the first airport, based on the total number of domestic departures from the airports (LAT-LONG data and OAG) SLOT = 1 if either endpoint of the route is slot-controlled. The slot-controlled airports are JFK, La Guardia, Washington National and Washington Dulles MAX_ARPT_TOTFLTS = the total number of departing flights in a week from the larger endpoint airport of a route (OAG) MIN_ARPT_TOTFLTS = the total number of departing flights in a week from the smaller endpoint airport of a route (OAG) iii. Carrier-Route Characteristics SERVE_ONE_END_1 = 1 if carrier served at least one endpoint airport of the route in the previous period (OAG) SERVE_BOTH_ENDS_1 = 1 if carrier served both endpoint airports of the route in the previous period (OAG)

MAX_OWN_SHFLTS_1= the maximum share of flights that carrier had at either endpoint airport of the route in the previous period. Carrier's share of flights from an airport is calculated as the fraction of all departing domestic flights from the airport in a week that are operated by the carrier (OAG) SUM_NEW_NETWORK = the number of new one-stop routes created if the carrier adds the route to its existing network. Only counts one-stop routes on which the carrier did not already offer direct or connecting service and which are not more than twice the direct distance between the ultimate endpoints. This variable attempts to measure how much a particular route contributes to a carrier's existing network. For example, a carrier that enters the Boston-Atlanta route will now be able to transport passengers from Ft. Lauderdale to Boston, by connecting them through Atlanta. This will add to the carrier's overall network if it did not already offer direct of one-stop connecting service between Ft. Lauderdale and Boston. This variable counts the total number of new one-stop routes that would created by the carrier's addition of the route. To avoid counting unreasonably long connections, such as Boston -- Los Angeles -- New York, we only count new connections for which the total distance flown is less than twice the direct distance (OAG) MAX_OWN_DESTS_1 = the maximum number of destinations that carrier served out of either endpoint airport of the route in the previous period (OAG) iv. Aggregated Rival-Route Characteristics NUM_RIV_BOTH_ENDS_1 = the number of rivals that served both endpoint airports of the route in the previous period (OAG) NUM_NC_BOTH_ENDS_1 = the number of large network carriers that served both endpoint airports of the route in the previous period (OAG) NUM_LCC_BOTH_ENDS_1= the number of LCC rivals that served both endpoint airports of the route in the previous period (OAG) MAX_RIV_SHFLTS_1 = the maximum share of flights that any rival had at either endpoint airport of the route in the previous period. Share of flights defined above (OAG) MAX_RIV_DESTS_1 = the maximum number of destinations that any rival served out of either endpoint airport of the route in the previous period (OAG)

References
Berry, S.T. (1992), "Estimation of a Model of Entry in the Airline Industry",
Econometrica 60(4), 889-917.
Boguslaski, C., H. Ito, and D. Lee (2002), "Entry Patterns in the Southwest Airlines
Route System", mimeo, Brown University.
Borenstein, S. (1989), "Hubs and High Fares: Dominance and Market Power in the U.S.
Airline Industry", Rand Journal of Economics 20(3), 344-65.
Borenstein, S. (1991), "The Dominant Firm-Advantage in Multiproduct Industries:
Evidence from the U.S. Airlines", Quarterly Journal of Economics 106(4), 1237-
1266.
Bresnahan, T. and P. Reiss (1991), "Entry and Competition in Concentrated Markets",
Journal of Political Economy 99 (5), 977-1009.
Bresnahan, T. and P. Reiss (1990), "Ent ry into Monopoly Markets", Review of Economic
Studies, 57(4), 531-553.
Evans, W.N. and I.N. Kessides (1993), "Localized Power in the U.S. Airline Industry",
Review of Economics and Statistics 75(1), 66-75.
Greenstein, S. and M. Mazzeo (2003), "Differentiation Strategy and Market
Deregulation: Local Telecommunication Entry in the Late 1990s", NBER
Working Paper 9761.
Ito, H. and D. Lee (2003), "Low Cost Carrier Growth in the U.S. Airline Industry: Past,
Present, and Future, mimeo, Brown University.

Mazzeo, M. (2002), "Product Choice and Oligopoly Market Structure", Rand Journal of
Economics 33(2), 221-242.
Reiss, P.C. and P.T. Spiller (1989), "Competition and Entry in Small Airline Markets",
Journal of Law and Economics 32, S179-S202.
Richards, K. (1996), "The Effect of Southwest Airlines on U.S. Airline Markets",
Research in Transportation Economics 4, 33-47.
Sinclair, R.A. (1995), "An Empirical Model of Entry and Exit in Airline Markets",
Review of Industrial Organization 10, 541-557.
Whinston, M.D. and S.C. Collins (1992), "Entry and Competitive Structure in
Deregulated Airline Markets: An Event Study Analysis of People Express", Rand
Journal f Economics 23(4), 445-462.
Windle, R. and M. Dresner (1999), "Competitive Responses to Low Cost Carrier Entry"
Transportation Research Part E 35, 59-75.

Table 1A Carriers in Sample
NAME CODE TYPE 1st YEAR OF OPERATIONS AirTran Airways FL LCC 1995
American Trans Air TZ LCC 1981
Eastwind Airlines W9 LCC 1995
Frontier Airlines F9 LCC 1994
Midwest Express Airlines YX LCC 1984
Reno Air QQ LCC 1991
Southwest Airlines WN LCC Pre-deregulation
Spirit Airlines NK LCC 1980
Sun Country Airlines SY LCC 1985
Tower Air FF LCC 1982
Vanguard Airlines NJ LCC 1994
Notes: Souce: Official Airlines Guide (OAG) and Wall Street Journal LCC indicates a “low-cost carrier”; NC indicates a “network carrier” Sample period is 1996 to 2000

Table 1B Characteristics of Carriers
NAME TYPE TOTAL # DOMESTIC
FLIGHTS1 PRICE
DISPERSION2 % OF PASSENGER
TRANSPORTED DIRECT3 AirTran Airways LCC 1793 1.84 0.73 America West Airlines NC 4902 2.03 0.74 American Airlines NC 19,560 2.65 0.80 American Trans Air LCC 903 1.61 0.97 Continental Airlines NC 13,860 2.50 0.84 Delta Air Lines NC 28,791 2.41 0.82 Frontier Airlines LCC 581 1.90 0.82 Midwest Express Airlines LCC 4,324 2.36 0.97 Northwest Airlines NC 15,002 2.66 0.79 Reno Air LCC 1177 1.97 0.95 Southwest Airlines LCC 15,939 1.84 0.92 Spirit Airlines LCC 303 1.51 1 Sun Country Airlines LCC 133 1.25 1 Tower Air LCC 48 1.49 1 Trans World Airlines NC 7503 2.25 0.75 United Airlines NC 25,159 2.50 0.88 US Airways NC 29,271 2.60 0.76 Vanguard Airlines LCC 362 3.06 0.86
Notes: Numbers are from first quarter of 1999 1 Total number of domestic flights operated per week between top 150 ranked U.S. airports (source: OAG data) 2 Calculated as the ratio of the 80th to the 20th percentile fare charged by a carrier for direct service on a route; averaged over all routes between the top 200 airports that are served by the carrier (source: DOT DB1A data) 3 % of all passengers transported on routes between top 200 airports that are transported on direct flights (source: DOT DB1A data)

Table 2
Service in the Beginning and End of Sample
1996 Q2 2000 Q4
% of total observations with SERVE=1 2.91% 3.26%
% of total observations with SERVE=1 that are by a LCC 22.19% 27.08%
% of 3977 routes served by at least one carrier 37.92% 39.53%
% of 3977 routes served by at least one LCC 11.49% 14.41%
% of 3977 routes served by at least one major network carrier that are also served by at least one LCC 13.7% 15.6%
Average # of carriers serving a route in a quarter 0.557 0.559
Average # of LCCs serving a route in a quarter 0.124 0.151
Average # of routes served by a carrier in a quarter 111 124
Average # of routes served by a LCC in a quarter 41 60

Table 3 Extent of Entry by LCCs, 1996-2000
FULL SAMPLE 1996 Q1 2000 Q4
% of potential entry observations that are entered 0.05% 0.09% 0.08%
% of 3977 routes that are entered by at least one LCC in a quarter 0.005% 0.01% 0.008%
Average # of LCCs entering a route in a quarter 0.006 0.01 0.008
Average # of routes entered by a LCC in a quarter 2.03 3.3 3.2
Average # of routes entered by a LCC in a quarter, excluding Southwest 1.63 1 2.44
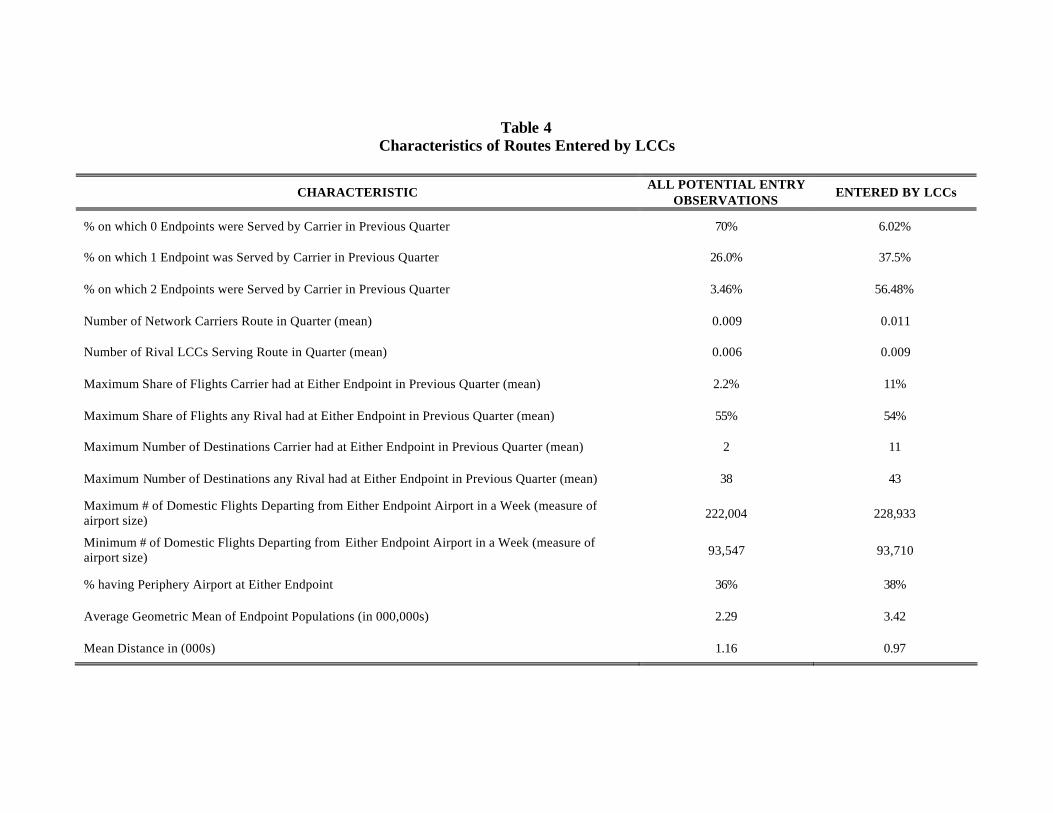
Table 4 Characteristics of Routes Entered by LCCs
CHARACTERISTIC ALL POTENTIAL ENTRY
OBSERVATIONS ENTERED BY LCCs
% on which 0 Endpoints were Served by Carrier in Previous Quarter 70% 6.02%
% on which 1 Endpoint was Served by Carrier in Previous Quarter 26.0% 37.5%
% on which 2 Endpoints were Served by Carrier in Previous Quarter 3.46% 56.48%
Number of Network Carriers Route in Quarter (mean) 0.009 0.011
Number of Rival LCCs Serving Route in Quarter (mean) 0.006 0.009
Maximum Share of Flights Carrier had at Either Endpoint in Previous Quarter (mean) 2.2% 11%
Maximum Share of Flights any Rival had at Either Endpoint in Previous Quarter (mean) 55% 54%
Maximum Number of Destinations Carrier had at Either Endpoint in Previous Quarter (mean) 2 11
Maximum Number of Destinations any Rival had at Either Endpoint in Previous Quarter (mean) 38 43
Maximum # of Domestic Flights Departing from Either Endpoint Airport in a Week (measure of airport size) 222,004 228,933
Minimum # of Domestic Flights Departing from Either Endpoint Airport in a Week (measure of airport size) 93,547 93,710
% having Periphery Airport at Either Endpoint 36% 38%
Average Geometric Mean of Endpoint Populations (in 000,000s) 2.29 3.42
Mean Distance in (000s) 1.16 0.97
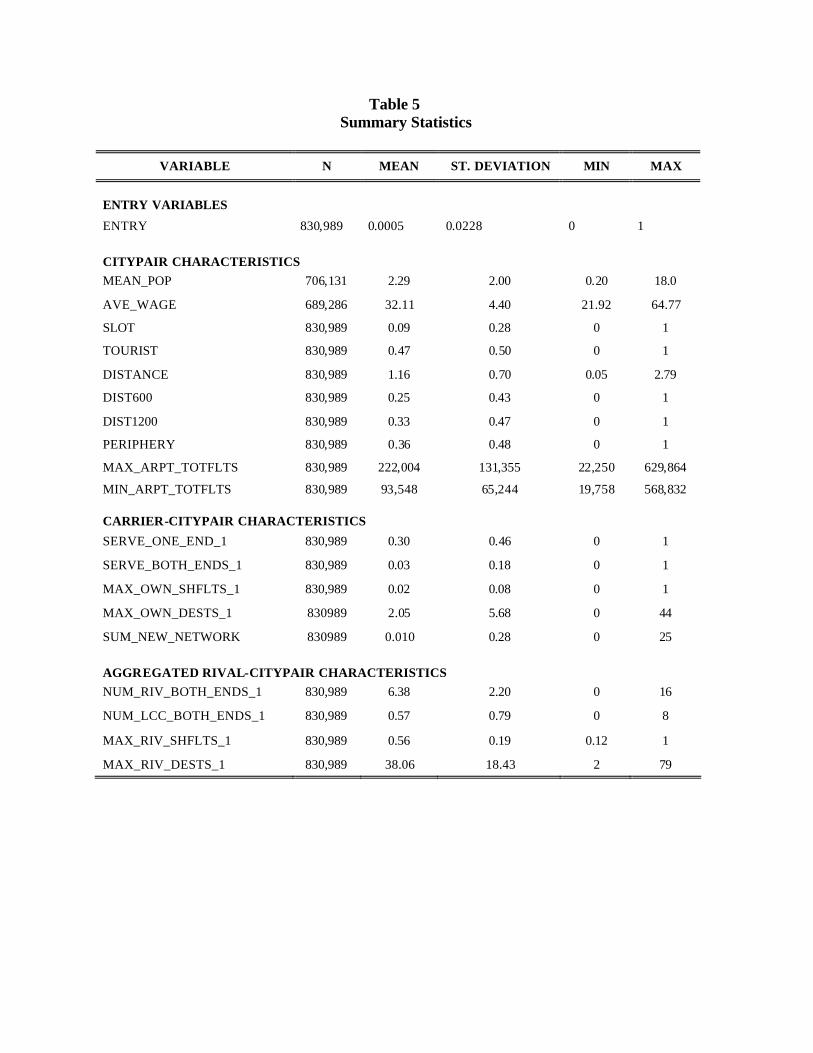
Table 5 Summary Statistics
VARIABLE N MEAN ST. DEVIATION MIN MAX
ENTRY VARIABLES
ENTRY 830,989 0.0005 0.0228 0 1
CITYPAIR CHARACTERISTICS MEAN_POP 706,131 2.29 2.00 0.20 18.0
AVE_WAGE 689,286 32.11 4.40 21.92 64.77
SLOT 830,989 0.09 0.28 0 1
TOURIST 830,989 0.47 0.50 0 1
DISTANCE 830,989 1.16 0.70 0.05 2.79
DIST600 830,989 0.25 0.43 0 1
DIST1200 830,989 0.33 0.47 0 1
PERIPHERY 830,989 0.36 0.48 0 1
MAX_ARPT_TOTFLTS 830,989 222,004 131,355 22,250 629,864
MIN_ARPT_TOTFLTS 830,989 93,548 65,244 19,758 568,832 CARRIER-CITYPAIR CHARACTERISTICS
SERVE_ONE_END_1 830,989 0.30 0.46 0 1
SERVE_BOTH_ENDS_1 830,989 0.03 0.18 0 1
MAX_OWN_SHFLTS_1 830,989 0.02 0.08 0 1
MAX_OWN_DESTS_1 830989 2.05 5.68 0 44
SUM_NEW_NETWORK 830989 0.010 0.28 0 25
AGGREGATED RIVAL-CITYPAIR CHARACTERISTICS NUM_RIV_BOTH_ENDS_1 830,989 6.38 2.20 0 16
NUM_LCC_BOTH_ENDS_1 830,989 0.57 0.79 0 8
MAX_RIV_SHFLTS_1 830,989 0.56 0.19 0.12 1
MAX_RIV_DESTS_1 830,989 38.06 18.43 2 79

Table 6 Service by NCs and LCCs, 1996 Q2
Dependent Variable SERVE
Network carriers
LCCs
LCCs, excluding Southwest
Southwest only
(1) (2) (3) (4)
Dummy for serving both endpoints 0.0284** (0.0018)
0.1210** (0.0192)
0.1098** (0.0257)
0.1251** (0.0173)
Network variable (number of new connections) 0.0023** (0.0003)
1.35E-04* (5.26E-05)
1.26E-04 (8.88E-05)
0.0025* (0.0010)
Carrier's share of flights at the endpoint with the larger share 0.0146** (0.0029)
1.61E-04 (1.38E-04)
3.61E-04 (2.43E-04)
0.0026 (0.0031)
Largest share of flights of any competitor at endpoints -0.0075** (0.0017)
-1.97E-04 (1.39E-04)
-5.79E-05 (5.36E-05)
-0.0068 (0.0046)
Size of larger endpoint airport (all flights, in millions) 0.0067** (0.0020)
5.80E-04 (2.36E-04)
-5.79E-05 (5.35E-05)
-0.0068 (0.0046)
Size of smaller endpoint airport (all flights, in millions) 0.0361** (0.0072)
0.0009* (0.0004)
-2.94E-05 (6.82E-05)
0.0291* (0.0122)
Mean endpoint population (in millions) 9.06E-05 (0.0001)
-1.05E-05 (1.57E-05)
3.18E-05 (0.0001)
0.0798** (0.0300)
Mean wage at endpoints (in thousands) 0.0003** (0.0001)
9.55E-06 (1.03E-05)
4.21E-06 (4.49E-05)
-0.0003 (0.0003)
Dummy for tourist locations 0.0020** (0.0005)
0.0001 (7.44E-05)
0.0000 (1.81E-05)
0.0008 (0.0014)
Dummy for short-haul routes 0.0046** (0.0012)
0.0014** (0.0004)
2.09E-05 (2.16E-05)
0.0515** (0.0156)
Dummy for medium-haul routes 0.0014* (0.0006)
0.0009** (0.0003)
3.57E-06 (1.32E-05)
0.0232** (0.0090)
Dummy for slot-controlled endpoint -0.0008 (0.0006)
-6.01E-05 (4.88E-05)
-2.88E-06 (1.56E-05)
Dummy for periphery airports 0.0011
(0.0006) 0.0002
(0.0001) 2.17E-05
(2.60E-05) 0.0153* (0.0073)
Notes: Robust standard errors, clustered by carrier and route, in parentheses. * significant at 5%; ** significant at 1%.

Table 7 Entry by LCCs
Dependent Variable ENTRY
Base case Without network variable
Number of destinations
Competitors at endpoint, by
type (1) (2) (3) (4)
Dummy for serving at least one endpoint 0.0008** (0.0002)
0.0016** (0.0003)
0.0007** (0.0002)
0.0005** (0.0001)
Dummy for serving both endpoints 0.0004**
(4.56E-05) 0.0005**
(5.58E-05) 0.0002**
(3.26E-05) 0.0002**
(4.33E-05)
Network variable (number of new connections) 4.92E-05
(9.12E-06) 3.37E-05** (6.86E-06)
3.27E-05** (7.98E-06)
Carrier's share of flights at the endpoint with the larger share -0.0003* (0.0001)
0.0002** (5.47E-05)
-0.0001 (7.94E-05)
Carrier's number of destinations at larger endpoint 4.98E-06** (1.06E-06)
Largest share of flights of any competitor at endpoints -2.08E-05 (2.25E-05)
-7.22E-05* (2.97E-05)
-4.98E-06 (1.54E-05)
Largest number of destinations of any competitor 1.97E-07
(2.53E-07)
Number of NC competitors serving both endpoints 1.49E-05** (3.27E-06)
Number of LCC competitors serving both endpoints -2.11E-06 (2.19E-06)
Size of larger endpoint airport (all flights, in millions) -2.27E-05 (3.05E-05)
0.0002** (5.35E-05)
-3.25E-05 (2.94E-05)
-3.17E-05 (2.26E-05)
Size of smaller endpoint airport (all flights, in millions) 0.0003**
(6.86E-05) 0.0006** (0.0001)
0.0002** (5.40E-05)
0.0001* (4.51E-05)
Mean endpoint population (in millions) 2.38E-06
(2.55E-06) 4.03E-07
(4.84E-06) 3.36E-06
(2.21E-05) 2.34E-06
(1.75E-06)
Mean wage at endpoints (in thousands) 6.13E-07
(1.27E-06) -5.51E-08 (2.16E-06)
-5.50E-09 (1.09E-05)
1.49E-07 (8.21E-07)
Dummy for tourist locations 3.43E-05** (1.07E-05)
6.46E-05 (1.60E-05)**
3.79E-05** (1.06E-05)
1.67E-05* (6.57E-06)
Dummy for short-haul routes 7.50E-05** (2.30E-05)
0.0001** (2.87E-05)
6.82E-05** (2.07E-05)
4.96E-05** (1.64E-05)
Dummy for medium-haul routes 5.80E-05** (1.59E-05)
7.36E-05** (1.88E-05)
4.54E-05** (1.35E-05)
3.94E-05** (1.16E-05)
Dummy for slot-controlled endpoint 4.27E-06
(1.10E-05) -8.13E-06 (1.69E-05)
1.49E-05 (1.14E-05)
-1.77E-06 (6.65E-06)
Dummy for periphery airports 1.51E-05
(1.05E-05) 4.06E-05* (1.83E-05)
1.29E-06 (7.97E-06)
1.98E-05* (8.91E-06)
Notes: Robust standard errors, clustered by carrier and route, in parentheses significant at 5%; ** significant at 1%
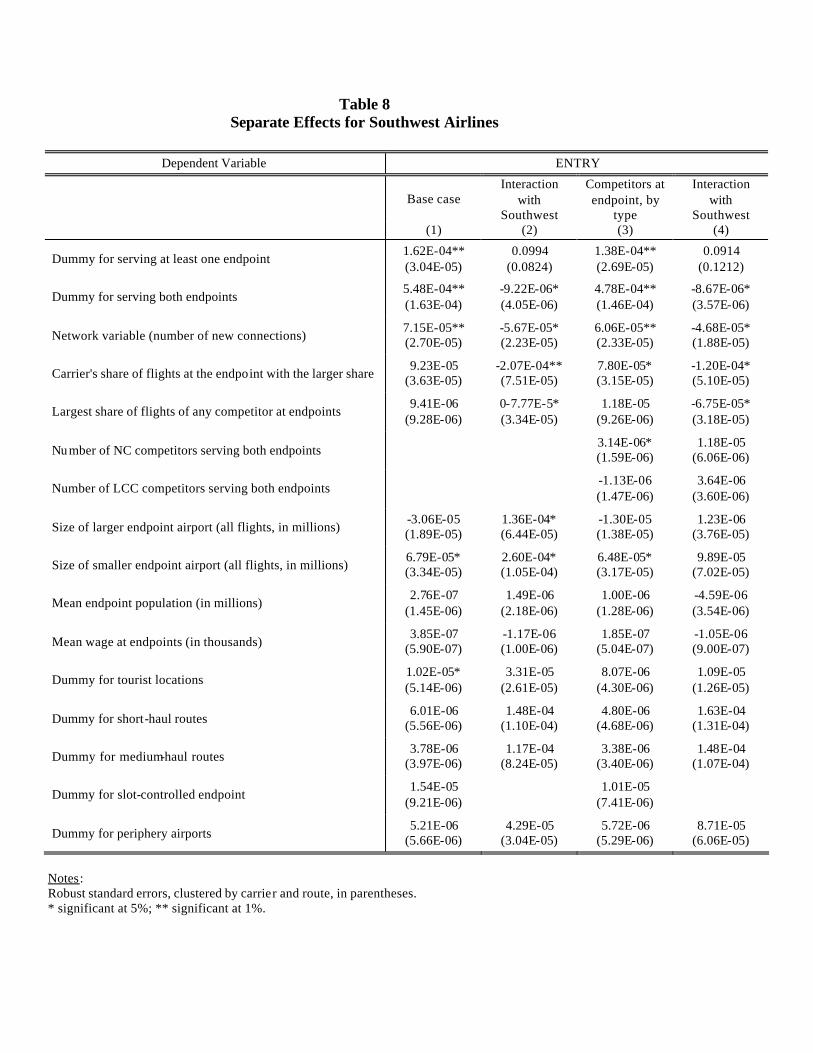
Table 8 Separate Effects for Southwest Airlines
Dependent Variable ENTRY
Base case
Interaction with
Southwest
Competitors at endpoint, by
type
Interaction with
Southwest (1) (2) (3) (4)
Dummy for serving at least one endpoint 1.62E-04** (3.04E-05)
0.0994 (0.0824)
1.38E-04** (2.69E-05)
0.0914 (0.1212)
Dummy for serving both endpoints 5.48E-04** (1.63E-04)
-9.22E-06* (4.05E-06)
4.78E-04** (1.46E-04)
-8.67E-06* (3.57E-06)
Network variable (number of new connections) 7.15E-05** (2.70E-05)
-5.67E-05* (2.23E-05)
6.06E-05** (2.33E-05)
-4.68E-05* (1.88E-05)
Carrier's share of flights at the endpoint with the larger share 9.23E-05
(3.63E-05) -2.07E-04** (7.51E-05)
7.80E-05* (3.15E-05)
-1.20E-04* (5.10E-05)
Largest share of flights of any competitor at endpoints 9.41E-06
(9.28E-06) 0-7.77E-5* (3.34E-05)
1.18E-05 (9.26E-06)
-6.75E-05* (3.18E-05)
Number of NC competitors serving both endpoints 3.14E-06* (1.59E-06)
1.18E-05 (6.06E-06)
Number of LCC competitors serving both endpoints -1.13E-06 (1.47E-06)
3.64E-06 (3.60E-06)
Size of larger endpoint airport (all flights, in millions) -3.06E-05 (1.89E-05)
1.36E-04* (6.44E-05)
-1.30E-05 (1.38E-05)
1.23E-06 (3.76E-05)
Size of smaller endpoint airport (all flights, in millions) 6.79E-05* (3.34E-05)
2.60E-04* (1.05E-04)
6.48E-05* (3.17E-05)
9.89E-05 (7.02E-05)
Mean endpoint population (in millions) 2.76E-07
(1.45E-06) 1.49E-06
(2.18E-06) 1.00E-06
(1.28E-06) -4.59E-06 (3.54E-06)
Mean wage at endpoints (in thousands) 3.85E-07
(5.90E-07) -1.17E-06 (1.00E-06)
1.85E-07 (5.04E-07)
-1.05E-06 (9.00E-07)
Dummy for tourist locations 1.02E-05* (5.14E-06)
3.31E-05 (2.61E-05)
8.07E-06 (4.30E-06)
1.09E-05 (1.26E-05)
Dummy for short-haul routes 6.01E-06
(5.56E-06) 1.48E-04
(1.10E-04) 4.80E-06
(4.68E-06) 1.63E-04
(1.31E-04)
Dummy for medium-haul routes 3.78E-06
(3.97E-06) 1.17E-04
(8.24E-05) 3.38E-06
(3.40E-06) 1.48E-04
(1.07E-04)
Dummy for slot-controlled endpoint 1.54E-05
(9.21E-06)
1.01E-05 (7.41E-06)
Dummy for periphery airports 5.21E-06
(5.66E-06) 4.29E-05
(3.04E-05) 5.72E-06
(5.29E-06) 8.71E-05
(6.06E-05)
Notes: Robust standard errors, clustered by carrier and route, in parentheses. * significant at 5%; ** significant at 1%.

Table 9 Separate Effects for “Young” LCCs
Dependent Variable ENTRY
Base case
Interaction with 'young'
Competitors at endpoint, by
type
Interaction with 'young'
(1) (2) (3) (4)
Dummy for serving at least one endpoint 1.71E-04** (4.54E-05)
1.47E-05 (2.17E-05)
1.10E-04** (3.45E-05)
1.10E-05 (1.51E-05)
Dummy for serving both endpoints 2.46E-04** (7.70E-05)
2.09E-04* (1.05E-04)
1.46E-04** (5.26E-05)
1.69E-04 (8.69E-05)
Network variable (number of new connections) 2.65E-05** (6.69E-06)
1.18E-04** (3.48E-05)
1.82E-05** (5.40E-06)
7.68E-05** (2.53E-05)
Carrier's share of flights at the endpoint with the larger share -1.61E-04* (6.46E-05)
4.64E-04** (1.35E-04)
-6.92E-05 (4.23E-05)
2.76E-04** (9.75E-05)
Largest share of flights of any competitor at endpoints -4.14E-05* (1.96E-05)
7.31E-05* (3.20E-05)
-2.15E-05 (1.33E-05)
4.26E-05 (2.31E-05)
Number of NC competitors serving both endpoints 1.32E-05** (3.70E-06)
-9.93E-06 (3.92E-06)*
Number of LCC competitors serving both endpoints -2.04E-06 (1.68E-06)
2.36E-07 (3.17E-06)
Size of larger endpoint airport (all flights, in millions) -3.18E-05 (2.70E-05)
-1.48E-05 (4.08E-05)
-3.35E-05 (2.10E-05)
1.84E-07 (2.87E-05)
Size of smaller endpoint airport (all flights, in millions) 1.98E-04** (5.87E-05)
-5.90E-05 (6.48E-05)
7.73E-05* (3.62E-05)
4.84E-06 (4.65E-05)
Mean endpoint population (in millions) 1.45E-06
(1.66E-06) 3.28E-06
(2.49E-06) 1.38E-06
(1.18E-06) 2.17E-06
(1.66E-06)
Mean wage at endpoints (in thousands) 1.23E-07
(8.59E-07) 3.98E-07
(1.11E-06) -1.41E-08 (5.71E-07)
1.34E-07 (7.45E-07)
Dummy for tourist locations 2.40E-05** (9.08E-06)
-7.19E-06 (7.38E-06)
1.11E-05* (5.29E-06)
-2.34E-06 (5.37E-06)
Dummy for short-haul routes 3.70E-05* (1.57E-05)
2.90E-06 (1.36E-05)
2.52E-05* (1.12E-05)
1.74E-06 (9.17E-06)
Dummy for medium-haul routes 2.69E-05* (1.10E-05)
3.64E-06 (1.29E-05)
1.84E-05* (7.81E-06)
2.35E-06 (8.75E-06)
Dummy for slot-controlled endpoint 7.70E-06
(9.58E-06) -5.40E-06 (1.10E-05)
3.81E-06 (6.20E-06)
-4.94E-06 (6.84E-06)
Dummy for periphery airports 1.61E-05
(9.53E-06) -1.57E-05* (7.28E-06)
1.62E-05* (7.96E-06)
-1.03E-05* (4.95E-05)
Notes: Robust standard errors, clustered by carrier and route, in parentheses. * significant at 5%; ** significant at 1% . All specifications include carrier and time fixed effects.