entrepreneurship research journal - erasmus … research journal manuscript 1051 are education and...
TRANSCRIPT

Entrepreneurship Research JournalManuscript 1051
Are Education and Entrepreneurial IncomeEndogenous? A Bayesian Analysis
Joern H. Block, Technische Universitat MunchenLennart Hoogerheide, Free University Amsterdam
Roy Thurik, Erasmus University Rotterdam
DOI: 10.1515/2157-5665.1051©2012 De Gruyter. All rights reserved.
Brought to you by | Erasmus University Library (Erasmus University Library)Authenticated | 172.16.1.226
Download Date | 7/16/12 12:21 PM

Are Education and Entrepreneurial IncomeEndogenous? A Bayesian Analysis
Joern H. Block, Lennart Hoogerheide, and Roy Thurik
AbstractEducation is a well-known driver of (entrepreneurial) income. The measurement of its
influence, however, suffers from endogeneity suspicion. For instance, ability and occupationalchoice are mentioned as driving both the level of (entrepreneurial) income and of education.Using instru-mental variables can provide a way out. However, two questions remain: whetherendogeneity is really present and whether it matters for the size of the estimated relationship.Using Bayesian methods, we find that the relationship between education and entrepreneurialincome is indeed en-dogenous and that the impact of endogeneity on the estimated relationshipbetween education and income is sizeable. Implications of our findings for research and practiceare discussed.
KEYWORDS: education, income, entrepreneurship, self-employment, endogeneity, instrumentalvariables, Bayesian analysis
Author Notes: Comments by Herman K. van Dijk and an anonymous reviewer are gratefullyacknowledged. This paper has been written in cooperation with the research program SCALES,carried out by Panteia/EIM and financed by the Dutch Ministry of Economic Affairs. It benefittedfrom a short stay of Roy Thurik at Université de Caen Basse-Normandie.
Brought to you by | Erasmus University Library (Erasmus University Library)Authenticated | 172.16.1.226
Download Date | 7/16/12 12:21 PM
1. Introduction The advent of a knowledge-intensive economy, together with the recognition that such an economy requires a vital entrepreneurial sector (Audretsch and Thurik 2001, Audretsch 2007, Block, Thurik, and Zhou in press), has renewed attention to the effect of education on entrepreneurial choice (Bosma et al. 2004, Block, Hoogerheide, and Thurik in press). Moreover, human capital (including age, ex-perience and formal education) is shown to be a major determinant of entrepre-neurial performance when compared to other explanatory variables (Parker 2009: chapter 13; de Bruin and Ferrante, 2011).1 Finally, of the many factors known to influence entrepreneurial choice and performance (Van der Sluis et al. 2008, Grilo and Thurik 2008, Parker 2009), education is popular among politicians because it can be influenced by education policy (European Commission 2003, OECD, 2009).
The measurement of the influence of education on entrepreneurial choice and income, however, suffers from endogeneity suspicion because there may be a correlation between the education variable and the error term. Neglecting this endogeneity can lead to unreliable estimation results even in large samples be-cause estimators of the model parameters are inconsistent.2 There are several pos-sible causes for this endogeneity. First, omitted factors may exist that impact both education and entrepreneurial performance. For instance, ability and occupational choice are mentioned as phenomena driving both the level of entrepreneurial in-come and education (Griliches and Mason 1972, Blackburn and Neumark 1993).3 Second, measurement errors associated with education can also lead to endogeneity (Griliches 1977, Angrist and Krueger 1991). These measurement er-rors push the estimated return to education toward zero because they lead to varia-tion in the education variable that has no effect on income.4 Other causes include
1 Parker’s overview of the literature on entrepreneurial choice points to age and experience as
playing prominent and positive roles, while education plays a lesser role (Parker 2009: chapter 4).
2 In the linear regression model, neglecting the endogeneity of explanatory variables is a more severe error than ignoring heteroskedasticity (a non-constant variance of the error term) or non-zero correlation between the errors. The latter leads to unreliable standard errors of the parame-ter estimates but leaves the least-squares estimator consistent.
3 If an explanatory variable is positively correlated with an omitted variable that has a positive effect, then its positive effect is overestimated. For instance, individuals with higher ability typi-cally obtain higher education levels but also earn higher income given a certain education level. If this were the only reason for the endogeneity of education, ignoring the issue would lead to an overestimated return to schooling.
4 In analyzing the effect of education on income, the variable for years of education is arguably a poor proxy for education level, even more so for accumulated human capital. Further, on-the-job-training is often ignored, and the length of education is sometimes simply misreported.
1
Block et al.: Are Education and Entrepreneurial Income Endogenous?
Brought to you by | Erasmus University Library (Erasmus University Library)Authenticated | 172.16.1.226
Download Date | 7/16/12 12:21 PM

reverse causality, autoregression with autocorrelated errors and non-random sam-ples (Kennedy 2008).
In the related literature that addresses occupational performance in general (including wage earners), many methods have been proposed to deal with this problem (for summaries, see Ashenfelter et al. 1999, Card 2001, Webbink 2005). Instrumental variables regression (hereafter, IV regression) is considered to be an appropriate estimator in the presence of endogeneity (Card 2001), independent of what its possible cause may be. The idea behind IV regression is to find one vari-able (or more) that is strongly correlated with the endogenous explanatory varia-ble but has no direct effect on the dependent variable beyond its indirect effect via the endogenous regressor, and to use this variable as an instrument to estimate the effect of the endogenous variable. A wide range of variables have been proposed as instruments for education, e.g., differences in schooling laws across regions, regional college proximity, father’s education, or number of siblings (Angrist and Krueger 1991, Card 2001, Webbink 2005, Parker and Van Praag 2006).5 Parker and Van Praag (2006) and Iversen et al. (2011) are two of the few studies that employ IV techniques to estimate the effect of education (formal schooling) on entrepreneurial income. Parker and Van Praag (2006) find that its effect on entre-preneurial income increases from 7.2% in the ordinary least squares (OLS) model to a 13.7% reward of additional income per extra year of education in the IV model (an increase of about 90%).6
Our study contributes to the literature on the effect of education on entre-preneurial income using data on self-employed German individuals. Two im-portant questions are at the heart of our analysis: whether endogeneity of the edu-cation variable is really present and whether it matters for the size of the estimated relationship. The second contribution this paper makes is methodological. We deal with the above questions using Bayesian techniques, which allows us to be very precise about the degree of endogeneity and its effect and to tolerate (small) deviations from the strict validity assumption of the instruments. To achieve the latter, we extend a recent contribution of Conley et al. (2012) to a panel data set-ting. Conley et al. (2012) developed Bayesian methods of performing inference while relaxing the exclusion restriction, thereby providing tools for applied re-searchers who want to proceed with less than perfectly valid instruments. We ap-ply the Gibbs sampling method in the following way. Given the random individu-al effects, we simulate the parameters following Rossi et al. (2005, chapter 7) and Conley et al. (2012). Given the parameters, we simulate the random individual effects following an extension of Koop (2003, section 7.3) of Bayesian individual
5 Webbink (2005) discriminates between instruments based upon ‘controlled experiments,’ ‘natu-
ral experiments,’ ‘institutional rules’ and ‘natural variation.’ 6 The influences of specific entrepreneurship education programs are discussed in Oosterbeek et
al. (2009).
2
Submission to Entrepreneurship Research Journal
Brought to you by | Erasmus University Library (Erasmus University Library)Authenticated | 172.16.1.226
Download Date | 7/16/12 12:21 PM

effects to the bivariate case; that is, we have two equations for income and educa-tion which both contain individual random effects that are allowed to be correlat-ed. The third contribution we make is to show that there is a positive effect of ed-ucation on entrepreneurial income using a longitudinal household survey that was conducted in Germany.
The results obtained using Bayesian techniques are straightforward: the re-lationship between education and entrepreneurial success is indeed endogenous. In addition, the impact of endogeneity on the estimated relationship between edu-cation and income is sizeable. The bias-corrected mean estimate is 75% higher than the uncorrected estimate. We conclude that the endogeneity problem needs to be addressed when analyzing the relationship between education and entrepre-neurial income.
The remainder of the paper is organized as follows. Section 2 summarizes the theoretical arguments for why education and entrepreneurial income are pre-sumed to be endogenous. Section 3 explains our Bayesian analysis of endogeneity. Section 4 describes our data and variables. Section 5 gives the results of our em-pirical analysis, which are then discussed in Section 6. The conclusion is given in Section 7.
2. Theory: Why Might Education and Entrepreneurial Income be Endogenous?
A variable is called endogenous if it appears as a causal variable in an economet-ric equation system while it is correlated with the errors in the model. A possible reason is that there is an omitted variable that has an impact on the causal and the dependent variables at the same time. If the correlation between the omitted vari-able and the causal variable is positive, the effect of the causal variable is overes-timated; if the correlation is negative, the effect is underestimated. Previous stud-ies from the labor economics literature have argued that the relationship between education and labor income is endogenous (Blackburn and Neumark 1993; for a summary, see Ashenfelter et al. 1999). We identified three groups of omitted var-iables that are difficult to capture in an entrepreneurial income equation.
The first group of omitted variables concerns the relationship between ed-ucation and (entrepreneurial) ability. Certain factors, such as intelligence or stam-ina, lead to both higher education levels and higher levels of entrepreneurial in-come. If these ability measures are missing in the income equation, the estimate of education is biased (Griliches and Mason 1972, Blackburn and Neumark 1993). If the omission of ability measures were the only reason for education’s endogeneity, ignoring the issue would lead to an overestimated return to educa-
3
Block et al.: Are Education and Entrepreneurial Income Endogenous?
Brought to you by | Erasmus University Library (Erasmus University Library)Authenticated | 172.16.1.226
Download Date | 7/16/12 12:21 PM

tion in entrepreneurial income regressions. We would observe an upward bias in the estimated effect of education.
The second group of omitted variables concerns unobservable variables re-lated to the decision to become an entrepreneur and the requirements associated with entrepreneurship (Block, Hoogerheide, and Thurik in press; Parker 2009). Riley (1979, 2002) argues that if employers demand a high degree of education from their employees as an otherwise unproductive screening device or if poten-tial employees use a high degree of education to signal their ability to potential employers, then individuals who want to become entrepreneurs and do not face this requirement should have a lower degree of education. If this argument holds true, then education and the willingness to become an entrepreneur are correlated negatively, and the estimate of education’s effect in the entrepreneurial income regression is biased. A related argument can be constructed from the jack-of-all-trades theory (Wagner 2003; Lazear 2004, 2005), according to which entrepre-neurs are generalists who do not excel at a particular skill but are competent at many skills. Accordingly, individuals who want to become entrepreneurs do not engage in a lengthy specialized education but instead choose a rather short gener-alist education. Again, the length of education and willingness to become an en-trepreneur are negatively correlated, and if this is not controlled for, the estimate of education’s effect in the entrepreneurial income regression will be biased.
The third group of omitted variables refers to the types of motivations for becoming an entrepreneur. Since 2001, the Global Entrepreneurship Monitor (GEM) has discussed necessity and opportunity entrepreneurship (Reynolds et al. 2002, Block and Sandner 2008, Block and Koellinger 2009). Opportunity entre-preneurs are those who start their businesses to pursue an entrepreneurial oppor-tunity, whereas necessity entrepreneurs start their businesses due to a lack of al-ternative employment options. For example, they might have experienced a long period of unemployment before starting their business (Meager 1992, Pfeiffer and Reize 2000). Almost by definition, necessity entrepreneurs have few alternatives for earning their living other than through entrepreneurship. The reason for this situation may be related to having a low level of education. In this case, necessity entrepreneurship and the level of education are correlated negatively, which leads to biased estimates of the impact of education on entrepreneurial income.
While the first group of omitted variables (entrepreneurial ability) relate directly to the entrepreneurial income regression, the second (signaling and jack-of-all trades) and third groups (alternatives to entrepreneurship) of omitted varia-bles relate both to the entrepreneurial choice and entrepreneurial income regres-sion. In the latter case, the effect of education on entrepreneurial income would be over- or underestimated as a result of sample selection bias in the entrepreneurial choice regression. The group of entrepreneurs differs in terms of education from the group of salaried employees. Regarding education levels, the group of entre-
4
Submission to Entrepreneurship Research Journal
Brought to you by | Erasmus University Library (Erasmus University Library)Authenticated | 172.16.1.226
Download Date | 7/16/12 12:21 PM

preneurs constitutes a non-random sample of the working population. Any com-parisons between the effects of education on entrepreneurial income versus those on salaried income are likely to suffer from endogeneity.
3. Method
3.1. Instrumental variables regression We want to estimate the effect of education on entrepreneurial income, expressed in the following equation:
n
iii uxeducationincomeurialEntreprene
11 , (1)
where entrepreneurial income is the dependent variable, education is our explana-tory variable of interest, xi are exogenous variables, is a constant, and u1 is an error term with E(u1)=0. For the theoretical reasons discussed above, the variable education, however, is assumed to be endogenous, i.e. the variable is correlated with the error term u1. IV regression is considered to be an appropriate estimation method in the presence of endogeneity (Angrist et al. 1996; Card 2001). The basic idea is to find an instrument that is uncorrelated with the errors u1 in the model but that is correlated with the endogenous variable education. In our case, this leads to the following equation:
2uzeducation , (2)
where education is the endogenous variable, z refers to the instrument used, measures the strength of the relationship between the instrument and the endoge-nous variable, is a constant, and u2 is an error term. The idea of the IV approach is to estimate both equations simultaneously. Yet, for this approach to work and to produce meaningful estimates, two conditions need to be satisfied: (1) Cov (z, u1) = 0 (i.e., the instrument should not be correlated with the error term of the per-formance equation), and (2) 0 (i.e., there should be a non-zero relationship between the instrument and the endogenous variable). The first condition refers to the validity of the instrument; otherwise stated, it means that the exclusion restric-tion holds that the instrument has no direct effect on income, it only has an indi-rect effect via education. The second condition refers to the strength of the in-strument.
Our IV model is actually somewhat more involved than (1)-(2). It involves multiple instruments and describes panel data with (random) individual effects.
5
Block et al.: Are Education and Entrepreneurial Income Endogenous?
Brought to you by | Erasmus University Library (Erasmus University Library)Authenticated | 172.16.1.226
Download Date | 7/16/12 12:21 PM

3.2. The Bayesian approach We use Bayesian methods to estimate the IV regression and a simple linear model used as a benchmark case. Bayesian analysis of IV models has become increas-ingly popular over the last years (for an overview and a comparison to classical IV regression, see Kleibergen and Zivot 2003, Lancaster 2005). Bayesian meth-ods rely on Bayes’ theorem of probability theory (Bayes 1763). This theorem is given by
)(
)()|()|(
yp
pypyp
, (3)
where represents the set of unknown parameters, and y represents the data. )(p is the prior density of the parameter that may be derived from theoretical
or other a priori knowledge. )|( yp is the likelihood function, which is the den-sity (or probability in the case of discrete events) of the data y given the unknown parameter . )(yp is the marginal likelihood, the marginal density of the data y, and finally, )|( yp represents the posterior density which is the density of the parameter given the data y. In Bayesian analysis, inference comes from the posterior distribution which states the likelihood of a particular parameter value. To find out about a relationship between two variables, Bayesian analysis pro-ceeds in the following steps: first, a priori beliefs about the relationship of interest are formulated (the prior density, )(p ). Next, a probability of occurrence of the data given these a priori beliefs is assumed (the likelihood function, )|( yp ). In a second step, data are used to update these beliefs. The result is the posterior density, )|( yp . It allows for statements in terms of likely and unlikely parame-ter values. We report the means, standard deviations and percentiles of the respec-tive parameter distributions. These posterior properties are computed as the sam-ple statistics of a large set of draws from the posterior distribution, which are ob-tained by a Gibbs sampling approach. 3.3. A Bayesian analysis of endogeneity We estimate the IV regression described above with Bayesian methods and use the results to analyze whether endogeneity is present and whether it matters with regard to the size of the estimated relationship between education and entrepre-neurial income. 3.3.1. Question 1: Is endogeneity present? To answer the question of whether endogeneity is present, we calculate the poste-rior distribution of the correlation between education and the error term of the in-
6
Submission to Entrepreneurship Research Journal
Brought to you by | Erasmus University Library (Erasmus University Library)Authenticated | 172.16.1.226
Download Date | 7/16/12 12:21 PM
come equation, that is, u1. A correlation (much) different from zero would indi-cate a (strong) degree of endogeneity. Furthermore, a positive correlation suggests that the endogeneity derives from factors that have similar influences on both in-come and education (e.g., the influence of the omitted variable is positive in both cases); in turn, a negative correlation shows that the sources of endogeneity are factors that have opposite influences on education and income.7
3.3.2. Question 2: Does endogeneity matter? Even if endogeneity is present, it may only have a weak effect on the estimated coefficients. To find out whether this is the case, we estimate the effect of educa-tion on entrepreneurial income in both an IV and a non-IV model and compare the results of these two models. We suggest that endogeneity matters when the results of the IV model deviate strongly from the results of the non-IV model, e.g., when the respective posterior distribution functions have very different properties. Note however that the absence of any difference between the IV and non-IV model does not necessarily mean that no endogeneity exists. It could also very well be the case that the biases resulting from the different sources of endogeneity (e.g., measurement error, omitted variables) balance out each other.
4. Data and Variables
4.1. Data
Our estimations are based on an unbalanced panel data set that is made available by the German Socio-Economic Panel Study (SOEP) at the German Institute for Economic Research (DIW), Berlin.8 The SOEP is a longitudinal household survey conducted annually that provides amongst others detailed information about the participant’s occupational status (e.g., employee or self-employed). To construct our estimation sample, we make use of the years from 1984-2004 and select those persons who are self-employed. After excluding observations with missing values, we obtained a panel data set with 8,288 observations from 2,280 individuals. No age or gender restriction is imposed with regard to the construction of the sample. 4.2. Variables
Entrepreneurial income is measured as the natural logarithm of hourly wage, which is determined by dividing the annual gross income (in €) with the number of annual hours worked. The endogenous explanatory variable education is measured as the number of years of schooling. The two instruments used in the education equation 7 Lancaster (2005, p. 332-335) describes this approach of measuring the level of endogeneity in more detail. 8 For more information about the SOEP, refer to Wagner et al. (1993, 2007).
7
Block et al.: Are Education and Entrepreneurial Income Endogenous?
Brought to you by | Erasmus University Library (Erasmus University Library)Authenticated | 172.16.1.226
Download Date | 7/16/12 12:21 PM

are based on the respondent’s father’s education (measured by his secondary school certificate). The respondent’s father’s education falls in one of three catego-ries: category 1 refers to “Hauptschule” (corresponding to approximately 9 years of primary and secondary education); category 2 refers to either “Realschule” (approx-imately 10 years) or “Fachhochschulreife” (approximately 12 years); category 3 refers to “Abitur” (approximately 13 years).9 The three categories provide two cat-egory indicators (with category 1 as the reference category). The validity of family background variables as instruments for education in income regressions has been criticized in the literature (Trostel et al. 2002, Psacharopoulos and Patrinos 2004). A contribution of Hoogerheide et al. (in press) however shows that the size of the bias from using family background as imperfect instrument is relatively small, in particular when compared against the problems of alternative instrumentation strat-egies (e.g., the weak instruments problems associated with quarter-of-birth dum-mies or changes in compulsory schooling laws). Family background variables have clearly an economically sizeable influence on the respondent’s level of education. Section 5.3.1. in the robustness checks section is devoted to the validity of family background variables as instruments.
As control variables, we included the respondent’s labor market experience (in its linear and squared term), gender, wealth (as proxied by the respondent’s income from assets), status of marriage, nationality, duration of unemployment before self-employment, whether the respondent lives in former West-Germany, time dummies as well as industry dummies. Our model specification resembles a Mincer equation (Mincer 1974). For more details regarding the construction of the variables, see Table A1 in appendix 1. Table A2 provides descriptive statistics.
5. Results Table 1 shows the results of the Bayesian random effects IV regression, while Ta-ble 2 shows the results of a non-IV Bayesian random effects model used as a benchmark case.10 In both models, we used a non-informative prior for β, a nor-mally distributed prior with mean zero and standard deviation of one. The use of alternative priors and their effects on the results is discussed in the robustness sec-tion. For each coefficient, we report the mean and standard deviation of the poste-rior distribution as well as the 50% and 95% posterior density intervals. 9 The three categories have 5,490, 1,245, and 1,553 observations, respectively. Within the second
category, there are only 82 observations with father’s education “Fachhochschulreife”, which is the reason for not including this as a separate category. The effect of “Fachhochschulreife” ap-peared close to “Realschule”, so that these are included in the second category.
10 To perform this analysis, we used the software package MatlabTM. It is also possible to estimate Bayesian models with the software package WinBUGS. The software is freely available online from the Medical Re-search Council at the University of Cambridge website. See http://www.mrc-bsu.cam.ac.uk/bugs (retrieved on February 7, 2009). Code can be found in Lancaster (2005, p. 321).
8
Submission to Entrepreneurship Research Journal
Brought to you by | Erasmus University Library (Erasmus University Library)Authenticated | 172.16.1.226
Download Date | 7/16/12 12:21 PM

Table 1: Posterior results of random effects instrumental variables model Dependent variable: Log (hourly earnings in self-employment)
Mean and standard dev. of posterior dis-tribution Percentiles of posterior distribution
Variables Mean Std. dev 2.5% 97.5% 25% 75%Education 0.105 0.013 0.079 0.130 0.096 0.113Experience 0.023 0.003 0.016 0.029 0.020 0.025Experience²/10 -0.004 0.001 -0.005 -0.002 -0.004 -0.003Unemployment duration -0.034 0.015 -0.064 -0.004 -0.044 -0.023Male 0.304 0.034 0.236 0.371 0.281 0.327Married 0.044 0.027 -0.008 0.096 0.026 0.062Non-German 0.107 0.071 -0.033 0.247 0.059 0.155Wealth 0.037 0.005 0.028 0.046 0.034 0.040West Germany 0.450 0.036 0.379 0.521 0.425 0.474Year 1985 0.097 0.066 -0.031 0.226 0.052 0.141Year 1986 0.127 0.068 -0.005 0.260 0.082 0.173Year 1987 0.133 0.066 0.004 0.263 0.088 0.178Year 1988 0.180 0.068 0.046 0.313 0.134 0.226Year 1989 0.210 0.067 0.079 0.341 0.164 0.255Year 1990 0.244 0.068 0.110 0.379 0.197 0.290Year 1991 0.300 0.067 0.169 0.431 0.255 0.346Year 1992 0.313 0.066 0.184 0.441 0.269 0.358Year 1993 0.410 0.065 0.282 0.538 0.366 0.454Year 1994 0.413 0.065 0.286 0.541 0.369 0.457Year 1995 0.475 0.065 0.349 0.602 0.431 0.519Year 1996 0.490 0.066 0.362 0.619 0.445 0.534Year 1997 0.437 0.065 0.311 0.564 0.393 0.481Year 1998 0.503 0.065 0.376 0.629 0.459 0.546Year 1999 0.568 0.065 0.441 0.694 0.524 0.612Year 2000 0.503 0.063 0.379 0.625 0.460 0.545
Year 2001 0.510 0.063 0.386 0.633 0.468 0.553Year 2002 0.629 0.063 0.505 0.753 0.586 0.672
Year 2003 0.661 0.064 0.536 0.786 0.618 0.704Year 2004 0.663 0.064 0.537 0.788 0.619 0.706Agriculture -0.502 0.065 -0.630 -0.374 -0.546 -0.458Manufacturing -0.031 0.040 -0.110 0.047 -0.058 -0.004Retail -0.104 0.040 -0.184 -0.025 -0.131 -0.076Hotel and Restaurant -0.180 0.067 -0.312 -0.048 -0.225 -0.135Financial Services 0.148 0.053 0.044 0.252 0.112 0.184Firm Services 0.013 0.038 -0.062 0.088 -0.013 0.039Construction -0.034 0.046 -0.124 0.056 -0.065 -0.003Health 0.173 0.051 0.072 0.274 0.139 0.208Transportation 0.014 0.069 -0.121 0.148 -0.032 0.061Culture, Sports, and Leisure 0.013 0.070 -0.124 0.148 -0.034 0.060Ρ -0.122 0.040 -0.199 -0.044 -0.149 -0.095Notes: N = 8,288 observations on 2,280 individuals (period 1984-2004). A non-informative prior was used for all coefficients of the unrestricted reduced form of this random effects panel data IV model;. 110,000 Gibbs draws have been generated (using pseudo random number generators in MatlabTM ); the first 10,000 draws have been discarded as a burn-in. Instruments for education: respondent’s father’s education (category indicators) Reference categories: year 1984 and industry category other. ρ = correlation (education, error term).
9
Block et al.: Are Education and Entrepreneurial Income Endogenous?
Brought to you by | Erasmus University Library (Erasmus University Library)Authenticated | 172.16.1.226
Download Date | 7/16/12 12:21 PM

Table 2: Posterior results of random effects model Dependent variable: Log (hourly earnings in self-employment)
Mean and standard dev. of posterior
distribution Percentiles of posterior distribution
Variables Mean Std. Dev. 2.5% 97.5% 25% 75% Education 0.060 0.003 0.053 0.066 0.057 0.062 Experience 0.021 0.002 0.017 0.026 0.020 0.023 Experience²/10 -0.004 0.000 -0.005 -0.003 -0.004 -0.004 Unemployment duration -0.041 0.010 -0.060 -0.021 -0.047 -0.034 Male 0.325 0.022 0.281 0.368 0.310 0.340 Married 0.042 0.018 0.007 0.079 0.030 0.055 Non-German 0.081 0.047 -0.011 0.174 0.049 0.112 Wealth 0.040 0.003 0.033 0.046 0.037 0.042 West Germany 0.436 0.023 0.390 0.481 0.420 0.452 Year 1985 0.099 0.050 0.000 0.197 0.065 0.133 Year 1986 0.132 0.052 0.029 0.234 0.097 0.167 Year 1987 0.141 0.051 0.040 0.239 0.106 0.175 Year 1988 0.188 0.053 0.084 0.291 0.153 0.224 Year 1989 0.220 0.051 0.120 0.319 0.186 0.255 Year 1990 0.256 0.052 0.152 0.358 0.221 0.291 Year 1991 0.312 0.051 0.212 0.411 0.277 0.346 Year 1992 0.325 0.049 0.228 0.422 0.292 0.358 Year 1993 0.424 0.049 0.328 0.519 0.391 0.457 Year 1994 0.428 0.048 0.333 0.522 0.395 0.461 Year 1995 0.493 0.048 0.399 0.586 0.461 0.526 Year 1996 0.510 0.048 0.415 0.605 0.478 0.543 Year 1997 0.459 0.047 0.366 0.552 0.427 0.491 Year 1998 0.527 0.047 0.435 0.619 0.495 0.559 Year 1999 0.592 0.047 0.500 0.684 0.561 0.624 Year 2000 0.532 0.045 0.443 0.620 0.501 0.562 Year 2001 0.541 0.045 0.453 0.630 0.511 0.572 Year 2002 0.667 0.045 0.578 0.755 0.636 0.697 Year 2003 0.701 0.045 0.612 0.790 0.671 0.732 Year 2004 0.704 0.045 0.615 0.792 0.673 0.734 Agriculture -0.539 0.043 -0.624 -0.454 -0.568 -0.509 Manufacturing -0.034 0.028 -0.090 0.021 -0.053 -0.015 Retail -0.111 0.028 -0.166 -0.057 -0.130 -0.092 Hotel and Restaurant -0.213 0.046 -0.304 -0.123 -0.244 -0.182 Financial Services 0.150 0.036 0.078 0.221 0.126 0.175 Firm Services 0.029 0.027 -0.024 0.082 0.011 0.048 Construction -0.037 0.031 -0.099 0.025 -0.058 -0.016 Health 0.210 0.035 0.142 0.279 0.187 0.234 Transportation -0.006 0.048 -0.101 0.088 -0.039 0.026 Culture, Sports, and Leisure 0.054 0.049 -0.043 0.150 0.021 0.087
Notes: N = 8,288 observations on 2,280 individuals (period 1984-2004). A non-informative prior was used for all coefficients of this random effects panel data model. 110,000 Gibbs draws have been generated (using the pseudo random number generators in MatlabTM ); the first 10,000 draws have been discarded as a burn-in. Reference categories: year 1984 and industry category other.
10
Submission to Entrepreneurship Research Journal
Brought to you by | Erasmus University Library (Erasmus University Library)Authenticated | 172.16.1.226
Download Date | 7/16/12 12:21 PM
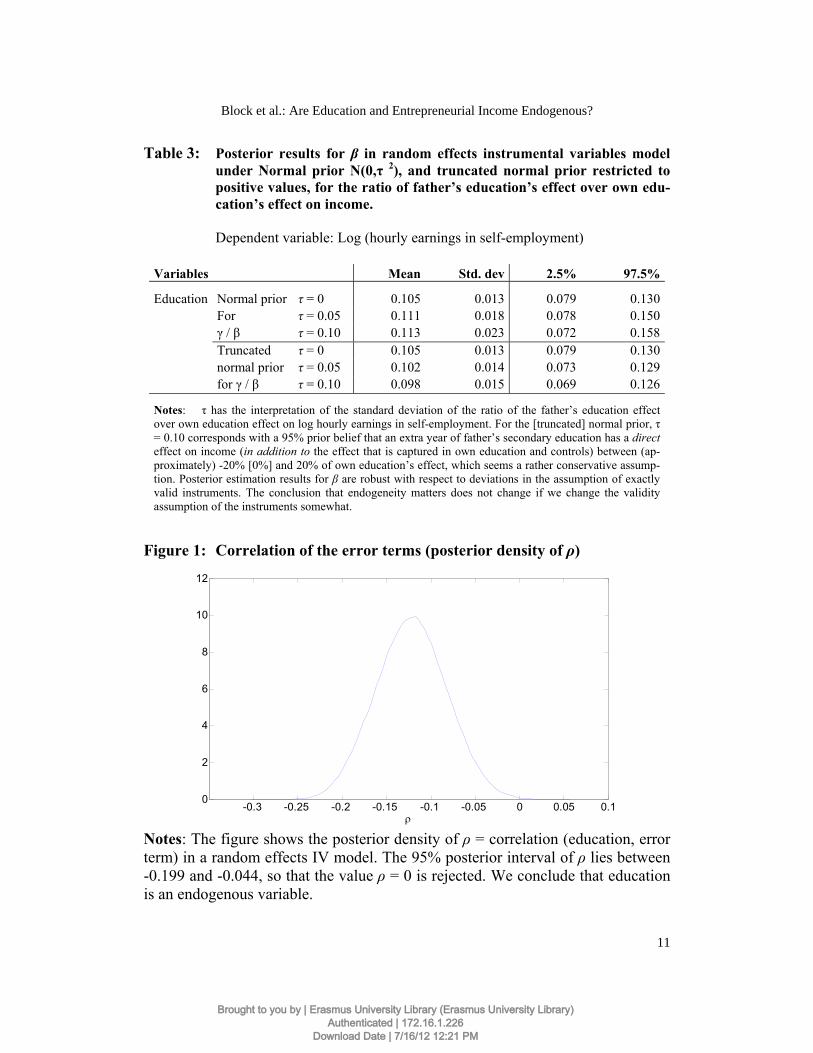
Table 3: Posterior results for β in random effects instrumental variables model under Normal prior N(0,τ 2), and truncated normal prior restricted to positive values, for the ratio of father’s education’s effect over own edu-cation’s effect on income. Dependent variable: Log (hourly earnings in self-employment)
Variables Mean Std. dev 2.5% 97.5%
Education Normal prior τ = 0 0.105 0.013 0.079 0.130 For τ = 0.05 0.111 0.018 0.078 0.150 γ / β τ = 0.10 0.113 0.023 0.072 0.158 Truncated τ = 0 0.105 0.013 0.079 0.130 normal prior τ = 0.05 0.102 0.014 0.073 0.129 for γ / β τ = 0.10 0.098 0.015 0.069 0.126
Notes: τ has the interpretation of the standard deviation of the ratio of the father’s education effect over own education effect on log hourly earnings in self-employment. For the [truncated] normal prior, τ = 0.10 corresponds with a 95% prior belief that an extra year of father’s secondary education has a direct effect on income (in addition to the effect that is captured in own education and controls) between (ap-proximately) -20% [0%] and 20% of own education’s effect, which seems a rather conservative assump-tion. Posterior estimation results for β are robust with respect to deviations in the assumption of exactly valid instruments. The conclusion that endogeneity matters does not change if we change the validity assumption of the instruments somewhat.
Figure 1: Correlation of the error terms (posterior density of ρ)
-0.3 -0.25 -0.2 -0.15 -0.1 -0.05 0 0.05 0.10
2
4
6
8
10
12
Notes: The figure shows the posterior density of ρ = correlation (education, error term) in a random effects IV model. The 95% posterior interval of ρ lies between -0.199 and -0.044, so that the value ρ = 0 is rejected. We conclude that education is an endogenous variable.
11
Block et al.: Are Education and Entrepreneurial Income Endogenous?
Brought to you by | Erasmus University Library (Erasmus University Library)Authenticated | 172.16.1.226
Download Date | 7/16/12 12:21 PM
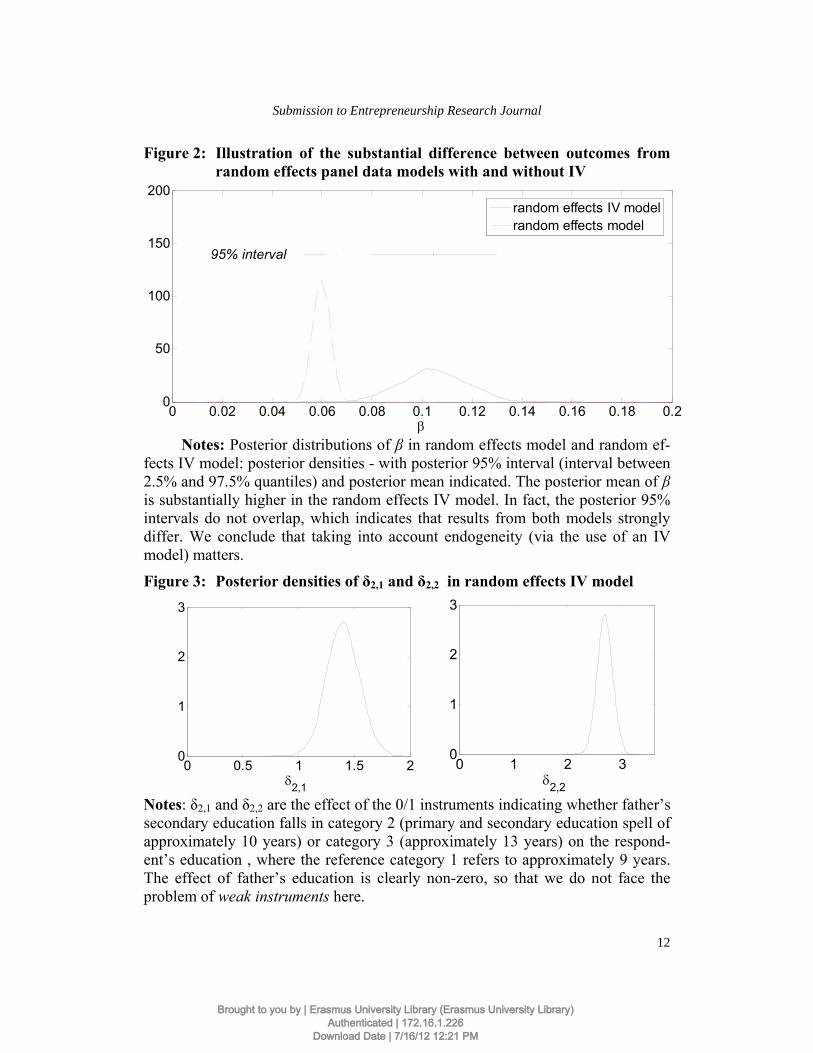
Figure 2: Illustration of the substantial difference between outcomes from random effects panel data models with and without IV
0 0.02 0.04 0.06 0.08 0.1 0.12 0.14 0.16 0.18 0.20
50
100
150
200
random effects IV modelrandom effects model
95% interval
Notes: Posterior distributions of β in random effects model and random ef-
fects IV model: posterior densities - with posterior 95% interval (interval between 2.5% and 97.5% quantiles) and posterior mean indicated. The posterior mean of β is substantially higher in the random effects IV model. In fact, the posterior 95% intervals do not overlap, which indicates that results from both models strongly differ. We conclude that taking into account endogeneity (via the use of an IV model) matters.
Figure 3: Posterior densities of δ2,1 and δ2,2 in random effects IV model
0 0.5 1 1.5 20
1
2
3
2,1
0 1 2 3
0
1
2
3
2,2
Notes: δ2,1 and δ2,2 are the effect of the 0/1 instruments indicating whether father’s secondary education falls in category 2 (primary and secondary education spell of approximately 10 years) or category 3 (approximately 13 years) on the respond-ent’s education , where the reference category 1 refers to approximately 9 years. The effect of father’s education is clearly non-zero, so that we do not face the problem of weak instruments here.
12
Submission to Entrepreneurship Research Journal
Brought to you by | Erasmus University Library (Erasmus University Library)Authenticated | 172.16.1.226
Download Date | 7/16/12 12:21 PM

Figure 4: Posterior density for β in random effects IV model under Normal prior N(0,τ
2) for the ratio of father’s education’s effect over own education’s effect on income, and posterior density for β in ran-dom effects model (without IV)
0 0.02 0.04 0.06 0.08 0.1 0.12 0.14 0.16 0.18 0.20
20
40
60
80
100
120
140
random effects IV ( = 0)random effects IV ( = 0.05)random effects IV ( = 0.10)random effects
Notes: τ has the interpretation of the standard deviation of the ratio of father’s education’s effect over own education’s effect on log hourly earnings in self-employment. τ = 0.10 corresponds with a 95% prior belief that an extra year of father’s secondary education has a direct effect on income (in addition to the ef-fect that is captured in own education and controls) between (approximately) -20% and 20% of own education’s effect, which seems a rather conservative as-sumption. The graphs show that posterior estimation results for β are robust with respect to deviations in the assumption of exactly valid instruments. The conclu-sion that endogeneity matters does not change if we change the validity assump-tion of the instruments.
13
Block et al.: Are Education and Entrepreneurial Income Endogenous?
Brought to you by | Erasmus University Library (Erasmus University Library)Authenticated | 172.16.1.226
Download Date | 7/16/12 12:21 PM
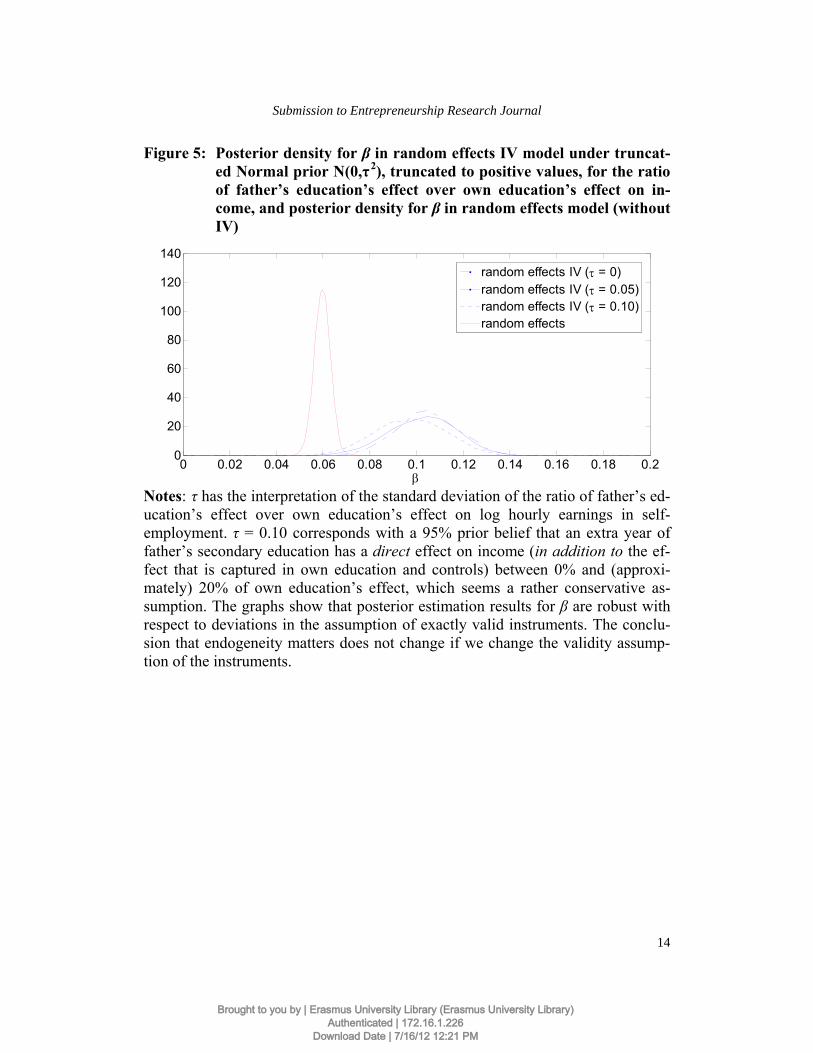
Figure 5: Posterior density for β in random effects IV model under truncat-ed Normal prior N(0,τ
2), truncated to positive values, for the ratio of father’s education’s effect over own education’s effect on in-come, and posterior density for β in random effects model (without IV)
0 0.02 0.04 0.06 0.08 0.1 0.12 0.14 0.16 0.18 0.20
20
40
60
80
100
120
140
random effects IV ( = 0)random effects IV ( = 0.05)random effects IV ( = 0.10)random effects
Notes: τ has the interpretation of the standard deviation of the ratio of father’s ed-ucation’s effect over own education’s effect on log hourly earnings in self-employment. τ = 0.10 corresponds with a 95% prior belief that an extra year of father’s secondary education has a direct effect on income (in addition to the ef-fect that is captured in own education and controls) between 0% and (approxi-mately) 20% of own education’s effect, which seems a rather conservative as-sumption. The graphs show that posterior estimation results for β are robust with respect to deviations in the assumption of exactly valid instruments. The conclu-sion that endogeneity matters does not change if we change the validity assump-tion of the instruments.
14
Submission to Entrepreneurship Research Journal
Brought to you by | Erasmus University Library (Erasmus University Library)Authenticated | 172.16.1.226
Download Date | 7/16/12 12:21 PM

Figure 6: Illustration of the effect of the respondent’s father’s education in-struments on the respondent’s years of education
0%
20%
40%
60%
80%
100%
[7,11) [11,12) [12,13) [13,14) [14,16) [16,18]
education (years)
father's secondary school: category 1 father's secondary school: category 2
father's secondary school: category 3
Note: father’s secondary school instruments have explanatory power for education on different levels. A high father’s education (category 3) implies a higher probability of medium versus low level of education, and a higher proba-bility of high versus medium level of education.
5.1. Question 1: Is endogeneity present in the relationship be-
tween entrepreneurial income and education? As stated above, we measure the level of endogeneity by calculating the correla-tion between education and the error term in the entrepreneurial income equation. The result is clear: the posterior distribution of the correlation has a mean of -0.122 and a 95% posterior density interval that lies between -0.199 and -0.044 (Table 1). Figure 1 shows the marginal posterior density function of this correla-tion graphically. A value of zero for the correlation is clearly rejected. Based on these results, we conclude that education is an endogenous variable in the entre-preneurial income equation.
5.2. Question 2: Does endogeneity matter for the size of the es-
timated education coefficient? In the IV model, the posterior distribution of the variable education has a mean value of 0.105; the 95% posterior interval lies between 0.079 and 0.130 (Table 1). In other words, with a probability of 95%, an additional year of education results
15
Block et al.: Are Education and Entrepreneurial Income Endogenous?
Brought to you by | Erasmus University Library (Erasmus University Library)Authenticated | 172.16.1.226
Download Date | 7/16/12 12:21 PM

in an increase of hourly gross earnings of between 7.9% and 13%. In the non-IV Bayesian random effects model, which we use as a benchmark case, the mean co-efficient of the variable education is only 0.060, and the 95% density interval is between 0.053 and 0.066 (Table 2). Compared to the linear model, the IV model estimate of education is about 4.5 percentage points higher (an increase of about 75%). We conclude that using IV methods makes a great difference in the results.
5.3. Robustness checks
5.3.1. Family background variables as instruments The use of Bayesian methods allows us to discover whether an instrument makes sense. That is, we can comment on its validity and whether it is statistically rele-vant.
Validity: The instruments should not have a direct effect on the dependent variable; their only effect on the dependent variable should be via their effect on the endogenous explanatory variable. However, there is a fundamental uncertainty regarding the validity of this assumption. Fortunately, a Bayesian analysis in which one specifies different prior distributions of the direct effect of the instru-ments on the dependent variable can provide a vital check of the robustness of estimation results.
We investigate the results for several priors in which the direct effect is ap-proximately zero rather than exactly equal to zero. In each case, we specify a prior for the relative size of the direct effect of one extra year of the respondent’s fa-ther’s secondary education compared with one extra year of the respondent’s own education. For this ratio, we consider a normal prior N(0,τ
2) with standard devia-tion τ = 0.05 or τ = 0.10. The latter corresponds to the assumption that one’s fa-ther’s secondary education has a direct effect on one’s income (in addition to the effect that is captured in one’s own education and controls) between approximate-ly -20% and 20% of the effect of one’s own education, which seems to be a rather conservative assumption. Table 3 and Figure 4 show that estimation results change little if we substitute the exact validity assumption for this conservative assumption of approximate validity. There is only a rather small change in the posterior distribution of β. The difference between the posterior distributions in the models with and without IV remains huge; the presence of endogeneity still matters. We also consider truncated normal priors N(0,τ
2), where the effect of fa-ther’s education is restricted to that with the same sign as own education (typical-ly positive). In this case, the specification of τ = 0.10 reflects a 95% prior belief that the ratio of one’s father’s and one’s own education’s effects on income is be-tween 0% and approximately 20%. Again, estimation results change little (see Table 3 and Figure 5). We conclude that estimation results are robust with respect to the assumption of exact validity of the instruments.
16
Submission to Entrepreneurship Research Journal
Brought to you by | Erasmus University Library (Erasmus University Library)Authenticated | 172.16.1.226
Download Date | 7/16/12 12:21 PM

Statistically relevant: Preferably, the instruments have a strong effect on the endogenous explanatory variable. Figure 3 shows that our instruments, the category indicators of father’s secondary education, clearly have this property. The effect of the respondent’s father’s education on the respondent’s education is clearly substantial, so the problem of weak instruments is not present here (Bound et al. 1995). Figure 6 shows that father’s secondary school instruments have ex-planatory power for education on different levels. A high father’s education im-plies a higher probability of medium versus low level of education, and a higher probability of high versus medium level of education.
5.3.2. Non-linearities and gender effects Recent contributions by Iversen et al. (2010, 2011) provide empirical evidence that the relationship between education and entrepreneurial income is convex. To find out whether non-linearities in the relationship between education and entre-preneurial income effect our results regarding endogeneity, we re-estimated the IV and non-IV model allowing for a non-linear, quadratic relationship. We did not find any evidence indicating non-linearities in education’s effect on income. Therefore, it is not surprising that the main results regarding the existence and economic effect of endogeneity in the entrepreneurial income equation still hold true in the more flexible model. As another robustness check, we investigated whether the size of the endogeneity problem is substantially different for male versus female entrepreneurs. We did not find evidence supporting this claim. 5.3.3. Using alternative priors To check whether our results are robust to prior specification, we estimated our Bayesian IV model also with alternative priors. The results did not change. For example, using a normally distributed prior with mean -1 (instead of mean 0) and variance 1 for the variables respondent’s father’s education and education results in a mean coefficient of 0.105 for the variable education and a mean coefficient of -0.122 for the correlation between the error terms (which exactly correspond to the results reported above). Also differences between the graphs of the posterior densities under these two priors are not visible. These results confirm that our standard normal prior on β is truly non-informative. 5.3.4. Comparison with the results of a classical IV model We also compare the results of our Bayesian IV model to the results of a classical IV regression,11 which is shown in Table A3 in Appendix 2. The estimated coeffi-cient of the education variable in the classical IV model is 0.113 (with p<0.001), which is only slightly different from the mean coefficient of 0.105 that results
11 Here we used the method of two-stage least squares, which in this case of exact identification is
equivalent to the method of limited information maximum likelihood (LIML).
17
Block et al.: Are Education and Entrepreneurial Income Endogenous?
Brought to you by | Erasmus University Library (Erasmus University Library)Authenticated | 172.16.1.226
Download Date | 7/16/12 12:21 PM

from the Bayesian model. The effect of education in the IV model was found to be 88% higher than in the OLS model (with the Bayesian approach: 75%). The Durbin-Wu-Hausman test (Hausman 1978) for endogeneity is significant at the 0.1% significance level. 5.4. Results with regard to control variables The results concerning the control variables entered into the income equation are in line with our predictions and do not differ between the linear and the IV models. We report only the results of the IV model. Experience is found to have a positive effect in its linear term and a negative effect in its squared term. On average, male self-employed individuals earn more than female self-employed individuals (mean coefficient: 0.304). The same applies to West German versus East German self-employed individuals (mean coefficient: 0.450). A long period of unemploy-ment before entering self-employment is found to have a negative impact on self-employment earnings (mean coefficient: -0.034). The level of wealth of the self-employed before entering self-employment is found to have a positive effect (mean coefficient: 0.037). The impacts of the variables married and non-German are unclear, which is illustrated by the high standard deviations of the posterior distributions and the change of signs in the 95% density interval. With regard to the industry effects, we find that entrepreneurial income is highest in the health sector and lowest in agriculture. As regards time effects, we can observe a posi-tive linear trend.
6. Discussion
6.1. Are education and entrepreneurial income endogenous? To establish whether education and entrepreneurial income are endogenous, a benchmark is needed. What is the minimum level of correlation between the causal variable and the errors in the model necessary to fulfill the criterion of endogeneity? In a theoretical study using simulated data, Hoogerheide et al. (2007a) introduce strong endogeneity when the correlation is =0.99, medium endogeneity when =0.5, and no endogeneity when =0. Using this classification, the relationship between education and entrepreneurial success should be classi-fied as weak. We estimate the mean correlation of the error terms to be 0.122 (95% density interval is between -0.199 and -0.044, Table 1). The result of the Durbin-Wu-Hausman test for endogeneity, which is estimated for the classical IV
18
Submission to Entrepreneurship Research Journal
Brought to you by | Erasmus University Library (Erasmus University Library)Authenticated | 172.16.1.226
Download Date | 7/16/12 12:21 PM

model, goes in the same direction. The test is highly significant (p<0.001, Table A3).
6.2. Is endogeneity a problem and, if relevant, how can it be
solved? We find that the endogeneity-corrected estimate of education is about 75% higher than the uncorrected estimate, which is similar to the 90% difference found in Parker and Van Praag (2006). Although the degree of endogeneity is rather low, the increase in the effect of the estimated coefficient is sizeable. We conclude that it is essential to address endogeneity and treat it as a problem, in particular when the size–and not only the direction–of the effect is analyzed.
Our findings have an important implication for dealing with the endogeneity of education in the entrepreneurial income equation. First, the results of the Bayesian and the classical IV models are similar: the estimated coefficient for ed-ucation in the classical IV model (β=0.113, Table A1) is close to the posterior mean in the Bayesian IV model (β=0.105, Table 1). Thus, contingent on the low degree of endogeneity and the strength of the instrument, classical IV methods perform considerably well and appear to be well suited to solving the endogeneity problem between education and entrepreneurial performance.
6.3. Bayesian methods in labor market research This paper concerns an application where the use of Bayesian methods provides additional insights for labor market research. We use Bayesian methods to meas-ure the degree of endogeneity between two variables in a very precise way, which would not have been possible with classical methods. The same approach is rele-vant in other areas of labor market research where endogeneity is suspected to be a problem, e.g., the effect of capital constraints on entrepreneurial income or oc-cupational choice (Hurst and Lusardi 2004, Parker and Van Praag 2006). Fur-thermore, as Hoogerheide et al. (2007a, 2007b) show, Bayesian methods may be used to evaluate the strength of instruments in IV regressions. Furthermore, the fact that Bayesian methods do not rely on asymptotic theory and statistical tests to disprove a particular theory provides new perspectives; because it is not necessary to reach a particular significance level, the Bayesian approach is ideally suited to testing competing theories. Bayesian analysis simply makes a statement regarding which theory is more likely. For the same reason, Bayesian methods have an ad-vantage over classical methods in cases where the sample is rather small or multicollinearity is an issue (both of which decrease significance levels). Finally, Bayesian methods may be used as a robustness check for results obtained with traditional methods.
19
Block et al.: Are Education and Entrepreneurial Income Endogenous?
Brought to you by | Erasmus University Library (Erasmus University Library)Authenticated | 172.16.1.226
Download Date | 7/16/12 12:21 PM

6.4. The influence of education on entrepreneurial income The literature on entrepreneurial income and returns to education is less straight-forward than the much older and broader literature regarding employee income and returns to education (Bosma et al. 2004, Van der Sluis et al. 2008, Parker 2009, Iversen et al. 2010, 2011). Parker demonstrates that less clear results may be expected in the entrepreneurial context (Parker 2009: chapter 13). He justifies this argument in a variety of ways, such as measurement issues (tax evasion, in-come under-reporting, high non-response rates, incomparable legal structures, nonpecuniary benefits, heterogeneities in entrepreneurial activities, etc.), the roles of inequality and volatility of entrepreneurial income, observational regularities that demonstrate that formal education is unrelated to higher levels of entrepre-neurial success and conflicting predictions from human capital theory. Basing his analysis largely on Van der Sluis et al.’s (2005, 2008) two meta-analyses of the numerous empirical findings, Parker concludes that the returns to education for entrepreneurs are high, “but much more careful econometric modeling of entre-preneurs’ payoffs is needed to establish the robustness and generality of this find-ing” (Parker 2009: 382). Our paper contributes precisely to this research gap: we find significant and positive payoffs to education through careful use of new econometric techniques.
7. Conclusion Education and human capital in general (including age and experience in addition to type and duration of schooling) are commonly analyzed variables in the entre-preneurship and labor economics literature. We used German data to establish the returns to education for entrepreneurs. We show that they are highly positive and that the standard OLS model produces different estimates than an IV model. The findings that the returns to education are positive for entrepreneurs and that endogeneity is an unresolved issue in the literature on returns to education are not new. Instead, we focused on two questions: whether endogeneity is really present and whether it matters economically. Using Bayesian methods, we find that the relationship between education and entrepreneurial income is indeed endogenous and that the impact of endogeneity on the estimated relationship between educa-tion and income is sizeable. Our approach is relevant beyond the field of the re-turns to education for income. It applies wherever the two questions arise, e.g., in research about entry into entrepreneurship (Bates 1995, Blanchflower 2000, Van der Sluis et al. 2008, Block, Hoogerheide, and Thurik in press), exit from entre-preneurship (Block and Sandner 2008; Stam, Thurik and Van der Zwan 2010) or the roles of education and human capital in government-initiated start-up pro-
20
Submission to Entrepreneurship Research Journal
Brought to you by | Erasmus University Library (Erasmus University Library)Authenticated | 172.16.1.226
Download Date | 7/16/12 12:21 PM

grams (Pfeiffer and Reize 2000) However, careful investigation of the two ques-tions is also essential beyond the world of entrepreneurship research. From a prac-tical perspective, our findings are of particular interest for policy makers and in-stitutions that evaluate the benefits of entrepreneurial education programs (Oosterbeek et al. 2010). Due to the endogeneity problem discussed in this paper, the effect of those programs can be seriously under- or overestimated.
Appendix
Table A1: Description of variables
Variable Description Categorical variables Male Dummy for individual who is male
Non-German Dummy for individual who is Non-German by nationality
Married Dummy for individual who is married
West Germany Dummy for individual who lives in West Germany
Year 1984-2004 Dummies for years 1984-2004
Industry dummies Dummies for the following industries: agriculture (NACE 1,2,5), manufacturing (NACE 15, 16, 17, 18, 19, 20, 21, 22, 23, 24, 26, 27, 28, 29, 30, 31, 32, 33, 34, 35, 36, 37, 40, 41, 96, 97, 100), retail (NACE 51, 52), hotel and restaurant (NACE 55), financial services (NACE 65, 66, 67, 70), firm services (NACE 50, 72, 74), construction (NACE 45), health (NACE 85), trans-portation (NACE 60, 61, 62, 63), culture, sports, and leisure (NACE 92), and other (NACE 10, 11, 12, 13, 14, 64, 71, 73, 75, 80, 90, 91, 93, 95, 98, 99)
Continuous variables and ordinal variable Entrepreneurial income Log (annual gross income [in €] divided by annual hours
worked [in hrs.])
Education Years of schooling (incl. time at university)
Respondent’s father’s edu-cation
Ordinal variable including the following secondary school cer-tificates: “Hauptschule” (approx. 9 yrs.), “Realschule” (approx. 10 yrs.), “Fachhochschulreife” (approx. 12 yrs.), “Abitur” (approx. 13 yrs.)
Experience Current age minus age at first job
Unemployment duration Years that an individual has been unemployed in her entire working life before entering self-employment
Wealth Log (household income from assets)
21
Block et al.: Are Education and Entrepreneurial Income Endogenous?
Brought to you by | Erasmus University Library (Erasmus University Library)Authenticated | 172.16.1.226
Download Date | 7/16/12 12:21 PM

Table A2: Descriptive statistics
Mean Std. Dev.
Entrepreneurial income 1 2.43 0.90 Education 13.12 2.92
Experience 19.51 12.02 Unemployment duration 0.26 0.85
Male 0.70 Married 0.79
Non-German 0.032 Wealth 6.70 2.11
West Germany 0.79
Respondent father’s education “Hauptschule” 0.66
“Realschule” 0.14 “Fachhoschschulreife” 0.01
“Abitur” 0.19
Industry sectors Agriculture 0.063
Manufacturing 0.147 Retail 0.162
Hotel and restaurant 0.037 Financial services 0.066
Firm services 0.164 Construction 0.122
Health 0.092 Transportation 0.027
Culture, sports, and leisure 0.021 Other 0.099
1 Entrepreneurial income is logged N=8.288 obs.
22
Submission to Entrepreneurship Research Journal
Brought to you by | Erasmus University Library (Erasmus University Library)Authenticated | 172.16.1.226
Download Date | 7/16/12 12:21 PM

Table A3: Results of classical regression with dependent variable log (hourly earnings in self-employment)
Variables
OLS Regression Two-stage Least Squares (2SLS)Instrumental Variables
Regression 1
Coefficient (SE) Coefficient (SE)
Education 0.060 (0.005) *** 0.113 (0.016) *** Experience 0.021 (0.004) *** 0.023 (0.004) ***
Experience²/10 -0.004 (0.000) *** -0.004 (0.000) *** Unemployment duration -0.042 (0.016) *** -0.026 (0.015) *
Male 0.327 (0.034) *** 0.293 (0.034) *** Married 0.044 (0.027) 0.038 (0.026)
Non-German 0.077 (0.072) 0.116 (0.070) * Wealth 0.038 (0.005) *** 0.036 (0.005) ***
West Germany 0.434 (0.036) *** 0.466 (0.036) *** Year 1985 0.099 (0.066) 0.101 (0.067) Year 1986 0.131 (0.068) * 0.133 (0.069) * Year 1987 0.139 (0.066) ** 0.138 (0.068) ** Year 1988 0.185 (0.068) *** 0.185 (0.070) *** Year 1989 0.218 (0.067) *** 0.216 (0.069) *** Year 1990 0.253 (0.069) *** 0.248 (0.070) *** Year 1991 0.311 (0.067) *** 0.304 (0.068) *** Year 1992 0.325 (0.066) *** 0.316 (0.067) *** Year 1993 0.423 (0.065) *** 0.415 (0.067) *** Year 1994 0.428 (0.065) *** 0.416 (0.067) *** Year 1995 0.492 (0.065) *** 0.477 (0.066) *** Year 1996 0.509 (0.065) *** 0.492 (0.067) *** Year 1997 0.459 (0.064) *** 0.437 (0.066) *** Year 1998 0.526 (0.064) *** 0.501 (0.066) *** Year 1999 0.593 (0.064) *** 0.566 (0.066) *** Year 2000 0.532 (0.063) *** 0.503 (0.064) *** Year 2001 0.542 (0.063) *** 0.508 (0.065) *** Year 2002 0.664 (0.063) *** 0.625 (0.065) *** Year 2003 0.699 (0.063) *** 0.655 (0.065) *** Year 2004 0.702 (0.063) *** 0.656 (0.065) ***
Agriculture -0.520 (0.065) *** -0.461 (0.068) *** Manufacturing -0.037 (0.040) -0.007 (0.041)
Retail -0.106 (0.040) *** -0.073 (0.042) * Hotel and Restaurant -0.207 (0.068) *** -0.128 (0.071) *
Financial Services 0.142 (0.053) *** 0.177 (0.053) *** Firm Services 0.023 (0.038) 0.006 (0.039) Construction -0.042 (0.046) -0.006 (0.046)
Health 0.199 (0.051) *** 0.135 (0.055) ** Transportation -0.004 (0.069) 0.054 (0.071)
Culture, Sports, and Leisure 0.042 (0.069) 0.016 (0.070) Intercept 0.125 (0.108) -0.593 (0.230) ***
N obs. (individuals) Obs. per group: min.,
avg., max. R2 within, between, overall
Wald Chi²
8,288 (2,280) 1; 3.6; 20
0.053; 0.356; 0.306 1,536.25 ***
8,288 (2,280) 1; 3.6; 20
0.050; 0.330; 0.281 1,576.80 ***
23
Block et al.: Are Education and Entrepreneurial Income Endogenous?
Brought to you by | Erasmus University Library (Erasmus University Library)Authenticated | 172.16.1.226
Download Date | 7/16/12 12:21 PM

References
Angrist, J.D., Krueger, A.B. 1991. Does compulsory school attendance affect schooling and earnings? The Quarterly Journal of Economics 106(4): 979-1014.
Angrist, J.D., Imbens, G.W., Rubin, D.B. 1996. Identification of causal effects using in-strumental variables. Journal of the American Statistical Association 91(434): 444-455.
Ashenfelter, O., Harmon, C., Oosterbeek, H. 1999. A review of estimates of the school-ing/earnings relationship, with tests for publication bias. Labour Economics 6(4): 453-470.
Audretsch, D.B. 2007. Entrepreneurship capital and economic growth, Oxford Review of Economic Policy 23(1): 63-78.
Audretsch, D.B., Thurik, A.R. 2001. What is new about the new economy: sources of growth in the managed and entrepreneurial economies, Industrial and Corporate Change 10(1): 267-315.
Bates, T. 1995. Self-employment entry across industry groups. Journal of Business Ven-turing 10(2): 143-156.
Bayes, T. 1763. An essay towards solving a problem in the doctrine of chances. Philo-sophical Transactions of the Royal Society of London 53: 370-418.
Blackburn, M. , Neumark, D. 1993. Omitted-ability bias and the increase in the return to schooling. Journal of Labor Economics 11(3): 521-544.
Blanchflower, D. 2000. Self-employment in OECD countries. Labour Economics 7(5): 471-505.
Block, J., Köllinger, P. 2009. I can’t get no satisfaction – necessity entrepreneurship and procedural utility. Kyklos 62(1): 191-209.
Block, J., Sandner, P. 2008. Necessity and opportunity entrepreneurs and their duration in self-employment: evidence from German micro data. Journal of Industry, Competition and Trade 9(2): 117-137.
Block, J., Hoogerheide, L., Thurik, R. in press. Education and entrepreneurial choice: an instrumental variables analysis. International Small Business Journal. doi:10.1177/0266242611400470.
Block, J., Thurik, R., Zhou, H. in press. What turns knowledge into innovative products? The role of entrepreneurship and knowledge spillovers. Journal of Evolutionary Econom-ics. doi: 10.1007/s00191-012-0265-5.
Bosma, N., Van Praag, M., Thurik, A.R., De Wit, G. 2004. The value of human and so-cial capital investments for the business performance of startups. Small Business Eco-nomics 23(3): 227-236.
24
Submission to Entrepreneurship Research Journal
Brought to you by | Erasmus University Library (Erasmus University Library)Authenticated | 172.16.1.226
Download Date | 7/16/12 12:21 PM
Bound, J., Jaeger, D.A., Baker, R.M. 1995. Problems with instrumental variables estimation when the correlation between the instruments and the endogenous explanatory variable is weak. Journal of the American Statistical Association 90(430): 443-450.
Card, D. 2001. Estimating the returns to schooling: progress on some persistent econo-metric problems. Econometrica 69(5): 1127-1160.
Conley T.G., Hansen C.B., Rossi P.E. 2012. Plausibly exogenous. The Review of Eco-nomics and Statistics 94(1): 260-272.
de Bruin, A.M., Ferrante, F.M. 2011 Bounded opportunity: a knowledge-based approach to opportunity recognition and development. Entrepreneurship Research Journal: 1(4), Article 2.
European Commission, 2003. Green Paper: Entrepreneurship in Europe. Brussels, Direc-torate General Enterprise and Industry.
Geman, S., Geman, D. 1984. Stochastic relaxation, Gibbs distributions, and the Bayesian restoration of images. IEEE Transactions on Pattern Analysis and Machine Intelligence 6(6): 721-741.
Griliches, Z., Mason, W.M. 1972. Education, income, and ability. Journal of Political Economy 80(3): S74-S103.
Grilo, I., Thurik, A.R. 2008. Determinants of entrepreneurial engagement levels in Eu-rope and the US. Industrial and Corporate Change 17(6): 1113-1145.
Hausman, J.A. 1978. Specification tests in econometrics. Econometrica 46(6): 1251-1271.
Hoogerheide, L.F., Kaashoek, J.F., Van Dijk, H.K. 2007a. On the shape of posterior den-sities and credible sets in instrumental variable regression models with reduced rank: An application of flexible sampling methods using neural networks. Journal of Econometrics 139(1): 154-180.
Hoogerheide, L.F., Kleibergen, F., Van Dijk, H.K. 2007b. Natural conjugate priors for the instrumental variables regression model applied to the Angrist-Krueger data. Journal of Econometrics 138(1): 63-103.
Hoogerheide, L.F., Block, J., Thurik, R. in press. Family background variables as instru-ments for education in income regressions: a Bayesian analysis. Economics of Education Review. doi: 10.1016/j.econedurev.2012.03.001
Hurst, E., Lusardi, A. 2004. Liquidity constraints, household wealth, and entrepreneur-ship. Journal of Political Economy 112(2): 319-347.
Iversen, J., Malchow-Moller, N., Sorensen, A. 2010. Returns to schooling in self-employment. Economics Letters 109(3): 179-182
Iversen, J., Malchow-Moller, N., Sorensen, A. 2011, The returns to educqtion in entre-preneurship: heterogeneity and non-linearities. Entrepreneurship Research Journal 1(3): article 5.
Kennedy, P. 2008. A Guide to Econometrics. 6th edition. Blackwell Publishing: Oxford.
25
Block et al.: Are Education and Entrepreneurial Income Endogenous?
Brought to you by | Erasmus University Library (Erasmus University Library)Authenticated | 172.16.1.226
Download Date | 7/16/12 12:21 PM
Kleibergen, F., Zivot, E. 2003. Bayesian and classical approaches to instrumental varia-ble regression. Journal of Econometrics 114(1): 29-72.
Koop, G. 2003. Bayesian Econometrics, Wiley: Chichester, UK.
Lancaster, T. 2005. An introduction to modern Bayesian econometrics. Blackwell Pub-lishing: Oxford.
Lazear, E.P. 2004. Balanced skills and entrepreneurship. American Economic Review Papers and Proceedings 94(2): 208-211.
Lazear, E.P. 2005. Entrepreneurship. Journal of Labor Economics 23(4): 649-680.
Meager, N. 1992. Does unemployment lead to self-employment Small Business Economics 4(2): 87-103
OECD, 2009. Education at a Glance. Paris.
Oosterbeek, H., Van Praag, M., IJsselstein, A. 2010. The impact of entrepreneurship edu-cation on entrepreneurship skills and motivation. European Economic Review, 54(3): 442-454.
Parker, S.C. 2009. The economics of entrepreneurship, second edition. Cambridge Uni-versity Press: Cambridge, UK..
Parker, S.C., Van Praag, C.M. 2006. Schooling, capital constraints, and entrepreneurial performance: the endogenous triangle. Journal of Business & Economic Statistics 24(4): 416-431.
Pfeiffer, F., Reize, F. 2000. Business start-ups by the unemployed – an econometric analysis based on firm data. Labour Economics 7(5): 629-663.
Psacharopoulos, G., Patrinos, A. 2004. Returns to investment in education: a further up-date. Education Economics 12(2): 111-134.
Reynolds, P.D., Camp, S.M., Bygrave, W.D., Autio, E., Hay, M. 2002. Global Entrepre-neurship Monitor 2001 Executive Report. Babson College, London Business School.
Riley, J.G. 1979. Testing the educational screening hypothesis. Journal of Political Econ-omy 87(5): S227-52.
Riley, J.G. 2002. Weak and strong signals. Scandinavian Journal of Economics 104(2): 213-236.
Rossi, P.E., Allenby, G.M, McCulloch, R. 2005. Bayesian Statistics and Marketing, Wiley: Chichester, UK.
Stam, E., Thurik, A.R., Van der Zwan, P. 2010. Entrepreneurial exit in real and imagined markets. Industrial and Corporate Change 19(4): 1109-1139.
Trostel, P., Walker, I., Wooley, P. 2002. Estimates of the economic return to schooling for 28 countries. Labour Economics 9(1): 1-16.
26
Submission to Entrepreneurship Research Journal
Brought to you by | Erasmus University Library (Erasmus University Library)Authenticated | 172.16.1.226
Download Date | 7/16/12 12:21 PM
Van der Sluis, J., Van Praag, C.M., Vijverberg, W. 2005. Entrepreneurship selection and performance: a meta-analysis of the impact of education in less developed countries. World Bank Economic Review 19(2): 225-261.
Van der Sluis, J., Van Praag, C.M., Vijverberg, W. 2008. Education and entrepreneurship selection and performance: a review of the empirical literature. Journal of Economic Sur-veys 22(5): 795-841.
Wagner, G.G., Burkhauser, R.V., Behringer, F. 1993. The English language public use file of the German Socio-Economic Panel Study. The Journal of Human Resources 28(2): 429-433.
Wagner, G.G., Frick, J.R., Schupp, J. 2007. The German Socio-Economic Panel Study (SOEP) – scope, evolution and enhancements. Schmollers Jahrbuch 127(1): 139-169.
Wagner, J. 2003. Testing Lazear’s jack-of-all-trades view of entrepreneurship with Ger-man micro data. Applied Economics Letters 10(11): 687-689.
Webbink, D. 2005. Causal effects in education. Journal of Economic Surveys, 19(4): 535-560.
27
Block et al.: Are Education and Entrepreneurial Income Endogenous?
Brought to you by | Erasmus University Library (Erasmus University Library)Authenticated | 172.16.1.226
Download Date | 7/16/12 12:21 PM