entrepreneurship in brazil, china, and russia - cefir.org · entrepreneurship in brazil, china, and...
TRANSCRIPT
1
Entrepreneurship in Brazil, China, and Russia
Simeon Djankov,
Yingyi Qian, Gérard Roland, Ekaterina Zhuravskaya*
July 2006
Abstract: We study the determinants of the decision to become an entrepreneur in Russia, China, and Brazil, using unique survey data at the individual level. We find that entrepreneurs have many common characteristics relative to non-entrepreneurs in all three countries. They are more likely to have entrepreneurs among their relatives and friends, place a higher value on work, are happier and perceive themselves as more successful. There are also a few important differences. Russian and Chinese entrepreneurs are more mobile geographically and across jobs. In Brazil, on the contrary, entrepreneurs are less mobile across jobs and industries. Brazil entrepreneurs have higher trust than non-entrepreneurs, while in Russia and China this is not the case. Finally, we confirm that perceptions of institutional environment are an important determinant of individual decisions to expand business.
* The authors are at the World Bank, UC Berkeley and NBER, UC Berkeley, UC Berkeley and CEPR, CEFIR and CEPR, respectively. We thank Irina Levina for excellent research assistance, and the International Finance Corporation for financial support.

2
Introduction
The recent development and transition literatures have emphasized the importance of
a strong small and medium enterprise sector for economic growth and development.
Endogenous growth theory (Aghion and Howitt, 1997) has highlighted the Shumpeterian
approach to growth which advances that entrepreneurial dynamism is fundamental for
innovation and growth. A growing body of research emphasizes the role of entrepreneurs and
the development of a vibrant small and medium enterprise sector in the process of economic
development (e.g., World Bank, 2003, 4004, and 2005). Understanding the factors that
enable and hinder entrepreneurial activities is at the heart of this research agenda.
We have launched a research project trying to understand better the determinants of
entrepreneurship using surveys of individuals that are being conducted in five large
developing and transition countries: Russia, Brazil, China, India, and Nigeria. The samples
include both entrepreneurs and non-entrepreneurs in order to understand how these groups
differ in terms of three broad sets of variables put forward in social sciences as factors that
potentially affect entrepreneurship: 1) individual characteristics such as skills, education,
intellectual and personality traits, 2) sociological variables such as family background, social
origins, social networks, values and beliefs, and 3) perceptions of the institutional, social and
economic environment businesses face. While recent economic research has much
emphasized the role of credit institutions (Banerjee and Newman, 1993) or of institutions
securing property rights (Johnson et al., 2002; Besley, 1995; Che and Qian, 1998; Djankov et
al., 2002, Frye and Zhuravskaya, 2000; Roland and Verdier, 2003), we want to take a more
comprehensive approach and try to disentangle the role all these factors play in promoting
entrepreneurship across a variety of settings.
This paper reports and compares some findings from pilot surveys conducted in
Russia in 2003-2004, in China in 2004-2005, and in Brazil in 2005. The paper complements a
3
series of articles that we wrote about pilot surveys in Russia and China, i.e., Djankov et al.,
2005, 2006a, and 2006b.
The data
In each of the three countries, Russia, China and Brazil, we surveyed individuals in
seven large cities in four different regions. To capture some of the regional heterogeneity in
these countries, the regions were selected to maximize the cross-regions variation in the
business climate. In Russia, the survey was done in Moscow; in Nizhny Novgorod and
Dzerzhinsk in the Nizhegorodskaya Oblast; in Perm and Chaikovsky in the Permskaya
Oblast; and in Rostov on the Don and Taganrog in the Rostovskaya Oblast. In China, the
survey was conducted in Beijing; in Wuhan and Huangshi in the Hubei Province; in
Guangzhou and Zhongshan in the Guangdong Province; and in Xi’An and Baoji in the
Shaanxi Province. In Brazil, the survey took place in the following cities: Sao Paulo; Curitiba
and Londrina in the Sul region; Salvador and Feira de Santana in the Nordeste region; and
Brazilia and Goiania in the Centro Oeste region.
In each country, we first surveyed a random sample of about 400 entrepreneurs – 100
in the metropolitan areas (Moscow, Beijing, and Sao Paulo) and 50 in each of the other cities.
These surveys were conducted in the fall of 2003 in Russia, in the fall of 2004 in China, and
in the fall of 2005 in Brazil. We defined entrepreneur as an owner-manager of a business with
five or more employees because we wanted to make sure that individual whom we call
entrepreneurs in our sample are more than just self-employed. After completion of the
surveys of entrepreneurs in the respective countries, we conducted a survey of about 550 non-
entrepreneurs in the same cities using a similar instrument.1 We defined non-entrepreneurs as
individuals who are not working for their own business. Non-entrepreneurs surveys took
1 400 entrepreneurs and 550 non-entrepreneurs was the target sample size given to the survey firms in each country. In reality, these firms interviewed a slightly larger number of individuals to make sure that in the end we have the targeted number of valid questionnaires. The actual number of observations in the empirical analysis depends on the response rates for each particular question.
4
place in during the spring of 2004 and 2005 in Russia and China respectively, and in the fall
of 2005 in Brazil. In all three countries 80% of respondents in the non-entrepreneur sample
were chosen randomly conditional on matching the age, gender and educational attainment of
entrepreneurs from the respective entrepreneur surveys, and 20% were chosen at random.
Finally, in Russia and China, a short survey was run among a random sample of 1,200
individuals (with the same breakdown across cities) asking nine questions about their
personal characteristics, including a question on whether or not they are entrepreneurs or self-
employed to get data on prevalence of entrepreneurship across cities. In Brazil we took these
data from the national population census. In all the empirical analysis, the observations are
weighted with weights equal to the inverse of the probability for a particular respondent
(entrepreneur or non-entrepreneur) to get into our sample. The weights reflect differences in
entrepreneurship, age, gender, and education across cities in the population, as well as city
size.
Comparing entrepreneurs to non-entrepreneurs in Russia, China, and Brazil
In this section, we summarize differences in individual characteristics, social
environment, values, beliefs, and perceptions of institutional environment for entrepreneurs
and non-entrepreneurs in Russia, China, and Brazil. We report weighted means for
entrepreneurs and non-entrepreneurs in all three countries on various questions from the
survey.2 In order to have comparability between entrepreneurs and non-entrepreneurs, the
means for non-entrepreneurs are conditional on age, gender and years of education (with a
quadratic term) of respondents, and on city dummies within each country.
INSERT TABLE 1
2 It is worth noting that in our previous work (i.e., Djankov et al., 2006a) we used unweighted means in comparisons of means between Russia and China. Therefore, some of the numbers reported here and in Djankov et al., 2006a diverge. Although weighting does change the quantitative results, in most cases it does not change qualitative results.

5
Below we describe some of the important differences between entrepreneurs and non-
entrepreneurs in the three countries. All results that are described in the text below are
statistically significant, unless stated otherwise.
First, we summarize differences in individual characteristics of entrepreneurs and
non-entrepreneurs. In Russia and China, entrepreneurs are more mobile geographically, and
have tried more different professional activities and worked for more industries (particularly,
in China) in the course of their lives than non-entrepreneurs, although these differences are
statistically significant only in China. In Brazil, on the contrary, entrepreneurs have tried less
professional activities and worked for a smaller number of industries than non-entrepreneurs.
Differences between the countries can be related to the Soviet past of Russia and China,
which did not allow entrepreneurial opportunities. Thus, in these two countries, in order to
become entrepreneurs, people often had to change significantly their professions, whereas
starting a business in Brazil did not necessarily require such changes.
In Russia and China, entrepreneurs are more risk-taking than non-entrepreneurs,
although the difference is statistically insignificant in Russia: 74% of Russian and 93% of
Chinese entrepreneurs replied that they would accept a risk-neutral gamble of $10 or $20,
compared to 64% of Russian and 60% of Chinese non-entrepreneurs. In contrast, there is
practically no difference in the attitude towards risk between entrepreneurs and non-
entrepreneurs in Brazil.
In all three countries entrepreneurs report higher levels of happiness and perceive
themselves as more successful in life than non-entrepreneurs (difference in happiness is
statistically insignificant in China). The gap between entrepreneurs and non-entrepreneurs in
self-assessed happiness and success is the largest in Russia. 93% of Russian entrepreneurs
and only 74% of non-entrepreneurs replied “Yes” to the question of whether they are happy;
and 86% of Russian entrepreneurs and 49% of non-entrepreneurs replied “Yes” to the
6
question of whether they are successful in life. For comparison, in Brazil, 95% of
entrepreneurs and 88% of non-entrepreneurs replied that they are happy; and 88% of
entrepreneurs and 70% of non-entrepreneurs think of themselves as being successful in life.
In Russia and China, entrepreneurs report better health than non-entrepreneurs, again with the
gap being larger in Russia. Chinese entrepreneurs indeed get ill less frequently than non-
entrepreneurs; however, in Russia there is no statistically significant difference in the rate of
getting ill between entrepreneurs and non-entrepreneurs. In all three countries entrepreneurs
are taller than non-entrepreneurs; the difference, however, is statistically significant only in
Brazil. Entrepreneurs are more likely than non-entrepreneurs to be married (the difference is
statistically significant for Russia and Brazil). In China, entrepreneurs have significantly
higher number of children than non-entrepreneurs.
According to the results of cognitive ability test, entrepreneurs are smarter than non-
entrepreneurs, although the difference is statistically significant only in Brazil. At the same
time there is no significant difference in self-reported school and college achievement.
Interestingly, entrepreneurs speak foreign languages less often than non-entrepreneurs in
Russia and China, and more often in Brazil.
An important difference between entrepreneurs and non-entrepreneurs is related to
leisure-work choice. In all three countries entrepreneurs are significantly less likely to retire if
won a large amount of money, 100, 500 or 5000 times the annual GDP per capita of the
country, in a lottery. For example, only 24% of Russian, 15% of Chinese, and 17% of Brazil
entrepreneurs would retire if won 500 times GDP per capita of their country, compared to
35% of Russian, 38% of Chinese, and 44% of Brazil non-entrepreneurs.
We asked the respondents about the reasons why they would not want to retire if won
such a large amount of money (the question allowed several answers). In Russia and Brazil,
satisfaction from work is the most important reason not to retire both for entrepreneurs and
7
non-entrepreneurs. In China, the most important reason is the desire to earn more money,
with satisfaction from work being slightly less important. Thus, 91% of entrepreneurs and
77% of non-entrepreneurs in Russia, 74% of entrepreneurs and 72% of non-entrepreneurs in
China, and 85% of entrepreneurs and 81% of non-entrepreneurs in Brazil responded that they
would not retire because they like their job. In Russia, the job-satisfaction reason is
significantly more important for entrepreneurs than for non-entrepreneurs, whereas in the
other countries difference is insignificant. The belief in a social usefulness of their jobs as a
reason not to retire is stronger for entrepreneurs than for non-entrepreneurs in Russia,
whereas the opposite is observed in China. Chinese entrepreneurs seem to be much more
cynical compared to Russian entrepreneurs. Only 9% of Chinese entrepreneurs compared to
67% of non-entrepreneurs said that the reason not to retire is that their job serves a socially-
important mission. Finally, in contrast to Russia and China, Brazilian entrepreneurs are not
greedy: the desire to earn more money is less important reason not to retire for entrepreneurs
than for non-entrepreneurs in Brazil.
Now let us focus on the social environment. Parents of entrepreneurs in Russia are
much better educated (compared to parents of non-entrepreneurs): 90% vs. 65% for fathers
and 88% vs. 62% for mothers achieved higher or special education. There are no significant
differences in parents’ education in China and Brazil. In all the three countries parents of
entrepreneurs are more likely to have been bosses or directors than parents of non-
entrepreneurs: 23% vs. 15% in Russia, 39% vs. 17% in China, and 56% vs. 29% in Brazil for
fathers (the difference for Russia is, however, insignificant). At the same time, in Russia and
China, parents of entrepreneurs are also more likely to have been workers or employees
without special education (44% vs. 3% for fathers in Russia, and 65% vs. 49% for mothers in
China). In other words, in these two countries there is a non-monotone relationship between
education of parents and entrepreneurial activity of children. In Brazil, on the contrary,

8
entrepreneurs’ parents are less likely to have been workers or employees without special
education (23% vs. 34% for fathers).
A very large difference that emerges in all three countries is the likelihood of having
entrepreneurs or former entrepreneurs among relatives and childhood and adolescent friends.
Entrepreneurs are much more likely to have entrepreneurs among their relatives than non-
entrepreneurs (71% vs. 49% in Russia, 48% vs. 20% in China, and 84% vs. 63% in Brazil);
among their childhood friends (58% vs. 36% in Russia, 42% vs. 25% in China, and 74% vs.
55% in Brazil, the difference for China is insignificant); and among their adolescent friends
(62% vs. 42% for Russia, 57% vs. 20% for China, and 77% vs. 40% for Brazil). These
differences suggest that social networks may be important for the decision to become an
entrepreneur in all the three countries.
We also asked questions about values and beliefs. Concerning values, the only pattern
that is similar for all the three countries is the difference in the value attached to work
between entrepreneurs and non-entrepreneurs. In all three countries, entrepreneurs consider
work to be significantly more important for their lives than non-entrepreneurs: 68% of
entrepreneurs vs. 46% of non-entrepreneurs in Russia, 77% of entrepreneurs vs. 60% of non-
entrepreneurs in China, and 81% of entrepreneurs vs. 71% of non-entrepreneurs in Brazil
claim that work is very important for them. In China, entrepreneurs value financial well-
being more than non-entrepreneurs, whereas in Russia and Brazil there is no significant
difference in the importance attached to income and wealth. An interesting difference is in
the attitude towards political freedom. In China and Brazil, entrepreneurs value political
freedom substantially more than non-entrepreneurs: 74% of Chinese and 50% of Brazil
entrepreneurs perceive political freedom to be very important for them, compared to 30% of
Chinese and 50% of Brazilian non-entrepreneurs. In contrast, in Russia the relationship is the
opposite, non-entrepreneurs value political freedom higher: 49% of Russian entrepreneurs

9
and 61% of non-entrepreneurs claim that political freedom is very important for them. In
Russia, entrepreneurs are less religious than non-entrepreneurs; in China and Brazil,
religiosity is higher among entrepreneurs, although religiosity in Russia and China generally
is very low. Finally, in Brazil, entrepreneurs attach more importance to education of their
children than non-entrepreneurs, whereas in China there is no significant difference between
the groups (the question about the importance of children’ education was not asked in
Russia).
When asked about attitudes towards legal social norms, entrepreneurs demonstrated
higher tolerance of corruption. Entrepreneurs in Russia and China more often than non-
entrepreneurs think that accepting a bribe in some circumstances can be justified to some
degree: 36% of entrepreneurs vs. 22% of non-entrepreneurs in Russia, and 21% of
entrepreneurs vs. 8% of non-entrepreneurs in China tolerate having a public official accept a
bribe in some circumstances. In Brazil, there is no significant difference between the groups,
with tolerance towards accepting bribes being very low (only 2% of Brazil entrepreneurs and
5% of non-entrepreneurs consider accepting a bribe justifiable to some degree). In Russia and
China, there is no significant differences between entrepreneurs and non-entrepreneurs in the
attitude towards paying bribes, with the tolerance towards paying bribes being rather high
(56% of Russian and 25% of Chinese entrepreneurs consider paying a bribe to be justifiable
to some degree). In Brazil, entrepreneurs are more tolerant towards paying bribes than non-
entrepreneurs; although for both groups tolerance towards paying bribes is much lower (only
15% of entrepreneurs and 9% of non-entrepreneurs in Brazil consider paying a bribe to be
justifiable to some degree).
We asked a number of questions about trust. We did not observe any common pattern
with regard to trust for the three countries. There are no statistically significant differences in
trust between entrepreneurs and non-entrepreneurs in Russia. In China, entrepreneurs report

10
higher levels of trust than non-entrepreneurs when asked general questions about trust: how
much trust do they have in different groups of people, i.e., businessmen in their town,
subordinated, government officials of various levels of government, etc. When asked more
concrete questions, however, such as whether they would entrust keys from their apartment to
different people, Chinese entrepreneurs report lower levels of trust than non-entrepreneurs.
For example, 67% of entrepreneurs in China compared to 76% of non-entrepreneurs would
give keys from their apartment to a friend. In Brazil, the significance of differences between
entrepreneurs and non-entrepreneurs in questions about trust is lower. But the sign of
differences is consistent among all questions. Brazilian entrepreneurs show higher levels of
trust compared to non-entrepreneurs, disregarding of whether these are general questions
about trust or concrete examples. E.g., 58% of Brazil entrepreneurs compared to 35% of non-
entrepreneurs would trust keys from their apartment to their subordinate.
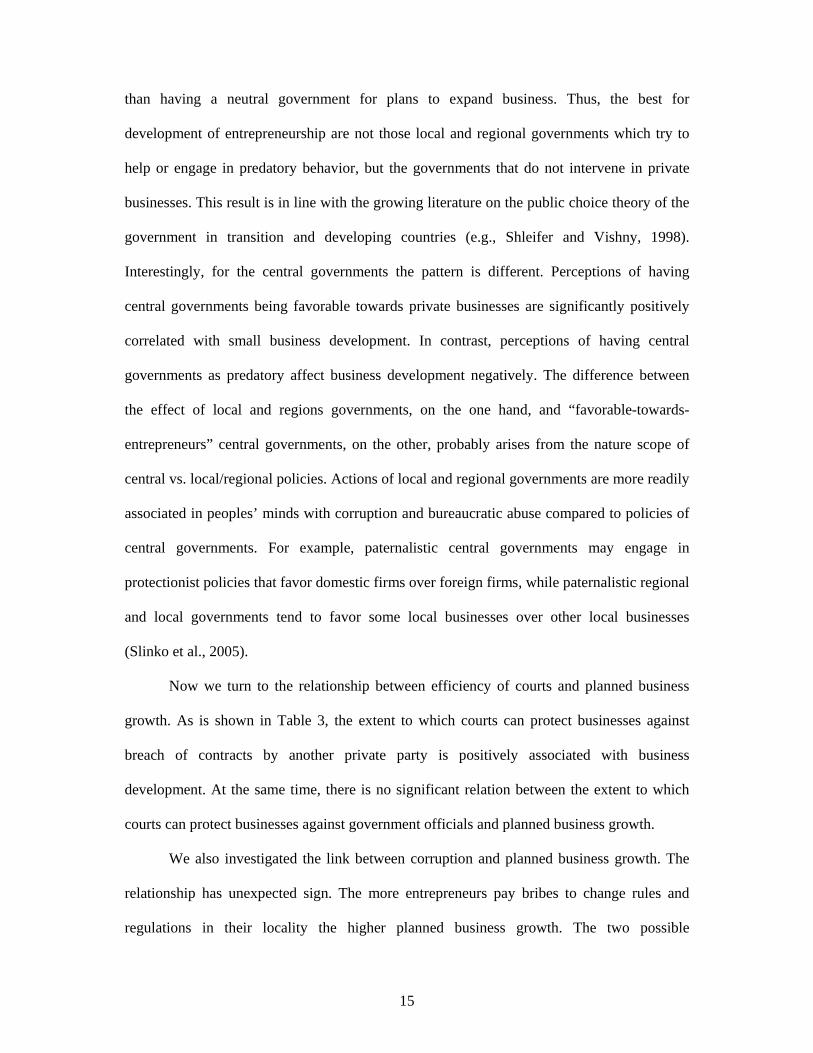
Finally, we compare individual perceptions of entrepreneurs and non-entrepreneurs
about the institutional environment controlling for the average differences across cities. In all
the three countries people perceive business corruption as strong, and non-entrepreneurs
perceive it as even stronger than entrepreneurs do. For example, 71% of entrepreneurs
compared to 83% of non-entrepreneurs in Russia, 56% of entrepreneurs compared to 59% of
non-entrepreneurs in China, and 52% of entrepreneurs compared to 66% of non-
entrepreneurs in Brazil believe that entrepreneurs often pay bribes to avoid regulation (with
the difference for China being statistically insignificant). Brazilian entrepreneurs are much
more pessimistic about the efficiency of courts than non-entrepreneurs. Only 45% of
entrepreneurs in Brazil compared to 73% of non-entrepreneurs think that it makes sense for
entrepreneur in their city to go to court if cheated by a business relation; and 38% of
entrepreneurs compared to 60% of non-entrepreneurs think that it makes sense for
entrepreneur to go to court if abused by a government official. In China, on the contrary,
11
entrepreneurs are more optimistic about the efficiency of courts than non-entrepreneurs (the
difference is insignificant for the cases against business relations, and significant for the cases
against government officials). Chinese entrepreneurs evaluate attitude of local government
towards entrepreneurs better than non-entrepreneurs, and attitude of central government –
worse. In general Chinese people highly evaluate attitude of different branches of
government towards entrepreneurs, whereas, in Brazil, only small share of people thinks that
government is favorable towards entrepreneurs. For example, 64% of entrepreneurs and 69%
of non-entrepreneurs in Russia; 75% of entrepreneurs and 84% of non-entrepreneurs in
China; and only 8% of entrepreneurs and 10% of non-entrepreneurs in Brazil think that
central government in their country is in favor of entrepreneurs.
To summarize the most significant results from this section, entrepreneurs in all three
countries are more likely to have entrepreneurs among their relatives and friends; value work
higher than non-entrepreneurs; are happier and perceive themselves as more successful. In
Russia and China entrepreneurs are more mobile geographically and across jobs; in Brazil, on
the contrary, entrepreneurs are less mobile across jobs and industries. In Russia and China
entrepreneurs are more mobile geographically and across jobs; in Brazil, on the contrary,
entrepreneurs are less mobile across jobs and industries. Finally, in Brazil entrepreneurs have
significantly higher levels of trust than non-entrepreneurs, in Russia there is no significant
difference in trust between entrepreneurs and non-entrepreneurs; in China, evidence is mixed.
Results of multivariate probit regressions
In this section, we report results of multivariate analysis. We explain variation in
individual decisions to become entrepreneur in probit regressions with independent variables
that can plausibly be considered exogenous to this decision. The main objective of these
regressions is to see which variables are robustly associated to entrepreneurship and also to
compare the differences between the countries.
12
INSERT TABLE 2.
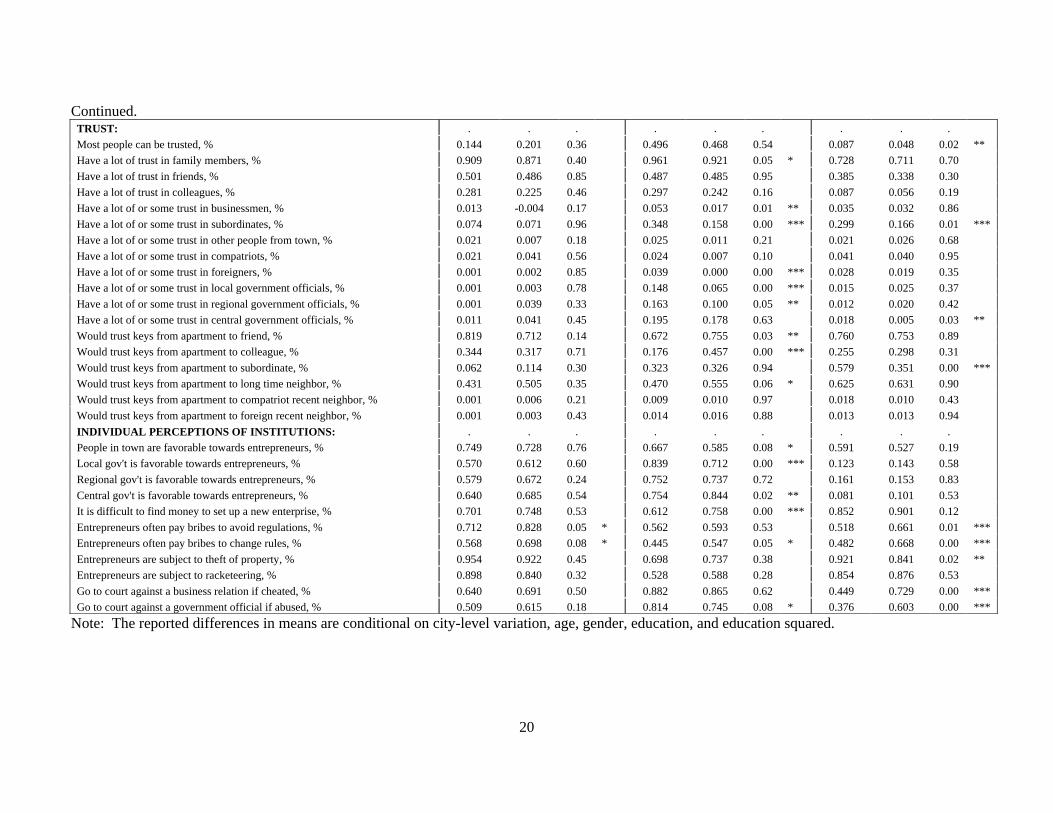
The results are reported in Table 2. We report marginal effects from estimation of the
following probit regressions with probability to become an entrepreneur as the dependent
variable. Column 1 in Table 2 reports results from one pooled regression where we force
coefficients to be the same across countries; columns 2, 3 and 4 report results of three
regressions run separately for Russia, China, and Brazil, respectively; columns 5, 6, and 7
present results of one regression where we allow for different coefficients for each
independent variable in each of the three countries. This is operationalized by including
interaction terms with China dummy and Brazil dummy for all independent variables (so that
Russia becomes the comparison group). In the fifth column we report marginal effects for the
respective independent variables. Thus, the fifth column should be read as the effects of a
marginal change in independent variables on the probability for an individual to become an
entrepreneur in Russia. The sixth column reports marginal effects for the cross-term between
the respective independent variable and dummy for China. Thus, the sixth column should be
read as the difference in the effects in China relative to Russia. In the column seven, we
report the marginal effects of the cross-terms between independent variables and Brazil
dummy. Thus, the results in this column show difference in Brazil effects relative to Russia.
As above, all the regressions include city fixed effects and controls for gender, and a
quadratic function of education.
The pooled results in the Table 2 (column 1) show that entrepreneurship is positively
associated with the respondent’s father having been a boss or a director, with having
entrepreneurs among family and friends, with higher risk-loving, and higher IQ and height.
When looking at the country regressions (columns 2, 3, and 4), however, we see that none of
these variables is robustly significant in all the three countries. We can note that better
father’s education is positively associated with entrepreneurship in Russia, whereas has a
13
negative significant sign in Brazil. Having entrepreneurs or former entrepreneurs among
family and friends is positively significantly associated with entrepreneurship in China and
Brazil, however, is insignificant in Russia, although also positive. Only in China
entrepreneurship is associated with significantly higher risk-loving, while IQ and height
effects are significant only for Brazil. The striking result is that entrepreneurship is associated
with higher greed (not willing to retire in order to earn more money) in Russia and China, is
reversed in Brazil. Finally, in Russia, entrepreneurship is associated with better school and
college achievements.
Columns 6 and 7 of Table 2 display which differences in entrepreneurship patterns
between China and Russia, and Brazil and Russia, respectively, are statistically significant.
We see that in China entrepreneurs are significantly more risk-taking than in Russia, and in
Brazil entrepreneurs are significantly less greedy compared to Russian entrepreneurs. In both,
China and Brazil, good school and college achievement and special or higher education of
fathers are less prevalent among entrepreneurs than in Russia.
In terms of the economic significance of estimated effects, looking at pooled results in
column 1, the most sizable effects are related to the social networks. Having had an
entrepreneur among childhood and adolescent friends increases the probability of being
entrepreneur by 14 percentage points; having had an entrepreneur among relatives increases
the probability of being entrepreneur by 10 percentage points; and having father been a boss
or director – by 9 percentage points. Risk-loving is also very important: the property of
accepting a risk-neutral gamble of $10 or $20 increases the probability of being an
entrepreneur by 6 percentage points. The country regressions in columns 2, 3, and 4,
however, show that the magnitude of these and other effects differs among countries.
As with all cross-section regressions, we cannot rule out the possibility that some
omitted unobserved characteristic simultaneously influences entrepreneurship decisions of

14
the respondents and of their family members and friends. Therefore, these regressions do not
allow us to establish a causal link between social networks and entrepreneurship. Thus, in the
Brazil survey we included a few additional questions which allow us to test for the causal
relation between social networks and entrepreneurship by exploring exogenous variation in
grand-parents families as an instrument for having parents-entrepreneurs. The Brazilian
analysis shows that social networks are indeed important for entrepreneurship (see Djankov
et al., 2006c).
INSERT TABLE 3
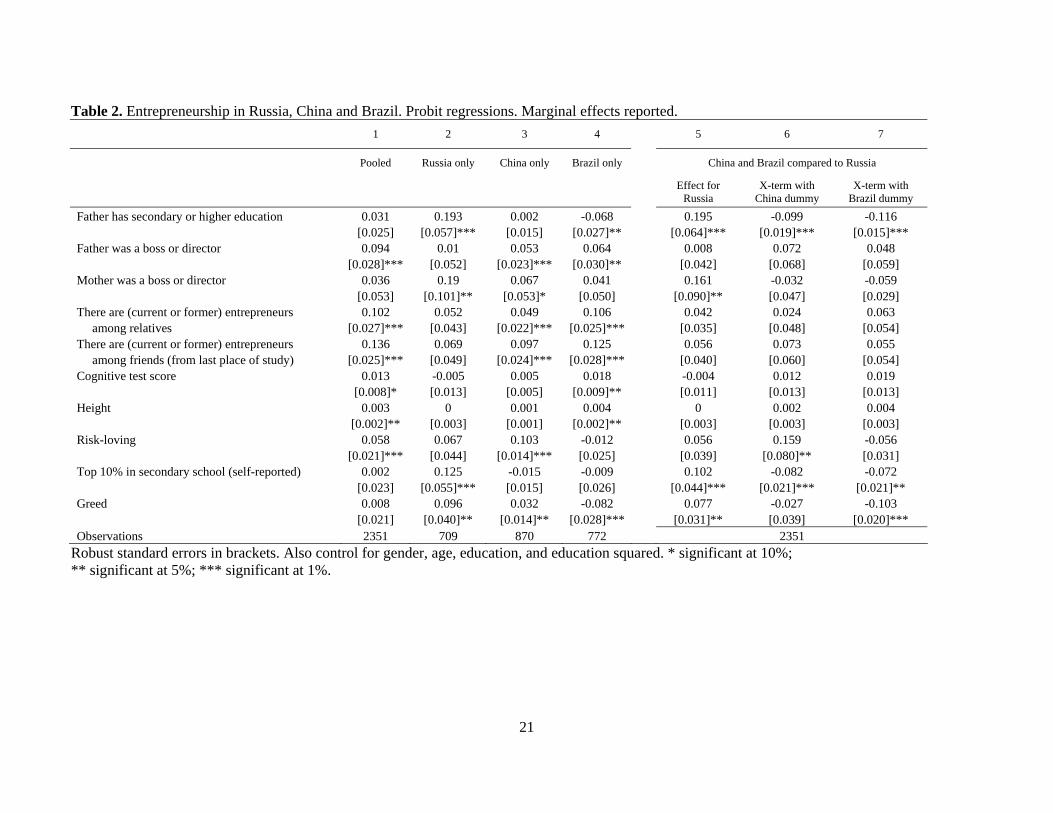
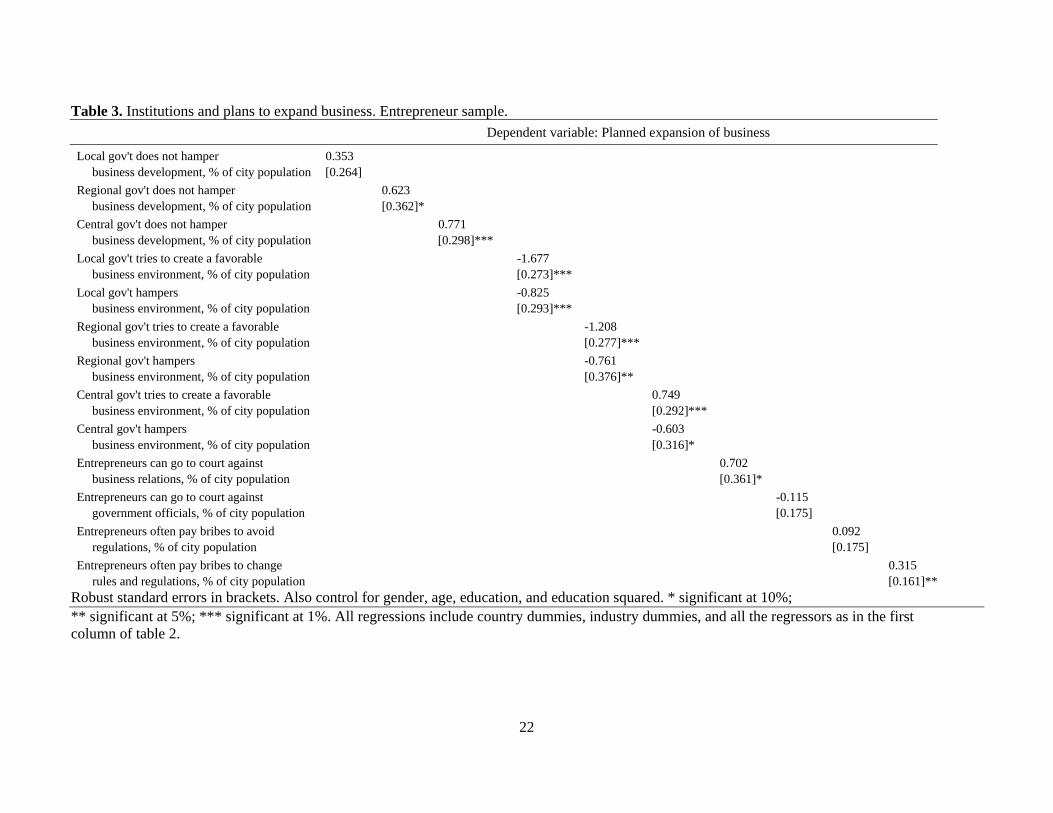
So far we have held the variation in city-level institutional environment constant by
including city dummies. To evaluate the effect of city-level institutional environment, we
regress a dummy that equals one if entrepreneur has concrete plans to expand his business on
various average city-level institutional characteristics (as reported in Table 3). These
regressions include controls (not reported) for country dummies, industry dummies and all
individual characteristics as reported in Table 2.
To estimate the effect of the average city-level perceptions about the attitude of
various branches of government towards entrepreneurs, we, first, look at the coefficients of
the share of city population which believes that the particular branch of government does not
hamper business development. We see that if measured in this way, the good attitude of
central and regional governments towards entrepreneurs is positively related to the
development of small business; the attitude of local government has a positive sign, although
is insignificant. At the next step, we want to distinguish between governments perceived as
trying to paternalistic towards entrepreneurs, governments perceived as not favoring but also
not hampering development of businesses, and those perceived as hampering business
development. Interestingly, both the “good” (i.e., paternalistic) and bad (i.e., grabbing hand)
attitudes of local and regional governments towards entrepreneurs are significantly worse
15
than having a neutral government for plans to expand business. Thus, the best for
development of entrepreneurship are not those local and regional governments which try to
help or engage in predatory behavior, but the governments that do not intervene in private
businesses. This result is in line with the growing literature on the public choice theory of the
government in transition and developing countries (e.g., Shleifer and Vishny, 1998).
Interestingly, for the central governments the pattern is different. Perceptions of having
central governments being favorable towards private businesses are significantly positively
correlated with small business development. In contrast, perceptions of having central
governments as predatory affect business development negatively. The difference between
the effect of local and regions governments, on the one hand, and “favorable-towards-
entrepreneurs” central governments, on the other, probably arises from the nature scope of
central vs. local/regional policies. Actions of local and regional governments are more readily
associated in peoples’ minds with corruption and bureaucratic abuse compared to policies of
central governments. For example, paternalistic central governments may engage in
protectionist policies that favor domestic firms over foreign firms, while paternalistic regional
and local governments tend to favor some local businesses over other local businesses
(Slinko et al., 2005).
Now we turn to the relationship between efficiency of courts and planned business
growth. As is shown in Table 3, the extent to which courts can protect businesses against
breach of contracts by another private party is positively associated with business
development. At the same time, there is no significant relation between the extent to which
courts can protect businesses against government officials and planned business growth.
We also investigated the link between corruption and planned business growth. The
relationship has unexpected sign. The more entrepreneurs pay bribes to change rules and
regulations in their locality the higher planned business growth. The two possible

16
explanations for the positive sign of correlation between corruption and business growth are
omitted variables and reverse causality. For example, growth of businesses may make them
more visible to the corrupt bureaucrats’ radar screens; and we may not properly control for
some characteristics of the cities which drive both corruption and business growth.
Conclusions
In Russia, China, and Brazil, entrepreneurs have many common characteristics
relative to non-entrepreneurs controlling for age, gender and education. They are more likely
to have entrepreneurs (or former entrepreneurs) among their relatives and friends, place a
higher value on work, are happier and perceive themselves as more successful. However,
there are also important differences. Russian and Chinese entrepreneurs are more mobile
geographically and across jobs. In Brazil, on the contrary, entrepreneurs are less mobile
across jobs and industries. Brazil entrepreneurs have higher trust than non-entrepreneurs; we
do not observe such a pattern in Russia and China.
The results of our regression analysis suggest that institutional environment is an
important determinant of business growth. First, the (perceived) attitude of government
towards entrepreneurs matters a great deal. The best for entrepreneurs are those local and
regional governments that do not intervene into the day to day business operations. Those
local and regional governments which are perceived as either trying to help or to hinder
business environment are associated with lower planned business growth. Finally, higher
planned business growth is accompanied with more efficient courts and higher levels of
corruption.

17
References
Aghion, Philippe and Peter Howitt (1997). Endogenous Growth Theory, MIT Press, Cambridge Massachussetts.
Banerjee, Abhijit and Andrew Newman (1993). “Occupational Choice and the Process of Development,” Journal of Political Economy, 101(2).
Besley, Tim (1995). "Property Rights and Investment Incentives: Theory and Evidence from Ghana," Journal of Political Economy, Vol. 103 (5) pp. 903-37
Che, Jiahua and Yingyi Qian (1998). “Insecure Property Rights and Government Ownership of Firms,” Quarterly Journal of Economics, May, 113(2), pp. 467-496.
Djankov, Simeon, Ed Glaeser, Andrei Shleifer (2002). “The Regulation of Entry,” Quarterly Journal of Economics, 1-37.
Djankov, Simeon, Edward Miguel, Yingyi Qian, Gerard Roland, and Ekaterina Zhuravskaya (2005). “Who Are Russia’s Entrepreneurs?” Journal of the European Economic Association, Papers and Proceedings, April-May, 3(2-3), 587-597.
Djankov, Simeon, Yingyi Qian, Gerard Roland, and Ekaterina Zhuravskaya (2006a). “Entrepreneurship in China and Russia Compared.” Journal of the European Economic Association, Papers and Proceedings, April-May, 4(2-3), 352-365.
Djankov, Simeon, Yingyi Qian, Gerard Roland, and Ekaterina Zhuravskaya (2006b). “Who Are China's Entrepreneurs?” American Economic Review, Papers and Proceedings, 96 (2), 348-352.
Djankov, Simeon, Yingyi Qian, Gerard Roland, and Ekaterina Zhuravskaya (2006c). “Who Are Brazil's Entrepreneurs?” mimeo.
Frye, Timothy and Ekaterina Zhuravskaya (2000). "Rackets, Regulation and the Rule of Law," Journal of Law, Economics, and Organization, May, Vol. 16 (2) pp. 478-502.
Johnson, Simon, John McMillan and Chris Woodruff, (2002). "Property Rights and Finance," American Economic Review, 92 (5) pp. 1335-1356.
Roland, Gérard and Thierry Verdier (2003). “Law Enforcement and Transition”, European Economic Review.
Shelifer, Andrei and Robert Vishny (1998). The Grabbing Hand: Government Pathologies and Their Cures, Harvard University Press, Cambridge, MA and London, England.
Slinko, Irina, Evgeny Yakovlev, and Ekaterina Zhuravskaya (2005). “Laws for Sale: Evidence from Russian Regions.” American Law and Economics Review, 7 (1), 284-318.
World Bank, (2003) Doing Business in 2004: Understanding Regulation, Oxford University Press, Oxford, UK.
World Bank, (2004) Doing Business in 2005: Removing Obstacles to growth, Oxford University Press, Oxford, UK.
World Bank, (2005) Doing Business in 2006: Creating Jobs, Oxford University Press, Oxford, UK.

18
Table 1. Entrepreneurship in Russia, China and Brazil (comparison of means). RUSSIA CHINA BRAZIL
Entrepre- neurs
Non- entrepre-
neurs
p-value for test of difference in means
Entrepre- neurs
Non- entrepre-
neurs
p-value for test of difference in means
Entrepre- neurs
Non- entrepre-
neurs
p-value for test of difference in means
INDIVIDUAL CHARACTERISTICS: . . . . . . . . . Number of localities lived 2.253 2.013 0.21 1.738 1.438 0.00 *** 2.501 2.457 0.76 Number of distinct professional activities 2.810 2.412 0.22 2.244 1.975 0.01 ** 2.448 2.843 0.00 *** Number of industries respondent worked in . . . 1.830 1.562 0.00 *** 1.836 2.290 0.00 *** Inherited current industry from parents, % . . . 0.111 0.160 0.11 0.226 0.290 0.15 Have ever inherited industry from parents, % . . . 0.274 0.266 0.83 0.306 0.374 0.15 Accept a risk neutral gamble, % 0.743 0.640 0.20 0.932 0.604 0.00 *** 0.444 0.465 0.66 Very happy or quite happy in life, % 0.927 0.739 0.00 *** 0.915 0.909 0.82 0.952 0.882 0.02 ** Very successful or quite successful in life, % 0.862 0.489 0.00 *** 0.664 0.458 0.00 *** 0.882 0.699 0.00 *** Good health, self described, % 0.852 0.596 0.00 *** 0.891 0.824 0.04 ** 0.868 0.857 0.73 Got ill last week, % 0.205 0.249 0.54 0.035 0.078 0.02 ** 0.070 0.096 0.38 Height, cm 170.926 170.729 0.84 168.986 168.320 0.15 171.575 170.124 0.03 ** Married, % 0.710 0.574 0.07 * 0.822 0.781 0.21 0.738 0.530 0.00 *** Number of children 1.085 1.056 0.80 1.058 0.854 0.00 *** 1.858 1.754 0.38 Religious believer 0.616 0.713 0.16 0.130 0.088 0.10 0.941 0.914 0.22 Cognitive test score 3.581 3.409 0.46 4.128 4.002 0.28 3.154 2.764 0.01 *** Top 10% in secondary school (self-reported), % 0.479 0.373 0.16 0.370 0.383 0.78 0.363 0.380 0.74 Top 10% in high school, college or university (self-reported), % . . . 0.337 0.361 0.64 0.414 0.413 0.98 Speak foreigh language, % 0.503 0.706 0.00 *** 0.350 0.496 0.00 *** 0.339 0.267 0.08 * MOTIVATION, GREED: . . . . . . . . . Retire if won 100 times GDP pc, % 0.100 0.290 0.00 *** 0.043 0.237 0.00 *** 0.099 0.314 0.00 *** Retire if won 500 times GDP pc, % 0.238 0.350 0.11 0.148 0.380 0.00 *** 0.170 0.442 0.00 *** Retire if won 5000 times GDP pc, % . . . 0.363 0.489 0.00 *** 0.370 0.534 0.00 *** Not retire if won a large sum: I like what I do, % 0.912 0.776 0.04 ** 0.740 0.715 0.65 0.854 0.811 0.47 Not retire if won a large sum: I want more money, % 0.676 0.566 0.13 0.788 0.799 0.79 0.580 0.732 0.00 *** Not retire if won a large sum: my work serves useful social purpose, % 0.804 0.472 0.00 *** 0.091 0.665 0.00 *** 0.773 0.700 0.14

19
Continued. SOCIOLOGICAL CHARACTERISTICS: . . . . . . . . . Father has secondary special or higher education, % 0.903 0.652 0.00 *** 0.346 0.321 0.54 0.313 0.366 0.23 Mother has secondary special or higher education, % 0.879 0.623 0.00 *** 0.161 0.207 0.18 0.295 0.269 0.53 Father was a boss or director, % 0.229 0.153 0.19 0.393 0.172 0.00 *** 0.564 0.287 0.00 *** Mother was a boss or director, % 0.123 0.084 0.45 0.084 0.037 0.03 ** 0.153 0.085 0.03 ** Father was a worker or employee without special education, % 0.442 0.026 0.00 *** 0.356 0.384 0.55 0.225 0.340 0.01 *** Mother was a worker or employee without special education, % 0.227 0.121 0.10 0.646 0.485 0.00 *** 0.282 0.399 0.06 * Members of the family were running business, % 0.711 0.486 0.00 *** 0.481 0.202 0.00 *** 0.844 0.632 0.00 *** Had childhood friends, who became entrepreneurs, % 0.580 0.358 0.00 *** 0.418 0.247 0.00 *** 0.736 0.548 0.00 *** Had adolescent friends who became entrepreneurs, % 0.619 0.423 0.02 ** 0.571 0.208 0.00 *** 0.769 0.403 0.00 *** VALUES: . . . . . . . . . Friends are very important, % 0.431 0.537 0.18 0.614 0.670 0.18 0.593 0.591 0.97 Relations with parents are very important, % 0.812 0.893 0.06 * 0.876 0.895 0.53 0.813 0.746 0.09 * Education of children is very important, % . . . 0.915 0.922 0.81 0.973 0.917 0.01 ** Financial well-being is very important, % 0.596 0.644 0.51 0.745 0.630 0.01 *** 0.695 0.716 0.63 Leisure time is very important, % 0.259 0.293 0.63 0.181 0.191 0.79 0.495 0.526 0.53 Health is very important, % 0.778 0.831 0.29 0.936 0.883 0.06 * 0.945 0.915 0.17 Service to others is very important, % 0.120 0.195 0.22 0.202 0.206 0.92 0.411 0.390 0.67 Political freedom is very important, % 0.490 0.614 0.10 * 0.744 0.296 0.00 *** 0.500 0.382 0.02 ** Power is very important, % 0.193 0.022 0.00 *** 0.331 0.264 0.13 0.177 0.148 0.39 Religion is very important, % 0.092 0.186 0.09 * 0.084 0.023 0.00 *** 0.486 0.382 0.03 ** Work is very important, % 0.676 0.462 0.01 *** 0.773 0.598 0.00 *** 0.807 0.707 0.01 ** Intellectual achievement is very important, % 0.531 0.594 0.39 0.276 0.364 0.04 ** 0.531 0.535 0.93 Politics is very important, % 0.099 0.041 0.16 0.131 0.173 0.22 0.171 0.148 0.52 VALUES OF LEGAL SOCIAL NORMS: . . . . . . . . . Avoiding a fare on public transport can be justified to some degree, % 0.854 0.843 0.87 0.087 0.055 0.16 0.328 0.464 0.00 *** Paying a bribe can be justified to some degree, % 0.560 0.593 0.67 0.254 0.215 0.32 0.152 0.087 0.05 * Accepting a bribe can be justified to some degree, % 0.358 0.217 0.02 ** 0.212 0.075 0.00 *** 0.024 0.047 0.24 Buying smth stolen can be justified to some degree, % 0.223 0.356 0.06 * 0.103 0.053 0.05 * 0.017 0.053 0.16
20
Continued. TRUST: . . . . . . . . . Most people can be trusted, % 0.144 0.201 0.36 0.496 0.468 0.54 0.087 0.048 0.02 ** Have a lot of trust in family members, % 0.909 0.871 0.40 0.961 0.921 0.05 * 0.728 0.711 0.70 Have a lot of trust in friends, % 0.501 0.486 0.85 0.487 0.485 0.95 0.385 0.338 0.30 Have a lot of trust in colleagues, % 0.281 0.225 0.46 0.297 0.242 0.16 0.087 0.056 0.19 Have a lot of or some trust in businessmen, % 0.013 -0.004 0.17 0.053 0.017 0.01 ** 0.035 0.032 0.86 Have a lot of or some trust in subordinates, % 0.074 0.071 0.96 0.348 0.158 0.00 *** 0.299 0.166 0.01 *** Have a lot of or some trust in other people from town, % 0.021 0.007 0.18 0.025 0.011 0.21 0.021 0.026 0.68 Have a lot of or some trust in compatriots, % 0.021 0.041 0.56 0.024 0.007 0.10 0.041 0.040 0.95 Have a lot of or some trust in foreigners, % 0.001 0.002 0.85 0.039 0.000 0.00 *** 0.028 0.019 0.35 Have a lot of or some trust in local government officials, % 0.001 0.003 0.78 0.148 0.065 0.00 *** 0.015 0.025 0.37 Have a lot of or some trust in regional government officials, % 0.001 0.039 0.33 0.163 0.100 0.05 ** 0.012 0.020 0.42 Have a lot of or some trust in central government officials, % 0.011 0.041 0.45 0.195 0.178 0.63 0.018 0.005 0.03 ** Would trust keys from apartment to friend, % 0.819 0.712 0.14 0.672 0.755 0.03 ** 0.760 0.753 0.89 Would trust keys from apartment to colleague, % 0.344 0.317 0.71 0.176 0.457 0.00 *** 0.255 0.298 0.31 Would trust keys from apartment to subordinate, % 0.062 0.114 0.30 0.323 0.326 0.94 0.579 0.351 0.00 *** Would trust keys from apartment to long time neighbor, % 0.431 0.505 0.35 0.470 0.555 0.06 * 0.625 0.631 0.90 Would trust keys from apartment to compatriot recent neighbor, % 0.001 0.006 0.21 0.009 0.010 0.97 0.018 0.010 0.43 Would trust keys from apartment to foreign recent neighbor, % 0.001 0.003 0.43 0.014 0.016 0.88 0.013 0.013 0.94 INDIVIDUAL PERCEPTIONS OF INSTITUTIONS: . . . . . . . . . People in town are favorable towards entrepreneurs, % 0.749 0.728 0.76 0.667 0.585 0.08 * 0.591 0.527 0.19 Local gov't is favorable towards entrepreneurs, % 0.570 0.612 0.60 0.839 0.712 0.00 *** 0.123 0.143 0.58 Regional gov't is favorable towards entrepreneurs, % 0.579 0.672 0.24 0.752 0.737 0.72 0.161 0.153 0.83 Central gov't is favorable towards entrepreneurs, % 0.640 0.685 0.54 0.754 0.844 0.02 ** 0.081 0.101 0.53 It is difficult to find money to set up a new enterprise, % 0.701 0.748 0.53 0.612 0.758 0.00 *** 0.852 0.901 0.12 Entrepreneurs often pay bribes to avoid regulations, % 0.712 0.828 0.05 * 0.562 0.593 0.53 0.518 0.661 0.01 *** Entrepreneurs often pay bribes to change rules, % 0.568 0.698 0.08 * 0.445 0.547 0.05 * 0.482 0.668 0.00 *** Entrepreneurs are subject to theft of property, % 0.954 0.922 0.45 0.698 0.737 0.38 0.921 0.841 0.02 ** Entrepreneurs are subject to racketeering, % 0.898 0.840 0.32 0.528 0.588 0.28 0.854 0.876 0.53 Go to court against a business relation if cheated, % 0.640 0.691 0.50 0.882 0.865 0.62 0.449 0.729 0.00 *** Go to court against a government official if abused, % 0.509 0.615 0.18 0.814 0.745 0.08 * 0.376 0.603 0.00 ***
Note: The reported differences in means are conditional on city-level variation, age, gender, education, and education squared.
21
Table 2. Entrepreneurship in Russia, China and Brazil. Probit regressions. Marginal effects reported.
1 2 3 4
5 6 7
Pooled Russia only China only Brazil only
China and Brazil compared to Russia
Effect for
Russia X-term with
China dummy X-term with
Brazil dummy
Father has secondary or higher education 0.031 0.193 0.002 -0.068 0.195 -0.099 -0.116 [0.025] [0.057]*** [0.015] [0.027]** [0.064]*** [0.019]*** [0.015]*** Father was a boss or director 0.094 0.01 0.053 0.064 0.008 0.072 0.048 [0.028]*** [0.052] [0.023]*** [0.030]** [0.042] [0.068] [0.059] Mother was a boss or director 0.036 0.19 0.067 0.041 0.161 -0.032 -0.059 [0.053] [0.101]** [0.053]* [0.050] [0.090]** [0.047] [0.029] There are (current or former) entrepreneurs 0.102 0.052 0.049 0.106 0.042 0.024 0.063 among relatives [0.027]*** [0.043] [0.022]*** [0.025]*** [0.035] [0.048] [0.054] There are (current or former) entrepreneurs 0.136 0.069 0.097 0.125 0.056 0.073 0.055 among friends (from last place of study) [0.025]*** [0.049] [0.024]*** [0.028]*** [0.040] [0.060] [0.054] Cognitive test score 0.013 -0.005 0.005 0.018 -0.004 0.012 0.019 [0.008]* [0.013] [0.005] [0.009]** [0.011] [0.013] [0.013] Height 0.003 0 0.001 0.004 0 0.002 0.004 [0.002]** [0.003] [0.001] [0.002]** [0.003] [0.003] [0.003] Risk-loving 0.058 0.067 0.103 -0.012 0.056 0.159 -0.056 [0.021]*** [0.044] [0.014]*** [0.025] [0.039] [0.080]** [0.031] Top 10% in secondary school (self-reported) 0.002 0.125 -0.015 -0.009 0.102 -0.082 -0.072 [0.023] [0.055]*** [0.015] [0.026] [0.044]*** [0.021]*** [0.021]** Greed 0.008 0.096 0.032 -0.082 0.077 -0.027 -0.103 [0.021] [0.040]** [0.014]** [0.028]*** [0.031]** [0.039] [0.020]*** Observations 2351 709 870 772 2351
Robust standard errors in brackets. Also control for gender, age, education, and education squared. * significant at 10%; ** significant at 5%; *** significant at 1%.
22
Table 3. Institutions and plans to expand business. Entrepreneur sample. Dependent variable: Planned expansion of business
Local gov't does not hamper 0.353 business development, % of city population [0.264] Regional gov't does not hamper 0.623 business development, % of city population [0.362]* Central gov't does not hamper 0.771 business development, % of city population [0.298]*** Local gov't tries to create a favorable -1.677 business environment, % of city population [0.273]*** Local gov't hampers -0.825 business environment, % of city population [0.293]*** Regional gov't tries to create a favorable -1.208 business environment, % of city population [0.277]*** Regional gov't hampers -0.761 business environment, % of city population [0.376]** Central gov't tries to create a favorable 0.749 business environment, % of city population [0.292]*** Central gov't hampers -0.603 business environment, % of city population [0.316]* Entrepreneurs can go to court against 0.702 business relations, % of city population [0.361]* Entrepreneurs can go to court against -0.115 government officials, % of city population [0.175] Entrepreneurs often pay bribes to avoid 0.092 regulations, % of city population [0.175] Entrepreneurs often pay bribes to change 0.315 rules and regulations, % of city population [0.161]**
Robust standard errors in brackets. Also control for gender, age, education, and education squared. * significant at 10%; ** significant at 5%; *** significant at 1%. All regressions include country dummies, industry dummies, and all the regressors as in the first column of table 2.