entrepreneurship and innovation at mit · entrepreneurship and innovation at mit continuing lobal...
TRANSCRIPT

Entrepreneurship and Innovation at MITContinuing Global Growth and Impact
Edward B. Roberts, Fiona Murray, and J. Daniel Kim MIT Sloan School of Management
D E C E M B E R 2 0 1 5

Entrepreneurship and Innovation at MITContinuing Global Growth and Impact
Edward B. Roberts, Fiona Murray and J. Daniel Kim

© Edward B. Roberts and Fiona Murray

iii
Contents
ABOUT THE AUTHORS .............................................................................................................................................. iv
ACKNOWLEDGMENTS .............................................................................................................................................. iv
INTRODUCTION ............................................................................................................................................................5
ECONOMIC IMPACT OF MIT ALUMNI ENTREPRENEURS ............................................................................6
Geographic Impact..............................................................................................................................................6
Survival Statistics .................................................................................................................................................8
Impact on Employment and Revenues ......................................................................................................8
Company Funding and Outcomes ............................................................................................................. 10
Serial Entrepreneurship ................................................................................................................................. 11
TRENDS IN MIT ALUMNI ENTREPRENEURSHIP .......................................................................................... 13
Growth Rate of New Company Formation ............................................................................................. 13
Declining Age of Founders ........................................................................................................................... 15
Industry Shifts in MIT Entrepreneurship ................................................................................................. 15
Gender Differences .......................................................................................................................................... 16
International Students .................................................................................................................................... 22
OTHER CONTRIBUTIONS TO MIT ENTREPRENEURSHIP AND INNOVATION .................................. 22
CONTINUING DEVELOPMENT OF THE MIT ENTREPRENEURSHIP ECOSYSTEM ........................... 23
Entrepreneurship Education at MIT .......................................................................................................... 24
Internal Entrepreneurship Development Programs .......................................................................... 25
MIT’s Global Entrepreneurial Outreach ................................................................................................... 25
Other Key MIT Organizations ...................................................................................................................... 26
ENTREPRENEURSHIP AND INNOVATION AT MIT: CONCLUSIONS AND IMPLICATIONS .......... 28
Implications of our Research ....................................................................................................................... 28
APPENDIX. SURVEY ANALYSIS AND EXTRAPOLATION ........................................................................... 32
Main Approach................................................................................................................................................... 32
Robustness Checks ........................................................................................................................................... 33

ivEntrepreneurship and Innovation at MIT: Continuing Global Growth and Impact |
ABOUT THE AUTHORS
Edward B. Roberts is the David Sarnoff Professor of Management of Technology at the MIT Sloan School of Management, and the Founder and Chair of the Martin Trust Center for MIT Entrepreneurship.
Fiona Murray is Associate Dean for Innovation at the MIT Sloan School of Management; William Porter (1967) Distinguished Professor of Entrepreneurship; Co-Director of the MIT Innovation Initiative; Faculty Director, Trust Center for MIT Entrepreneurship; and Faculty Director, MIT Legatum Center for Development & Entrepreneurship.
J. Daniel Kim is a PhD candidate at the MIT Sloan School of Management.
ACKNOWLEDGMENTS
We thank the MIT Office of Institutional Research and MIT Alumni Association for their cooperation in developing and implementing the underlying MIT alumni survey upon which this work is based. Jon Daries was especially helpful in carrying out the follow-up telephone survey. We also thank the Lord Foundation of Massachusetts and Deans Ian Waitz of the MIT School of Engineering and David Schmittlein of the MIT Sloan School of Management for providing the financial resources to undertake this work. We appreciate the assistance of MIT Sloan PhD student Joshua Krieger. Finally, we deeply appreciate the assistance of the MIT Reference Publications Office for their contributions to the editing and production of the report, in particular Kimberly Mancino, who led that effort.

5
INTRODUCTION
Leading research-based universities play a significant role in stimulating and sustaining U.S. economic growth. These institutions educate not only productive workers who create value as employees of large established firms but also entrepreneurs who commercialize ideas—often research-based—and build innovation-driven enterprises. These company founders (and their early employees) exert a major ripple effect in both local and global economies, as new companies have the potential to scale rapidly and thus create jobs. This is especially true for companies based on emerging science, technology, or other sources of innovative concepts, whether in manufacturing process, distribution approaches, or newly defined markets.1 U.S. economic data demonstrate that start-up businesses are the primary driver of job growth and are responsible for a disproportionately high share of job creation, with new and high-growth young firms accounting for roughly 70% of gross job creation.2
In 2003, in the first study of its kind, Professor Edward Roberts along with then PhD student Charles Eesley developed a survey to explore the entrepreneurial activities of MIT alumni, in particular the rate, location, and success of their new enterprises.3,4 Since then, other universities, including Stanford, Tsinghua (China), the Technion (Israel), and University of Virginia, have conducted similar studies of their own alumni entrepreneurs. Several studies limited to the entrepreneurial alumni of business schools have been carried out as well.
The findings from the initial MIT survey indicated that MIT alumni were significantly engaged in new enterprise formation. Over 20% of respondents had started one or more for-profit ventures that were still in business in 2006, the year of final data collection. More than 26% of those firms were located in Massachusetts, with the next largest concentration (22%) in California. Nearly 40% of those who reported founding a company were “serial” entrepreneurs (i.e., had started more than one company), with an average of 3.25 start-ups per person.
In 2014—a decade later—we updated the survey to explore the continuing contribution of MIT alumni to innovation and entrepreneurship in the United States and worldwide.5 This update is particularly salient given the burgeoning interest in the role of universities in economic growth and the fact that students who graduated between 2004 and 2014 faced a more difficult economic climate. On the one hand, fund raising and capital access became more challenging as the U.S. economy entered a period of deep recession starting at the end of 2007, and venture capital assets and investments declined. On the other hand, entrepreneurship concurrently became a potentially more appealing career choice due both to structural and perceptual changes in traditional employment and occupations, as well as to an apparent groundswell in young people’s interests in entrepreneurial endeavors. For instance, the proportion of MIT undergraduates selecting employment in venture capital–backed start-ups upon graduation increased from less than 2% in 2006 to 15% in 2014.6
1 http://www.oecd.org/sti/young-SME-growth-and-job-creation.pdf2 Ryan Decker, John Haltiwanger, Ron Jarmin, and Javier Miranda, “The Role of Entrepreneurship in U.S. Job Creation and
Economic Dynamism,” Journal of Economic Perspectives 2014 28(3):3–24. doi: 10.1257/jep.28.3.33 Edward Roberts and Charles Eesley, “Entrepreneurial Impact: The Role of MIT.” Kauffman Foundation, Kansas City,
MO; 2009. 4 Edward Roberts and Charles Eesley, “Entrepreneurial Impact: The Role of MIT—An Updated Report,” Foundations and
Trends in Entrepreneurship 2011 7(1–2):1–149. doi: 10.1561/03000000305 The survey was sent to all MIT alumni in February 2014, resulting in 104,169 survey invitations and 19,730 responses (19%
response rate). A follow-up telephone survey of the initial non-respondents was carried out in October–November 2015 to check for response bias in business formation response statistics; 1,650 U.S. alumni were randomly selected and called, and 254 (15.4%) of them responded to the brief telephone questionnaire.
6 J. Daniel Kim. “Early Employees of Venture-Backed Startups: Selection and Wage Differentials,” Working Paper. Cambridge, MA; 2015.

6Entrepreneurship and Innovation at MIT: Continuing Global Growth and Impact |
Overall, our new findings indicate that MIT alumni are engaged in entrepreneurship and innovation (E&I) at ever increasing rates, and at earlier and earlier stages in their lives.
The MIT Admissions Office informs us that this trend continues: the dominant percentage of undergraduate applicants to the Institute want to contribute significantly to important global challenges at all stages of the idea-to-impact process—from invention and patenting to venture-creation projects within large corporations to launching their own start-ups. Our results confirm that many act on these aspirations once they leave MIT. The following findings have particularly important implications for how we educate the coming generation of global innovators:
• Of our alumni survey respondents, 31% have filed patents and 34% consider themselves inventors.7,8
• Twenty-five percent of the online survey respondents have engaged in new company formation. (Thirty-five percent of alumni who responded to a follow-up telephone survey had started one or more businesses.)
• The proportion of respondents who founded a venture within five years of graduation rose from 4% among those who graduated in the 1960s to 8% among those who graduated in the 1990s. The study also revealed another growth trend in MIT entrepreneurship over time: The number of companies founded per 100 active alumni increased from 6 among those who graduated in the 1970s to 12 among those who graduated in the 1990s.
• Twenty-two percent of our alumni respondents have worked as employees of early-stage ventures, indicating their engagement not only in the formation but also in the growth of new firms; 38% of these early employees later went on to start their own company.
• Our alumni have increasingly engaged in funding innovation projects: 16% of respondents have invested in new companies (that they did not found). Seventeen percent have participated in crowdfunding to support the invention of a new product or service, a new phenomenon in which graduates from the 2000s in particular have engaged.
• Of the alumni surveyed, 17% serve as board members of for-profit companies; and 11% serve on a firm’s scientific advisory board.
ECONOMIC IMPACT OF MIT ALUMNI ENTREPRENEURS
Our new study reveals that MIT alumni contribute greatly to the global innovation economy and to particular regional innovation ecosystems. While MIT innovators contribute to companies large and small, as well as to and through governments, universities, and other public sector organizations, we are best able to measure the impact of those alumni who start and build for-profit firms.
Geographic Impact
Extrapolating from our survey results (see Appendix for methods and information about the follow-up survey of non-respondents), we estimate that MIT alumni of both undergraduate and graduate programs have been among the founders of at least 30,000 currently active companies. We estimate
7 This can be compared to a 2012 study by Shu that found that 16% of MIT undergraduate alumni produce at least one patent. Pian Shu, “The Long-Term Impact of Business Cycles on Innovation: Evidence from the Massachusetts Institute of Technology,” July12, 2012. http://economics.mit.edu/files/7363
8 We found a 24% patenting rate among undergraduate alumni during the same time frame as the Shu study [1980–2005] Our finding of a higher patenting rate is most likely attributable to response bias in favor of innovators, as well as the potential of Type I Error in Shu’s approximate name-matching process (i.e., respondents identified as non-inventor if they are ambiguously matched to inventors).

7Entrepreneurship and Innovation at MIT: Continuing Global Growth and Impact |
that these enterprises employ 4.6 million individuals and generate annual global revenues of $1.9 trillion, which is roughly equivalent to the GDP of the world’s 10th largest economy as of 2014. These figures are based upon an extrapolation method that scales according to the entrepreneurship activities by MIT School, gender, and decade of graduation. This is similar to the scaling approach used in the recent Stanford alumni survey,9 but different from our 2009 and 2011 assessments of MIT alumni entrepreneurial impact, which scaled only the totals rather than estimating by specific cohorts.10
Entrepreneurship is a strong marker of MIT’s global impact: 23% of MIT alumni’s new firms are founded outside the United States. This in part reflects the international nature of the alumni themselves (some 30% of our current undergraduate and graduate students were born outside the United States), as well as our students’ global aspirations.
Though many alumni are engaged in international entrepreneurial activity, our survey results echo the global movement toward the agglomeration of innovation-driven economic activity (Figure 1): While only 8% of undergraduates were admitted to MIT from Massachusetts, roughly half of U.S.-based MIT alumni–founded companies represented in our survey have located in the Northeast.
Figure 1. Location of U.S.-based MIT alumni–founded companies.
Massachusetts accounts for the highest portion of MIT alumni companies at 31% (1,691 companies among the survey responses), which translates into an estimate of roughly 7,000 companies using our extrapolation method.11 California comes in second at 21%, in large part reflecting the return of those at MIT who had come originally from the West Coast (17% of undergraduates surveyed were admitted from California). At the city level, although San Francisco typically attracts the highest number of
9 Charles Eesley and William Miller, “Impact: Stanford University’s Economic Impact via Innovation and Entrepreneurship.” Stanford University, Stanford, CA; 2012.
10 Our estimates published in 2009 were of approximately 3.3 million employees worldwide and revenues of nearly $2 trillion for the year 2006. The estimated 25,800 living MIT-alumni-founded companies in that survey ranged across sectors with the most highly represented industries being software, electronics and telecommunications. Using the earlier methodology on our 2014 survey data produces well over 30,000 living companies and considerably higher employment and revenue statistics. The limited data from the telephone survey suggest even higher numbers. (See Appendix for additional detail.)
11 Estimates are derived using the same extrapolation method mentioned earlier and with the additional assumption that 77% of all MIT-related companies are based in the U.S.
Massachusetts 31%
California 21%
New York 7%
Florida 4%
Texas 3%
Virginia 3%
New Jersey 3%
Other 28%
Figure 1. Location of US-based MIT alumni-founded companies.
28%
Note: Repondents reported current company location or last location if no longer operating; includes companies founded between the 1940s and April 2014.

8Entrepreneurship and Innovation at MIT: Continuing Global Growth and Impact |
technology start-ups in the United States,12 our results show that Cambridge boasts the highest share of MIT alumni companies at 8%. These companies have a direct impact on the local and regional economies, and their presence has been influential in attracting the significant biotechnology and information technology (IT) industry clusters that have emerged in the greater Kendall Square area in Cambridge. These trends are consistent with results from the 2009 survey.
Survival Statistics
Of course, the formation of new enterprises does not necessarily indicate or ensure their contributions to economic growth. Measurable impact depends on the companies’ abilities to serve customers and build products and services that solve important problems, as well as their capacity to scale and grow effectively and efficiently. Our data show that, as a whole, MIT alumni–founded companies exhibit strong performance in comparison with baseline U.S. statistics. One common metric that sheds light on start-up performance is their survival rate over time. Survival is a major challenge for nascent firms because of the risks inherent in entrepreneurship.
The MIT alumni–founded companies represented in our survey results exhibit superior performance in terms of survival relative to new U.S. firms as a whole. While roughly 50% of U.S. newly formed businesses survive for five years or more and 35% last for 10 years, approximately 80% of new companies founded by MIT alumni survive for five years or more and 70% last for 10 years according to our results. As shown in Figure 2, the survival rate for the MIT-alumni companies is higher at every stage of the company life cycle. Overall, the survey results suggest that about two-thirds of all MIT alumni–founded companies—from those that started as far back as 1945 to those recently founded—continue to exist today. This is consistent with the follow-up telephone survey, which found that 72% of all companies founded are still active.
Impact on Employment and Revenues
Other salient metrics of entrepreneurial success include employment and revenues. As mentioned earlier, MIT alumni–founded companies have a substantial impact on our economy through employment and revenues. Nonetheless, it is worth highlighting that MIT alumni companies are significantly heterogeneous in firm size as well as the magnitude of their economic impact. Table 1a indicates that roughly half of MIT companies represented in this survey employ fewer than 10 people. Contrary to high-growth entrepreneurship, many are probably lifestyle businesses that generate steady streams of income, such as personal consulting companies.
Like the economy as a whole, a small fraction of entrepreneurial ventures is responsible for a disproportionately high share of employment and revenues. (Most small business in the United States never intend to grow or innovate in any major way.13) For instance, while companies with more than 1,000 employees make up only 2.3% of total MIT alumni–founded companies in our survey data, they account for 68% of total employment as well as 42% of total revenues. This is comparable to our findings in our earlier report of concentrated sources of entrepreneurial economic impact.
12 “Top 20 US Cities for Tech Startup Funding,” Inc.com, October 23, 2014. Accessed March 30, 2015, http://www.inc.com/associated-press/top-20-cities-for-tech-startup-funding.html. These rankings do not take into account the relative population sizes of the states or regions in which the cities are located.
13 Erik Hurst and Benjamin Wild Pugsley, “What Do Small Businesses Do?” NBER Working Paper No. 17041. Cambridge, MA; May 2011. http://www.nber.org/papers/w17041.pdf

9Entrepreneurship and Innovation at MIT: Continuing Global Growth and Impact |
Figure 2. Survival rates of MIT alumni–founded companies versus all U.S. new businesses, 1994–2014.
Table 1a. Reported Employment and Revenue Distribution of MIT Alumni–Founded Active Companies, 2013
Employment Revenues ($ Millions)
Employment category
Percent of companies Median Mean
Percent of total Median Mean
Percent of total
1–10 51.0% 4 4.5 1% 0.1 4.6 4%
11–50 27.8% 24 26 4% 3 7.4 3%
51–200 12.6% 100 116 8% 16 67 13%
201–500 4.6% 325 354 9% 50 248 18%
501–1,000 1.8% 825 819 8% 110 756 21%
1,001–5,000 1.8% 2,500 2,750 30% 450 900 26%
5,001–10,000 0.3% 7,000 7,600 12% 600 1,302 6%
10,000+ 0.2% 15,000 21,429 26% 2,000 2,743 10%
0%
20%
40%
60%
80%
100%
1 2 3 4 5 6 7 8 9 10 11 12 13 14 15 16
MIT alumni-founded companies
Years since founding
Figure 2. Survival rates of MIT alumni-funded companies versus all US new businesses, 1994–2014.
Note: Data for MIT alumni–founded companies are from the period 2004–2014. Data for all US new businesses are from the US Bureau of Labor Statistics (BLS) for the period 1994–2010. In order to follow the BLS data format, each year represents a unique set of companies; 2014 is normalized to year 0. In other words, at 10 years since founding, only companies that are founded in 2004 are represented while at 9, only those founded in 2005 are shown; no companies overlap in the two subsets.
Surv
ival
rat
e
Sources: Edward B. Roberts, Fiona Murray, J. Daniel Kim. Entrepreneurship and Innovation at MIT: Continuing Global Growth and Impact. Cambridge, MA: Massachusetts Institute of Technology; 2015. US Bureau of Labor Statistics, Business Employment Dynamics, Entrepreneurship and the US Economy, “Chart 3. Survival rates of establishments, by year started and number of years since starting, 1994–2010, in percent,” http://www.bls.gov/bdm/entrepreneurship/bdm_chart3.htm.
All US businesses MIT Alumni–founded companies

10Entrepreneurship and Innovation at MIT: Continuing Global Growth and Impact |
In addition to firm size, age is another useful measure of the firm’s growth prospects. Recent studies also show that young—not necessarily small—firms drive much of the employment growth.14 Therefore, the distinction between small and young firms is meaningful.
Table 1b shows the breakdown of MIT alumni–founded companies by their founding decade. As expected, most of the firms founded in the past 15 years employ 10 or fewer employees. For earlier decades, around 30%–40% of the companies continue to stay small despite being in operation for several decades, reinforcing the notion that many small businesses never intended or were able to grow. Also, mean employment numbers show the continuing growth of the surviving firms over their first 40 years.
Table 1b. Selected Employment Statistics for MIT Alumni–Founded Companies, by Decade Founded, 2013
Founding decadePercent with 1–10
employeesMean
employmentMedian
employment
Pre-1960s 35% 307 22
1960s 34% 356 30
1970s 33% 464 25
1980s 30% 412 26
1990s 38% 207 20
2000s 40% 119 15
2010s 85% 14 3
Company Funding and Outcomes
The range of company outcomes, or “exits,” provides another key metric to understand entrepreneurial performance, especially for investors and other stakeholders (even though not all profitable private companies seek to exit). Some very successful companies choose to remain privately held by their founders, employees, and private investors. Nonetheless, for many entrepreneurs and investors who seek liquidity and/or returns on their earlier investments, an initial public offering (IPO) of company shares is a sought-after outcome. While IPOs frequently mark some degree of growth and initial success, acquisitions of one company by another are another exit measure. These may include profitable mergers and acquisitions (M&As) as well as unprofitable liquidation events such as “fire-sale” acquisitions or asset sales. In Table 2, we label these fire-sale acquisitions as “Acquired, closed” (suggesting the closure of the company post-acquisition). Bankruptcy is also included in our definition of company failures.
Overall, 2% of MIT alumni companies in this survey experienced an IPO while 8% were bought out through an acquisition. The majority of the companies in our “live” survey sample remain privately held.
To put these rates into perspective we compare them to the IPO/acquisition rates of a comprehensive venture capital (VC)-backed sample: A 2010 analysis of 22,000 VC-backed companies found that 9% achieved an IPO while another 25% were acquired.15 In comparison, of the MIT alumni companies represented in the survey from the same time frame (1986–2008) that we could identify as venture-
14 John Haltiwanger, Ron S. Jarmin, and Javier Miranda, “Who Creates Jobs? Small Versus Large Versus Young,” The Review of Economics and Statistics 2013 95(2):347–361. doi: 10.1162/REST_a_00288
15 Robert E. Hall and Susan W. Woodward, “The Burden of the Nondiversifiable Risk of Entrepreneurship,” American Economic Review 2010 100:1163–1194.

11Entrepreneurship and Innovation at MIT: Continuing Global Growth and Impact |
based, 7% experienced an IPO and 19% were acquired.16 The IPO rate for MIT alumni companies in this survey is lower than our earlier study of MIT alumni, where we documented 11% of their firms as having had IPOs.
Table 2. Selected Outcome Measures of MIT Alumni–Founded Companies, 1940s through April 2014
Company outcome Non VC-backed* VC-backed*
Proportion of MIT companies 96% 4%
Successfully exited 10% 20%
Public 2% 6%
Acquired, open 7% 14%
Failed 34% 32%
Acquired, closed 10% 17%
Closed 23% 15%
Still privately held 57% 49%
*VC=Venture capital
It is worth noting that young enterprises can generally be categorized into two distinct types: small and medium-sized enterprises (SMEs) and innovation-driven enterprises (IDEs).17,18 The distinguishing feature of new IDEs is that they are based on bringing to customers innovations that exhibit high growth potential and competitive advantage. As a result, external capital to support growth is their characteristic financing, whereas SMEs usually support their investment by “bootstrapping” or by taking on small business loans. According to the Small Business Administration, about 600,000 new businesses are started in the United States each year. Some 300 of them are backed by venture capital, resulting in an estimated rate of 0.05%.19 In contrast, our survey approximation shows that around 4% of MIT alumni–founded companies are funded through venture capital. These large differences highlight that MIT entrepreneurs are much more likely to launch innovation-driven enterprises when compared to the baseline population of U.S. entrepreneurs.
Serial Entrepreneurship
One final observation regarding economic impact is that many MIT alumni founders become “serial entrepreneurs.” Roughly 40% of MIT alumni entrepreneurs in our current survey (and 49% of telephone survey respondents) have already launched two or more companies during their careers. In reality, the overall proportion of serial entrepreneurs is necessarily higher due to the “right-hand censoring effect”; i.e., alumni who graduated more recently and those who are first-time entrepreneurs are observed here as one-time founders though they may go on to found more businesses in the future.
16 Unfortunately, we do not observe whether companies in our data are affiliated with venture capital financing. We identify which MIT companies are VC-backed by “fuzzy matching” against the CrunchBase dataset based on company name and location. For comparison with Hall and Woodward (2010), our sample is restricted to companies founded between 1986 and 2008.
17 Bill Aulet and Fiona Murray, “A Tale of Two Entrepreneurs: Understanding Differences in the Types of Entrepreneurship in the Economy.” Kauffman Foundation: Kansas City, MO; 2013.
18 Antoinette Schoar refers to these two types of new companies as “subsistence” and “transformational” in her paper, “The Divide between Subsistence and Transformational Entrepreneurship,” in Innovation Policy and the Economy, Vol. 10. National Bureau of Economic Research; Cambridge, MA; 2010. 57–81.
19 Dileep Rao, “Why 99.95% of Entepreneurs Should Stop Wasting Time Seeking Venture Capital,” Forbes, July 22, 2013. Accessed July 20, 2015, http://www.forbes.com/sites/dileeprao/2013/07/22/why-99-95-of-entrepreneurs-should-stop-wasting-time-seeking-venture-capital/.
12Entrepreneurship and Innovation at MIT: Continuing Global Growth and Impact |
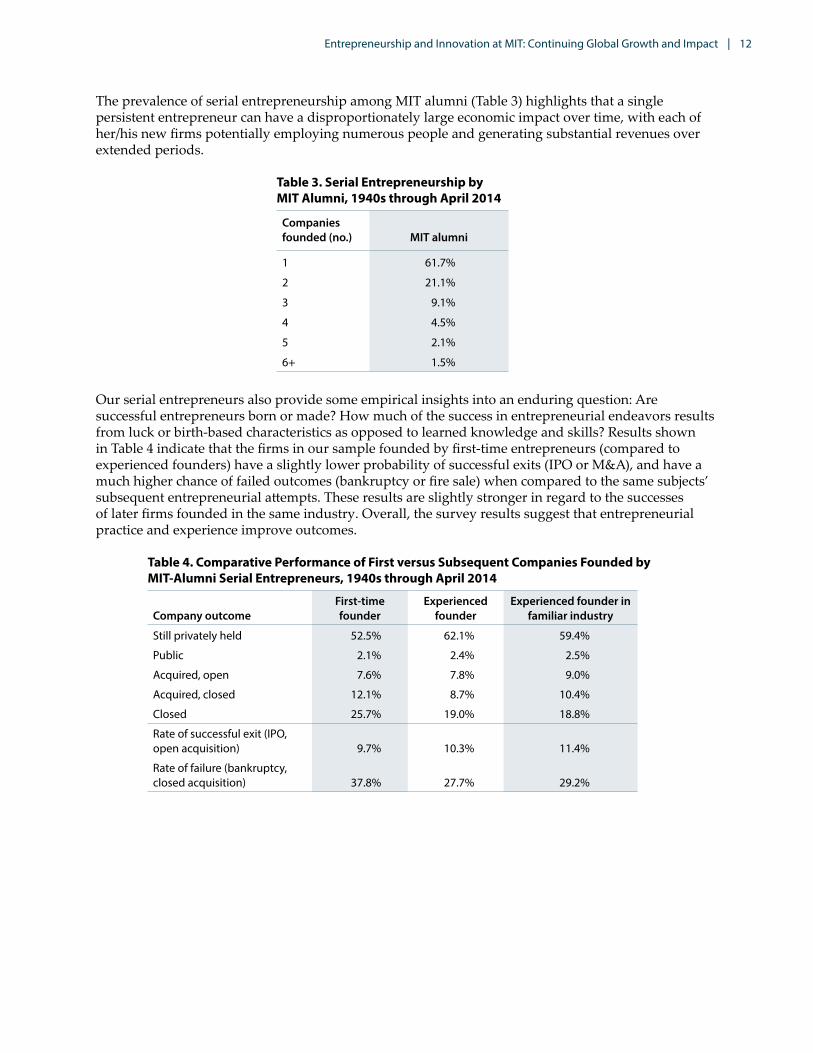
The prevalence of serial entrepreneurship among MIT alumni (Table 3) highlights that a single persistent entrepreneur can have a disproportionately large economic impact over time, with each of her/his new firms potentially employing numerous people and generating substantial revenues over extended periods.
Table 3. Serial Entrepreneurship by MIT Alumni, 1940s through April 2014
Companies founded (no.) MIT alumni
1 61.7%
2 21.1%
3 9.1%
4 4.5%
5 2.1%
6+ 1.5%
Our serial entrepreneurs also provide some empirical insights into an enduring question: Are successful entrepreneurs born or made? How much of the success in entrepreneurial endeavors results from luck or birth-based characteristics as opposed to learned knowledge and skills? Results shown in Table 4 indicate that the firms in our sample founded by first-time entrepreneurs (compared to experienced founders) have a slightly lower probability of successful exits (IPO or M&A), and have a much higher chance of failed outcomes (bankruptcy or fire sale) when compared to the same subjects’ subsequent entrepreneurial attempts. These results are slightly stronger in regard to the successes of later firms founded in the same industry. Overall, the survey results suggest that entrepreneurial practice and experience improve outcomes.
Table 4. Comparative Performance of First versus Subsequent Companies Founded by MIT-Alumni Serial Entrepreneurs, 1940s through April 2014
Company outcomeFirst-time founder
Experienced founder
Experienced founder in familiar industry
Still privately held 52.5% 62.1% 59.4%
Public 2.1% 2.4% 2.5%
Acquired, open 7.6% 7.8% 9.0%
Acquired, closed 12.1% 8.7% 10.4%
Closed 25.7% 19.0% 18.8%
Rate of successful exit (IPO, open acquisition) 9.7% 10.3% 11.4%
Rate of failure (bankruptcy, closed acquisition) 37.8% 27.7% 29.2%

13Entrepreneurship and Innovation at MIT: Continuing Global Growth and Impact |
TRENDS IN MIT ALUMNI ENTREPRENEURSHIP
Growth Rate of New Company Formation
The rise of entrepreneurship among MIT alumni can be explored using the entrepreneurship participation rate in the period immediately after graduation. The percentage of surveyed alumni who have founded a venture within five years of graduation has risen from 4% among those who graduated in the 1960s to approximately 8% among those graduating in the 1990s. The rate drops to 7% in the first decade of the 2000s, possibly due to the dot-com crash. For the 2010s, the five-year entrepreneurship participation rate rose again to 11%. This new high is particularly interesting given that the most recent alumni have had limited time to explore their career options (i.e., right-censoring bias) and none of them was a full five years past graduation when the survey was administered. We do not know how many of these early start-ups actually began prior to graduation! These trends are robust to three- and 10-year windows, as shown in Figure 3.
Figure 3. Estimated entrepreneurship participation rate of MIT alumni, by decade of graduation, pre-1960s through April 2014.
Next, we assess the increasing trend in MIT alumni entrepreneurship at the firm level. As shown in Figure 4, our estimates, based on extrapolation from the survey respondents to the entire alumni population, suggest that MIT alumni founded roughly 5,300 for-profit companies during the 1980s.20 By the 1990s, that number increased by roughly 50%. During the decade of the 2000s—the peak 10-year period thus far for MIT alumni entrepreneurship—extrapolation suggests that MIT alumni created approximately 12,000 new companies. It is important to note that these measurements are based on gross firm creation. In other words, these numbers do not take into account firm survival (meaning that many of these companies may have operated for only a short span of time before going out of business).
20 See Appendix for a more detailed description of the extrapolation method.

14Entrepreneurship and Innovation at MIT: Continuing Global Growth and Impact |
Figure 4. Estimated number of MIT alumni–founded companies, by founding decade, pre-1960s through April 2014.
Growth is evident in absolute numbers, but also in the proportional rates (Figure 5), normalizing to address differences in the size of the alumni base over time. (We divide the number of companies founded by MIT alumni in each decade by the number of existing alumni in that decade.) We estimate that approximately 3.5 active companies were founded per 100 alumni during the 1960s; by the 1980s, this figure had jumped to some 10.7, and rose again in the 2000s to 13.4. The expected figure for the 2010s is 18 companies per 100 active alumni based on an extrapolation of this growth rate. In annual terms, this suggests that in the 2000s, around 1,300 firms were founded each year by MIT alumni entrepreneurs.
Figure 5. Estimated number of MIT alumni–founded companies, per 100 active alumni, by founding decade, pre-1960s through April 2014.
Nu
mb
er o
f com
pan
ies
Figure 4. Estimated number of MIT alumni-founded companies, by founding decade, pre-1960s through April 2014.
Pre-1960s 1960s 1970s 1980s 1990s 2000s 2010s
12,00012,000
10,000
8,0008,000
5,300
2,200
1,000
200
9,100
6,000
4,000
2,000
0
Founding decade
Figure 5. Estimated number of MIT alumni-founded companies, per 100 active alumni, by founding decade, pre-1960s through April 2014.
9.2
18.0
13.4
12.0
10.7
6.96.0
3.5
18
15
12
9
6
3
0
Founding decade
Pre-1960s 1960s 1970s 1980s 1990s 2000s 2010s
Num
ber o
f com
pani
es (p
er 1
00 a
ctiv
e al
umni
)
ProjectedActual

15Entrepreneurship and Innovation at MIT: Continuing Global Growth and Impact |
Declining Age of Founders
The declining age of MIT alumni founders, shown in Figure 6, is another notable trend in MIT entrepreneurship. The median age of first-time founders has decreased over the last eight decades. While the median age during the 1940s was 39 years old, it decreased slightly to 37 in the 1970s and eventually to 30 in the 2000s. Although the median age for first-time founders who graduated during the 2010s is even lower at 27, the accuracy of this particular snapshot is unclear since this figure is downward biased due to right censoring. A similar steady decline in median age of first-time MIT alumni entrepreneurs was also reported in the earlier MIT study. These results do not include companies already formed by MIT students who had not yet graduated at the time of the survey.
Figure 6. Median age of first-time MIT alumni company founders, by decade of graduation, 1940s through April 2014.
The factors contributing to the falling age of first-time entrepreneurs are not well known. One possible contributor is the declining cost of starting an innovation-driven enterprise (e.g., cloud computing and application program interface (API) tools have lowered the IT costs of starting a company), which in turn reduces the opportunity cost of entrepreneurship. Moreover, enhanced access to alternative forms of capital may also be a factor. For example, our own data show the increasing engagement of recent MIT alumni in crowdfunding to support the invention of a new product or service.
More specific to our student body, applications to MIT—at the undergraduate level and the MIT Sloan MBA—indicate a strong shift over the past decade toward entrepreneurial career interests by young people. This is also evident in the rapidly increasing enrollments in MIT’s entrepreneurial courses, as well as in the number of student teams entering MIT’s various business-plan and venture-formation competitions.
Industry Shifts in MIT Entrepreneurship
Notable shifts have taken place in the composition of entrepreneurship at the industry level. Similar to the broader U.S. economy and OECD nations, MIT start-ups have become increasingly services-oriented and correspondingly less manufacturing-focused. Until the 1980s, the breakdown of MIT alumni–founded firms in the survey responses was evenly split between manufacturing and services. However, the services sector gained traction in the 1990s, during which 70% of the companies were services-oriented (Figure 7). The services-manufacturing split still appears to be 70-30 in recent years.

16Entrepreneurship and Innovation at MIT: Continuing Global Growth and Impact |
Figure 7. MIT alumni–founded companies, by decade, manufacturing versus services, pre-1960s through April 2014.
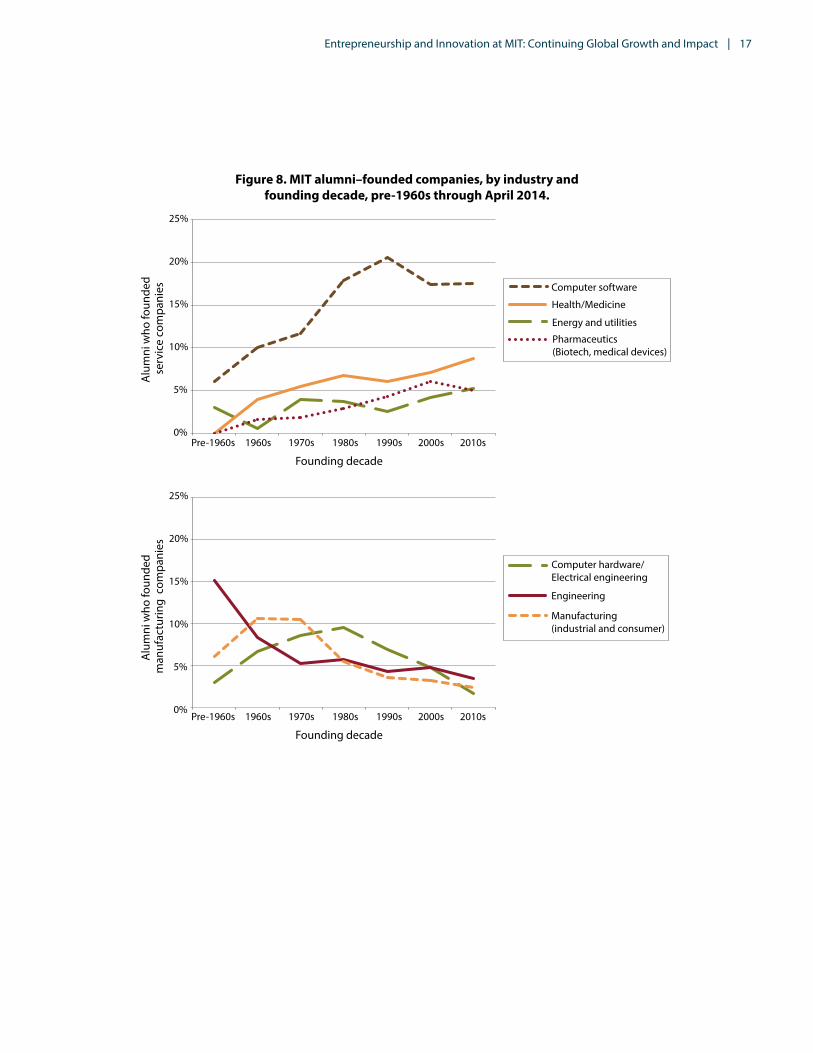
At a more granular level, a few industries have experienced large, persistent trends. Most notably, the software industry has experienced the largest gain in the share of MIT alumni–founded companies over a 60-year period, perhaps comparable to the United States as a whole. While software comprised 6% of alumni companies before the 1960s, the industry’s share among MIT alumni–founded firms peaked in the 1990s at 20% and has since stabilized at around 18%, making it the most popular among the start-ups in our survey data. Furthermore, as Professor Fiona Murray has pointed out, the healthcare, medical, and pharmaceutical industries have also seen considerable growth that has accompanied, and no doubt contributed to, the recent rise of the biotech cluster within the Kendall Square area, where 120 biomedical companies have located within a little over a one-mile radius.21 In contrast, engineering and hardware have experienced sharp declines in the share of MIT alumni–founded companies. These trends are illustrated in Figure 8.
Gender Differences
As with broader trends in the U.S. economy, the overall rate of entrepreneurship is considerably lower among female MIT alumni survey respondents than among their male counterparts. Overall, the rate of entrepreneurship in our sample is 12% for women versus 29% for men—a more than two-fold difference. This finding is consistent with the fact that roughly only 30% of U.S. businesses are women-owned.22 As shown in Table 5, we also find variations in the rate of female participation in other innovation-related activities.
21 Heidi Ledford, “Start-ups fight for a place in Boston’s biotech hub,” Nature, June 8, 2015. Accessed July 20, 2015, http://www.nature.com/news/start-ups-fight-for-a-place-in-boston-s-biotech-hub-1.17721.
22 2007 Survey of Business Owners, U.S. Census Bureau. Accessed at http://www.census.gov/econ/sbo/getsof.html?07women.
52%
48% 50%
47%
37%
40%
38%
48%
52% 50% 53%
63%
60% 62%
30%
40%
50%
60%
70%
Figure 7. MIT alumni-founded companies founded, by decade, manufacturing versus services*, pre-1960s through April 2014.
Founding decade
Alu
mni
-foun
ded
com
pani
es
Pre-1960s 1960s 1970s 1980s 1990s 2000s 2010s
ServicesManufacturing
*Manufacturing and services do not necessarily add up to 100% because “Other” industry is coded as neither category.
17Entrepreneurship and Innovation at MIT: Continuing Global Growth and Impact |
Figure 8. MIT alumni–founded companies, by industry and founding decade, pre-1960s through April 2014.
Founding decade
Alu
mni
who
foun
ded
serv
ice
com
pani
esA
lum
ni w
ho fo
unde
d m
anuf
actu
ring
com
pani
es
Figure 8. MIT alumni-founded companies, by industry and founding decade, pre-1960s through April 2014.
Computer software
Health/Medicine
Pharmaceutics (Biotech, medical devices)
Energy and utilities
0%
5%
10%
15%
20%
25%
Pre-1960s 1960s 1970s 1980s 1990s 2000s 2010s
Engineering
Manufacturing (industrial and consumer)
Computer hardware/Electrical engineering
Founding decade
Pre-1960s 1960s 1970s 1980s 1990s 2000s 2010s0%
5%
10%
15%
20%
25%

18Entrepreneurship and Innovation at MIT: Continuing Global Growth and Impact |
Table 5. MIT Alumni Participation in Innovation-Related Activities, by Gender, 1940s through April 2014
Male participation Female participation
Yes Rate Yes Rate
Entrepreneurship
For profit 4,181 29% 585 12%
Non-profit 1,747 12% 484 10%
Early employee 3,577 25% 643 13%
Innovation
Inventor 5,524 39% 871 18%
Patentor 5,160 36% 762 16%
Product development 8,464 59% 1,963 41%
Advisor
Board of directors, private 2,893* 20%* 364* 8%*
Board of directors, public 531* 4%* 81* 2%*
Scientific advisory board 1,717* 12%* 334* 7%*
Investor
In a start-up by MIT alum(s) 967 7% 161 3%
Friends and family (angel) 2,388 17% 656 14%
Venture capital 968 7% 90 2%
*Alumni serving in this role at time of survey; the total number or percentage of alumni who have served in this role at some point in their careers may be higher.
A simple hazard model in Figure 9 shows whether gender correlates with a respondent’s decision to become an entrepreneur in a given year after graduating from MIT. Kaplan-Meier risk curves display a significant level difference (thus confirming the overall percentage differences for male and female alumni).
Figure 9. MIT alumni hazard rate of entrepreneurship post-graduation,* by gender, 1940s through April 2014.
0 20 40 60
Male Female
0.00
0.10
0.20
0.30
0.40
0.50
Years since graduation
Haz
ard
rate
*The likelihood of an individual’s decision to become an entrepreneur, calculated using a Kaplan-Meier risk estimate model with a maximum of 60 years following graduation.
Figure 9. MIT alumni hazard rate of entrepreneurship* post graduation, by gender, 1940s through April 2014.
19Entrepreneurship and Innovation at MIT: Continuing Global Growth and Impact |
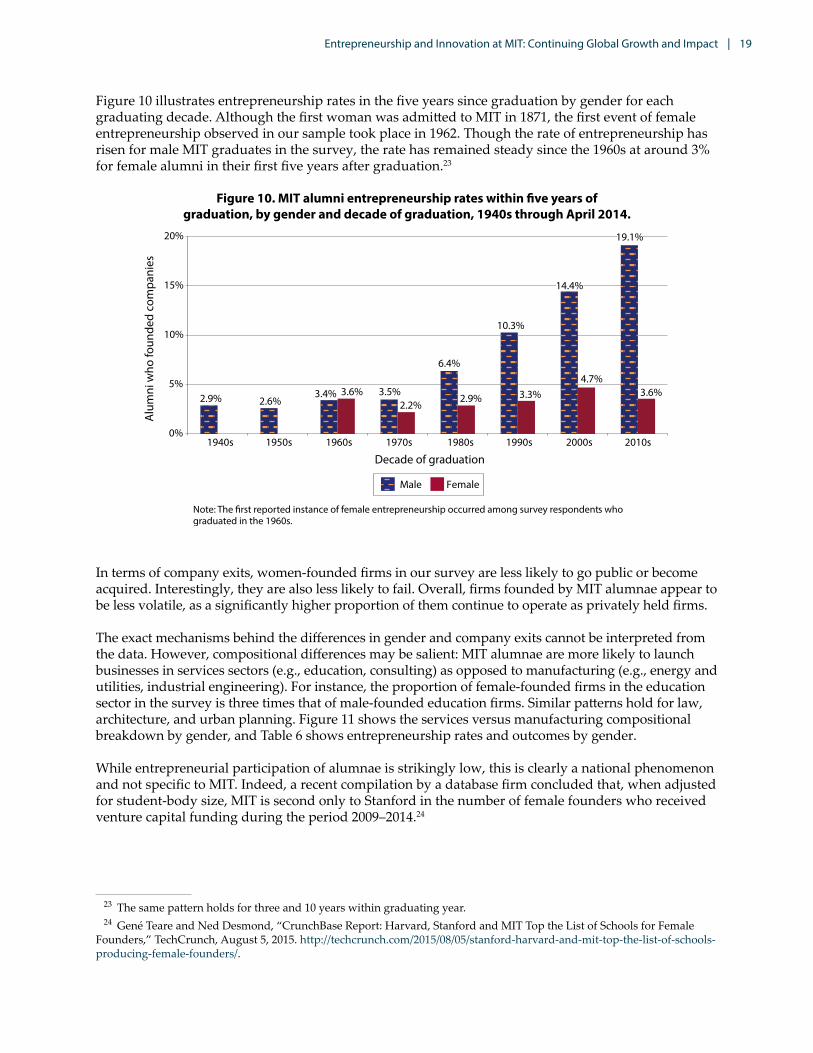
Figure 10 illustrates entrepreneurship rates in the five years since graduation by gender for each graduating decade. Although the first woman was admitted to MIT in 1871, the first event of female entrepreneurship observed in our sample took place in 1962. Though the rate of entrepreneurship has risen for male MIT graduates in the survey, the rate has remained steady since the 1960s at around 3% for female alumni in their first five years after graduation.23
Figure 10. MIT alumni entrepreneurship rates within five years of graduation, by gender and decade of graduation, 1940s through April 2014.
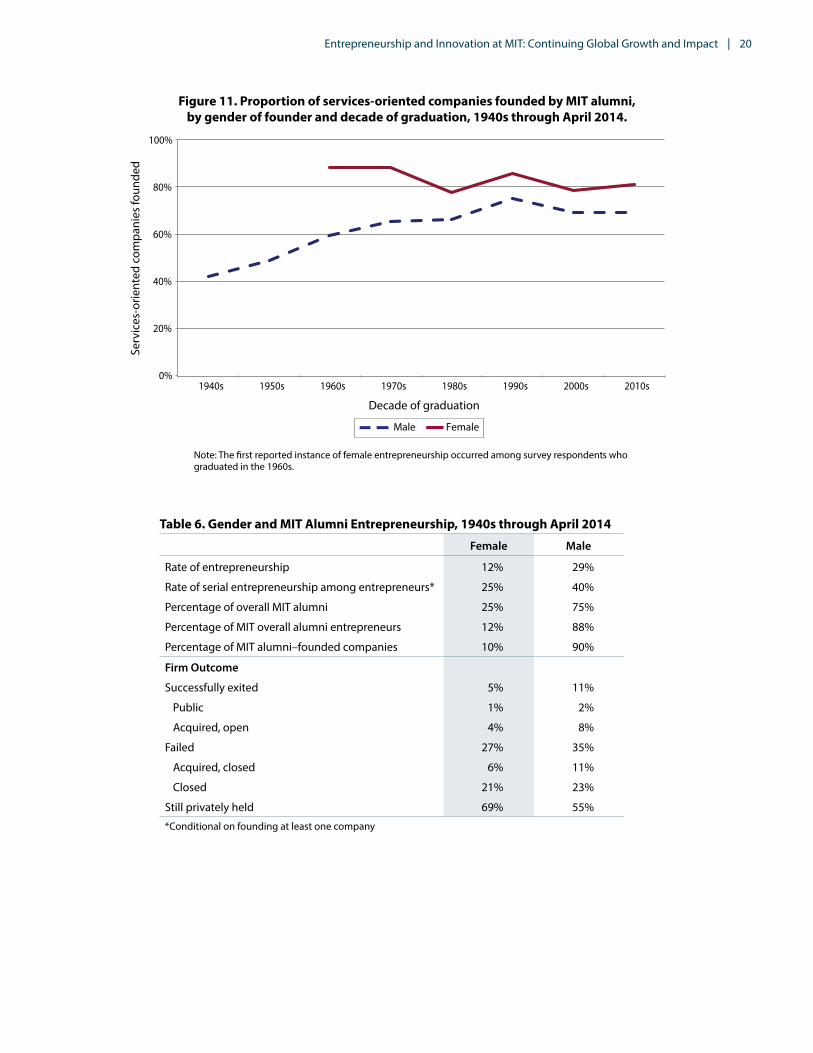
In terms of company exits, women-founded firms in our survey are less likely to go public or become acquired. Interestingly, they are also less likely to fail. Overall, firms founded by MIT alumnae appear to be less volatile, as a significantly higher proportion of them continue to operate as privately held firms.
The exact mechanisms behind the differences in gender and company exits cannot be interpreted from the data. However, compositional differences may be salient: MIT alumnae are more likely to launch businesses in services sectors (e.g., education, consulting) as opposed to manufacturing (e.g., energy and utilities, industrial engineering). For instance, the proportion of female-founded firms in the education sector in the survey is three times that of male-founded education firms. Similar patterns hold for law, architecture, and urban planning. Figure 11 shows the services versus manufacturing compositional breakdown by gender, and Table 6 shows entrepreneurship rates and outcomes by gender.
While entrepreneurial participation of alumnae is strikingly low, this is clearly a national phenomenon and not specific to MIT. Indeed, a recent compilation by a database firm concluded that, when adjusted for student-body size, MIT is second only to Stanford in the number of female founders who received venture capital funding during the period 2009–2014.24
23 The same pattern holds for three and 10 years within graduating year.24 Gené Teare and Ned Desmond, “CrunchBase Report: Harvard, Stanford and MIT Top the List of Schools for Female
Founders,” TechCrunch, August 5, 2015. http://techcrunch.com/2015/08/05/stanford-harvard-and-mit-top-the-list-of-schools-producing-female-founders/.
20Entrepreneurship and Innovation at MIT: Continuing Global Growth and Impact |
Figure 11. Proportion of services-oriented companies founded by MIT alumni, by gender of founder and decade of graduation, 1940s through April 2014.
Table 6. Gender and MIT Alumni Entrepreneurship, 1940s through April 2014
Female Male
Rate of entrepreneurship 12% 29%
Rate of serial entrepreneurship among entrepreneurs* 25% 40%
Percentage of overall MIT alumni 25% 75%
Percentage of MIT overall alumni entrepreneurs 12% 88%
Percentage of MIT alumni–founded companies 10% 90%
Firm Outcome
Successfully exited 5% 11%
Public 1% 2%
Acquired, open 4% 8%
Failed 27% 35%
Acquired, closed 6% 11%
Closed 21% 23%
Still privately held 69% 55%
*Conditional on founding at least one company

21Entrepreneurship and Innovation at MIT: Continuing Global Growth and Impact |
We also observe differences in firm size for female versus male entrepreneurship. Figure 12 shows the distribution of MIT alumni–founded company size by gender. Relative to males in the survey, female entrepreneurs from MIT are significantly more likely to own small firms. While 49% of male-founded firms report employing fewer than 10 workers, the figure for female-founded firms is 72%. (See Table 1b for further analysis of the size distribution.)
While bias in access to funding may play a role (as noted in prior research by Professor Fiona Murray25), the difference in firm size for a similar cohort of accomplished MIT graduates suggests that female entrepreneurs have generally been more likely to start small and medium-sized enterprises rather than innovation-driven enterprises (see the section on Company Funding and Outcomes for the distinction). This distinction, together with the observed sectoral patterns, largely explains the observed differences in company exit patterns.
Figure 12. Size distribution of MIT alumni–founded firms, by gender of founder, April 2014.
25 Alison Wood Brooks, Laura Huang, Sarah Wood Kearney and Fiona. E. Murray, Investors Prefer Entrepreneurial Ventures Pitched By Attractive Men, Proceedings of the National Academy of Science 2014 111(12):4427–4431. http://www.pnas.org/content/111/12/4427.full.pdf

22Entrepreneurship and Innovation at MIT: Continuing Global Growth and Impact |
International Students
International students (defined here as individuals born outside the United States) in our MIT alumni survey were as likely to start their own ventures as the domestic students. However, they were more likely to be serial entrepreneurs, meaning that foreign-born students account for a disproportionately high proportion of MIT alumni–founded companies. Companies founded by international students exhibited both a lower failure rate and a lower likelihood of achieving a successful exit.
These differences in serial entrepreneurship and performance likely result in part from location decisions. Whereas 94% of the companies founded by U.S. student respondents are located in the United States, the figure is only 45% for companies launched by international students. These observed differences have important policy implications regarding immigration policies focused on science, technology, engineering, and mathematics (STEM) and on recipients of U.S.-based higher education. Table 7 shows the entrepreneurship rates and outcomes by alumni birthplace.
Table 7. MIT Alumni Entrepreneurship and Birthplace, 1940s through April 2014
Foreign-born students U.S.-born students
Rate of entrepreneurship 26% 24%
Rate of serial entrepreneurship among entrepreneurs* 44% 35%
Percentage of overall MIT alumni 37% 63%
Percentage of overall MIT alumni entrepreneurs 38% 62%
Percentage of MIT alumni–founded companies 41% 59%
Firm Outcome
Successfully exited 9% 11%
Public 2% 2%
Acquired, open 7% 8%
Failed 28% 37%
Acquired, closed 8% 12%
Closed 20% 25%
Still privately held 63% 52%
*Conditional on founding at least one company
OTHER CONTRIBUTIONS TO MIT ENTREPRENEURSHIP AND INNOVATION
While founders attract much of the limelight in the world of entrepreneurship, other activities and roles contribute to the economic impact of entrepreneurship and innovation and drive the innovation economy. In terms of direct contribution to innovation, 31% of the MIT alumni responded that they are named as an inventor on a patent.26 Furthermore, more than half of MIT alumni noted that they were responsible for new product development at a firm of which they were not a founder (Table 8).
26 This figure may underestimate the true level of patenting among younger MIT alumni due to the “right-censoring bias.” That is, younger alumni have had so little time out of school to create and patent their inventions. Compared with the 39% patenting rate for survey respondents graduating in the 1970s, the rate for those graduating in the 2000s is only 25%, but we expect that percentage to rise as their careers progress.

23Entrepreneurship and Innovation at MIT: Continuing Global Growth and Impact |
Table 8. Participation of MIT Alumni in Entrepreneurship and Innovation Activities, 1940s through April 2014
Activity Alumni participating (%)
Entrepreneurship
Company founder 25%
Early employee 22%
Innovation
Inventor 34%
Patentor 31%
Product development 55%
Advisor
Company board of directors, private 17%*
Company board of directors, public 3%*
Scientific advisory board 11%*
*Alumni serving in this role at time of survey; the total percentage of alumni who have served in this role at some point in their careers is no doubt higher.
MIT alumni are early (non-founding) employees in entrepreneurial teams. Unsurprisingly, MIT has produced many talented workers and innovators who joined early-stage companies and significantly contributed to the growth of these firms. Specifically, 22% of MIT alumni in the survey have been early employees, which we defined as among the first 10 non-founder employees to join a company within its first two years of operation.27 Among this group, 38% eventually moved on to launch their own business, which is a higher proportion of alumni entrepreneurs than those without early-stage company employee experience.
Early employees are particularly important because acquiring high quality human capital is crucial for nascent firms. For innovation-driven start-ups, the ability to enter and potentially disrupt a market requires not only innovative ideas, but also productive workers to commercialize and execute those ideas. Therefore, early employees are perhaps the most important assets for nascent companies, supplementing the co-founder teams.
CONTINUING DEVELOPMENT OF THE MIT ENTREPRENEURSHIP ECOSYSTEM
Entrepreneurship among MIT alumni has been increasing at an impressive pace, matching and even outpacing trends that can be observed throughout the U.S. economy and worldwide. The support of innovation ecosystems in the key areas where many of MIT’s entrepreneurial alumni are located—within the United States in Kendall Square/Massachusetts, Silicon Valley, New York City, and outside the United States in Israel, London, and Singapore—is critical as our alumni develop entrepreneurial companies after they leave the campus.
Nonetheless, the support for innovation—bringing ideas to impact and, in particular, the role of entrepreneurial start-up ventures as the organizational vehicle to accelerate impact—is consistent with MIT’s enduring culture of innovation and its long-standing commitment to a practical, hands-on
27 This level is consistent with the MIT Graduating Student Survey, which suggests that in the past few years, around 20% of graduating seniors have joined early-stage companies. A related analysis shows that 14% have joined venture-backed start-ups in 2014 (see Footnote 5).

24Entrepreneurship and Innovation at MIT: Continuing Global Growth and Impact |
approach to education.28 One important force has been the extensive collection of centers and programs that support MIT’s innovation culture and enable the entrepreneurial ambitions of our students. From its earliest beginnings in the post–World War II period, the educational activities, networking, mentoring, and celebrating of entrepreneurship has proliferated significantly in the past three decades. Additionally, the overall increases in research funding, faculty members, and graduate students have increased the opportunities for entrepreneurial activities.
This growing emphasis was symbolized by the 1990 launch of the MIT Entrepreneurship Center (now the Martin Trust Center for MIT Entrepreneurship). At that time, MIT offered only one entrepreneurship course. In the 2014–2015 academic year, MIT’s entrepreneurship offerings included a total of 63 courses from departments across the Institute on a variety of topics, attracting thousands of registrants from all five MIT Schools.
Entrepreneurship Education at MIT
MIT’s ambitious entrepreneurship educational program rests upon three principles: (1) Mens et Manus, (2) teams, not individuals, and (3) cross-disciplinary collaboration. The first of these, “Mind and Hand,” stems from William Barton Rogers’ founding conception of linking theory and practice. The entrepreneurship curriculum is focused on moving ideas to action, invention to the marketplace. The spirit of this motto also manifests in the co-mingling of academicians with practitioners to deliver courses. MIT academic faculty in entrepreneurship bring their research findings and rigorous discipline into their subjects. They are matched by experienced and successful entrepreneurs and investors who bring their “practice” into the classroom. Whenever possible, academics and practitioners co-teach entrepreneurship subjects, to the benefit of teachers and students alike.
MIT research on entrepreneurship determined years ago that solo entrepreneurs were considerably less likely to build successful companies than were teams, thus forming the basis for our second educational principle. A team-based approach to student learning and activities has therefore been adopted throughout most of our curriculum design. Entrepreneurship Lab (E-Lab) and Global Entrepreneurship Lab (G-Lab) are problem-solving courses that place student teams with companies in Greater Boston and around the world to focus on critical early-stage growth challenges. MIT’s many venture courses, described below, depend upon teams as the working and learning units in the class.
The third educational principle also stems from early MIT entrepreneurship research that showed that teams of co-founders from complementary or different disciplines (e.g., engineering and management) did far better in creating and developing strong roots for later achievement. Indeed, the most successful start-ups were co-founded by technologists and individuals who had marketing or sales experience. The MIT Entrepreneurship Center (E-Center) set out in 1990 to engage students from across all Schools at MIT. This design concept was implemented in our first effort to link MIT faculty research to student learning, the collaborative Innovation Teams (i-Teams) course launched by the E-Center and the MIT Deshpande Center. Mixed teams of students drawn from the MIT Sloan School of Management and the School of Engineering undertook semester-long commercialization projects involving early-stage faculty studies. The integration of engineering students with management students was a clear success in the classroom and has led to countless formations and launches of new innovation-driven companies over the years. The initial i-Teams successes in involving interdisciplinary student teams with early-stage faculty research projects were replicated over the next several years with comparable “venture” courses in energy, linked-data systems, developmental ventures, neurological and brain sciences, and others (led by faculty from several different departments and Schools), with extensive participation from students across all five of the MIT Schools.
28 Further detail on the early history of the MIT entrepreneurship educational programs, the many student clubs, and related MIT organizations and programs that provide support can be found in Roberts and Eesley, 2009 and 2011, as previously cited.

25Entrepreneurship and Innovation at MIT: Continuing Global Growth and Impact |
Internal Entrepreneurship Development Programs
Faculty and staff from the Martin Trust Center and many of the other centers and programs across campus (including the Legatum Center for Development and Entrepreneurship, the Tata Center, and the IDEAS Global Challenge), as well as student-led clubs and activities, have gone beyond the classroom to generate engaging co-curricular programs that attract students from across the Institute to strengthen their entrepreneurial practice and skills.
These include a variety of MIT hackathons that engage students in problem-solving efforts in fields ranging from medicine to the arts, and the Global Founders Skills Accelerator (GFSA). GFSA, initiated by Martin Trust Center Managing Director Bill Aulet, provides a three-month summer capstone educational experience to move student teams from interesting ideas and/or proofs of concept to launch-ready enterprises. In 2015, GFSA received 50% more team applications than the previous year’s 120, with student representatives from 21 different MIT academic departments and programs and several collaborating countries. In 2014, the Trust Center integrated these types of activities through the appointment of five sector practice leaders charged with developing year-long sets of activities in five different “technical” areas, including creative arts. These efforts brought more MIT students together in line with their primary interests and stimulated the formation of new student teams, resulting in such activities as hackathons as well as team applications to GFSA and to the MIT $100K Entrepreneurship Competition (MIT $100K).
MIT’s entrepreneurship-related student clubs and activities are diverse and ever expanding. They include the MIT $100K, the first substantial student organization in entrepreneurship, which started in 1990 and celebrated its 25th anniversary in 2015 with over 1,000 students participating in more than 300 teams. For many years, the competition had six tracks for competing, judging, and awards: Energy; Life Sciences; Web/IT; Mobile; Products and Services; and Emerging Markets. The first-prize winner in each track receives $50,000. This past year, Creative Arts was added as a seventh track, bringing the domains of organized entrepreneurship coaching and competition into the reach of even more students. This key student activity has been complemented by the nationwide Department of Energy–supported Clean Energy Prize, the Water Innovation Prize, the E&I Club, and many others. All of these clubs tied to entrepreneurship are student organized and operated, without faculty or staff oversight. However, they are all based in the Trust Center, facilitating student integration across clubs and Schools in an environment where informal coaching and mentoring by Trust Center staff members and others are readily accessible.
MIT’s Global Entrepreneurial Outreach
In 1998, the student leadership of the MIT $100K decided to help students around the world stimulate entrepreneurship at their own campuses, and formed the MIT Global Startup Workshop. The workshop meets in a different country each year and attracts hundreds of students and faculty, with government representatives from as many as 50 countries or more also attending. Its best-known spinoff, formed by one of its former student chairs, is the MassChallenge, a six-month “acceleration” program that attracts thousands of applicants each year to compete for $1,000,000 in total prizes. This past year the MassChallenge initiated the MassChallenge Israel and the MassChallenge UK competitions, working with those countries to spread entrepreneurial development into their midst.
One of MIT’s earliest educational initiatives in global entrepreneurship was its launch of G-Lab, the Global Entrepreneurship Lab course led by Professors Simon Johnson and Richard Locke (later joined by Yasheng Huang) in which students examine the issues involved in growing new firms in countries other than the United States. Student teams then work for three weeks in a young company of choice outside of the U.S. on a problem designated by its management, helping to define and implement solutions. G-Lab has been expanded with the creation of the country-targeted venture courses of ChinaLab, IndiaLab, and, most recently, IsraelLab.
26Entrepreneurship and Innovation at MIT: Continuing Global Growth and Impact |
These efforts, together with the MIT International Science and Technology Initiatives (MISTI) program (which matches more that 750 students each year with tailored internship, research, and teaching opportunities abroad), the Tata Center, D-Lab programs worldwide, and MIT’s engagement in E&I in Singapore, Russia (through the Skolkovo Institute of Science and Technology), Portugal, China, and Turkey, have broadened MIT’s commitment to sharing its particular approach to entrepreneurship and innovation education more globally. Additionally, MISTI’s Global Startup Labs give MIT students a chance to go into the field and share their entrepreneurship education and passion with young people in a range of developing countries.
Several other major entrepreneurial outreach efforts, developed and operated by the Trust Center, reach beyond current MIT students and staff to the global community of innovators and entrepreneurs. First is the Entrepreneurship Development Program, an intensive weeklong executive education course aimed at individuals from around the world who want to learn about starting and developing their own companies or about facilitating entrepreneurial development in their corporations or regions. Second is the MITx course “Entrepreneurship 101,” which has used the edX online platform to reach almost 100,000 entrepreneurs worldwide, bringing the most committed among them to campus for an in-person boot camp.
More recently, a group of MIT entrepreneurship faculty (including the authors of this study, along with colleagues Professor Scott Stern and Bill Aulet and Phil Budden) have collaborated in developing the Regional Entrepreneurship Acceleration Program (REAP). This two-year educational program brings together teams of stakeholders from eight regions of the world—including entrepreneurs, leaders of large corporations, government officials, university faculty, and risk capital providers—for four workshops over a two-year period to work collectively on policies and actions needed to enhance their own regions’ economic growth through innovation-driven enterprise formation. It is built off the considerable research and educational expertise in innovation and entrepreneurship of MIT’s community, as well as MIT’s growing expertise in policies and programs to shape innovation ecosystems, and constitutes a unique, evidence-based, hands-on approach to economic growth.
Other Key MIT Organizations
A wide range of infrastructure to support innovation broadly, but particularly entrepreneurship, has grown along a continuum from the earliest stages of commercialization and proof of concept to prototyping and venture creation at MIT over the past decade. Its role is to help members of the MIT community move ideas beyond fundamental research to impact through a combination of patenting and licensing, as well as through the provision of mentoring and other support for venture building.
• Translating research: Since 2002, the Deshpande Center for Technological Innovation has supported faculty and students in MIT research laboratories as they seek to translate their research from ideas to application and impact. The center brings in entrepreneurs and venture capitalists to help faculty judge the potential commercial attractiveness of research proposals and advise in the award of grants from $50,000 to $150,000. It has become a role model for government “translational research” programs in various fields, and has assisted many other universities to establish similar entities.
• Intellectual property licensing: MIT’s Technology Licensing Office (TLO), created in 1932, is among the earliest organizations at the Institute that have contributed to MIT entrepreneurship. It was reorganized in 1945 and was largely redirected toward its current activities in the 1980s with the passage of the Bayh-Dole Act. Its role is to help move MIT research toward commercialization, and it engages large corporations, local medium-sized companies, and start-ups by licensing patented MIT research. For years, TLO has helped MIT rank number one among U.S. universities and research institutions in licensing start-ups to build upon its “invented” technologies, averaging 21 new companies annually throughout the 2000s. That
27Entrepreneurship and Innovation at MIT: Continuing Global Growth and Impact |
number rose slightly in the period between 2011 and 2014, with 27 start-ups in 2011 and 22 in each of the following three years. TLO also provides consultation to students, staff, and faculty to assist them in their own independent pursuit of commercialization.
• Mentoring: A range of entities and programs provide mentoring to the MIT community in their venture development. In addition to the student-focused Trust Center and Legatum Center (for those with a developing world focus), the Venture Mentoring Service (VMS) provides guidance to current MIT students, staff, faculty, and local alumni. Through the VMS, a diverse group of 160 current mentors advise more than 250 MIT would-be entrepreneurs—free of charge and of any MIT equity holdings, often well in advance of formal company start-up. Also, the Deshpande Center provides mentoring for earlier stages of translational research, while other programs such as the MIT IDEAS Global Challenge and the MIT $100K provide other mentoring opportunities.
In October 2013, President Rafael Reif challenged the MIT community to build on its strong history and take steps to better serve as one of the world’s most powerful engines of innovation and entrepreneurship. Calling for the creation of an MIT Innovation Initiative (MITii), President Reif recognized that MIT has the capacity—and the responsibility—to carry the advancements of humanity forward and to devise imaginative and innovative solutions to the world’s most daunting problems.
In the newly created posts of associate deans for innovation, Professors Vladimir Bulović (School of Engineering) and Fiona Murray (School of Management) lead MITii in collaboration with many colleagues. This initiative is an Institute-wide, multiyear agenda to educate the next generation of global innovators and prepare them to move their ideas more effectively toward impact by combining hands-on opportunities to build expertise in the innovation process with insights developed from the evidence-based science of innovation. In practical terms, MITii’s activities are intended to enhance the connectivity among the rich and varied educational opportunities around entrepreneurship and innovation at MIT (for students at all educational stages). MITii’s small team of staff and its broad faculty leadership team also target specific projects that are best undertaken in collaboration with all five of MIT’s Schools.
The following strategic activities drive MITii’s programmatic focus:
• Support Capability-building Programs: Support and connect existing on-campus programs while creating a small number of select new Institute-wide innovation and entrepreneurship programs of interest to MIT students and faculty. The key focus for 2015–2016 is to finalize a new undergraduate minor in entrepreneurship and innovation.
• Develop a Collaboration Infrastructure: Create additional infrastructure by expanding maker and collaborative spaces across campus and by creating digital tools that connect them into a unified “innovation-centric” campus accessible to the innovator community from all five MIT Schools.
• Build Innovation Communities: Cultivate innovation communities across MIT and worldwide by connecting the MIT community more deeply with corporations, governments, and innovation hubs in Cambridge and around the world, with an emphasis on creating a small number of innovation nodes as focal points for expanding global innovation and entrepreneurship education.
• Formalize the Science of Innovation: Create and build the Lab for Innovation Science and Policy as a nexus for MIT faculty and scholars across many disciplines interested in rigorous analysis of the conditions that shape desirable innovation outcomes and innovation-driven economic growth, disseminate evidence-based knowledge about innovation and entrepreneurship, and translate that knowledge into tools and frameworks for use by practitioners.
28Entrepreneurship and Innovation at MIT: Continuing Global Growth and Impact |
ENTREPRENEURSHIP AND INNOVATION AT MIT: CONCLUSIONS AND IMPLICATIONS
Well into the second decade of the 21st century, the growth and impact of MIT alumni entrepreneurship continues unabated. This report has reviewed the key findings arising from our 2014 survey of MIT alumni to determine the extent and nature of their innovation and entrepreneurship activities. The new data supplement information gathered in our earlier MIT study. In addition to tracing the entrepreneurship and innovation activities and contributions of MIT alumni, we have updated the progress being made on the MIT campus to strengthen these forms of impact. Below we review some of our key findings and the important questions that they raise for the Institute and for the economy more broadly.
The number of new firms formed each year by MIT alumni is growing. Our rough estimate is that approximately 12,000 new firms were started in the first decade of the 2000s, and at current rates of formation we project the emergence of 18,000 new MIT alumni–founded companies in the current decade. Twenty-five percent of the alumni in the survey (and 35% of follow-up telephone survey respondents) report having started one or more companies. Where will this entrepreneurial energy be directed in coming years; which locations and sectors will benefit?
The median age of first-time founders has been dropping continuously, from 39 years old 40 years ago to about 29 years old today. Much of this is due to the increase in the number of alumni who create their first firm within five years of graduation, rising from 4% among those who graduated in the 1960s to 11% among those graduating in this decade. How will this expanding crop of young entrepreneurs perform? Will fewer years of formal work experience change their outcomes? How should our education change to support these changing career paths?
Joining and starting new companies has become a more frequently chosen career path. More individuals are starting second and third companies. These serial entrepreneurs now comprise 40% or more of all MIT alumni entrepreneurs, and that number is expected to grow. In addition, 22% of alumni are joining early-stage companies shortly after graduation and then many of them become founders themselves. Do these changes reflect broader economic trends and changing patterns of employment (and self-employment) among highly educated young people?
Female alumni have a much smaller but growing presence as founders, but their firms have relatively limited economic impact. Changing this pattern of impact is a significant challenge but represents an important opportunity for MIT to enhance its overall contribution to society. How best can this be accomplished on campus and worldwide?
Beyond entrepreneurship, the evidence is strong that up to one-third of MIT alumni have become inventors, with similar numbers filing patents on their novel ideas and developments. In addition, more than half of reporting alumni identified primary roles in new product development for both young and old existing firms. Is our innovation-oriented education adequate for them to be as successful as possible in these critical roles, and how else can these contributions be supported?
Implications of our Research
Universities with a deep commitment to basic research develop ideas that are at the knowledge frontier. Some, like MIT, also emphasize the application of their ideas to critical problems of global significance, and focus on the ways in which ideas can be developed and scaled up for maximum impact. When the university is able to couple this capability for research with the inclination and resources needed to connect problems and solutions, it generates impressive possibilities for entrepreneurship-based economic impact at the local, regional, national, and global levels.

29Entrepreneurship and Innovation at MIT: Continuing Global Growth and Impact |
A commitment from university leadership to build and maintain attitudes and an institutional culture that rewards and supports taking ideas to implementation at increasing scale is key to achieving this transformative economic impact. Numerous elements must reflect and align with this culture, the most important of which is a set of contractual rules and regulations covering issues ranging from conflict of interest and sponsored research arrangements to technology licensing and consulting; none of these can be accomplished without strong, determined leaders. Lastly, universities need the physical infrastructure, such as maker spaces, collaborative meeting spaces, and traditional laboratories, to support start-ups, spinouts, and corporations.
MIT’s history provides numerous examples of how one major academic institution achieved significant entrepreneurial impact over its first 155 years, and especially in the 100 years since its move to the Cambridge/Kendall Square campus in 1916.
Emphasizing our cultural focus on impact and engagement with real-world challenges, we point to ways that other universities can move toward enhancing their own entrepreneurial impact in their regions. Early examples of engaging the academic with the “real” world, such as the 1916 “Tech Plan,” did much in the mid–20th century to legitimize the idea of technology transfer and commercialization in academia. Big differences between institutional histories of entrepreneurial output can no doubt be explained to a great extent by this distinction in MIT’s founding mission, leadership roles, and behavior.
MIT’s history suggests that every university needs to assess its rules and regulations to ensure that they do not present barriers to faculty participation in industrial consulting and, more vitally, that they do not hinder initiatives taken by faculty and students in new company formation. A shift from impediments toward incentives will take time to accomplish in most academic organizations but will be accelerated if advocates for entrepreneurship pay strict attention to establishing and enforcing strong guidelines against conflicts of interest.
In designing and implementing such rules, the MIT Technology Licensing Office serves as a proactive and supportive-of-entrepreneurship program office that has contributed much to technology transfer from the research labs. The TLO was realigned in this direction 30 years ago and has had the time to mature in its effectiveness. More recently, MIT’s creation of the Venture Mentoring Service, its own form of volunteer “lightweight” but quite effective “incubation,” with clear rules for avoiding conflict of interest, has generated a model of helping that is clearly possible in many other university communities. Additionally, direct, targeted funding of faculty research that has commercial potential, as the MIT Deshpande Center does, is certainly possible elsewhere.
Interestingly, until quite recently, MIT had followed a “hands off” approach toward entrepreneurial engagement and the provision of more resources and infrastructure, in contrast with many other universities in the United States and abroad: MIT has neither created an internal physical incubator space for ventures nor a venture capital fund to enable prospective start-ups. That approach has permitted MIT to avoid the internal conflicts and occasional embarrassments that have plagued other academic institutions that have tried to hasten the entrepreneurship development process. However, MIT has been an active contributor to the vibrant surrounding community that has essentially provided those functions as well as other aspects of a supportive infrastructure for new enterprises. The role of the MIT Investment Management Company in the development of Kendall Square’s start-up and corporate-friendly real estate is worth noting. In less well-endowed regions (or in times of financial constraint), a university may have to provide more proactive support to help get entrepreneurial ventures off the ground.
Beyond the role of MIT’s leadership, the Institute has relied upon growing faculty, student, and alumni initiatives. This has been especially true over the past two-and-half decades. These key developments contributed to the vibrant innovation ecosystem that took root in Kendall Square and

30Entrepreneurship and Innovation at MIT: Continuing Global Growth and Impact |
spread into Boston and Somerville, helping to foster the formation and growth of new and young companies. The formation of the MIT Entrepreneurship Center in 1990 (now the Martin Trust Center for MIT Entrepreneurship) kicked off these activities and change at MIT. Educational opportunities in entrepreneurship for students Institute-wide have expanded, the support and nurture of numerous student clubs linked to entrepreneurship have deepened, and a robust academic and practitioner faculty in entrepreneurship and innovation has been built. These have, in turn, significantly increased the number of people interested and participating in entrepreneurship and innovation, with corresponding growth in their activities and positive outcomes. For institutions deliberately attempting to become rapidly more entrepreneurial, the MIT approach would take a significant amount of patience and self-restraint.
This report demonstrates the extent to which a university’s alumni are the primary drivers for moving its knowledge base to the marketplace for economic impact and social progress. Indeed, the first MIT-linked activities to encourage and assist entrepreneurs were the MIT Alumni Association Seminar Series on how to start a new business (in 1969), followed by alumni-created MIT Venture Clinic in New York City and the MIT Enterprise Forum in Cambridge. Outreach to alumni can be achieved easily in the form of these self-organized seminars, and through faculty visits and lectures, facilitated increasingly by direct distance learning classes and conferences. Organizations such as the MIT Alumni Association and the MIT Enterprise Forum often can be accessed in local communities, perhaps just by joining or partnering instead of needing to replicate the organization, reaching critical mass much sooner along with greater community-level interaction.
Students are increasingly seeking to access strong entrepreneurship and innovation education. Indeed, such education is being extended well beyond the traditional purview of the MBA classroom to undergraduates and even high schools at one end, and to doctoral students and postdoctoral fellows at the other. Such educational programs require long-term investment in faculty who have expertise in the innovation process and the ways in which entrepreneurship can be successfully undertaken. Unfortunately, effective and well-trained academics in these areas are still relatively scarce. Fortunately, two additional avenues provide opportunities to leverage this small faculty core.
First, successful practitioners are available everywhere and MIT’s history indicates that they are often willing and enthusiastic about sharing their time and experience with would-be student entrepreneurs. MIT provides many platforms through which practitioners can engage effectively with students, including student clubs, the VMS, informal seminars, and mentoring and judging the MIT $100K, Clean Energy Prize, and IDEAS Global Challenge. Other mentoring opportunities include serving as “catalysts” on i-Teams, as “board members” in the Global Founders Skills Accelerator, and as advisors to the Translational Fellows Program.
Furthermore, entrepreneurship faculty and practitioners and science and engineering faculty come together to provide a strong educational foundation in entrepreneurship and innovation for students across disciplines.
Today MIT provides various ways for students, leaders, and other stakeholders around the world to become part of our global innovation and entrepreneurship community. For example, MIT students increasingly travel worldwide, sharing their passion for innovation and entrepreneurship and serving as “innovation diplomats” for the Institute, as well as sharing their expertise in competition planning and the start-up process. MIT faculty also are delivering entrepreneurship education beyond traditional student audiences. For instance, the MITx introductory entrepreneurship course has been accessed by over 100,000 people, and among a number of programs in entrepreneurship and innovation education, the aforementioned weeklong intensive Entrepreneurial Development Program can be helpful to those attempting to encourage entrepreneurship, as can Legatum Center and D-Lab workshops in Africa, India, and elsewhere. These efforts are complemented by the MIT Regional Entrepreneurship Acceleration Program, in which teams from more than 25 regions have participated
31Entrepreneurship and Innovation at MIT: Continuing Global Growth and Impact |
to date. MIT’s other global innovation-focused efforts are considerable and have spanned many years and many countries. These range from a multiyear commitment to research-led innovation in Singapore to the more recent announcement of an innovation node for student activities in Hong Kong (providing a platform into Greater China).
In the spirit of research and practice that epitomizes MIT’s approach to education, this report has systematically documented how MIT alumni who have formed new enterprises over the past 75 years have generated dramatic economic impact. We have observed, via our research and our on-campus activities, how various elements have formed an ecosystem that has contributed to making entrepreneurship happen and be successful, and have attempted to communicate the many interwoven components of our university’s entrepreneurial system. In doing so, we also contribute to the burgeoning “science of innovation,” which takes a rigorous approach to the study and analysis of the innovation process, including venture formation.
We hope that our discussion helps show how other universities may strengthen their own entrepreneurial ecosystems and, in turn, amplify their contribution to innovation-driven economic growth in their communities, regions, and nations.
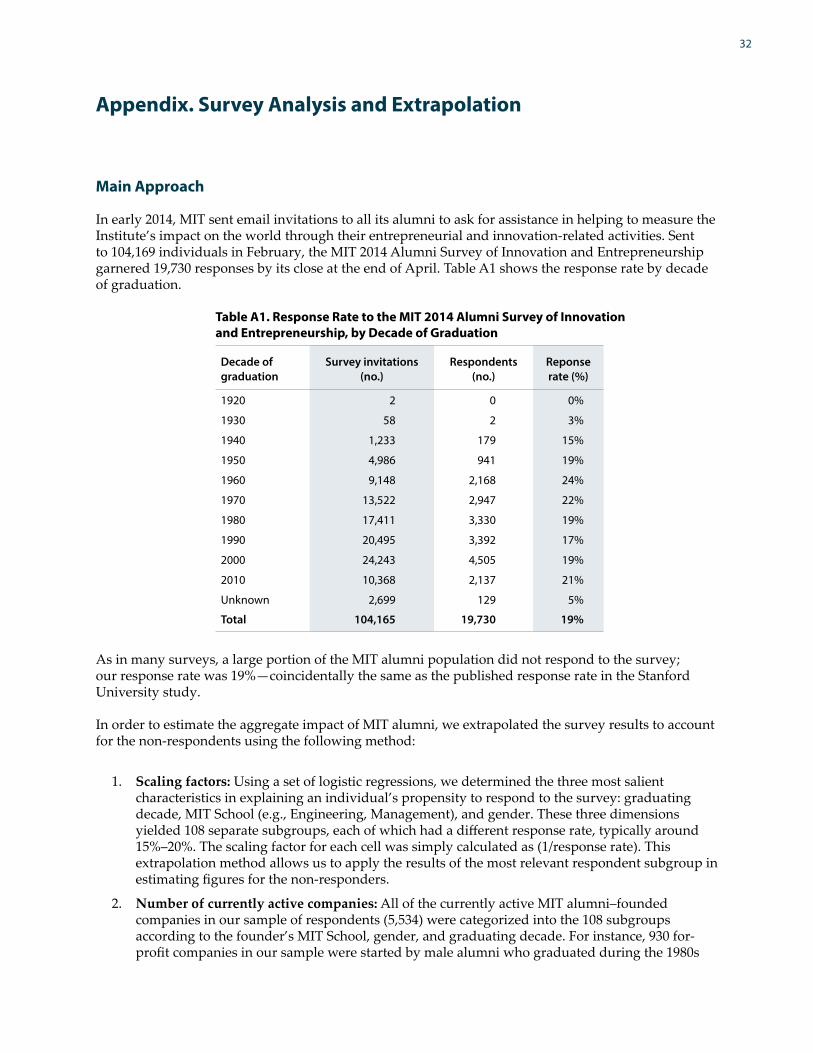
32
Appendix. Survey Analysis and Extrapolation
Main Approach
In early 2014, MIT sent email invitations to all its alumni to ask for assistance in helping to measure the Institute’s impact on the world through their entrepreneurial and innovation-related activities. Sent to 104,169 individuals in February, the MIT 2014 Alumni Survey of Innovation and Entrepreneurship garnered 19,730 responses by its close at the end of April. Table A1 shows the response rate by decade of graduation.
Table A1. Response Rate to the MIT 2014 Alumni Survey of Innovation and Entrepreneurship, by Decade of Graduation
Decade of graduation
Survey invitations (no.)
Respondents (no.)
Reponse rate (%)
1920 2 0 0%
1930 58 2 3%
1940 1,233 179 15%
1950 4,986 941 19%
1960 9,148 2,168 24%
1970 13,522 2,947 22%
1980 17,411 3,330 19%
1990 20,495 3,392 17%
2000 24,243 4,505 19%
2010 10,368 2,137 21%
Unknown 2,699 129 5%
Total 104,165 19,730 19%
As in many surveys, a large portion of the MIT alumni population did not respond to the survey; our response rate was 19%—coincidentally the same as the published response rate in the Stanford University study.
In order to estimate the aggregate impact of MIT alumni, we extrapolated the survey results to account for the non-respondents using the following method:
1. Scaling factors: Using a set of logistic regressions, we determined the three most salient characteristics in explaining an individual’s propensity to respond to the survey: graduating decade, MIT School (e.g., Engineering, Management), and gender. These three dimensions yielded 108 separate subgroups, each of which had a different response rate, typically around 15%–20%. The scaling factor for each cell was simply calculated as (1/response rate). This extrapolation method allows us to apply the results of the most relevant respondent subgroup in estimating figures for the non-responders.
2. Number of currently active companies: All of the currently active MIT alumni–founded companies in our sample of respondents (5,534) were categorized into the 108 subgroups according to the founder’s MIT School, gender, and graduating decade. For instance, 930 for-profit companies in our sample were started by male alumni who graduated during the 1980s

33Entrepreneurship and Innovation at MIT: Continuing Global Growth and Impact |Appendix. Survey Analysis and Extrapolation
from the School of Engineering. Each cell was then multiplied by the scaling factor explained above. When summed up, this yielded an overall estimate of 30,200 currently active MIT alumni–founded companies.
3. Revenues and employment: Entrepreneur respondents provided information on revenues and employment as of 2013 for firms continuing to exist as of 2013. We computed the mean revenue and employment as of 2013 for each of the 108 subgroups. The mean figures were then multiplied to the estimated number of currently active firms for each cell. This resulted in $1.9 trillion in total revenues and 4.6 million jobs as our estimated total current economic impact of MIT living alumni entrepreneurship.
The extrapolation method rests on two key assumptions: (1) The proportion of entrepreneurs among the respondents is equal to the proportion of entrepreneurs among the non-respondents; and (2) the distribution of start-up outcomes for respondent entrepreneurs is the same for the non-respondent entrepreneurs.
Although possible non-response bias (i.e., non-entrepreneurs are less like to respond to a survey focusing on entrepreneurship and innovation) can create an upward bias in our estimates, there are also factors that may cause an underestimation of the true economic impact arising from MIT contributions to entrepreneurship and innovation.
• First, only firms founded or co-founded by MIT alumni are included. Additional data on firms in which MIT alumni were early employees, investors, board members, or advisors are not included.
• Second, many large MIT alumni–founded companies are not represented in the data. Companies such as Hewlett-Packard, Genentech, Intel, Koch Industries, Raytheon, and Texas Instruments are excluded because their MIT alumni founders or co-founders are now deceased. We also limited our analyses to currently existing companies, excluding both closures and mergers and acquisitions by other firms.
• Third, we omitted many other firms that are no longer in business, such as Digital Equipment and Patni Computer Systems, but which made significant economic contributions during their existence.
• Fourth, we are also aware of some successful existing companies founded by current alumni that are not among the survey responses since their MIT alumni founders were likely too busy to respond.
Robustness Checks
Our survey approach assumes that entrepreneurial activity among MIT alumni is evenly dispersed. In this sense, the method of aggregation is “bottom-up” since it assumes that the entrepreneurship rates of the survey respondents are roughly equal to the rates of non-responders of similar characteristics.
In contrast, a “top-down” approach assumes that entrepreneurial success is disproportionately concentrated in a small number of very prolific MIT alumni–founded companies such as Intel and Bose. Indeed, Table 1a shows that the top 2% of all MIT alumni–founded companies in terms of firm size accounts for more than two-thirds of the total jobs created by all companies founded by MIT alumni. The distribution of entrepreneurial success among MIT alumni–founded companies is heavily skewed to the right. Therefore, it would seem reasonable to deduce that capturing the small portion of companies at the right tail of the distribution would account for most of the total entrepreneurial activity by MIT alumni.

34Entrepreneurship and Innovation at MIT: Continuing Global Growth and Impact |Appendix. Survey Analysis and Extrapolation
Our alternative approach focuses on the top public companies founded by MIT alumni as of 2014 —most of which are not included in the survey. We selected the top 18 companies founded by MIT alumni. If this small group of large public corporations captures most of the total entrepreneurial activity, then we would expect the combined revenues of these top companies to exceed the total revenues reported by our survey respondents. In fact, when we sum the revenues of 18 top public companies founded by MIT alumni, they amounted to $247 billion in 2014. In comparison, our survey respondents provided 5,534 currently active firms, which amount to $204 billion total revenue.
Although the concentrated (“top-down”) view is not equivalent to an approach that estimates the total levels of entrepreneurship among all graduates, it provides a baseline comparison to our main extrapolation method for the overall economic impact. Since the combined revenues of 18 companies far exceed the aggregate gross sales of all 5,534 observed companies, it is reasonable to conclude that our main extrapolation method for economic impact yields a conservative estimate given that these 18 companies were not included in the survey; inclusion of these 18 giant public companies would significantly amplify the estimation of the total economic impact of MIT entrepreneurship.
Finally, in October–November 2015, a telephone survey of alumni who had not responded to the online survey was undertaken to ask how many of them had started new firms, as well as a few related questions. This was done to confirm the reliability of the results of the broader web survey. This work was overseen independently by senior staff in the MIT Office of Institutional Research, with the telephone process conducted by current MIT students who are trained volunteers supervised by the MIT Alumni Association (MITAA). The MITAA drew 1,999 alumni from its database using the database’s built-in random function, but limited the draw to those from the Class of 1970 or later who had a U.S. phone number. Of the 1,999 randomly selected, 349 had already responded to the web survey and were removed from the sample. The remaining selected alumni were called and asked to participate in a short survey. When alumni didn’t answer the telephone, they were called again at a different time or on a different day. Of those alumni who were eventually reached by phone, the average number of calls before they answered was three. In total, 254 alumni responded to the survey, resulting in a response rate of 15.4%.