entrepreneurial local governance modes for … texto... · entrepreneurial local governance modes...
TRANSCRIPT
Entrepreneurial local governance modes
for sustainable mobility management.
The case of Portuguese municipalities
Catarina Aroso Monteiro
Supervised by Aurora A.C.Teixeira
Master Thesis Dissertation June 2006
i
Acknowledgments
First I would like to thank my supervisor, Aurora Teixeira, for all the help and patience
that she had in these two years. She was my greatest friend always pushing to do it well
and to do it fast.
Another important friend that I would like to thank is Cristina Queimado, who helped
me in the surveys when I needed the most.
I would also like to thank my best friends, especially Ana Monforte and Marta
Damasceno and my dear colleague Paulo Santos for being such good friends and having
lots of patience during all this time.
My last thank goes to my parents for their support in all my actions.

ii
Abstract Urban mobility has become an international problem and several countries have joined
together in different consortia, signing international agreements and developing projects
with a view to establishing new standards for current mobility levels and the
development of the transport systems of the future.
Despite the ongoing efforts in this field, particularly on the part of the Portuguese
national authorities, there is a need to question the quality of these plans and the way
they are being managed. Even though a description is provided of the measures
presented, it is not yet clear why these measures are not implemented by the local
authorities, especially measures applied to traffic management or those which provide
support to the scientific world with the aim of endorsing better technologies to
overcome these problems.
The main goal of this thesis is to identify the different sustainable mobility strategies
and the corresponding perceptions by local public authorities. Such local governance
aspects have yet to be dealt with appropriately and in a credible way. This shortcoming
is particularly acute in Portugal where sustainable urban mobility management is still
highly underdeveloped and very few studies have been dedicated to the matter. We
provide new evidence on the perceptions and strategies of the Portuguese local public
authorities regarding sustainable urban mobility management. Moreover, we evaluate
the best practices and the inherent factors that contribute to or restrain the development
of mobility plans at the local level.
Through a direct survey of all the Portuguese municipalities, we concluded that
sustainable mobility is not yet a very relevant issue among local authorities. In fact,
from 192 municipalities (out of 308, corresponding to a 62.3% response rate), less than
half (46.6%) claimed to have conducted a mobility study, only 29.7% answered that
they actually have a mobility plan, and a small percentage (18%) claimed to have
conducted a mobility-related survey of their citizens. Moreover, estimates based on a
logit regression indicate that the most mobility-aware municipalities are, on average,
those that have a high employment ratio, have alternative transport (i.e., bicycle) parks
and lanes, have larger and more human capital intensive departments (which are
responsible for mobility issues), have a high auto average age, have included mobility
issues in the urban plan and (somewhat surprisingly) are located in the North.
Keywords: sustainable mobility; local authorities; management

iii
Resumo A mobilidade urbana tornou-se um problema internacional e vários países associaram-
se formando consórcios, assinando acordos internacionais e desenvolvendo projectos
com o intuito de estabelecer novas estratégias para os actuais níveis de mobilidade e
desenvolvimento dos sistemas de transporte do futuro.
Apesar dos esforços neste campo há necessidade de questionar a qualidade desses
planos e a forma como estão a ser geridos, especialmente no caso das autoridades locais
portuguesas. Apesar da descrição dos projectos e medidas apresentadas, não é claro
porque é que essas medidas ainda não estão implementadas pelas autoridades locais,
nomeadamente medidas de controle de tráfego, ou medidas de apoio à comunidade
cientifica para desenvolvimento de tecnologias inovadoras.
O objectivo principal desta tese é identificar diferentes estratégias de mobilidade
sustentável adoptadas pelas autoridades locais portuguesas e a sua percepção face a esta
problemática. A percepção das autoridades locais ainda não foi adequadamente
abordada. Esta falha é ainda mais visível no caso das autoridades portuguesas onde a
gestão da mobilidade sustentável não é ainda uma prioridade, havendo poucos estudos
nesta matéria. No presente trabalho apresentamos evidências relativas à gestão da
mobilidade sustentável. Adicionalmente, avaliamos as melhores práticas e os factores
inerentes que contribuem para o desenvolvimento de planos de mobilidade ao nível
local. Através de um inquérito direccionado a todos os municípios portugueses,
concluímos que a mobilidade sustentável não é ainda uma prioridade das autoridades
locais. De facto, dos 192 municípios respondentes (de um total de 308, uma taxa de
resposta de 62.3%) menos de metade (46.6%) afirma ter concluído um estudo de
mobilidade no município, apenas 29.7% respondeu ter já executado um plano de
mobilidade e uma pequena percentagem (18%) confirma ter realizado um inquérito à
satisfação dos cidadãos do município. As estimativas baseadas em regressão
econométricas indicam que os municípios mais sensíveis ás questões de mobilidade
sustentável são, em média, os que têm departamentos responsáveis pela mobilidade
sustentável, são os de maiores dimensões (em termos de pessoal ao serviço), apresentam
maiores intensidades de capital humano, têm infra-estruturas (faixas próprias, parques)
para transportes alternativos, têm uma elevada taxa de população empregada, têm um
parque automóvel mais antigo, têm as questões da mobilidade já introduzidas no plano
urbano e, algo surpreendente, estão localizados no Norte de Portugal.

iv
Index of Contents
ACKNOWLEDGMENTS...............................................................................................I
ABSTRACT ................................................................................................................. II
RESUMO ............................................................................................................... III
INDEX OF CONTENTS..............................................................................................IV
LIST OF TABLES........................................................................................................VI
LIST OF FIGURES.................................................................................................... VII
ACRONYMS ................................................................................................................IX
INTRODUCTION .......................................................................................................... 1
CHAPTER 1. RELATIONSHIP BETWEEN SUSTAINABLE DEVELOPMENT AND MOBILITY MANAGEMENT..................................................... 4
1.1. DEFINING THE CONCEPTS OF SUSTAINABLE DEVELOPMENT AND MOBILITY MANAGEMENT ....................................................................................................... 4
1.1.1. Sustainable Development................................................................................ 4 1.1.2. Mobility management ..................................................................................... 6
1.2. THEORETICAL UNDERPINNINGS OF THE RELATIONSHIP BETWEEN MOBILITY MANAGEMENT AND SUSTAINABLE DEVELOPMENT ............................................... 11
1.3. MANAGING MOBILITY: A WAY TO ACHIEVE SUSTAINABLE DEVELOPMENT. THE EMPIRICS .............................................................................................................. 13
1.4. THE LOCAL GOVERNMENT’S PERCEPTION OF SUSTAINABLE MOBILITY MANAGEMENT. THE MISSING LINK....................................................................... 19
CHAPTER 2. SUSTAINABLE MOBILITY MANAGEMENT IN A PERIPHERAL ECONOMY................................................................ 24
2.1. SUSTAINABLE MOBILITY IN PORTUGAL. AN HISTORICAL OVERVIEW.................... 24 2.2. SUSTAINABLE MOBILITY IN PORTUGAL AT A DECENTRALISED LEVEL .................. 28
2.2.1. Central versus Local Administration............................................................ 28 2.2.2. Existing measures regarding sustainable mobility at the local level in
Portugal ........................................................................................................ 32
CHAPTER 3. LOCAL GOVERNMENT PERCEPTION OF SUSTAINABLE MOBILITY MANAGEMENT IN A PERIPHERAL ECONOMY. RESULTS FROM A COMPREHENSIVE SURVEY OF PORTUGUESE MUNICIPALITIES.................................................. 40
3.1. METHODOLOGICAL CONSIDERATIONS................................................................... 40 3.1.1. Presentation and justification of the methodology used............................... 40 3.1.2. Representativeness of the respondent sample............................................... 41
3.2. THE DEGREE OF COMMITMENT OF MUNICIPALITIES REGARDING MOBILITY ISSUES – SOME DESCRIPTIVE STATISTICS ............................................................................ 44
3.3. THE DEGREE OF INTERVENTION OF THE MUNICIPALITIES WITH REGARD TO SUSTAINABLE MOBILITY....................................................................................... 48
3.3.1. Public transportation.................................................................................... 48 3.3.2. Private transportation................................................................................... 55 3.3.3. Alternative transportation............................................................................. 59

v
3.4. SUSTAINABLE MOBILITY-RELATED KNOWLEDGE AND PLANNING CAPACITY OF PORTUGUESE MUNICIPALITIES ............................................................................. 63
3.5. SENSIBILITY AND SUSTAINABLE MOBILITY MEASURES AT THE LEVEL OF PORTUGUESE MUNICIPALITIES. WHAT IS THE RELATION? .................................... 75
3.5.1. Aims and model specification ....................................................................... 75 3.5.2. Estimation results ......................................................................................... 81
CONCLUSION ............................................................................................................. 83
REFERENCES.............................................................................................................. 88
APPENDIX 1: INQUIRY TO THE PORTUGUESE MUNICIPALITIES............. 94
APPENDIX 2: BEST AND THE WORST RANKED MUNICIPALITIES AND REGIONS IN THE SELECTED INDICATORS .............................. 96

vi
List of Tables
Table 1: Type and evolution of land transportation in the EU15, 1970-2000 .................. 9
Table 2: Overview of the most important documents and projects in the EU’s
frameworks targeting sustainable mobility............................................................. 18
Table 3: Mobility management strategies adopted in three benchmarking cities........... 21
Table 4: Permanent measures introduced within the scope of the European campaign
“European Mobility Week” up to 2003 .................................................................. 33
Table 5: Measures adopted by different Portuguese municipalities in the last 6 years .. 36
Table 6: Regional representativeness of the respondent municipalities by NUTs III .... 42
Table 7: Position of the person that responded to the survey ......................................... 45
Table 8: Departments in charge of mobility issues......................................................... 45
Table 9: Public transportation companies (by groups) operating in the municipalities . 49
Table 10: Distribution of bus schedules and route information in different municipalities
................................................................................................................................ 54
Table 11: Linear Pearson Correlation estimates (municipalities)................................... 61
Table 12: Linear Pearson Correlation estimates (municipalities)................................... 63
Table 13: Distribution of municipalities by programmes that integrate mobility
management and urban planning ............................................................................ 72
Table 14: Different mobility indicators mentioned in the urban plan ............................ 74
Table 15: Determinants of the Portuguese municipalities’ sensibility regarding
sustainable mobility ................................................................................................ 80
Table 16: Determinants of the Portuguese municipalities’ sensibility regarding
sustainable mobility ................................................................................................ 96

vii
List of Figures
Figure 1: The three key features of sustainable development .......................................... 5
Figure 2: Movement of people by mode 1850-1990 ........................................................ 7
Figure 3: Evolution of kilometres made by car in some EU15 countries during the last
30 years. ........................................................................................................... 10
Figure 4: Evolution of the GDP, population and vehicles in circulation, 1990-2002 .... 25
Figure 5: Evolution of passenger vehicles traffic – intensity per capita between 1990
and 1997........................................................................................................... 26
Figure 6: Representativeness of the respondent municipalities by NUTs II .................. 43
Figure 7: Characteristics of the respondent municipalities versus total Portuguese
municipalities................................................................................................... 43
Figure 8: Municipalities’ commitment to mobility issues and human capital intensity, by
NUTs III........................................................................................................... 46
Figure 9: Municipalities with multimodal tickets and number of public transport
operators........................................................................................................... 50
Figure 10: Existence and (average) number of public transport passes by NUTs III..... 52
Figure 11: Priority lanes for buses and schedule and route information availability ..... 53
Figure 12: Rail transports by municipalities................................................................... 55
Figure 13: Vehicle intensity (by employed and total population) and private parks
(existing and predicted in the next three years) by NUTs III .......................... 56
Figure 14: Number of private vehicles and the distribution of non-paid private vehicle
parks................................................................................................................. 57
Figure 15: Freight intensity by total population (average) and existing and predicted (in
the next three years) freight parks (% total municipalities in each NUTs III). 59
Figure 16: Relation between the percentage of municipalities in each NUTs III having
and predicting increase in bicycle parks and their Education and Cultural, and
Development Index.......................................................................................... 60
Figure 17: Relation between the percentage of municipalities in each NUTs III having
and predicting an increase in bicycle parks and their Education and Cultural,
and Development Index ................................................................................... 62
Figure 18: Relation between the percentage of municipalities in each NUTs III having
mobility studies, mobility plans and mobility surveys .................................... 65

viii
Figure 19: Relation between the percentage of municipalities in each NUTs III
possessing at least one of the measures, at least two of the measures or all
three measures.................................................................................................. 66
Figure 20: Evolution of municipalities’ mobility studies distribution (in %) between
1991 and 2005.................................................................................................. 67
Figure 21: Relation between the percentage of municipalities in each NUTs III having
mobility studies and Development Index and ratio of educated workers in the
mobility issues department .............................................................................. 68
Figure 22: Evolution of municipalities’ mobility plans distribution (in %) between 1980
and 2005........................................................................................................... 69
Figure 23: Relation between the percentage of municipalities in each NUTs III having
mobility plans and the Development Index and ratio of educated workers in
the mobility issues department ........................................................................ 70
Figure 24: Relation between the percentage of municipalities in each NUTs III with
mobility surveys and the Development Index and ratio of educated workers in
the mobility issues department ........................................................................ 71
Figure 25: Relation between the percentage of municipalities in each NUTs III having
urban programmes and percentage of municipalities in each NUTs III having
mobility issues included in urban plans. .......................................................... 73
ix
Acronyms
BUGAS – Aveiro Free Use Bicycles
CCDR – Regional and Development Coordination Commission
CE – European Commission
CEC – Commission of the European Communities
CFS – Community Support Framework
CITIVAS – Cleaner and Better Transport in Cities
CST – Centre for Sustainable Transportation
EAP – Environmental Action Program
EC – European Commission
ELTIS – European Local Transport Information Service
ENDS – National Strategy for Sustainable Development
EU – European Union
FP – Framework Program
GDP – Gross Domestic Product
GHG – Green House Gas
IA – Instituto de Ambiente
IST – Instituto Superior Técnico
MC – Ministério das Cidades
MCOTA – Ministério das Cidades Ordenamento do Território e Ambiente
MOST – Mobility Management Strategies for the Next Decades
MOST – Moving on Sustainable Transportation
MTB – Ministério dos Transportes Brasileiros
NOVEM – Nederlandse Organisatie Voor Energie en Milieu
OECD – Organisation for Economic Co-operation and Development
OJEC – Official Journal of the European Community

x
ONU – Organisation of United Nations
PNAC – National Programme for Climatic Changes
POLIS – Cities and Regions Networking for Innovative Transports Solutions
POLIS – Programme for Urban Regeneration and Environmental Improvement of Cities
PRIME – Incentives for the Modernization of the Economy Programme
PROSIURB – Program For Consolidation of the National Urban System
PRU – Urban Rehabilitation Programme
PTEN – Programme for the Reductions of National Emissions
TAPESTRY – Travel Awareness Public and Education Supporting a Sustainable
Transport Strategy in Europe
TC – Transports of Canada
TfL – Transport for London
TRB – Transportation Research Board
UITP – International Unit of Public Transportation
UN – United Nations
UNCED – United Nations Conference on Environment and Development

1
Introduction
Cities are home to more people than ever before. In 1900, only a tenth of the world
population lived in cities. In the 21st century, in contrast, half of the world population
lives in urban areas (O’Meara, 1999).
Urban development has produced a phenomenon of intense and rapid concentration of
people and activities in urban centres (Portugal, 2004), particularly marked by the
development of large metropolises with highly distinctive evolutionary dynamics
(Costa, 2003). Thus every world region suffers from car-choked urban areas.
Transportation, especially road traffic, is now the fastest-growing contributor to the
decline in quality of life and environmental degradation. Nowadays, large cities have
achieved expansion through processes which are closely associated to noise, pollution,
traffic, insecurity, and chaotic urbanism (Monteiro et al., 2004).
The geographer John Adams has argued that mobility societies have became
increasingly more polarised, more dispersed, more anonymous, less child-friendly, less
culturally distinctive, more crime-ridden and less democratic (Fahimuddin, 2002).
Thus, it is vital that new sustainable principles and guidelines be implemented. In this
context, and in order to countervail the current urban situation, it is important to apply
sustainable policies to urban planning. In effect, these policies have to be economically
feasible, socially acceptable and friendly to the environment.
Within urban planning, urban mobility management is one of the most important
features in achieving sustainability (Scaringella, 2001). Spatial mobility is now more
than ever at the heart of human activity. The Greek philosopher Heraclitus once
summarised his view on the world in two words, panta rei, meaning “everything is in
motion” (Banister, 2000). In our opinion, this statement still engages the current modern
world.
The emergence of this social and environment issue associated to mobility management
can be found at the core of the different projects presented by entities such as the
European Union (Euro-Cases, 1998). The matter has also been studied from different
yet interrelated perspectives, namely the World Commission Urban 21 (Gilbert, 2000),
the European concerns and strategies to diminish the green house effect (Rodenburg et
al., 2002), and concerns regarding the interface between transports and the Kyoto
protocol (Hook, 1998).

2
Although measures to integrate transportation and development strategies (e.g.,
sustainable mobility management and traffic management) have been introduced in
recent decades, their implementation at the local level has not yet been adequately
studied.
It is important to stress that these integration efforts at the local level are gaining
increasing support from architects, who emphasise the importance of regional planning,
for instance in creating streets and paths that pedestrians and cyclists are able to use
(Cera, 2003). However, noticeable limitations in these projects may be pointed out as
the majority have not been really integrated, that is, built around existing public
transportation networks, so that citizens cease to use their cars to get to most places
(Sheehan, 2001).
Policies to promote urban development around public transportation and other
alternative transports and remove incentives to sprawl are far easier to recommend than
to put in practice (O’Meara, 1999). In fact, achieving a state of sustainable mobility
means assigning more responsibility to the local authorities and to civil society and new
challenges for the organisation and management of transport systems (Scaringella,
2001).
With this view in mind, the analysis of the different current mobility management
strategies represents a necessary tool in promoting the information and knowledge
which are essential to our understanding of new specifications within urban
organisation.
The main goal of this thesis is to identify the different sustainable mobility strategies
and the corresponding perceptions of local public authorities. Such local governance
aspects have yet to be dealt with appropriately and in a credible way. This shortcoming
is particularly acute in Portugal where sustainable urban mobility management is still
highly underdeveloped and very few studies have been dedicated to the matter. To this
end, we provide new evidence on the perceptions and strategies of the Portuguese local
public authorities regarding sustainable urban mobility, based on a direct survey of all
(308) Portuguese municipalities. We seek to describe the best practices and the inherent
factors that contribute or restrain the development of mobility plans.
Given the absence of databases on these matters, we have devised a direct survey of all
the Portuguese municipalities through which new evidence was gathered on the
3
perceptions and strategies of the Portuguese local public authorities regarding
sustainable urban mobility management.
The data collected permits an evaluation of the best practices and the inherent factors
that contribute to or restrain the development of mobility plans at the local level in
Portugal. In particular, it provides answers to a third of our main research questions,
which are the following:
1. What is the present status of sustainable mobility management policies at the
European level?
2. Is Portugal catching up in terms of sustainable mobility management policies?
3. What is the sensibility or perception of Portuguese local authorities regarding
sustainable mobility issues? Are they aware?
The thesis is divided in three chapters. The first chapter provides a definition and a
theoretical analysis of the relationship between sustainable development and mobility
management and same of the measures already presented in the world. The state of art
of the existing sustainable measures in mobility management in Portuguese
municipalities is presented in the second chapter. In the third chapter is provided the
methodology for analysing the perceptions and strategies of Portuguese local public
authorities, regarding sustainable urban mobility, the results and interpretations of the
survey applied to all the local authorities in Portugal. Finally, in the Conclusions, we
systematise the study’s main results and contributions.

4
Chapter 1. Relationship between Sustainable Development
and Mobility Management
1.1. Defining the concepts of Sustainable Development and Mobility
Management
1.1.1. Sustainable Development
Environmental issues are today more than ever one of the major concerns of our society.
The high deterioration of quality of life conditions in big cities has contributed to a
global environmental policy named sustainable development (Monteiro et al., 2004).
Sustainable development is an ambiguous and slippery concept. Who can possibly be
against something that invokes alluring images of untouched wilderness? The difficulty
comes in trying to conciliate “development” with “sustainable”.
Sustainable development has been interpreted in many different ways. Sometimes it is
used to emphasise the importance of continued and steady economic growth (Nordhaus,
1991, 1992). In other circumstances it is restricted to an ecological target (Wilson,
1988). Although the concept of sustainable is largely discussed on theoretical grounds,
its implementation has been hard to achieve given the high controversy that surrounds
it. On account of all the different interpretations of the concept, there is a need to be
quite explicit every time it is used.
In 1987 the World Commission on Environment and Development led the United
Nations (UNDEC - United Nations Conference on Environment and Development) to
publish the document “Our Common Future”, also known as the Brundtland report
(UN, 1997). According to the report, sustainable development is “development which
meets the needs of the present without compromising the ability of future generations to
meet their own needs” (Taylor, 1998: 1). Moreover, it concludes that preserving the
environment, addressing global inequities and fighting poverty, could stimulate
economic growth by promoting sustainable development since the “attempt to maintain
social and ecological stability through old approaches to development and
environmental protection will increase instability” (Runyan et al., 2002: 33).
From the definition of sustainable development in the Brundtland report it is clear that
this concept does not only imply its economic impact on the environment. In fact,

5
economic feasibility, the environment and the welfare of the society constitute the basic
triangle (cf. Figure 1) that supports sustainable development. This justifies why the
European Union elected Sustainable Development as a priority political action (Euro-
Cases, 1998). The aim is to promote quality of life, and the well-ordered access to
natural resources in such a way that permanent damage can be prevented. The
environment surrounding urban development it is no longer a hostile space that has to
be controlled to become a cultural representation of society.
Figure 1: The three key features of sustainable development
Source: CST (2002: 3)
More recently, in 1992, many countries and 117 heads of state participated in the
groundbreaking UN Conference on Environment and Development in Rio de Janeiro,
Brazil, The Earth Summit, which declared that “the right to development must be
fulfilled so as to equitably meet developmental and environmental needs of present and
future generations”.1
Sustainable development must therefore be more than merely “protecting” the
environment; it requires economic and social change to reduce the need for
environmental protection.
It was clear from the outset that sustainable development has global, national and local
dimensions and that all three should be targeted. Thus cities provide enormous,
1 At http://www.ecouncil.ac.cr/about/ftp/riodoc.htm accessed on 05.10.31.
6
untapped opportunities to solve environmental challenges, and local governments can
and must pioneer new approaches to sustainable development and urban management.
Jorge E. Connell, Chair of the National Round Table on the Environment and the
Economy said “it has become apparent that almost every issue of sustainable
development which emerges at a local level will be replicated, in one form or another, at
a provincial, national and international levels” (Roseland, 1992: 21).
1.1.2. Mobility management
Throughout the 20th century it was possible to observe several exponential growths,
such as the increase of population, urban area development and the rise of transportation
demand (Fahimuddin, 2002). Although the population is now achieving a balance,
transportation demand has achieved an unbearable magnitude (Fahimuddin, 2002).
According to the OECD (1999) the negative effects of the transport sector on the
environment are growing faster than the negative effects caused by any other economic
sector. The escalation of mobility patterns has led authorities to address issues like
urban sprawl and separation of the population from activities and urban services, the
adoption of non-environmental transportation, the inefficiency of public transportation,
noise, pollution and traffic (Giorgi, 2003).
Transport infrastructures consume about 15-40% of land in urban areas. Road traffic,
which is the most intensive mode of traffic, occupies 93% of the total land used for
transport in the European Union, while railways are responsible for 4% of the land take,
and airports for less than 1% (Herala, 2003).
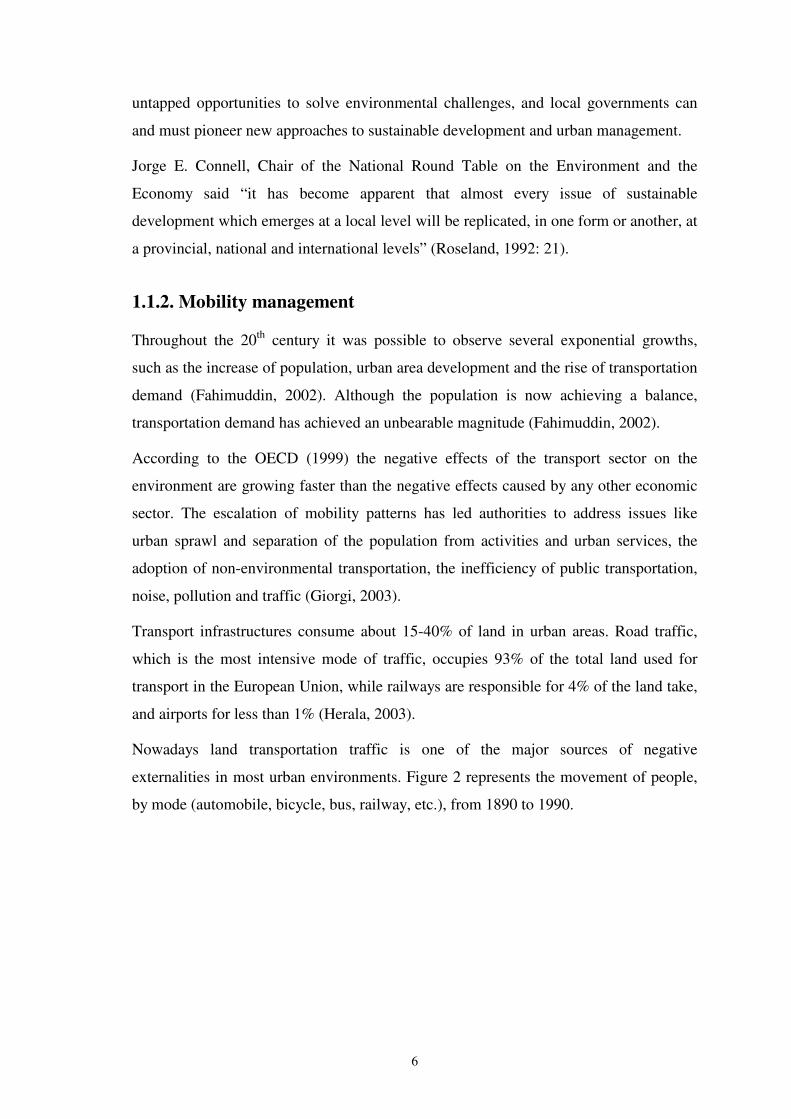
Nowadays land transportation traffic is one of the major sources of negative
externalities in most urban environments. Figure 2 represents the movement of people,
by mode (automobile, bicycle, bus, railway, etc.), from 1890 to 1990.
7
Figure 2: Movement of people by mode 1850-1990
Source: Gilbert (2000: 13)
Current trends in transport indicate that the system is moving away from sustainability.
High economic growth rates and rising urban income have led to high levels of motor
vehicle ownership, particularly the automobile (Chin, 2000). Private vehicles currently
represent more of a social status rather than a mobility need, and it can be very difficult
to convince people to abandon this commodity especially in cities were public
transportation is deficient.
However, there is a relationship between the structure of cities and the traffic flows in
them. Several researches have highlighted the fact that travel patterns and therefore fuel
consumption and pollutant emissions are strongly related to land use and the degree of
“compactness” of towns (Herala, 2003).
In rich countries, such as the US, Canada and Australia, the urban area is growing at
much higher rates when compared to population growth (Gilbert, 2000), and as
expected, small urban centres typical of Australia and the US, as with almost all
peripheral cities, result in a much higher demand for transport dominated by cars
(Scheurer, 2001). In contrast, the higher densities are to be found in Asia and in Europe,

8
where they are associated with a lower demand for transport and the higher importance
of public and non-motorised transport.
Still, it is not easy to characterise urban mobility patterns, as it is a multifaceted
phenomenon, which is related to factors such as the cities’ internal organisation, the
proximity of other urban areas and the relationships and functionalities of each city. The
National Academy of Science even states that large urban patterns were entirely shaped
by the car, emerging after the construction of main roads.
Transport growth and urban mobility problems in large metropolises started worrying
the authorities as far back as the 1960s, at a time when on average there was one car for
every two inhabitants (TRB, 2001).
In the US, traffic operators are facing meaningful changes in the attraction and retention
of users. However, private roadway transportation still has a very important function in
the transport system of most of the US towns (TRB, 2001).
Traffic problems however are more important in Canada’s strategies when compared to
the US’s, as Canada spent efforts and resources to ensure that public services should be
comfortable and reliable. Nonetheless, an enormous number of factors have an
influence on the different approaches of these two neighbouring countries, such as
different taxes on motorised vehicles and on fuel or the efforts made to control urban
development to preserve the history of towns.2
The European Union (EU), through its policies to eliminate physical borders and to
promote the single market, has given a significant boost to the growth of transports,
facing, nevertheless, the same problems and issues of urban mobility as the countries
mentioned earlier. In fact, the daily distance made on average by a person, between
1975 and 1995, has doubled and presently 75% of the daily trips are done by car
(Rodenburg et al., 2002). Yet, a fifth of all the kilometres made correspond to daily trips
of less than 15 km and around 7500 km of roads are blocked daily by traffic jams (CE,
2003). Traffic congestion is growing in all urban areas and has a measurable impact on
an economy. Congestion cost in 2003 reached, on average, 2% of the GDP or 120
billion just in Europe (15 countries) (UITP, 2003).
On the other hand, and adding to this scenario, we can also mention that railway
transport has suffered a 22% decline, in spite of the differences among several State 2 At http://www.tc.gc.ca, accessed 2005-01-23.

9
Members (EC, 2003).
The expansion of urban regions increases the number of trips made by their residents.
Table 1 presents land transport types in the 15 European Countries and their evolution
between 1970 and 2000. The constant growth in the demand for mobility is proved by
the increase in the number of cars in this period of time. In 2000, 177 million cars were
registered in EU15, an impressive increase of 215% in three decades.
So we can understand why transportation, by itself, represents around 10% of the
European Gross Domestic Product (GDP). It is an industry that is worth around 1
trillion Euros per year and employs more than ten million (CE, 2003).
Table 1: Type and evolution of land transportation in the EU15, 1970-2000
Transport types 1970 1980 1990 1995 1996 1999 2000 Tx. c.
m. a.
Passenger cars (millions) 82.48 103.21 143.27 180.00 169.03 173.76 177.30 2.6%
Buses, Coaches (1000) 331 444 484 486 510 525 535 1.6% Roadway
Freight vehicles (1) (1000) 7 480 10 842 17 399 19 795 21 998 22 855 23 671 3.9%
Locomotives and Railcars (units) 49 969 46 639 44 524 40 042 38 787 38 330 38 280 -0.8%
Passenger transportation (Units)(2)
97 581 95 735 84 386 79 046 76 507 77 130 76 185 -0.8% Railway
Freight wagons (units) 1509 1218 888 827 522 517 * -3.6%
(1) Lorries and trucks (2) Coaches, rail cars and trailers; estimates in italic; * No information available Source: EC (2003: 35)
Not surprisingly, between 1970 and 2000, the highest annual average growth in
registered cars occurs in countries such as Greece, Portugal and Spain, whereas the
lowest averages occur in Sweden and Denmark (EC, 2003).
Figure 3 presents the evolution of kilometres made by car in some EU15 countries
during the last 30 years.

10
0 100 200 300 400 500 600 700 800 900
1970
1980
1990
1995
1996
1997
1998
1999
2000
Denmark 333848545857586767
Spain 77172220262272283296325332
Netherlands 87108139143143146146151152
UK 304396800809819828830826825
P o rtuga l 142941616671768287
197019801990199519961997199819992000
Figure 3: Evolution of kilometres made by car in some EU15 countries during the last
30 years. Source: Adapted from EC (2003: 35)
There is no significant variation in the annual kilometre average growth rate in the
chosen countries. Portugal has a rate of 6.0%, Spain 4.8%, the UK 3.3% and the
Netherlands 1.8%. As expected, in this respect, Portugal and Spain have the highest
kilometre growth rate.
In developing countries this expansion is more in keeping with population growth, but
the increase in the corresponding trips may be considered large (Gilbert, 2000). We
could assume that, in developing countries, one of the major challenges of present-day
urban planning is to control the increase of traffic in urban areas. Different practices
have also already been documented as is the case for Singapore (e.g. Chin, 2000) or for
Bangladesh (e.g. Fahimuddin, 2002).
To combat theses new urban pathologies, in a period were the development applied to
cities has an enormous impact on the stability and quality of urban life, it is necessary to

11
reflect on urban development using an integrated policy – sustainable development –
which is economically feasible, socially acceptable and friendly to the environment.
1.2. Theoretical underpinnings of the relationship between mobility
management and sustainable development
In the 1960s, many people around the world began to face critical environmental issues
in their communities. Despite the lack of any legal obligation at the Community level
regarding urban mobility, the 1957 Rome Treaty determined that the EU had the
responsibility to carry out a common transport policy.
A few scientists began to speak out about the global interconnectedness of
environmental problems, warning that societies were becoming victims of their own
success (Flavin, 2002). Since then the environment and urban development became two
inseparable themes.
In 1989 the European Commission presented the first green paper on the European
environment, dealing with, amongst other matters, sustainable urban development
(NOVEM, 2001).
In 1991 the EC Directorate-General for the environment established the Expert Group
on the Urban Environment, an authoritative group of national representatives and
independent experts. Their mission was to develop ideas pursuing sustainability in
European urban settings.
It was only in 1992, with the Maastricht Treaty, that an actual capacity to intervene in
the area of transports was given to the EC (CE, 2003). It was also in the European
Community Treaty that the principles to protect the environment, which had to be
integrated with transport management so as to promote sustainable development, were
established (Herala, 2003).
In 1992, at the Rio Summit, the participating countries adopted Agenda 21, a document
for action that called for the improvement of quality of life on Earth through the more
efficient use of natural resources, the protection of global assets, better management of
human settlements, and the reduction of pollutants and chemical waste (Runyan et al.,
2002). Among other urban matters, Agenda 21 also discussed transports and included a
global implementation plan for sustainable development. An agreement was reached on
the promotion of policies and land-use planning, transport systems and logistics systems
12
aimed at increasing energy efficiency, reducing pollution and traffic jams, and
improving quality of life standards (UN, 2003).
The Fifth Environmental Action Programme (5th EAP), which took place between 1992
and 1999, laid out the main priority environmental objectives towards sustainability
(OJEC, 1993). The 5th EAP also represented the starting point for the implementation of
Agenda 21 (Herala, 2003) by the Community and its Member States. Among all the
European cities involved in sustainable development management, 75% stated that
Agenda 21 policies shaped their urban policies (NOVEM, 2001).
In 1994 the first European Conference on Urban Sustainability was organized in the city
of Aalborg. The principles for sustainable development in urban areas, based on the
European Sustainable Cities Report, were also presented in that year.
This report had four major points of action:
1. The principle of urban management towards sustainability is essentially a political
process, which requires planning and has impact on urban governance.
2. The principle of policy integration: coordination and integration should be achieved
through the combination of the subsidiary principle with the wider concepts of
shared responsibility.
3. The principle of ecosystems thinking: the city as a complex system which is
characterised by continuous processes of change and development.
4. The principle of cooperation and partnership among different levels, organisations
and interests.
The Kyoto Protocol was signed in 1997, where countries agreed that the developed
countries and economics in transition to market economies should reduce six
greenhouse gas emissions by roughly 5% from 1990 levels (Hook, 1998). The Kyoto
Protocol emerged as an attempt to urge governments to control GHG from the
transports sector, imposing limit values and proposing strategies to achieve them.
However, some countries like the US and Australia did not sign the Protocol. In
countries like the US, government actions to achieve sustainable mobility do not go
beyond restrictions to air quality or the improvement of fuel efficiency (UN, 1997).
At the beginning of the 21st century the European Commission adopted the Sixth
Environmental Action Programme (6th EAP) for a 10-year period. One of the objectives

13
of this programme is to provide best practices and transport management policies in
order to curb the excessive demand for mobility (CEC, 2001).
In 2003 two new directives were issued designed to boost the transport sector’s move
towards a more sustainable management. The first law aimed at making the Member
States comply with the use of biofuel or other renewable fuels in transports. The second
law was directed at the transport of goods by rail, aimed at facilitating an increase in the
liberalisation of the sector in what concerns the transport of freight (Silva, 2003).3
But if for citizens the association of urban development with sustainability is already
present in principle and in discourse, carrying through means hard work and is full of
challenges. Any honest assessment of the last 10 years leads to the conclusion that the
world has made little progress in addressing the major problems that the Rio Summit set
out to tackle (Brown et al., 2001).
The application of this concept to daily life requires both government and private
administration measures, but it also means that there has to be an international
consensus on the matter. The key component of sustainable development is changing
human attitudes to preventive environmental actions (Monteiro et al., 2004).
As Brazil’s President Cardoso said of the World Summit agenda “failure is not an
option” (Flavin, 2002:39).
1.3. Managing mobility: a way to achieve sustainable development.
The empirics
Development of transport infrastructure is often directly linked to the expansion of
urban areas, which in turn increases the demand for transportation. Those dependent on
walking, cycling and public transport are suffering from decreasing access to social and
economic opportunities because of changes in land use patterns (Herala, 2003).
If it is accepted that it will never be possible or even desirable for most of the
population to own cars, then the ultimate objective of a fair, environmentally and
socially sustainable transport policy should be the creation of a transport and land use
system that allows every citizen the possibility to lead a full and satisfying life without
the need to own a car (OECD, 1999).
3 Directive no. 2003/30/EC dated 2003-05-08 at http://www.diramb.gov.pt/ accessed on 2005-01-18.

14
An innovative view of sustainable transportation requires an intermodal system both in
passenger and freight transportation. To create this intermodal approach it is necessary
to overcome several obstacles and there must be appropriate policy and decision-
making systems that incorporate genuine public participation (Szyliowicz, 2003). This
approach also has economic benefits, for instance, public transportation brings
employment as it creates 2-3 times more jobs than private transportation (UITP, 2003).
The application of innovative and efficient technologies can also offer new
opportunities to reach a more balanced development in the transport sector. However, to
some researchers only the combination of environmental policies and a change in
societal behaviour can accomplish the sustainable use and management of mobility
(Scaringella, 2001).
Creating a better future requires acting now for a more balanced present, and
governments and businesses in all sectors need to be committed to policies and
programmes that improve current mobility trends and patterns.
Urban mobility has become an international problem and several countries gather in
consortia to sign international agreements and developed projects with the aim of
changing current mobility patterns, and guiding the transportation sector to a better
future. There is however a remaining question, are these projects able to change the
current situation of the transportation sector?
The OECD and the EU have developed principles of sustainable transport and
sustainable traffic to tackle the growth of traffic in the last few years. Different
strategies centred on sustainable mobility and environmentally-friendly transportation
have been presented in different countries but so far limited success as been recorded
(Gudmundsson, 2003). With the introduction of the 5th Framework Programme (FP), in
1998, the European Union launched several projects, all intending to reduce the number
of circulating cars and, consequently, to reduce the greenhouse-effect (Herala, 2003).
EU policies frequently have some bearing on local authorities. In fact, around 80% of
European cities receive financing from European entities (NOVEM, 2001).
The sustainability of urban mobility was adopted by different associations, such as
POLIS (Cities and Regions Networking for Innovative Transports Solutions), for
example, and was applied in countless projects developed by different EU institutions.
The POLIS association is a network of 65 members, including local authorities, public
15
transport organisations, among others, in 18 countries. This network aims to lead
European cities and regions to work together to develop innovative technologies and
policies for local transport.4
In the beginning, POLIS’s main areas of interest were defined by the different European
Community Framework Programmes, but with the introduction of the priorities
allocated to sustainable development in the 1990s, POLIS members specialised in some
areas. Among POLIS’s most notable achievements, we can find projects in areas such
as:
• Public transport - the projects developed include defining priority strategies for
public transport and identifying the impact of these policies within the scope of
large pilot urban areas.
• Mobility services – the projects developed are designed to promote the concept of
car pooling as an option among mobility service operators.
• Traffic management and information – the projects in this area develop software
to improve pedestrian and public transport circulation, and here we can find the best
practices for intermodal traffic, for example. The VOYAGER project, developed in
the framework of the 5th FP, is one example of these projects.5 This project
developed the ELTIS portal (European Local Transport Information Service). This
portal is an information service on local transport, news, events, policies and
practices implemented in different cities of Europe. ELTIS aims to provide
information and support the exchange of knowledge and practical experience in the
area of urban and regional transport.6
• Environmentally friendly transport – in this particular area projects for the
demonstration, evolution and promotion of more ecological transport are presented.
• Integrated strategies – this area covers projects which include innovative measures
to promote the development of attractive alternatives to the use of private cars in
cities, to improve public transport systems and to manage the logistics within urban
areas efficiently. An example of these projects is CIVITAS (Cleaner and Better
Transports in Cities), a project that aims to lead transport systems towards a more
4 At http://www.polis-online.org/, accessed on 2004-12-27. 5 At http://www.uitp.com accessed on 2006-03-02. 6 At http://www.eltis.org/, accessed 2004-12-27.

16
sustainable use through the combination of technologies and strategic policies.7
Based on the CIVITAS initiative, four projects were developed:
- TRENDSETTER – a project that aims to improve air quality, to reduce noise and
traffic jams.8 As pilot-cities we have Graz (Austria), Lille (France), Pecs
(Hungary), Prague (Czech Republic) and Stockholm (Sweden).
- VIVALDI – this project aims to demonstrate an innovative transport strategy and
to measure and assess its contribution to the improvement of urban policies.9
The pilot-cities which participated in this project were Aalborg (Denmark),
Bremen (Germany), Bristol (Great Britain), Kaunas (Lithuania) and Nantes
(France).
- TELLUS – this project aims to improve and increase public transport systems
and non-motorised transport such as bicycles.10 A priority is also to reduce
traffic jams and the level of noise and air pollution resulting from traffic, as well
as to increase political and public accountability. The pilot-cities are Rotterdam
(Holland), Bucharest (Romania), Gdynia (Poland), Berlin (Germany) and
Göteborg (Sweden).
- MIRACLES – this project intends to combine innovation, technology, urban
policies and communication so that, with citizens’ participation and pro-activity,
energy consumption and traffic may be reduced, as well as air and noise
pollution.11 The pilot-cities in this project are Rome (Italy), Barcelona (Spain),
Winchester (Great-Brittan) and Cork (Ireland).
The European Directorate-General for Energy and Transport also developed a project
call TAPESTRY (Travel Awareness, Publicity and Education Supporting a Sustainable
Transport Strategy in Europe) which ended in October 2003.12 This project aimed to
improve the understanding of how programmes and communication campaigns can be
developed to sustain and stimulate sustainable travel patterns across Europe.
One last project that should be mentioned as well is MOST (Mobility Management
7 At http://www.civitas-initiative.org/ accessed 2005-01-05. 8 At http://www.trendsetter-europe.org accessed 2004-12-22. 9 At http://www.vivaldiproject.org accessed 2004-12-22. 10 At http://www.tellus-cities.net accessed 2004-12-23. 11 At http://www.miraclesproject.net accessed 2004-12-27. 12 At http://www.eu-tapestry.org accessed 2004-12-27.

17
Strategies for the Next Decade), whose top priorities included the introduction of
mobility management in transport policies.13 It was one of the major projects developed
by the European Union in the framework of the 5th FP and took place between 1998 and
2002.
Besides the projects mentioned above, the EU also programmes some annual activities
in the framework of sustainable mobility, such as the “In Town Without My Car!”
day.14 With the goal of reflecting and debating the problems caused by the mobility
model centred on the car, the campaign initially took place in France in 1998 with the
participation of 35 cities. In the following year, with the participation of Italy, 186 cities
took part in the event. But it was in 2000, when the campaign “In Town Without My
Car!” was launched that countries such as Germany, Austria, Belgium, Denmark, Spain,
Finland, France, Greece, Ireland, Italy, Luxembourg, Holland, Portugal, the United
Kingdom and Sweden signed the European Declaration, committing themselves to
participate in the initiative.
Reviewing all these projects and their aims, we can assume that, from those focusing on
sustainable mobility, the great majority present the following factors as guidelines: the
reduction of greenhouse-effect gas emissions, reduction in the consumption of energy
by means of transport, directives for the use of renewable energy and reduction of
motorised vehicles.
The following activities can typically be found in these projects:
��The promotion of non-motorised transport, such as bicycles and walking;
construction of proper lanes, parking for bicycles, bicycle rental services and traffic
management and control measures;
��The promotion of the use of public transport, the improvement of its efficiency and
attractiveness, specially of environmentally-friendly transports, including new
structures, fleet renewal and modernisation, and the establishment of priorities for
public transport in traffic controls;
��Control and limitation of the number of circulating cars with car pooling
programmes, parking management and charge payment;
13 At http://mo.st accessed 2004-12-27. 14 At http://www.eurocities.org accessed 2004-12-27.
18
��Improvement of interface points among different types of transports, and creation of
“park-and-ride“ services;
��Horizontal measures like information management, traffic control, public
participation and training, integrated plans, public space reorganisation and
supplying more than one option to public and non-motorised transports.
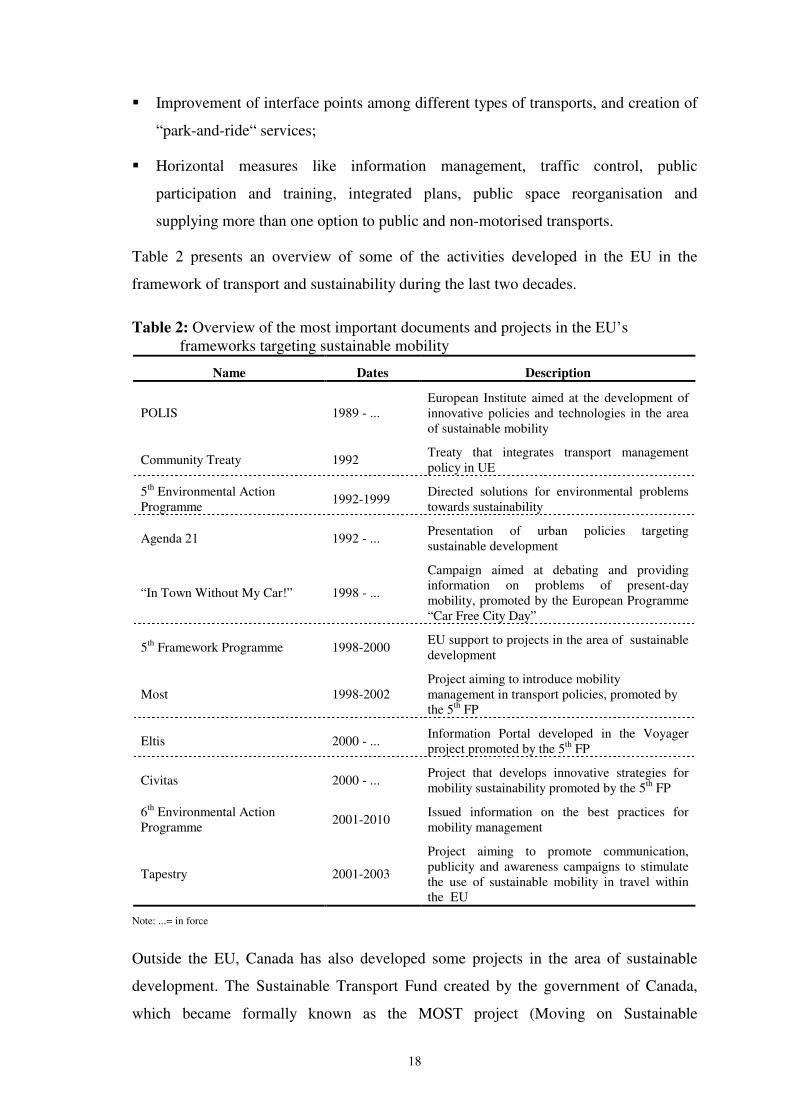
Table 2 presents an overview of some of the activities developed in the EU in the
framework of transport and sustainability during the last two decades.
Table 2: Overview of the most important documents and projects in the EU’s frameworks targeting sustainable mobility
Name Dates Description
POLIS 1989 - ... European Institute aimed at the development of innovative policies and technologies in the area of sustainable mobility
Community Treaty 1992 Treaty that integrates transport management policy in UE
5th Environmental Action Programme 1992-1999 Directed solutions for environmental problems
towards sustainability
Agenda 21 1992 - ... Presentation of urban policies targeting sustainable development
“In Town Without My Car!” 1998 - ...
Campaign aimed at debating and providing information on problems of present-day mobility, promoted by the European Programme “Car Free City Day”
5th Framework Programme 1998-2000 EU support to projects in the area of sustainable development
Most 1998-2002 Project aiming to introduce mobility management in transport policies, promoted by the 5th FP
Eltis 2000 - ... Information Portal developed in the Voyager project promoted by the 5th FP
Civitas 2000 - ... Project that develops innovative strategies for mobility sustainability promoted by the 5th FP
6th Environmental Action Programme 2001-2010 Issued information on the best practices for
mobility management
Tapestry 2001-2003
Project aiming to promote communication, publicity and awareness campaigns to stimulate the use of sustainable mobility in travel within the EU
Note: ...= in force
Outside the EU, Canada has also developed some projects in the area of sustainable
development. The Sustainable Transport Fund created by the government of Canada,
which became formally known as the MOST project (Moving on Sustainable
19
Transportation), has as one of its major goals to provide Canada with information and
tools aimed at the implementation of a better sustainable transport policy, stimulating
the development of innovative measures that constantly seek to quantify the advances
made in development.15
The MOST Programme was created by Canada's Transports Department and has
developed more than 50 projects since 1999. Its areas of action include urban planning
projects, projects focusing on public traffic, active transports, car pooling, improved
technologies, improved fuel and better mobility practices.
Canada’s strategy for 2004-2006 is structured into seven steps (TC, 2004):
• Encouraging Canadians to opt for less polluting transports;
• Promoting innovation and the development of skills;
• Improving the systems’ efficiency and optimising means of transport choices;
• Stimulating the country to develop more efficient vehicles, with better fuel and
better infrastructures;
• Promoting the performance of public transport;
• Improving government and transport sector decision-making;
• Improving transport operators’ management.
The transport sector is critical to future economic, social and environmental progress.
The integration of economic and financial instruments in environmental and transport
policies is a step in the right direction but all actors have the obligation to promote more
sustainable practices. The application of the concept to reality requires a number of
measures from both public and private entities as well as an international consensus on
this matter.
1.4. The local government’s perception of sustainable mobility
management. The missing link
As highlighted in earlier sections, one of the great challenges of the 21st century is to
conciliate the different priorities between economic development and the environment,
15 At http://www.tc.gc.ca, accessed on 2005-01-23.

20
whilst at the same time recognising the different social priorities and the consequences
resulting from the decisions made.
Policies based on information could alter attitudes towards environmentally friendly
modes. As awareness is increased, changes in life styles and travel patterns would take
place. However these policies should be supplemented with other measures, which
would support the message conveyed by public information.
During the 1980s in Europe, it was often said that strategic planning was in limbo
(Albrechts et al, 2003). Urban and regional planning practices focused on projects,
especially those focusing on the revival of rundown parts of cities and on land use
regulation. But at the end of the century, new efforts were underway in many parts of
Europe to produce strategies for cities, sub-regions and regions (Scheurer, 2001).
Creating and implementing strategies for urban development is an activity that mainly
concerns local governments, cities and regions. This is because each region has its own
particular characteristics and needs, and these require tailored policy responses that can
best be designed locally.
A wide range of policy measures has recently been proposed to cope with the high
social cost of geographic mobility, such as information campaigns, user charges,
emissions standards, mobility constrains, new forms of land-use and physical planning
and new transport technologies. The main goal in most urban areas is also to stimulate
public transportation and reduce car use (Banister et al., 2000).
However, as already said, policies to promote urban development, especially around
public transportation, are far easier to recommend than to put into practice. Nations and
cities face many barriers to rational development - for instance, the structure of
government bureaucracies tends to hamper government decisions (Sheehan, 2001). At a
national level, separated agencies for transportation, environment, and land use often
have competing agendas. At a local level, officials from different towns within a large
metropolitan area are more likely to compete than to cooperate (Sheehan, 2001). This
situation leads the government to a sort of segmentation at a metropolitan level.
The local dimension of the transport sector problem has already been acknowledged in
several countries and by multinational entities such as the United Nations (UN) and the
European Union.
To better analyse the actions of local administrations around the world, we present a

21
summary analysis of different transport systems and strategic plans for sustainable
mobility studies: the Metropolitan area of Curitiba, Rotterdam (part of Randstad) and
the Metropolitan area of London.
Analysing the strategies for sustainability used by those three cities comparatively, we
come to the conclusion that they were all different, even though they shared a common
goal – to provide the population with an alternative to private transport that, together
with factors of spatial planning and social cohesion, would make the city a more
“competitive” one.
Table 3 shows the main action guidelines and the resemblances and differences found in
the different cites under study.
Table 3: Mobility management strategies adopted in three benchmarking cities
Measures/City Curitiba London Rotterdam
Financing
Transport system was initially financed by the municipality. Nowadays it is a self-sufficient system
Greater London Authority
Central government, Rotterdam Municipality and European Union programmes
Priority of public transport
Bus network divided into different categories for different needs
Giving the bus the same usefulness as the underground
Interconnection between different public means of transport
Educating the population
Education on the needs of city sustainability, including mobility, starts at school. 75% of the population travels by public transport
New interactive forms of information on schedules and delays in buses and underground. Interactive information on road traffic
New interactive forms of information on schedules and delays in public transport. Interactive information on road traffic
Alternative transport Bicycle lanes
Well-established underground and motorcycle travel, with programmes promoting their use
Bicycle lanes
Actions began 1974 2000 2000
Strategy
Integrating a first class bus network with a well-defined structural axis which channels population growth
New common and integrated TfL management to improve all public transport services
Intermodality between different public and non-polluting means of transport
Innovation
Creation of bus lanes between peripheral areas and between the periphery and the centre. Different buses with different types of services
Road tolls during rush hours in city centre
Creation of a special lane for freight transport between the city centre and the port.

22
The experiences of the selected cities show that the strategy adopted with a view to
sustainable mobility must consider several factors, especially social ones, which depend
on the population’s culture and habits, which vary according to each society, and
strategies should be adapted to their needs and possibilities.
Thus, we can conclude that there is no single strategy with defined measures for
sustainable mobility, but a range of experiences that can be adapted to the reality at
hand. The strategy behind the success of these actions is the implementation of
horizontal measures such as population education, information management and traffic
control boosting participation and responsibility on the part of the population and an
integrated management of all public transport services.
A common measure to all the cities studied is the effort to improve and modernise the
attractiveness of public transport, especially of public road transports, such as the bus,
where infrastructure already exists and there is no need for big investments. Frequently,
this measure is associated with the promotion of alternative transports, such as bicycles
or car pooling, in order to create intermodality and inter-connectivity between different
transports.
Although several projects clearly point out the direct connection between mobility
modes, energy consumption and the rate of urban sprawl, an agreement has yet to be
reached on the best strategy for urban spatial organisation and mobility management,
and what their relationship should be with the allocation of urban activities.
Until the mid-1990s transport planning was in progression, but with no clear theoretical
groundings (Banister, 1994). Everyone was aware of the problems created by the
increased demand for transportation and most efforts were directed at finding methods
of analysis with practical, usually quantitative, output. More recently, several studies
have attempted to understand the relationship between land use, urban form and urban
travel, and seek to provide empirical evidence on these aspects (Cera, 2003).
Some authors (e.g., Kitamura et al., 1997) suggest that attitudes affect travel patterns
more strongly and perhaps more directly than land use factors. In this context, the local
authorities have an important role in presenting information-based policies.
To the best of our knowledge, a study has yet to be conducted that identifies the
different sustainable mobility strategies in a comprehensive and representative group of
cities in the same country. In fact, most of the studies (e.g., Sheehan, 2001; Sequinel,
23
2002; Marshall, 2000) focus on a selected benchmarking group of different cities in
different countries. Moreover, and more importantly, none of these studies provide a
thorough and quantitative account of the perceptions of local public authorities with
regard to the issue of sustainable mobility.
In this study, we seek to fill these gaps by identifying the different sustainable mobility
strategies and the corresponding perceptions of the Portuguese local public authorities,
especially the Portuguese municipalities.

24
Chapter 2. Sustainable mobility management in a peripheral
economy
2.1. Sustainable Mobility in Portugal. An historical overview
The transport sector in Portugal (similarly to other countries) is one of the economic
sectors which has revealed some of the major environmental pressures. The increasing
number of cars, the lack of a social transport policy, and flaws in territorial management
are matters of concern that contribute to settlement patterns and lifestyles which
endanger the objectives of sustainable development that the country has made a
commitment to achieve (MCOTA, 2002).
The economic cycle observed in Portugal, between 1990 and 2000, led to a considerable
increase of the number of vehicles in circulation. In fact, the motorisation rate almost
doubled in this period (Gonçalves, 2003).
Despite the commitment to the Kyoto Protocol, Greenhouse Gas (GHG) emissions in
the transport sector rose 67% between 1990 and 1999, contributing with about a quarter
of the national GHG emissions (Quental et al., 2004). Additionally, when analysing the
variation in energy consumption between 1990 and 2000, roadway transportation has
consumed the largest energy quota, reaching around 90% of the sector’s total (MCOTA,
2002).
The use of improved technologies and fuel has caused greater efficiency in energy
consumption and a decrease in some pollutant emissions. Nevertheless, air quality in
most of the larger cities remains below the desirable level (MCOTA, 1999).
The study “Drivers Awareness of Energy and Environment Issues”,16 carried out in
1999/2000 with the support of the EU programme, set out to characterised Portuguese
drivers. When questioned about the main reason for the degradation of the country’s
environment, road traffic was pointed out by 31% of the respondents. The solutions for
this problem, according to those interviewed, should include “investment in
infrastructure”, considered to be the most efficient instrument in solving the transport
problem (thus revealing a more traditional way of thinking), the high level of responses
favouring instruments such as “investment in public transport”, “awareness campaigns”
and “attitudinal changes from drivers”, reveals that at least awareness of the problem is 16 At http://www.eu-tapestry.org accessed 2004-12-27.
25
already significant.
Portugal, as well as Greece, Ireland and the Czech Republic are the EU25’s countries
where the largest increase in polluting emissions was registered, not only due to the
large increase in road transportation but also due to the high average age of the fleets
(CE, 2003).
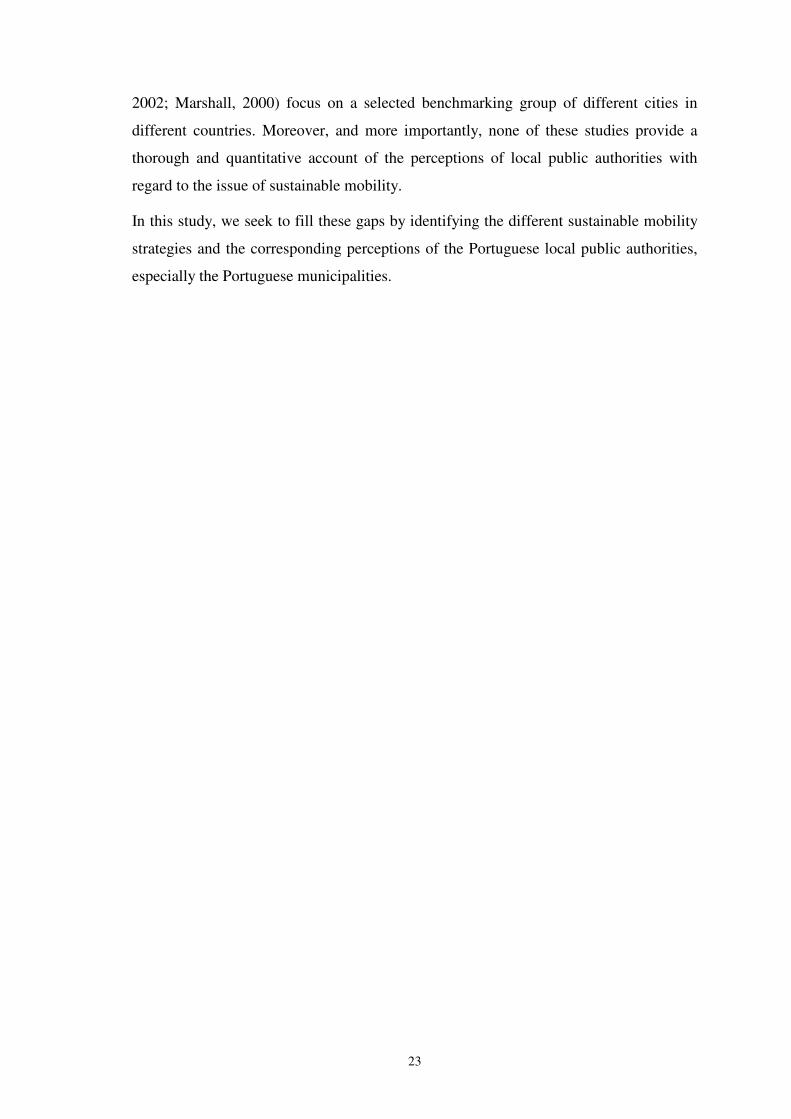
Figure 4 depicts the evolution of the real Gross Domestic Product (GDP), population
and number of vehicles circulating in Portugal between 1990 and 2002. It is clear that
the evolution in the number of vehicles in circulation is much higher than the GDP
growth.
Figure 4: Evolution of the GDP, population and vehicles in circulation, 1990-2002 * As for goods transportation, a reference must be made to the absence of information on the stock of
own-account vehicles from 2000 onwards, as INE’s access to previously used administrative sources was not possible, in order to ascertain the universe of that stock.
Source: MCOTA (2002: 71), Relatório do Estado do Ambiente
Passenger vehicles represent 72% of the vehicles in circulation (MCOTA, 2002). Thus,
it would be interesting to analyse the intensity of the traffic jams they generate. Figure 5
shows, for the Portuguese case, the increase in kilometres covered, on average, by
passenger vehicles between 1990 and 1997.

26
Figure 5: Evolution of passenger vehicles traffic – intensity per capita between 1990 and 1997
Source: MCOTA (1999: 363), Relatório do Estado do Ambiente.
As we can see, there has been a significant increase in the kilometres covered by car.
On average, there was a rise from 2694 km in 1990 to 4641 km in 1997, which
represents an annual growth rate of 8% (MCOTA, 1999).
According to the latest Population Census, between 1991 and 2001, the modal share of
private cars in commuter trips within the Lisbon Metropolitan Area rose from 24% to
44%. Within the Porto Metropolitan Area, the evolution in the same period was from
23% to 49%.17
In contrast, as a result of the existing ambiguity of their roles in transport policy, the
demand for public and rail transportation is in decline, and concurrently, the cost
incurred by operators tends to rise (Caetano, 2004). This fact can be related both to the
quality and steady decline in supply and to changes in ways of life and consumer habits
that benefit the private car.
However, between 1996 and 2003, approximately sixteen billion euros were invested in
public transportation (Pereira, 2004). After decades of unsustainable growth, the
transport sector requires an urgent strategic intervention.
Portugal also benefits from several financing and cooperation sources promoted by the
EU with the aim of supporting sustainable mobility measures.
17 At http://www.eu-tapestry.org accessed 2004-12-27.

27
The cohesion fund, foreseen in the Maastricht Treaty (1993), is a financial instrument
created to reinforce the economic and social cohesion of the more needy Member
States, as is the case of Portugal, Spain, Greece and Ireland (Ponte, 2003). This fund
was created to support, among others, projects focusing on the environment and a trans-
European transport network with co-participation rates that may reach 85% of the
investment (Ponte, 2003).
The 3rd Community Support Framework (2000-2006), a European initiative for growth,
networking and knowledge investment to sustain employment growth, presents sector
support strategies which are defined in the operational programmes designed to improve
accessibility and transports, and the environment.18 Also in the scope of the 5th FP
(1998-2002) for Portugal, around half is destined to transport management.
However, only a few sustainable measures can be seen. According to Ponte (2003), one
of the main reasons why measures targeting sustainable mobility have not yet been
implemented is economic, since the transport sector has a strong relevance in the
economic growth of the country and occupies a primary position in Portugal's revenues.
Portugal is presently resting on a rather solid pillar in terms of the financial incentives
coming from this sector, as gains in the transport sector are large and diversified.
Indeed, the main sources of the revenue budget for the economic year of 2002 were
identified as proceeding from (Ponte, 2003):
• Indirect taxes on consumption specially from fuel industries;
• Fines, duties and other penalties (including traffic fines and other duties related
to the sector and its agents);
• Transfers regarding credit institutions and insurance companies (on average, 5
million Euros from the vehicle system alone).
Supplementary to the economic importance of the transport sector, when we look at the
3rd CSF programme for accessibility and transport, we realise that EU funds intended
for the transport sector in Portugal are channelled mainly to the creation of trans-
European connections, including railway. Thus, significant funds have not yet been
made available to implement most of the important measures needed for the
18 In http://www.qca.pt/, accessed 2005-01-21.
28
development of sustainable mobility, such as, for instance, measures aimed at reducing
greenhouse-effect gas emissions or diminishing traffic jams.
There are, however, other reasons why these measures have not been implemented.
Since 1974 living standards in Portugal have progressively improved (Ponte, 2003). The
increase in people’s purchasing power has allowed them to acquire more and better
goods, such as private cars, for example. It should be remembered that, unlike countries
such as Japan, individuals can easily buy a car. Added to this, we are faced with another
problem: many people prefer to endure traffic jams rather than change their habits
(Gilbert, 2000), which makes the proposal of replacing private cars with public
transport even more difficult.
Comparing the Portuguese transport sector with most European countries, it is clear that
Portugal continues to reveal unsatisfactory performance levels which are critical to
international competitiveness. Regulations are highly dispersed and fragmented and
huge differences can be observed between different modes and even between different
urban areas.
Several recent strategic measures have been adopted in Portugal designed to change this
bleak scenario in the transport sector through more sustainable management strategies.
2.2. Sustainable Mobility in Portugal at a decentralised level
2.2.1. Central versus Local Administration
Inefficient transportation and land use patterns inevitably reduce economic
competitiveness. Governments at every level are experiencing a fiscal crisis and are
mostly unable to adequately maintain and expand transportation infrastructure to keep
pace with traffic growth (Roseland, 1992).
Taking into account all the problems associated to the present management of mobility,
the strategy of the XV Government (2002-2004) for public works and transportation
addressed the issue of the adequacy of the transportation system – of diverse types – to
the mobility needs of people and freight.19
This strategy’s objectives were:
19 Programme of the XV Constitutional Government, II Public Finance Recovery, at http://www.portugal.gov.pt, accessed 05-01-25.

29
• Reduction of regional asymmetries within the national territory;
• Portugal drawing closer to Europe, accelerating the course of real convergence;
• Contribution, through public investment in infrastructures, to economic growth;
• Integration of the major public works projects with the fundamental policy lines
for territorial management, safeguarding environmental values and historical-
cultural heritage.
The governmental strategy presented can be summarised under three lines of action: the
privatisation of public transport operators; the promotion of railway transport, which
appears as a strategy for national mobility in the future both as an option of alternative
public transport and as a connection to the centre of Europe and the creation of
Metropolitan Transport Authorities. Along with these lines there were also the
promotion of public transport and measures to discourage private transports.
The relationship between the environment and mobility management could also be
observed in other government policies, such as the National Strategy for Sustainable
Development (ENDS), the National Programme for Climatic Change (PNAC), the
Programme for the Reduction of National Emissions (PTEN) and the National
Reference Strategic Framework.
The ENDS, the programme that best interrelated mobility with sustainable
development, intended to invest in new transport solutions in urban areas. Thus, it
would permit the reduction of traffic jams and environmental degradation without the
need for heavy infrastructural investments, experimenting with new technological
innovations – in the areas of fuel and motorisation – and new organisational solutions in
public transport management (Mota, et al., 2005).
The National Reference Strategic Framework was created for the period 2007-2013.
This framework also includes a priority strategy for the qualification of cities through
several actions where sustainable mobility is included (Vazquez et al., 2004).
To achieve sustainable development, and consequently sustainable mobility, it is
important that efficient coordination between entrepreneurial initiatives and actions be
developed, both from the urban and economic sectors’ point of view. Thus it is critical
that the municipalities play an active role in this process.
30
In 800 years of Portuguese history, municipalities have played an important role in
public administration. However, after the 1974 revolution they were restricted to mere
administrative units of the state, as all regulations came from the central level and were
directly applied at the local level (Carlens, 2003). In the last few years, major reforms
have taken place in the relationship between the central, regional and local levels of
administration, in the organisational design of public policies, and in the evaluation of
administrative outcomes and outputs (Nikos, 2000). Indeed, the government recently
announced the creation of two Metropolitan Transport Authorities (Lisbon and Porto),
declaring furthermore that the future transport policy would be centred on the
municipalities20. The goal is to insure the strengthening of national cohesion and
interregional solidarity, and to promote efficiency in public management and
effectiveness, taking into account the rights of citizens.
The Metropolitan Transport Authorities have assumed the responsibility of the transport
sector in the two metropolitan areas, Porto and Lisbon, which until now were divided
between the central administration and different municipalities. At this point, the
implementation of Metropolitan Transport Authorities, as proposed by the government,
is important in order to bring solutions to public transport, which might lead to an
increase in the number of interfaces between private and public transport, thus
improving the quality of services (Ponte, 2003).
When it comes to the consequences of all these changes, local authorities have faced
both a lack of capacities and organisational problems. It is clear that most of the
municipalities, especially the rural areas, were not adequately prepared to deal with the
changes brought on. Corroborating this, a survey conducted in 2002 by the consultants
Neoris revealed that 44% of Portuguese mayors considered administrative
modernisation a necessity and 39% of the mayors defined it as a major priority (Carlens,
2003).
Thus the central government made efforts to meet these municipalities’ needs by
providing them with support agencies. This autonomy, however, is sometimes
experienced as being highly relative. In a situation of drastic cuts in public expenditure,
the central government is challenging municipalities to find new sources of funding for
investments in transports, bearing in mind the need to reduce private cars, thus
improving urban mobility (Carlens, 2003). 20 www.portugal.gov.pt accessed in 05.01.25.

31
Local authorities are very diverse and apply different methods to promote the
participation of local communities in the formulation of sustainable development
policies, and usually work in several partnerships. Évora, for instance, is considered a
good example of what is being done by Portuguese municipalities due to its great
capacity to adopt a global vision of urban issues (CE, 1996). However, is not possible to
identify one Portuguese city were we can find a truly integrated strategy at the local
level.
Local governments are closer to the people they represent, making them better able to
respond to their needs and they became to recognise their responsibility in developing
sustainable communities. Also it is possible to create networks of municipalities (even
though this is a long term process), which offer a solid structure that might contribute to
the exchange of best practices. Unfortunately, these networks are not very frequent in
Portugal (CE, 1996).
It is important to note that some working methods, certain organisational and
management processes, and mechanisms for action have been introduced both in land
use planning and in mobility management, always with the goal of achieving
sustainable development.
In this context, the main directives of projects developed in Portugal in the area of
mobility and traffic jams are (Osório-Peters et al., 2002):
• Intermodal transport and inter-operability;
• Unbalanced regional development;
• Transport price;
• Public transport infrastructures;
• Incompatibilities, urban transport jams, precarious regional situation.
Given the innovative initiatives already underway, such as the creation of the
Metropolitan Transport Areas, new trams and subways, logistics platforms, and others,
the important issue here is to adopt an integrated approach that guarantees an equal
share of the environmental, social and economic costs (Banister, 2000).
Local government could and should pioneer new approaches to sustainable
development and urban management. Thus, it would be important for municipalities to
32
assume the responsibility for (and organise) all the resources needed to address the
environmental problems facing their communities.
Since the local authorities do not have the regulatory and financial authority required to
effectively contribute to sustainable mobility, other levels of government must provide
resources and support for the financing, management and policy-making necessary for
municipalities to achieve sustainability in their communities.
2.2.2. Existing measures regarding sustainable mobility at the local
level in Portugal
As mentioned earlier, a sustainable transport policy has to be identified bearing in mind
three central vectors. First, the transfer of passengers to more environmentally efficient
transport modes; second, the integration of transportation with land use planning, such
as public transportation; and, last, both social and economic costs have to be weighed
up (CE, 2003).
In this section, we present several sustainable mobility measures already adopted by
some Portuguese municipalities in the two first vectors. Although there are other
initiatives, we have selected a few examples that have focused particularly on the two
metropolitan areas, Porto and Lisbon.
Although there is still a lack of an integrated sustainable mobility measure with a solid
supporting background, public actions are now more focused on improving the image of
public transportation. In fact, in Portugal different actions have taken place throughout
the country. Most of these actions have in fact been promoted or supported by
municipalities and metropolitan areas.
One of the most well-known mobility campaigns is the “European mobility week” and
“In town without my car”, a European initiative which is today internationally
renowned, that takes place in September of each year. This campaign is coordinated by
Eurocities, Energie-cités and Climate Alliance and national coordinators and financed
by the European Commission.
In Portugal this campaign started in 2000 and is promoted by the Environment Ministry
through the Environment Institute.21 Unfortunately, the number of municipalities that
21 At www.mobilityweek-europe.org accessed 2005-01-21.

33
joined the initiative has decreased over the years. In 2003 there were 74 municipalities,
in 2004, 57, and in 2005, just 46 municipalities participated in this initiative (Serra,
2005).
Nevertheless, the campaign has always had a positive impact both on the citizens and
the people responsible for making the decisions, as well as increasing public awareness
of these issues. Also this Campaign is designed to promote programmes to introduce
permanent sustainable mobility measures in cities. Table 4 shows the permanent
measures introduced.
Table 4: Permanent measures introduced within the scope of the European campaign
“European Mobility Week” up to 2003
Type of initiative Number of permanent measures
New pedestrian areas 33
Bicycle lanes or parking facilities 9
Development of public transportation network 8
New “car-free days” 2
Parking areas (new or enlargement of existing) 8
Free – use bicycles 2
Electric vehicles 1
Traffic control 13
Urban public space regeneration 6
Noise monitoring and control 3
Air quality improvement 2
New roads for diverting traffic from urban centres 1
Parking control 2
Bicycle rental systems 1
Source: Tapestry (2003: 141), at http://www.eu-tapestry.org accessed 2004-12-27.
Other initiatives are underway all over the country. Lisbon and Porto, the municipalities
with the most serious mobility problems, took part in the initiative “Switching to public
transportation”, coordinated by the UITP (International Unit of Public Transportation)
and promoted by several transport operators. The main aim of this project was to make
people use public transport more often by providing more precise information and

34
networks.
Other campaigns to promote public transportation were made. One of these campaigns
involved several operators and was launched by the government agency responsible for
the application of EU funds to the transport sector. The campaign slogan was “Together
everywhere you go”. Also the rail operator, following the approach of the public
transportation campaign, launched a nationwide campaign to promote rail services,
especially in urban areas. The campaign slogan was “Don’t lose time behind the wheel
of your car!”.22
Moreover, different initiatives to promote intermodality were also initiated in the two
largest Portuguese cities (Porto and Lisbon). One of the most relevant examples took
place in Porto, where the recent opening (in 2003) of the light rail network represented a
positive enhancement factor by encouraging a partnership between the bus and metro
operators, and enabling the introduction of the multimodal contactless card called
“Andante” (meaning “on the move”). The “Andante” campaign is part of a broader
initiative designed to accompany the extension of coverage to several public and private
operators. This measure is very important since public transportation in Porto is poorly
integrated. Those who use public transportation in Porto are unanimous in recognising
that there is a lack of integration namely at the level of time schedules between
operators, and a lack of network coherence. It is expected that “Andante” and this new
approach may play an important role in changing people’s attitudes towards urban
mobility as it permits users to get more accustomed with the advantages of transport
services and the possibility of multimodality.
Similarly, Lisbon introduced a new contactless card called “Lisboa Viva” (“Live
Lisbon”). Although Lisbon already had a social pass that could be used in different
operators, “Lisboa Viva” uses new technology. This multimodal pass, like the
“Andante”, was considered a success given the number of cards issued within a short
period of time.
Real time information at bus stops was also one of the pilot actions recently
implemented. Some operators have started to devise other ways to inform clients about
bus schedules. The SMSBUS was created in Porto (mobile phone text messages, called
‘SMS’ in Portugal, providing information of public transportation), taking advantage of
22 At http://www.eu-tapestry.org accessed 2004-12-27.

35
the huge success of mobile phones in Portugal. If a client in Porto wants to know at
what time a given bus is going to pass at a specific bus stop, all he/she has to do is send
a text message to the number 3001 with the code of the bus stop in question at a cost of
0,20 Euros. Up to April 2005 the SMSBUS received about 133.500 messages.23
Another important initiative in Porto was the itenerarium.net that serves to guide users
across the urban public transport system, enabling web searches for single or
multimodal routes between two points, considering as parameters cost, comfort and
speed.
The Lisbon municipality has also adopted several tough measures and recently closed a
traditional central district (Bairo Alto) to car traffic, and other similar initiatives are
under study. The most innovative initiative concerning mobility and transport
infrastructure took place in Lisbon with the introduction of the first “on and off” bus
lane. This lane has a mechanism that switches to “on” and gives lane priority to buses
whenever a bus is approaching and private cars can no longer enter the lane.
Thus, despite the relative backwardness of Portugal in this domain, recent developments
are signalling a positive evolution for the years to come.
Table 5 summarises several measures adopted by different Portuguese municipalities
(note that most of the sustainable mobility measures were adopted in the context of the
European Mobility Week).
23 www.stcp.pt accessed on 06.04.15.
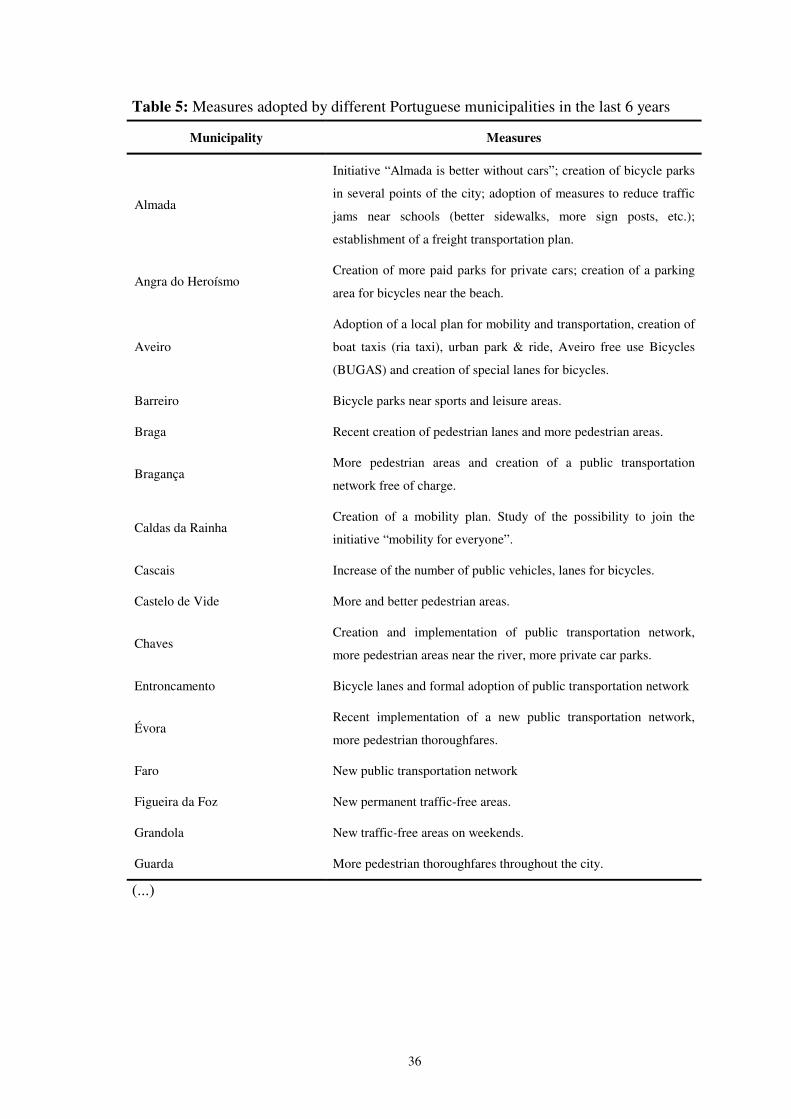
36
Table 5: Measures adopted by different Portuguese municipalities in the last 6 years
Municipality Measures
Almada
Initiative “Almada is better without cars”; creation of bicycle parks
in several points of the city; adoption of measures to reduce traffic
jams near schools (better sidewalks, more sign posts, etc.);
establishment of a freight transportation plan.
Angra do Heroísmo Creation of more paid parks for private cars; creation of a parking
area for bicycles near the beach.
Aveiro
Adoption of a local plan for mobility and transportation, creation of
boat taxis (ria taxi), urban park & ride, Aveiro free use Bicycles
(BUGAS) and creation of special lanes for bicycles.
Barreiro Bicycle parks near sports and leisure areas.
Braga Recent creation of pedestrian lanes and more pedestrian areas.
Bragança More pedestrian areas and creation of a public transportation
network free of charge.
Caldas da Rainha Creation of a mobility plan. Study of the possibility to join the
initiative “mobility for everyone”.
Cascais Increase of the number of public vehicles, lanes for bicycles.
Castelo de Vide More and better pedestrian areas.
Chaves Creation and implementation of public transportation network,
more pedestrian areas near the river, more private car parks.
Entroncamento Bicycle lanes and formal adoption of public transportation network
Évora Recent implementation of a new public transportation network,
more pedestrian thoroughfares.
Faro New public transportation network
Figueira da Foz New permanent traffic-free areas.
Grandola New traffic-free areas on weekends.
Guarda More pedestrian thoroughfares throughout the city.
(...)

37
(...)
Leiria
Implementation of a new public transportation network for people
with physical disabilities. New public transportation network
(Mobilis).
Lourinha
More private car parks, more signalling, better pedestrian
infrastructures, reduction of speed limit, restructuring of public
places, more facilities for people with physical disabilities.
Maneigas More and better pedestrian thoroughfares, study of the possibility
of bicycle lanes.
Mealhada Bicycle lanes, more signalling, better infrastructures
Mértola Car pooling, every 3 months a survey is done to evaluate user
satisfaction.
Monchique Prohibited parking areas, Bicycle parking areas.
Montijo Bicycle lanes.
Nisa
Regeneration of the central area with more pedestrian
thoroughfares and green areas, prohibited parking and traffic areas,
strategic traffic management.
Oeiras Creation of bicycle lanes, bicycles of free use.
Ovar
Bicycle and motorcycle parks near the train station, parking for
people with physical disabilities near schools and bicycle parks
near the beach.
Portalegre Better pedestrian areas.
S. João da Madeira Pedestrian thoroughfares all over the city, better public
transportation.
Seixal Bicycle lanes and better pedestrian thoroughfares near the bay.
Serpa Bicycle parks, new experimental public transportation, sustainable
mobility plan.
Sever do Vouga Bicycle lanes, freight parks, better pedestrian areas, 11 pedestrian
thoroughfares throughout the city, urban plan with mobility issues.
Torres Vedras Bicycle lanes, new partnership with IST to create sustainable mobility plans.
Trofa New pedestrian areas, better signalling in critical areas.
Vila Real de Santo António Bicycle lanes, better pedestrian areas
Viseu Electric mini-buses to go to the historical centre, bicycle lanes, traffic restriction to historical centre.
Source: Adaptation from Serra (2005: 19-20)
38
When it comes to another aspect of sustainability – urban system policies – experiences
in Portugal are highly diversified and modes of action very fragmented (Vazquez et al.,
2004).
The second Regional Development Plan, covering the 1994-1999 period, brought to the
urban systems new interventions in environmental terms, when the PROSIURB
programme was launched (Programme for the Consolidation of the National Urban
System). This programme was defined at a national level and directed at medium-sized
cities. It is in fact a policy explicitly designed to foster the balanced and integrated
development of urban systems with the purpose of encouraging attractiveness and
sustainable development (Vazquez et al., 2004).
So as receive funds (in the context of the II Community Support Framework), the
municipalities were required to develop a strategic plan. PROSIURB had a massive
participation on the part of the local authorities, and in some cases, specific offices were
created to better contribute to the cities’ strategy (Portugal - Presidency of the Council
of Ministers, 2000).
The second experience within a national framework for urban policy directed at cities
was the POLIS programme (Programme for Urban Regeneration and Environmental
Improvement of Cities).24 Transport management, along with environmental upgrading,
are two measures implemented under the Polis programme.
The main objective of the POLIS programme is conveyed by the intervention dimension
of the National Plan for Economic and Social Development, “protection and
environmental improvement of the territory” (Portugal - Presidency of the Council of
Ministers, 2000).
The POLIS programme depends on the financial resources of the 3rd CSF and its prime
goal is to mobilise and foster actions focusing on the urban and environmental
regeneration of cities.
The main intervention lines of the POLIS programme are briefly as follows:25
• Integrated operations of urban upgrading and environmental improvement;
• Interventions in cities with areas classified as world heritage;
24 At http://www.polis.mcota.gov.pt, accessed 2005-01-21. 25 At http://www.polis.mcota.gov.pt, accessed 2005-01-21.
39
• Urban and environmental upgrading in relocation areas;
• Complementary measures to improve urban and environmental conditions in cities.
Within these measures, the support for new forms of mobility in the urban space, as a
line of action, is also included. These initiatives aim to remove cars from urban centres,
restrict traffic, stimulate the use of public transport and promote new means of access
and circulation, namely pedestrian and bike lanes.
Another measure is the URBCOM programme promoted by PRIME (Incentives for the
Modernisation of the Economy Programme). In this programme the selected projects
aimed to revitalise and strengthen business activities and to upgrade the surrounding
urban space. 27% of the total Portuguese municipalities participated in this programme,
some of them with more than one project.
Several other programmes were created in the last few years, with different rates of
participation. The 3rd CSF (2000- 2006) alone financed 410 million euros for cities and
metropolitan regeneration measures within the scope of the CCDR’s Regional
Programmes. All together, the Urban Environment Improvement programme, the
Digital City project, URBCOM, URBAN II, and Urban Rehabilitation Programme
(PRU) account for more than 418 million euros in public expenditure with particular
incidence on urbanism and mobility (Portas et al., 2003).
Despite all these initiatives, both with regard to mobility and transport infrastructure and
urban system-related policies, a comprehensive picture of the perception and
commitment at a decentralised level is still missing (particularly) in the Portuguese case.
In the next two chapters, we attempt to fill this gap by presenting and discussing new
evidence, gathered through a direct survey of the Portuguese local entrepreneurial
governance modes regarding sustainable mobility management.

40
Chapter 3. Local government perception of sustainable
mobility management in a peripheral economy.
Results from a comprehensive survey of
Portuguese municipalities
3.1. Methodological considerations
3.1.1. Presentation and justification of the methodology used
As stated in the introductory part of the present thesis, the main goal of this research is
to identify the different sustainable mobility strategies and the corresponding
perceptions of Portuguese local public authorities. There is scant empirical assessment
from this perspective, and the existing reflection on governance aspects targeting
sustainable policies has not yet dealt with the issue properly and in a convincing way.
Such a shortcoming is particularly acute in Portugal where sustainable urban mobility
management is still an undeveloped and scarcely studied reality.
Given the absence of databases on these matters, we devised a direct survey (see
Appendix 1) which was sent to all the Portuguese municipalities (308) and allowed us
to gather new evidence on the perceptions and strategies of Portuguese local public
authorities regarding sustainable urban mobility management.
The data gathered permits an evaluation of the best practices and the inherent factors
that contribute to or restrict the development of mobility plans at the local level in
Portugal. In particular, it provides answers to a third of our main research questions:
What is the sensibility or perception of Portuguese local authorities regarding
sustainable mobility issues? Are they aware?
The survey is divided into three groups. The first group of questions targeted the degree
of commitment of municipalities regarding mobility issues. Specifically, it questioned
whether there is an independent department in the municipality to deal with mobility
issues, the size (number of employees) of that independent department (or in the
absence of an independent department, the size of the department that dealt with
mobility issues), and the percentage of skilled/educated workers (i.e. workers with a
university degree) of that same department.
41
The second group of questions sought to ascertain the degree of intervention of the
municipalities with regard to sustainable mobility. In particular, it asked more
quantitatively related aspects concerning mobility indicators, namely: the existence of
parking for private cars, freight transportation and bicycles; parking distribution in
terms of the corresponding cost (private parks, parking meters or public parks); the
existence of special lanes for buses and bicycles; intermodality and costumer
information, and the existence of railways.
Finally, the third group focused on land use and urban planning, with the intention of
assessing the pro-activity of the municipalities in this regard. We questioned
municipalities on their involvement and participation in urban programmes, whether
they had mobility plans and whether they had conducted or contracted studies
concerning mobility management and land use.
The survey was conducted by e-mail, telephone and fax between March and December
2005. In total, 192 of the 308 municipalities responded to the survey, which corresponds
to an above average response rate of 62.3%, a truly remarkably rate for a non-
compulsory survey.
In addition to the information gathered through the survey, we collected from secondary
sources (Fonseca, 2002) and the Sales Index 2003 (Marktest) a set of variables that
enabled a comprehensive characterisation of the municipalities. These ‘control’
variables were divided into four main groups: demographic (population density),
income and employment (income index, employment index, and employment ratio),
human capital (education and culture index, development index), and transport
infrastructure (total vehicles to employed population, total vehicles to population, total
private car to population, total freight to population, auto average age, and motorcycles
to 10000 inhabitants).
3.1.2. Representativeness of the respondent sample
The data collected are distributed throughout all the Portuguese NUTs II, from a
minimum of 2 respondent municipalities in Pinhal Interior Sul and Beira Interior Sul up
to a maximum of 12 respondent municipalities in Pinhal Interior Norte. In regional
(NUTS III) terms, the data present a fairly good representativeness, although the Douro
region and the Azores are relatively underrepresented and the Grande Porto NUTs III is
overrepresented.

42
Table 6: Regional representativeness of the respondent municipalities by NUTs III
% of total
respondents
Municipalities
% Total
Municipalities
(population)
N
Minho-Lima 2.6 3.2 10
Cavado 2.6 1.9 6
Ave 2.6 2.6 8
Grande Porto 4.2 2.9 9
Tâmega 5.3 4.9 15
Entre Douro e Vouga 2.1 1.6 5
Douro 3.7 6.2 19
Alto-Trás-Montes 5.8 4.5 14
Baixo Vouga 5.3 3.9 12
Baixo Mondego 3.2 2.6 8
Pinhal Litoral 2.1 1.6 5
Pinhal Interior Norte 6.3 4.5 14
Dão-Lafões 5.8 4.9 15
Pinhal Interior Sul 1.1 1.6 5
Serra da Estrela 1.6 1.0 3
Beira Interior Norte 3.2 2.9 9
Beira Interior Sul 1.1 1.3 4
Cova da Beira 1.6 1.0 3
Oeste 4.2 3.9 12
Médio Tejo 2.6 3.2 10
Grande Lisboa 3.7 2.9 9
Península de Setúbal 2.1 2.9 9
Alentejo Litoral 1.6 1.6 5
Alto Alentejo 5.8 5.2 16
Alentejo Central 4.2 4.2 13
Baixo Alentejo 4.2 4.2 13
Lezíria do Tejo 3.7 3.6 11
Algarve 4.2 5.2 16
Região Autónoma dos Açores 1.6 6.2 19
Região Autónoma da Madeira 2.1 3.6 11
Group Total 100.0 100.0 308
Source: Author’s computations based on a survey of Portuguese municipalities, March - December 2005.
The representativeness in terms of NUTs II is depicted in Figure 6, which again
demonstrates the relatively poor coverage of our survey regarding the islands.
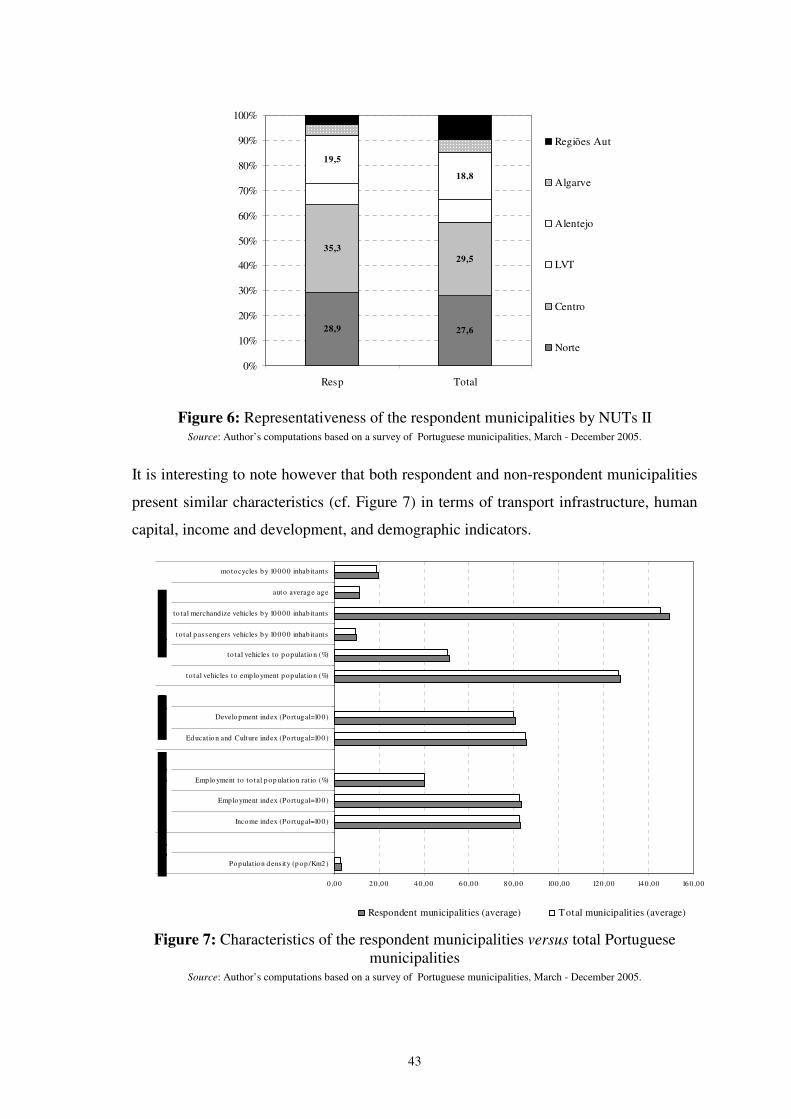
43
35,329,5
19,5
18,8
27,628,9
0%
10%
20%
30%
40%
50%
60%
70%
80%
90%
100%
Resp Total
Regiões Aut
Algarve
Alentejo
LVT
Centro
Norte
Figure 6: Representativeness of the respondent municipalities by NUTs II
Source: Author’s computations based on a survey of Portuguese municipalities, March - December 2005.
It is interesting to note however that both respondent and non-respondent municipalities
present similar characteristics (cf. Figure 7) in terms of transport infrastructure, human
capital, income and development, and demographic indicators.
0 ,0 0 2 0,00 4 0,00 6 0,0 0 8 0,0 0 100 ,00 120 ,00 14 0,00 16 0,00
Pop ulatio n d ens ity (p op /Km2 )
Income index (Portugal=10 0)
Emp loyment index (Portugal=10 0)
Emp lo yment to to tal p op ulatio n rat io (%)
Ed ucatio n and Culture index (Po rtugal=100 )
Develo pment index (Portugal=10 0)
to tal vehicles to emp lo yment p op ulat io n (%)
to tal vehicles to p op ulatio n (%)
to tal p asseng ers vehicles b y 10 0 0 0 inhab itants
to tal merchandize vehicles b y 10 0 00 inhab itants
auto average age
mo tocycles b y 10 0 0 0 inhab itants
Respondent municipalit ies (average) Total municipalit ies (average)
Figure 7: Characteristics of the respondent municipalities versus total Portuguese municipalities
Source: Author’s computations based on a survey of Portuguese municipalities, March - December 2005.

44
For instance, the respondent municipalities present an average value for the income
index of 82.7, which is very close of the corresponding value of the whole population of
Portuguese municipalities (82.3). This means that on average, respondent municipalities
have an income level that is 80% of the Portuguese total aggregate value. The same
occurs when we look at the education and culture index and the development index.
Respondent and non-respondent municipalities present similar (average) levels of
education, culture and development. With regard to the indicators of transport
infrastructure, although they are slightly higher for the respondent sample, differences
are not striking, presenting the highest discrepancy in relation to total merchandise
vehicles per 10000 inhabitants – 149.5 for the respondents against 145.5 of the total
population. Such evidence provides further support to our earlier statement about the
soundness of the data’s representativeness.
3.2. The degree of commitment of municipalities regarding mobility
issues – some descriptive statistics
As we mentioned in the methodological part, the first set of questions intended to assess
the degree of commitment of municipalities regarding mobility issues. In particular, it
questioned whether there was an independent department in the municipality to deal
with mobility issues, the size (number of employees) of that independent department (or
in the absence of an independent department, the size of the department that dealt with
mobility issues), and the percentage of skilled/educated workers (i.e., workers with a
university degree) of that same department. It is important to highlight that a substantial
part (around 81%) of our respondents were the directors and division heads (42.2%) or
highly qualified technicians (38.5%) of the department in charge of mobility issues (see
Table 7). This assures, to some extent, that the respondents were individuals with broad
expertise and experience regarding the issues in analysis, conveying therefore a high
degree of confidence to the quality of the answers.
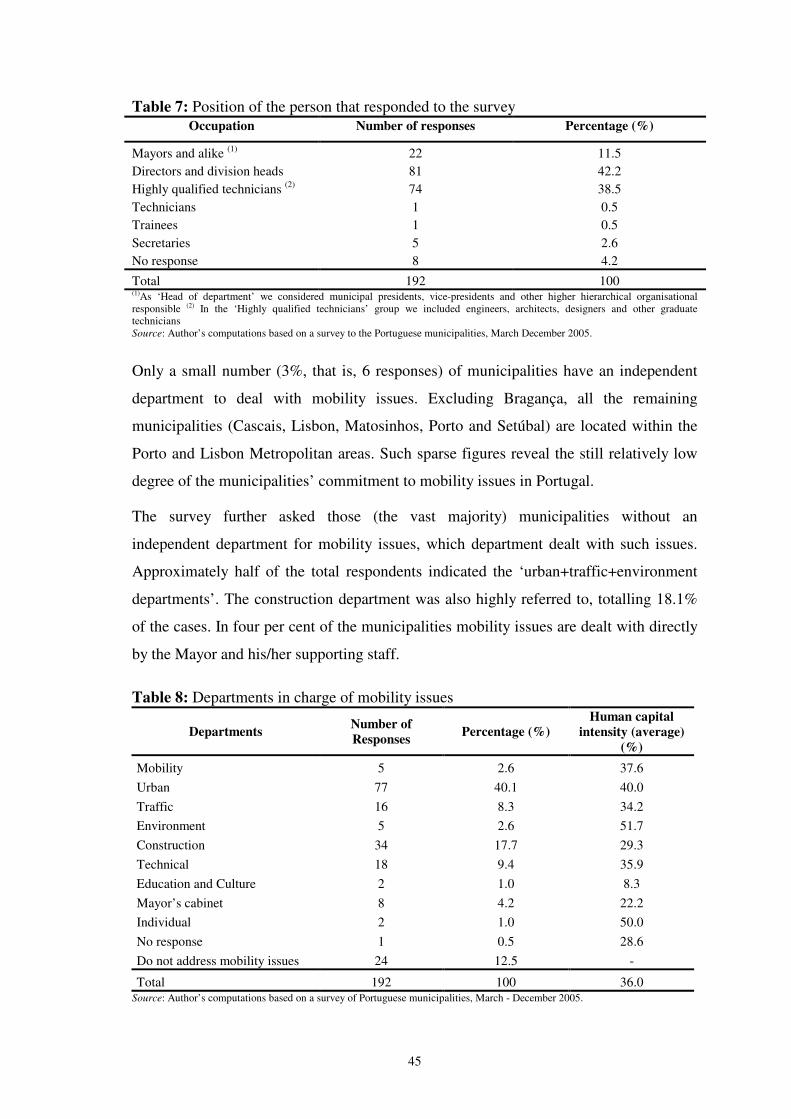
45
Table 7: Position of the person that responded to the survey Occupation Number of responses Percentage (%)
Mayors and alike (1) 22 11.5 Directors and division heads 81 42.2 Highly qualified technicians (2) 74 38.5 Technicians 1 0.5 Trainees 1 0.5 Secretaries 5 2.6 No response 8 4.2
Total 192 100 (1)As ‘Head of department’ we considered municipal presidents, vice-presidents and other higher hierarchical organisational responsible (2) In the ‘Highly qualified technicians’ group we included engineers, architects, designers and other graduate technicians Source: Author’s computations based on a survey to the Portuguese municipalities, March December 2005.
Only a small number (3%, that is, 6 responses) of municipalities have an independent
department to deal with mobility issues. Excluding Bragança, all the remaining
municipalities (Cascais, Lisbon, Matosinhos, Porto and Setúbal) are located within the
Porto and Lisbon Metropolitan areas. Such sparse figures reveal the still relatively low
degree of the municipalities’ commitment to mobility issues in Portugal.
The survey further asked those (the vast majority) municipalities without an
independent department for mobility issues, which department dealt with such issues.
Approximately half of the total respondents indicated the ‘urban+traffic+environment
departments’. The construction department was also highly referred to, totalling 18.1%
of the cases. In four per cent of the municipalities mobility issues are dealt with directly
by the Mayor and his/her supporting staff.
Table 8: Departments in charge of mobility issues
Departments Number of Responses Percentage (%)
Human capital intensity (average)
(%) Mobility 5 2.6 37.6 Urban 77 40.1 40.0 Traffic 16 8.3 34.2 Environment 5 2.6 51.7 Construction 34 17.7 29.3 Technical 18 9.4 35.9 Education and Culture 2 1.0 8.3 Mayor’s cabinet 8 4.2 22.2 Individual 2 1.0 50.0 No response 1 0.5 28.6 Do not address mobility issues 24 12.5 -
Total 192 100 36.0 Source: Author’s computations based on a survey of Portuguese municipalities, March - December 2005.

46
It is interesting to note that those departments which are somehow directly related to
mobility issues (mobility, urban, traffic and environment) are relatively highly endowed
in terms of human capital – on average, the percentage of employees with university
degrees is approximately 40%, above the total average (36%).
The departments responsible for mobility issues employ, on average, 31 individuals
(ranging between 0 employees – the department (Traffic) existed but was not active -
and 367 employees). The largest department specifically concerned with mobility issues
is located in the Porto municipality, which happens to be one of the most active
Portuguese municipalities regarding sustainable mobility initiatives in recent years.26
Figure 8: Municipalities’ commitment to mobility issues and human capital intensity, by NUTs III Source: Author’s computations based on a survey of Portuguese municipalities, March - December 2005.
26 At www.cm-porto.pt accessed 2006-03-22.
�
�
�
�
�
�
�
�
�
�
��
�
�
�
�
�
�
�
�
�
�
�
�
�
�
�
�
Portugal_NutsIII
by human capital intensity (%)
56.3 to 100 (5)42.2 to 56.3 (5)34.8 to 42.2 (6)27.7 to 34.8 (6)
2.6 to 27.7 (6)
Portugal_NutsIII% municip. treating mob. issues
�100
� 50
� 10
47
When assessing the commitment of Portuguese municipalities regarding mobility
issues, we can mention two levels of analysis. At one level, already mentioned above,
only 5 municipalities claimed to possess a specialised department for mobility issues.
Nevertheless, at another level, an additional 163 municipalities (84.9% of the total
respondents) deal with mobility issues in non-independent departments. Thus, only
12.5% of the municipalities state that they do not address mobility issues. In this latter
group, indicated from North to South, we have NUTS III Minho-Lima, Douro, Serra da
Estrela, Alentejo Litoral and Algarve.
If we analyse with some depth the geographical pattern of the municipalities’
commitment to mobility issues, we end up with 9 regions (NUTS III) with a high degree
of commitment, that is, presenting a high percentage (above 85%) of municipalities
concerned with mobility issues and a relatively high human capital intensity in the
corresponding departments (over 45% of employees with university degrees). Among
these regions, in the North we find Grande Porto and Entre Douro e Vouga (summing
12 municipalities); in the Centre, Baixo Mondego, Pinhal Litoral, Dão-Lafões, Pinhal
Interior Sul, and Cova da Beira (with 26 municipalities overall); and Lisboa e Vale do
Tejo, Grande Lisboa and Península de Setúbal (totalling 12 municipalities).
Three of the 9 NUTS III mentioned reveal a very strong commitment to these matters:
Grande Porto, Grande Lisboa and Península de Setúbal.
Grande Porto is here represented by 8 municipalities,27 with Porto presenting the highest
number of employees (367) in the mobility department, albeit (and also because of that)
with the lowest human capital intensity (9.5%). In contrast, Póvoa de Varzim emerges
here as a truly mobility-committed municipality with 63.6% of the total (11) employees
in the mobility-related department holding a university degree.
Grande Lisboa reveals a more homogenous picture than Grande Porto in terms of the
mobility departments’ size and human capital intensity (all above 50%).28
Notwithstanding, we can highlight three municipalities, Lisbon, Cascais and Oeiras.
The first municipality presents the highest human capital intensity with 72.7% of its
total (11) employees with university degrees, whereas Cascais and Oeiras present
respectively, 58.8% and 57.9% of the corresponding totals (17 and 14 employees). 27 It should be noted that Espinho does not reveal any present concern regarding mobility as it has no department, and Gaia did not provide information regarding the number of department employees with university degrees. 28 Loures does not have any department in charge of mobility issues.

48
It is interesting to note that Península de Setúbal, from amongst the three NUTS III
analysed here, is the one where all of its (5) municipalities state they have a department
(independent or not) which is responsible for mobility issues. Moreover, within this
NUT category, Almada and Barreiro reveal remarkable human capital intensity. In the
first case, 76.7% of the total (30) employees in the mobility-related department have
university degrees. In the second case, 90% of a total of 20 employees are university
graduates. It is important to stress that, as mentioned in Chapter 2, Almada has recently
started an ‘Almada without cars’ initiative, which further testify to its commitment to
mobility issues.
3.3. The degree of intervention of the municipalities with regard to
sustainable mobility
The second group of questions is related to the degree of intervention of the
municipalities with regard to sustainable mobility. In particular, it focused on more
quantitatively related aspects concerning mobility indicators, namely: the existence of
parking for private cars, freight transportation and bicycles; parking distribution in
terms of the corresponding cost (private parks, parking meters or public parks); the
existence of special lanes for buses and bicycles; multimodal tickets, costumer
information, and the existence of railways.
The sustainable measures were divided into different headings, such as public
transportation (in this section public road and rail transportation were included), private
transportation and alternative transportation (bicycles).
3.3.1. Public transportation
More than half of the respondent municipalities has more than two operators working in
public transportation. Only four do not have any operator at this level: one municipality
(Melgaço) is located in the North, two in the South, namely in Alentejo Central (Borba
and Estremoz) and another in the Islands - Madeira (Calheta).

49
Table 9: Public transportation companies (by groups) operating in the municipalities
Number of public transport operators Number of Responses Percentage (%)
0 4 2.1
1 77 40.1
2-5 94 49.0
>5 15 7.8
No response 2 1.0
Total 192 100
Source: Author’s computations based on a survey of Portuguese municipalities, March - December 2005. Note: In Figure 9, the frequency of operators is based on the grouping of transport operators presented in this table, corresponding
‘0’ to 0, ‘1’ to 1, ‘2-5’ to 2, and ‘>5’ to 3.
In general, although not necessarily, the number and diversity of transport operators is
related to the existence of intermodality and multimodal tickets (UITP, 2003). As
mentioned in Chapter 1, intermodality is one of the most innovative strategies that
international cities are currently implementing.29 However, according to our survey, and
as is perfectly visible in the following figure, a substantial percentage of the Portuguese
municipalities (encompassing 85.5% of valid answers) do not have any kind of
multimodal tickets.
29 According to Keller (2001), intermodal nodal points involving passenger services and goods transportation connect not only physical infrastructures but also transport services of different modes of transport. In this vein, they facilitate multimodal transport chains with an ecologically and economically optimal use of different means of transport.

50
Figure 9: Municipalities with multimodal tickets and number of public transport operators
Source: Author’s computations based on a survey of Portuguese municipalities, March - December 2005. Note: In this figure, the frequency of operators is based on the grouping of transport operators presented in Table 9, corresponding
‘0’ to 0, ‘1’ to 1, ‘2-5’ to 2, and ‘>5’ to 3.
Municipalities from Pinhal Interior Norte (Centre), Oeste (Lisboa e Vale do Tejo), and
Alentejo (Litoral, Alto Alentejo, Alentejo Central and Baixo Alentejo) present the
lowest score in what concerns the number of public transport operators. As expected,
these municipalities (cf. Figure 9) do not have multimodal tickets either.
At first glance, surprisingly we find the cases of Serra da Estrela, Beira Interior Sul and
Cova da Beira, which rank high in terms of number of public transport operators but do
not possess any kind of multimodal tickets.
��
�
�
�
�
�
�
�
�
Portugal_NutsIII
by operator frequency
2 to 2.38 (8)1.89 to 2 (1)1.67 to 1.89 (6)1.5 to 1.67 (7)1 to 1.5 (6)
% municipalitieswith multimodal tickets
�80
� 40
� 8

51
A more regular and expected pattern is observed in Grande Porto, Grande Lisboa and
Península de Setúbal. These regions combine a large number of public transport
operators with a high percentage (over 70%) of municipalities offering multimodal
tickets.
The existence and number of social passes corroborates this latter evidence that the
most active municipalities in this regard belong to the above-mentioned regions: Porto
and Vila Nova de Gaia (Grande Porto), Cascais and Lisboa (Grande Lisboa) and
Almada (Península de Setúbal). All these municipalities have more than 5 types of
public transport passes. In the other extreme we have five regions, two from the North
(Minho Lima and Douro), two from the Centre (Beira Interior Norte and Pinhal Litoral),
one from Lisboa e Vale do Tejo (Médio Tejo), and one from the Islands (Madeira),
where over 50% of their municipalities do not have any kind of public transport passes.
The next figure reveals some degree of linear association between the regions which
have a relatively high percentage of municipalities with public transport passes and the
(average) number of different types of passes.30 Notwithstanding, the three regions that
present the highest figure for this latter variable – Grande Porto, Grande Lisboa, and
Península de Setúbal – are not those with the highest percentage of municipalities
having any type of passes, although their percentages are also quite high (80% and
over). In regions where all the municipalities claimed to have at least one type of public
transport passes – Tâmega, Entre Douro e Vouga, Pinhal Interior Sul, Beira Interior Sul,
Cova da Beira, and Alentejo Litoral – the average number of passes tends to be
relatively low, closer to the unity, reflecting local authorities’ policies to provide
students with social passes.
30 The estimate of the Pearson linear correlation coefficient is rather high (0.63).

52
Figure 10: Existence and (average) number of public transport passes by NUTs III Source: Author’s computations based on a survey of Portuguese municipalities, March - December 2005.
Note: In this figure, the average number of passes is grouped, corresponding ‘0’ to 0 passes, ‘1’ to 1, ‘2-5’ to 2, and ‘>5’ to 3.
From the figure below it is apparent that in Portugal the majority of municipalities
currently show some concern in providing their citizens with information on bus
schedules and routes. In smaller municipalities this type of information is, in general,
provided at the main bus stations.
�
�
�
�
�
�
��
�
�
�
�
�
�
�
�
�
�
�
��
�
�
�
�
�
�
�
% municip. with publ. transp.passes by Nuts III
90 to 100 (7)85.7 to 90 (1)80 to 85.7 (8)66.7 to 80 (6)25 to 66.7 (6)
Average number of publ. transp. passes
�1.9
� 0.95
� 0.19

53
Figure 11: Priority lanes for buses and schedule and route information availability Source: Author’s computations based on a survey of Portuguese municipalities, March - December 2005.
In fact, 72.3% of the municipalities have schedules and route information. Half of the
respondent municipalities provide the information at bus stops, and 45.3% at the main
stations. On-line displaying is only available for one quarter of the Portuguese
municipalities and about one third possess maps with that kind of information.
It is interesting to note that only 15 respondent municipalities provide their citizens with
information on bus schedules, routes at all possible locations (main stations and bus
stops) and by other means (on-line and maps booklets). Grande Porto, Grande Lisboa
and Algarve present three municipalities each in this situation, respectively, Vila Nova
de Gaia, Matosinhos and Porto; Mafra, Cascais and Lisboa; Aljezur, Albufeira and
Faro. Península de Setúbal presents two municipalities (Almada and Setúbal) that claim
�
�
�
�
�
�
�
�
�
�
% Municipalities with availableinformation regarding publ. transp.
87.5 to 100 (8)80 to 87.5 (5)70.7 to 80 (2)60 to 70.7 (6)33.3 to 60 (7)
% Municipalities withpriority lanes for buses
�67
� 33 .5
� 6.7
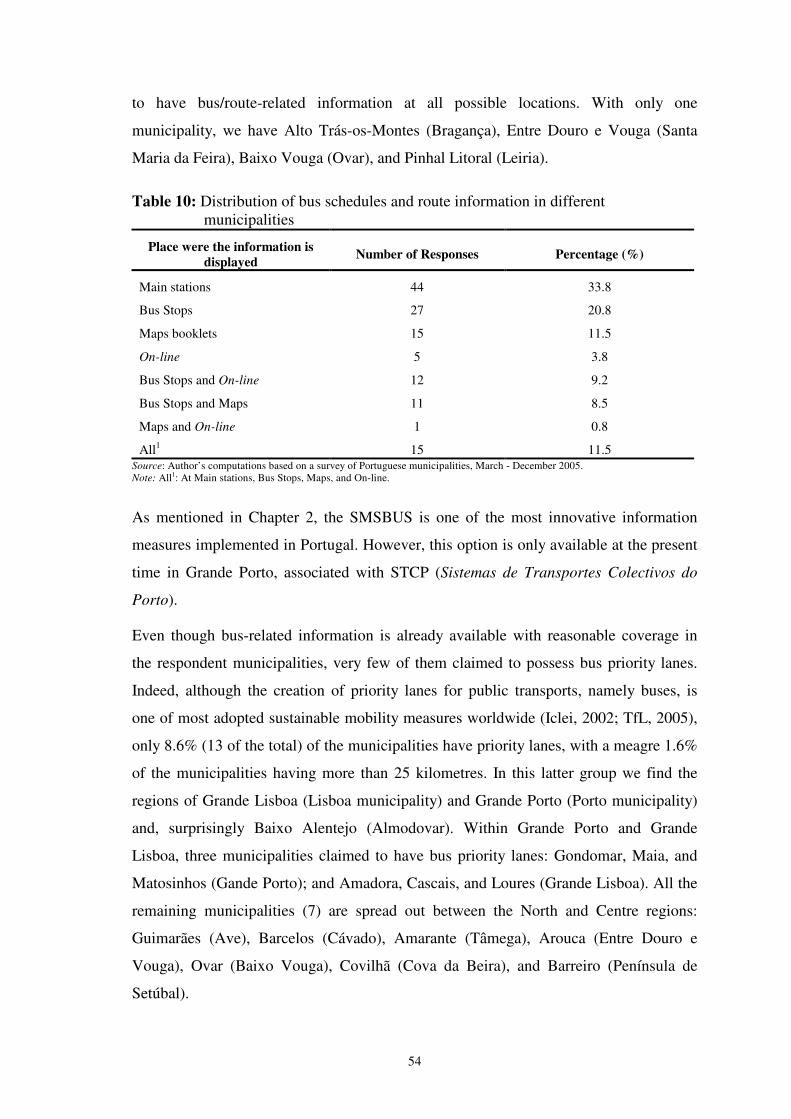
54
to have bus/route-related information at all possible locations. With only one
municipality, we have Alto Trás-os-Montes (Bragança), Entre Douro e Vouga (Santa
Maria da Feira), Baixo Vouga (Ovar), and Pinhal Litoral (Leiria).
Table 10: Distribution of bus schedules and route information in different municipalities
Place were the information is displayed Number of Responses Percentage (%)
Main stations 44 33.8
Bus Stops 27 20.8
Maps booklets 15 11.5
On-line 5 3.8
Bus Stops and On-line 12 9.2
Bus Stops and Maps 11 8.5
Maps and On-line 1 0.8
All1 15 11.5 Source: Author’s computations based on a survey of Portuguese municipalities, March - December 2005. Note: All1: At Main stations, Bus Stops, Maps, and On-line.
As mentioned in Chapter 2, the SMSBUS is one of the most innovative information
measures implemented in Portugal. However, this option is only available at the present
time in Grande Porto, associated with STCP (Sistemas de Transportes Colectivos do
Porto).
Even though bus-related information is already available with reasonable coverage in
the respondent municipalities, very few of them claimed to possess bus priority lanes.
Indeed, although the creation of priority lanes for public transports, namely buses, is
one of most adopted sustainable mobility measures worldwide (Iclei, 2002; TfL, 2005),
only 8.6% (13 of the total) of the municipalities have priority lanes, with a meagre 1.6%
of the municipalities having more than 25 kilometres. In this latter group we find the
regions of Grande Lisboa (Lisboa municipality) and Grande Porto (Porto municipality)
and, surprisingly Baixo Alentejo (Almodovar). Within Grande Porto and Grande
Lisboa, three municipalities claimed to have bus priority lanes: Gondomar, Maia, and
Matosinhos (Gande Porto); and Amadora, Cascais, and Loures (Grande Lisboa). All the
remaining municipalities (7) are spread out between the North and Centre regions:
Guimarães (Ave), Barcelos (Cávado), Amarante (Tâmega), Arouca (Entre Douro e
Vouga), Ovar (Baixo Vouga), Covilhã (Cova da Beira), and Barreiro (Península de
Setúbal).
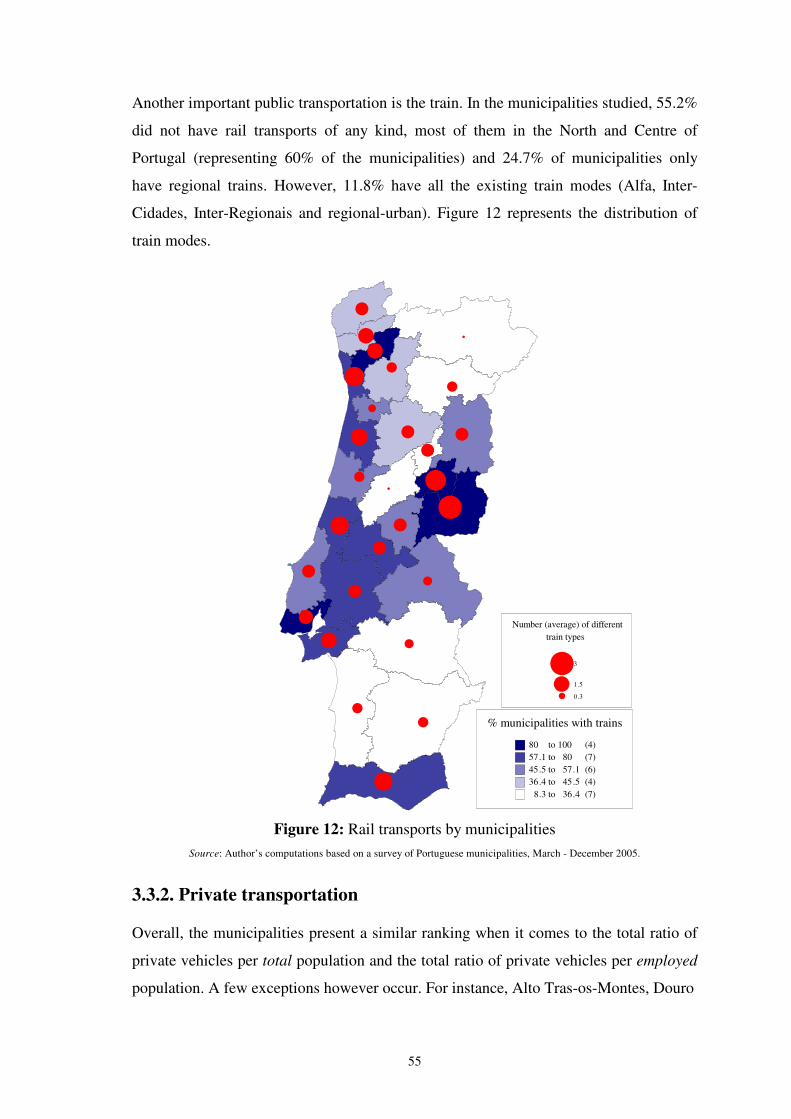
55
Another important public transportation is the train. In the municipalities studied, 55.2%
did not have rail transports of any kind, most of them in the North and Centre of
Portugal (representing 60% of the municipalities) and 24.7% of municipalities only
have regional trains. However, 11.8% have all the existing train modes (Alfa, Inter-
Cidades, Inter-Regionais and regional-urban). Figure 12 represents the distribution of
train modes.
Figure 12: Rail transports by municipalities Source: Author’s computations based on a survey of Portuguese municipalities, March - December 2005.
3.3.2. Private transportation
Overall, the municipalities present a similar ranking when it comes to the total ratio of
private vehicles per total population and the total ratio of private vehicles per employed
population. A few exceptions however occur. For instance, Alto Tras-os-Montes, Douro
��
�
�
�
�
�
��
�
�
�
�
�
�
�
��
�
�
�
�
�
�
�
�
�
�
% municipalities with trains
80 to 100 (4)57.1 to 80 (7)45.5 to 57.1 (6)36.4 to 45.5 (4)
8.3 to 36.4 (7)
Number (average) of differenttrain types
�3
� 1.5
� 0.3

56
Pinhal Interior Sul, Serra da Estrela, Beira Interior Norte, Pinhal Interior Norte, and
Baixo Alentejo present relatively low private vehicles per total population ratios. At the
other end, with relatively high ratios of private vehicles per total population, we have
Alentejo Central, Pinhal Litoral, Grande Porto, Algarve, Alentejo Litoral, Cova da
Beira.
Figure 13: Vehicle intensity (by employed and total population) and private parks (existing and predicted in the next three years) by NUTs III
Source: Author’s computations based on a survey of Portuguese municipalities, March - December 2005.
In 60% of the NUTs III regions, all respondent municipalities claimed to have exclusive
private vehicle parking. However, only in Grande Porto, Península de Setúbal, and
Grande Lisboa over 80% of their municipalities predict, in the next three years, building
additional parks.
It is interesting to note that those regions – two in the North (Entre Douro e Vouga,
Douro); three in the Centre (Cova da Beira, Baixo Vouga, Pinhal Interior Norte); two in
Lisboa e Vale do Tejo (Medio Tejo, Oeste); and four in the Alentejo (Baixo Alentejo,
�
�
�
�
�
�
��
�
�
�
�
�
�
�
�
�
�
�
�
�
�
�
�
�
�
Ratio private vehiclesper total population
0.561 to 0.801 (5)0.521 to 0.561 (5)0.501 to 0.521 (6)0.455 to 0.501 (6)0.315 to 0.455 (6)
% municip. predictingincrease parks in the next 3y
�100
� 50
� 10
% municip. with privatevehicle parks
1 Dot = 2
�
�
�
�
�
�
��
�
�
�
�
�
�
�
�
�
�
�
�
�
�
�
�
�
�
Ratio of private vehiclesper employed population
1.43 to 1.74 (4)1.38 to 1.43 (4)1.33 to 1.38 (6)1.25 to 1.33 (7)0.66 to 1.25 (7)
% municipalities withprivate vehicles parks
1 Dot = 2
% municip. predictingincrease parks in the next 3 y
�100
� 50
� 10

57
Alto Alentejo, Alentejo Litoral, Alentejo Central) - where a smaller percentage of
municipalities point out having exclusive private vehicle parks, are the same ones that
acknowledge that building exclusive private parks in the next three years is not a
priority.
In what concerns the potential correlation between the ratio of private vehicles to total
(and employed) population and the willingness to build additional exclusive private
parks in the next three years, our data fail to show any kind of (statistical linear)
relation. In fact, although in the case of Grande Lisboa the two variables are directly
correlated, in the cases of Grande Porto and Península de Setúbal, there is a symmetrical
relation, that is, low ratios of private vehicles to total (and employed) population are
associated with a high percentage of municipalities (in fact all) that predict increasing
their exclusive private parks in the next three years.
Figure 14: Number of private vehicles and the distribution of non-paid private vehicle parks Source: Author’s computations based on a survey of Portuguese municipalities, March - December 2005.
Note: In this figure, the relative distribution of non-paid private vehicle parks is based on the grouping of percentages, corresponding ‘0’ to[ 0%, 25%[, ‘1’ to [ 25%, 50%[, ‘2’ to [ 50%, 75%[, and ‘3’ to [ 75%, 100%].
�
�
�
�
�
�
�
�
�
�
�
�
�
�
�
�
�
�
�
�
�
�
�
�
�
�
�
�
Relative distribution of non-paidprivate vehicles park
3 to 3 (7)2 .88 to 3 (2)2 .73 to 2 .88 (6)2 .4 to 2 .73 (7)1 .75 to 2 .4 (6)
Number of private vehicles
�230,000
� 115,000
� 23,000
Cova da Beira
Grande Lisboa
Ave
Grande Porto
Entre o Douro e Vouga
Baixo Mondego

58
To analyse the issue of private vehicle parking we asked the municipalities about each
of the different types of parking - Non-paid parks, which bear no cost for the owner of
the vehicle; Parking Meters and Paid Parks - to distribute them into four categories: 0%
to 25%; 25% to 50%; 50% to 75%, and 75% and over.
We found that 76.6% of the municipalities have 75% or over of non-paid parks, which
tends to benefit exclusively private cars. Only 1.1% of the respondent municipalities
have 75% or over Paid Parks.
It is possible to observe from Figure 14 a negative correlation between the number of
private vehicles and the distribution of non-paid private vehicle parks. This seems to
reflect some sensibility on the part of municipalities regarding the control of the
increase in the number of private vehicles in the municipalities by imposing a fee of the
type ‘polluter-payer’, as in these municipalities there is a relatively higher percentage of
paid parks and parking meters.
In particular, 8 (14) of the twenty-eight NUTs III include municipalities with 25% and
more paid parks (parking meters). Baixo Mondego, Cova da Beira and Gande Lisboa
are the regions with the highest percentage of municipalities claiming to possess 25%
and more paid parks and parking meters. We can also underline the relatively good
performance of Ave, Grande Porto and Entre Douro e Vouga in this regard.
As for freight vehicle parking, the regions which present the highest percentage of
municipalities claming to have these parks are Pinhal Interior Sul (all municipalities),
Beira Interior Norte (with 83.3%) and Cávado (with 80%). However, in the next three
years only Beira Interior Norte (with half of its municipalities) intends to increase the
number of freight parks. Most of the regions where over 50% of the corresponding total
municipalities that have freight parks do not intend to increase these parks in the near
future (e.g., Baixo Mondego, Serra da Estrela, Entre Douro e Vouga, and Beira Interior
Sul).
Moreover, of those regions where less than 30% of their total municipalities have
freight parks, only Algarve and Dão-Lafões present a high percentage of municipalities
intending to add new freight parks in the next 3 years.
As we can see in the next figure, although there is some correlation between freight
intensity and the existence of freight parks, no correlation exists between that intensity
and the regions’ (average) intentions to build new parks.

59
A curious ‘cluster’ of high intensity freight ratio and high percentage of municipalities
with freight parks is located at the Centre and Lisboa e Vale do Tejo regions,
encompassing 6 NUTs III (Pinhal Interior Norte, Pinhal Litoral, and Pinhal Interior Sul;
Médio Tejo, Oeste, and Lezíria do Tejo).
Figure 15: Freight intensity by total population (average) and existing and predicted (in the next three years) freight parks (% total municipalities in each NUTs III)
Source: Author’s computations based on a survey of Portuguese municipalities, March - December 2005.
3.3.3. Alternative transportation
Alternative transportation is one of the sustainable measures that can be considered a
success in cities like Amsterdam. In the Report of the First International Ecological
Conference, Kilcoyne wrote “culture plays little or no role in travel mode choice. One
could argue, for example, that extensive use is part of the Dutch culture. But in this
context culture is the result, not the cause, of bicycle prominence” (Roseland, 1992: 76).
�
�
�
�
�
�
�
�
�
�
�
�
�
�
�
�
�
�
�
�
Ratio of freight vehiclesper total population
0.02 to 0.032 (6)0.019 to 0.02 (1)0.014 to 0.019 (9)0.012 to 0.014 (6)0.005 to 0.012 (6)
% municip. predictingincrease parks in next 3y
�50
� 25
� 5
% municip. withfreight parks
1 Dot = 2

60
To implement the use of alternative transportation, municipalities, besides changing the
citizens’ attitude through communication and information, have to create the
infrastructures necessary to support the alternative transportation. Two of the alternative
transportation indicators that were analysed in the present survey were the number of
kilometres of lanes for alternative transportation, namely bicycles, and the number of
parks exclusively used by bicycles throughout the municipalities.
Figure 16: Relation between the percentage of municipalities in each NUTs III having
and predicting increase in bicycle parks and their Education and Cultural, and Development Index
Source: Author’s computations based on a survey of Portuguese municipalities, March - December 2005.
The Education and Cultural Index was taken from Fonseca (2002), “Índices de Desenvolvimento Concelhio”, Revista de Estatística, INE.
In terms of existing alternative transport infrastructure, the regions that present 60% and
over of its total municipalities with bicycle parks are in the North, Minho-Lima and
Ave, in the Centre, Baixo Mondego and Pinhal Litoral, in Lisboa e Vale do Tejo,
Península de Setúbal, and in the South, the Algarve. However, in the two Northern
regions, none of their municipalities intends to increase (within 3 years) the bicycle
�
�
�
�
��
�
�
�
�
�
�
�
�
�
�
�
�
�
Development IndexPortugal=100
87.7 to 119.9 (5)81.4 to 87.7 (4)77.2 to 81.4 (7)73.8 to 77.2 (6)62.4 to 73.8 (6)
% municip. predictingincrease parks in next 3y
�100
� 50
� 10
% municip. withbicycle parks
1 Dot = 2
�
�
�
�
��
�
�
�
�
�
�
�
�
�
�
�
�
�
Education and Cultural IndexPortugal=100
92.6 to 109.3 (5)85.3 to 92.6 (5)82.3 to 85.3 (6)78.9 to 82.3 (6)70.8 to 78.9 (6)
% municip. predictingincrease parks in next 3y
�100
� 50
� 10
% municip. withbicycle parks
1 Dot = 2
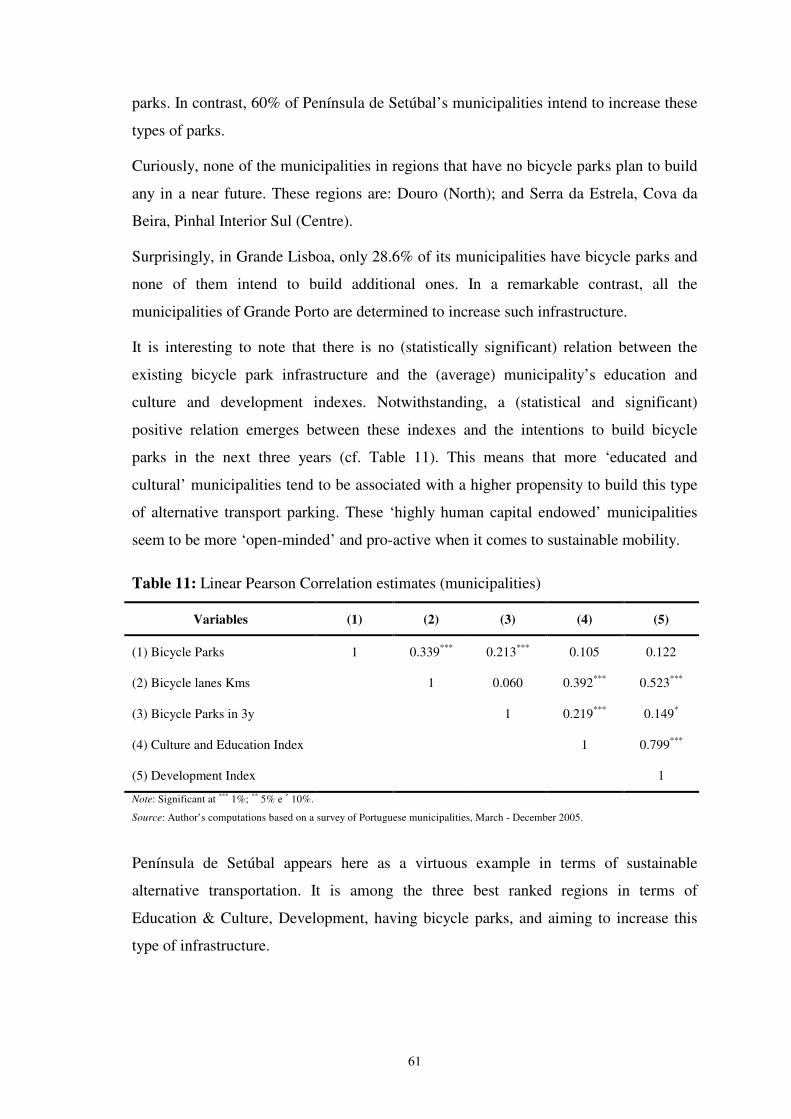
61
parks. In contrast, 60% of Península de Setúbal’s municipalities intend to increase these
types of parks.
Curiously, none of the municipalities in regions that have no bicycle parks plan to build
any in a near future. These regions are: Douro (North); and Serra da Estrela, Cova da
Beira, Pinhal Interior Sul (Centre).
Surprisingly, in Grande Lisboa, only 28.6% of its municipalities have bicycle parks and
none of them intend to build additional ones. In a remarkable contrast, all the
municipalities of Grande Porto are determined to increase such infrastructure.
It is interesting to note that there is no (statistically significant) relation between the
existing bicycle park infrastructure and the (average) municipality’s education and
culture and development indexes. Notwithstanding, a (statistical and significant)
positive relation emerges between these indexes and the intentions to build bicycle
parks in the next three years (cf. Table 11). This means that more ‘educated and
cultural’ municipalities tend to be associated with a higher propensity to build this type
of alternative transport parking. These ‘highly human capital endowed’ municipalities
seem to be more ‘open-minded’ and pro-active when it comes to sustainable mobility.
Table 11: Linear Pearson Correlation estimates (municipalities)
Variables (1) (2) (3) (4) (5)
(1) Bicycle Parks 1 0.339*** 0.213*** 0.105 0.122
(2) Bicycle lanes Kms 1 0.060 0.392*** 0.523***
(3) Bicycle Parks in 3y 1 0.219*** 0.149*
(4) Culture and Education Index 1 0.799***
(5) Development Index 1
Note: Significant at *** 1%; ** 5% e * 10%.
Source: Author’s computations based on a survey of Portuguese municipalities, March - December 2005.
Península de Setúbal appears here as a virtuous example in terms of sustainable
alternative transportation. It is among the three best ranked regions in terms of
Education & Culture, Development, having bicycle parks, and aiming to increase this
type of infrastructure.

62
The worst example comes from Pinhal Interior Sul, the less developed region of
Portugal both in Culture & Education and economic terms; combining with this bleak
picture inadequate behaviour towards sustainable mobility measures.
Figure 17: Relation between the percentage of municipalities in each NUTs III having and predicting an increase in bicycle parks and their Education and Cultural, and Development
Index Source: Author’s computations based on a survey of Portuguese municipalities, March - December 2005.
The Education and Cultural Index was taken from Fonseca (2002), “Índices de Desenvolvimento Concelhio”, Revista de Estatística, INE.
In Table 11 we compute that the correlation between the municipality’s average
Education & Culture and Development Indexes and the corresponding (average)
number of bicycle lanes (in km) is positive and statistically significant, particularly in
the case of the Development Index (Pearson correlation coefficient of 0.5232).
We observed that although the majority (73.5%) of the Portuguese municipalities do not
have any lanes for alternative transportation, namely bicycles, 21.7% of the
municipalities already have between 1 to 10 kilometres of priority lanes for bicycles,
3.7% have between 11-25 kilometres, and 1.1% have more than 25 kilometres. In the
�
�
�
�
�
�
�
�
�
�
�
�
�
�
�
�
�
�
�
�
�
�
Development IndexPortugal=100
87.7 to 119.9 (5)81.4 to 87.7 (4)77.2 to 81.4 (7)73.8 to 77.2 (6)62.4 to 73.8 (6)
Number (average) of bicycleKm lanes
�1.3
� 0.65
� 0.13
�
�
�
�
�
�
�
�
�
�
�
�
�
�
�
�
�
�
�
�
�
�
Education and Cultural IndexPortugal=100
92.6 to 109.3 (5)85.3 to 92.6 (5)82.3 to 85.3 (6)78.9 to 82.3 (6)70.8 to 78.9 (6)
Number (average) of bicycleskm lanes
�2
� 1
� 0.2

63
second group we find the municipalities of Ponte de Lima (Minho-Lima), Guimarães
(Ave), Cantenhede and Mira (Baixo Mondego), Cascais and Lisboa (Grande Lisboa),
and Tavira (Algarve). In the third and last case we have the municipalities of Marinha
Grande (Pinhal Litoral) and Beja (Baixo Alentejo).
This seems to suggest that these latter municipalities are starting to give some
importance to alternative transports as a way to promote better quality of life.
In the Douro, Entre Douro e Vouga, Beira Interior Norte, Pinhal Interior Sul, Alentejo
Litoral and Alto Alentejo regions none of the municipalities possess bicycle lanes.
3.4. Sustainable mobility-related knowledge and planning capacity of
Portuguese municipalities
The third group of the survey conducted on Portuguese municipalities is related to land
use and urban planning. This group of questioned aimed to assess the pro-activity of the
municipalities in this regard. We questioned municipalities on their involvement and
participation in urban programmes, whether they had mobility plans, whether they had
conducted or contracted studies on mobility management and land use and the
promotion of surveys to assess citizens’ satisfaction regarding mobility within the
municipality.
To better assess the sensibility of the municipalities in relation to mobility management
issues we analyse three variables simultaneously that we considered as the most
relevant: mobility studies, mobility plans and surveys to assess citizens’ satisfaction.
There is some degree of linear association between the mobility studies, mobility plans
and mobility surveys at the municipality level - the estimates of the Pearson linear
correlation coefficient are positive and significant at 5% (cf. Table12).
Table 12: Linear Pearson Correlation estimates (municipalities)
Variables (1) Mobility Studies (2) Mobility Plans (3) Mobility Surveys
(1) Mobility Studies 1 0.247** 0.294**
(2) Mobility Plans 1 0.245**
(3) Mobility Surveys 1
Note: Significant at *** 1%; ** 5% e * 10%. N=177
Source: Author’s computations based on a survey of Portuguese municipalities, March - December 2005.

64
Entre Douro e Vouga and Península de Setúbal are the only regions were all the
municipalities have mobility studies. However, there are also six regions that have at
least half of their municipalities with mobility studies such as Cávado, Grande Porto,
Pinhal Litoral, Lezíria do Tejo and Algarve.
Similarly to the mobility studies, Entre Douro e Vouga, Pinhal Litoral and Leziria do
Tejo, plus Cova da Beira and Beira Interior Sul, are the regions were half or more of
their municipalities have mobility plans, providing further evidence that these two
measures are correlated.
Douro stands at the other end, the only region that does not have any municipality with
mobility studies, mobility plans or surveys to assess citizens’ satisfaction. Nevertheless,
municipalities in two other regions - Cávado and Pinhal Interior Sul - claim to not have
mobility plans.
There are three regions were at least half of the municipalities have surveyed their
citizens regarding mobility issues, two in the Centre of Portugal - Beira Interior Sul and
Pinhal Interior Sul -, and one in Lisboa e Vale do Tejo (Grande Lisboa).
Although Entre Douro e Vouga is the region with more municipalities with mobility
studies and mobility plans, none of its municipalities have surveyed their citizens on
mobility satisfaction. Other regions where none of their municipalities prepared a
survey of their citizens are Minho e Lima, Tâmega, Serra da Estrela and Médio Tejo.
In contrast to the analyses of the commitment and intervention of municipalities in
mobility issues, when assessing the knowledge levels and planning capacity of the
municipalities, we note that Grande Porto is not one of the most pro-active regions; in
fact, only 28.6% of its municipalities have mobility plans and 14.3% have surveyed
their citizens’ satisfaction.
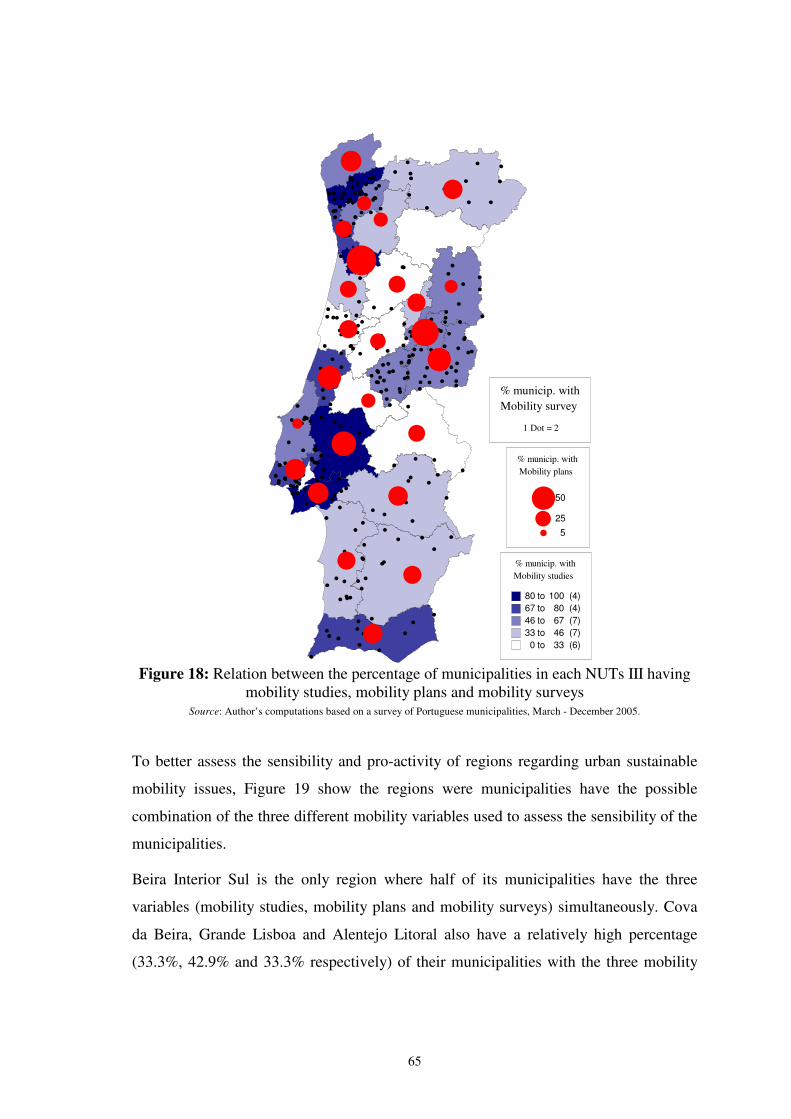
65
Figure 18: Relation between the percentage of municipalities in each NUTs III having mobility studies, mobility plans and mobility surveys
Source: Author’s computations based on a survey of Portuguese municipalities, March - December 2005.
To better assess the sensibility and pro-activity of regions regarding urban sustainable
mobility issues, Figure 19 show the regions were municipalities have the possible
combination of the three different mobility variables used to assess the sensibility of the
municipalities.
Beira Interior Sul is the only region where half of its municipalities have the three
variables (mobility studies, mobility plans and mobility surveys) simultaneously. Cova
da Beira, Grande Lisboa and Alentejo Litoral also have a relatively high percentage
(33.3%, 42.9% and 33.3% respectively) of their municipalities with the three mobility
�
�
�
��
��
�
�
�
�
�
�
�
��
�
�
�
�
�
��
�
�
% municip. withMobility studies
80 to 100 (4)67 to 80 (4)46 to 67 (7)33 to 46 (7)0 to 33 (6)
% municip. withMobility plans
�50
� 25
� 5
% municip. withMobility survey
1 Dot = 2

66
sensibility measures. Nevertheless, in more than half (57%) of the total twenty-eight
NUTs III regions, none of the municipalities claim to have all three indicators.
In Entre Douro e Vouga, Cova da Beira, Pinhal Interior Sul, Beira Interior Sul, and
Grande Lisboa half or more of their municipalities claim to have, at least, two of the
three variables.
Figure 19: Relation between the percentage of municipalities in each NUTs III possessing at
least one of the measures, at least two of the measures or all three measures
Source: Author’s computations based on a survey of Portuguese municipalities, March - December 2005.
With regard to mobility studies, 46.6% of the respondent municipalities declare having
a mobility study. Although it is a solid percentage (almost half of the total respondent
municipalities) most of them (84%) were completed in the last 5 years (cf. Figure 20). It
should also be noted that a significant part of these studies aim to assess the
municipality’s conditions for people with physical disabilities.
�
�
�
��
�
�
�
��
�
�
�
�
�
��
�
�
�
�
�
�
�
�
�
% municip. withat least one measure
80 to 100 (6)64 to 80 (4)60 to 64 (5)46 to 60 (6)0 to 46 (7)
% municip. withat least two measures
�100
� 50
� 10
% municip. withall three measures
1 Dot = 1

67
0,00
5,00
10,00
15,00
20,00
25,00
30,00
No-
res
pons
e
1991
1992
1994
1996
1997
1998
1999
2000
2001
2002
2003
2004
2005
Years
Val
id P
erce
ntag
e (%
)
Figure 20: Evolution of municipalities’ mobility studies distribution (in %) between
1991 and 2005 Source: Author’s computations based on a survey of Portuguese municipalities, March - December 2005.
It is interesting to note that the first municipalities to perform mobility studies in
Portugal (from those that responded to our survey) are rather peripheral and inland
municipalities, namely Mação (Pinhal Interior Sul), in 1991, followed in 1992 by
Montalegre (Alto Trás os Montes), in 1994 by Guarda (Beira Interior Norte) and in
1996 by Faro (Algarve).
As expected, a high percentage of the municipalities (93.3%) outsourced their mobility
studies to consultants or universities, usually in partnership with the municipality.
As we can see in Figure 21, the existence of mobility studies in the municipality is
significantly (linearly) correlated with the Development Index. That is, those regions
where municipalities have more mobility studies, namely Grande Porto, Pinhal Litoral,
Grande Lisboa, Península de Setúbal and Algarve, are also the ones that rank higher in
terms of development.
Although not as significant, there is also a very good correlation between regions where
municipalities have mobility studies with the level of educated workers in the mobility
issues department. Once again, the regions Grande Porto, Pinhal Litoral and Peninsula
de Setúbal appear as the ones where their municipalities have a high human capital
intensity in the department in charge of mobility issues.
The Douro region is less sensitive to mobility issues, given that it comprises the
municipalities that claim to not have mobility studies, and are simultaneously the
municipalities with low human capital intensities in the mobility issues department.

68
Figure 21: Relation between the percentage of municipalities in each NUTs III having mobility studies and Development Index and ratio of educated workers in the mobility
issues department Source: Author’s computations based on a survey of Portuguese municipalities, March - December 2005.
The Developmentl Index was taken from Fonseca (2002), “Índices de Desenvolvimento Concelhio”, Revista de Estatística, INE.
Only a small number, 29.7%, of the respondent municipalities acknowledge having a
mobility plan. However, most of them (61.7%) only began in the last 3 years. Figure 22
illustrates the evolution of mobility plans over the years. Similarly to mobility studies it
is possible to see a positive evolution of the municipalities’ interest in mobility
management. Curiously, the pioneering municipalities in this regard were Góis (Pinhal
Interior Norte, which implemented its mobility plan as far back as 1980, and Évora
(Alentejo Central), which implemented its mobility plan ten years later.
�
�
�
�
�
�
�
�
�
�
�
�
�
��
�
�
�
�
�
�
�
�
�
�
�
�
HC intensity (%)Mobility issues department
56.3 to 100 (5)42.2 to 56.3 (5)34.8 to 42.2 (6)27.7 to 34.8 (6)2.6 to 27.7 (6)
% municip. withMobility studies
�100
� 50
� 10
�
�
�
�
�
�
�
�
�
�
�
�
�
��
�
�
�
�
�
�
�
�
�
�
�
�
Development IndexPortugal=100
87.7 to 119.9 (5)81.4 to 87.7 (4)77.2 to 81.4 (7)73.8 to 77.2 (6)62.4 to 73.8 (6)
% municip. withMobility studies
�100
� 50
� 10

69
0,00
5,00
10,00
15,00
20,00
25,00
30,00
No-
resp
onse
1980
1990
1994
1995
1996
1997
1998
1999
2000
2001
2002
2003
2004
2005
Years
Val
id P
erce
ntag
e (%
)
Figure 22: Evolution of municipalities’ mobility plans distribution (in %) between 1980
and 2005 Source: Author’s computations based on a survey of Portuguese municipalities, March - December 2005.
As we can see in Figure 23, out of the twenty eight NUTs III regions, only Entre Douro
e Vouga, Cova da Beira, Beira Interior Sul, Pinhal Litoral and Lezíria do Tejo have
more than half of their municipalities with mobility plans. It is interesting to note that
among these regions Pinhal Litoral is the only one that presents a reasonably high level
of development (as measured by the Development Index).
There are three regions where none of the municipalities have mobility plans: Cávado,
Douro and Pinhal Interior Sul, the latter two being the Portuguese regions with the
lowest level of development.
Correlating the (average) human capital intensity in the department in charge of
mobility issues and the percentage of municipalities in each NUTs III with mobility
plans, Cova da Beira and Pinhal Litoral appear as regions with a significant percentage
of municipalities (66.7% and 50%, respectively) with mobility plans and a high average
human capital intensity of employees in mobility-related departments. Nevertheless,
Pinhal Interior Sul, where none of its municipalities have mobility plans, is the region
with the highest rate of top educated workers in the mobility issues department. This
situation, as pointed out in the first section of the present chapter, is related to the small
number of total workers in the mobility issues department in the municipalities of this
region, usually one (university graduate) worker per department.
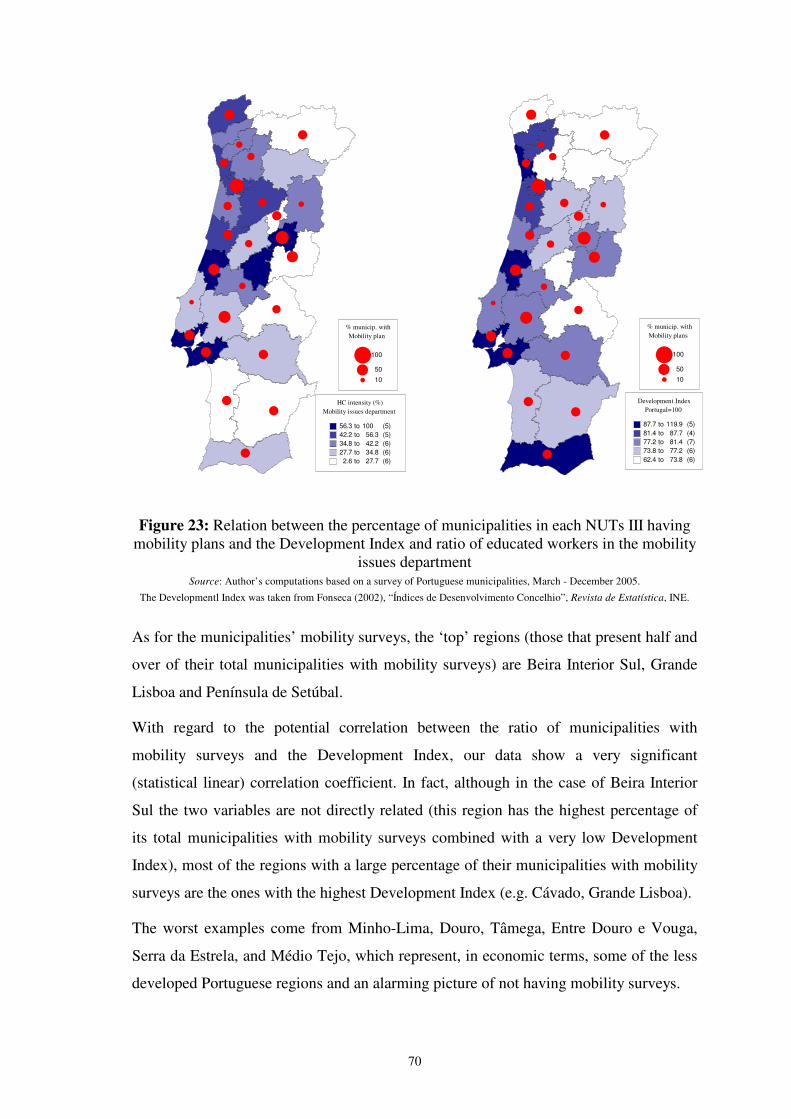
70
Figure 23: Relation between the percentage of municipalities in each NUTs III having mobility plans and the Development Index and ratio of educated workers in the mobility
issues department Source: Author’s computations based on a survey of Portuguese municipalities, March - December 2005.
The Developmentl Index was taken from Fonseca (2002), “Índices de Desenvolvimento Concelhio”, Revista de Estatística, INE.
As for the municipalities’ mobility surveys, the ‘top’ regions (those that present half and
over of their total municipalities with mobility surveys) are Beira Interior Sul, Grande
Lisboa and Península de Setúbal.
With regard to the potential correlation between the ratio of municipalities with
mobility surveys and the Development Index, our data show a very significant
(statistical linear) correlation coefficient. In fact, although in the case of Beira Interior
Sul the two variables are not directly related (this region has the highest percentage of
its total municipalities with mobility surveys combined with a very low Development
Index), most of the regions with a large percentage of their municipalities with mobility
surveys are the ones with the highest Development Index (e.g. Cávado, Grande Lisboa).
The worst examples come from Minho-Lima, Douro, Tâmega, Entre Douro e Vouga,
Serra da Estrela, and Médio Tejo, which represent, in economic terms, some of the less
developed Portuguese regions and an alarming picture of not having mobility surveys.
�
�
�
��
�
�
�
�
�
�
�
�
�
��
�
�
�
�
�
�
�
�
�
HC intensity (%)Mobility issues department
56.3 to 100 (5)42.2 to 56.3 (5)34.8 to 42.2 (6)27.7 to 34.8 (6)2.6 to 27.7 (6)
% municip. withMobility plan
�100
� 50
� 10
�
�
�
��
�
�
�
�
�
�
�
�
�
��
�
�
�
�
�
�
�
�
�
Development IndexPortugal=100
87.7 to 119.9 (5)81.4 to 87.7 (4)77.2 to 81.4 (7)73.8 to 77.2 (6)62.4 to 73.8 (6)
% municip. withMobility plans
�100
� 50
� 10

71
Despite the importance of citizens’ feedback and the existence of reasonable levels of
communication between citizens and the municipal authorities, only 18% of the
respondent municipalities have prepared a mobility survey.
Such evidence underlines the fact that the Portuguese local authorities lack a certain
degree of entrepreneurial behaviour and still have a long way to go in terms of
sustainable mobility.
Figure 24: Relation between the percentage of municipalities in each NUTs III with mobility surveys and the Development Index and ratio of educated workers in the
mobility issues department Source: Author’s computations based on a survey of Portuguese municipalities, March - December 2005.
The Developmentl Index was taken from Fonseca (2002), “Índices de Desenvolvimento Concelhio”, Revista de Estatística, INE.
As already mentioned previously, it is important to integrate mobility management with
urban planning, and presently several programmes exist (cf. Chapter 2) in which
municipalities can participate. According to our survey, around one third of the
municipalities have already participated in at least one urban programme. In Table 13,
we present the different programmes in which the respondent municipalities have
already participated.
�
��
�
�
� �
�
�
�
�
��
�
�
�
�
�
�
��
�
Development IndexPortugal=100
87.7 to 119.9 (5)81.4 to 87.7 (4)77.2 to 81.4 (7)73.8 to 77.2 (6)62.4 to 73.8 (6)
% municip. withMobility surveys
�58
� 29
� 5.8
�
��
�
�
� �
�
�
�
�
��
�
�
�
�
�
�
��
�
HC intensity (%)mobility issues department
56.3 to 100 (5)42.2 to 56.3 (5)34.8 to 42.2 (6)27.7 to 34.8 (6)
2.6 to 27.7 (6)
% municip. withMobility surveys
�58
� 29
� 5.8

72
Table 13: Distribution of municipalities by programmes that integrate mobility management and urban planning
(1) Polis (2) Prosiurb (3) Urbcom (4) Urban (5) Other &
no response
Total % Municipalities (1) + ...+ (5)
Number Municipalities participating in the programme
(1) Polis 30.5 1.7 3.4 35.6 21 (2) Prosiurb 20.3 3.4 23.7 14 (3) Urbcom 1.7 3.4 16.9 22.0 13 (4) Urban 3.4 6.8 10.2 6 (5) Other & no response1 16.9 16.9 10
1 Other urban programmes not mentioned in Chapter 2; Six municipalities (3.1% of the respondent’s total) that acknowledged participation in urban programmes did not specify which one(s).
Source: Author’s computations based on a survey of Portuguese municipalities, March - December 2005.
As expected, given its wider coverage and vast publicity by the government (e.g.,
outdoors, TV), Polis was the most sought out programme by the Portuguese
municipalities.31
The highest rate of municipal participation (68%) in the programmes overall occurred
between 2000 and 2003 which coincides with the beginning of the Polis, Urbcom and
Urban programmes.
It is interesting to note (cf. Figure 25) that only two of the total twenty eight NUTs III
regions have all their municipalities participating in urban programmes, one in the
North - Entre Douro e Vouga - and the other in Lisboa e Vale do Tejo - Península de
Setúbal. However, there are eight NUTs III that have half and over of their
municipalities participating in urban programmes. Listed from North to South we have,
in the North, Alto Trás os Montes, and Ave; in the Centre, Baixo Mondego and Beira
Interior Sul; in Lisboa and Vale do Tejo, Médio Tejo; and in Alentejo, Baixo Alentejo.
Oddly, the regions of Grande Porto and Grande Lisboa, particularly the latter, appear
with a relatively small percentage of municipalities participating in this type of
programme, respectively 42.9% and 28.6%.
Among those regions that do not have any of their municipalities participating in urban
31 The POLIS Programme for urban regeneration and environmental enhancement of medium-sized cities - of ministerial responsibility - was meant to set a national example of urban quality. The programme was, in a first phase, implemented in 18 Portuguese cities (Albufeira, Aveiro, Beja, Bragança, Cacém, Castelo-Branco, Coimbra, Costa da Caparica, Covilhã, Guarda, Leiria, Matosinhos, Porto, Viana do Castelo, Vila do Conde, Vila Nova de Gaia, Vila Real, Viseu). In a second phase another 10 cities were added to the programme. Urban regeneration projects with a strong environmental component should develop a model for other actions to be undertaken throughout the country. (at http://home.fa.utl.pt/~camarinhas/1.htm, accessed on 06.05.27).
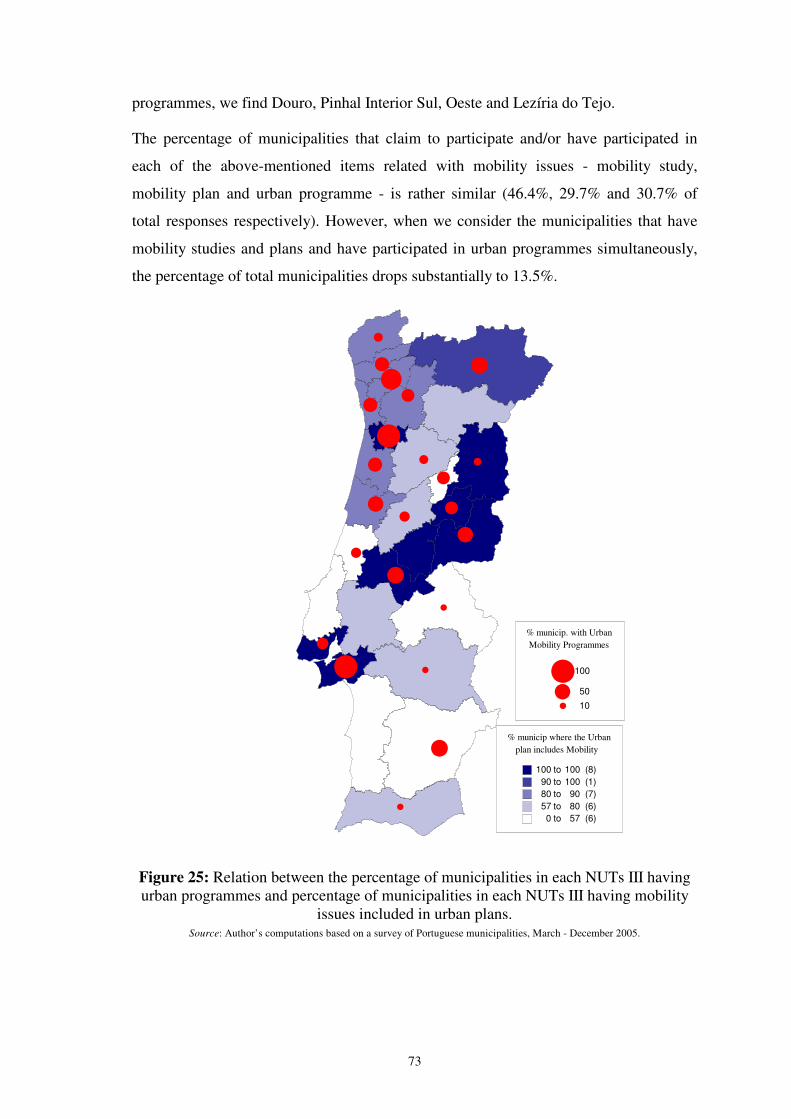
73
programmes, we find Douro, Pinhal Interior Sul, Oeste and Lezíria do Tejo.
The percentage of municipalities that claim to participate and/or have participated in
each of the above-mentioned items related with mobility issues - mobility study,
mobility plan and urban programme - is rather similar (46.4%, 29.7% and 30.7% of
total responses respectively). However, when we consider the municipalities that have
mobility studies and plans and have participated in urban programmes simultaneously,
the percentage of total municipalities drops substantially to 13.5%.
Figure 25: Relation between the percentage of municipalities in each NUTs III having urban programmes and percentage of municipalities in each NUTs III having mobility
issues included in urban plans. Source: Author’s computations based on a survey of Portuguese municipalities, March - December 2005.
�
�
�
�
�
�
�
�
�
�
��
�
�
�
�
�
�
� �
�
�
�
% municip where the Urbanplan includes Mobility
100 to 100 (8)90 to 100 (1)80 to 90 (7)57 to 80 (6)0 to 57 (6)
% municip. with UrbanMobility Programmes
�100
� 50
� 10

74
When it comes to the inclusion of mobility measures in urban plans (Figure 25), all the
municipalities in the regions Entre Douro e Vouga, Beira (North); Beira Interior Norte,
Cova da Beira, Beira Interior Sul, Pinhal Interior Sul (Centre); Médio Tejo, Grande
Lisboa, and Península de Setúbal (Lisboa e Vale do Tejo), claimed to have already
included them. In contrast, the Alentejo Litoral region is the only one where all the
municipalities indicated they have not included mobility measures in their urban plan.
It is interesting to note that the potential (statistic linear) correlation between the
inclusion of mobility indicators in urban plans and the municipalities’ participation in
urban programmes is significant (Pearson coefficient estimate of 0.329, significant at
1%).
In almost three-quarters of the municipalities, urban plans already include mobility
management issues. Table 14 presents the different mobility indicators mentioned in the
urban plan.
Table 14: Different mobility indicators mentioned in the urban plan
Indicators Nº municipalities Percentage (%)
Public transportation trip time 8 6.1
Number of public transportation 6 4.5
Variety of public transportation 4 3.0
Public transportation waiting time 1 0.8
Two or more of the selected indicators 17 12.9
All the selected indicators 24 18.2
Others 66 50.0
No-response 6 4.5
Total 132 100
Source: Author’s computations based on a survey of Portuguese municipalities, March - December 2005.
In half of the cases, the municipalities responded that they were including ‘other’
indicators such as private car infrastructures or (in fewer cases) infrastructures and
facilities for individuals with mobility constraints. Note that although some
municipalities include indicators encouraging the growth of public transportation (lower
waiting times, additional transportation modes), the majority include indicators that
implicitly encourage the use of private cars.

75
Although 62.4% of the respondent municipalities claimed to have considered mobility
measures in their PDM – Plano Director Municipal (Municipal Master Plan),32 the
number of municipalities that have not done so is still considerably high. In this latter
case, and in terms of NUTs III regions, we have, for instance, Beira Interior Sul and
Pinhal Interior Sul, where none of their municipalities claimed to include mobility
measures in PDM.
3.5. Sensibility and sustainable mobility measures at the level of
Portuguese municipalities. What is the relation?
3.5.1. Aims and model specification
The aim here is to find out which are the main determinants of the municipalities’
propensity/sensibility for sustainable urban mobility. To assess the municipalities’
sensibility we use a combination of three different yet interrelated dimensions or
indicators of the phenomena (as described in the previous sections): 1) the municipality
conducted a mobility study; 2) the municipality has a mobility plan; 3) the municipality
conducted a survey of its citizens regarding their satisfaction with mobility issues. Thus,
we built three indicators of the municipality’s sensibility regarding mobility issues: 1)
the municipality has one of the three above-mentioned items (mobility study; mobility
plan; mobility survey); 2) the municipality has two of the three above-mentioned items
(mobility study; mobility plan; mobility survey); 3) the (log) number of the items
(mobility study; mobility plan; mobility survey) that the municipality has.33
The nature of the data observed relative to the first two dependent variable [Have one
(or two) of the tree measures? (1) Yes; (0) No] dictates the choice of the estimation
model. Conventional estimation techniques (e.g., multiple regression analysis), in the
context of a discrete dependent variable, are not a valid option. Firstly, the assumptions
needed for hypothesis testing in conventional regression analysis are necessarily
violated – it is unreasonable to assume, for instance, that the distribution of errors is
normal. Secondly, in multiple regression analysis predicted values cannot be interpreted
32 It should be noted that most of the respondent municipalities (64.6%) are now (2005-2006) reviewing their PDM. 33 Regarding this latter variable we add 1 to the number of items in order to avoid the impossibility when we log the number [i.e., the new variable comes log(number+1)].

76
as probabilities – they are not constrained to fall within the interval between 0 and 1.34
The approach used, therefore, is to analyse each situation in the general framework of
probabilistic models.
Prob (event j occurs) = Prob (Y=j) = F[relevant effects: parameters].
In our theoretical model of the municipalities’ sensibility towards sustainable mobility
issues it is believed (cf. Chapters 1 and 2) that a set of factors gathered on a vector X,
can explain the outcome, so that
),(1)0(Pr),()1(Pr ββ XFYobandXFYob −==== .
Among these factors we have the organisation of the department in charge of mobility
issues (number and type of workers employed); the sustainable mobility indicators
(alternative transportation – bicycle parks and lanes; public transportation – number of
operators, exclusive lanes, social passes, schedule and route information, ratio of public
transport to population, trains; and private transportation – number of motorcycles per
10000 inhabitants, private vehicle and freight parks, ratio of private vehicles and freight
to population, auto average age); local policy related indicators (the municipality
participates in programmes targeting urban regeneration; urban plans and the PDM
explicitly mentioning mobility issues); characteristics of the municipalities namely in
terms of development – Education and Cultural Index, and Employment ratio;
location/region of the municipality (whether it is an inland or coastal municipality, and
if it belongs to the North, Centre, Lisboa e Vale do Tejo, Alentejo or Algarve).
The set of β parameters reflects the impact of changes in X on the likelihood of the
municipality being ‘sensitive to sustainable mobility issues’. The problem at this point
is to devise a suitable model for the right-hand side of the equation. The requirement is
for a model that will produce predictions consistent with the underlying theory. For a
given vector of regressors, we would expect
0)1(Prlim1)1(Prlim ====−∞→′+∞→′
YobandYobXX ββ
.
34 The logistic regression model is also preferred to another conventional estimation technique, discriminant analysis. According to Hosmer and Lemeshow (1989), even when the assumptions required for discriminant analysis are satisfied, logistic regression still performs well.
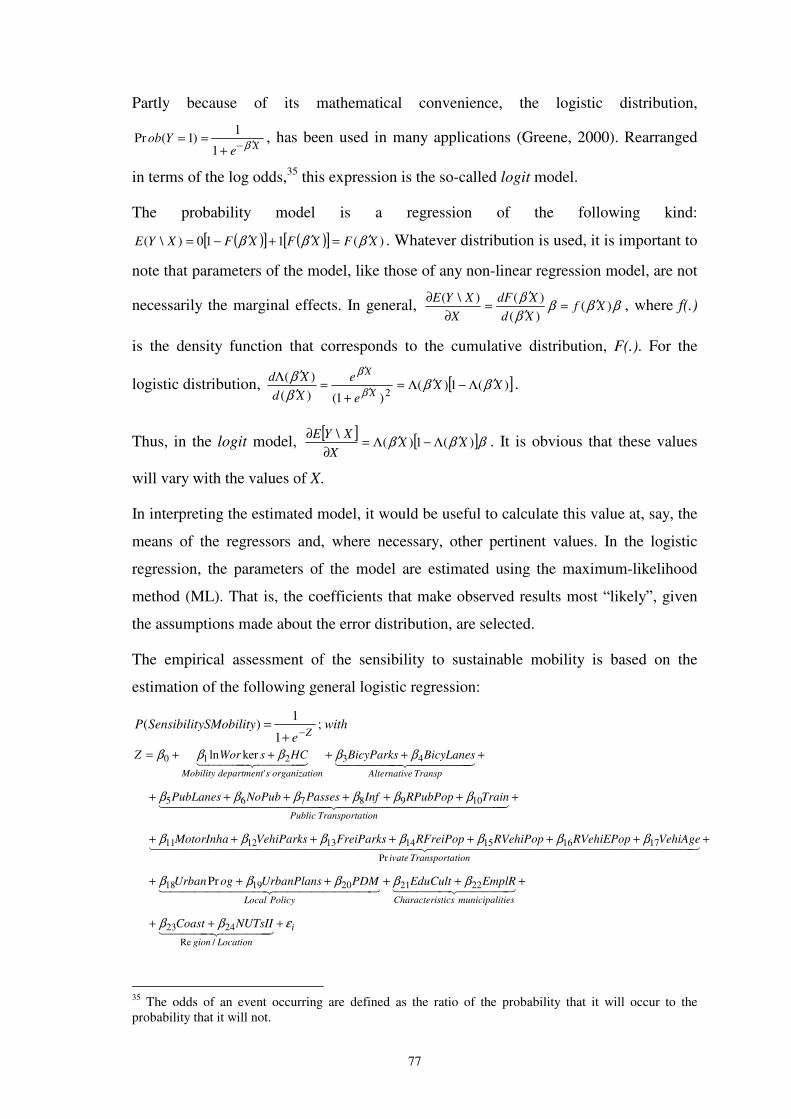
77
Partly because of its mathematical convenience, the logistic distribution,
XeYob β ′−+
==1
1)1(Pr , has been used in many applications (Greene, 2000). Rearranged
in terms of the log odds,35 this expression is the so-called logit model.
The probability model is a regression of the following kind:
( )[ ] ( )[ ] )(110)\( XFXFXFXYE βββ ′=′+′−= . Whatever distribution is used, it is important to
note that parameters of the model, like those of any non-linear regression model, are not
necessarily the marginal effects. In general, βββββ
)()()()\(
XfXdXdF
XXYE ′=
′′
=∂
∂ , where f(.)
is the density function that corresponds to the cumulative distribution, F(.). For the
logistic distribution, [ ])(1)()1()(
)(2
XXe
eXdXd
X
Xββ
ββ
β
β′Λ−′Λ=
+=
′′Λ
′
′.
Thus, in the logit model, [ ] [ ]βββ )(1)(\
XXX
XYE ′Λ−′Λ=∂
∂ . It is obvious that these values
will vary with the values of X.
In interpreting the estimated model, it would be useful to calculate this value at, say, the
means of the regressors and, where necessary, other pertinent values. In the logistic
regression, the parameters of the model are estimated using the maximum-likelihood
method (ML). That is, the coefficients that make observed results most “likely”, given
the assumptions made about the error distribution, are selected.
The empirical assessment of the sensibility to sustainable mobility is based on the
estimation of the following general logistic regression:
withe
ySMobilitySensibilitPZ
;1
1)(
−+=
i
Locationgion
tiesmunicipalisticsCharacteriPolicyLocal
tionTransportaivate
tionTransportaPublic
TranspeAlternativonorganizatisdepartmentMobility
NUTsIICoast
EmplREduCultPDMUrbanPlansogUrban
VehiAgeRVehiEPopRVehiPopRFreiPopFreiParksVehiParksMotorInha
TrainRPubPopInfPassesNoPubPubLanes
BicyLanesBicyParksHCsWorZ
εββ
βββββ
βββββββ
ββββββ
βββββ
+++
++++++
++++++++
+++++++
+++++=
���� ����� ��
���� ����� ���������� ��������� ��
���������������������� ����������������������� ��
�������������� ��������������� ��
����� ������ ������ ����� ��
/Re
2423
2221201918
Pr
17161514131211
1098765
43'
210
Pr
kerln
35 The odds of an event occurring are defined as the ratio of the probability that it will occur to the probability that it will not.

78
In order to have a more straightforward interpretation of the logistic coefficients, it is
convenient to consider a rearrangement of the equation for the logistic model, in which
the logistic model is rewritten in terms of the odds of an event occurring.
Writing the logistic model in terms of the odds, we obtain the logit model
i
Locationgion
tiesymunicipalisticsCharacteriPolicyLocal
tionTransportaivate
tionTransportaPublic
TranspeAlternativonorganizatisdepartmentMobility
NUTsIICoast
EmplREduCultPDMUrbanPlansogUrban
VehiAgeRVehiEPopRVehiPopRFreiPopFreiParksVehiParksMotorInha
TrainRPubPopInfPassesNoPubPubLanes
BicyLanesBicyParksHCsWorSensibleNotob
Sensibleob
εββ
βββββ
βββββββ
ββββββ
βββββ
+++
++++++
++++++++
+++++++
+++++=���
����
�
���� ����� ��
���� ����� ���������� ��������� ��
���������������������� ����������������������� ��
�������������� ��������������� ��
����� ������ ������ ����� ��
/Re
2423
2221201918
Pr
17161514131211
1098765
43'
210
Pr
kerln)(Pr
)(Prlog
The logistic coefficient can be interpreted[CAM1] as the change in the log odds associated
with a one-unit change in the independent variable. Then e raised to the power βi is the
factor by which the odds change when the ith independent variable increases by one unit.
If βi is positive, this factor will be greater than 1, which means that the odds are
increased; if βi is negative, the factor will be less than one, which means that the odds
are decreased. When βi is 0, the factor equals 1, which leaves the odds unchanged.
In the case where the data corroborates the hypothesis:
“Municipalities with high human capital intensive departments (which are in charge of
mobility issues) are more likely to be sensitive to sustainable urban mobility”,
the estimate of β2 should appear as positive and significant for the conventional levels
of statistical significance (that is, 1%, 5% or 10%).
The estimates of the βs are given in Table 15 below, related with three alternative
models, two logit models, Model I and Model II, which are estimated by Maximum
Likelihood (ML) (as explained above), and a linear regression model, Model III,
estimated by the traditional Ordinary Least Square (OLS) method.36 In the first two
36 Linear Regression estimates the coefficients of the linear equation, involving one or more independent variables, that best predict the value of the dependent variable. This model assumes that for each value of the independent variable, the distribution of the dependent variable is normal; the variance of the distribution of the dependent variable is constant for all values of the independent variable; and the relationship between the dependent variable and each independent variable is linear, and all observations are independent.
79
models the dependent variable is dichotomist, that is, it assumes the values 0 or 1. In
particular, in Model I the proxy for the municipalities’ sensibility to sustainable
mobility is the indicator ‘having one of the three measures – mobility study, mobility
plan, mobility survey - selected’, whereas in Model II the dependent variable
(municipalities’ sensibility to sustainable mobility) is proxied by the indicator ‘having
two of the three measures – mobility study, mobility plan, mobility survey - selected’.
In Model III the dependent variable is proxied by (the natural log of) a continuous
variable that sums up the number of measures related with sustainable mobility that the
municipality adopted.

80
Table 15: Determinants of the Portuguese municipalities’ sensibility regarding sustainable mobility
Logit model (ML estimation) OLS estimation
Implemented one of the three measures
Implemented two of the three measures
Number of measures
adopted (ln)
β̂ )ˆ(βExp β̂ )ˆ(βExp β̂
Number of workers (ln) 0,78*** 2,17 0,02 1,02 0,07* Mobility issue department organisation Ratio of graduate to total workers 2,68** 14,58 0,78 2,17 0,20
Bicycle parks (yes=1) 1,70*** 5,49 1,54*** 4,67 0,27*** Alternative transportation
Bicycle lane (yes=1) 2,30*** 9,93 0,76 2,14 0,30***
Public transportation lane (yes=1) 1,01 2,74 0,81 2,25 0,14
Number of public transportation operators (ln)
0,71 2,04 -2,16 0,12 -0,08
Social pass (yes=1) 0,50 1,64 1,18 3,27 0,13
Public transportation schedule and route information (yes=1)
0,56 1,75 1,25 3,50 0,10
Ratio of the number of public transports to population
-192,22 0,00 -372,43 0,00 -37,41
Public transportation
Train (yes=1) 0,26 1,30 1,08* 2,93 0,07
Number of motorcycles per 10000 inhab.
0,01 1,01 0,01 1,01 0,00
Private vehicle parks (yes=1) 2,04* 7,70 1,19 3,30 0,17
Freight vehicle parks (yes=1) -0,24 0,78 0,26 1,30 -0,03
Ratio of the number of freights to population
-23,94 0,00 45,96 9,16E+19 0,45
Ratio of private vehicles to employed population
3,22** 24,98 1,22 3,39 0,38**
Sustainable mobility
indicators
Private transportation
Auto average age 1,34*** 3,82 1,14** 3,11 0,18***
Urban regeneration programmes (yes=1)
-0,06 0,94 1,35** 3,85 0,08
Urban plans explicitly mentioning mobility (yes=1) 1,67*** 5,29 0,53 1,70 0,20* Local policy related indicators
PDM explicitly mentioning mobility (yes=1) 0,22 1,25 0,99 2,69 0,10
Education and cultural index -0,03 0,98 0,03* 1,03 0,00 Development indicators
Employment ratio 26,09*** 2,14E+11 10,17 2,61E+04 2,78**
Coastal municipalities (yes=1) -0,92 0,40 -0,85 0,43 -0,11
North 2,07* 7,95 2,74** 15,51 0,31**
Centre -0,52 0,59 0,49 1,62 -0,02
Alentejo 1,78 5,95 -0,32 0,73 0,19
Region
Algarve 1,12 3,07 2,42 11,25 0,26
Constant -36,12*** 0,00 -28,29*** 0,00 -4,20*** % correct 80,0 81,5 F-stat 3,65***
Nagelkerke R2 0,52 0,53 Rsqadj 0,34 Hosmer & Lemeshow Test (p-value) 11,07 (0,20) 9,23 (0,32) D-W 1,97
Note: Significant at *** 1%; ** 5% e * 10%.
81
3.5.2. Estimation results
The goodness of fit measures selected - Hosmer and Lemeshow’s test, percentage
corrected, and Nagelkerke R2, in the case of the two first models, and the F-Statistics,
Adjusted R2, and Durbin-Watson, in the case of the third model – reveal that all the
estimated models have a reasonable fit. In fact, and according to the Hosmer and
Lemeshow’s test, both Model I and II reveal a good fit. This test’s null hypothesis
indicates that the values predicted by the model are not significantly different from the
observed values. Given that the p-value is not significant for standard values (1%, 5%,
and 10%), this hypothesis is not rejected, leading us to the conclusion that the models
reflect reality reasonably well. Moreover, in both models, around 80% of values were
correctly predicted, and they explain (cf Nagelkerke R2), on average, around half of the
variance of the dependent variables. In the linear regression model (Model III), the
goodness of fit statistics reveal that, overall, the model is significant (F-Statistics is
significant at 1%), explaining on average, around one third of the variance of the
dependent variable (adjusted R-square of 34%), and the residuals are not serially
correlated (Durbin-Watson test is around 2).
Using the results of the first model, which compares municipalities that possess at least
two of the three selected measures of sustainable mobility (mobility study, mobility
plan, mobility survey) to municipalities that do not have any of the measures, the
determinants of the municipalities’ sensibility towards sustainable urban mobility is
positively and significantly related with the dimension and quality of the department in
charge of mobility issues. Specifically, on average, municipalities with large and more
human capital intensive (higher number of university graduate workers to total workers)
departments are, ceteris paribus, those that are more aware of sustainable mobility
issues. Moreover, municipalities that have alternative transports, namely bicycles, tend
to be more mobility conscious. According to our results, the odds ratio of mobility
sensibility changes by the factor 5.49 [e1.70] (9.93 [e2.30]) when municipalities have
bicycle parks (lanes) compared with the case of municipalities that do not have parks
(lanes).
All the indicators related with public transport fail to emerge as significant determinants
of Portuguese municipalities’ awareness of sustainable mobility issues. Controlling for
all the factors likely to explain this awareness (included in the models), having

82
exclusive bus lanes, a large number of public transport operators, social passes, and
available information on schedules and routes, as well as possessing trains, does not
significantly determine the municipalities’ sensibility towards sustainable mobility. This
result is robust regardless of the model selected.
In what concerns private transportation the picture changes somewhat, where two of the
five selected indicators turn out to be statistically significant – the ratio of private
vehicles to employed population and (more strongly) the auto average age. Put more
simply, all else remaining constant, municipalities with more acute problems in terms of
mobility, that is, larger ratios of private vehicles to employed population and older auto
parks, seems to be more sensitive to sustainable mobility issues; in other words, these
municipalities are more entrepreneurial when devising mobility studies, implementing
mobility plans and/or assessing the degree of satisfaction of their citizens in this regard.
When we control for the region, level of development and other municipal traits,
participating in urban regeneration programmes (e.g, POLIS, URBCOM) does not
necessarily lead to a higher awareness on the part of the municipality of sustainable
mobility. Results show that more than simply participating in this type of programme, a
more committed attitude is necessary, namely that the municipalities’ urban plans
explicitly mention mobility issues and indicators.
As expected, municipalities that are characterised by higher employment rates tend to
be, on average, more mobility aware, in the sense that employment rates are usually
associated with higher degrees of traffic congestion and require a more in-depth
analysis of alternative mobility solutions. The municipal level of education and culture
arise as a significant and positive determinant in cases where the municipality’s
sensibility is assessed by more demanding indicators, in particular that of having two of
the three (mobility study, plan or survey) selected measures of mobility awareness.
Finally, although the results do not show any kind of divide between Coastal – In-Land
municipalities, all three models clearly estimated evidence of a higher awareness in
Northern municipalities of sustainable mobility issues. On average, all remaining
factors constant, Northern municipalities present a higher probability of being more
sensitive to sustainable mobility issues than municipalities located in Lisboa e Vale do
Tejo (the default category). More specifically, the odds ratio of mobility sensibility is 8
times (Model I) to 15 (Model II) times higher in the Northern municipalities than in the
municipalities located in Lisboa e Vale do Tejo.

83
Conclusion
Cities are growing more rapidly than ever with the corresponding increased pressure on the
capacity and range of their transport systems, suffering among other problems from car-
choked areas.
Although this problem is already widely recognised by the different international groups and
governments, it has been very difficult to come to an agreement about what is the best
strategy for urban spatial organisation and (sustainable) mobility management.
Nevertheless, today’s citizens already understand that sprawling cities that cater to the
automobile are, to a large extent, the result of government choices to foster road construction
and car infrastructures aimed at boosting economic development. Nevertheless, citizens can
bring pressure to bear on local authorities to choose a different future. Cities could be made
more sustainable with the integration of innovative types of transports.
The benchmarking of different international cities, presented in the first chapter, reveals that
some local authorities already have strategies targeting sustainable mobility management,
where such strategies are adapted to the cities’ and citizens’ needs and possibilities. A wide
range of measures can be found in different cities such as information campaigns, new forms
of land use and physical planning, emissions standards, transport technologies and mobility
constraints (pollutant-paid).
The strategy for success is to a large extent explained by the implementation of horizontal
measures, such as education and communications, with more practical measures, such as
intermodality between different public transportation modes; adoption of alternative non-
pollutant transportation, and innovative measures to stop the circulation of private vehicles.
Thus, it is important that the local authorities and society in general assume more
responsibilities and challenges in the organisation and management of urban planning and
mobility management.
We need to recognise that, in spite of the failures and weaknesses that still persist, EU
regional policy has been successful enough to build some strong partnerships at various levels
– Regional, Local and Non-governmental (Gudmundsson, 2003).
In Portugal, the transport sector is one of the most relevant sectors in government revenues.
Nevertheless, the central government is transferring more competences to local authorities
(municipalities), claiming that the municipalities are closer to the citizens and are better
prepared to answer their needs. Although Portuguese municipalities still face a lack of

84
capabilities (especially in rural areas), they are aware that administrative modernisation is a
necessity, and have come to recognise their role in developing sustainable communities.
However, in most of cases, they remain focused on the old, car-centred perspective, giving
priority to private car infrastructural investments to boost higher quality for drivers.
Something is however (slowly) changing. Several best practices in Portuguese municipalities
can be pointed out which have addressed the growth of urban areas and supported the pressure
caused by the rise in the number of vehicles. The public transport system has been expanding
both in size and capacity, with the implementation of intermodality and multimodal tickets,
more and better public transportation infrastructures, interactive information, alternative
transportation, among others. The competitiveness of these entrepreneurial actions has arisen
from the intersection of land-use planning, transport systems, know-how and innovation – the
interaction between sustainability and globalisation (Marques, 2004).
Our survey was designed to give a global view of the Portuguese municipalities’ awareness of
sustainable mobility management, assessing their entrepreneurial approach to this issue,
through their commitment, intervention and sensibility.
The data gathered in our survey allowed us to conclude that the majority of the municipalities
already deal with mobility issues, showing a recent concern for mobility management
problems. One good indicator of this is the fact that the percentage of employees with
university degrees working on mobility issues in municipalities is above the corresponding
overall Portuguese total employment average. However, most of the respondent
municipalities delegate this task to divisions of other departments, revealing therefore a
relatively low degree of commitment to the issue. Only six municipalities claimed to have
mobility departments and most of them were located in the two Portuguese metropolitan areas
(Lisboa and Porto).
In what concerns public transportation, more than half of the municipalities have more than
one operator. However, more than two thirds of the municipalities do not have any kind of
multimodal tickets, which illustrates a certain lack of communication between the operators,
since most of the time they prefer to compete rather than collaborate with each other.
The new organisational systems should benefit, now more than ever, from the coordination
and integration of the public transportation supply, given the global international results when
it comes to the efficiency of operators (productivity and costs) as well the effectiveness of the
public transportation system (more utilisation) (Szyliowicz, 2003).
85
Although in a significant number of the municipalities there is already information about
public transportation schedules and routes, most of the municipalities do not considered the
creation of priority lanes for buses relevant, and still given priority to the private car. This
point is also clearly demonstrated in the survey when a reasonable number of the
municipalities present as mobility indicators in their urban plans the construction of new
infrastructures for private car circulation.
This overall Portuguese choice for organising cities in benefit of private cars can also be
verified through the number of exclusive parks for private vehicles: more than 90% of the
municipalities have these and half of the respondent municipalities plan to build more in the
next three years. It should be remembered that the International Association of Public
Transportation considered that an excess of parking spaces in town centres is an incentive to
car use; towns where the market share of public transportation is high have adopted a
restrictive parking policy (UITP, 2003).
All these decisions to adopt the private vehicle as a priority and to build more and better
infrastructures are not only legitimate but also natural in the perspective of people’s
adaptation to the current situation. These decisions are (from an economic perspective)
marginally correct but, on the whole, they lead to a situation that is far from satisfactory
(Roseland, 1992). Moreover, Portugal is one of the countries where some of the highest
increases in polluting emissions have been registered (CE, 2003).
In terms of existing alternative transportation, the Portuguese case can be considered
moderately sensitive to this issue since, on average, only one third of the total respondent
municipalities have bicycle parks or/and bicycle lanes.
In terms of the Portuguese municipalities’ knowledge levels and planning capacity we
concluded that, on average, a third of the respondent municipalities have already made or
outsourced a mobility study or implemented mobility plans. Nevertheless, the percentage of
municipalities that have assessed their citizens’ satisfaction regarding mobility issues is quite
low.
One advantage of a closer link between land use and transportation planning is the possibility
of adjusting urban development to the needs of the public transportation system, by
developing a mix of functions (Herela, 2003). In almost three-quarters of the total respondent
municipalities, their urban plans already include mobility management issues and
approximately a third has already participated in at least one of the urban programmes.

86
The evaluation of the municipalities propensity/sensibility towards sustainable urban
mobility, allow us to conclude that the determinants of the municipalities’ sensibility towards
sustainable mobility are very similar both in the models where we compare the municipalities
that have at least one or at least two of the three measures with municipalities that do not have
any of the measures, and the linear regression model.
On average, municipalities with larger and more human capital intensive (high number of
university graduates) departments in charge of mobility issues are those that are more
responsive to sustainable mobility issues.
The existence of infrastructure for alternative non-pollutant transportation (bicycles) is also an
important determinant of the sensibility of the municipalities since the odds of their sensibility
ratio changes, by a factor 5 to 10, when municipalities have bicycle infrastructures in
comparison to cases where municipalities do not. Unexpectedly, all the public transportation
indicators failed to emerge as significant determinants of the Portuguese municipalities’
awareness of sustainable mobility issues. This result proves that there is a need to be more
innovative in the presentation of mobility options to the citizens.
It was also possible to conclude, as expected, that municipalities with more problems
regarding urban mobility, related to a larger ratio of private cars to employed population,
higher employment ratio and especially older auto park, are also the municipalities that are
more alert to sustainable mobility issues.
When we assessed the integration of mobility issues with land use planning, we concluded
that the municipalities that are more aware of sustainable mobility issues are those that,
having participated in urban programmes, have given continuity to the measures proposed in
these programmes and are more committed to implementing mobility measures in their urban
plans. This is indicative of the importance of the integration of the public transport system
with land use planning as already pointed out.
When analysing the sensibility of Portuguese regions, we found that municipalities from the
North present a higher probability of being more sensitive to sustainable mobility than the
municipalities located in Lisboa e Vale do Tejo. The odds ratio of mobility sensibility rises to
15 times higher in the Northern municipalities when compared with municipalities located in
Lisboa e Vale do Tejo.
From our overall exercise, we can point out the most pro-active municipalities with regard to
sustainable mobility issues, by combining all the variables used to analyse the sensibility of
Portuguese municipalities (mobility studies, mobility plans and mobility surveys). These are,

87
from North to South, Bragança (Alto Trás-os-montes); Viseu (Dão-Lafões); Fundão (Cova da
Beira); Estarreja (Baixo Vouga); Castelo Branco (Beira Interior Sul); Miranda do Corvo
(Pinhal Interior Norte); Leiria (Pinhal Litoral); Santarém (Lezíria do Tejo); Cascais, Lisboa
and Loures (Grande Lisboa); Almada (Península de Setúbal); Alcácer (Alentejo Litoral);
Évora (Alentejo Central); Beja (Baixo Alentejo); Faro (Algarve). Table 16 (Appendix 2)
present the best and the worst ranked municipalities and regions in the selected indicators.
Although Portugal lacks a cohesion policy regarding sustainable mobility among its
municipalities, there are recent and significant developments that signal positive evolution in
the years to come.
88
References
Albrechts L., Healey P. and Kunzmann K. (2003), “Strategic Spatial Planning and Regional
Governance in Europe”, APA journal 69 (2), 113 - 129
Banister, D., Stead, D., Steen, P., Akrman, J., Dreborg, K., Nijkamp, P., Shleicher-Tappeser,
R. (2000), European Transport Policy and Sustainable Mobility, E&FN Spon
Brown, L., Flavin, C. and French, H. (2001), State of the World 2001, World Watch Institute,
W.W. Norton & Company, Inc
Caetano, A.(2004), “Mobilidade Sustentável e Custos Externos”em Transportes em Revistas
Ano III (18), 38
Carlens, I. (2003), “Local Administration Management reform in Portugal and Flanders
Compared”, mimeo, Ghent University in Belgium
CE (1996), Relatório Cidades Europeias Sustentáveis, Grupo de Peritos sobre o Ambiente
Urbano Direcção Geral XI Ambiente, Segurança Nuclear e Protecção Civil, at
www.urbanismo-portugal.com, aceesed in 05.01.18
CE (2003), A Europa numa encruzilhada – A necessidade de transportes sustentáveis,
Direcção Geral de Imprensa e Comunicação, at http://europa.eu.int/, accessed in
05.01.18
CEC (2001), Environment 2010: Our future, Our choice, Sixth Environment Action
Programme of the European Community, Communication from the Commission to the
Council, the European Parliament, the Economic and Social Committee and the
Committee of the Regions, COM (2001) 31 final, Brussels, at www.ec.europa.eu,
accessed in 05.01.18
Cera, M. (2003), “Land use, transport and environmental sustainability in cities”, Polytecnic
of Bari Student paper in conference ESTER ADVANCED SEMINAR -Infrastructure,
environment and urban culture: industrial and post-industrial societies
Chin, A. (2000), “Sustainable Urban Transportation: Abatement and control of traffic
congestion and vehicular emissions from land transportation in Singapore”,
Environmental Economics and Policy Studies 3, 355-380
Costa, M. (2003), Mobilidade Urbana Sustentável: Um Estudo Comparativo e as Bases de um
Sistema de Gestão para Brasil e Portugal, Dissertação apresentada na Escola de

89
Engenharia de São Carlos da Universidade de São Paulo at http://www.teses.usp.br,
accessed in 05.01.07
CST (2002), Definition and vision for sustainable transportation, at www.cstctd.org, accessed
in 06.02.17
EC (2003), Panorama of Transports – Statistical overview of transports in the European
Union, Office for Official Publications of the European Communities, Luxembourg,
Part 2, at http://epp.eurostat.cec.eu.int, accessed in 04.12.27
Euro-cases (1998), Mobility, Transport and Traffic, in the perspective of Growth,
Competitiveness and Employment, The European Council of the Applied Sciences and
Engineering, at http://www.euro-case.org/ , accessed in 05.01.07
Fahimuddin, A. (2002), “Sustainable Transportation System: Scenario of 21st Century”, paper
presented in conference Development by Design, Bangalore, December 2002
Flavin, C. (2002), “Climbing a Steep Summit”, in World Watch 15 (5), 39
Fonseca, P. (2002), “Índices de Desenvolvimento Concelhio”, Revista de Estatística, Vol. II,
2º Quadrimestre, INE
Gilbert, R. (2000), “Sustainable Mobility in the City”, Presentation on the Urban 21, Global
Conference on the Urban Future, in the Session “Mobility in the City”, Germany, July
2000
Giorgi, L. (2003), “Sustainable Mobility Challenges, Opportunities and Conflicts – A Social
Science Perspective”, International Social Science Journal 55 (176), 179-183
Gonçalves, J. (2003), “Transportes e Ambiente”, Transportes em Revista Ano II (6), 34-35
Greene, W. H. (2000), Econometric Analysis, Prentice Hall
Gudmundsson, H. (2003), “Making Concepts Matter: Sustainable mobility and indicator
systems in transport policy”, International Social Science Journal, 55(2), 199-217
Hardt, L., Hardt, C., Oba L. (2003), “Planejamento do Desenvolvimento Urbano Sustentável”,
Position paper presented in Seminário Internacional em Gestão Urbana, Agosto de
2003
Herala, N. (2003), “Regulating Traffic with land use planning”, Sustainable Development, N.
11 pp. 91-102
90
Hook, W. (1998), Implementing the Kyoto Protocol in the Transport Sector, paper from the
Institute for Transportation and Development Policy, at http://www.itdp.org/pub,
accessed in 05.01.18
Hosmer, D. e Lemeshow, S. (1989), Applied Logistic Regression, New York: John Wiley &
Sons
Iclei (2002), Orienting Urban Planning to Sustainability in Curitiba, Brazil, Case Study 77, at
http://www.iclei.org, accessed in 06.05.28
Keller, P. (2001) “Intermodal Conectivity at European Tranportat Network Points: Why so
Late?”, Working paper nº 88, Institute of Transportation, Traffic, Highway and
Railway Engineering
Kitamura R., Mokhtarian, P., Laidet L. (1997), “A microanalysis of land use and travel in five
neighbourhoods in the San Francisco Bay Area”, Transportation 24,125-158
Marques, T (2004) Portugal na Transição do Século - Retratos e Dinâmicas Territoriais,
Edições Afrontamento.
Marshall, T., (2000), “Urban Planning and Governance: Is there a Barcelona Model?”,
International Planning Studies 5 (3), 299–319
MCOTA (1999), Relatório do Estado do Ambiente 1999, at www.iambiente.pt, accessed in
05.01.18
MCOTA (2002), Relatório do Estado do Ambiente 2002, at www.iambiente.pt, accessed in
05.01.20
Monteiro, C., Lira, P., Pereira, J. (2004), Directório VFV – Processamento integrado de
Veículos em Fim de Vida, Edições INEGI
Mota, I., Pinto, M., Sá, J. (2005), Estratégia Nacional para o Desenvolvimento sustentável -
ENDS, at http://www.portugal.gov.pt/, accessed in 05.01.21
Nikos, M. (2000), “Trends of Administrative Reform in Europe: Towards Administrative
Convergence?”, presented in First International Conference of the International
Institute of Administrative Sciences, University of Bologna
Nordhaus, W. (1991), “Lethal model 2: the limits of growth revisited”, Brookings Papers on
Economic Activity 2, 1-43
Nordhaus, W. (1992), “To slow or not to slow: the economics of the green-house effect”,
Economic Journal 101, 920-937
91
NOVEM (2001), Urban Sustainable Management and the European Commission – from
Policy to Reality, in http://www.novem.org, accessed in 05.01.05
O’Meara, M. (1999), “Reinventing Cities for People and the Planet”, World Watch paper nº
147
OECD (1999), “Project on Environmentally Sustainable Transport (EST) the economic and
social implications of sustainable transportation”, Proceedings from the Ottawa
Workshop OECD Environment Directorate, Environment Policy Committee, at
http://www.olis.oecd.org , accessed in 04.12.12
OJEC (1993), Towards Sustainability, A European Community Programme of Policy and
Action in relation to the environmental and sustainable development, No C 138/5
Osório-Peters, S., Caixinhas J., Silveira R. (2002), National Research Activities and
Sustainable Development, Country Report Portugal, from Ceifa Ambiente, at
http://www.ceifa-ambiente.pt/, accessed in 05.01.20
Pereira, P. (2004), “Governo quer rentabilizar investimento nos transportes públicos”,
Transportes em Revista, Ano III (18), 34
Ponte, A. (2003), O sector dos transportes na politica ambiental Nacional, tese de final do
curso do Instituto Superior Técnico 2003/2004, at http://meteo.ist.utl.pt, accessed in
05.01.20
Portas, N., Domingues, A., Cabral, J. (2003) Politicas Urbanas - Tendências Estratégias e
oportunidades, Fundação Calouste Gulbenkian
Portugal (2004), Programa do XVI Governo Constitucional – Reforçar a Justiça Social
Garantir a Igualdade das Oportunidades, Portal do Governo, at
http://www.portugal.gov.pt/, accessed in 04.11.15
Presidência do Conselho de Ministros, Resolução do Conselho de Ministros n.º 26/2000 from
15 of May, at http://www.diramb.gov.pt, accessed in 05-01-21
Quental N.; Silva M.; Lourenço J. (2004), “Integração de critérios objectivos de
sustentabilidade ambiental na elaboração de planos regionais de ordenamento de
território”, presented in XI Jornadas da Associação dos Urbanistas Portugueses,
Outubro de 2004
Rodenburg, C. Ubbels, B. and NijKamp, P. (2002), “Policy Scenarios for Achieving
Sustainable Transportation in Europe”, Transport Reviews, 22 (4), 449-472

92
Roseland, R. (1992), Towards Sustainable Communities: a Resource Book for Municipal and
Local Governments publisher by National Round Table on the Environment and the
Economy
Runyan C. and Norderhaug M. (2002), “The Path to the Johannesburg Summit” World Watch
– Working for a Sustainable Future, 15 (3), 33
Scaringella R. (2001), “A crise da Mobilidade Urbana em São Paulo”, São Paulo
Perspectivas 15 (1), 55-59
Scheurer, J. (2001), Urban Ecology Innovations in Housing Policy and the Future of Cities:
Towards Sustainability in Neighbourhood Communities, Un-published PhD thesis,
Institute of Sustainability and Technology Policy, Murdoch University Fremantle, at
http://www.landcentre.ca, accessed in 06.07.05
Sequinel, M. (2002), O Modelo de Sustentabilidade Urbana de Curitiba, Tese de Mestrado da
Universidade Federal de Santa Catarina, at http://teses.eps.ufsc.br, accessed in
05.03.22
Serra D. (2005), “Mobilidade Sustentável”, Transportes em Revista Ano VI (35), 1843-2250
Sheehan, M. (2001) “City Limits Putting the Brakes on Sprawl”, World Watch paper nº 156
Silva, M. (2003), Pacote Ferroviário II – A caminho de um modelo Europeu de regulação
ferroviária?, at www.intf.pt, accessed in 05.01.20
Szyliowicz, J. (2003), “Decision - Making, Intermodal Transportation, and Sustainable
Mobility: Towards a New Paradigm”; International Social Science Journal 55 (176),
185-197
Taylor, J. (1998), “Sustainable Development: Common Sense or Non Sense on Stilts”, in The
Freeman, 48 (9), 545-550
TC (2004), Sustainable Development Strategy 2004-2006, at www.tc.gc.ca, accessed in
05.01.25
TfL (2005), Transport for London 5 years investment programme – The Business Plan 2005/6
– 2009/10, at http://www.tfl.gov.uk, accessed in 05.07.02
TRB (2001), Making Transit Work: Insight from Western Europe, Canada and the United
States , Special Report 257, at http://www.nae.edu, accessed in 05.01.19
UN (1997), Kyoto Protocol, United Nations Framework Convention on Climate Change,
Third Session – Kyoto, at http://usinfo.state.gov/, accessed in 05.01.07

93
UN (2003), Energy, Transport and Atmosphere, Department of Economic and Social Affairs,
Division for Sustainable Development, at http://www.un.org, accessed in 05.01.05
UTIP (2003), “Ticket to the future: Three stops to sustainable mobility”, Sustainable
Development Charter at its World Congress in Madrid, Spain
Vazquez, I., Conceição, P. (2004), “Multi-level urban policies: a useful model for public
actions”, paper presented in the 34th Annual Meeting of the Urban Affairs Association
in Washington
Wilson, E. (ed.) (1988), Biodiversity, Collection of reports from the National Forum on
BioDiversity in Washington, USA

94
Appendix 1: Inquiry to the Portuguese Municipalities
A informação será utilizada de forma agregada e exclusivamente para fins académicos.
Câmara: ___________________________
Nome do entrevistado: ______________________
Cargo: ____________________
Contacto: _____________
1. O município tem algum departamento exclusivamente destinado às questões de gestão e mobilidade de transportes:
Não _____ Qual o departamento responsável por esta área:__________________________
Sim _____ Nº pessoas que lá trabalham: ________[Total] ________[Com curso superior]
2. O município tem parques de estacionamento exclusivamente destinados a: Prevê construir nos
próximos 3 anos Sim Não Sim Não
Veículos ligeiros (passageiros e mercadorias) Veículos pesados (passageiros e mercadorias) Bicicletas
3. Qual a distribuição relativa (%) dos lugares de parque de estacionamento 0-25% 25-50% 50-75% +75%
Lugares públicos gratuitos Lugares públicos com parcómetro Parques de estacionamento pagos
4. Quantos quilómetros o município tem dedicadas exclusivamente a: 0 1-10Km 11-25Km +25Km
Faixas de Autocarros Faixas de Bicicleta
5. No que respeita aos transportes públicos (de passageiros):
��Nº empresas actualmente a operar no município: _____[0] _____[1] _____[2-5] _____[+5]
��As empresas são maioritariamente _____[Privadas] _____[Públicas]
��Existe no município passes especiais para transportes públicos? Não ____ Sim ____ Nº de modalidades _____[1] _____[2-5] _____[+5]
Algum passe inclui mais do que um tipo de transporte público? ____[Sim] ____[Não] (e.g., metro e autocarro, carreira e autocarro, autocarro e travessia de rio)
��Existe informação dos horários e percursos dos transportes públicos disponíveis ao público: Não ____ Sim ____Nas paragens de autocarros_____On-line_____São oferecidos mapas com as linhas _____
6. No que respeita aos transportes ferroviários, a CP tem comboios que chegam a esse município Não ____ Sim ____ Regional/Urbano_____Inter/regional_____Inter/cidades______Alfa pendular_______

95
7. O município já fez/encomendou algum estudo sobre a mobilidade e acessibilidade no município? Não _____ Sim _____ Em que ano(s) _________ Entidade realizou estudo ____________________________
8. Foi efectuado algum plano de mobilidade no Município? Não _____ Sim _____ Qual/Desde que ano?
9. A cidade participou/participa em algum programa de gestão da mobilidade urbana Não _____ Sim _____ Qual/Desde que ano? Polis _______ Prosiurb ______ Urban I ou II ______
10. O plano urbanístico tem por objectivo melhorar as condições de mobilidade dos cidadãos? Não _____ Sim _____
11. Com base em que indicadores?
Tempo de viagem_______
Tempo de espera ________
Nº de transportes públicos ______
Variedade de modos de transporte______
Outro_____ Qual? _______
12. Na ultima revisão do Plano Director Municipal, que aconteceu em __________, foi considerada a vertente do planeamento dos transportes?
Não _____ Sim _____
13. Já foi feito algum inquérito aos munícipes para saber o grau de satisfação relativamente aos problemas de mobilidade:S
Sim_____ Não_____

96
Appendix 2: Best and the worst ranked municipalities and regions in the
selected indicators
Table 16: Determinants of the Portuguese municipalities’ sensibility regarding sustainable mobility
Top 5 municipalities Worst 5 municipalities
Top NUT III
Top NUT III
Arcos Valdevez Alcanena Covilhã Alvaiázere
Faro Borba Guarda Murça
Mobility Studies1
Montalegre Vizela
Entre Douro e Vouga
Douro
Góis Alcanena Évora Alvaiázere
Matosinhos Borba Guarda Murça
Mobility Plans1
Mira Vizela
Entre Douro e Vouga
Douro
Almada Alvaiázere Bragança Borba Cascais Murça
Guimarães Porto
Dependent Variables
Mobility Surveys
Lisboa Vizela
Grande Lisboa Douro
Porto Murça Alenquer Alcanena
Moura Belmonte Alcácer Alvaiázere
Number of workers
Fundão Vizela
Alentejo Litoral Médio Tejo
Oleiros Penela Amarante Alter do Chão Manteigas Murça
Carregado do Sal Alcanena
Mobility issue department organization
Ratio of graduated to total workers
Vinhais Alvaiázere
Pinhal Interior Sul
Alentejo Litoral
Lisboa Borba Porto Arruda dos Vinhos Évora Óbidos Braga Nazaré
Education and cultural index
Vila Nova de Gaia Aljezur
Grande Porto
Pinhal Interior Sul
Albufeira Vinhais
Vizela Gavião
Guimarães Montalegre
Maia Melgaço
Development indicators
Employment ratio
Vila Franca de Xira Murça
Ave Alto Trás-os-montes
Note: 1 Ranking by data (pioneers first); 2 Ranking by number of options. In case of several municipalities or regions having the same grade, the examples were was peaked regarding the position in the several ratios and existence in other rankings.

97
(…)
Top 5 municipalities Worst 5 municipalities
Top NUT III
Top NUT III
Almada Albufeira Beja Braga
Cascais Lisboa Guimarães Murça
Bicycles parks
Marinha Grande Vizela
Dão – Lafões Médio Tejo
Beja Alcanena Cascais Alvaiáze
Guimarães Borba Lisboa Murça
Alternative transportati
on
Bicycles lane
Marinha Grande Vizela
Algarve Médio Tejo
Almodôvar Alcanena Porto Alvaiáze
Lisboa Borba Cascais Murça
Public transportation lane
Guimarães Vizela
Grande Lisboa
Minho Lima
Almada Calheta Bragança Borba
Guimarães Estremoz Lisboa Melgaço
Number of public transportation operators
Vila Nova de Gaia
Grande Porto Madeira
Almada Alcanena Lisboa Borba Porto Braga
Vila Nova de Gaia Tabuaço Social pass2
Cascais Vizela
Grande Porto
Minho Lima
Albufeira Águeda Cascais Borba Lisboa Ferreira do Zêzere Porto Óbidos
Public transportation schedule and route information 2 Vila Nova de Gaia Odemira
Grande Lisboa
Beira Interior Norte
Mondim Bastos Caminha Lisboa Vizela Porto Trofa
Frei Espada Cintra Vimioso
Ratio of the number of public transports to population Faro Manteigas
Grande Lisboa Madeira
Braga Alcanena Faro Alvaiáze
Lisboa Borba Porto Odemira
Sustainable mobility indicators
Public transportati
on
Train2
Vila Nova de Gaia Tabuaço
Beira Interior Sul
Pinhal Interior Norte
Note: 1 Ranking by data (pioneers first); 2 Ranking by number of options. In case of several municipalities or regions having the same grade, the examples were was peaked regarding the position in the several ratios and existence in other rankings.
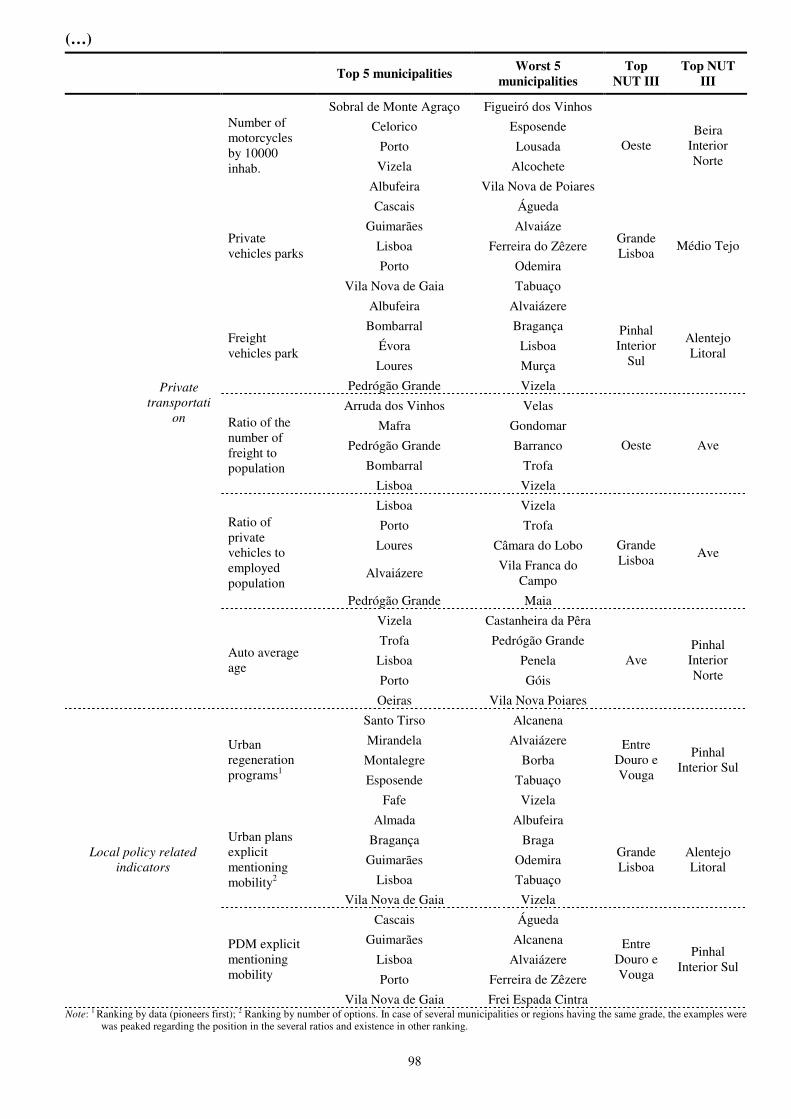
98
(…)
Top 5 municipalities Worst 5 municipalities
Top NUT III
Top NUT III
Sobral de Monte Agraço Figueiró dos Vinhos Celorico Esposende
Porto Lousada Vizela Alcochete
Number of motorcycles by 10000 inhab.
Albufeira Vila Nova de Poiares
Oeste Beira
Interior Norte
Cascais Águeda Guimarães Alvaiáze
Lisboa Ferreira do Zêzere Porto Odemira
Private vehicles parks
Vila Nova de Gaia Tabuaço
Grande Lisboa Médio Tejo
Albufeira Alvaiázere Bombarral Bragança
Évora Lisboa Loures Murça
Freight vehicles park
Pedrógão Grande Vizela
Pinhal Interior
Sul
Alentejo Litoral
Arruda dos Vinhos Velas Mafra Gondomar
Pedrógão Grande Barranco Bombarral Trofa
Ratio of the number of freight to population
Lisboa Vizela
Oeste Ave
Lisboa Vizela Porto Trofa
Loures Câmara do Lobo
Alvaiázere Vila Franca do Campo
Ratio of private vehicles to employed population
Pedrógão Grande Maia
Grande Lisboa Ave
Vizela Castanheira da Pêra Trofa Pedrógão Grande Lisboa Penela Porto Góis
Private
transportation
Auto average age
Oeiras Vila Nova Poiares
Ave Pinhal Interior Norte
Santo Tirso Alcanena Mirandela Alvaiázere Montalegre Borba Esposende Tabuaço
Urban regeneration programs1
Fafe Vizela
Entre Douro e Vouga
Pinhal Interior Sul
Almada Albufeira Bragança Braga
Guimarães Odemira Lisboa Tabuaço
Urban plans explicit mentioning mobility2
Vila Nova de Gaia Vizela
Grande Lisboa
Alentejo Litoral
Cascais Águeda Guimarães Alcanena
Lisboa Alvaiázere Porto Ferreira de Zêzere
Local policy related indicators
PDM explicit mentioning mobility
Vila Nova de Gaia Frei Espada Cintra
Entre Douro e Vouga
Pinhal Interior Sul
Note: 1 Ranking by data (pioneers first); 2 Ranking by number of options. In case of several municipalities or regions having the same grade, the examples were was peaked regarding the position in the several ratios and existence in other ranking.