entrepreneurial activity - ewing marion kauffman foundation
TRANSCRIPT
Robert W. Fairlie | March 2012
entrepreneurial activity
K A U F F M A N I N D E X O F
1996–2011

Robert W. Fairlie is aProfessor of Economics at
the University of California,Santa Cruz.
©2012 by the Ewing Marion Kauffman Foundation. All rights reserved.
2 0 1 1 K A U F F M A N I N D E X O F E N T R E P R E N E U R I A L A C T I V I T Y
1
2 0 1 1 K A U F F M A N I N D E X O F E N T R E P R E N E U R I A L A C T I V I T Y
Executive Summary ......................................................................................................................................... 2
Introduction ..................................................................................................................................................... 4
Trends in Entrepreneurial Activity ................................................................................................................. 4
Figure 1: Kauffman Index of Entrepreneurial Activity (1996–2011) ................................................................ 5
Table 1: Kauffman Index of Entrepreneurial Activity (1996–2011) ................................................................ 5
Figure 1B: Kauffman Index of Entrepreneurial Activity (1996–2011) and Employer Establishment Birth Rate (1996–2011Q2) ................................................................. 6
Entrepreneurial Activity by Demographic Groups ...................................................................................... 7
Figure 2: Kauffman Index of Entrepreneurial Activity by Gender (1996–2011) .............................................. 7
Figure 3: Kauffman Index of Entrepreneurial Activity by Race (1996–2011) .................................................. 8
Table 2: Kauffman Index of Entrepreneurial Activity by Race (1996–2011) .................................................. 8
Figure 3B: Changes in Composition of New Entrepreneurs by Race (1996, 2011) ........................................... 8
Figure 4: Kauffman Index of Entrepreneurial Activity by Nativity (1996–2011) .............................................. 9
Table 3: Kauffman Index of Entrepreneurial Activity by Nativity (1996–2011) ............................................ 10
Figure 4B: Changes in Composition of New Entrepreneurs by Nativity (1996, 2011) .................................... 10
Figure 5: Kauffman Index of Entrepreneurial Activity by Age (1996–2011) .................................................. 11
Table 4: Kauffman Index of Entrepreneurial Activity by Age (1996–2011) .................................................. 11
Figure 5B: Changes in Composition of New Entrepreneurs by Age (1996, 2011) ........................................... 12
Figure 6: Kauffman Index of Entrepreneurial Activity by Education (1996–2011) ........................................ 13
Table 5: Kauffman Index of Entrepreneurial Activity by Education (1996–2011) ........................................ 13
Entrepreneurial Activity by Industry ........................................................................................................... 14
Figure 7: Kauffman Index of Entrepreneurial Activity by Industry (1996–2011) ........................................... 14
Table 6: Kauffman Index of Entrepreneurial Activity by Industry (1996–2011) ........................................... 14
Entrepreneurial Activity by State .................................................................................................................15
Table 7: Kauffman Index of Entrepreneurial Activity by State (2011) .......................................................... 15
Figure 8: Kauffman Index of Entrepreneurial Activity by State (2011) .......................................................... 16
Figure 9: Kauffman Index of Entrepreneurial Activity by State with 95 Percent Confidence Intervals, 2011 ................................................................................. 17
Figure 10: Kauffman Index of Entrepreneurial Activity by Region (1996–2011) ............................................. 18
Table 8: Kauffman Index of Entrepreneurial Activity by Region (1996–2011) ............................................. 18
Table 9: Kauffman Index of Entrepreneurial Activity by State (2010, 2011) ................................................ 19
Table 10: Kauffman Index of Entrepreneurial Activity by State (1999–2001 to 2009–2011) ......................... 20
Entrepreneurial Activity by Metropolitan Area .......................................................................................... 21 Table 11: Kauffman Index of Entrepreneurial Activity for the Fifteen Largest MSAs (2011) ........................... 21
Summary ........................................................................................................................................................ 22
Appendix ........................................................................................................................................................ 23
Data .............................................................................................................................................. 23
Detailed Definitions ...................................................................................................................... 23
Standard Errors and Confidence Intervals ...................................................................................... 24
Advantages Over Other Possible Measures of Entrepreneurship .................................................... 25
Comparison to Specific Datasets ................................................................................................... 25
Endnotes ......................................................................................................................................................... 27
TABLE OF CONTENTS

2
2 0 1 1 K A U F F M A N I N D E X O F E N T R E P R E N E U R I A L A C T I V I T Y
• Therateofbusinesscreationdeclinedfrom340outof100,000adultsin2010to320outof100,000adultsin2011,whichrepresentsadropof5.9percent.This0.32business-creationratetranslatesintoapproximately543,000newbusinessesbeingcreatedeachmonthduringtheyear.
• Althoughtheentrepreneurshipratedeclinedin2011,itremainedmorethan5percenthigherthanbeforetherecessionstarted.Overthepastdecadeandahalf,thebusinesscreationratefluctuatedwithintherangeof0.27percentto0.31percent,butthenroseabovethislevelinthepastfouryears.Aseparatemeasurealsocalculatedinthereportshowsthat,from2007to2010,thequarterlyemployerestablishmentbirthratedroppedfrom0.13percentto0.11percent.TheseopposingtrendsmaybeduetotheGreatRecessionpushingmanyindividualsintobusinessownershipbecauseofhighratesofunemployment.Theseindividualsprobablyweremorelikelytostartsoleproprietorshipsandothernon-employerfirmsinsteadofmorecostlyemployerfirms.
• Bothmenandwomenexperiencedslightlydecliningratesofentrepreneurialactivityin2011.
• TheentrepreneurialactivityrateamongLatinosdecreasedfrom0.56percentin2010to0.52percentin2011,butremainedatahighlevelrelativetopreviousyearsandotherdemographicgroups.TheAsianentrepreneurialactivityratealsodecreasedin2011(from0.37percentto0.32percent).
• Immigrantsweremorethantwiceaslikelyaswerethenative-borntostartbusinesseseachmonthin2011.Theimmigrantrateofentrepreneurialactivitydecreasedfrom0.62percentin2010to0.55percentin2011.Thenative-bornratedeclinedfrom0.28percentin2010to0.27percentin2011.
• Theaged20–34andaged45–54groupsexperiencedincreasesinentrepreneurialactivityfrom2010to2011,whereastheaged35–44andaged55–64groupsexperienceddecreasesinrates.
TheKauffmanIndexofEntrepreneurialActivityisaleadingindicatorofnewbusinesscreationin
theUnitedStates.Capturingnewbusinessownersintheirfirstmonthofsignificantbusiness
activity,thismeasureprovidestheearliestdocumentationofnewbusinessdevelopmentacross
thecountry.Thepercentageoftheadult,non-business-ownerpopulationthatstartsabusinesseach
monthismeasuredusingdatafromtheCurrentPopulationSurvey(CPS).Inadditiontothisoverallrateof
entrepreneurialactivity,separateestimatesforspecificdemographicgroups,states,andselectmetropolitan
statisticalareas(MSAs)arepresented.TheIndexprovidestheonlynationalmeasureofbusinesscreationby
specificdemographicgroups.
New2011dataallowforanupdatetopreviousreports,withconsiderationoftrendsintherates
ofentrepreneurialactivityoverthesixteen-yearperiodbetween1996and2011.TheKauffmanIndexreveals
importantshiftsinthenationallevelofentrepreneurialactivityandshiftsinthedemographicandgeographic
compositionofnewentrepreneursacrossthecountry.Keyfindingsfor2011include:
executive summary

3
2 0 1 1 K A U F F M A N I N D E X O F E N T R E P R E N E U R I A L A C T I V I T Y
• Overthepastsixteenyears,Latinos,Asians,andimmigrantsexperiencedrisingsharesofallnewentrepreneurs,partlybecauseofrisingratesofentrepreneurship,butalsobecauseofincreasingpopulations.Theoldestagegroup(ages55–64)alsoexperiencedarisingshareofallnewentrepreneurs,mainlybecauseitrepresentsanincreasingshareofthepopulation.
• Althoughtheentrepreneurshipratedeclinedforhighschooldropoutsfrom2010to2011(0.59percentto0.57percent),therateremainedmuchhigherthanthepre-recessionlevel,whichmaybeduetolingeringhighunemploymentratespushingmanyindividualsintobusinessownershiporchangingpatternsofoutsourcingless-skilledworkers.
• Theconstructionindustryhadthehighestrateofentrepreneurialactivityofallmajorindustrygroupsin2011(1.68percent).Thesecond-highestrateofentrepreneurialactivitywasintheservicesindustry(0.42percent).
• From2010to2011,entrepreneurialactivityratesdecreasedinallregionsofthecountryexcepttheNortheast,whichexperiencedaslightincreaseinrates.EntrepreneurshipratesarehighestintheWestandlowestintheMidwest.
• ThestateswiththehighestratesofentrepreneurialactivitywereArizona(520per100,000adults),Texas(440per100,000adults),California(440per100,000adults),Colorado(420per100,000adults),andAlaska(410per100,000adults).ThestateswiththelowestratesofentrepreneurialactivitywereWestVirginia(150per100,000adults),Pennsylvania(160per100,000adults),Hawaii(180per100,000adults),Illinois(200per100,000adults),Indiana(200per100,000adults),andVirginia(200per100,000adults).
• ThestatesexperiencingthelargestincreasesinentrepreneurialactivityratesoverthepastdecadewereNevada(0.23percentagepoints),Georgia(0.18percentagepoints),Massachusetts(0.16percentagepoints),Tennessee(0.15percentagepoints),California(0.13percentagepoints),Louisiana(0.12percentagepoints),andFlorida(0.12percentagepoints).StatesthatexperiencedthelargestdecreasesinentrepreneurialactivityrateswereWyoming(-0.17percentagepoints)andNewMexico(-0.13percentagepoints).
• AmongthefifteenlargestMSAsintheUnitedStates,thehighestentrepreneurialactivityratein2011wasinLosAngeles(580per100,000adults).ThelargeMSAswiththelowestratesofentrepreneurialactivitywereChicago(180per100,000adults)andDetroit(180per100,000adults).

4
2 0 1 1 K A U F F M A N I N D E X O F E N T R E P R E N E U R I A L A C T I V I T Y
Introduction
TheKauffmanIndexofEntrepreneurialActivitymeasurestherateofbusinesscreationattheindividualownerlevel.Presenting
thepercentageoftheadult,non-business-owner
populationthatstartsabusinesseachmonth,
theKauffmanIndexcapturesallnewbusiness
owners,includingthosewhoownincorporated
orunincorporatedbusinessesandthosewho
areemployersornon-employers.1TheKauffman
Indexiscalculatedfrommatcheddatafromthe
CurrentPopulationSurvey(CPS),amonthlysurvey
conductedbytheU.S.BureauoftheCensus
andtheBureauofLaborStatistics.Thisreport
updatespreviousaccountsoftheKauffmanIndex,
incorporatingnewdatafrom2011.
TocreatetheKauffmanIndex,allindividuals
betweenagestwentyandsixty-fourwhodonot
ownabusinessastheirmainjobareidentifiedintheinitialsurveymonth.BymatchingCPSfilesforthesubsequentmonthtocreateatwo-monthsurveypair,itisthendeterminediftheseindividualsownabusinessastheirmainjobwithfifteenormoreusualhoursworkedperweekinthefollowingsurveymonth.Thesemonthlyentrepreneurialactivityratesthenareaveragedtocalculateanaveragemonthlyestimateforeachyear.Moredetailsaboutthedatasetsandmeasuresused,andwheretoaccessthemicrodataforresearchareprovidedinpreviousreportsandintheAppendix.2TheKauffmanIndexofEntrepreneurialActivityimprovesoverotherpossiblemeasuresofentrepreneurshipbecauseofitstimeliness,dynamicnature,inclusionofalltypesofbusinessactivity,exclusionof“casual”businesses,andinformationonownerdemographics.
In2011,anaverageof0.32percentoftheadultpopulation,or320outof100,000adults,createdanewbusinesseachmonth.3This
business-creationratetranslatesintoapproximately543,000newbusinessesbeingcreatedeachmonthduringtheyear.Theaveragenumberofexistingself-employedbusinessownersin2011was11.5million,representing6.3percentoftheadultpopulation.Theentrepreneurialactivityratedeclinedfromlastyearandreturnedtotheratein2008,whichmaybeduetoimprovingeconomicconditionsoverthepastyear.TheofficialendoftherecessionwasJune2009,butthenationalunemploymentrateremainednear10percentformostof2010andwasonlyconsistentlybelow9percentattheendof2011.4
Althoughtheentrepreneurshipratedeclinedin
2011,itremainedhigherthanbeforetherecessionstarted(officiallydatedDecember2007).In2006and2007,theentrepreneurshipratewas0.29and0.30percent,respectively.Overthepastdecadeandahalf,thebusinesscreationratefluctuatedwithintherangeof0.27percentto0.31percent,butthenroseabovethislevelinthepastfouryears.Figure1andTable1reportaveragemonthlyestimatesoftheKauffmanIndexbyyearfrom1996to2011.5Althoughtherearelikelytobeseparatepatternsinbusinesscreationbelowthesurface,withbothhigh-potentialbusinessesstartingandpeoplebeingforcedintoself-employedbusinessownershipbecauseoflackofotherjobopportunities,unfortunatelyitisimpossibletocleanlydisaggregatethesetwotypesofbusinesscreation.
The Kauffman Index of Entrepreneurial Activity measures the rate of business creation at the individual owner level.
Trends in Entrepreneurial Activity

5
1996 0.37% 243,368 0.26% 287,639 0.31% 531,007 1997 0.35% 244,863 0.22% 286,266 0.28% 531,129 1998 0.33% 245,820 0.25% 286,476 0.29% 532,296 1999 0.32% 246,225 0.22% 286,765 0.27% 532,990 2000 0.34% 246,522 0.21% 284,901 0.27% 531,423 2001 0.31% 264,693 0.23% 304,765 0.26% 569,458 2002 0.36% 288,595 0.22% 334,562 0.29% 623,157 2003 0.38% 284,391 0.22% 330,166 0.30% 614,557 2004 0.37% 279,373 0.24% 323,314 0.30% 602,687 2005 0.35% 276,836 0.24% 320,362 0.29% 597,198 2006 0.35% 274,825 0.23% 316,781 0.29% 591,606 2007 0.41% 271,807 0.20% 314,441 0.30% 586,248 2008 0.42% 272,218 0.24% 312,167 0.32% 584,385 2009 0.43% 276,445 0.25% 315,254 0.34% 591,699 2010 0.44% 277,387 0.24% 315,884 0.34% 593,271 2011 0.42% 273,887 0.23% 312,259 0.32% 586,146
2 0 1 1 K A U F F M A N I N D E X O F E N T R E P R E N E U R I A L A C T I V I T Y
Notes: (1) Estimates calculated by Robert W. Fairlie, University of California, Santa Cruz, using the Current Population Survey. (2) The entrepreneurship index is the percent of individuals (ages twenty to sixty-four) who do not own a business in the first survey month that start a business in the following month with fifteen or more hours worked. (3) All observations with allocated labor force status, class of worker, and hours worked variables are excluded.
Visit www.kauffman.org/kiea to download the data files.
Sample Sample Sample Year Index Size Index Size Index Size
MALE FEMALE
TABLE 1
Kauffman Index of Entrepreneurial Activity (1996–2011)
TOTAL
0.0%1996 1997 1998 1999 2000 2001 2002 2003 2004 2005 2006 2007 2008 2009 2010 2011
0.1%
0.2%
0.3%
0.4%
0.5%
SOURCE: Robert W. Fairlie, University of California, Santa Cruz, using the Current Population Survey.
Figure 1
Kauffman Index of Entrepreneurial Activity(1996–2011)

6
2 0 1 1 K A U F F M A N I N D E X O F E N T R E P R E N E U R I A L A C T I V I T Y
Thedropinentrepreneurshipratesin2011differsfromanessentiallyflatpatterninemployerbusinesscreationfrom2010to2011.Figure1BreportsaveragequarterlyestimatesofemployerestablishmentbirthratesinadditiontotheaveragemonthlyestimatesoftheKauffmanIndexbyyearfrom1996to2011.Theemployerestablishmentbirthrateistheratiooftheaveragequarterlynumberofestablishmentbirthsdividedbytheaveragenumberofnon-businessowners.ThenumberofestablishmentbirthsisfromtheBusinessEmployerDynamics(BED)compiledbytheU.S.BureauofLaborStatistics(BLS),andthenumberofnon-businessownersisestimatedusingcross-sectionalCPSdata.Theemployerestablishmentbirthratewas0.11percentor11outof100,000peopleperquarterin2011(onlythefirstquarterofdatawasavailablefor2011atthetimeofthisreport).Thisratetranslatesintoanaverageof183,000employerestablishmentbirthsperquarterin2011.Thisnumberandrateofbusinesscreation
issubstantiallysmallerthanthenumberandrateofbusinesscreationfromtheKauffmanIndex,especiallyaftertakingintoaccountthattheKIEAisamonthlyrate.Thelargedifferenceisprimarilybecausetheemployerestablishmentbirthrateonlycapturesnewestablishmentswithemployees,indicatingthattheyrepresentonlyasmallshareofallnewbusinesses.
From2007to2010,thequarterlyemployerestablishmentbirthratedroppedfrom0.13percentto0.11percent.6Overthissameperiodoftime,themonthlyentrepreneurshipactivityrateincreasedfrom0.30percentto0.34percent.TheseopposingtrendsmaybeduetotheGreatRecessionpushingmanyindividualsintobusinessownershipbecauseofhighratesofunemployment.7Theseindividualswereprobablymorelikelytostartsoleproprietorshipsandothernon-employerfirmsinsteadofmorecostlyemployerfirms.From2010to2011,however,theemployerestablishmentbirthratewasflatwhiletheentrepreneurshipratedeclined.8
0.00%
0.05%
0.10%
0.15%
0.20%
0.25%
Entr
epre
neur
ship
Rat
e
SOURCE: Robert W. Fairlie, University of California, Santa Cruz, using the CPS and BLS. NOTE: 2011 Employer Establishment Birth Rate only includes Q1 and Q2
0.30%
0.35%
0.40%
1996 1997 1998 1999 2000 2001 2002 2003 2004 2005 2006 2007 2008 2009 2010 2011
Figure 1B
Kauffman Index of Entrepreneurial Activity (1996–2011)and Employer Establishment Birth Rate (1996–2011 Q2)
Entrepreneurship Rate Monthly Employer Establishment Birth Rate (Quarterly)

7
2 0 1 1 K A U F F M A N I N D E X O F E N T R E P R E N E U R I A L A C T I V I T Y
SOURCE: Robert W. Fairlie, University of California, Santa Cruz, using the Current Population Survey.
Figure 2
Kauffman Index of Entrepreneurial Activityby Gender (1996–2011)
Male Female
0.0%1996 1997 1998 1999 2000 2001 2002 2003 2004 2005 2006 2007 2008 2009 2010 2011
0.1%
0.2%
0.3%
0.4%
0.5%
ENTREPRENEURIAL ACTIVITY BY DEMOGRAPHIC GROUPS
ThedetaileddemographicinformationavailableintheCPSandlargesamplesizesallowfortheestimationofseparateindicesbygender,race,immigrantstatus,age,andeducation.Thisrepresentsanadvantageoftheindividual-levelCPSdatabecauselarge,nationallyrepresentativebusiness-leveldatasetstypicallyprovideeithernoorverylimiteddemographicinformationontheowner.Entrepreneurialactivitydecreasedforbothmenandwomenfrom2010to2011.Formen,theentrepreneurialactivityratedecreasedfrom0.44percentin2010to0.42percentin2011,reversinganupwardtrendoverthepastfewyears.Theentrepreneurshipratedecreasedfrom0.24percentto0.23percentforwomen.Figure2andTable1reportestimatesoftheKauffmanIndexbygenderfrom1996to2011.Overall,menaresubstantiallymorelikelytostartbusinesseseachmonththanarewomen.Theaveragerateofentrepreneurialactivityformenoverthesixteen-yearperiodwas0.37
percent.Theaveragerateforwomenwaslowerat0.23percent.
Allracialandethnicgroupsexperienceddeclinesinentrepreneurialactivityratesbetween2010and2011.Figure3andTable2reportestimatesoftheKauffmanIndexbyraceandethnicity.TheAsianrateofbusinesscreationdecreasedfrom0.37percentin2010to0.32percentin2011,andtheLatinorateofbusinesscreationdecreasedfrom0.56percentin2010to0.52percentin2011.Thesetwogroupsexperiencedthelargestdeclinesinentrepreneurshiprates.Although2011representedadeclineintherate,Latinosbeganexperiencingasharpupwardtrendinentrepreneurshipin2006.AfricanAmericansandnon-Latinowhitesalsoexperienceddeclinesinentrepreneurialactivityratesfrom2010to2011,butthedeclinesweresmaller.
Reflectingthelonger-termtrendsshowingrisingentrepreneurshipratesandagrowingshareofthetotalU.S.population,theLatinoshareofallnewentrepreneursrosefromalittlemorethan10percentin1996to22.9percentin2011.Figure3Breportsestimatesoftheshareofnewentrepreneurs

8
2 0 1 1 K A U F F M A N I N D E X O F E N T R E P R E N E U R I A L A C T I V I T Y
1996 0.33% 405,007 0.21% 54,799 0.33% 44,033 0.29% 20,489 0.31% 531,007 1997 0.29% 402,519 0.19% 55,300 0.30% 45,537 0.21% 20,711 0.28% 531,129 1998 0.31% 402,681 0.17% 54,669 0.29% 46,940 0.26% 21,099 0.29% 532,296 1999 0.28% 401,712 0.22% 54,241 0.29% 49,074 0.24% 21,256 0.27% 532,990 2000 0.28% 394,524 0.24% 55,249 0.29% 52,428 0.23% 21,897 0.27% 531,423 2001 0.27% 425,149 0.20% 58,250 0.30% 54,155 0.28% 23,895 0.26% 569,458 2002 0.29% 469,626 0.25% 61,083 0.30% 57,514 0.26% 26,373 0.29% 623,157 2003 0.29% 455,554 0.22% 58,797 0.38% 59,676 0.28% 24,011 0.30% 614,557 2004 0.31% 444,321 0.21% 56,587 0.34% 59,170 0.29% 24,227 0.30% 602,687 2005 0.29% 437,420 0.24% 55,069 0.32% 60,828 0.27% 25,690 0.29% 597,198 2006 0.29% 428,021 0.22% 55,532 0.33% 64,204 0.32% 26,578 0.29% 591,606 2007 0.30% 422,369 0.23% 56,529 0.40% 63,900 0.29% 27,128 0.30% 586,248 2008 0.31% 419,454 0.22% 56,311 0.48% 64,470 0.35% 28,097 0.32% 584,385 2009 0.33% 423,378 0.27% 57,564 0.46% 65,514 0.31% 28,961 0.34% 591,699 2010 0.31% 418,536 0.24% 60,550 0.56% 67,853 0.37% 30,243 0.34% 593,271 2011 0.29% 411,118 0.23% 59,939 0.52% 67,695 0.32% 31,456 0.32% 586,146
Sample Sample Sample Sample Sample Year Index Size Index Size Index Size Index Size Index Size
WHITE BLACK LATINO
TABLE 2
Kauffman Index of Entrepreneurial Activity by Race (1996–2011)
Notes: (1) Estimates calculated by Robert W. Fairlie, University of California, Santa Cruz, using the Current Population Survey. (2) The entrepreneurship index is the percent of individuals (ages twenty to sixty-four) who do not own a business in the first survey month that start a business in the following month with fifteen or more hours worked. (3) Race and Spanish codes changed in 2003. Estimates for 2003 only include individuals reporting one race. (4) All observations with allocated labor force status, class of worker, and hours worked variables are excluded.
Visit www.kauffman.org/kiea to download the data files.
ASIAN TOTAL
SOURCE: Robert W. Fairlie, University of California, Santa Cruz, using the Current Population Survey.
Figure 3
Kauffman Index of Entrepreneurial Activity by Race(1996–2011)
0.0%
0.1%
0.2%
0.3%
0.4%
0.5%
0.6%
1996 1997 1998 1999 2000 2001 2002 2003 2004 2005 2006 2007 2008 2009 2010 2011
White Black Latino Asian
Race 1996 2011 White 76.4% 60.2% Black 8.4% 9.1% Latino 10.5% 22.9% Asian 3.5% 5.3% Other 1.2% 2.5%
9
2 0 1 1 K A U F F M A N I N D E X O F E N T R E P R E N E U R I A L A C T I V I T Y
byracefrom1996to2011.TheAsianshareofnewentrepreneursalsorosesubstantiallyfrom1996to2011,butremainsrelativelysmallat5.3percent.Thewhiteshareofnewentrepreneursdeclinedoverthepastsixteenyears,whereastheblackshareincreasedslightly.
Theentrepreneurialactivityratedecreasedforimmigrantsin2011anddeclinedslightlyforthe
native-born.Thesetrendsslightlyreducedthelargepositivegapbetweenimmigrantandnative-bornrates.Figure4andTable3reportestimatesoftheKauffmanIndexbynativity.Theentrepreneurialactivityrateforimmigrantsdroppedfrom0.62percentin2010to0.55percentin2011.Thelonger-runpatterninentrepreneurshipratesforimmigrants,however,isanupwardtrendstarting
Figure 3B
Changes in Composition of New Entrepreneurs by Race
(1996, 2011)
White
Black
Latino
Asian
Other
1996 2011
SOURCE: Robert W. Fairlie, University of California, Santa Cruz, using the Current Population Survey.
0.0%
0.1%
0.2%
0.3%
0.4%
0.5%
0.6%
0.7%
Native-Born ImmigrantSOURCE: Robert W. Fairlie, University of California,
Santa Cruz, using the Current Population Survey.
1996 1997 1998 1999 2000 2001 2002 2003 2004 2005 2006 2007 2008 2009 2010 2011
Figure 4
Kauffman Index of Entrepreneurial Activity by Nativity (1996–2011)
Nativity 1996 2011 Native-Born 86.3% 72.0% Immigrant 13.7% 28.0%
10
2 0 1 1 K A U F F M A N I N D E X O F E N T R E P R E N E U R I A L A C T I V I T Y
1996 0.30% 474,984 0.36% 56,023 0.31% 531,007 1997 0.27% 473,208 0.31% 57,921 0.28% 531,129 1998 0.28% 472,458 0.33% 59,838 0.29% 532,296 1999 0.26% 472,107 0.31% 60,883 0.27% 532,990 2000 0.27% 466,150 0.33% 65,273 0.27% 531,423 2001 0.26% 500,292 0.30% 69,166 0.26% 569,458 2002 0.27% 549,356 0.37% 73,801 0.29% 623,157 2003 0.29% 539,914 0.38% 74,643 0.30% 614,557 2004 0.28% 528,881 0.41% 73,806 0.30% 602,687 2005 0.28% 521,967 0.35% 75,231 0.29% 597,198 2006 0.27% 513,386 0.37% 78,220 0.29% 591,606 2007 0.27% 507,985 0.46% 78,263 0.30% 586,248 2008 0.28% 505,911 0.53% 78,474 0.32% 584,385 2009 0.30% 511,798 0.51% 79,901 0.34% 591,699 2010 0.28% 510,631 0.62% 82,640 0.34% 593,271 2011 0.27% 503,500 0.55% 82,646 0.32% 586,146
Sample Sample Sample Year Index Size Index Size Index Size
IMMIGRANT TOTAL
TABLE 3
Kauffman Index of Entrepreneurial Activity by Nativity (1996–2011)
Notes: (1) Estimates calculated by Robert W. Fairlie, University of California, Santa Cruz, using the Current Population Survey. (2) The entrepreneurship index is the percent of individuals (ages twenty to sixty-four) who do not own a business in the first survey month that start a business in the following month with fifteen or more hours worked. (3) All observations with allocated labor force status, class of worker, and hours worked variables are excluded.
Visit www.kauffman.org/kiea to download the data files.
Figure 4B
Changes in Composition of New Entrepreneurs by Nativity (1996, 2011)
1996 2011
SOURCE: Robert W. Fairlie, University of California, Santa Cruz, using the Current Population Survey.
Native-Born Immigrant
in2006.Theimmigrantrateofentrepreneurshipincreasedfrom0.35percentin2005to0.55percentin2011.Thenative-bornratehasremainedrelativelyflatoverthelastsixteenyears.Theresultofthesecontrastingtrendsisthatimmigrantsweretwiceaslikelytostartbusinesseseachmonthin2011aswerethenative-born.Forimmigrants,550outof100,000peoplestartedabusinesseachmonth,comparedwith270outof100,000peopleforthenative-born.
Agrowingimmigrantpopulationandrisingentrepreneurshipratecontributedtoariseintheshareofnewentrepreneursthatareimmigrant.Figure4Breportsestimatesoftheshareofnewentrepreneursbynativity.Theimmigrantshareofnewentrepreneursis28.0percent,upfrom13.7percentin1996.
Figure5andTable4reportestimatesofentrepreneurialactivityratesbyagegroup.Theyoungestagegroup(ages20–34)experiencedan
NATIVE-BORN

11
2 0 1 1 K A U F F M A N I N D E X O F E N T R E P R E N E U R I A L A C T I V I T Y
1996 0.28% 193,242 0.30% 148,251 0.36% 113,187 0.32% 76,327 0.31% 531,007 1997 0.26% 189,631 0.28% 149,034 0.28% 115,371 0.32% 77,093 0.28% 531,129 1998 0.27% 185,691 0.30% 147,668 0.28% 119,502 0.32% 79,435 0.29% 532,296 1999 0.25% 180,102 0.29% 146,808 0.27% 123,993 0.29% 82,087 0.27% 532,990 2000 0.23% 178,854 0.27% 144,969 0.31% 125,619 0.34% 81,981 0.27% 531,423 2001 0.23% 187,883 0.27% 153,012 0.28% 139,228 0.32% 89,335 0.26% 569,458 2002 0.24% 203,569 0.30% 164,997 0.31% 152,841 0.31% 101,750 0.29% 623,157 2003 0.23% 198,248 0.35% 158,205 0.32% 152,447 0.34% 105,657 0.30% 614,557 2004 0.26% 193,373 0.31% 150,221 0.30% 150,743 0.37% 108,350 0.30% 602,687 2005 0.26% 190,271 0.30% 147,905 0.29% 149,119 0.34% 109,903 0.29% 597,198 2006 0.23% 186,939 0.30% 142,910 0.33% 149,117 0.33% 112,640 0.29% 591,606 2007 0.25% 184,710 0.33% 138,016 0.35% 147,387 0.31% 116,135 0.30% 586,248 2008 0.26% 184,338 0.35% 133,968 0.35% 147,230 0.36% 118,849 0.32% 584,385 2009 0.24% 187,073 0.40% 133,289 0.36% 149,073 0.40% 122,264 0.34% 591,699 2010 0.26% 190,232 0.40% 130,670 0.35% 147,479 0.39% 124,890 0.34% 593,271 2011 0.27% 188,276 0.33% 127,160 0.37% 142,498 0.33% 128,212 0.32% 586,146
Sample Sample Sample Sample Sample Year Index Size Index Size Index Size Index Size Index Size
AGES 20–34 AGES 35–44 AGES 45–54 AGES 55–64 TOTAL
TABLE 4
Kauffman Index of Entrepreneurial Activity by Age (1996–2011)
Notes: (1) Estimates calculated by Robert W. Fairlie, University of California, Santa Cruz, using the Current Population Survey. (2) The entrepreneurship index is the percent of individuals (ages twenty to sixty-four) who do not own a business in the first survey month that start a business in the following month with fifteen or more hours worked. (3) All observations with allocated labor force status, class of worker, and hours worked variables are excluded.
Visit www.kauffman.org/kiea to download the data files.
0.0%
0.1%
0.2%
0.3%
0.4%
0.5%
SOURCE: Robert W. Fairlie, University of California, Santa Cruz, using the Current Population Survey.
1996 1997 1998 1999 2000 2001 2002 2003 2004 2005 2006 2007 2008 2009 2010 2011
Figure 5
Kauffman Index of Entrepreneurial Activity by Age(1996–2011)
Ages20–34
Ages55–64
Ages45–54
Ages35–44

Age 1996 2011 Ages 20–34 34.8% 29.4% Ages 35–44 27.0% 22.0% Ages 45–54 23.9% 27.7% Ages 55–64 14.3% 20.9%
12
2 0 1 1 K A U F F M A N I N D E X O F E N T R E P R E N E U R I A L A C T I V I T Y
Figure 5B
Changes in Composition of New Entrepreneurs by Age (1996, 2011)
1996 2011
SOURCE: Robert W. Fairlie, University of California, Santa Cruz, using the Current Population Survey.
Ages 20–34
Ages 35–44
Ages 45–54
Ages 55–64
increaseinbusinesscreationratesfrom2010to2011,risingfrom0.26in2010to0.27in2011.From2010to2011,boththe35–44and55–64agegroupsexperiencedlargedropsinrates,andthe45–54agegroupexperiencedanincreaseinentrepreneurialactivity.Overtheentireperiod,businesscreationwaslowestamongtheyoungestgroup.
Figure5Breportsestimatesoftheshareofnewentrepreneursbyagegroup.Anagingpopulationandincreasingrateofentrepreneurshipamongolderageshasledtoarisingshareofnewentrepreneursintheages55–64group.Thisgrouprepresented14.3percentofnewentrepreneursin1996,whereasitrepresented20.9percentofnewentrepreneursin2011.
Entrepreneurialactivityratesdecreasedin2011fortheleast-educatedgroup,but
longer-termpatternsindicateanupwardtrend.Additionally,entrepreneurshipratesarehigherforthiseducationalgroupthanforallothereducationgroups,asindicatedinFigure6andTable5.Thesehighratesfortheleast-educatedgroupsuggestanincreasednumberofpeopleenteringentrepreneurshipoutofnecessity.Thelargestdecreaseinentrepreneurshipratesoccurredforcollegegraduates.Theentrepreneurshipratedecreasedfrom0.33percentin2010to0.29percentin2011.Entrepreneurshipratesessentiallyremainedthesamefortheothertwoeducationalgroups.Althoughratesarehighestfortheleast-educatedgroup,previousresearchthatcontrolsforothercorrelatedfactorssuchasrace,ethnicity,andunemploymentstatusindicatesincreasingratesofentrepreneurshipwithhigherlevelsofeducation.9

13
2 0 1 1 K A U F F M A N I N D E X O F E N T R E P R E N E U R I A L A C T I V I T Y
1996 0.39% 64,210 0.31% 162,390 0.32% 126,376 0.30% 121,451 0.32% 474,427 1997 0.35% 62,653 0.27% 162,088 0.31% 126,570 0.26% 123,904 0.29% 475,215 1998 0.33% 60,824 0.30% 160,574 0.30% 126,861 0.29% 128,391 0.30% 476,650 1999 0.30% 58,617 0.28% 158,787 0.28% 128,497 0.27% 131,801 0.28% 477,702 2000 0.36% 57,710 0.29% 155,477 0.29% 129,658 0.25% 131,932 0.29% 474,777 2001 0.31% 60,007 0.26% 164,765 0.26% 140,562 0.31% 144,419 0.28% 509,753 2002 0.35% 63,257 0.30% 179,230 0.29% 153,908 0.31% 161,682 0.30% 558,077 2003 0.44% 61,472 0.30% 175,389 0.30% 151,086 0.31% 161,841 0.32% 549,788 2004 0.37% 59,907 0.29% 170,234 0.31% 148,945 0.32% 160,064 0.31% 539,150 2005 0.39% 59,405 0.29% 166,435 0.31% 147,920 0.29% 159,962 0.31% 533,722 2006 0.36% 58,330 0.29% 162,751 0.31% 146,951 0.30% 161,102 0.30% 529,134 2007 0.42% 55,143 0.30% 159,239 0.28% 146,639 0.33% 163,843 0.32% 524,864 2008 0.48% 53,574 0.35% 156,810 0.30% 147,302 0.31% 166,125 0.34% 523,811 2009 0.49% 53,791 0.38% 158,573 0.30% 149,708 0.34% 168,737 0.36% 530,809 2010 0.59% 53,366 0.34% 157,939 0.31% 149,218 0.33% 170,832 0.36% 531,355 2011 0.57% 51,934 0.33% 154,501 0.31% 147,693 0.29% 171,581 0.34% 525,709
Sample Sample Sample Sample Sample Year Index Size Index Size Index Size Index Size Index Size
LESS THAN HIGH SCHOOL
HIGH SCHOOL GRADUATE
SOME COLLEGE
COLLEGE GRADUATE
TOTAL AGES 25–64
TABLE 5
Kauffman Index of Entrepreneurial Activity by Education (1996–2011)
Notes: (1) Estimates calculated by Robert W. Fairlie, University of California, Santa Cruz, using the Current Population Survey. (2) The entrepreneurship index is the percent of individuals (ages twenty-five to sixty-four) who do not own a business in the first survey month that start a business in the following month with fifteen or more hours worked. (3) All observations with allocated labor force status, class of worker, and hours worked variables are excluded.
Visit www.kauffman.org/kiea to download the data files.
0.0%
0.1%
0.2%
0.3%
0.4%
0.5%
0.6%
1996 1997 1998 1999 2000 2001 2002 2003 2004 2005 2006 2007 2008 2009 2010 2011
SOURCE: Robert W. Fairlie, University of California, Santa Cruz, using the Current Population Survey.
Figure 6
Kauffman Index of Entrepreneurial Activity by Education (1996–2011)
Less than High School
High SchoolGraduate
SomeCollege
CollegeGraduate
14
2 0 1 1 K A U F F M A N I N D E X O F E N T R E P R E N E U R I A L A C T I V I T Y
1996 1.06% 23,693 0.07% 71,120 0.39% 60,144 0.44% 205,664 0.41% 55,604 1997 1.05% 23,694 0.08% 71,152 0.30% 59,480 0.38% 208,199 0.37% 55,302 1998 0.95% 23,961 0.07% 69,792 0.35% 59,763 0.41% 211,337 0.32% 55,124 1999 0.90% 24,754 0.06% 66,980 0.29% 59,935 0.39% 213,046 0.31% 54,331 2000 0.98% 25,771 0.06% 65,676 0.36% 59,445 0.37% 212,927 0.32% 53,941 2001 0.89% 28,472 0.08% 67,844 0.27% 63,069 0.38% 231,578 0.29% 56,704 2002 1.04% 31,212 0.08% 70,348 0.32% 69,660 0.39% 257,048 0.34% 61,376 2003 1.25% 31,542 0.09% 65,494 0.31% 69,037 0.39% 254,486 0.34% 58,302 2004 1.22% 31,726 0.10% 62,079 0.27% 67,839 0.41% 248,391 0.29% 56,946 2005 1.14% 32,179 0.10% 59,476 0.28% 67,491 0.38% 246,875 0.34% 57,671 2006 1.06% 32,760 0.09% 57,677 0.26% 65,244 0.40% 247,242 0.31% 57,386 2007 1.23% 31,860 0.08% 56,828 0.24% 62,789 0.41% 245,946 0.32% 57,394 2008 1.38% 30,406 0.11% 55,262 0.33% 62,200 0.41% 247,636 0.33% 57,592 2009 1.55% 29,465 0.13% 53,287 0.34% 62,662 0.42% 252,851 0.36% 57,527 2010 1.60% 27,827 0.08% 51,537 0.28% 62,895 0.44% 253,068 0.41% 58,028 2011 1.68% 26,315 0.11% 50,375 0.30% 60,956 0.42% 249,309 0.30% 56,807
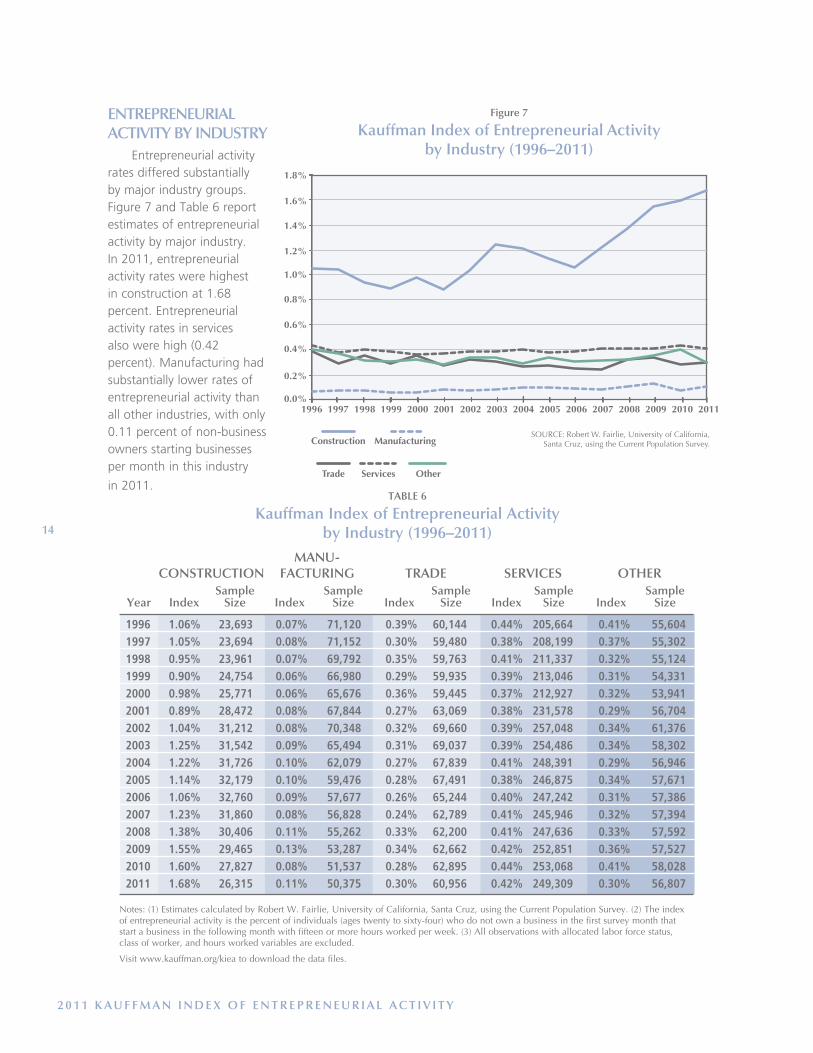
ENTREPRENEURIAL ACTIVITY BY INDUSTRY
Entrepreneurialactivityratesdifferedsubstantiallybymajorindustrygroups.Figure7andTable6reportestimatesofentrepreneurialactivitybymajorindustry.In2011,entrepreneurialactivityrateswerehighestinconstructionat1.68percent.Entrepreneurialactivityratesinservicesalsowerehigh(0.42percent).Manufacturinghadsubstantiallylowerratesofentrepreneurialactivitythanallotherindustries,withonly0.11percentofnon-businessownersstartingbusinessespermonthinthisindustry
in2011.
Sample Sample Sample Sample Sample Year Index Size Index Size Index Size Index Size Index Size
MANU- FACTURING
CONSTRUCTION
TRADE
SERVICES
OTHER
TABLE 6
Kauffman Index of Entrepreneurial Activity by Industry (1996–2011)
Notes: (1) Estimates calculated by Robert W. Fairlie, University of California, Santa Cruz, using the Current Population Survey. (2) The index of entrepreneurial activity is the percent of individuals (ages twenty to sixty-four) who do not own a business in the first survey month that start a business in the following month with fifteen or more hours worked per week. (3) All observations with allocated labor force status, class of worker, and hours worked variables are excluded.
Visit www.kauffman.org/kiea to download the data files.
1996 1997 1998 1999 2000 2001 2002 2003 2004 2005 2006 2007 2008 2009 2010 20110.0%
0.2%
0.4%
0.6%
0.8%
1.0%
1.2%
1.4%
1.6%
1.8%
SOURCE: Robert W. Fairlie, University of California, Santa Cruz, using the Current Population Survey.
Figure 7
Kauffman Index of Entrepreneurial Activity by Industry (1996–2011)
Construction Manufacturing
Trade Services Other
15
2 0 1 1 K A U F F M A N I N D E X O F E N T R E P R E N E U R I A L A C T I V I T Y
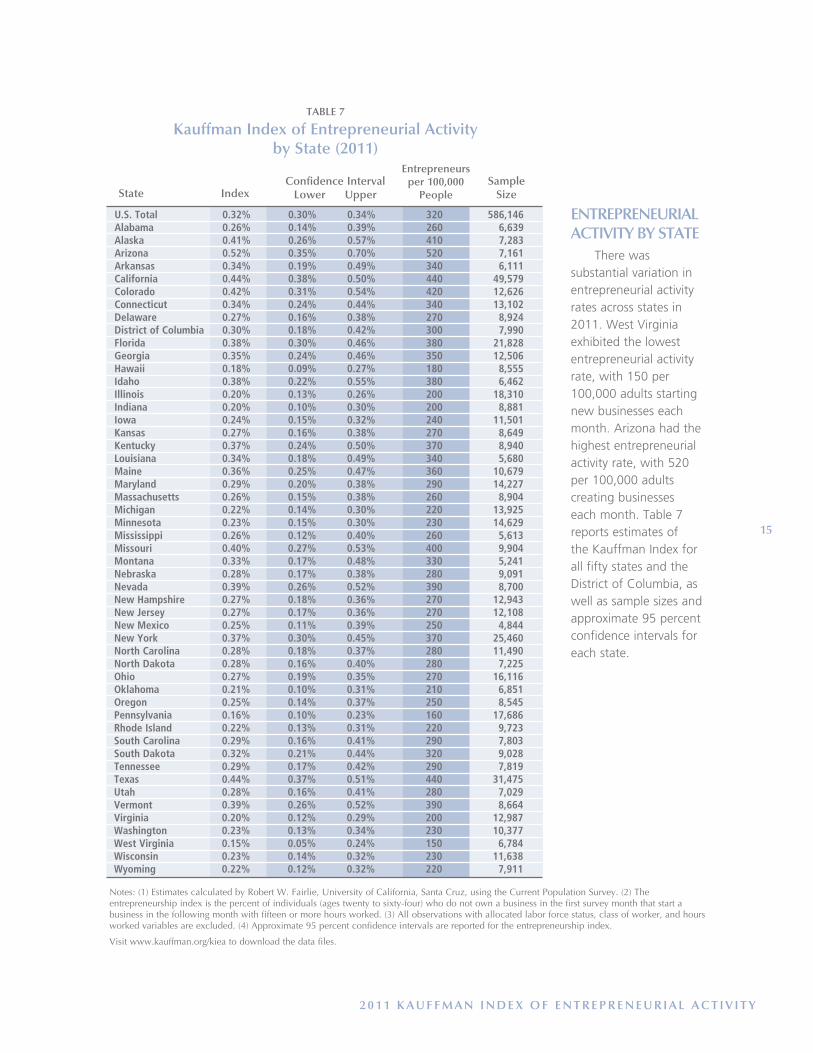
ENTREPRENEURIAL ACTIVITY BY STATE
Therewassubstantialvariationinentrepreneurialactivityratesacrossstatesin2011.WestVirginiaexhibitedthelowestentrepreneurialactivityrate,with150per100,000adultsstartingnewbusinesseseachmonth.Arizonahadthehighestentrepreneurialactivityrate,with520per100,000adultscreatingbusinesseseachmonth.Table7reportsestimatesoftheKauffmanIndexforallfiftystatesandtheDistrictofColumbia,aswellassamplesizesandapproximate95percentconfidenceintervalsforeachstate.
U.S. Total 0.32% 0.30% 0.34% 320 586,146 Alabama 0.26% 0.14% 0.39% 260 6,639 Alaska 0.41% 0.26% 0.57% 410 7,283 Arizona 0.52% 0.35% 0.70% 520 7,161 Arkansas 0.34% 0.19% 0.49% 340 6,111 California 0.44% 0.38% 0.50% 440 49,579 Colorado 0.42% 0.31% 0.54% 420 12,626 Connecticut 0.34% 0.24% 0.44% 340 13,102 Delaware 0.27% 0.16% 0.38% 270 8,924 District of Columbia 0.30% 0.18% 0.42% 300 7,990 Florida 0.38% 0.30% 0.46% 380 21,828 Georgia 0.35% 0.24% 0.46% 350 12,506 Hawaii 0.18% 0.09% 0.27% 180 8,555 Idaho 0.38% 0.22% 0.55% 380 6,462 Illinois 0.20% 0.13% 0.26% 200 18,310 Indiana 0.20% 0.10% 0.30% 200 8,881 Iowa 0.24% 0.15% 0.32% 240 11,501 Kansas 0.27% 0.16% 0.38% 270 8,649 Kentucky 0.37% 0.24% 0.50% 370 8,940 Louisiana 0.34% 0.18% 0.49% 340 5,680 Maine 0.36% 0.25% 0.47% 360 10,679 Maryland 0.29% 0.20% 0.38% 290 14,227 Massachusetts 0.26% 0.15% 0.38% 260 8,904 Michigan 0.22% 0.14% 0.30% 220 13,925 Minnesota 0.23% 0.15% 0.30% 230 14,629 Mississippi 0.26% 0.12% 0.40% 260 5,613 Missouri 0.40% 0.27% 0.53% 400 9,904 Montana 0.33% 0.17% 0.48% 330 5,241 Nebraska 0.28% 0.17% 0.38% 280 9,091 Nevada 0.39% 0.26% 0.52% 390 8,700 New Hampshire 0.27% 0.18% 0.36% 270 12,943 New Jersey 0.27% 0.17% 0.36% 270 12,108 New Mexico 0.25% 0.11% 0.39% 250 4,844 New York 0.37% 0.30% 0.45% 370 25,460 North Carolina 0.28% 0.18% 0.37% 280 11,490 North Dakota 0.28% 0.16% 0.40% 280 7,225 Ohio 0.27% 0.19% 0.35% 270 16,116 Oklahoma 0.21% 0.10% 0.31% 210 6,851 Oregon 0.25% 0.14% 0.37% 250 8,545 Pennsylvania 0.16% 0.10% 0.23% 160 17,686 Rhode Island 0.22% 0.13% 0.31% 220 9,723 South Carolina 0.29% 0.16% 0.41% 290 7,803 South Dakota 0.32% 0.21% 0.44% 320 9,028 Tennessee 0.29% 0.17% 0.42% 290 7,819 Texas 0.44% 0.37% 0.51% 440 31,475 Utah 0.28% 0.16% 0.41% 280 7,029 Vermont 0.39% 0.26% 0.52% 390 8,664 Virginia 0.20% 0.12% 0.29% 200 12,987 Washington 0.23% 0.13% 0.34% 230 10,377 West Virginia 0.15% 0.05% 0.24% 150 6,784 Wisconsin 0.23% 0.14% 0.32% 230 11,638 Wyoming 0.22% 0.12% 0.32% 220 7,911
State IndexConfidence Interval
Lower Upper
Entrepreneurs per 100,000
PeopleSample
Size
TABLE 7
Kauffman Index of Entrepreneurial Activity by State (2011)
Notes: (1) Estimates calculated by Robert W. Fairlie, University of California, Santa Cruz, using the Current Population Survey. (2) The entrepreneurship index is the percent of individuals (ages twenty to sixty-four) who do not own a business in the first survey month that start a business in the following month with fifteen or more hours worked. (3) All observations with allocated labor force status, class of worker, and hours worked variables are excluded. (4) Approximate 95 percent confidence intervals are reported for the entrepreneurship index.
Visit www.kauffman.org/kiea to download the data files.
16
2 0 1 1 K A U F F M A N I N D E X O F E N T R E P R E N E U R I A L A C T I V I T Y
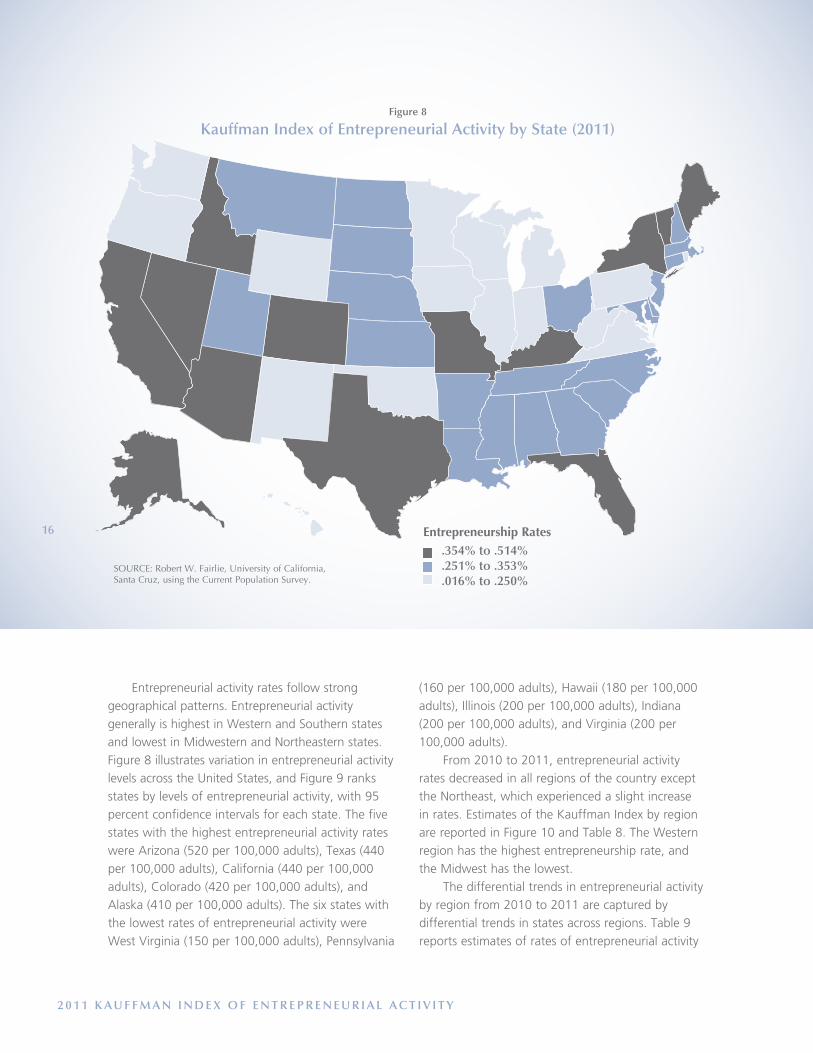
Entrepreneurialactivityratesfollowstronggeographicalpatterns.EntrepreneurialactivitygenerallyishighestinWesternandSouthernstatesandlowestinMidwesternandNortheasternstates.Figure8illustratesvariationinentrepreneurialactivitylevelsacrosstheUnitedStates,andFigure9ranksstatesbylevelsofentrepreneurialactivity,with95percentconfidenceintervalsforeachstate.ThefivestateswiththehighestentrepreneurialactivityrateswereArizona(520per100,000adults),Texas(440per100,000adults),California(440per100,000adults),Colorado(420per100,000adults),andAlaska(410per100,000adults).ThesixstateswiththelowestratesofentrepreneurialactivitywereWestVirginia(150per100,000adults),Pennsylvania
Entrepreneurship Rates.354% to .514%.251% to .353%.016% to .250%
Figure 8
Kauffman Index of Entrepreneurial Activity by State (2011)
SOURCE: Robert W. Fairlie, University of California, Santa Cruz, using the Current Population Survey.
(160per100,000adults),Hawaii(180per100,000adults),Illinois(200per100,000adults),Indiana(200per100,000adults),andVirginia(200per100,000adults).
From2010to2011,entrepreneurialactivityratesdecreasedinallregionsofthecountryexcepttheNortheast,whichexperiencedaslightincreaseinrates.EstimatesoftheKauffmanIndexbyregionarereportedinFigure10andTable8.TheWesternregionhasthehighestentrepreneurshiprate,andtheMidwesthasthelowest.
Thedifferentialtrendsinentrepreneurialactivitybyregionfrom2010to2011arecapturedbydifferentialtrendsinstatesacrossregions.Table9reportsestimatesofratesofentrepreneurialactivity

17
2 0 1 1 K A U F F M A N I N D E X O F E N T R E P R E N E U R I A L A C T I V I T Y
SOURCE: Robert W. Fairlie, University of California, Santa Cruz, using the Current Population Survey.
0.00% 0.10% 0.20% 0.30% 0.40% 0.50% 0.60% 0.70% 0.80%
Figure 9
Kauffman Index of Entrepreneurial Activity by State with 95 Percent Confidence Intervals, 2011
Arizona Texas
California Colorado
Alaska Missouri Nevada
Vermont Idaho
Florida New York Kentucky
Maine Georgia
Arkansas Connecticut
Louisiana Montana
South Dakota District of Columbia
Tennessee Maryland
South Carolina Utah
North Dakota Nebraska
North Carolina Kansas
New Hampshire Delaware
Ohio New Jersey
Alabama Massachusetts
Mississippi Oregon
New Mexico Iowa
Washington Wisconsin Minnesota
Rhode Island Michigan Wyoming
Oklahoma Virginia Indiana Illinois Hawaii
Pennsylvania West Virginia

18
2 0 1 1 K A U F F M A N I N D E X O F E N T R E P R E N E U R I A L A C T I V I T Y
1996 0.24% 114,486 0.27% 126,402 0.34% 164,415 0.38% 125,704 0.31% 531,007 1997 0.21% 113,819 0.26% 125,603 0.29% 164,277 0.35% 127,430 0.28% 531,129 1998 0.24% 114,246 0.28% 125,411 0.27% 164,190 0.36% 128,449 0.29% 532,296 1999 0.22% 112,804 0.24% 125,372 0.27% 164,416 0.34% 130,398 0.27% 532,990 2000 0.23% 111,319 0.27% 126,975 0.28% 163,720 0.31% 129,409 0.27% 531,423 2001 0.23% 122,399 0.24% 139,538 0.27% 169,480 0.31% 138,041 0.26% 569,458 2002 0.23% 135,033 0.25% 156,223 0.29% 179,221 0.36% 152,680 0.29% 623,157 2003 0.24% 132,855 0.26% 153,953 0.31% 177,302 0.37% 150,447 0.30% 614,557 2004 0.22% 128,536 0.25% 149,380 0.31% 178,789 0.38% 145,982 0.30% 602,687 2005 0.26% 123,177 0.26% 144,081 0.29% 183,966 0.34% 145,974 0.29% 597,198 2006 0.28% 120,283 0.22% 140,195 0.30% 185,136 0.33% 145,992 0.29% 591,606 2007 0.26% 117,828 0.25% 139,827 0.31% 183,035 0.37% 145,558 0.30% 586,248 2008 0.29% 119,172 0.23% 139,301 0.33% 181,221 0.42% 144,691 0.32% 584,385 2009 0.30% 121,081 0.27% 141,705 0.36% 183,661 0.38% 145,252 0.34% 591,699 2010 0.28% 121,555 0.26% 141,571 0.36% 184,805 0.41% 145,340 0.34% 593,271 2011 0.29% 119,269 0.24% 138,897 0.33% 183,667 0.39% 144,313 0.32% 586,146
SOURCE: Robert W. Fairlie, University of California, Santa Cruz, using the Current Population Survey.
Figure 10
Kauffman Index of Entrepreneurial Activity by Region (1996–2011)
0.0%
0.1%
0.2%
0.3%
0.4%
0.5%
0.0%
0.1%
0.2%
0.3%
0.4%
0.5%
1996 1997 1998 1999 2000 2001 2002 2003 2004 2005 2006 2007 2008 2009 2010 2011
Northeast South WestMidwest
Sample Sample Sample Sample Sample Year Index Size Index Size Index Size Index Size Index Size
NORTHEAST MIDWEST SOUTH WEST TOTAL
TABLE 8
Kauffman Index of Entrepreneurial Activity by Region (1996–2011)
Notes: (1) Estimates calculated by Robert W. Fairlie, University of California, Santa Cruz, using the Current Population Survey. (2) The index of entrepreneurial activity is the percent of individuals (ages twenty to sixty-four) who do not own a business in the first survey month that start a business in the following month with fifteen or more hours worked per week. (3) All observations with allocated labor force status, class of worker, and hours worked variables are excluded.
Visit www.kauffman.org/kiea to download the data files.
19
2 0 1 1 K A U F F M A N I N D E X O F E N T R E P R E N E U R I A L A C T I V I T Y
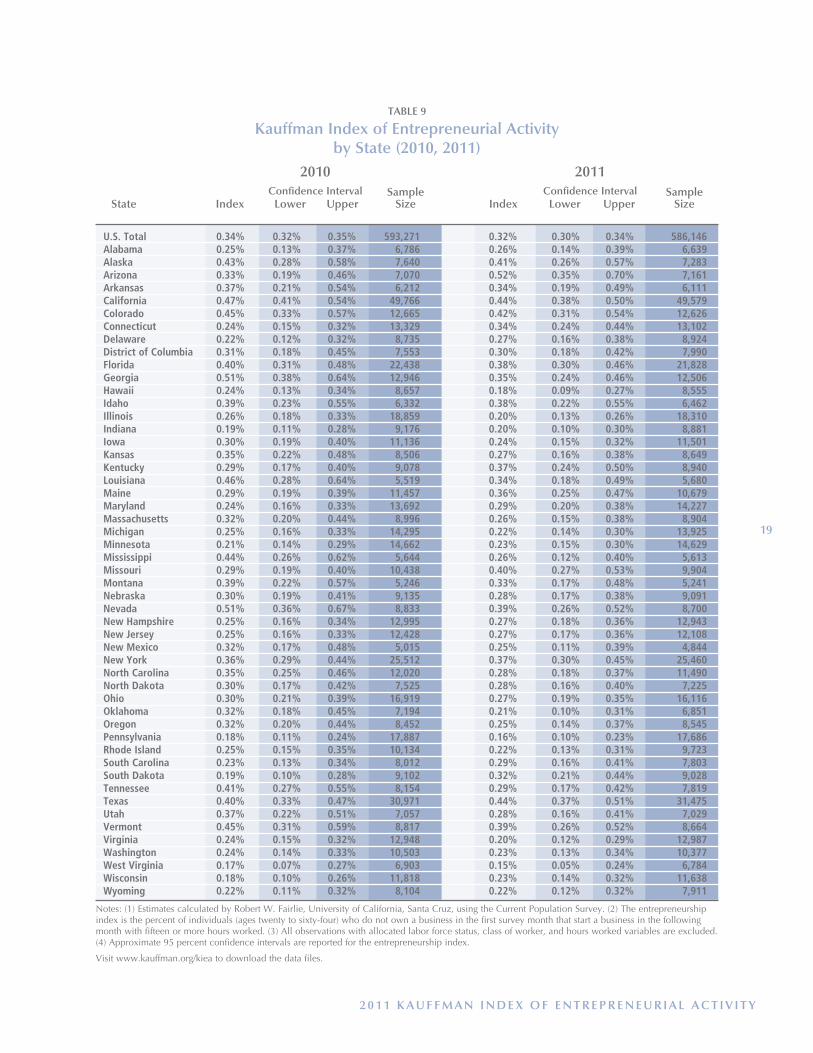
Confidence Interval
U.S. Total 0.34% 0.32% 0.35% 593,271 0.32% 0.30% 0.34% 586,146 Alabama 0.25% 0.13% 0.37% 6,786 0.26% 0.14% 0.39% 6,639 Alaska 0.43% 0.28% 0.58% 7,640 0.41% 0.26% 0.57% 7,283 Arizona 0.33% 0.19% 0.46% 7,070 0.52% 0.35% 0.70% 7,161 Arkansas 0.37% 0.21% 0.54% 6,212 0.34% 0.19% 0.49% 6,111 California 0.47% 0.41% 0.54% 49,766 0.44% 0.38% 0.50% 49,579 Colorado 0.45% 0.33% 0.57% 12,665 0.42% 0.31% 0.54% 12,626 Connecticut 0.24% 0.15% 0.32% 13,329 0.34% 0.24% 0.44% 13,102 Delaware 0.22% 0.12% 0.32% 8,735 0.27% 0.16% 0.38% 8,924 District of Columbia 0.31% 0.18% 0.45% 7,553 0.30% 0.18% 0.42% 7,990 Florida 0.40% 0.31% 0.48% 22,438 0.38% 0.30% 0.46% 21,828 Georgia 0.51% 0.38% 0.64% 12,946 0.35% 0.24% 0.46% 12,506 Hawaii 0.24% 0.13% 0.34% 8,657 0.18% 0.09% 0.27% 8,555 Idaho 0.39% 0.23% 0.55% 6,332 0.38% 0.22% 0.55% 6,462 Illinois 0.26% 0.18% 0.33% 18,859 0.20% 0.13% 0.26% 18,310 Indiana 0.19% 0.11% 0.28% 9,176 0.20% 0.10% 0.30% 8,881 Iowa 0.30% 0.19% 0.40% 11,136 0.24% 0.15% 0.32% 11,501 Kansas 0.35% 0.22% 0.48% 8,506 0.27% 0.16% 0.38% 8,649 Kentucky 0.29% 0.17% 0.40% 9,078 0.37% 0.24% 0.50% 8,940 Louisiana 0.46% 0.28% 0.64% 5,519 0.34% 0.18% 0.49% 5,680 Maine 0.29% 0.19% 0.39% 11,457 0.36% 0.25% 0.47% 10,679 Maryland 0.24% 0.16% 0.33% 13,692 0.29% 0.20% 0.38% 14,227 Massachusetts 0.32% 0.20% 0.44% 8,996 0.26% 0.15% 0.38% 8,904 Michigan 0.25% 0.16% 0.33% 14,295 0.22% 0.14% 0.30% 13,925 Minnesota 0.21% 0.14% 0.29% 14,662 0.23% 0.15% 0.30% 14,629 Mississippi 0.44% 0.26% 0.62% 5,644 0.26% 0.12% 0.40% 5,613 Missouri 0.29% 0.19% 0.40% 10,438 0.40% 0.27% 0.53% 9,904 Montana 0.39% 0.22% 0.57% 5,246 0.33% 0.17% 0.48% 5,241 Nebraska 0.30% 0.19% 0.41% 9,135 0.28% 0.17% 0.38% 9,091 Nevada 0.51% 0.36% 0.67% 8,833 0.39% 0.26% 0.52% 8,700 New Hampshire 0.25% 0.16% 0.34% 12,995 0.27% 0.18% 0.36% 12,943 New Jersey 0.25% 0.16% 0.33% 12,428 0.27% 0.17% 0.36% 12,108 New Mexico 0.32% 0.17% 0.48% 5,015 0.25% 0.11% 0.39% 4,844 New York 0.36% 0.29% 0.44% 25,512 0.37% 0.30% 0.45% 25,460 North Carolina 0.35% 0.25% 0.46% 12,020 0.28% 0.18% 0.37% 11,490 North Dakota 0.30% 0.17% 0.42% 7,525 0.28% 0.16% 0.40% 7,225 Ohio 0.30% 0.21% 0.39% 16,919 0.27% 0.19% 0.35% 16,116 Oklahoma 0.32% 0.18% 0.45% 7,194 0.21% 0.10% 0.31% 6,851 Oregon 0.32% 0.20% 0.44% 8,452 0.25% 0.14% 0.37% 8,545 Pennsylvania 0.18% 0.11% 0.24% 17,887 0.16% 0.10% 0.23% 17,686 Rhode Island 0.25% 0.15% 0.35% 10,134 0.22% 0.13% 0.31% 9,723 South Carolina 0.23% 0.13% 0.34% 8,012 0.29% 0.16% 0.41% 7,803 South Dakota 0.19% 0.10% 0.28% 9,102 0.32% 0.21% 0.44% 9,028 Tennessee 0.41% 0.27% 0.55% 8,154 0.29% 0.17% 0.42% 7,819 Texas 0.40% 0.33% 0.47% 30,971 0.44% 0.37% 0.51% 31,475 Utah 0.37% 0.22% 0.51% 7,057 0.28% 0.16% 0.41% 7,029 Vermont 0.45% 0.31% 0.59% 8,817 0.39% 0.26% 0.52% 8,664 Virginia 0.24% 0.15% 0.32% 12,948 0.20% 0.12% 0.29% 12,987 Washington 0.24% 0.14% 0.33% 10,503 0.23% 0.13% 0.34% 10,377 West Virginia 0.17% 0.07% 0.27% 6,903 0.15% 0.05% 0.24% 6,784 Wisconsin 0.18% 0.10% 0.26% 11,818 0.23% 0.14% 0.32% 11,638 Wyoming 0.22% 0.11% 0.32% 8,104 0.22% 0.12% 0.32% 7,911
Sample SampleState Index Lower Upper Size Index Lower Upper Size
Confidence Interval
2010 2011
TABLE 9
Kauffman Index of Entrepreneurial Activity by State (2010, 2011)
Notes: (1) Estimates calculated by Robert W. Fairlie, University of California, Santa Cruz, using the Current Population Survey. (2) The entrepreneurship index is the percent of individuals (ages twenty to sixty-four) who do not own a business in the first survey month that start a business in the following month with fifteen or more hours worked. (3) All observations with allocated labor force status, class of worker, and hours worked variables are excluded. (4) Approximate 95 percent confidence intervals are reported for the entrepreneurship index.
Visit www.kauffman.org/kiea to download the data files.

20
2 0 1 1 K A U F F M A N I N D E X O F E N T R E P R E N E U R I A L A C T I V I T Y
U.S. Total 0.27% 0.26% 0.28% 1,626,186 0.33% 0.32% 0.34% 1,771,116 Alabama 0.22% 0.16% 0.28% 24,446 0.24% 0.17% 0.31% 20,129 Alaska 0.51% 0.40% 0.62% 19,590 0.39% 0.31% 0.48% 22,707 Arizona 0.35% 0.27% 0.42% 24,595 0.44% 0.34% 0.53% 21,096 Arkansas 0.34% 0.26% 0.42% 21,167 0.36% 0.27% 0.46% 18,556 California 0.31% 0.28% 0.34% 132,276 0.44% 0.41% 0.48% 148,285 Colorado 0.39% 0.31% 0.47% 25,332 0.42% 0.35% 0.48% 38,073 Connecticut 0.27% 0.19% 0.35% 18,569 0.29% 0.23% 0.34% 39,624 Delaware 0.17% 0.11% 0.23% 17,299 0.26% 0.20% 0.33% 26,524 District of Columbia 0.26% 0.18% 0.35% 15,607 0.31% 0.23% 0.38% 23,112 Florida 0.29% 0.25% 0.33% 73,058 0.41% 0.35% 0.46% 66,545 Georgia 0.25% 0.19% 0.31% 26,861 0.43% 0.36% 0.50% 38,005 Hawaii 0.26% 0.18% 0.34% 16,790 0.23% 0.17% 0.29% 26,043 Idaho 0.42% 0.33% 0.52% 22,885 0.41% 0.31% 0.50% 19,247 Illinois 0.24% 0.20% 0.28% 67,701 0.23% 0.19% 0.28% 55,938 Indiana 0.30% 0.23% 0.38% 23,864 0.22% 0.17% 0.28% 27,380 Iowa 0.33% 0.25% 0.41% 22,114 0.25% 0.20% 0.31% 34,067 Kansas 0.28% 0.21% 0.35% 21,895 0.29% 0.22% 0.35% 25,659 Kentucky 0.22% 0.16% 0.29% 22,612 0.30% 0.23% 0.37% 27,009 Louisiana 0.28% 0.21% 0.36% 20,919 0.41% 0.31% 0.51% 16,873 Maine 0.31% 0.23% 0.39% 19,750 0.33% 0.27% 0.39% 33,437 Maryland 0.28% 0.20% 0.36% 19,467 0.28% 0.22% 0.33% 41,648 Massachusetts 0.14% 0.11% 0.18% 38,083 0.31% 0.24% 0.37% 26,946 Michigan 0.23% 0.19% 0.27% 56,642 0.25% 0.21% 0.30% 42,363 Minnesota 0.22% 0.16% 0.28% 25,259 0.22% 0.18% 0.26% 44,283 Mississippi 0.36% 0.27% 0.45% 18,547 0.29% 0.21% 0.37% 16,814 Missouri 0.21% 0.15% 0.28% 21,047 0.32% 0.26% 0.39% 30,728 Montana 0.41% 0.32% 0.50% 21,171 0.40% 0.30% 0.50% 15,881 Nebraska 0.29% 0.21% 0.36% 21,861 0.26% 0.20% 0.32% 27,504 Nevada 0.19% 0.14% 0.25% 25,079 0.43% 0.34% 0.51% 26,659 New Hampshire 0.24% 0.17% 0.31% 19,154 0.27% 0.21% 0.32% 39,297 New Jersey 0.23% 0.18% 0.27% 48,167 0.28% 0.22% 0.34% 36,823 New Mexico 0.41% 0.31% 0.50% 21,188 0.28% 0.19% 0.36% 14,954 New York 0.28% 0.25% 0.32% 97,590 0.36% 0.32% 0.40% 76,059 North Carolina 0.29% 0.23% 0.34% 41,204 0.29% 0.24% 0.35% 35,379 North Dakota 0.33% 0.25% 0.42% 20,476 0.30% 0.22% 0.38% 21,999 Ohio 0.22% 0.18% 0.27% 61,941 0.28% 0.23% 0.33% 50,216 Oklahoma 0.27% 0.20% 0.34% 23,234 0.33% 0.25% 0.41% 21,178 Oregon 0.39% 0.30% 0.48% 20,951 0.32% 0.25% 0.39% 25,522 Pennsylvania 0.17% 0.14% 0.20% 67,118 0.18% 0.14% 0.22% 53,547 Rhode Island 0.14% 0.08% 0.19% 19,337 0.24% 0.18% 0.29% 29,912 South Carolina 0.19% 0.12% 0.26% 18,524 0.25% 0.18% 0.32% 23,825 South Dakota 0.35% 0.26% 0.43% 21,285 0.31% 0.25% 0.38% 26,901 Tennessee 0.20% 0.15% 0.26% 22,504 0.35% 0.28% 0.43% 24,119 Texas 0.33% 0.29% 0.37% 80,028 0.43% 0.39% 0.48% 92,901 Utah 0.30% 0.22% 0.37% 22,678 0.34% 0.26% 0.42% 21,154 Vermont 0.35% 0.26% 0.45% 16,985 0.40% 0.32% 0.48% 26,260 Virginia 0.19% 0.13% 0.24% 26,955 0.24% 0.19% 0.29% 38,570 Washington 0.30% 0.23% 0.38% 22,598 0.24% 0.18% 0.30% 31,304 West Virginia 0.17% 0.11% 0.22% 23,832 0.22% 0.16% 0.29% 20,946 Wisconsin 0.28% 0.20% 0.35% 25,256 0.24% 0.18% 0.29% 35,135 Wyoming 0.42% 0.33% 0.51% 20,695 0.25% 0.19% 0.32% 23,980
Sample SampleState Index Lower Upper Size Index Lower Upper Size
Confidence Interval
1999–2001 Period 2009–2011 PeriodConfidence Interval
TABLE 10
Kauffman Index of Entrepreneurial Activity by State (1999–2001 and 2009–2011)
Notes: (1) Estimates calculated by Robert W. Fairlie, University of California, Santa Cruz, using the Current Population Survey. (2) The entrepreneurship index is the percent of individuals (ages twenty to sixty-four) who do not own a business in the first survey month that start a business in the following month with fifteen or more hours worked. (3) All observations with allocated labor force status, class of worker, and hours worked variables are excluded. (4) Approximate 95 percent confidence intervals are reported for the entrepreneurship index.
Visit www.kauffman.org/kiea to download the data files.

21
2 0 1 1 K A U F F M A N I N D E X O F E N T R E P R E N E U R I A L A C T I V I T Y
bystatefrom2010to2011.Estimatedratesforsomesmallerstates,however,canvarysomewhatbetweenthetwoyearsbecauseofimpreciseestimatesinsteadofactualchangesineconomicconditionsforentrepreneurship.
TrendsinstateentrepreneurshipratesoverthepastdecadearereportedinTable10.Toincreasesamplesizesandprecision,thethree-yearperiod2009–2011iscomparedtothethree-yearperiod1999–2001,providingadecadalestimateoftrends.10Nevadaexperiencedthelargestpositivechangeinitsentrepreneurialactivityrateoverthepastdecade,morethandoublingitsincidencefrom0.19percentto0.43percent.OtherstatesexperiencinglargeincreasesinratesofentrepreneurialactivitywereGeorgia(0.18percentagepoints),Massachusetts(0.16percentagepoints),Tennessee(0.15percentagepoints),California(0.13percentagepoints),Louisiana(0.12percentagepoints),andFlorida(0.12percentagepoints).Statesthatexperiencedlarge
decreasesinentrepreneurialactivityrateswereWyoming(-0.17percentagepoints)andNewMexico(-0.13percentagepoints).Allofthesechangesovertimearestatisticallysignificantatthe0.05or0.10levelofconfidence.
ENTREPRENEURIAL ACTIVITY BY METROPOLITAN AREA
AnindexofentrepreneurialactivityalsowascreatedforthefifteenlargestmetropolitanareasintheUnitedStates(Table11).11Amongthesemetropolitanareas,LosAngeleshadthehighestentrepreneurialactivityrateat580per100,000adults.Atlanta(500per100,000adults)andPhoenix(500per100,000adults)alsohadhighratesofentrepreneurialactivity.ThemetropolitanareaswiththelowestentrepreneurialactivityrateinthisgroupoflargeMSAswereChicago(180per100,000adults),Detroit(180per100,000adults),
andPhiladelphia(200per100,000adults).
New York-Northern New Jersey-Long Island, NY-NJ-PA 0.42% 0.34% 0.50% 420 25,165 0.40% 74,992 Los Angeles-Long Beach-Santa Ana, CA 0.58% 0.46% 0.69% 580 17,895 0.56% 53,879 Chicago-Naperville-Joliet, IL-IN-WI 0.18% 0.11% 0.25% 180 13,093 0.25% 39,740 Dallas-Fort Worth-Arlington, TX 0.37% 0.24% 0.50% 370 8,529 0.32% 25,617 Houston-Baytown-Sugar Land, TX 0.40% 0.25% 0.55% 400 7,181 0.53% 20,462 Washington-Arlington-Alexandria, DC-VA-MD-WV 0.23% 0.15% 0.31% 230 18,652 0.29% 54,013 Philadelphia-Camden-Wilmington, PA-NJ-DE 0.20% 0.10% 0.29% 200 12,775 0.18% 37,735 Atlanta-Sandy Springs-Marietta, GA 0.50% 0.33% 0.67% 500 6,969 0.53% 21,756 Miami-Fort Lauderdale-Miami Beach, FL 0.47% 0.31% 0.64% 470 6,573 0.54% 19,947 Boston-Cambridge-Quincy, MA-NH 0.26% 0.13% 0.39% 260 10,149 0.29% 30,466 San Francisco-Oakland-Fremont, CA 0.37% 0.21% 0.53% 370 5,987 0.47% 17,756 Detroit-Warren-Livonia, MI 0.18% 0.06% 0.30% 180 6,049 0.27% 18,624 Phoenix-Mesa-Scottsdale, AZ 0.50% 0.28% 0.71% 500 4,748 0.46% 14,050 Riverside-San Bernardino, CA 0.43% 0.25% 0.62% 430 5,150 0.37% 14,890 Seattle-Tacoma-Bellevue, WA 0.29% 0.12% 0.45% 290 5,534 0.22% 16,743
TABLE 11
Kauffman Index of Entrepreneurial Activity for the Fifteen Largest MSAs (2011)
Entrepreneurs 2009– 2011 per 100,000 Sample 2011 Sample Metropolitan Statistical Area Index Lower Upper People Size Index Size
Confidence Interval
Notes: (1) Estimates calculated by Robert W. Fairlie, University of California, Santa Cruz, using the Current Population Survey. (2) The entrepreneurship index is the percent of individuals (ages twenty to sixty-four) who do not own a business in the first survey month that start a business in the following month with fifteen or more hours worked. (3) All observations with allocated labor force status, class of worker, and hours worked variables are excluded. (4) Approximate 95 percent confidence intervals are reported for the entrepreneurship index.
Visit www.kauffman.org/kiea to download the data files.

22
2 0 1 1 K A U F F M A N I N D E X O F E N T R E P R E N E U R I A L A C T I V I T Y
TheKauffmanIndexmeasuresthemonthlybusiness-creationrateattheindividualownerlevel,reportingthepercentageofnon-business-owningadultswhostartbusinesseswithmorethanfifteenhoursworkedperweek.ThematchedbasicmonthlyfilesfromtheCurrentPopulationSurvey(CPS)provideauniquelylarge,nationallyrepresentativepaneldatasetformeasuringthisentrepreneurialactivity.Thetotaladultpopulationsamplesizefortheperiodfrom1996to2011isnearlytwelvemillion.DetaileddemographicinformationavailableintheCPSandlargesamplesizesalsoallowforestimatesofseparateindicesbygender,race,immigrantstatus,age,andeducation.IndicesforallstatesandthelargestMSAsalsoarecalculated.In2011,0.32percentoftheadultpopulation,or320outof100,000adults,creatednewbusinesseseachmonth,representingapproximately543,000newbusinessespermonth.Thistotalrateofbusinesscreationdecreasedfrom0.34percentin2010.
In2011,thereareinterestingdifferencesinchangesinentrepreneurialactivityratesforpopulationsubgroups.First,LatinosandAsiansexperiencedlargedecreasesintheentrepreneurialactivityratein2011.But,theLatinoentrepreneurshiprateof0.52percentrepresentsthesecond-highestrateforthisgroupoverthepastsixteenyears.AfricanAmericansandwhitesexperiencedsmallerdeclinesinentrepreneurialactivityratesfrom2010to2011.Arelatedfindingisthattherateofentrepreneurialactivityamongimmigrantsdecreasedsharplyin2011,althoughtherateofbusinesscreationcontinuedtobetwiceashighasthenative-bornrate.Theoldestagegroup(ages55–64)andtheages35–44groupexperiencedlargedeclinesinentrepreneurialactivityratesfrom2010to2011.Finally,entrepreneurialactivityrates
increasedforthosewithouthighschooldegreesoverthepastfewyears,althoughtheyexperiencedaslightdropfrom2010to2011.
Entrepreneurialactivityratesreflectstrongregionalpatterns.RatesofnewbusinesscreationarehighestintheWestandSouth.AllregionsexcepttheNortheastexperienceddecliningratesin2011.
Entrepreneurialactivityratesvariedsubstantiallyacrossstates,fromalowof0.15percentinWestVirginiatoahighof0.52percentinArizona.EntrepreneurialactivityratesalsowerehighinTexas(440per100,000adults),California(440per100,000adults),Colorado(420per100,000adults),andAlaska(410per100,000adults).InadditiontoWestVirginia,thelowestratesofentrepreneurialactivitywerefoundinPennsylvania(160per100,000adults),Hawaii(180per100,000adults),Illinois(200per100,000adults),Indiana(200per100,000adults),andVirginia(200per100,000adults).ThestatesexperiencingthelargestincreasesinentrepreneurialactivityratesoverthepastdecadewereNevada(0.23percentagepoints),Georgia(0.18percentagepoints),Massachusetts(0.16percentagepoints),Tennessee(0.15percentagepoints),California(0.13percentagepoints),Louisiana(0.12percentagepoints),andFlorida(0.12percentagepoints).StatesthatexperiencedthelargestdecreasesinentrepreneurialactivityrateswereWyoming(-0.17percentagepoints)andNewMexico(-0.13percentagepoints).
AnalysisofthefifteenlargestmetropolitanareasintheUnitedStatesrevealsthatLosAngeles(0.58percent)hadthehighestentrepreneurialactivityratein2010.Chicago(0.18percent)andDetroit(0.18percent)hadthelowestentrepreneurialactivityrates.
Summary
23
2 0 1 1 K A U F F M A N I N D E X O F E N T R E P R E N E U R I A L A C T I V I T Y
Appendix
DATATheunderlyingdatasetsthatareusedinthis
analysisarethebasicmonthlyfilestotheCurrentPopulationSurvey(CPS).Thesesurveys,conductedmonthlybytheU.S.BureauoftheCensusandtheBureauofLaborStatistics,representtheentireU.S.populationandcontainobservationsformorethan130,000peopleeachmonth.BylinkingtheCPSfilesovertime,longitudinaldataarecreated,allowingfortheexaminationofbusinesscreations.Combiningthemonthlyfilescreatesasamplesizeofroughly700,000adultsagestwentytosixty-foureachyear.
HouseholdsintheCPSareinterviewedeachmonthoverafour-monthperiod.Eightmonthslater,theyarere-interviewedineachmonthofasecondfour-monthperiod.Thus,individualswhoareinterviewedinJanuary,February,March,andAprilofoneyearareinterviewedagaininJanuary,February,March,andAprilofthefollowingyear.TheCPSrotationpatternmakesitpossibletomatchinformationonindividualsmonthlyand,therefore,tocreatetwo-monthpaneldataforupto75percentofallCPSrespondents.Tomatchthesedata,theCPShouseholdandindividualidentifiersareused.Falsematchesareremovedbycomparingrace,sex,andagecodesfromthetwomonths.Afterremovingallnon-uniquematches,theunderlyingCPSdataarecheckedextensivelyforcodingerrorsandotherproblems.
Monthlymatchratesgenerallyarebetween94percentand96percent(seeFairlie2005).Householdmovesaretheprimaryreasonfornon-matching.Asomewhatnon-randomsample(mainlygeographicmovers)will,therefore,belostduetothematchingroutine.Movesdonotappeartocreateaseriousproblemformonth-to-monthmatches,however,becausetheobservablecharacteristicsoftheoriginal
sampleandthematchedsampleareverysimilar(seeFairlie2005).
Themicrodatausedinthisreportandacodebookareavailablefordownloadingathttp://www.kauffman.org/research-and-policy/kiea-data-files.aspx.Thedatasetincludestheentrepreneurialindexaswellasmanyadditionalvariablesforanalysis.
DETAILED DEFINITIONSTheCPSmicrodatacaptureallbusiness
owners,includingthosewhoownincorporatedorunincorporatedbusinessesandthosewhoareemployersornon-employers.TocreatetheKauffmanIndex,allindividualswhodonotownabusinessastheirmainjobareidentifiedinthefirstsurveymonth.BymatchingCPSfiles,itisthendeterminedwhethertheseindividualsownabusinessastheirmainjobwithfifteenormoreusualhoursworkedinthefollowingsurveymonth.Reducingthelikelihoodofreportingspuriouschangesinbusinessownershipstatusfrommonthtomonth,individualsareaskedbysurvey-takerswhethertheycurrentlyhavethesamemainjobasreportedinthepreviousmonth.Iftheanswerisyes,thentheinterviewercarriesforwardjobinformation,includingbusinessownership,fromthepreviousmonth’ssurvey.Iftheanswerisno,thentherespondentisaskedthefullseriesofjob-relatedquestions.Survey-takersaskthisquestionatthebeginningofthejobsectiontosavetimeduringtheinterviewprocessandimproveconsistencyinreporting.
Themainjobisdefinedastheonewiththemosthoursworked.Individualswhostartsidebusinesseswill,therefore,notbecountediftheyareworkingmorehoursonawage/salaryjob.The

24
2 0 1 1 K A U F F M A N I N D E X O F E N T R E P R E N E U R I A L A C T I V I T Y
requirementthatbusinessownersworkfifteenormorehoursperweekinthesecondmonthisimposedtoruleoutpart-timebusinessownersandverysmallbusinessactivities.Itmay,therefore,resultinanunderstatementofthepercentofindividualscreatinganytypeofbusiness.TheKauffmanIndexalsoexcludesindividualswhoownedabusinessandworkedfewerthanfifteenhoursinthefirstsurveymonth.Thus,theKauffmanIndexdoesnotcapturebusinessownerswhoincreasedtheirhoursfromlessthanfifteenperweekinonemonthtofifteenormorehoursperweekinthesecondmonth.Inaddition,theKauffmanIndexdoesnotcapturewhenthesebusinessownerschangedfromnon-businessownerstobusinessownerswithlessthanfifteenhoursworked.Theseindividualsareexcludedfromthesamplebutmayhavebeenattheearlieststagesofstartingabusiness.MoreinformationconcerningthedefinitionisprovidedinFairlie(2006).
TheKauffmanIndexalsomayoverstatebusinesscreationincertainrespectsbecauseofsmallchangesinhowindividualsreporttheirworkstatus.Longstandingbusinessownerswhoalsohavesalariedpositionsmay,forexample,reportthattheyarenotbusinessownersastheirmainjobsinaparticularmonthbecausetheirwage/salaryjobshadmorehoursinthatmonth.Iftheindividualsthenswitchedtohavingmorehoursinbusinessownershipthefollowingmonth,itwouldappearthatanewbusinesshadbeencreated.
ThemainsampleusedtocalculatetheKauffmanIndexincludesonlyadultsbetweentheagesoftwentyandsixty-four.Forestimatesofentrepreneurialactivityratesbyeducationlevel,thepopulationbetweentheagesoftwenty-fiveandsixty-fourisusedinsteadtocapturecompletedformaleducation.Olderindividuals(agessixty-five
andolder)areremovedfromthesamplebecauseretirementinthisagegroupleadstolowerratesofentrepreneurialactivity.Thereweremajorchangesinraceandindustrycodingovertheincludedperiod.Althougheveryeffortwasdevotedtocreatingconsistentcoding,definitionsarenotperfectlyconsistentovertime.
Forthedefinitionofentrepreneurialactivitydiscussedinthisreport,allobservationswithallocatedlaborforcestatus,classofworker,andhoursworkedvariablesareexcluded.Entrepreneurialactivityissubstantiallyhigherforallocatedorimputedobservations.TheseobservationswereincludedinthefirstKauffmanIndexreport(Fairlie2005).SeeFairlie(2006)foracompletediscussionoftheissuesandcomparisonsbetweenunadjustedandadjustedratesofentrepreneurialactivity.
TheCPSsamplewasdesignedtoproducenationalandstateestimatesoftheunemploymentrateandadditionallaborforcecharacteristicsofthecivilian,non-institutionalpopulationagessixteenandover.Thetotalnationalsamplesizeisdrawntoensureahighlevelofprecisionforthemonthlynationalunemploymentrate.ForeachofthefiftystatesandtheDistrictofColumbia,thesamplealsoisdesignedtoguaranteepreciseestimatesofaverageannualunemploymentratesresultinginvaryingsampleratesbystate(Polivka2000).12SamplingweightsprovidedbytheCPS,whichalsoadjustfornon-responseandpost-stratificationraking,areusedforallnationalandstate-levelestimates.
STANDARD ERRORS AND CONFIDENCE INTERVALS
Theanalysisofentrepreneurialactivitybystateincludesconfidenceintervalsthatindicateconfidencebandsofapproximately0.15percent

25
2 0 1 1 K A U F F M A N I N D E X O F E N T R E P R E N E U R I A L A C T I V I T Y
aroundtheratesofentrepreneurialactivity.Whilelargerstateshavesmallerconfidencebands,thesmalleststateshavelargerconfidencebandsofapproximately0.20percent.OversamplingintheCPSensuresthatthesesmallstateshavesamplesizesofatleast5,000observations,and,therefore,providesaminimumlevelofprecision.
Thestandarderrorsusedtocreatetheconfidenceintervalsreportedheremayunderstatethetruevariabilityinthestateestimates.Bothstratificationofthesampleandtherakingprocedure(post-stratification)willreducethevarianceofCPSestimates(Polivka2000andTrain,Cahoon,andMaken1978).Ontheotherhand,theCPSclustering(i.e.,nearbyhousesonthesameblockandmultiplehouseholdmembers)leadstoalargersamplingvariancethanwouldhavebeenobtainedfromsimplerandomsampling.ItappearsasthoughthelattereffectdominatesintheCPS,andtreatingtheCPSasrandomgenerallyunderstatesstandarderrors(Polivka2000).NationalunemploymentrateestimatesindicatethattreatingtheCPSasarandomsampleleadstoanunderstatementofthevarianceoftheunemploymentrateby23percent.Anotherproblemassociatedwiththeestimatesreportedhereisthatmultipleobservations(uptothree)mayoccurforthesameindividual.
Allofthereportedconfidenceintervalsshouldbeconsideredapproximate,astheactualconfidenceintervalsmaybeslightlylarger.ThecompletecorrectionforthestandarderrorsandconfidenceintervalsinvolvesobtainingconfidentialreplicateweightsfromtheBLSandemployingsophisticatedstatisticalprocedures.Correctionsforthepossibilityofmultipleobservationsperperson,whichmaycreatethelargestbiasinstandarderrors,aremadeusingstatisticalsurveyproceduresforallreportedconfidenceintervals.Itisimportanttonote,
however,thattheestimatesofentrepreneurialactivityratesarenotsubjecttoanyoftheseproblems.ByusingthesampleweightsprovidedbytheCPS,allestimatesofratesofentrepreneurialactivityarecorrect.
ADVANTAGES OVER OTHER POSSIBLE MEASURES OF ENTREPRENEURSHIP
TheKauffmanIndexofEntrepreneurialActivityhasseveraladvantagesoverotherpossiblemeasuresofentrepreneurshipthatarebasedonhouseholdorbusiness-leveldata.First,theCPSdataareavailableonlyacoupleofmonthsaftertheendoftheyear,whereasevenrelativelytimelydatasuchastheAmericanCommunitySurvey(ACS)takemorethanayeartobereleased.Second,theindexincludesalltypesofbusinessactivities(employers,non-employers,unincorporated,andincorporatedbusinesses),butdoesnotincludesmall-scalebusinessactivitiessuchasconsultingandcasualbusinesses.Forexample,theCountyBusinessPatternsdataincludeonlyemployerfirmsandtheSurveyofBusinessOwnersandunderlyingnon-employerdataincludeanybusinessactivitywithatleast$1,000inannualsales.Third,thepaneldatacreatedfrommatchingconsecutivemonthsoftheCPSallowforadynamicmeasureofbusinesscreation,whereasmostdatasetsonlyallowforastaticmeasureofbusinessownership(e.g.,ACS).Finally,theCPSdataincludeddetailedinformationondemographiccharacteristicsoftheowner,whereasmostbusiness-leveldatasetscontainnoinformationontheowner(e.g.,employerandnon-employerdata).
COMPARISON TO SELECTED DATASETSThemaindifferencebetweentheKauffman
Indexandpossiblemeasuresofentrepreneurial

26
2 0 1 1 K A U F F M A N I N D E X O F E N T R E P R E N E U R I A L A C T I V I T Y
activityfromtheACS(andrelateddecennialCensusofthePopulation)isthattheindexmeasuresflowsintobusinessownershipratherthanthenumberofexistingbusinessownersataspecificpointintime.Cross-sectionaldatasets,suchastheACS,donotprovideinformationonbusinesscreation.Staticmeasuresofbusinessownershipbasedoncross-sectionaldatadonotcapturethedynamicnatureofentrepreneurialactivitythattheKauffmanIndexillustrates.
TheKauffmanIndexdiffersinseveralmajorwaysfromtheSurveyofBusinessOwners(SBO)conductedeveryfiveyearsbytheU.S.CensusBureau.First,theKauffmanIndexisbasedonhouseholdsurveydataandmeasuresindividualbusinessowners.TheSBOincludesallfirmsoperatingduringtheyearthatfiledtaxformsasindividualproprietorships,partnerships,oranytypeofcorporation.Second,theKauffmanIndexcapturesbusinesscreation,whereastheSBOcapturesthenumberofexistingbusinessesatapointintime.Third,theKauffmanIndexonlyincludesindividualsstartingbusinessesastheirmainworkactivitywithasubstantialhourscommitment.TheSBOincludesallfirmswithreceiptsof$1,000ormore,whichmayincludesideor“casual”businessesownedbywage/salaryworkers,theunemployed,orretiredworkers.Finally,theKauffmanIndexincludesallnewbusinessowners,whereastheSBOexcludesagriculturalandafewothertypesofbusinesses.
TheKauffmanIndexcapturesabroaderrangeofentrepreneurialactivitythandothenationalandstate-levelfirmorestablishmentbirthdatafromtheBusinessEmployerDynamics(BED)ortheStatisticsofU.S.Businesses(SUSB).TheBEDdataarecompiledbytheU.S.BureauofLaborStatisticsfromexistingquarterlystateunemploymentinsurancerecordsthroughtheQuarterlyCensus
ofEmploymentandWagesorES-202program.TheSUSBdataarecollectedbytheU.S.CensusBureauandsummarizedbytheU.S.SmallBusinessAdministration(SBA),OfficeofAdvocacy.Bothofthesedatasetsincludeonlyemployerfirms.Employerfirmsrepresentonlyapproximatelyroughlyone-fourthofallfirms,andmanyfirmsstartwithnoemployees.Thesedata,therefore,arelikelytoleadtoasubstantialundercountintherateofentrepreneurialactivity,particularlyforcertainindustriesandregions.Finally,theBEDandSUSBdataarebusiness-leveldatacontainingessentiallynoinformationontheowner’scharacteristics,whiletheCPSisperson-leveldatacontainingverydetailedinformationontheowner.
TheKauffmanIndexalsodiffersfromtheTotalEarly-stageEntrepreneurialActivity(TEA)indexusedintheGlobalEntrepreneurshipMonitor.TheTEAcapturesthepercentageoftheage18–64populationwhoarecurrentlynascententrepreneurs(i.e.,individualswhoareactivelyinvolvedinsettingupbusinesses)orwhoarecurrentlyowner-managersofnewbusinesses(i.e.,businesseswithnopaymentstoownersoremployeesformorethanforty-twomonths).ThenascententrepreneurscapturedintheTEAwhoarestillinthestartupphaseofbusinesscreationarenotnecessarilycapturedintheKauffmanIndexbecausetheymaynotbeworkingonthenewbusinessforfifteenhoursormoreperweek.Becauseitisbasedonpaneldata,theKauffmanIndexalsodiffersfromtheTEAinthatitcapturesentrepreneurshipatthepointintimewhenthebusinessiscreated.

27
2 0 1 1 K A U F F M A N I N D E X O F E N T R E P R E N E U R I A L A C T I V I T Y
1. The U.S. Census Bureau notes that the definitions of non-employers and self-employed business owners are not the same. Although most self-employed business owners are non-employers, about a million self-employed business owners are classified as employer businesses. http://www.census.gov/econ/nonemployer/index.html.
2. See “Kauffman Index of Entrepreneurial Activity, 1996–2010” (Fairlie 2011) and http://www.kauffman.org/research-and-policy/kauffman-index-of-entrepreneurial-activity.aspx for previous reports.
3. Estimates of annual business creation rates would be approximately six to eight times higher. Annual rates are not twelve times higher than monthly rates because individuals potentially can start and exit from business ownership multiple times within the same year. Additionally, because of the broader definition of new business owners used in the Kauffman Index, it is not possible to directly compare the monthly statistics in the Kauffman Index with the quarterly and annual statistics of new employer businesses produced by the U.S. Census Bureau and U.S. Bureau of Labor Statistics.
4. National Bureau of Economic Research. 2010. Business Cycle Expansions and Contractions, http://www.nber.org/cycles.html.
5. Starting in 2009, the annual entrepreneurship rate is calculated using data from December to December. In previous years, annual entrepreneurship rates are calculated using data from January to January. See Fairlie (2010) for more details.
6. Employer firms also were starting with fewer employees. See Reedy and Litan (2011) “Starting Smaller; Staying Smaller: America’s Slow Leak in Job Creation” Kauffman Foundation Report for more information on job creation among new employer firms.
7. See Fairlie (2011), “Entrepreneurship, Economic Conditions, and the Great Recession,” University of California, Santa Cruz, Working Paper at http://people.ucsc.edu/~rfairlie/papers/ recessionentrep.pdf, for evidence on the effects of economic conditions and the Great Recession on entrepreneurship.
8. In other works from the Foundation, such as “Starting Smaller; Staying Smaller: America’s Slow Leak in Job Creation,” these differing trends among new employer businesses are discussed at more length.
9. For evidence of the relationship between education and entrepreneurship from a multivariate analysis that controls for other factors, see Fairlie (2007), “Entrepreneurship in Silicon Valley during the Boom and Bust,” University of California, Santa Cruz, Working Paper at http://people.ucsc.edu/~rfairlie/papers/siliconvalley.pdf.
10. Annual estimates of state-level entrepreneurship rates are available for downloading at www.kauffman.org/kauffmanindex.
11. As there is no oversampling of metropolitan areas in the CPS, only the largest metropolitan areas have sufficient observations to calculate reasonably accurate rates of entrepreneurial activity. All MSAs reported in Table 11 have at least 4,600 observations.
12. The ratio of households sampled for each state range from one in 100 households to one in 3,000 households (Polivka 2000).
Endnotes

28
2 0 1 1 K A U F F M A N I N D E X O F E N T R E P R E N E U R I A L A C T I V I T Y

2 0 1 1 K A U F F M A N I N D E X O F E N T R E P R E N E U R I A L A C T I V I T Y

4801 ROCKHILL ROADKANSAS CITY, MISSOURI 64110
816-932-1000 www.kauffman.org