entity resources and planne d performance · department of the treasury budget statements 12 1.2 e...
TRANSCRIPT
ENTITY RESOURCES AND PLANNED PERFORMANCE

9
DEPARTMENT OF THE TREASURY
SECTION 1: ENTITY OVERVIEW AND RESOURCES ............................................... 11 1.1 Strategic direction statement .......................................................................... 11 1.2 Entity resource statement ............................................................................... 12 1.3 Budget measures ............................................................................................ 14
SECTION 2: OUTCOMES AND PLANNED PERFORMANCE ................................... 19 2.1 Budgeted expenses and performance for Outcome 1 .................................... 20
SECTION 3: BUDGETED FINANCIAL STATEMENTS ............................................... 43 3.1 Budgeted financial statements........................................................................ 43 3.2. Budgeted financial statements tables ............................................................. 44

11
DEPARTMENT OF THE TREASURY
Section 1: Entity overview and resources
1.1 STRATEGIC DIRECTION STATEMENT
The Treasury is the pre-eminent economic adviser to the Government.
The Treasury’s purpose is to support and implement informed decisions on policies for the good of the Australian people, consistent with achieving strong, sustainable economic growth and fiscal settings.
The Treasury achieves this by providing advice, analysis and legislation to deliver economic policy supporting the effective management of the Australian economy.
The Treasury pursues its purpose through four broad objectives:
• promoting fiscal sustainability.
• increasing productivity.
• securing the benefits of global economic integration.
• efficient administration of Treasury portfolio functions.
In 2019, the Treasury embedded Structural Reform Group’s functions into the Fiscal and Macroeconomic Groups. The change to the internal structure was made to achieve better organisational balance, improve collaboration and further embed productivity and structural reform in core Treasury activities.
Department of the Treasury Budget Statements
12
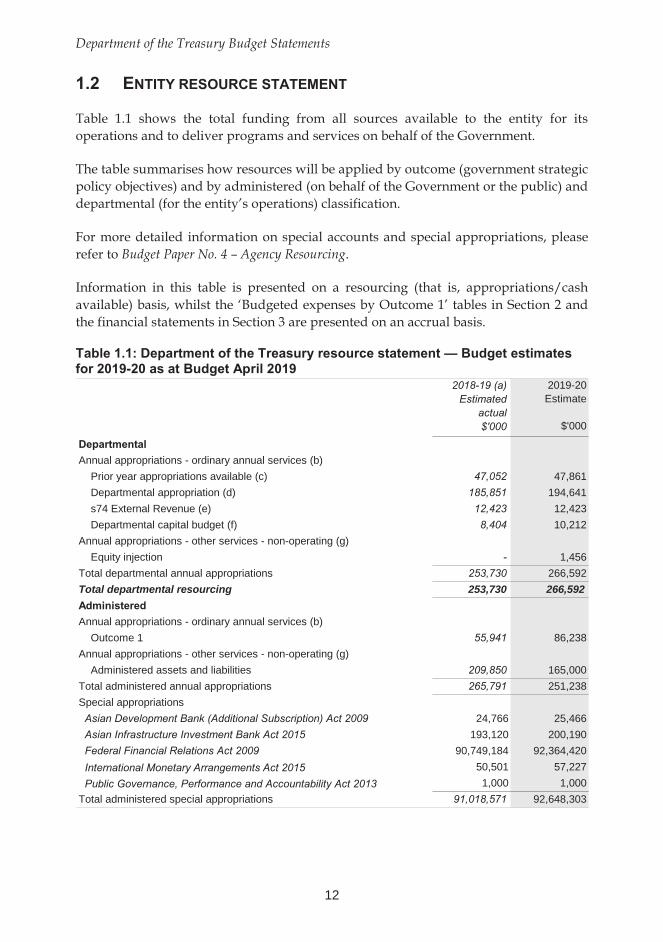
1.2 ENTITY RESOURCE STATEMENT
Table 1.1 shows the total funding from all sources available to the entity for its operations and to deliver programs and services on behalf of the Government.
The table summarises how resources will be applied by outcome (government strategic policy objectives) and by administered (on behalf of the Government or the public) and departmental (for the entity’s operations) classification.
For more detailed information on special accounts and special appropriations, please refer to Budget Paper No. 4 – Agency Resourcing.
Information in this table is presented on a resourcing (that is, appropriations/cash available) basis, whilst the ‘Budgeted expenses by Outcome 1’ tables in Section 2 and the financial statements in Section 3 are presented on an accrual basis.
Table 1.1: Department of the Treasury resource statement — Budget estimates for 2019-20 as at Budget April 2019
2018-19 (a)Estimated
actual $'000
2019-20 Estimate
$'000
DepartmentalAnnual appropriations - ordinary annual services (b) Prior year appropriations available (c) 47,052 47,861 Departmental appropriation (d) 185,851 194,641 s74 External Revenue (e) 12,423 12,423 Departmental capital budget (f) 8,404 10,212 Annual appropriations - other services - non-operating (g) Equity injection - 1,456 Total departmental annual appropriations 253,730 266,592 Total departmental resourcing 253,730 266,592 AdministeredAnnual appropriations - ordinary annual services (b) Outcome 1 55,941 86,238 Annual appropriations - other services - non-operating (g) Administered assets and liabilities 209,850 165,000 Total administered annual appropriations 265,791 251,238 Special appropriations Asian Development Bank (Additional Subscription) Act 2009 24,766 25,466 Asian Infrastructure Investment Bank Act 2015 193,120 200,190 Federal Financial Relations Act 2009 90,749,184 92,364,420 International Monetary Arrangements Act 2015 50,501 57,227 Public Governance, Performance and Accountability Act 2013 1,000 1,000 Total administered special appropriations 91,018,571 92,648,303
Department of the Treasury Budget Statements
13
Table 1.1: Department of the Treasury resource statement — Budget estimates for 2019-20 as at Budget April 2019 (continued)
2018-19 (a) Estimated
actual $'000
2019-20 Estimate
$'000
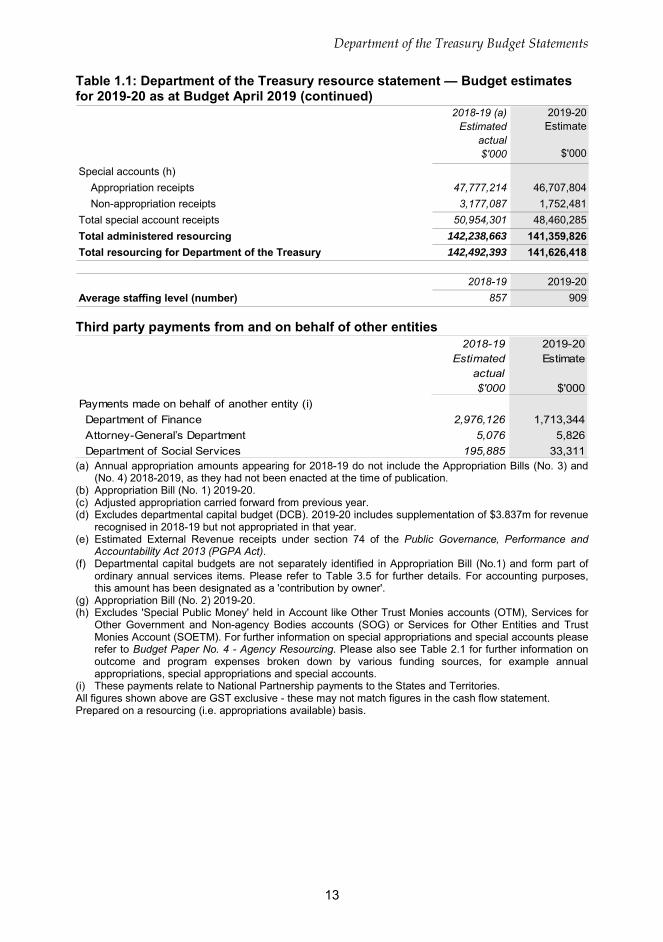
Special accounts (h) Appropriation receipts 47,777,214 46,707,804 Non-appropriation receipts 3,177,087 1,752,481 Total special account receipts 50,954,301 48,460,285 Total administered resourcing 142,238,663 141,359,826 Total resourcing for Department of the Treasury 142,492,393 141,626,418
2018-19 2019-20Average staffing level (number) 857 909
Third party payments from and on behalf of other entities
2018-19 Estimated
actual $'000
2019-20 Estimate
$'000Payments made on behalf of another entity (i) Department of Finance 2,976,126 1,713,344 Attorney-General’s Department 5,076 5,826 Department of Social Services 195,885 33,311
(a) Annual appropriation amounts appearing for 2018-19 do not include the Appropriation Bills (No. 3) and (No. 4) 2018-2019, as they had not been enacted at the time of publication.
(b) Appropriation Bill (No. 1) 2019-20. (c) Adjusted appropriation carried forward from previous year. (d) Excludes departmental capital budget (DCB). 2019-20 includes supplementation of $3.837m for revenue
recognised in 2018-19 but not appropriated in that year. (e) Estimated External Revenue receipts under section 74 of the Public Governance, Performance and
Accountability Act 2013 (PGPA Act). (f) Departmental capital budgets are not separately identified in Appropriation Bill (No.1) and form part of
ordinary annual services items. Please refer to Table 3.5 for further details. For accounting purposes, this amount has been designated as a 'contribution by owner'.
(g) Appropriation Bill (No. 2) 2019-20. (h) Excludes 'Special Public Money' held in Account like Other Trust Monies accounts (OTM), Services for
Other Government and Non-agency Bodies accounts (SOG) or Services for Other Entities and Trust Monies Account (SOETM). For further information on special appropriations and special accounts please refer to Budget Paper No. 4 - Agency Resourcing. Please also see Table 2.1 for further information on outcome and program expenses broken down by various funding sources, for example annual appropriations, special appropriations and special accounts.
(i) These payments relate to National Partnership payments to the States and Territories. All figures shown above are GST exclusive - these may not match figures in the cash flow statement. Prepared on a resourcing (i.e. appropriations available) basis.
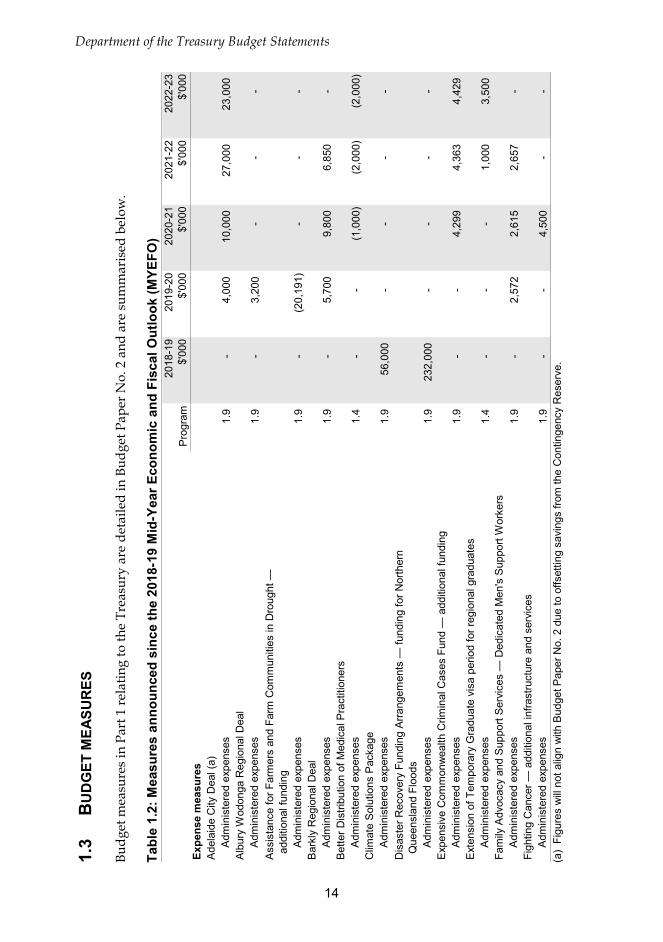
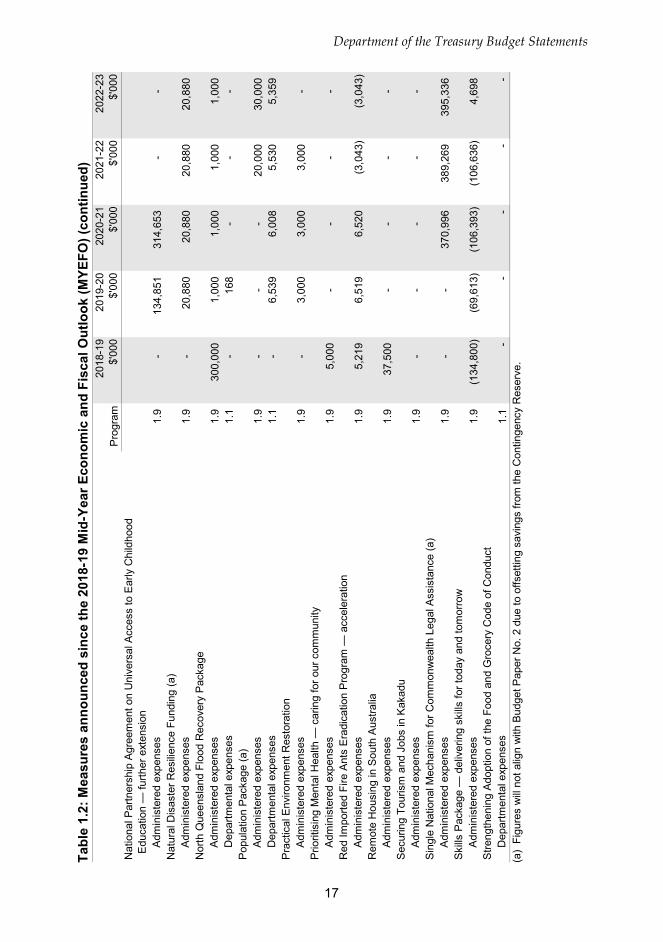
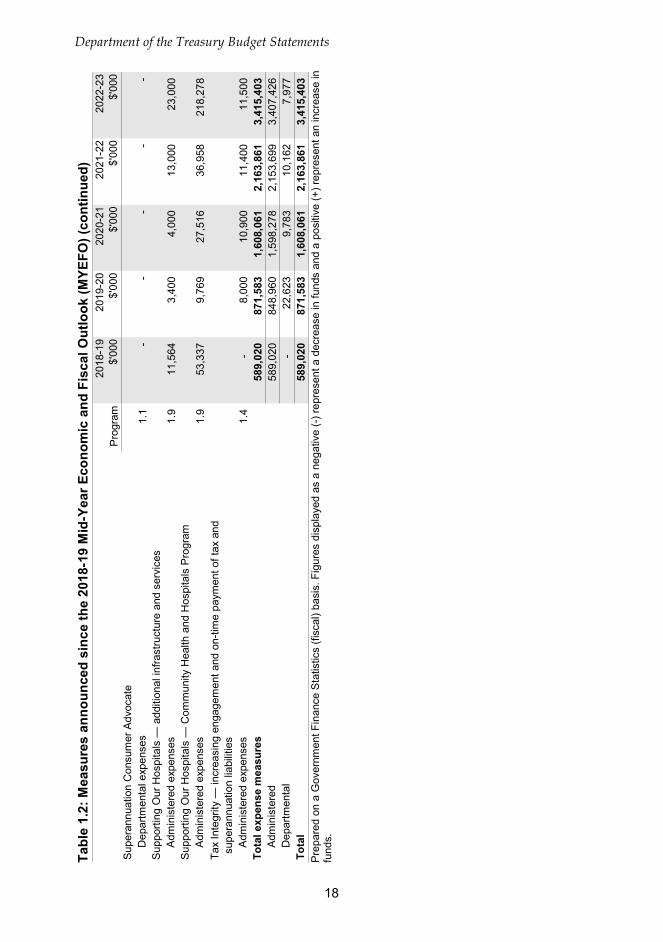
1.3
BU
DG
ET M
EASU
RES
Budg
et m
easu
res
in P
art 1
rela
ting
to th
e Tr
easu
ry a
re d
etai
led
in B
udge
t Pap
er N
o. 2
and
are
sum
mar
ised
bel
ow.
Tabl
e 1.
2: M
easu
res
anno
unce
d si
nce
the
2018
-19
Mid
-Yea
r Eco
nom
ic a
nd F
isca
l Out
look
(MYE
FO)
Pro
gram
2018
-19
$'00
020
19-2
0$'
000
2020
-21
$'00
020
21-2
2$'
000
2022
-23
$'00
0Ex
pens
e m
easu
res
Ade
laid
e C
ity D
eal (
a)
Adm
inis
tere
d ex
pens
es1.
9
-
4,00
0
10
,000
27
,000
23
,000
A
lbur
y W
odon
ga R
egio
nal D
eal
A
dmin
iste
red
expe
nses
1.9
-
3,
200
-
-
-
Ass
ista
nce
for F
arm
ers
and
Farm
Com
mun
ities
in D
roug
ht —
a
dditi
onal
fund
ing
A
dmin
iste
red
expe
nses
1.9
-
(2
0,19
1)
-
-
-
Bar
kly
Reg
iona
l Dea
l
Adm
inis
tere
d ex
pens
es1.
9
-
5,70
0
9,
800
6,85
0
-
B
ette
r Dis
tribu
tion
of M
edic
al P
ract
ition
ers
A
dmin
iste
red
expe
nses
1.4
-
-
(1
,000
)
(2,0
00)
(2
,000
)
Clim
ate
Sol
utio
ns P
acka
ge
Adm
inis
tere
d ex
pens
es1.
9
56,0
00
-
-
-
-
Dis
aste
r Rec
over
y Fu
ndin
g A
rrang
emen
ts —
fund
ing
for N
orth
ern
Que
ensl
and
Floo
ds
Adm
inis
tere
d ex
pens
es1.
9
232,
000
-
-
-
-
Exp
ensi
ve C
omm
onw
ealth
Crim
inal
Cas
es F
und
— a
dditi
onal
fund
ing
A
dmin
iste
red
expe
nses
1.9
-
-
4,
299
4,36
3
4,
429
Ext
ensi
on o
f Tem
pora
ry G
radu
ate
visa
per
iod
for r
egio
nal g
radu
ates
A
dmin
iste
red
expe
nses
1.4
-
-
-
1,
000
3,50
0
Fa
mily
Adv
ocac
y an
d S
uppo
rt S
ervi
ces
— D
edic
ated
Men
's S
uppo
rt W
orke
rs
Adm
inis
tere
d ex
pens
es1.
9
-
2,57
2
2,
615
2,65
7
-
Fi
ghtin
g C
ance
r — a
dditi
onal
infra
stru
ctur
e an
d se
rvic
es
Adm
inis
tere
d ex
pens
es1.
9
-
-
4,50
0
-
-
(a)
Figu
res
will
not
alig
n w
ith B
udge
t Pap
er N
o. 2
due
to o
ffset
ting
savi
ngs
from
the
Con
tinge
ncy
Res
erve
.
Department of the Treasury Budget Statements
14
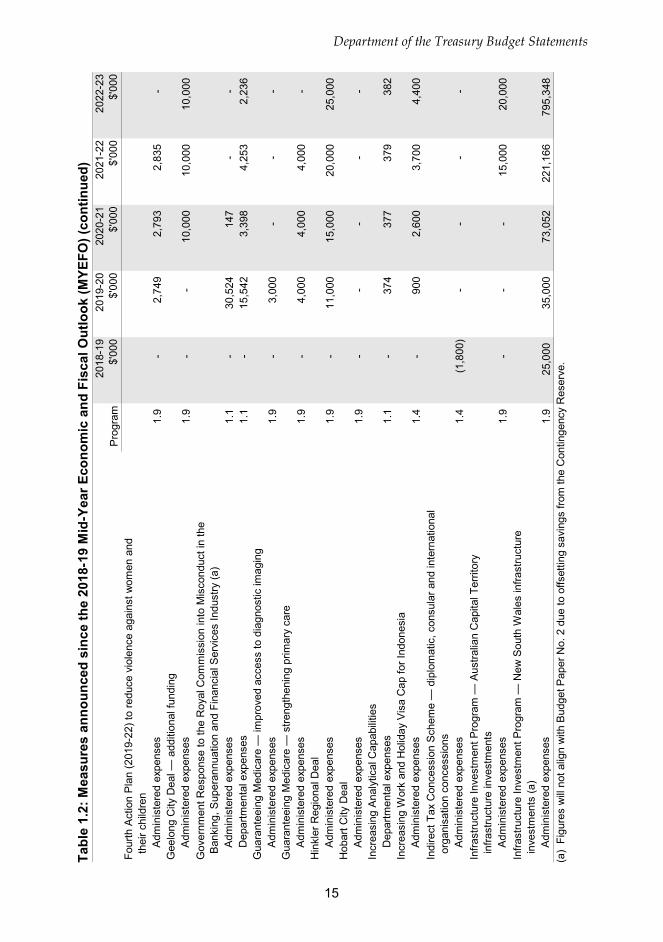
Tabl
e 1.
2: M
easu
res
anno
unce
d si
nce
the
2018
-19
Mid
-Yea
r Eco
nom
ic a
nd F
isca
l Out
look
(MYE
FO) (
cont
inue
d)
Pro
gram
2018
-19
$'00
020
19-2
0$'
000
2020
-21
$'00
020
21-2
2$'
000
2022
-23
$'00
0Fo
urth
Act
ion
Pla
n (2
019-
22) t
o re
duce
vio
lenc
e ag
ains
t wom
en a
nd
the
ir ch
ildre
n
Adm
inis
tere
d ex
pens
es1.
9
-
2,74
9
2,
793
2,83
5
-
G
eelo
ng C
ity D
eal —
add
ition
al fu
ndin
g
Adm
inis
tere
d ex
pens
es1.
9
-
-
10,0
00
10,0
00
10,0
00
Gov
ernm
ent R
espo
nse
to th
e R
oyal
Com
mis
sion
into
Mis
cond
uct i
n th
e B
anki
ng, S
uper
annu
atio
n an
d Fi
nanc
ial S
ervi
ces
Indu
stry
(a)
A
dmin
iste
red
expe
nses
1.1
-
30
,524
14
7
-
-
D
epar
tmen
tal e
xpen
ses
1.1
-
15
,542
3,
398
4,25
3
2,
236
Gua
rant
eein
g M
edic
are
— im
prov
ed a
cces
s to
dia
gnos
tic im
agin
g
Adm
inis
tere
d ex
pens
es1.
9
-
3,00
0
-
-
-
G
uara
ntee
ing
Med
icar
e —
stre
ngth
enin
g pr
imar
y ca
re
A
dmin
iste
red
expe
nses
1.9
-
4,
000
4,00
0
4,
000
-
Hin
kler
Reg
iona
l Dea
l
Adm
inis
tere
d ex
pens
es1.
9
-
11,0
00
15,0
00
20,0
00
25,0
00
Hob
art C
ity D
eal
A
dmin
iste
red
expe
nses
1.9
-
-
-
-
-
In
crea
sing
Ana
lytic
al C
apab
ilitie
s
Dep
artm
enta
l exp
ense
s1.
1
-
374
37
7
379
38
2
Incr
easi
ng W
ork
and
Hol
iday
Vis
a C
ap fo
r Ind
ones
ia
Adm
inis
tere
d ex
pens
es1.
4
-
900
2,
600
3,70
0
4,
400
Indi
rect
Tax
Con
cess
ion
Sch
eme
— d
iplo
mat
ic, c
onsu
lar a
nd in
tern
atio
nal
org
anis
atio
n co
nces
sion
s
Adm
inis
tere
d ex
pens
es1.
4
(1,8
00)
-
-
-
-
In
frast
ruct
ure
Inve
stm
ent P
rogr
am —
Aus
tralia
n C
apita
l Ter
ritor
y i
nfra
stru
ctur
e in
vest
men
ts
Adm
inis
tere
d ex
pens
es1.
9
-
-
-
15,0
00
20,0
00
Infra
stru
ctur
e In
vest
men
t Pro
gram
— N
ew S
outh
Wal
es in
frast
ruct
ure
inv
estm
ents
(a)
A
dmin
iste
red
expe
nses
1.9
25
,000
35
,000
73
,052
22
1,16
6
79
5,34
8
(a)
Figu
res
will
not
alig
n w
ith B
udge
t Pap
er N
o. 2
due
to o
ffset
ting
savi
ngs
from
the
Con
tinge
ncy
Res
erve
.
Department of the Treasury Budget Statements
15
Department of the Treasury Budget Statements
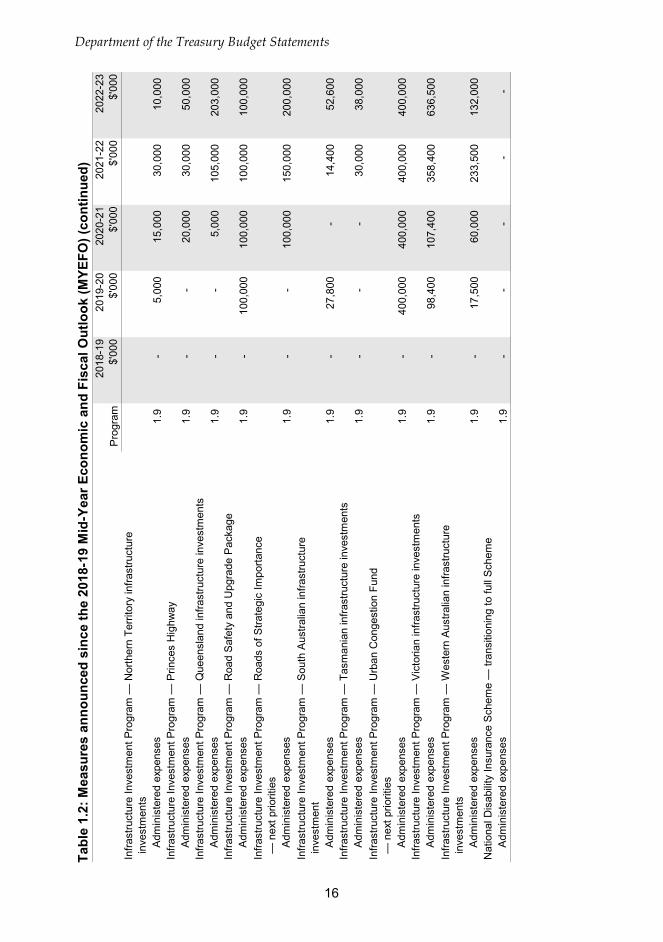
Tabl
e 1.
2: M
easu
res
anno
unce
d si
nce
the
2018
-19
Mid
-Yea
r Eco
nom
ic a
nd F
isca
l Out
look
(MYE
FO) (
cont
inue
d)
Pro
gram
2018
-19
$'00
020
19-2
0$'
000
2020
-21
$'00
020
21-2
2$'
000
2022
-23
$'00
0In
frast
ruct
ure
Inve
stm
ent P
rogr
am —
Nor
ther
n Te
rrito
ry in
frast
ruct
ure
inv
estm
ents
A
dmin
iste
red
expe
nses
1.9
-
5,
000
15,0
00
30,0
00
10,0
00
Infra
stru
ctur
e In
vest
men
t Pro
gram
— P
rince
s H
ighw
ay
Adm
inis
tere
d ex
pens
es1.
9
-
-
20,0
00
30,0
00
50,0
00
Infra
stru
ctur
e In
vest
men
t Pro
gram
— Q
ueen
slan
d in
frast
ruct
ure
inve
stm
ents
A
dmin
iste
red
expe
nses
1.9
-
-
5,
000
105,
000
203,
000
Infra
stru
ctur
e In
vest
men
t Pro
gram
— R
oad
Saf
ety
and
Upg
rade
Pac
kage
A
dmin
iste
red
expe
nses
1.9
-
10
0,00
0
10
0,00
0
10
0,00
0
10
0,00
0
In
frast
ruct
ure
Inve
stm
ent P
rogr
am —
Roa
ds o
f Stra
tegi
c Im
porta
nce
— n
ext p
riorit
ies
A
dmin
iste
red
expe
nses
1.9
-
-
10
0,00
0
15
0,00
0
20
0,00
0
In
frast
ruct
ure
Inve
stm
ent P
rogr
am —
Sou
th A
ustra
lian
infra
stru
ctur
e i
nves
tmen
t
Adm
inis
tere
d ex
pens
es1.
9
-
27,8
00
-
14,4
00
52,6
00
Infra
stru
ctur
e In
vest
men
t Pro
gram
— T
asm
ania
n in
frast
ruct
ure
inve
stm
ents
A
dmin
iste
red
expe
nses
1.9
-
-
-
30
,000
38
,000
In
frast
ruct
ure
Inve
stm
ent P
rogr
am —
Urb
an C
onge
stio
n Fu
nd
— n
ext p
riorit
ies
A
dmin
iste
red
expe
nses
1.9
-
40
0,00
0
40
0,00
0
40
0,00
0
40
0,00
0
In
frast
ruct
ure
Inve
stm
ent P
rogr
am —
Vic
toria
n in
frast
ruct
ure
inve
stm
ents
A
dmin
iste
red
expe
nses
1.9
-
98
,400
10
7,40
0
35
8,40
0
63
6,50
0
In
frast
ruct
ure
Inve
stm
ent P
rogr
am —
Wes
tern
Aus
tralia
n in
frast
ruct
ure
inv
estm
ents
A
dmin
iste
red
expe
nses
1.9
-
17
,500
60
,000
23
3,50
0
13
2,00
0
N
atio
nal D
isab
ility
Insu
ranc
e S
chem
e —
tran
sitio
ning
to fu
ll S
chem
e
Adm
inis
tere
d ex
pens
es1.
9
-
-
-
-
-
16
Tabl
e 1.
2: M
easu
res
anno
unce
d si
nce
the
2018
-19
Mid
-Yea
r Eco
nom
ic a
nd F
isca
l Out
look
(MYE
FO) (
cont
inue
d)
Pro
gram
2018
-19
$'00
020
19-2
0$'
000
2020
-21
$'00
020
21-2
2$'
000
2022
-23
$'00
0N
atio
nal P
artn
ersh
ip A
gree
men
t on
Uni
vers
al A
cces
s to
Ear
ly C
hild
hood
E
duca
tion
— fu
rther
ext
ensi
on
Adm
inis
tere
d ex
pens
es1.
9
-
134,
851
314,
653
-
-
Nat
ural
Dis
aste
r Res
ilien
ce F
undi
ng (a
)
Adm
inis
tere
d ex
pens
es1.
9
-
20,8
80
20,8
80
20,8
80
20,8
80
Nor
th Q
ueen
slan
d Fl
ood
Rec
over
y P
acka
ge
Adm
inis
tere
d ex
pens
es1.
9
300,
000
1,00
0
1,
000
1,00
0
1,
000
D
epar
tmen
tal e
xpen
ses
1.1
-
16
8
-
-
-
Pop
ulat
ion
Pac
kage
(a)
A
dmin
iste
red
expe
nses
1.9
-
-
-
20
,000
30
,000
Dep
artm
enta
l exp
ense
s1.
1
-
6,53
9
6,
008
5,53
0
5,
359
Pra
ctic
al E
nviro
nmen
t Res
tora
tion
A
dmin
iste
red
expe
nses
1.9
-
3,
000
3,00
0
3,
000
-
Prio
ritis
ing
Men
tal H
ealth
— c
arin
g fo
r our
com
mun
ity
Adm
inis
tere
d ex
pens
es1.
9
5,00
0
-
-
-
-
R
ed Im
porte
d Fi
re A
nts
Era
dica
tion
Pro
gram
— a
ccel
erat
ion
A
dmin
iste
red
expe
nses
1.9
5,
219
6,51
9
6,
520
(3,0
43)
(3
,043
)
Rem
ote
Hou
sing
in S
outh
Aus
tralia
A
dmin
iste
red
expe
nses
1.9
37
,500
-
-
-
-
S
ecur
ing
Tour
ism
and
Job
s in
Kak
adu
A
dmin
iste
red
expe
nses
1.9
-
-
-
-
-
S
ingl
e N
atio
nal M
echa
nism
for C
omm
onw
ealth
Leg
al A
ssis
tanc
e (a
)
Adm
inis
tere
d ex
pens
es1.
9
-
-
370,
996
389,
269
395,
336
Ski
lls P
acka
ge —
del
iver
ing
skill
s fo
r tod
ay a
nd to
mor
row
A
dmin
iste
red
expe
nses
1.9
(1
34,8
00)
(69,
613)
(1
06,3
93)
(106
,636
)
4,
698
Stre
ngth
enin
g A
dopt
ion
of th
e Fo
od a
nd G
roce
ry C
ode
of C
ondu
ct
Dep
artm
enta
l exp
ense
s1.
1
--
--
-
(a)
Figu
res
will
not
alig
n w
ith B
udge
t Pap
er N
o. 2
due
to o
ffset
ting
savi
ngs
from
the
Con
tinge
ncy
Res
erve
.
Department of the Treasury Budget Statements
17
Department of the Treasury Budget Statements
Tabl
e 1.
2: M
easu
res
anno
unce
d si
nce
the
2018
-19
Mid
-Yea
r Eco
nom
ic a
nd F
isca
l Out
look
(MYE
FO) (
cont
inue
d)
Pro
gram
2018
-19
$'00
020
19-2
0$'
000
2020
-21
$'00
020
21-2
2$'
000
2022
-23
$'00
0S
uper
annu
atio
n C
onsu
mer
Adv
ocat
e
Dep
artm
enta
l exp
ense
s1.
1
--
--
-S
uppo
rting
Our
Hos
pita
ls —
add
ition
al in
frast
ruct
ure
and
serv
ices
Adm
inis
tere
d ex
pens
es1.
9
11,5
64
3,40
0
4,
000
13,0
00
23,0
00
Sup
porti
ng O
ur H
ospi
tals
— C
omm
unity
Hea
lth a
nd H
ospi
tals
Pro
gram
A
dmin
iste
red
expe
nses
1.9
53
,337
9,
769
27,5
16
36,9
58
218,
278
Tax
Inte
grity
— in
crea
sing
eng
agem
ent a
nd o
n-tim
e pa
ymen
t of t
ax a
nd
sup
eran
nuat
ion
liabi
litie
s
Adm
inis
tere
d ex
pens
es1.
4
-
8,00
0
10
,900
11
,400
11
,500
To
tal e
xpen
se m
easu
res
589,
020
871,
583
1,60
8,06
1
2,16
3,86
1
3,41
5,40
3
A
dmin
iste
red
589,
020
848,
960
1,59
8,27
8
2,15
3,69
9
3,40
7,42
6
D
epar
tmen
tal
-
22,6
23
9,78
3
10
,162
7,
977
Tota
l58
9,02
0
87
1,58
3
1,
608,
061
2,
163,
861
3,
415,
403
Pre
pare
d on
a G
over
nmen
t Fin
ance
Sta
tistic
s (fi
scal
) bas
is. F
igur
es d
ispl
ayed
as
a ne
gativ
e (-)
repr
esen
t a d
ecre
ase
in fu
nds
and
a po
sitiv
e (+
) rep
rese
nt a
n in
crea
se in
fu
nds.
18
Department of the Treasury Budget Statements
19
Section 2: Outcomes and planned performance
Government outcomes are the intended results, impacts or consequences of actions by the Government on the Australian community. Commonwealth programs are the primary vehicle by which government entities achieve the intended results of their outcome statements. Entities are required to identify the programs which contribute to government outcomes over the Budget and forward years.
The Treasury’s outcome is described below together with its related programs. The following provides detailed information on expenses for each outcome and program, further broken down by funding source.
Note:
Performance reporting requirements in the Portfolio Budget Statements are part of the enhanced Commonwealth performance framework established by the Public Governance, Performance and Accountability Act 2013. It is anticipated that the performance criteria described in Portfolio Budget Statements will be read with broader information provided in an entity’s corporate plans and annual performance statements – included in Annual Reports - to provide an entity’s complete performance story.
The most recent corporate plan for the Treasury can be found at: https://treasury.gov.au/publication/corporate-plan-2018-19
The most recent annual performance statement can be found at: http://treasury.gov.au/publication/annual-report-2018
Department of the Treasury Budget Statements
20
2.1 BUDGETED EXPENSES AND PERFORMANCE FOR OUTCOME 1
Outcome 1:
Supporting and implementing informed decisions on policies for the good of the Australian people, including for achieving strong, sustainable economic growth, through the provision of advice to Treasury Ministers and the efficient administration of Treasury’s functions.
Linked programs
Contribution made by Outcome 1 Treasury Outcome 1 contributes to the following programs by making payments to the States and Territories under National Partnership agreements, National Specific Purpose Payments (SPP) and bilateral agreements that support the delivery of the programs. Details of the individual National Partnership agreements within Program 1.9 are set out in Table 2.2 for each Portfolio.
Attorney-General’s Department
Programs • Program 1.4 – Justice Services
• Program 1.6 - Indigenous Legal and Native Title Assistance
• Program 2.3 - Social and Community Service
Department of Agriculture and Water Resources
Programs • Program 1.2 – Sustainable Management – Natural resources
• Program 1.3 – Forestry Industry
• Program 2.2 – Plant and Animal Health
• Program 3.1 – Water Reform
Department of Communication and the Arts
Program • Program 1.1 – Digital Technologies and Communications Services
Department of Defence
Program • Program 2.1 - Strategic Policy and Intelligence
Department of the Treasury Budget Statements
21
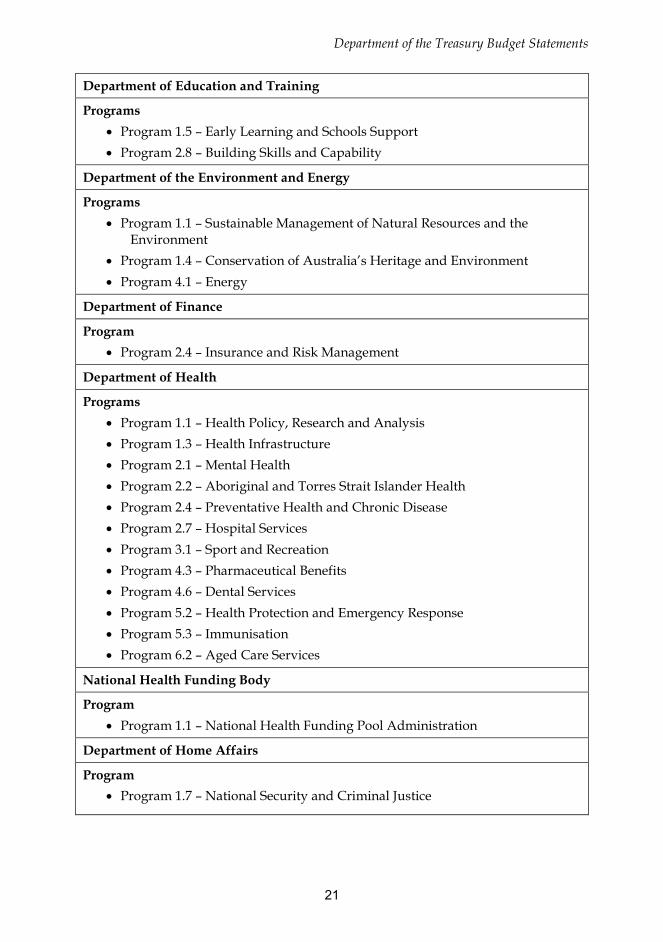
Department of Education and Training
Programs • Program 1.5 – Early Learning and Schools Support • Program 2.8 – Building Skills and Capability
Department of the Environment and Energy
Programs • Program 1.1 – Sustainable Management of Natural Resources and the
Environment • Program 1.4 – Conservation of Australia’s Heritage and Environment • Program 4.1 – Energy
Department of Finance
Program • Program 2.4 – Insurance and Risk Management
Department of Health
Programs • Program 1.1 – Health Policy, Research and Analysis • Program 1.3 – Health Infrastructure • Program 2.1 – Mental Health • Program 2.2 – Aboriginal and Torres Strait Islander Health • Program 2.4 – Preventative Health and Chronic Disease • Program 2.7 – Hospital Services • Program 3.1 – Sport and Recreation • Program 4.3 – Pharmaceutical Benefits • Program 4.6 – Dental Services • Program 5.2 – Health Protection and Emergency Response • Program 5.3 – Immunisation • Program 6.2 – Aged Care Services
National Health Funding Body
Program • Program 1.1 – National Health Funding Pool Administration
Department of Home Affairs
Program • Program 1.7 – National Security and Criminal Justice
Department of the Treasury Budget Statements
22
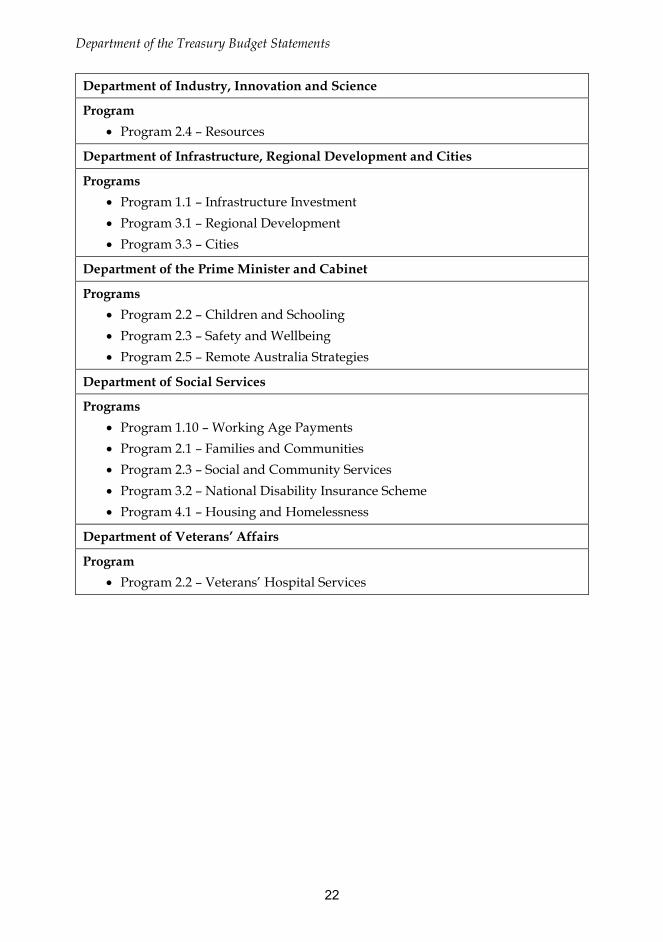
Department of Industry, Innovation and Science
Program • Program 2.4 – Resources
Department of Infrastructure, Regional Development and Cities
Programs • Program 1.1 – Infrastructure Investment • Program 3.1 – Regional Development • Program 3.3 – Cities
Department of the Prime Minister and Cabinet
Programs • Program 2.2 – Children and Schooling • Program 2.3 – Safety and Wellbeing • Program 2.5 – Remote Australia Strategies
Department of Social Services
Programs • Program 1.10 – Working Age Payments • Program 2.1 – Families and Communities • Program 2.3 – Social and Community Services • Program 3.2 – National Disability Insurance Scheme • Program 4.1 – Housing and Homelessness
Department of Veterans’ Affairs
Program • Program 2.2 – Veterans’ Hospital Services
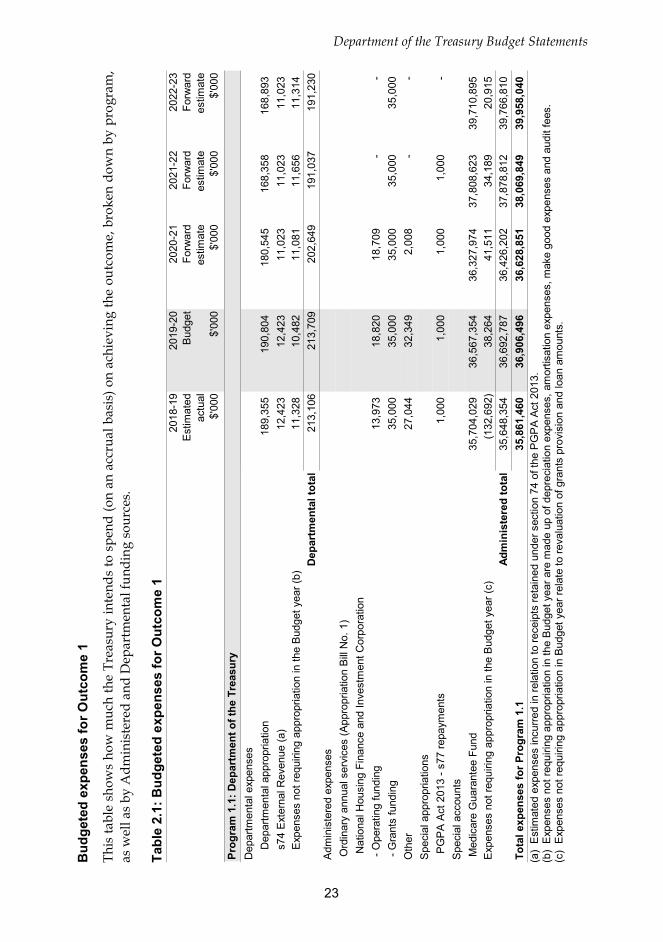
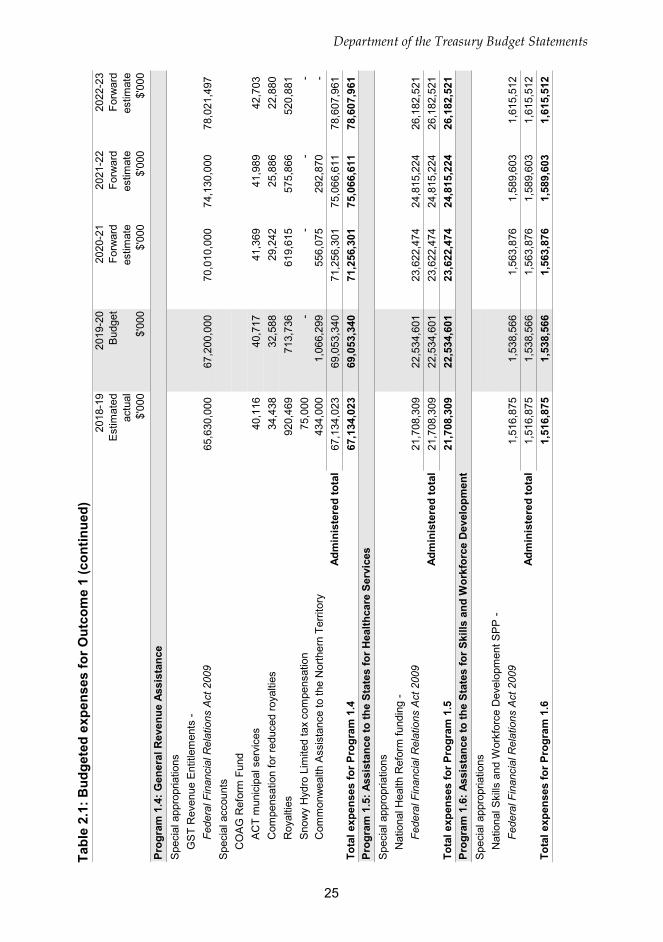
Bud
gete
d ex
pens
es fo
r Out
com
e 1
This
tabl
e sh
ows
how
muc
h th
e Tr
easu
ry in
tend
s to
spe
nd (o
n an
acc
rual
bas
is) o
n ac
hiev
ing
the
outc
ome,
bro
ken
dow
n by
pro
gram
, as
wel
l as
by A
dmin
iste
red
and
Dep
artm
enta
l fun
ding
sou
rces
.
Tabl
e 2.
1: B
udge
ted
expe
nses
for O
utco
me
1
2018
-19
Est
imat
ed
actu
al$'
000
2019
-20
Bud
get
$'00
0
2020
-21
Forw
ard
estim
ate
$'00
0
2021
-22
Forw
ard
estim
ate
$'00
0
2022
-23
Forw
ard
estim
ate
$'00
0
Dep
artm
enta
l exp
ense
sD
epar
tmen
tal a
ppro
pria
tion
189,
355
190,
804
180,
545
168,
358
168,
893
s74
Ext
erna
l Rev
enue
(a)
12,4
2312
,423
11,0
2311
,023
11,0
23E
xpen
ses
not r
equi
ring
appr
opria
tion
in th
e B
udge
t yea
r (b)
11,3
2810
,482
11,0
8111
,656
11,3
14D
epar
tmen
tal t
otal
213,
106
213,
709
202,
649
191,
037
191,
230
Adm
inis
tere
d ex
pens
es O
rdin
ary
annu
al s
ervi
ces
(App
ropr
iatio
n B
ill N
o. 1
) N
atio
nal H
ousi
ng F
inan
ce a
nd In
vest
men
t Cor
pora
tion
- O
pera
ting
fund
ing
13, 9
7318
,820
18,7
09-
- -
Gra
nts
fund
ing
35,0
0035
,000
35,0
0035
,000
35,0
00O
ther
27,0
4432
,349
2,00
8-
-S
peci
al a
ppro
pria
tions
PG
PA
Act
201
3 - s
77 re
paym
ents
1,00
01,
000
1,00
01,
000
-S
peci
al a
ccou
nts
Med
icar
e G
uara
ntee
Fun
d35
, 704
,029
36,5
67,3
5436
,327
,974
37,8
08,6
2339
,710
,895
Exp
ense
s no
t req
uirin
g ap
prop
riatio
n in
the
Bud
get y
ear (
c)(1
32,6
92)
38,2
6441
,511
34,1
8920
,915
Adm
inis
tere
d to
tal
35,6
48,3
5436
,692
,787
36,4
26,2
0237
,878
,812
39,7
66,8
10To
tal e
xpen
ses
for P
rogr
am 1
.135
,861
,460
36,9
06,4
9636
,628
,851
38,0
69,8
4939
,958
,040
Prog
ram
1.1
: Dep
artm
ent o
f the
Tre
asur
y
(a
) E
stim
ated
exp
ense
s in
curre
d in
rela
tion
to re
ceip
ts re
tain
ed u
nder
sec
tion
74 o
f the
PG
PA
Act 2
013.
(b
) E
xpen
ses
not r
equi
ring
appr
opria
tion
in th
e B
udge
t yea
r are
mad
e up
of d
epre
ciat
ion
expe
nses
, am
ortis
atio
n ex
pens
es, m
ake
good
exp
ense
s an
d au
dit f
ees.
(c
) E
xpen
ses
not r
equi
ring
appr
opria
tion
in B
udge
t yea
r rel
ate
to re
valu
atio
n of
gra
nts
prov
isio
n an
d lo
an a
mou
nts.
Department of the Treasury Budget Statements
23
Department of the Treasury Budget Statements
Tabl
e 2.
1: B
udge
ted
expe
nses
for O
utco
me
1 (c
ontin
ued)
20
18-1
9 E
stim
ated
ac
tual
$'00
0
2019
-20
Bud
get
$'00
0
2020
-21
Forw
ard
estim
ate
$'00
0
2021
-22
Forw
ard
estim
ate
$'00
0
2022
-23
Forw
ard
estim
ate
$'00
0
Adm
inis
tere
d ex
pens
es S
peci
al a
ppro
pria
tions
In
tern
atio
nal M
onet
ary
Agr
eem
ents
Act
194
762
,839
71,5
5973
,155
81,1
8490
,435
E
xpen
ses
not r
equi
ring
appr
opria
tion
(d)
489,
383
40,7
74-
198,
716
205,
612
Adm
inis
tere
d to
tal
552,
222
112,
333
73,1
5527
9,90
029
6,04
7To
tal e
xpen
ses
for P
rogr
am 1
.255
2,22
211
2,33
373
,155
279,
900
296,
047
Adm
inis
tere
d ex
pens
esO
rdin
ary
annu
al s
ervi
ces
(App
ropr
iatio
n A
ct N
o. 1
)G
loba
l Inf
rast
ruct
ure
Hub
5,
900
-
7,5
00
7,5
00
2,5
00
Sta
ndar
ds A
ustra
lia -
deve
lopm
ent o
f int
erna
tiona
l blo
ckch
ain
sta
ndar
ds
7
0 60
-
--
Hou
sing
Loa
ns In
sura
nce
Com
pany
Lim
ited
- man
agem
ent o
f p
re-tr
ansf
er c
ontra
ct p
ortfo
lio
9 9
9
9
-
Adm
inis
tere
d to
tal
5,97
9
69
7,50
9
7,
509
2,50
0
Tota
l exp
ense
s fo
r Pro
gram
1.3
5,97
9
69
7,50
9
7,
509
2,50
0
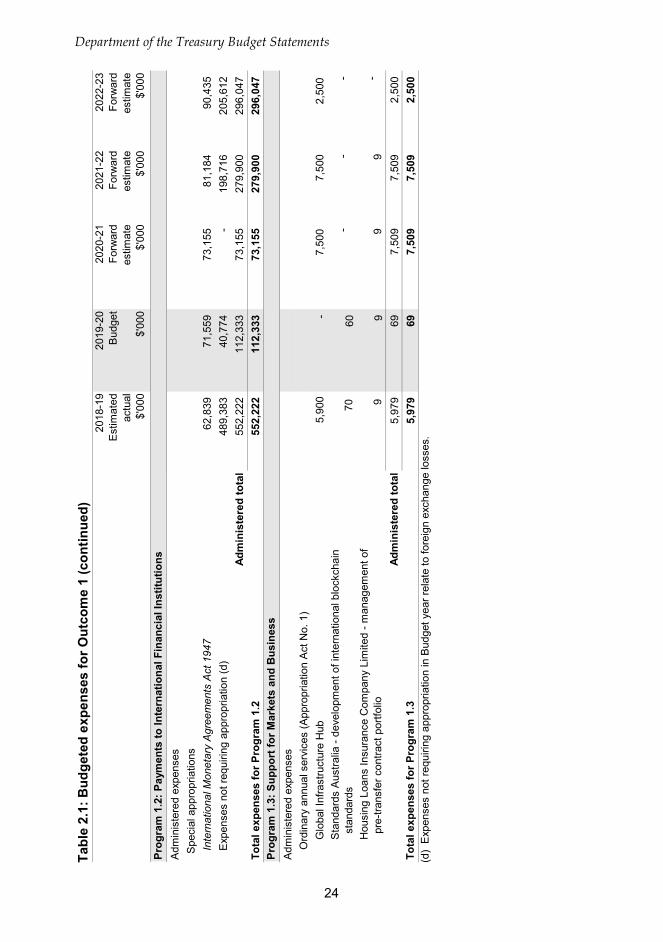
Prog
ram
1.2
: Pay
men
ts to
Inte
rnat
iona
l Fin
anci
al In
stitu
tions
Prog
ram
1.3
: Sup
port
for M
arke
ts a
nd B
usin
ess
(d
) E
xpen
ses
not r
equi
ring
appr
opria
tion
in B
udge
t yea
r rel
ate
to fo
reig
n ex
chan
ge lo
sses
.
24
Tabl
e 2.
1: B
udge
ted
expe
nses
for O
utco
me
1 (c
ontin
ued)
20
18-1
9 E
stim
ated
ac
tual
$'00
0
2019
-20
Bud
get
$'00
0
2020
-21
Forw
ard
estim
ate
$'00
0
2021
-22
Forw
ard
estim
ate
$'00
0
2022
-23
Forw
ard
estim
ate
$'00
0
Spe
cial
app
ropr
iatio
nsG
ST
Rev
enue
Ent
itlem
ents
- Fe
dera
l Fin
anci
al R
elat
ions
Act
200
9 65
,630
,000
67,2
00,0
0070
,010
,000
74,1
30,0
0078
,021
,497
Spe
cial
acc
ount
sC
OA
G R
efor
m F
und
AC
T m
unic
ipal
ser
vice
s40
,116
40,7
1741
,369
41,9
8942
,703
Com
pens
atio
n fo
r red
uced
roya
lties
34,4
3832
,588
29,2
4225
,886
22,8
80R
oyal
ties
920,
469
713,
736
619,
615
575,
866
520,
881
Sno
wy
Hyd
ro L
imite
d ta
x co
mpe
nsat
ion
75,0
00-
--
-C
omm
onw
ealth
Ass
ista
nce
to th
e N
orth
ern
Terri
tory
434,
000
1,06
6,29
955
6,07
529
2,87
0-
Adm
inis
tere
d to
tal
67,1
34,0
2369
,053
,340
71,2
56,3
0175
,066
,611
78,6
07,9
61To
tal e
xpen
ses
for P
rogr
am 1
.467
,134
,023
69,0
53,3
4071
,256
,301
75,0
66,6
1178
,607
,961
Spe
cial
app
ropr
iatio
nsN
atio
nal H
ealth
Ref
orm
fund
ing
-Fe
dera
l Fin
anci
al R
elat
ions
Act
200
921
, 708
,309
22,5
34,6
0123
,622
,474
24,8
15,2
2426
,182
,521
Adm
inis
tere
d to
tal
21,7
08,3
0922
,534
,601
23,6
22,4
7424
,815
,224
26,1
82,5
21To
tal e
xpen
ses
for P
rogr
am 1
.521
,708
,309
22,5
34,6
0123
,622
,474
24,8
15,2
2426
,182
,521
Spe
cial
app
ropr
iatio
nsN
atio
nal S
kills
and
Wor
kfor
ce D
evel
opm
ent S
PP
- Fe
dera
l Fin
anci
al R
elat
ions
Act
200
91,
516,
875
1,53
8,56
61,
563,
876
1,58
9,60
31,
615,
512
Adm
inis
tere
d to
tal
1,51
6,87
51,
538,
566
1,56
3,87
61,
589,
603
1,61
5,51
2To
tal e
xpen
ses
for P
rogr
am 1
.61,
516,
875
1,53
8,56
61,
563,
876
1,58
9,60
31,
615,
512
Prog
ram
1.4
: Gen
eral
Rev
enue
Ass
ista
nce
Prog
ram
1.5
: Ass
ista
nce
to th
e St
ates
for H
ealth
care
Ser
vice
s
Prog
ram
1.6
: Ass
ista
nce
to th
e St
ates
for S
kills
and
Wor
kfor
ce D
evel
opm
ent
Department of the Treasury Budget Statements
25
Department of the Treasury Budget Statements
Tabl
e 2.
1: B
udge
ted
expe
nses
for O
utco
me
1 (c
ontin
ued)
20
18-1
9 E
stim
ated
ac
tual
$'00
0
2019
-20
Bud
get
$'00
0
2020
-21
Forw
ard
estim
ate
$'00
0
2021
-22
Forw
ard
estim
ate
$'00
0
2022
-23
Forw
ard
estim
ate
$'00
0
Spe
cial
app
ropr
iatio
nsN
atio
nal D
isab
ility
Ser
vice
s S
PP
-Fe
dera
l Fin
anci
al R
elat
ions
Act
200
9 (e
)95
8,17
017
2,94
4-
--
Adm
inis
tere
d to
tal
958,
170
172,
944
--
-To
tal e
xpen
ses
for P
rogr
am 1
.795
8,17
017
2,94
4-
--
Spe
cial
app
ropr
iatio
nsN
atio
nal A
fford
able
Hou
sing
SP
P -
Fede
ral F
inan
cial
Rel
atio
ns A
ct 2
009
--
--
-N
atio
nal H
ousi
ng a
nd H
omel
essn
ess
1,53
5,84
61,
564,
909
1,59
7,56
31,
565,
550
1,59
0,60
2Ad
min
iste
red
tota
l1,
535,
846
1,56
4,90
91,
597,
563
1,56
5,55
01,
590,
602
Tota
l exp
ense
s fo
r Pro
gram
1.8
1,53
5,84
61,
564,
909
1,59
7,56
31,
565,
550
1,59
0,60
2
Spe
cial
acc
ount
sC
OA
G R
efor
m F
und
(f)
12,4
06,5
459,
734,
631
9,41
6,99
99,
450,
432
10,6
86,4
00Ad
min
iste
red
tota
l12
,406
,545
9,73
4,63
19,
416,
999
9,45
0,43
210
,686
,400
Tota
l exp
ense
s fo
r Pro
gram
1.9
12,4
06,5
459,
734,
631
9,41
6,99
99,
450,
432
10,6
86,4
00
Prog
ram
1.9
: Nat
iona
l Par
tner
ship
Pay
men
ts to
the
Stat
es
Prog
ram
1.7
: Ass
ista
nce
to th
e St
ates
for D
isab
ility
Ser
vice
s
Prog
ram
1.8
: Ass
ista
nce
to th
e St
ates
for A
fford
able
Hou
sing
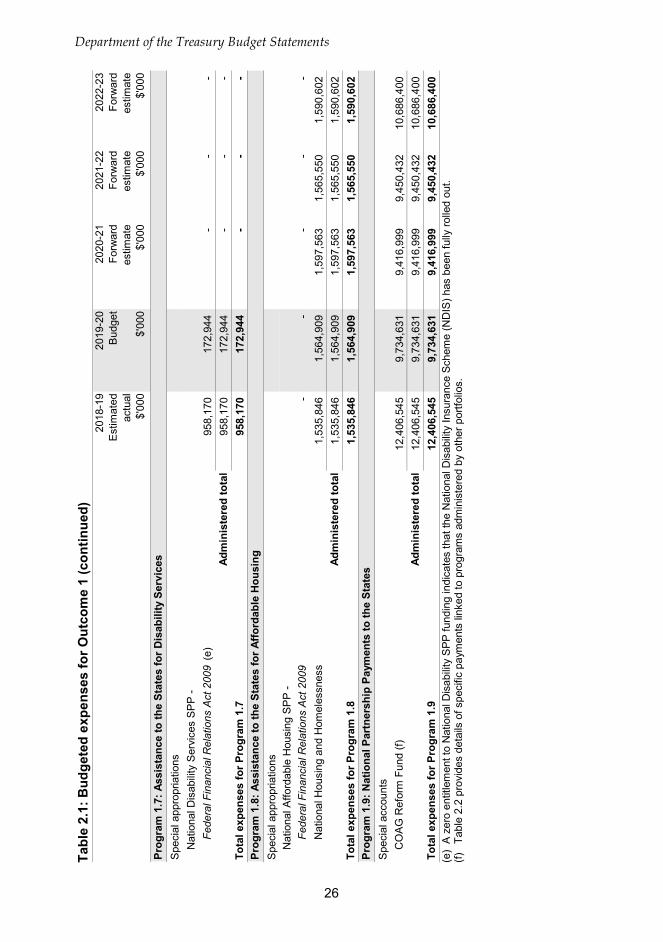
(e
) A
zer
o en
title
men
t to
Nat
iona
l Dis
abili
ty S
PP fu
ndin
g in
dica
tes
that
the
Nat
iona
l Dis
abilit
y In
sura
nce
Sche
me
(ND
IS) h
as b
een
fully
rolle
d ou
t. (f)
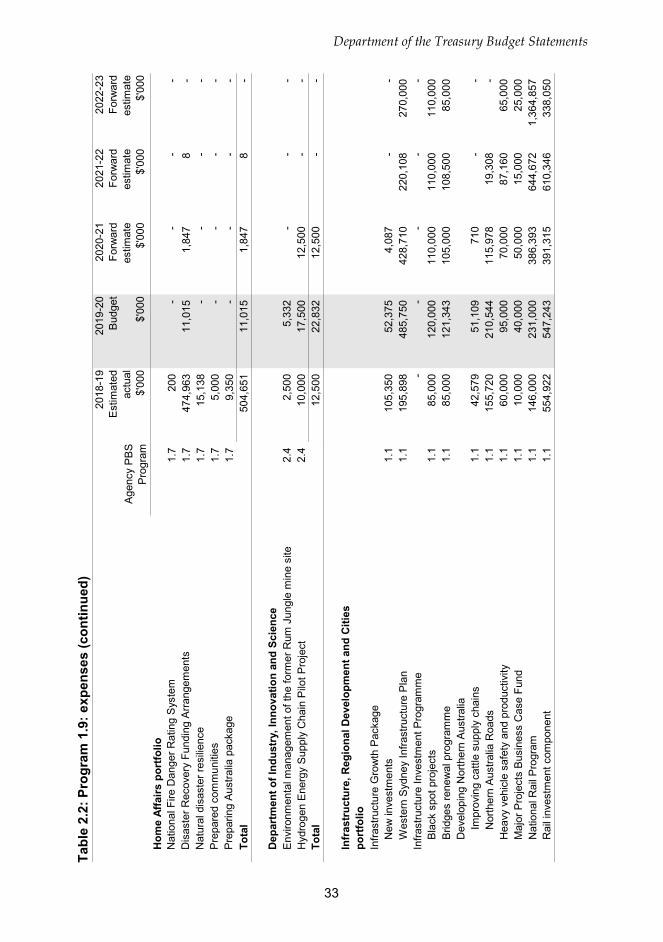
Ta
ble
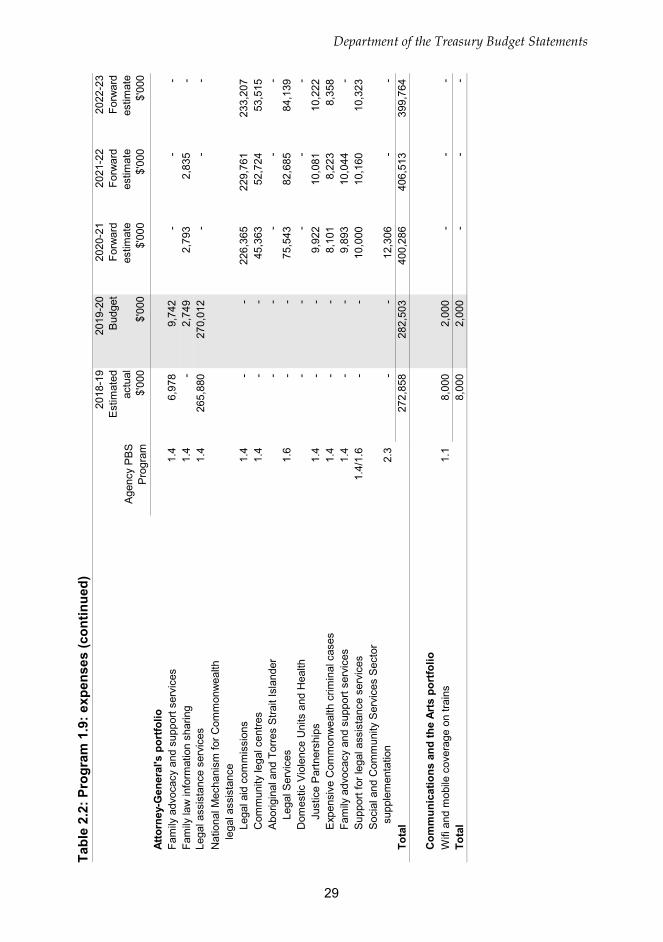
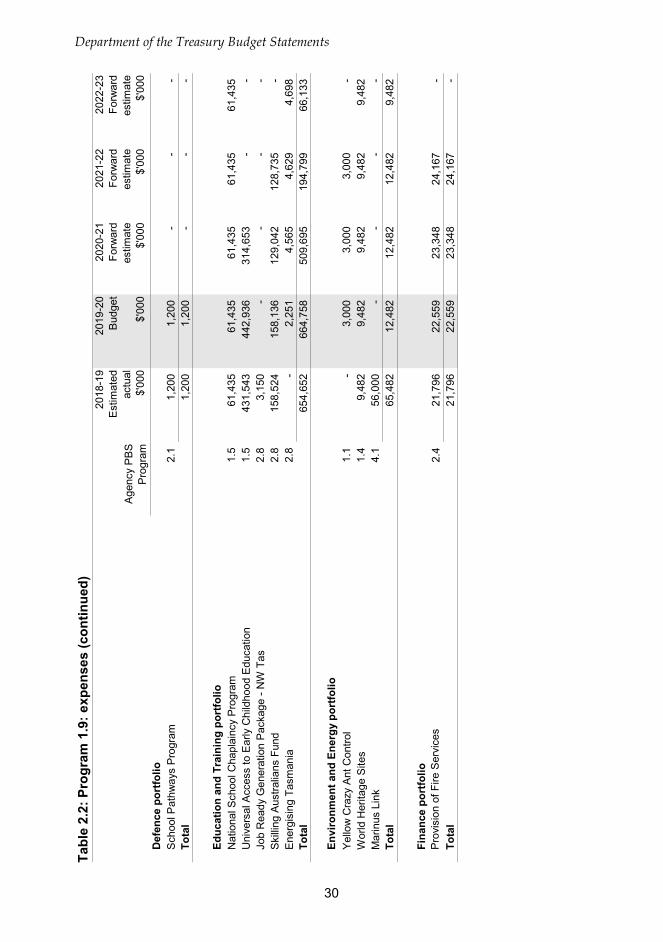
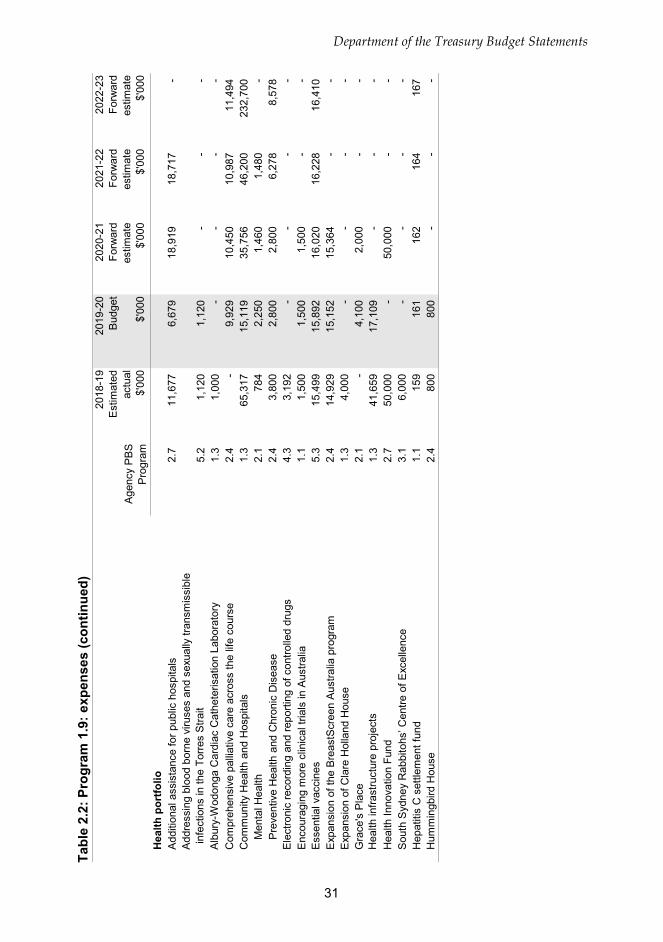
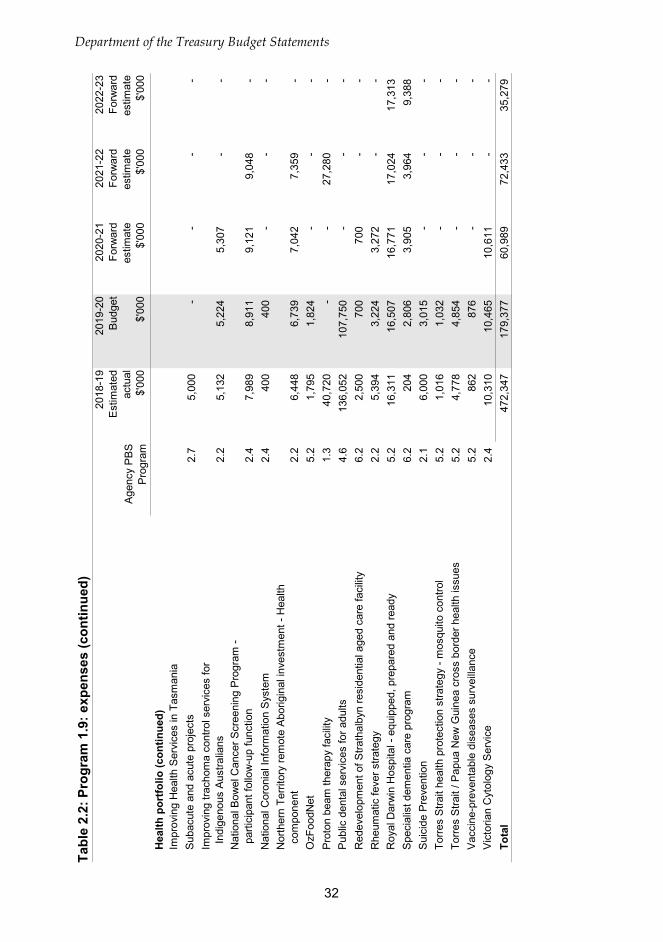
2.2
prov
ides
det
ails
of s
peci
fic p
aym
ents
link
ed to
pro
gram
s ad
min
iste
red
by o
ther
por
tfolio
s.
26
Tabl
e 2.
1: B
udge
ted
expe
nses
for O
utco
me
1 (c
ontin
ued)
20
18-1
9 E
stim
ated
ac
tual
$'00
0
2019
-20
Bud
get
$'00
0
2020
-21
Forw
ard
estim
ate
$'00
0
2021
-22
Forw
ard
estim
ate
$'00
0
2022
-23
Forw
ard
estim
ate
$'00
0
Dep
artm
enta
l exp
ense
sD
epar
tmen
tal a
ppro
pria
tion
189,
355
190,
804
180,
545
168,
358
168,
893
s74
Ext
erna
l Rev
enue
(a)
12,4
2312
,423
11,0
2311
,023
11,0
23E
xpen
ses
not r
equi
ring
appr
opria
tion
in th
e B
udge
t yea
r (b)
11,3
2810
,482
11,0
8111
,656
11,3
14D
epar
tmen
tal t
otal
213,
106
213,
709
202,
649
191,
037
191,
230
Adm
inis
tere
d ex
pens
esO
rdin
ary
annu
al s
ervi
ces
(App
ropr
iatio
n B
ill N
o. 1
)81
,996
86,2
3863
,226
42,5
0937
,500
Spe
cial
app
ropr
iatio
ns91
,413
,039
93,0
83,5
7996
,868
,067
102,
182,
561
107,
500,
567
Spe
cial
acc
ount
s49
,614
,597
48,1
55,3
2546
,991
,274
48,1
95,6
6650
,983
,759
Exp
ense
s no
t req
uirin
g ap
prop
riatio
n35
6,69
179
,038
41,5
1123
2,90
522
6,52
7Ad
min
iste
red
tota
l14
1,46
6,32
314
1,40
4,18
014
3,96
4,07
915
0,65
3,64
115
8,74
8,35
3To
tal e
xpen
ses
for O
utco
me
114
1,67
9,42
914
1,61
7,88
914
4,16
6,72
815
0,84
4,67
815
8,93
9,58
3M
ovem
ent o
f adm
inis
tere
d fu
nds
betw
een
year
s (g
)O
utco
me
1:
Pro
gram
1.9
- N
atio
nal P
artn
ersh
ip P
aym
ents
to th
e S
tate
s(4
16,2
97)
(64,
019)
428,
371
268,
254
(421
,609
)To
tal m
ovem
ent o
f adm
inis
tere
d fu
nds
(416
,297
)(6
4,01
9)42
8,37
126
8,25
4(4
21,6
09)
2018
-19
2019
-20
Aver
age
staf
fing
leve
l (nu
mbe
r)85
790
9
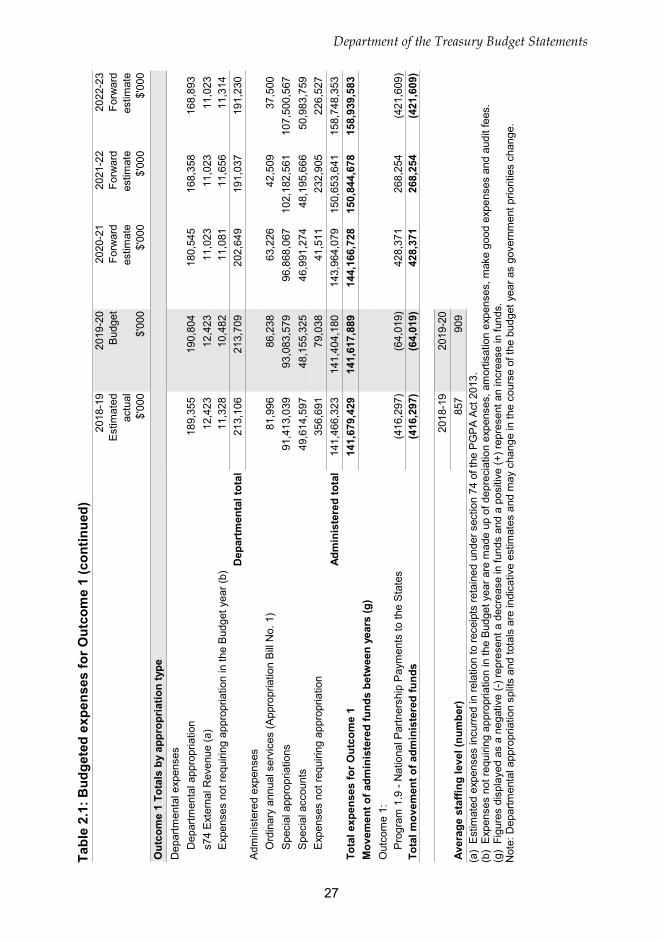
Out
com
e 1
Tota
ls b
y ap
prop
riatio
n ty
pe
(a
) E
stim
ated
exp
ense
s in
curre
d in
rela
tion
to re
ceip
ts re
tain
ed u
nder
sec
tion
74 o
f the
PG
PA
Act 2
013.
(b
) E
xpen
ses
not r
equi
ring
appr
opria
tion
in th
e B
udge
t yea
r are
mad
e up
of d
epre
ciat
ion
expe
nses
, am
ortis
atio
n ex
pens
es, m
ake
good
exp
ense
s an
d au
dit f
ees.
(g
) Fi
gure
s di
spla
yed
as a
neg
ativ
e (-)
repr
esen
t a d
ecre
ase
in fu
nds
and
a po
sitiv
e (+
) rep
rese
nt a
n in
crea
se in
fund
s.
Not
e: D
epar
tmen
tal a
ppro
pria
tion
split
s an
d to
tals
are
indi
cativ
e es
timat
es a
nd m
ay c
hang
e in
the
cour
se o
f the
bud
get y
ear a
s go
vern
men
t prio
ritie
s ch
ange
.
Department of the Treasury Budget Statements
27
Department of the Treasury Budget Statements
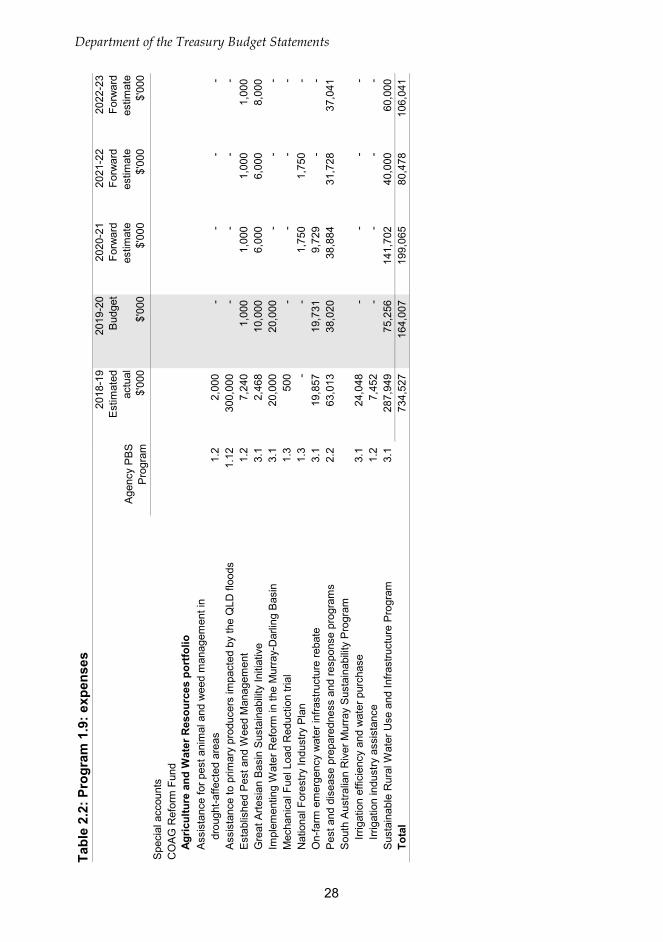
Tabl
e 2.
2: P
rogr
am 1
.9: e
xpen
ses
Age
ncy
PB
S
Pro
gram
2018
-19
Est
imat
ed
actu
al$'
000
2019
-20
Bud
get
$'00
0
2020
-21
Forw
ard
estim
ate
$'00
0
2021
-22
Forw
ard
estim
ate
$'00
0
2022
-23
Forw
ard
estim
ate
$'00
0S
peci
al a
ccou
nts
CO
AG
Ref
orm
Fun
dAg
ricul
ture
and
Wat
er R
esou
rces
por
tfolio
A
ssis
tanc
e fo
r pes
t ani
mal
and
wee
d m
anag
emen
t in
drou
ght-a
ffect
ed a
reas
1.2
2,00
0-
--
-A
ssis
tanc
e to
prim
ary
prod
ucer
s im
pact
ed b
y th
e Q
LD fl
oods
1.12
30
0,00
0-
--
-E
stab
lishe
d P
est a
nd W
eed
Man
agem
ent
1.2
7,24
01,
000
1,00
01,
000
1,00
0G
reat
Arte
sian
Bas
in S
usta
inab
ility
Initi
ativ
e3.
1
2,
468
10,0
006,
000
6,00
08,
000
Impl
emen
ting
Wat
er R
efor
m in
the
Mur
ray-
Dar
ling
Bas
in3.
1
20
,000
20,0
00-
--
Mec
hani
cal F
uel L
oad
Red
uctio
n tri
al
1.3
500
--
--
Nat
iona
l For
estry
Indu
stry
Pla
n1.
3
-
-1,
750
1,75
0-
On-
farm
em
erge
ncy
wat
er in
frast
ruct
ure
reba
te3.
1
19
,857
19,7
319,
729
--
Pes
t and
dis
ease
pre
pare
dnes
s an
d re
spon
se p
rogr
ams
2.2
63,0
1338
,020
38,8
8431
,728
37,0
41S
outh
Aus
tralia
n R
iver
Mur
ray
Sus
tain
abili
ty P
rogr
amIrr
igat
ion
effic
ienc
y an
d w
ater
pur
chas
e3.
1
24
,048
--
--
Irrig
atio
n in
dust
ry a
ssis
tanc
e1.
2
7,
452
--
--
Sus
tain
able
Rur
al W
ater
Use
and
Infra
stru
ctur
e P
rogr
am3.
1
28
7,94
975
,256
141,
702
40,0
0060
,000
Tota
l73
4,52
716
4,00
719
9,06
580
,478
106,
041
28
Tabl
e 2.
2: P
rogr
am 1
.9: e
xpen
ses
(con
tinue
d)
Age
ncy
PB
S
Pro
gram
2018
-19
Est
imat
ed
actu
al$'
000
2019
-20
Bud
get
$'00
0
2020
-21
Forw
ard
estim
ate
$'00
0
2021
-22
Forw
ard
estim
ate
$'00
0
2022
-23
Forw
ard
estim
ate
$'00
0At
torn
ey-G
ener
al's
por
tfolio
Fam
ily a
dvoc
acy
and
supp
ort s
ervi
ces
1.4
6,97
89,
742
--
-Fa
mily
law
info
rmat
ion
shar
ing
1.4
-2,
749
2,79
32,
835
-Le
gal a
ssis
tanc
e se
rvic
es1.
4
26
5,88
027
0,01
2-
--
Nat
iona
l Mec
hani
sm fo
r Com
mon
wea
lthle
gal a
ssis
tanc
eLe
gal a
id c
omm
issi
ons
1.4
--
226,
365
229,
761
233,
207
Com
mun
ity le
gal c
entre
s1.
4
-
-45
,363
52,7
2453
,515
Abo
rigin
al a
nd T
orre
s S
trait
Isla
nder
-
--
--
Lega
l Ser
vice
s1.
6
-
-75
,543
82,6
8584
,139
Dom
estic
Vio
lenc
e U
nits
and
Hea
lth
--
--
-Ju
stic
e P
artn
ersh
ips
1.4
--
9,92
210
,081
10,2
22E
xpen
sive
Com
mon
wea
lth c
rimin
al c
ases
1.4
--
8,10
18,
223
8,35
8Fa
mily
adv
ocac
y an
d su
ppor
t ser
vice
s1.
4
-
-9,
893
10,0
44-
Sup
port
for l
egal
ass
ista
nce
serv
ices
1.4/
1.6
--
10,0
0010
,160
10,3
23S
ocia
l and
Com
mun
ity S
ervi
ces
Sec
tor
sup
plem
enta
tion
2.3
--
12,3
06-
-To
tal
272,
858
282,
503
400,
286
406,
513
399,
764
Com
mun
icat
ions
and
the
Arts
por
tfolio
Wifi
and
mob
ile c
over
age
on tr
ains
1.1
8,00
02,
000
--
-To
tal
8,00
02,
000
--
-
Department of the Treasury Budget Statements
29
Department of the Treasury Budget Statements
Tabl
e 2.
2: P
rogr
am 1
.9: e
xpen
ses
(con
tinue
d)
Age
ncy
PB
S
Pro
gram
2018
-19
Est
imat
ed
actu
al$'
000
2019
-20
Bud
get
$'00
0
2020
-21
Forw
ard
estim
ate
$'00
0
2021
-22
Forw
ard
estim
ate
$'00
0
2022
-23
Forw
ard
estim
ate
$'00
0D
efen
ce p
ortfo
lioS
choo
l Pat
hway
s P
rogr
am2.
1
1,
200
1,20
0-
--
Tota
l1,
200
1,20
0-
--
Educ
atio
n an
d Tr
aini
ng p
ortfo
lioN
atio
nal S
choo
l Cha
plai
ncy
Pro
gram
1.5
61,4
3561
,435
61,4
3561
,435
61,4
35U
nive
rsal
Acc
ess
to E
arly
Chi
ldho
od E
duca
tion
1.5
431,
543
442,
936
314,
653
--
Job
Rea
dy G
ener
atio
n P
acka
ge -
NW
Tas
2.8
3,15
0-
--
-S
killi
ng A
ustra
lians
Fun
d2.
8
15
8,52
415
8,13
612
9,04
212
8,73
5-
Ene
rgis
ing
Tasm
ania
2.8
-2,
251
4,56
54,
629
4,69
8To
tal
654,
652
664,
758
509,
695
194,
799
66,1
33
Envi
ronm
ent a
nd E
nerg
y po
rtfo
lioY
ello
w C
razy
Ant
Con
trol
1.1
-3,
000
3,00
03,
000
-W
orld
Her
itage
Site
s1.
4
9,
482
9,48
29,
482
9,48
29,
482
Mar
inus
Lin
k4.
1
56
,000
--
--
Tota
l65
,482
12,4
8212
,482
12,4
829,
482
Fina
nce
port
folio
Pro
visi
on o
f Fire
Ser
vice
s2.
4
21
,796
22,5
5923
,348
24,1
67-
Tota
l21
,796
22,5
5923
,348
24,1
67-
30
Tabl
e 2.
2: P
rogr
am 1
.9: e
xpen
ses
(con
tinue
d)
Age
ncy
PB
S
Pro
gram
2018
-19
Est
imat
ed
actu
al$'
000
2019
-20
Bud
get
$'00
0
2020
-21
Forw
ard
estim
ate
$'00
0
2021
-22
Forw
ard
estim
ate
$'00
0
2022
-23
Forw
ard
estim
ate
$'00
0H
ealth
por
tfolio
Add
ition
al a
ssis
tanc
e fo
r pub
lic h
ospi
tals
2.7
11,6
776,
679
18,9
1918
,717
-A
ddre
ssin
g bl
ood
born
e vi
ruse
s an
d se
xual
ly tr
ansm
issi
ble
inf
ectio
ns in
the
Torre
s S
trait
5.2
1,12
01,
120
--
-A
lbur
y-W
odon
ga C
ardi
ac C
athe
teris
atio
n La
bora
tory
1.3
1,00
0-
--
-C
ompr
ehen
sive
pal
liativ
e ca
re a
cros
s th
e lif
e co
urse
2.4
-9,
929
10,4
5010
,987
11,4
94C
omm
unity
Hea
lth a
nd H
ospi
tals
1.
3
65
,317
15,1
1935
,756
46,2
0023
2,70
0M
enta
l Hea
lth2.
1
78
42,
250
1,46
01,
480
-P
reve
ntiv
e H
ealth
and
Chr
onic
Dis
ease
2.4
3,80
02,
800
2,80
06,
278
8,57
8E
lect
roni
c re
cord
ing
and
repo
rting
of c
ontro
lled
drug
s4.
3
3,
192
--
--
Enc
oura
ging
mor
e cl
inic
al tr
ials
in A
ustra
lia1.
1
1,
500
1,50
01,
500
--
Ess
entia
l vac
cine
s 5.
3
15
,499
15,8
9216
,020
16,2
2816
,410
Exp
ansi
on o
f the
Bre
astS
cree
n A
ustra
lia p
rogr
am2.
4
14
,929
15,1
5215
,364
--
Exp
ansi
on o
f Cla
re H
olla
nd H
ouse
1.3
4,00
0-
--
-G
race
's P
lace
2.1
-4,
100
2,00
0-
-H
ealth
infra
stru
ctur
e pr
ojec
ts1.
3
41
,659
17,1
09-
--
Hea
lth In
nova
tion
Fund
2.7
50,0
00-
50,0
00-
-S
outh
Syd
ney
Rab
bito
hs’ C
entre
of E
xcel
lenc
e3.
1
6,
000
--
--
Hep
atiti
s C
set
tlem
ent f
und
1.1
159
161
162
164
167
Hum
min
gbird
Hou
se2.
4
80
080
0-
--
Department of the Treasury Budget Statements
31
Department of the Treasury Budget Statements
Tabl
e 2.
2: P
rogr
am 1
.9: e
xpen
ses
(con
tinue
d)
Age
ncy
PB
S
Pro
gram
2018
-19
Est
imat
ed
actu
al$'
000
2019
-20
Bud
get
$'00
0
2020
-21
Forw
ard
estim
ate
$'00
0
2021
-22
Forw
ard
estim
ate
$'00
0
2022
-23
Forw
ard
estim
ate
$'00
0
Hea
lth p
ortfo
lio (c
ontin
ued)
Impr
ovin
g H
ealth
Ser
vice
s in
Tas
man
iaS
ubac
ute
and
acut
e pr
ojec
ts2.
7
5,
000
--
--
Impr
ovin
g tra
chom
a co
ntro
l ser
vice
s fo
r I
ndig
enou
s A
ustra
lians
2.2
5,13
25,
224
5,30
7-
-N
atio
nal B
owel
Can
cer S
cree
ning
Pro
gram
- p
artic
ipan
t fol
low
-up
func
tion
2.4
7,98
98,
911
9,12
19,
048
-N
atio
nal C
oron
ial I
nfor
mat
ion
Sys
tem
2.4
400
400
--
-N
orth
ern
Terri
tory
rem
ote
Abo
rigin
al in
vest
men
t - H
ealth
c
ompo
nent
2.2
6,44
86,
739
7,04
27,
359
-O
zFoo
dNet
5.2
1,79
51,
824
--
-P
roto
n be
am th
erap
y fa
cilit
y1.
3
40
,720
--
27,2
80-
Pub
lic d
enta
l ser
vice
s fo
r adu
lts4.
6
13
6,05
210
7,75
0-
--
Red
evel
opm
ent o
f Stra
thal
byn
resi
dent
ial a
ged
care
faci
lity
6.2
2,50
070
070
0-
-R
heum
atic
feve
r stra
tegy
2.2
5,39
43,
224
3,27
2-
-R
oyal
Dar
win
Hos
pita
l - e
quip
ped,
pre
pare
d an
d re
ady
5.2
16,3
1116
,507
16,7
7117
,024
17,3
13S
peci
alis
t dem
entia
car
e pr
ogra
m6.
2
20
42,
806
3,90
53,
964
9,38
8S
uici
de P
reve
ntio
n2.
1
6,
000
3,01
5-
--
Torre
s S
trait
heal
th p
rote
ctio
n st
rate
gy -
mos
quito
con
trol
5.2
1,01
61,
032
--
-To
rres
Stra
it / P
apua
New
Gui
nea
cros
s bo
rder
hea
lth is
sues
5.2
4,77
84,
854
--
-V
acci
ne-p
reve
ntab
le d
isea
ses
surv
eilla
nce
5.2
862
876
--
-V
icto
rian
Cyt
olog
y S
ervi
ce2.
4
10
,310
10,4
6510
,611
--
Tota
l47
2,34
717
9,37
760
,989
72,4
3335
,279
32
Tabl
e 2.
2: P
rogr
am 1
.9: e
xpen
ses
(con
tinue
d)
Age
ncy
PB
S
Pro
gram
2018
-19
Est
imat
ed
actu
al$'
000
2019
-20
Bud
get
$'00
0
2020
-21
Forw
ard
estim
ate
$'00
0
2021
-22
Forw
ard
estim
ate
$'00
0
2022
-23
Forw
ard
estim
ate
$'00
0H
ome
Affa
irs p
ortfo
lioN
atio
nal F
ire D
ange
r Rat
ing
Sys
tem
1.7
200
--
--
Dis
aste
r Rec
over
y Fu
ndin
g A
rrang
emen
ts1.
7
47
4,96
311
,015
1,84
78
-N
atur
al d
isas
ter r
esili
ence
1.7
15,1
38-
--
-P
repa
red
com
mun
ities
1.7
5,00
0-
--
-P
repa
ring
Aus
tralia
pac
kage
1.7
9,35
0-
--
-To
tal
504,
651
11,0
151,
847
8-
Dep
artm
ent o
f Ind
ustr
y, In
nova
tion
and
Scie
nce
Env
ironm
enta
l man
agem
ent o
f the
form
er R
um J
ungl
e m
ine
site
2.
4
2,
500
5,33
2-
--
Hyd
roge
n E
nerg
y S
uppl
y C
hain
Pilo
t Pro
ject
2.4
10,0
0017
,500
12,5
00-
-To
tal
12,5
0022
,832
12,5
00-
-
Infr
astr
uctu
re, R
egio
nal D
evel
opm
ent a
nd C
ities
po
rtfo
lioIn
frast
ruct
ure
Gro
wth
Pac
kage
N
ew in
vest
men
ts1.
1
10
5,35
052
,375
4,08
7-
-W
este
rn S
ydne
y In
frast
ruct
ure
Pla
n1.
1
19
5,89
848
5,75
042
8,71
022
0,10
827
0,00
0In
frast
ruct
ure
Inve
stm
ent P
rogr
amm
e-
--
--
Bla
ck s
pot p
roje
cts
1.1
85,0
0012
0,00
011
0,00
011
0,00
011
0,00
0B
ridge
s re
new
al p
rogr
amm
e1.
1
85
,000
121,
343
105,
000
108,
500
85,0
00D
evel
opin
g N
orth
ern
Aus
tralia
Impr
ovin
g ca
ttle
supp
ly c
hain
s1.
1
42
,579
51,1
0971
0-
-N
orth
ern
Aus
tralia
Roa
ds
1.1
155,
720
210,
544
115,
978
19,3
08-
Hea
vy v
ehic
le s
afet
y an
d pr
oduc
tivity
1.1
60,0
0095
,000
70,0
0087
,160
65,0
00M
ajor
Pro
ject
s B
usin
ess
Cas
e Fu
nd1.
1
10
,000
40,0
0050
,000
15,0
0025
,000
Nat
iona
l Rai
l Pro
gram
1.1
146,
000
231,
000
386,
393
644,
672
1,36
4,85
7R
ail i
nves
tmen
t com
pone
nt1.
1
55
4,92
254
7,24
339
1,31
561
0,34
633
8,05
0
Department of the Treasury Budget Statements
33
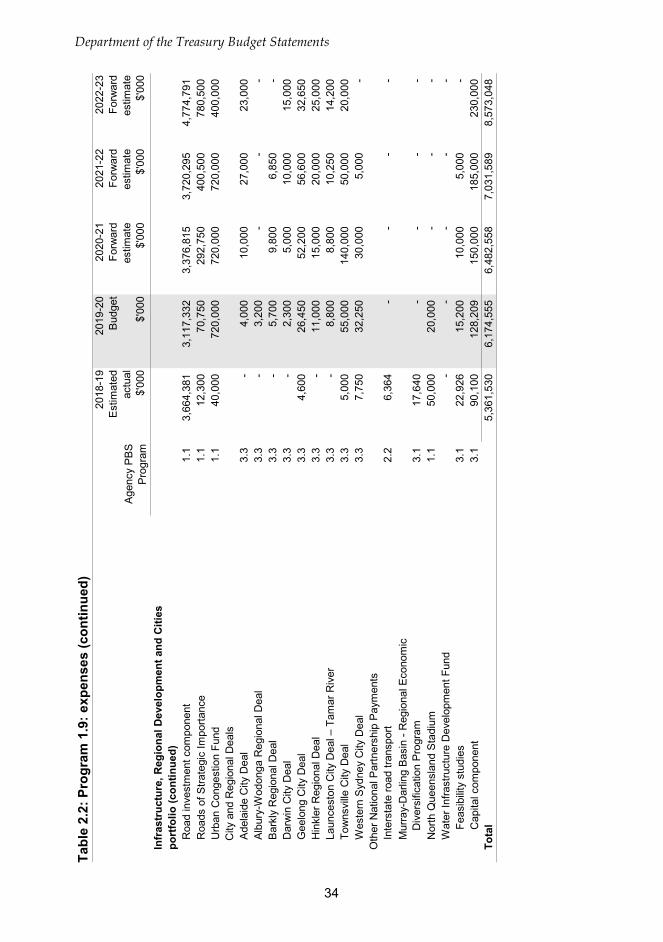
Department of the Treasury Budget Statements
Tabl
e 2.
2: P
rogr
am 1
.9: e
xpen
ses
(con
tinue
d)
Age
ncy
PB
S
Pro
gram
2018
-19
Est
imat
ed
actu
al$'
000
2019
-20
Bud
get
$'00
0
2020
-21
Forw
ard
estim
ate
$'00
0
2021
-22
Forw
ard
estim
ate
$'00
0
2022
-23
Forw
ard
estim
ate
$'00
0
Infr
astr
uctu
re, R
egio
nal D
evel
opm
ent a
nd C
ities
po
rtfo
lio (c
ontin
ued)
Roa
d in
vest
men
t com
pone
nt1.
1
3,
664,
381
3,11
7,33
23,
376,
815
3,72
0,29
54,
774,
791
Roa
ds o
f Stra
tegi
c Im
porta
nce
1.1
12,3
0070
,750
292,
750
400,
500
780,
500
Urb
an C
onge
stio
n Fu
nd1.
1
40
,000
720,
000
720,
000
720,
000
400,
000
C
ity a
nd R
egio
nal D
eals
Ade
laid
e C
ity D
eal
3.3
-4,
000
10,0
0027
,000
23,0
00A
lbur
y-W
odon
ga R
egio
nal D
eal
3.3
-3,
200
--
-B
arkl
y R
egio
nal D
eal
3.3
-5,
700
9,80
06,
850
-D
arw
in C
ity D
eal
3.3
-2,
300
5,00
010
,000
15,0
00G
eelo
ng C
ity D
eal
3.3
4,60
026
,450
52,2
0056
,600
32,6
50H
inkl
er R
egio
nal D
eal
3.3
-11
,000
15,0
0020
,000
25,0
00La
unce
ston
City
Dea
l – T
amar
Riv
er3.
3
-
8,80
08,
800
10,2
5014
,200
Tow
nsvi
lle C
ity D
eal
3.3
5,00
055
,000
140,
000
50,0
0020
,000
Wes
tern
Syd
ney
City
Dea
l3.
3
7,
750
32,2
5030
,000
5,00
0-
Oth
er N
atio
nal P
artn
ersh
ip P
aym
ents
Inte
rsta
te ro
ad tr
ansp
ort
2.2
6,36
4-
--
-M
urra
y-D
arlin
g B
asin
- R
egio
nal E
cono
mic
D
iver
sific
atio
n P
rogr
am3.
1
17
,640
--
--
Nor
th Q
ueen
slan
d S
tadi
um1.
1
50
,000
20,0
00-
--
Wat
er In
frast
ruct
ure
Dev
elop
men
t Fun
d -
--
--
Feas
ibili
ty s
tudi
es3.
1
22
,926
15,2
0010
,000
5,00
0-
Cap
ital c
ompo
nent
3.1
90,1
0012
8,20
915
0,00
018
5,00
023
0,00
0To
tal
5,36
1,53
06,
174,
555
6,48
2,55
87,
031,
589
8,57
3,04
8
34
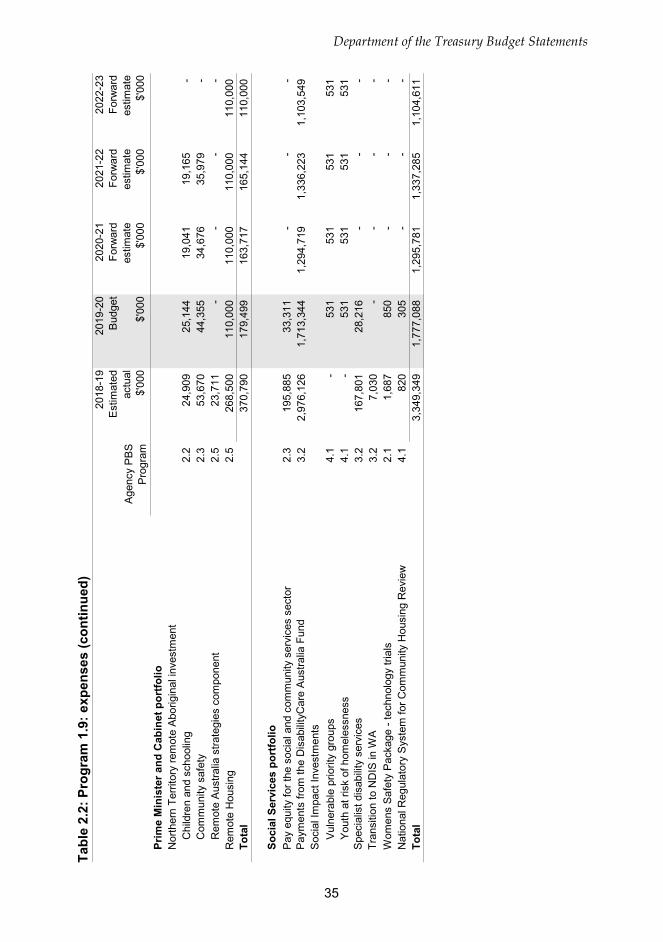
Tabl
e 2.
2: P
rogr
am 1
.9: e
xpen
ses
(con
tinue
d)
Age
ncy
PB
S
Pro
gram
2018
-19
Est
imat
ed
actu
al$'
000
2019
-20
Bud
get
$'00
0
2020
-21
Forw
ard
estim
ate
$'00
0
2021
-22
Forw
ard
estim
ate
$'00
0
2022
-23
Forw
ard
estim
ate
$'00
0Pr
ime
Min
iste
r and
Cab
inet
por
tfolio
Nor
ther
n Te
rrito
ry re
mot
e A
borig
inal
inve
stm
ent
Chi
ldre
n an
d sc
hool
ing
2.2
24,9
0925
,144
19,0
4119
,165
-C
omm
unity
saf
ety
2.3
53,6
7044
,355
34,6
7635
,979
-R
emot
e A
ustra
lia s
trate
gies
com
pone
nt2.
5
23
,711
--
--
Rem
ote
Hou
sing
2.5
268,
500
110,
000
110,
000
110,
000
110,
000
Tota
l37
0,79
017
9,49
916
3,71
716
5,14
411
0,00
0
Soci
al S
ervi
ces
port
folio
Pay
equ
ity fo
r the
soc
ial a
nd c
omm
unity
ser
vice
s se
ctor
2.3
195,
885
33,3
11-
--
Pay
men
ts fr
om th
e D
isab
ility
Car
e A
ustra
lia F
und
3.2
2,97
6,12
61,
713,
344
1,29
4,71
91,
336,
223
1,10
3,54
9S
ocia
l Im
pact
Inve
stm
ents
V
ulne
rabl
e pr
iorit
y gr
oups
4.1
-53
153
153
153
1Y
outh
at r
isk
of h
omel
essn
ess
4.1
-53
153
153
153
1S
peci
alis
t dis
abili
ty s
ervi
ces
3.2
167,
801
28,2
16-
--
Tran
sitio
n to
ND
IS in
WA
3.2
7,03
0-
--
-W
omen
s S
afet
y P
acka
ge -
tech
nolo
gy tr
ials
2.1
1,68
785
0-
--
Nat
iona
l Reg
ulat
ory
Sys
tem
for C
omm
unity
Hou
sing
Rev
iew
4.1
820
305
--
-To
tal
3,34
9,34
91,
777,
088
1,29
5,78
11,
337,
285
1,10
4,61
1
Department of the Treasury Budget Statements
35
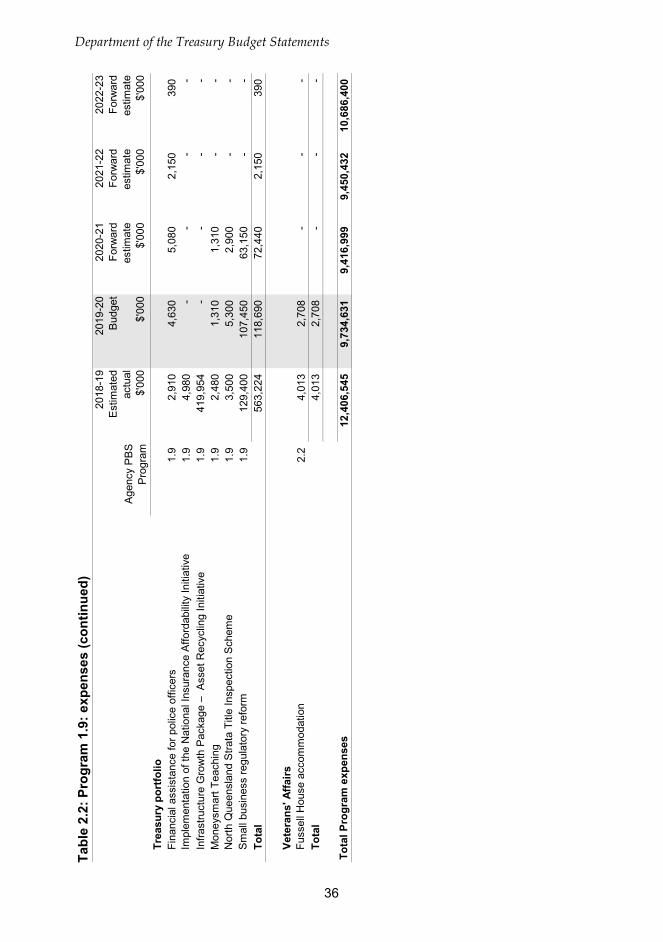
Department of the Treasury Budget Statements
Tabl
e 2.
2: P
rogr
am 1
.9: e
xpen
ses
(con
tinue
d)
Age
ncy
PB
S
Pro
gram
2018
-19
Est
imat
ed
actu
al$'
000
2019
-20
Bud
get
$'00
0
2020
-21
Forw
ard
estim
ate
$'00
0
2021
-22
Forw
ard
estim
ate
$'00
0
2022
-23
Forw
ard
estim
ate
$'00
0Tr
easu
ry p
ortfo
lioFi
nanc
ial a
ssis
tanc
e fo
r pol
ice
offic
ers
1.9
2,91
04,
630
5,08
02,
150
390
Impl
emen
tatio
n of
the
Nat
iona
l Ins
uran
ce A
fford
abili
ty In
itiat
ive
1.9
4,98
0-
--
-In
frast
ruct
ure
Gro
wth
Pac
kage
– A
sset
Rec
yclin
g In
itiat
ive
1.9
419,
954
--
--
Mon
eysm
art T
each
ing
1.9
2,48
01,
310
1,31
0-
-N
orth
Que
ensl
and
Stra
ta T
itle
Insp
ectio
n S
chem
e1.
9
3,
500
5,30
02,
900
--
Sm
all b
usin
ess
regu
lato
ry re
form
1.9
129,
400
107,
450
63,1
50-
-To
tal
563,
224
118,
690
72,4
402,
150
390
Vete
rans
' Affa
irsFu
ssel
l Hou
se a
ccom
mod
atio
n2.
2
4,
013
2,70
8-
--
Tota
l4,
013
2,70
8-
--
Tota
l Pro
gram
exp
ense
s 12
,406
,545
9,73
4,63
19,
416,
999
9,45
0,43
210
,686
,400
36
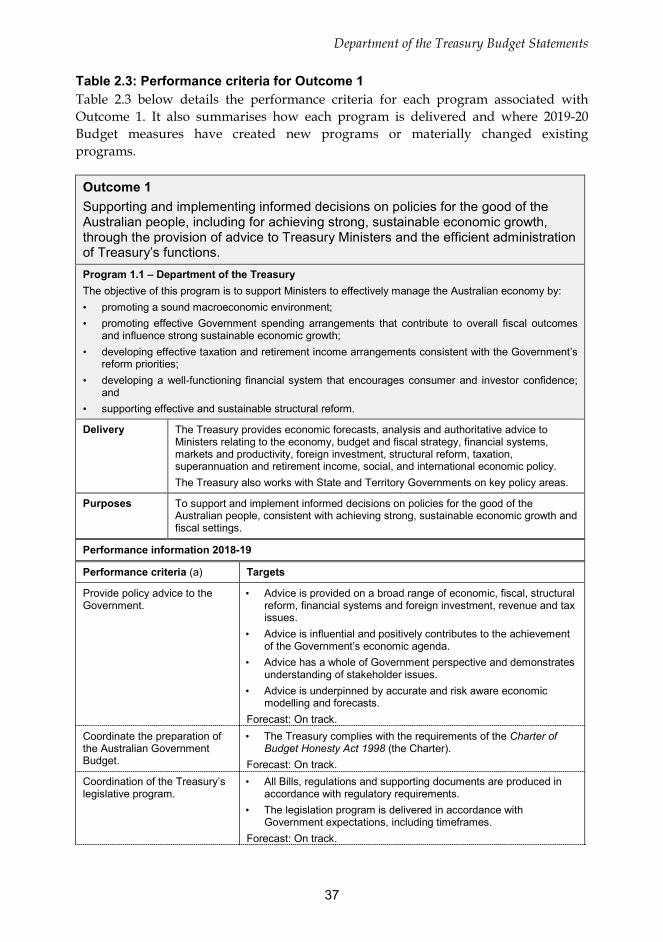
Department of the Treasury Budget Statements
37
Table 2.3: Performance criteria for Outcome 1 Table 2.3 below details the performance criteria for each program associated with Outcome 1. It also summarises how each program is delivered and where 2019-20 Budget measures have created new programs or materially changed existing programs.
Outcome 1 Supporting and implementing informed decisions on policies for the good of the Australian people, including for achieving strong, sustainable economic growth, through the provision of advice to Treasury Ministers and the efficient administration of Treasury’s functions. Program 1.1 – Department of the Treasury The objective of this program is to support Ministers to effectively manage the Australian economy by: • promoting a sound macroeconomic environment; • promoting effective Government spending arrangements that contribute to overall fiscal outcomes
and influence strong sustainable economic growth; • developing effective taxation and retirement income arrangements consistent with the Government’s
reform priorities; • developing a well-functioning financial system that encourages consumer and investor confidence;
and • supporting effective and sustainable structural reform.
Delivery The Treasury provides economic forecasts, analysis and authoritative advice to Ministers relating to the economy, budget and fiscal strategy, financial systems, markets and productivity, foreign investment, structural reform, taxation, superannuation and retirement income, social, and international economic policy. The Treasury also works with State and Territory Governments on key policy areas.
Purposes To support and implement informed decisions on policies for the good of the Australian people, consistent with achieving strong, sustainable economic growth and fiscal settings.
Performance information 2018-19
Performance criteria (a) Targets
Provide policy advice to the Government.
• Advice is provided on a broad range of economic, fiscal, structural reform, financial systems and foreign investment, revenue and tax issues.
• Advice is influential and positively contributes to the achievement of the Government’s economic agenda.
• Advice has a whole of Government perspective and demonstrates understanding of stakeholder issues.
• Advice is underpinned by accurate and risk aware economic modelling and forecasts.
Forecast: On track. Coordinate the preparation of the Australian Government Budget.
• The Treasury complies with the requirements of the Charter of Budget Honesty Act 1998 (the Charter).
Forecast: On track. Coordination of the Treasury’s legislative program.
• All Bills, regulations and supporting documents are produced in accordance with regulatory requirements.
• The legislation program is delivered in accordance with Government expectations, including timeframes.
Forecast: On track.
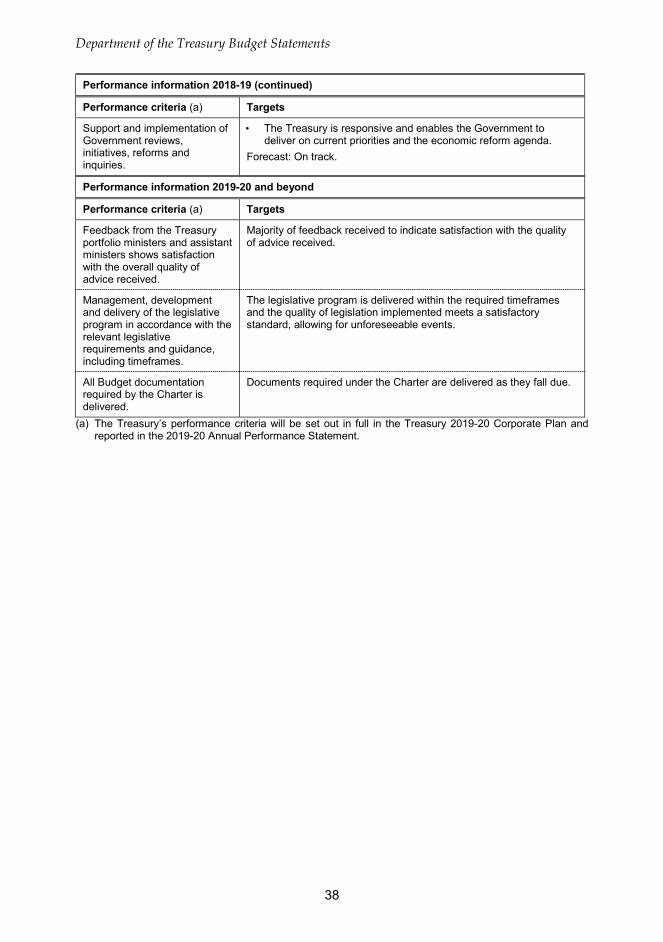
Department of the Treasury Budget Statements
38
Performance information 2018-19 (continued)
Performance criteria (a) Targets
Support and implementation of Government reviews, initiatives, reforms and inquiries.
• The Treasury is responsive and enables the Government to deliver on current priorities and the economic reform agenda.
Forecast: On track.
Performance information 2019-20 and beyond
Performance criteria (a) Targets
Feedback from the Treasury portfolio ministers and assistant ministers shows satisfaction with the overall quality of advice received.
Majority of feedback received to indicate satisfaction with the quality of advice received.
Management, development and delivery of the legislative program in accordance with the relevant legislative requirements and guidance, including timeframes.
The legislative program is delivered within the required timeframes and the quality of legislation implemented meets a satisfactory standard, allowing for unforeseeable events.
All Budget documentation required by the Charter is delivered.
Documents required under the Charter are delivered as they fall due.
(a) The Treasury’s performance criteria will be set out in full in the Treasury 2019-20 Corporate Plan and reported in the 2019-20 Annual Performance Statement.
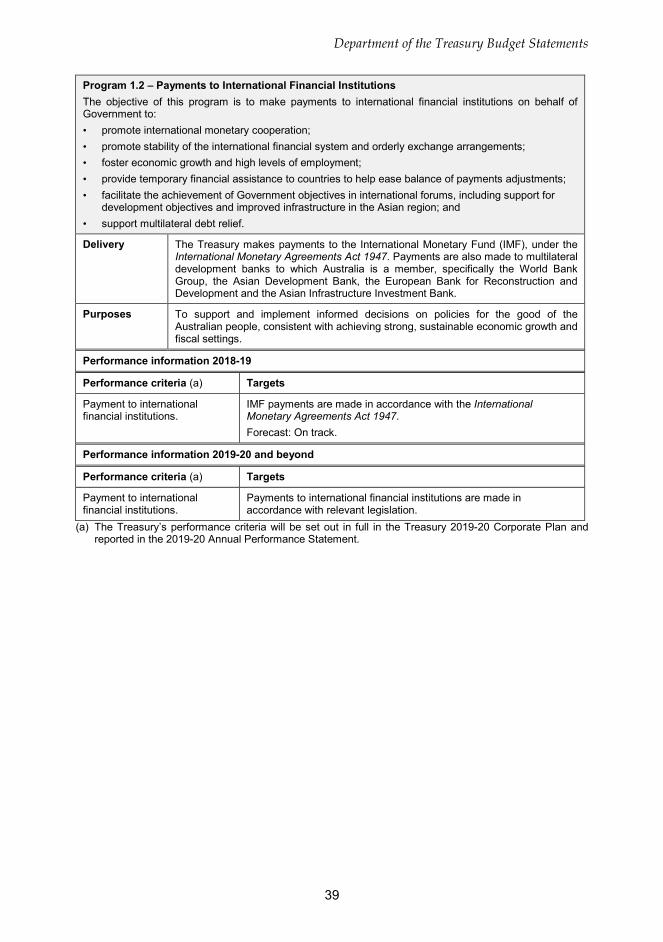
Department of the Treasury Budget Statements
39
Program 1.2 – Payments to International Financial Institutions The objective of this program is to make payments to international financial institutions on behalf of Government to: • promote international monetary cooperation; • promote stability of the international financial system and orderly exchange arrangements; • foster economic growth and high levels of employment; • provide temporary financial assistance to countries to help ease balance of payments adjustments; • facilitate the achievement of Government objectives in international forums, including support for
development objectives and improved infrastructure in the Asian region; and • support multilateral debt relief.
Delivery The Treasury makes payments to the International Monetary Fund (IMF), under the International Monetary Agreements Act 1947. Payments are also made to multilateral development banks to which Australia is a member, specifically the World Bank Group, the Asian Development Bank, the European Bank for Reconstruction and Development and the Asian Infrastructure Investment Bank.
Purposes To support and implement informed decisions on policies for the good of the Australian people, consistent with achieving strong, sustainable economic growth and fiscal settings.
Performance information 2018-19
Performance criteria (a) Targets
Payment to international financial institutions.
IMF payments are made in accordance with the International Monetary Agreements Act 1947. Forecast: On track.
Performance information 2019-20 and beyond
Performance criteria (a) Targets
Payment to international financial institutions.
Payments to international financial institutions are made in accordance with relevant legislation.
(a) The Treasury’s performance criteria will be set out in full in the Treasury 2019-20 Corporate Plan and reported in the 2019-20 Annual Performance Statement.
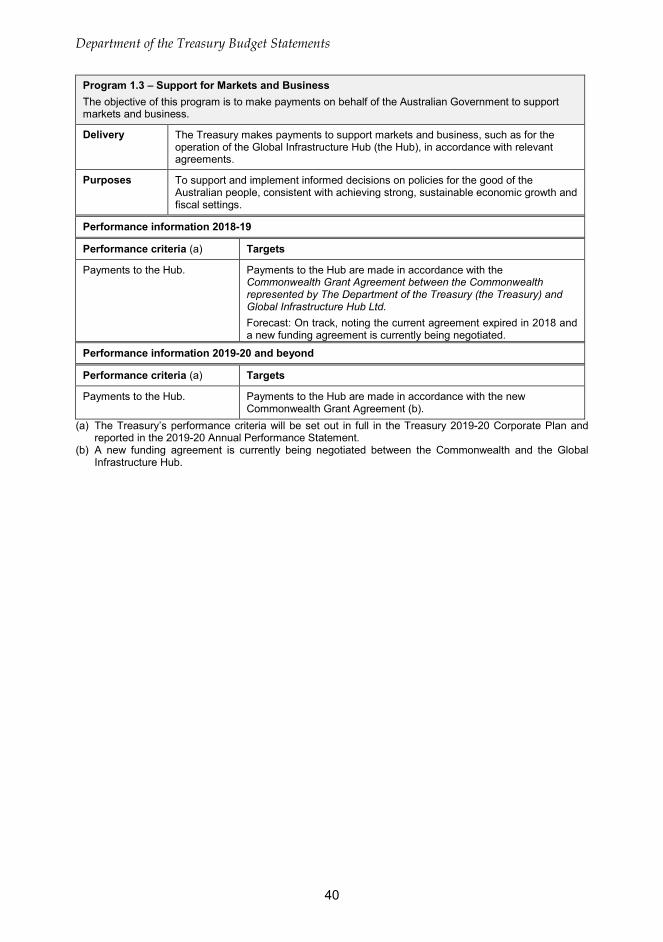
Department of the Treasury Budget Statements
40
Program 1.3 – Support for Markets and Business The objective of this program is to make payments on behalf of the Australian Government to support markets and business. Delivery The Treasury makes payments to support markets and business, such as for the
operation of the Global Infrastructure Hub (the Hub), in accordance with relevant agreements.
Purposes To support and implement informed decisions on policies for the good of the Australian people, consistent with achieving strong, sustainable economic growth and fiscal settings.
Performance information 2018-19
Performance criteria (a) Targets
Payments to the Hub. Payments to the Hub are made in accordance with the Commonwealth Grant Agreement between the Commonwealth represented by The Department of the Treasury (the Treasury) and Global Infrastructure Hub Ltd. Forecast: On track, noting the current agreement expired in 2018 and a new funding agreement is currently being negotiated.
Performance information 2019-20 and beyond
Performance criteria (a) Targets
Payments to the Hub. Payments to the Hub are made in accordance with the new Commonwealth Grant Agreement (b).
(a) The Treasury’s performance criteria will be set out in full in the Treasury 2019-20 Corporate Plan and reported in the 2019-20 Annual Performance Statement.
(b) A new funding agreement is currently being negotiated between the Commonwealth and the Global Infrastructure Hub.
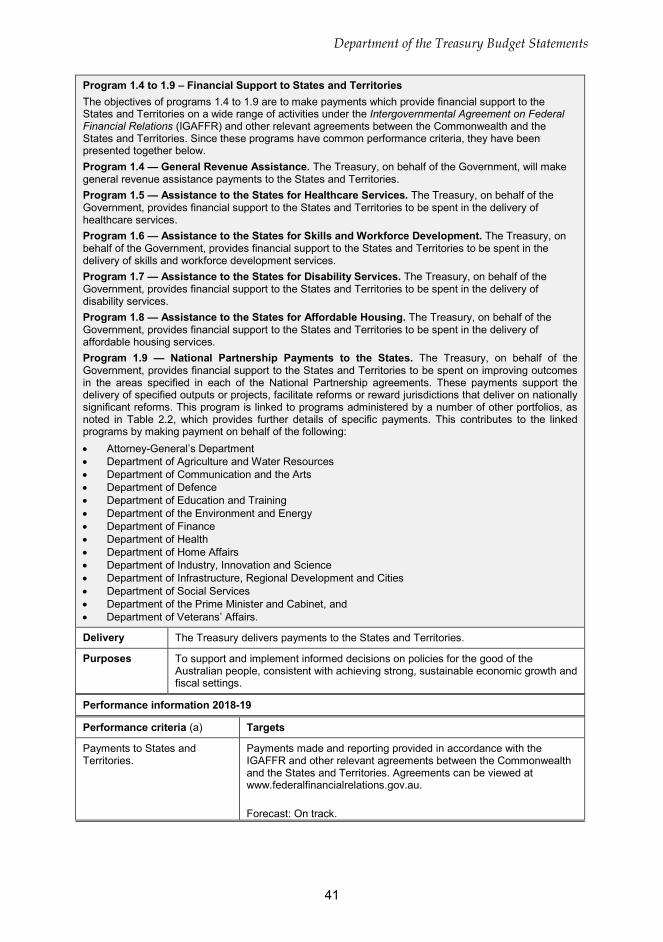
Department of the Treasury Budget Statements
41
Program 1.4 to 1.9 – Financial Support to States and Territories The objectives of programs 1.4 to 1.9 are to make payments which provide financial support to the States and Territories on a wide range of activities under the Intergovernmental Agreement on Federal Financial Relations (IGAFFR) and other relevant agreements between the Commonwealth and the States and Territories. Since these programs have common performance criteria, they have been presented together below. Program 1.4 — General Revenue Assistance. The Treasury, on behalf of the Government, will make general revenue assistance payments to the States and Territories. Program 1.5 — Assistance to the States for Healthcare Services. The Treasury, on behalf of the Government, provides financial support to the States and Territories to be spent in the delivery of healthcare services. Program 1.6 — Assistance to the States for Skills and Workforce Development. The Treasury, on behalf of the Government, provides financial support to the States and Territories to be spent in the delivery of skills and workforce development services. Program 1.7 — Assistance to the States for Disability Services. The Treasury, on behalf of the Government, provides financial support to the States and Territories to be spent in the delivery of disability services. Program 1.8 — Assistance to the States for Affordable Housing. The Treasury, on behalf of the Government, provides financial support to the States and Territories to be spent in the delivery of affordable housing services. Program 1.9 — National Partnership Payments to the States. The Treasury, on behalf of the Government, provides financial support to the States and Territories to be spent on improving outcomes in the areas specified in each of the National Partnership agreements. These payments support the delivery of specified outputs or projects, facilitate reforms or reward jurisdictions that deliver on nationally significant reforms. This program is linked to programs administered by a number of other portfolios, as noted in Table 2.2, which provides further details of specific payments. This contributes to the linked programs by making payment on behalf of the following: • Attorney-General’s Department • Department of Agriculture and Water Resources • Department of Communication and the Arts • Department of Defence • Department of Education and Training • Department of the Environment and Energy • Department of Finance • Department of Health • Department of Home Affairs • Department of Industry, Innovation and Science • Department of Infrastructure, Regional Development and Cities • Department of Social Services • Department of the Prime Minister and Cabinet, and • Department of Veterans’ Affairs.
Delivery The Treasury delivers payments to the States and Territories.
Purposes To support and implement informed decisions on policies for the good of the Australian people, consistent with achieving strong, sustainable economic growth and fiscal settings.
Performance information 2018-19
Performance criteria (a) Targets
Payments to States and Territories.
Payments made and reporting provided in accordance with the IGAFFR and other relevant agreements between the Commonwealth and the States and Territories. Agreements can be viewed at www.federalfinancialrelations.gov.au. Forecast: On track.
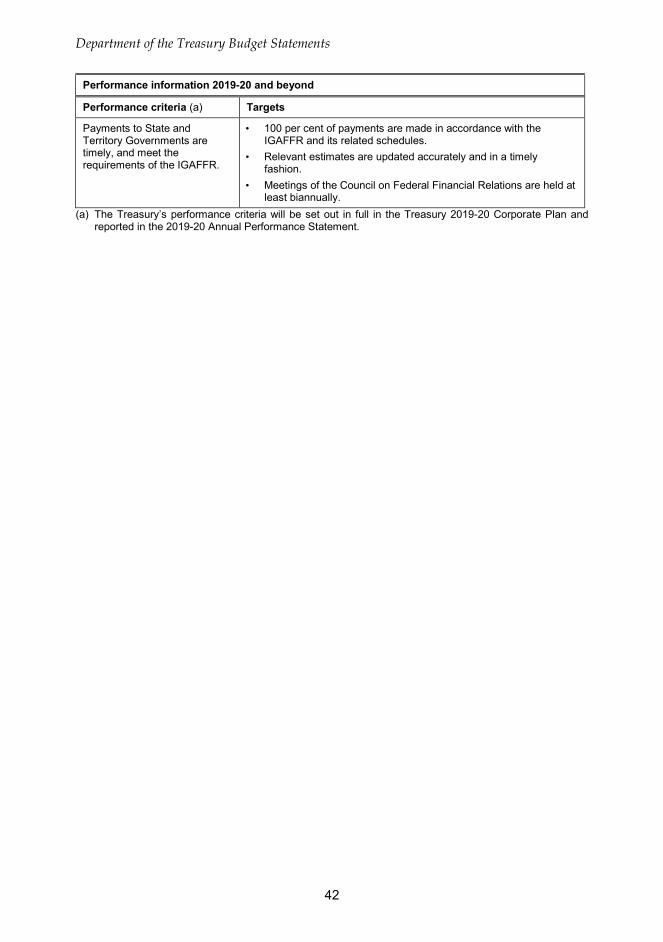
Department of the Treasury Budget Statements
42
Performance information 2019-20 and beyond
Performance criteria (a) Targets
Payments to State and Territory Governments are timely, and meet the requirements of the IGAFFR.
• 100 per cent of payments are made in accordance with the IGAFFR and its related schedules.
• Relevant estimates are updated accurately and in a timely fashion.
• Meetings of the Council on Federal Financial Relations are held at least biannually.
(a) The Treasury’s performance criteria will be set out in full in the Treasury 2019-20 Corporate Plan and reported in the 2019-20 Annual Performance Statement.
Department of the Treasury Budget Statements
43
Section 3: Budgeted financial statements
Section 3 presents budgeted financial statements which provide a comprehensive snapshot of entity finances for the 2019-20 budget year, including the impact of budget measures and resourcing on financial statements.
3.1 BUDGETED FINANCIAL STATEMENTS
3.1.1 Differences between entity resourcing and financial statements The entity resource statement is prepared on a cash basis and provides a view of cash/appropriations resources available to the Treasury whilst the financial statements are prepared on an accrual basis.
3.1.2 Explanatory notes and analysis of budgeted financial statements The Treasury is budgeting for a break-even operating result, after non-appropriated expenses such as depreciation are removed, in 2019-20 and over the forward estimates.
The Treasury has a sound financial position and has sufficient cash reserves to fund provisions and payables, and asset replacement, as they fall due.
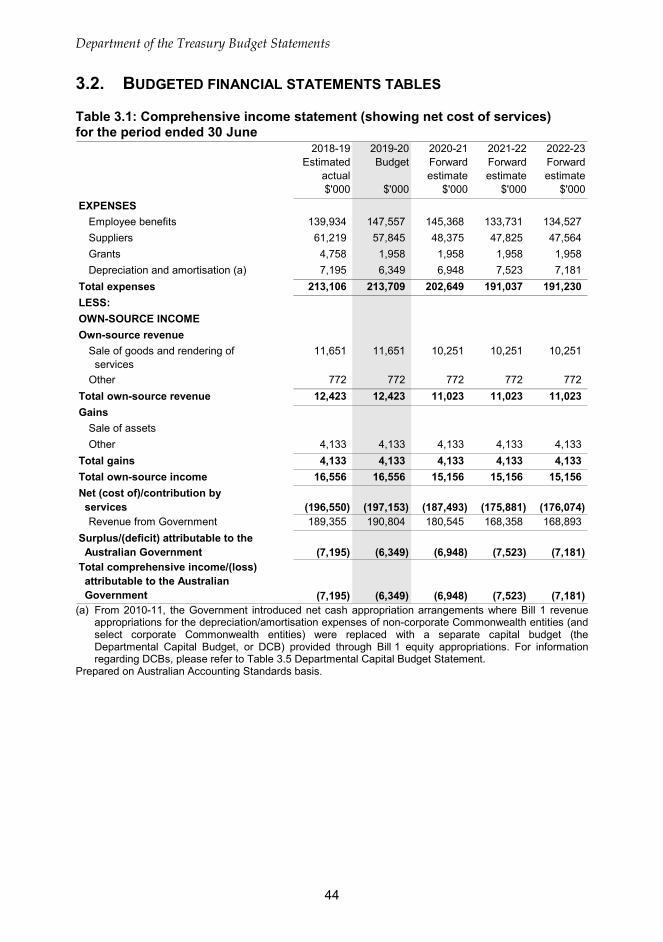
Department of the Treasury Budget Statements
44
3.2. BUDGETED FINANCIAL STATEMENTS TABLES
Table 3.1: Comprehensive income statement (showing net cost of services) for the period ended 30 June
2018-19 Estimated
actual$'000
2019-20Budget
$'000
2020-21 Forward estimate
$'000
2021-22 Forward estimate
$'000
2022-23Forward estimate
$'000EXPENSES
Employee benefits 139,934 147,557 145,368 133,731 134,527Suppliers 61,219 57,845 48,375 47,825 47,564Grants 4,758 1,958 1,958 1,958 1,958Depreciation and amortisation (a) 7,195 6,349 6,948 7,523 7,181
Total expenses 213,106 213,709 202,649 191,037 191,230LESS: OWN-SOURCE INCOMEOwn-source revenue
Sale of goods and rendering of services
11,651 11,651 10,251 10,251 10,251
Other 772 772 772 772 772Total own-source revenue 12,423 12,423 11,023 11,023 11,023Gains
Sale of assetsOther 4,133 4,133 4,133 4,133 4,133
Total gains 4,133 4,133 4,133 4,133 4,133Total own-source income 16,556 16,556 15,156 15,156 15,156Net (cost of)/contribution by services (196,550) (197,153) (187,493) (175,881) (176,074)
Revenue from Government 189,355 190,804 180,545 168,358 168,893Surplus/(deficit) attributable to the Australian Government (7,195) (6,349) (6,948) (7,523) (7,181)Total comprehensive income/(loss) attributable to the Australian Government (7,195) (6,349) (6,948) (7,523) (7,181)
(a) From 2010-11, the Government introduced net cash appropriation arrangements where Bill 1 revenue appropriations for the depreciation/amortisation expenses of non-corporate Commonwealth entities (and select corporate Commonwealth entities) were replaced with a separate capital budget (the Departmental Capital Budget, or DCB) provided through Bill 1 equity appropriations. For information regarding DCBs, please refer to Table 3.5 Departmental Capital Budget Statement.
Prepared on Australian Accounting Standards basis.
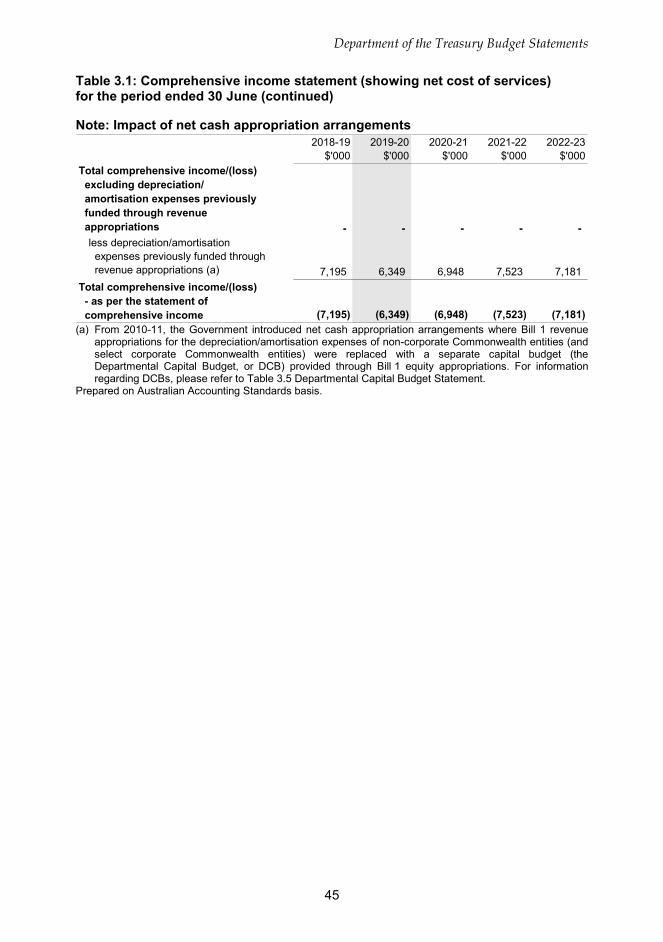
Department of the Treasury Budget Statements
45
Table 3.1: Comprehensive income statement (showing net cost of services) for the period ended 30 June (continued) Note: Impact of net cash appropriation arrangements
2018-19$'000
2019-20$'000
2020-21$'000
2021-22$'000
2022-23$'000
Total comprehensive income/(loss) excluding depreciation/ amortisation expenses previously funded through revenue appropriations - - - - -
less depreciation/amortisation expenses previously funded through revenue appropriations (a) 7,195 6,349 6,948 7,523 7,181
Total comprehensive income/(loss) - as per the statement of comprehensive income (7,195) (6,349) (6,948) (7,523) (7,181)
(a) From 2010-11, the Government introduced net cash appropriation arrangements where Bill 1 revenue appropriations for the depreciation/amortisation expenses of non-corporate Commonwealth entities (and select corporate Commonwealth entities) were replaced with a separate capital budget (the Departmental Capital Budget, or DCB) provided through Bill 1 equity appropriations. For information regarding DCBs, please refer to Table 3.5 Departmental Capital Budget Statement.
Prepared on Australian Accounting Standards basis.
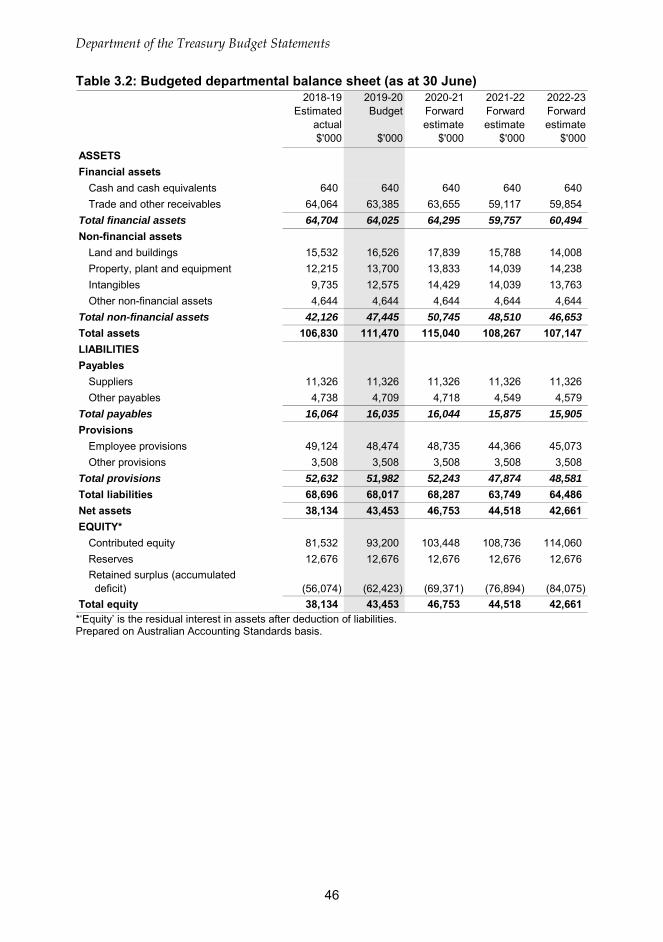
Department of the Treasury Budget Statements
46
Table 3.2: Budgeted departmental balance sheet (as at 30 June) 2018-19
Estimated actual$'000
2019-20Budget
$'000
2020-21 Forward estimate
$'000
2021-22 Forward estimate
$'000
2022-23Forward estimate
$'000ASSETSFinancial assets
Cash and cash equivalents 640 640 640 640 640 Trade and other receivables 64,064 63,385 63,655 59,117 59,854
Total financial assets 64,704 64,025 64,295 59,757 60,494 Non-financial assets
Land and buildings 15,532 16,526 17,839 15,788 14,008 Property, plant and equipment 12,215 13,700 13,833 14,039 14,238 Intangibles 9,735 12,575 14,429 14,039 13,763 Other non-financial assets 4,644 4,644 4,644 4,644 4,644
Total non-financial assets 42,126 47,445 50,745 48,510 46,653 Total assets 106,830 111,470 115,040 108,267 107,147 LIABILITIESPayables
Suppliers 11,326 11,326 11,326 11,326 11,326 Other payables 4,738 4,709 4,718 4,549 4,579
Total payables 16,064 16,035 16,044 15,875 15,905 Provisions
Employee provisions 49,124 48,474 48,735 44,366 45,073 Other provisions 3,508 3,508 3,508 3,508 3,508
Total provisions 52,632 51,982 52,243 47,874 48,581 Total liabilities 68,696 68,017 68,287 63,749 64,486 Net assets 38,134 43,453 46,753 44,518 42,661 EQUITY*
Contributed equity 81,532 93,200 103,448 108,736 114,060 Reserves 12,676 12,676 12,676 12,676 12,676 Retained surplus (accumulated deficit) (56,074) (62,423) (69,371) (76,894) (84,075)
Total equity 38,134 43,453 46,753 44,518 42,661 *‘Equity’ is the residual interest in assets after deduction of liabilities. Prepared on Australian Accounting Standards basis.
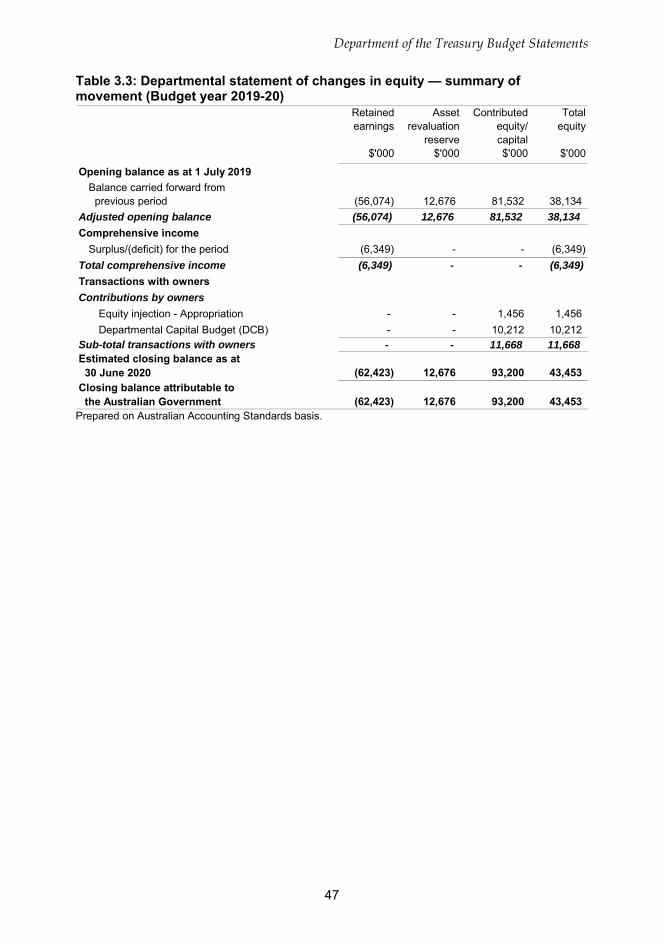
Department of the Treasury Budget Statements
47
Table 3.3: Departmental statement of changes in equity — summary of movement (Budget year 2019-20)
Retainedearnings
$'000
Assetrevaluation
reserve$'000
Contributedequity/capital$'000
Totalequity
$'000
Opening balance as at 1 July 2019Balance carried forward from previous period (56,074) 12,676 81,532 38,134
Adjusted opening balance (56,074) 12,676 81,532 38,134Comprehensive income
Surplus/(deficit) for the period (6,349) - - (6,349)Total comprehensive income (6,349) - - (6,349)Transactions with ownersContributions by owners
Equity injection - Appropriation - - 1,456 1,456Departmental Capital Budget (DCB) - - 10,212 10,212
Sub-total transactions with owners - - 11,668 11,668Estimated closing balance as at 30 June 2020 (62,423) 12,676 93,200 43,453Closing balance attributable to the Australian Government (62,423) 12,676 93,200 43,453
Prepared on Australian Accounting Standards basis.
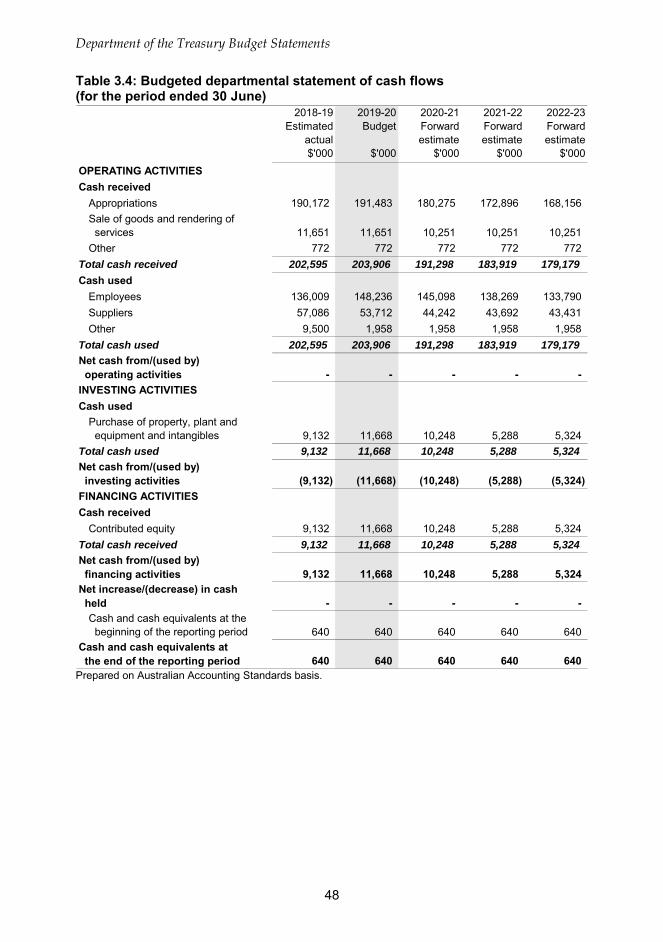
Department of the Treasury Budget Statements
48
Table 3.4: Budgeted departmental statement of cash flows (for the period ended 30 June)
2018-19 Estimated
actual$'000
2019-20Budget
$'000
2020-21 Forward estimate
$'000
2021-22 Forward estimate
$'000
2022-23Forward estimate
$'000OPERATING ACTIVITIESCash received
Appropriations 190,172 191,483 180,275 172,896 168,156Sale of goods and rendering of services 11,651 11,651 10,251 10,251 10,251Other 772 772 772 772 772
Total cash received 202,595 203,906 191,298 183,919 179,179Cash used
Employees 136,009 148,236 145,098 138,269 133,790Suppliers 57,086 53,712 44,242 43,692 43,431Other 9,500 1,958 1,958 1,958 1,958
Total cash used 202,595 203,906 191,298 183,919 179,179Net cash from/(used by) operating activities - - - - -INVESTING ACTIVITIESCash used
Purchase of property, plant and equipment and intangibles 9,132 11,668 10,248 5,288 5,324
Total cash used 9,132 11,668 10,248 5,288 5,324Net cash from/(used by) investing activities (9,132) (11,668) (10,248) (5,288) (5,324)FINANCING ACTIVITIESCash received
Contributed equity 9,132 11,668 10,248 5,288 5,324Total cash received 9,132 11,668 10,248 5,288 5,324Net cash from/(used by) financing activities 9,132 11,668 10,248 5,288 5,324Net increase/(decrease) in cash held - - - - -
Cash and cash equivalents at the beginning of the reporting period 640 640 640 640 640
Cash and cash equivalents at the end of the reporting period 640 640 640 640 640 Prepared on Australian Accounting Standards basis.
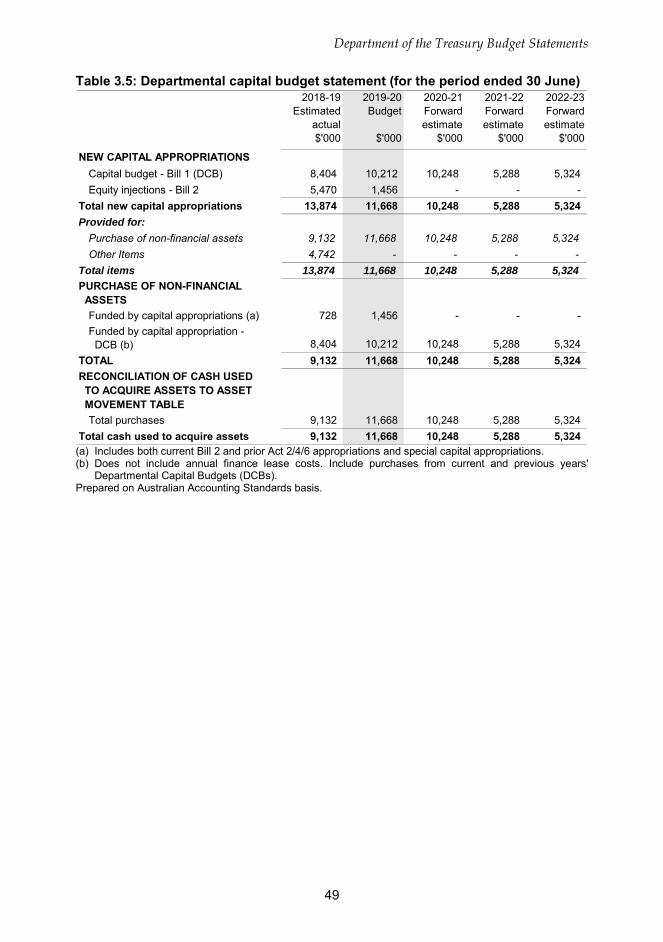
Department of the Treasury Budget Statements
49
Table 3.5: Departmental capital budget statement (for the period ended 30 June) 2018-19
Estimated actual$'000
2019-20Budget
$'000
2020-21 Forward estimate
$'000
2021-22 Forward estimate
$'000
2022-23Forward estimate
$'000
NEW CAPITAL APPROPRIATIONSCapital budget - Bill 1 (DCB) 8,404 10,212 10,248 5,288 5,324Equity injections - Bill 2 5,470 1,456 - - -
Total new capital appropriations 13,874 11,668 10,248 5,288 5,324Provided for:
Purchase of non-financial assets 9,132 11,668 10,248 5,288 5,324Other Items 4,742 - - - -
Total items 13,874 11,668 10,248 5,288 5,324PURCHASE OF NON-FINANCIAL ASSETS
Funded by capital appropriations (a) 728 1,456 - - -Funded by capital appropriation - DCB (b) 8,404 10,212 10,248 5,288 5,324
TOTAL 9,132 11,668 10,248 5,288 5,324RECONCILIATION OF CASH USED TO ACQUIRE ASSETS TO ASSET MOVEMENT TABLE
Total purchases 9,132 11,668 10,248 5,288 5,324Total cash used to acquire assets 9,132 11,668 10,248 5,288 5,324 (a) Includes both current Bill 2 and prior Act 2/4/6 appropriations and special capital appropriations. (b) Does not include annual finance lease costs. Include purchases from current and previous years'
Departmental Capital Budgets (DCBs). Prepared on Australian Accounting Standards basis.
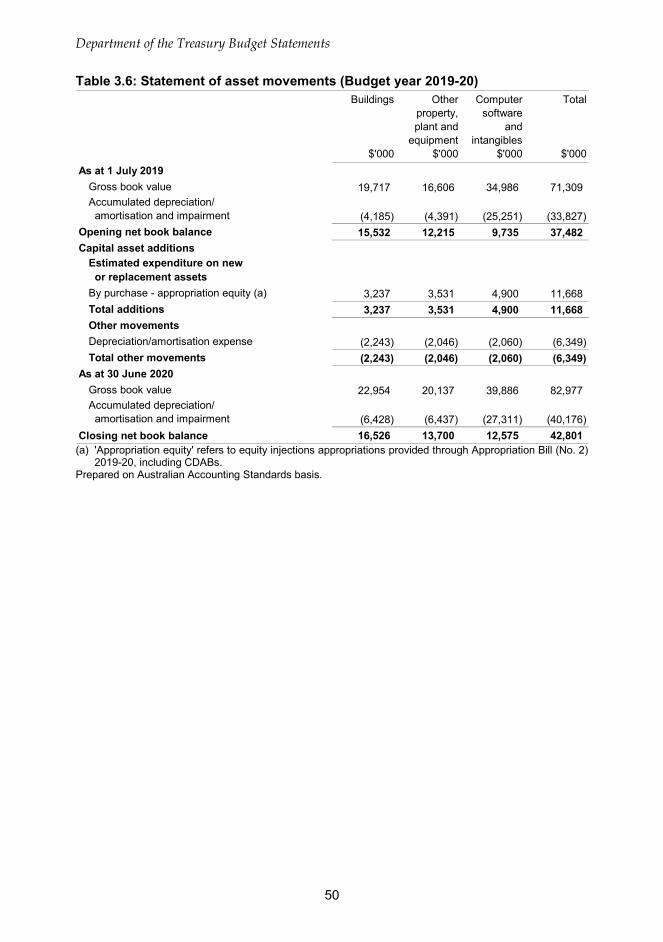
Department of the Treasury Budget Statements
50
Table 3.6: Statement of asset movements (Budget year 2019-20) Buildings
$'000
Otherproperty,plant and
equipment$'000
Computersoftware
andintangibles
$'000
Total
$'000As at 1 July 2019
Gross book value 19,717 16,606 34,986 71,309Accumulated depreciation/ amortisation and impairment (4,185) (4,391) (25,251) (33,827)
Opening net book balance 15,532 12,215 9,735 37,482Capital asset additions
Estimated expenditure on new or replacement assetsBy purchase - appropriation equity (a) 3,237 3,531 4,900 11,668Total additions 3,237 3,531 4,900 11,668Other movementsDepreciation/amortisation expense (2,243) (2,046) (2,060) (6,349)Total other movements (2,243) (2,046) (2,060) (6,349)
As at 30 June 2020Gross book value 22,954 20,137 39,886 82,977Accumulated depreciation/ amortisation and impairment (6,428) (6,437) (27,311) (40,176)
Closing net book balance 16,526 13,700 12,575 42,801 (a) 'Appropriation equity' refers to equity injections appropriations provided through Appropriation Bill (No. 2)
2019-20, including CDABs. Prepared on Australian Accounting Standards basis.
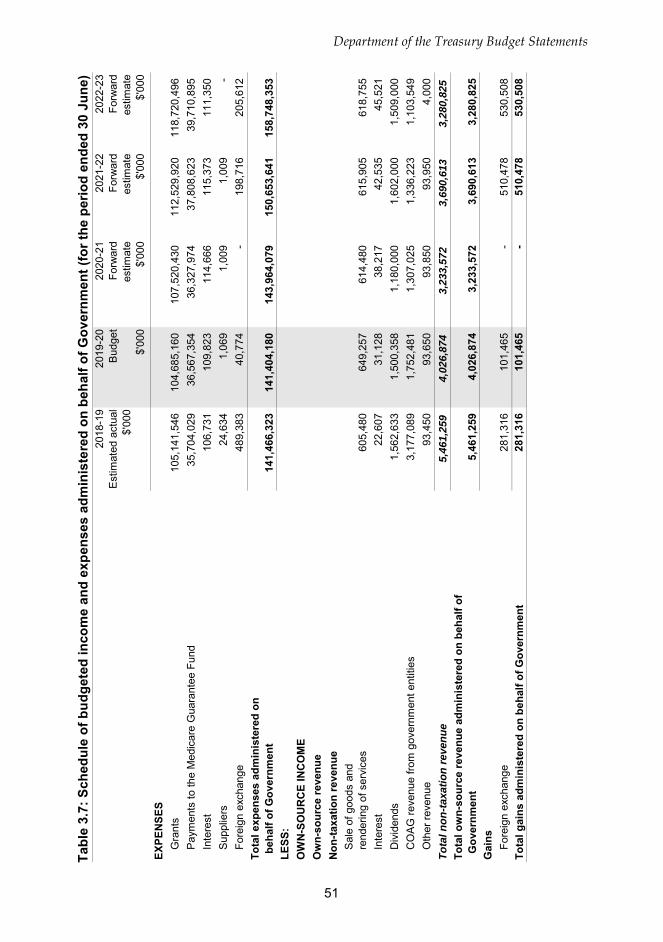
Tabl
e 3.
7: S
ched
ule
of b
udge
ted
inco
me
and
expe
nses
adm
inis
tere
d on
beh
alf o
f Gov
ernm
ent (
for t
he p
erio
d en
ded
30 J
une)
20
18-1
9 E
stim
ated
act
ual
$'00
0
2019
-20
Bud
get
$'00
0
2020
-21
Forw
ard
estim
ate
$'00
0
2021
-22
Forw
ard
estim
ate
$'00
0
2022
-23
Forw
ard
estim
ate
$'00
0
EXPE
NSE
SG
rant
s10
5,14
1,54
610
4,68
5,16
010
7,52
0,43
011
2,52
9,92
011
8,72
0,49
6P
aym
ents
to th
e M
edic
are
Gua
rant
ee F
und
35,7
04,0
2936
,567
,354
36,3
27,9
7437
,808
,623
39,7
10,8
95In
tere
st10
6,73
110
9,82
311
4,66
611
5,37
311
1,35
0S
uppl
iers
24,6
341,
069
1,00
91,
009
-Fo
reig
n ex
chan
ge48
9,38
340
,774
-19
8,71
620
5,61
2To
tal e
xpen
ses
adm
inis
tere
d on
beh
alf o
f Gov
ernm
ent
141,
466,
323
141,
404,
180
143,
964,
079
150,
653,
641
158,
748,
353
LESS
:O
WN
-SO
UR
CE
INC
OM
EO
wn-
sour
ce re
venu
eN
on-ta
xatio
n re
venu
eS
ale
of g
oods
and
rend
erin
g of
ser
vice
s60
5,48
064
9,25
761
4,48
061
5,90
561
8,75
5In
tere
st22
,607
31,1
2838
,217
42,5
3545
,521
Div
iden
ds1,
562,
633
1,50
0,35
81,
180,
000
1,60
2,00
01,
509,
000
CO
AG
reve
nue
from
gov
ernm
ent e
ntiti
es3,
177,
089
1,75
2,48
11,
307,
025
1,33
6,22
31,
103,
549
Oth
er re
venu
e93
,450
93,6
5093
,850
93,9
504,
000
Tota
l non
-taxa
tion
reve
nue
5,46
1,25
94,
026,
874
3,23
3,57
23,
690,
613
3,28
0,82
5To
tal o
wn-
sour
ce re
venu
e ad
min
iste
red
on b
ehal
f of
Gov
ernm
ent
5,46
1,25
94,
026,
874
3,23
3,57
23,
690,
613
3,28
0,82
5G
ains
Fore
ign
exch
ange
281,
316
101,
465
-51
0,47
853
0,50
8To
tal g
ains
adm
inis
tere
d on
beh
alf o
f Gov
ernm
ent
281,
316
101,
465
-51
0,47
853
0,50
8
Department of the Treasury Budget Statements
51
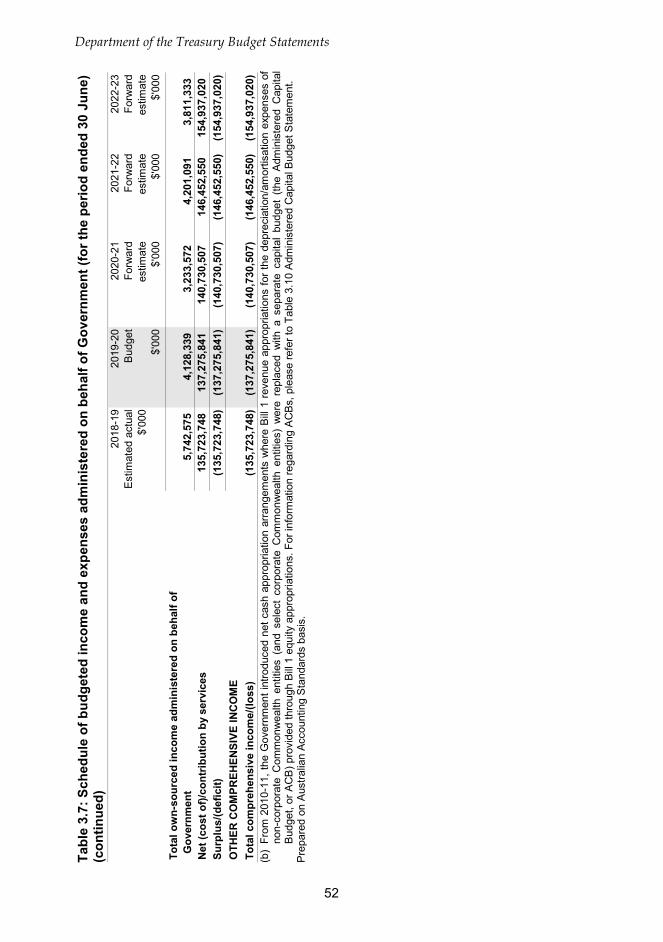
Department of the Treasury Budget Statements
Tabl
e 3.
7: S
ched
ule
of b
udge
ted
inco
me
and
expe
nses
adm
inis
tere
d on
beh
alf o
f Gov
ernm
ent (
for t
he p
erio
d en
ded
30 J
une)
(c
ontin
ued)
20
18-1
9 E
stim
ated
act
ual
$'00
0
2019
-20
Bud
get
$'00
0
2020
-21
Forw
ard
estim
ate
$'00
0
2021
-22
Forw
ard
estim
ate
$'00
0
2022
-23
Forw
ard
estim
ate
$'00
0
Tota
l ow
n-so
urce
d in
com
e ad
min
iste
red
on b
ehal
f of
Gov
ernm
ent
5,74
2,57
54,
128,
339
3,23
3,57
24,
201,
091
3,81
1,33
3N
et (c
ost o
f)/co
ntrib
utio
n by
ser
vice
s13
5,72
3,74
813
7,27
5,84
114
0,73
0,50
714
6,45
2,55
015
4,93
7,02
0Su
rplu
s/(d
efic
it)(1
35,7
23,7
48)
(137
,275
,841
)(1
40,7
30,5
07)
(146
,452
,550
)(1
54,9
37,0
20)
OTH
ER C
OM
PREH
ENSI
VE IN
CO
ME
Tota
l com
preh
ensi
ve in
com
e/(lo
ss)
(135
,723
,748
)(1
37,2
75,8
41)
(140
,730
,507
)(1
46,4
52,5
50)
(154
,937
,020
) (b
) Fr
om 2
010-
11, t
he G
over
nmen
t int
rodu
ced
net c
ash
appr
opria
tion
arra
ngem
ents
whe
re B
ill 1
reve
nue
appr
opria
tions
for t
he d
epre
ciat
ion/
amor
tisat
ion
expe
nses
of
non-
corp
orat
e C
omm
onw
ealth
ent
ities
(an
d se
lect
cor
pora
te C
omm
onw
ealth
ent
ities
) w
ere
repl
aced
with
a s
epar
ate
capi
tal
budg
et (
the
Adm
inis
tere
d C
apita
l B
udge
t, or
AC
B) p
rovi
ded
thro
ugh
Bill
1 eq
uity
app
ropr
iatio
ns. F
or in
form
atio
n re
gard
ing
AC
Bs,
ple
ase
refe
r to
Tabl
e 3.
10 A
dmin
iste
red
Cap
ital B
udge
t Sta
tem
ent.
Pre
pare
d on
Aus
tralia
n Ac
coun
ting
Sta
ndar
ds b
asis
.
52
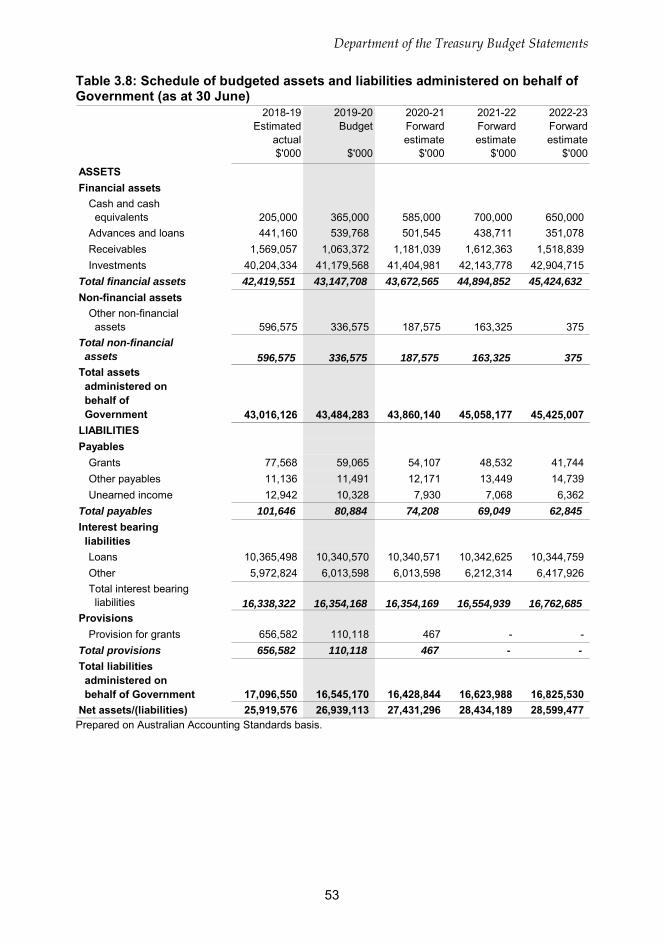
Department of the Treasury Budget Statements
53
Table 3.8: Schedule of budgeted assets and liabilities administered on behalf of Government (as at 30 June)
2018-19 Estimated
actual$'000
2019-20Budget
$'000
2020-21 Forward estimate
$'000
2021-22 Forward estimate
$'000
2022-23Forward estimate
$'000
ASSETS Financial assets
Cash and cash equivalents 205,000 365,000 585,000 700,000 650,000Advances and loans 441,160 539,768 501,545 438,711 351,078Receivables 1,569,057 1,063,372 1,181,039 1,612,363 1,518,839Investments 40,204,334 41,179,568 41,404,981 42,143,778 42,904,715
Total financial assets 42,419,551 43,147,708 43,672,565 44,894,852 45,424,632Non-financial assets
Other non-financial assets 596,575 336,575 187,575 163,325 375
Total non-financial assets 596,575 336,575 187,575 163,325 375Total assets administered on behalf of Government 43,016,126 43,484,283 43,860,140 45,058,177 45,425,007LIABILITIESPayables
Grants 77,568 59,065 54,107 48,532 41,744Other payables 11,136 11,491 12,171 13,449 14,739Unearned income 12,942 10,328 7,930 7,068 6,362
Total payables 101,646 80,884 74,208 69,049 62,845Interest bearing liabilities
Loans 10,365,498 10,340,570 10,340,571 10,342,625 10,344,759Other 5,972,824 6,013,598 6,013,598 6,212,314 6,417,926Total interest bearing liabilities 16,338,322 16,354,168 16,354,169 16,554,939 16,762,685
ProvisionsProvision for grants 656,582 110,118 467 - -
Total provisions 656,582 110,118 467 - -Total liabilities administered on behalf of Government 17,096,550 16,545,170 16,428,844 16,623,988 16,825,530Net assets/(liabilities) 25,919,576 26,939,113 27,431,296 28,434,189 28,599,477
Prepared on Australian Accounting Standards basis.
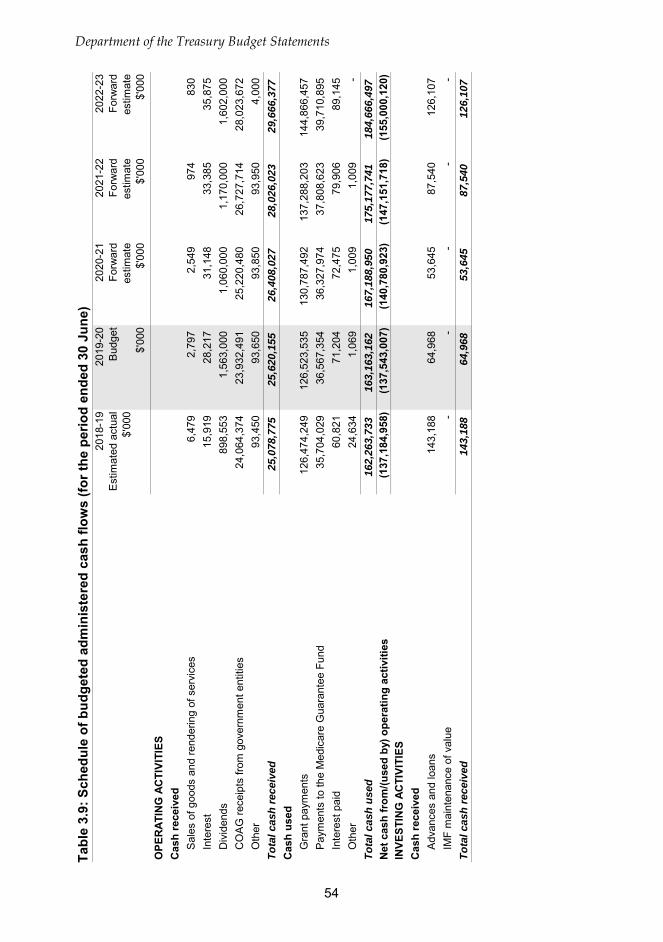
Tabl
e 3.
9: S
ched
ule
of b
udge
ted
adm
inis
tere
d ca
sh fl
ows
(for t
he p
erio
d en
ded
30 J
une)
20
18-1
9 E
stim
ated
act
ual
$'00
0
2019
-20
Bud
get
$'00
0
2020
-21
Forw
ard
estim
ate
$'00
0
2021
-22
Forw
ard
estim
ate
$'00
0
2022
-23
Forw
ard
estim
ate
$'00
0
OPE
RAT
ING
AC
TIVI
TIES
Cas
h re
ceiv
edS
ales
of g
oods
and
rend
erin
g of
ser
vice
s6,
479
2,79
72,
549
974
830
Inte
rest
15,9
1928
,217
31,1
4833
,385
35,8
75D
ivid
ends
898,
553
1,56
3,00
01,
060,
000
1,17
0,00
01,
602,
000
CO
AG
rece
ipts
from
gov
ernm
ent e
ntiti
es24
,064
,374
23,9
32,4
9125
,220
,480
26,7
27,7
1428
,023
,672
Oth
er93
,450
93,6
5093
,850
93,9
504,
000
Tota
l cas
h re
ceiv
ed25
,078
,775
25,6
20,1
5526
,408
,027
28,0
26,0
2329
,666
,377
Cas
h us
edG
rant
pay
men
ts12
6,47
4,24
912
6,52
3,53
513
0,78
7,49
213
7,28
8,20
314
4,86
6,45
7P
aym
ents
to th
e M
edic
are
Gua
rant
ee F
und
35,7
04,0
2936
,567
,354
36,3
27,9
7437
,808
,623
39,7
10,8
95In
tere
st p
aid
60,8
2171
,204
72,4
7579
,906
89,1
45O
ther
24,6
341,
069
1,00
91,
009
-To
tal c
ash
used
162,
263,
733
163,
163,
162
167,
188,
950
175,
177,
741
184,
666,
497
Net
cas
h fr
om/(u
sed
by) o
pera
ting
activ
ities
(137
,184
,958
)(1
37,5
43,0
07)
(140
,780
,923
)(1
47,1
51,7
18)
(155
,000
,120
)IN
VEST
ING
AC
TIVI
TIES
Cas
h re
ceiv
edA
dvan
ces
and
loan
s14
3,18
864
,968
53,6
4587
,540
126,
107
IMF
mai
nten
ance
of v
alue
--
--
-To
tal c
ash
rece
ived
143,
188
64,9
6853
,645
87,5
4012
6,10
7
Department of the Treasury Budget Statements
54
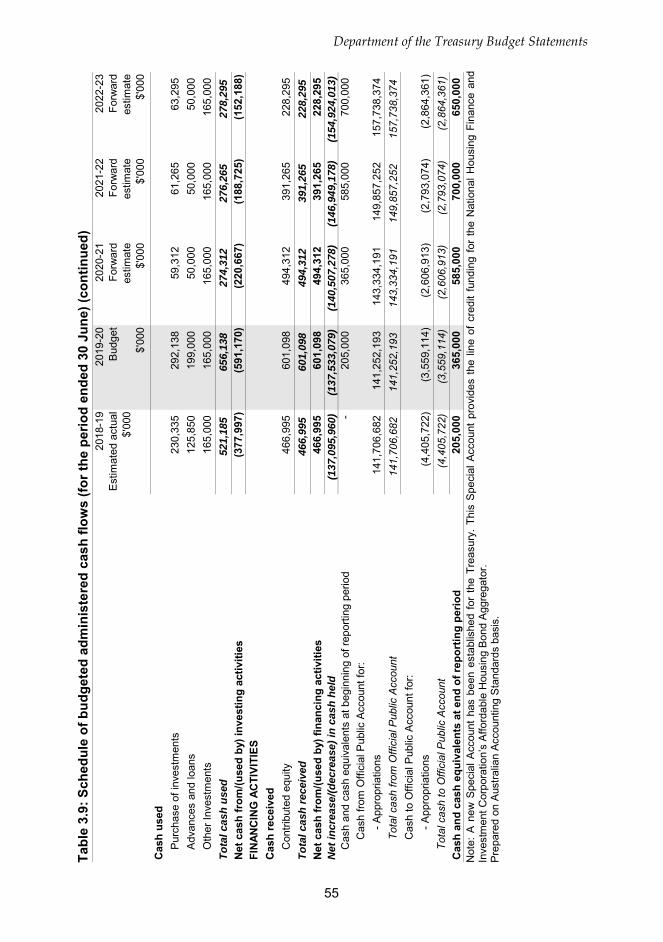
Tabl
e 3.
9: S
ched
ule
of b
udge
ted
adm
inis
tere
d ca
sh fl
ows
(for t
he p
erio
d en
ded
30 J
une)
(con
tinue
d)
2018
-19
Est
imat
ed a
ctua
l$'
000
2019
-20
Bud
get
$'00
0
2020
-21
Forw
ard
estim
ate
$'00
0
2021
-22
Forw
ard
estim
ate
$'00
0
2022
-23
Forw
ard
estim
ate
$'00
0
Cas
h us
edP
urch
ase
of in
vest
men
ts23
0,33
529
2,13
859
,312
61,2
6563
,295
Adv
ance
s an
d lo
ans
125,
850
199,
000
50,0
0050
,000
50,0
00O
ther
Inve
stm
ents
165,
000
165,
000
165,
000
165,
000
165,
000
Tota
l cas
h us
ed52
1,18
565
6,13
827
4,31
227
6,26
527
8,29
5N
et c
ash
from
/(use
d by
) inv
estin
g ac
tiviti
es(3
77,9
97)
(591
,170
)(2
20,6
67)
(188
,725
)(1
52,1
88)
FIN
ANC
ING
AC
TIVI
TIES
Cas
h re
ceiv
edC
ontri
bute
d eq
uity
466,
995
601,
098
494,
312
391,
265
228,
295
Tota
l cas
h re
ceiv
ed46
6,99
560
1,09
849
4,31
239
1,26
522
8,29
5N
et c
ash
from
/(use
d by
) fin
anci
ng a
ctiv
ities
466,
995
601,
098
494,
312
391,
265
228,
295
Net
incr
ease
/(dec
reas
e) in
cas
h he
ld( 1
37,0
95, 9
60)
( 137
,533
,079
)(1
40,5
07,2
78)
(146
,949
,178
)(1
54,9
24,0
13)
Cas
h an
d ca
sh e
quiv
alen
ts a
t beg
inni
ng o
f rep
ortin
g pe
riod
-20
5,00
036
5,00
058
5,00
070
0,00
0C
ash
from
Offi
cial
Pub
lic A
ccou
nt fo
r:- A
ppro
pria
tions
141,
706,
682
141,
252,
193
143,
334,
191
149,
857,
252
157,
738,
374
Tota
l cas
h fro
m O
ffici
al P
ublic
Acc
ount
141,
706,
682
141,
252,
193
143,
334,
191
149,
857,
252
157,
738,
374
Cas
h to
Offi
cial
Pub
lic A
ccou
nt fo
r:- A
ppro
pria
tions
(4,4
05,7
22)
(3,5
59,1
14)
(2,6
06,9
13)
(2,7
93,0
74)
(2,8
64,3
61)
Tota
l cas
h to
Offi
cial
Pub
lic A
ccou
nt(4
,405
,722
)(3
,559
,114
)(2
,606
,913
)(2
,793
,074
)(2
,864
,361
)C
ash
and
cash
equ
ival
ents
at e
nd o
f rep
ortin
g pe
riod
205,
000
365,
000
585,
000
700,
000
650,
000
N
ote:
A n
ew S
peci
al A
ccou
nt h
as b
een
esta
blis
hed
for
the
Trea
sury
. Th
is S
peci
al A
ccou
nt p
rovi
des
the
line
of c
redi
t fu
ndin
g fo
r th
e N
atio
nal H
ousi
ng F
inan
ce a
nd
Inve
stm
ent C
orpo
ratio
n’s
Affo
rdab
le H
ousi
ng B
ond
Agg
rega
tor.
P
repa
red
on A
ustra
lian
Acco
untin
g S
tand
ards
bas
is.
Department of the Treasury Budget Statements
55
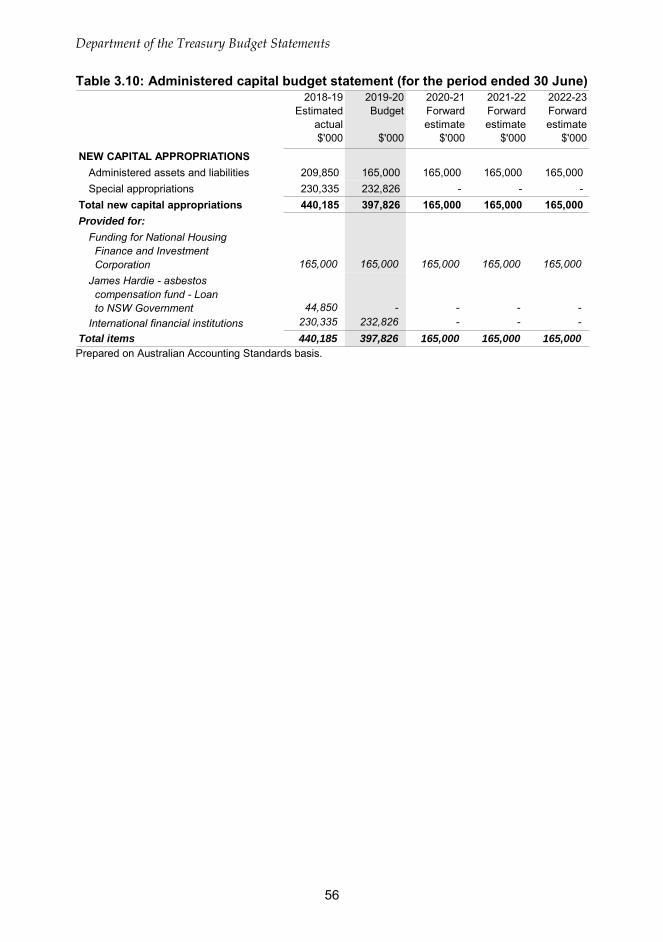
Department of the Treasury Budget Statements
56
Table 3.10: Administered capital budget statement (for the period ended 30 June) 2018-19
Estimated actual$'000
2019-20Budget
$'000
2020-21 Forward estimate
$'000
2021-22 Forward estimate
$'000
2022-23Forward estimate
$'000
NEW CAPITAL APPROPRIATIONSAdministered assets and liabilities 209,850 165,000 165,000 165,000 165,000Special appropriations 230,335 232,826 - - -
Total new capital appropriations 440,185 397,826 165,000 165,000 165,000Provided for:
Funding for National Housing Finance and Investment Corporation 165,000 165,000 165,000 165,000 165,000James Hardie - asbestos compensation fund - Loan to NSW Government 44,850 - - - -International financial institutions 230,335 232,826 - - -
Total items 440,185 397,826 165,000 165,000 165,000 Prepared on Australian Accounting Standards basis.