entertainment as crime prevention: evidence from chicago sports games
DESCRIPTION
Entertainment as Crime Prevention: Evidence from Chicago Sports GamesTRANSCRIPT

Electronic copy available at: http://ssrn.com/abstract=2429551
1
Entertainment as Crime Prevention: Evidence from Chicago Sports Games
Ryan Copus and Hannah Laqueur*
Abstract The concern that mass media may be responsible for aggressive and criminal behavior is widespread. Comparatively little consideration has been given to its potential diversionary function. This paper contributes to the emerging body of literature on entertainment as a determinant of crime by analyzing Chicago by-the-minute crime reports during major sporting events. Sports provide an exogenous infusion of TV diversion that we leverage to test the effect of entertainment on crime. Because the scheduling of a sporting event should be random with respect to crime within a given month, day of the week, and time, we use month-time-day-of-week fixed effects to estimate the effect of the sporting events on crime. We compare crime reports by the half hour when Chicago’s NFL, NBA, or MLB teams are playing to crime reports at the same time, day, and month when the teams are not playing. We conduct the same analysis for the Super Bowl, NBA Finals, and MLB World Series. The Super Bowl generates the most dramatic declines: total crime reports decrease by approximately 25 percent (roughly 60 fewer crimes). The decline is partially offset by an increase in crime before the game, most notably in drug and prostitution reports, and an uptick in reports of violent crime immediately after the game. Crime during Chicago Bears Monday night football games is roughly 15 percent lower (30 fewer crimes) than during the same time on non-game nights. Our results show similar but smaller effects for NBA and MLB games. Except for the Super Bowl, we find little evidence for temporal crime displacement before or after the games. In general, we find substantial declines during games across crime types – property, violent, drug, and other – with the largest reductions for drug crime. We believe fewer potential offenders on the streets largely explain the declines in crime.
* PhD Candidates, University of California, Berkeley Law School, Jurisprudence and Social Policy. The work was co-authored and the names are listed in alphabetical order. We are extremely grateful for the guidance and comments from Rob MacCoun, Justin McCrary, Kevin Quinn, Steve Raphael, and Franklin Zimring. In addition, we would like to thank our discussant, Ingrid Eagly, and the participants at the Western Empirical Legal Studies conference at UCLA Law School. We would also like to offer special thanks to our colleague Johann Koehler for his careful reading and extensive feedback. Finally, we are grateful to the Chicago Research and Development Division for their quick responses to questions about the data, and, more generally, to the city of Chicago for making these incident reports publically available online.

Electronic copy available at: http://ssrn.com/abstract=2429551
I. Introduction -"Do this research...If we don’t have a season, watch how much evil, which we call crime, watch how much crime picks up if you take away our game…[People have] nothing else to do."
--Ray Lewis, Super Bowl MVP
This paper tests Ray Lewis’s hypothesis.1 We analyze Chicago by-the-minute crime
reports during major sporting events and find there are significant reductions in crime during
games. The evidence suggests these reductions are largely explained by potential offenders
spending their time watching the game on television rather than engaging in criminal activity.
Importantly, at least in the short-term, the reductions appear to represent foregone criminal
opportunities -- crime does not increase before or after most games.
While the concern that mass media may be responsible for aggressive and criminal
behavior is widespread, comparatively little consideration has been given to its potential
diversionary function. Social science research in this area has been mostly experimental,
focusing primarily on the possible behavioral effects of mass media (e.g. whether viewing
violent films promotes violent tendencies) (e.g., Anderson and Bushman, 2001, 2002; Anderson,
2004; Uhlmann and Swanson, 2004; Adachi and Willoughby, 2011. Some scholars have made
the conceptual point that entertainment may in fact play a crime-reducing role by keeping people
off the streets (e.g., Zimring & Hawkins, 1997), but there has been relatively little empirical
testing of the idea. In this paper, we find strong evidence that entertainment, specifically the
entertainment provided by televised sports games, reduces rates of crime by up to 25 percent.
We compare crime reports by the half hour when Chicago’s NFL, National Basketball
1 Ray Lewis’s claim that a National Football League (NFL) lockout would lead to higher crime was largely dismissed. Blogs and commentators mostly mocked him; social scientists concluded there was no data to support the claim (http://www.politifact.com/georgia/statements/2011/jun/17/ray-lewis/ray-lewis-crime-claim-gets-flagged/) . Ray Lewis was not explicit as to why he thought cancelling NFL games would lead to increases in crime. He suggests crime would increase because people would have “nothing else to do” if the NFL season were cancelled due to the lockout. This theorization is compatible with our own: people watching NFL games are less likely to engage in crime. He also stated, however, “[t]here's too many people that live through us,” which suggests general malaise due to the absence of NFL football could increase crime. Our paper does not address the latter theory. His insight expresses an old and widespread trope: the distraction of games can pacify the population. Major movies like the “Hunger Games,” “Gladiator,” and “The Running Man” all prominently feature the theme of distraction by games.
3
Association (NBA), or Major League Baseball (MLB) teams are playing to crime reports at the
same time, day, and month when the teams are not playing. We conduct the same analysis for the
Super Bowl, NBA Finals, and MLB World Series. Our analysis exploits the fact that the
scheduling of sports games should be unrelated to crime within a given month, day of the week,
and time-slot to explore the effect of televised sporting events on rates of crime in the city.
Consider, for example, the Chicago Bears’ regular season schedule. During a given NFL season
one to two Bears games are scheduled on a Monday night. By comparing crime reports on the
Monday nights when they happen to play to crime reports on non-game Mondays (when they
instead played on Sunday), we estimate the causal effect of Bears games on crime.2
Our results show overall crime in Chicago during Bears Monday Night Football games is
approximately 15 percent lower than the same time on Monday nights when the Bears are not
playing. The Super Bowl generates even more dramatic reductions in crime. Crime is about 25
percent lower during Super Bowl game coverage, which amounts to roughly 60 fewer crimes.
We find similar but smaller effects for the NBA and MLB. Importantly, we find little evidence of
effects before or after the game. 3 Theoretically, this observation speaks to the issue of
displacement, as a crime prevented at one moment does not seem to occur at a later moment.
Methodologically, the fact that crime is affected only during game hours provides assurance that
it is indeed the game driving the results and not some unobserved feature of game days.
The consistent drop across all crime types -- violent, property, drug and other -- in
conjunction with the absence of displacement before or after games, suggests the decline in
crime is driven primarily by fewer potential criminals on the streets.4 As we discuss in Section V,
other possibilities -- reduced criminal opportunities, reduced crime reporting, or reduced law
enforcement -- cannot plausibly account for the consistent and widespread declines.
Our analysis has important implications for the study of crime and its control. First, the
reductions in crime we find during sports games speak to the nature of criminal behavior itself.
Some share of crime may be best understood not as a predetermined and calculated activity but
2 This is likely a conservative estimate. Because we are comparing Monday night Bears games to Monday nights within the same month in which there will be other football games airing, we estimate the effect of TV entertainment that a Bears game provides above and beyond that provided by other NFL games (See Section III C). 3 As we discuss in greater detail in Section V B, we test for short-term reductions in crime (the day of and day after a sporting event). Though we do not generally find evidence of displacement, we cannot speak as to whether the sports games produce long-term aggregate reductions in crime. 4 While we are able to break out crime reports into the broad categories of violent, property, drug, and other, we do not have enough data to explore effects on narrower crime types (e.g., domestic violence).

rather as itself recreation (Zimring & Hawkins, ch 8, 1997). The reductions we find can be
interpreted as the substitution of one diversionary activity with another. Relatedly, the absence of
significant short-term temporal displacement supports a corollary theoretical point: criminal
opportunities are important in determining not only how crime is distributed, but also its volume.
There is not a set “demand” for criminal activity. Rather, some amount of crime is opportunistic
and situational -- if prevented today, it does not inevitably occur tomorrow. The idiosyncrasies of
the immediate situation or context are important determinants of crime. Traditional accounts of
the etiology of crime have mostly looked either to “root” causes, whether biological,
psychological, macro-sociological and economic, or variation in policy -- changes in police
manpower or strategy, for example. “Routine Activities” theorists have, on the other hand,
focused on the importance of everyday features of life that can have a significant impact on
criminal activity (e.g. Felson and Clarke, 1993). Our results support these routine activities and
situational theories of crime.
Second, our findings suggest entertainment may actually serve a pro-social crime
preventative function. Social scientists have paid little attention to this possibility. While there is
a vast literature analyzing the psychological effects of viewing violent movies, and television, or
playing video games, the social benefits of people having something fun to do have been largely
dismissed or unexplored.5 Alternative leisure activities and entertainment can substitute for
criminal activity, and the benefits may be substantial.
II. Literature Review
A. Media Effects
The psychological research on the behavioral effects of viewing violent media -- whether
it be video games, television or movies -- has consistently found that subjects act more
aggressively (e.g., Anderson and Bushman, 2001, 2002; Anderson, 2004; Uhlmann and
Swanson, 2004; Adachi and Willoughby, 2011). More recently, however, a handful of papers
have explored the hypothesis that any increase in aggressive tendencies caused by violent media
may be countered by its diversionary effect. Dahl and DellaVigna (2009) find violent movie
5 The idea of recreation as crime prevention was central to the 1990s proposals for community activities like “midnight basketball.” Conservatives, who said such programs could never reduce crime and amounted to “coddling criminals,” readily dismissed the proposals. But while midnight basketball was mocked and unfunded, the effects we find for Monday Night Football suggest the core theory has merit.

5
attendance reduces violent crime in the short-term by between 1 to 2 percent. This net decline
includes a drop in crime both during and in the hours immediately following movie attendance.
They theorize the decline is a function of “voluntary incapacitation:” movie attendance offers a
substitute for other alternative aggressive activities. The authors concede violent movies may
have an “arousal” effect, evidenced by their finding that there are reductions in violence after
more violent movies relative to mildly violent movies. But the authors conclude any arousal
effect is swamped by the time-use effect.
Cunningham, Engelstätter, and Ward (2011) investigate the effect of violent video games
on violent crime. They use the release of highly rated games as an instrument for increased video
game play, and conclude violent video game play produces an overall decrease in violent crime.
They suggest this net decline comprises both a positive behavioral effect -- violent video games
encourage aggressive behavior -- and a larger negative voluntary incapacitation effect.
Individuals substitute video game playing for real-world aggressive conduct. Ward (2011) looks
at the association of video game stores, movie theaters, and sports stores with crime rates,
finding that additional sports and game stores are associated with decreases in crime.
B. Sporting Events and Crime
There have been several papers to date looking specifically at sports and crime, in
particular football. The focus of these papers has been on the effect of games’ content on
aggressive behavior, in particular domestic violence, rather than time-use trade-offs. Gantz,
Bradley, and Wang (2006) collected data from 15 local police departments, including Chicago,
from 1996-2002 to examine rates of domestic violence during football games. They find a very
small increase in domestic violence reports. Their results suggest Chicago, for example, would
experience 3.5 more domestic violence incidents on days in which the Bears are playing. Card
and Dahl (2009) study the effect of unexpected NFL football game wins and losses on rates of
family violence. They find that upset losses -- defeats in which the home team was predicted by
the Las Vegas odds-makers to win by four or more points -- lead to a 10 percent increase in
domestic violence. Neither expected losses nor unexpected wins (victories when the home team
was predicted to lose) have a significant impact on domestic violence. Kirby, Francis, and
O’Flaherty (2013) find that domestic abuse reports to an English police force increased
substantially on days when the English national team played, and the increase was higher when
the team lost.
There have been a few papers looking at the effect of sports games on crime rates more
generally, mostly focused on the effect of mass gatherings at sport stadiums rather than the effect
of televised games. Marie (2010) analyzes the effect of soccer matches in London. The study
finds no effect on violent crime but property crime increases for home games and decreases for
away games. Increased property crimes during home games is hypothesized to be the result of
fan concentration and police displacement; decreases in property crime during away games is
hypothesized to be due to voluntary incapacitation of potential offenders attending the matches.
Rees and Schnepel (2009) test the effect of college football matches on crime. They find sharp
increases in the host community’s assaults, vandalism, arrests for disorderly conduct and
alcohol-related offenses, with particularly sharp increases for upset losses. Finally, Baumann et
al (2012) attempt to estimate the effect of spectator sports on annual local crime rates. They find
the presence of a sport franchise or major sporting event in a city has no effect on property or
violent crime, with the exception of the Olympics and Super Bowl. They estimate cities that host
the Olympics experience a 10 percent increase in property crimes during the year of the games;
the Super Bowl is associated with a 2.5 percent decrease in violent crime during the year.
C. Displacement and Criminal Opportunity
The more general literature on crime displacement is also relevant to our study of the
effect of entertainment on crime. Insofar as there is a self-incapacitation function of video game
play, for example, this would be of little societal benefit, as Ward and Cunningham (2011)
suggest, if individuals simply shifted all of their criminal activity to other times. The empirical
literature on displacement indicates that criminal behavior does not necessarily shift in time,
place, or kind (e.g., Weisburd, David, Laura A. Wyckoff, Justin Ready, John E. Eck, Joshua C.
Hinkle, and Frank Gajewski, 2006). In short, some crime is opportunistic: an opportunity denied
to an individual (perhaps because he or she is watching sports or playing video games), may be a
crime prevented rather than shifted to another time or place. Jacob, Brians, Lefgren and Moretti
(2007) used the randomization inherent in weather and find substantial, but not complete,
displacement. They suggest a 10 percent increase in violent crime due to a weather shock results
in a 2.6 percent decrease the following week and 5.4 percent increase over the following month.
For property crimes, a 10 percent increase results in a 2 percent decrease the following week.6
6 Ray Lewis’s claim that crime would rise due to the 2011 NFL lockout also generated a small collection of analyses. Although it was never rigorously tested by academics, Politifact.com, an organization that fact-checks statements made in U.S. politics, took up the challenge of checking the Super Bowl MVP’s statement

7
Braga, Papachristos, and Hureau’s (2012) review of the experimental and quasi-experimental
evaluations of “hot spots” policing finds in the majority of studies such policing practices
produced significant reductions in crime. Importantly, there is no evidence that concentrating
police resources in crime “hot spots” leads to crime displacement in the surrounding locations. In
fact, research suggests that place-based interventions are more likely to produce a diffusion of
benefits – i.e. decreases in crime in the surrounding areas rather than the displacement of crime
(Weisburd & Telep, 2010; Weisburd, David, Laura A. Wyckoff, Justin Ready, John E. Eck,
Joshua C. Hinkle, and Frank Gajewski, 2006).
Researchers have studied the role of opportunity and activity in a number of contexts and
settings. Jacob and Lefren (2003) study the short-term effect of extra school days on juvenile
crime. They find school supervision provides an incapacitative function -- property crime
decreases by 14 percent on days in which school is in session -- but school also serves to increase
juvenile interactions and thereby increases levels of violence. Overall, the authors find violent
crime increases by 28 percent during days in which school is in session.7 More generally, the
literature on the relationship between employment and crime (e.g. Brunette, 2002; Duwe, 2012)
hypothesizes unemployment may increase crime not only because it might drive people to illegal
sources of income, but also because employment keeps people occupied and away from criminal
activity.
III. Data and Analysis
A. Chicago Crime Reports.
The crime data we use is provided by the city of Chicago Data Portal extracted from the
Chicago Police Department's CLEAR (Citizen Law Enforcement Analysis and Reporting)
system.8 The dataset contains crimes that are reported to the police and includes data for all days
from January 2001 through December 2013. The data reflects all criminal incidents in which the
(http://www.politifact.com/georgia/statements/2011/jun/17/ray-lewis/ray-lewis-crime-claim-gets-flagged/). The organization rated it false, but it relied on admittedly small sample sizes and non-scientific studies. Criminologist James A. Fox also weighed in. Leveraging the fact that there is/are no NFL games the week before the Super Bowl, he compared crime during the week before the Super Bowl and the week of the Super Bowl in 2006, 2007, and 2008 and found no differences in crime. 7 Notably, we do not find a similar phenomenon at work in our study. While televised sports games generate congregations of individuals in groups, because they likely share support for the same team, these group encounters appear not to engender overall increases in aggressive behavior. 8 Available at: https://data.cityofchicago.org/Public-Safety/Crimes-2001-to-present/ijzp-q8t2;

police responded and completed a case report. The police may respond to a call but determine
that a crime has not occurred, in which case a report will not be completed (personal
communication, CPD Research & Development Division, April 25, 2014). We aggregated the
data into broad crime type categories: violent, property, drugs, and other using the classifications
provided by the Chicago Police Department (CPD).9 “Other” includes all crimes categorized as
“crimes against society” other than narcotics offenses.
There are some clear recording errors in the dataset with respect to the precise date and
time of an event. First, 12:00 a.m. and 12:00 p.m. of the first day of each month contains a
disproportionate number of crime reports. The data is recorded on these dates as a matter of
default when the time/day of the crime is unknown. We therefore exclude the first of every
month from our analyses. Second, crime reports on the hour are systematically higher than other
times. Again, these times are entered as a default when reporters cannot reasonably estimate the
exact time of the crime. Because we aggregate crime by the nearest half hour and compare the
same thirty-minute time blocks on sports game days relative to non-game days, this quirk does
not ultimately affect our analysis
For the game dates, start times, and other game information for NFL, NBA, and MLB
games, we collected schedules from sports-reference.com. For some sports games sports-
reference.com did not provide start times. In these instances we supplemented the schedule data
with cbssports.com. We analyze a total of 12 Super Bowl games, 186 Sunday Bears games, 18
Monday night Bears games (11 wins and 7 losses), 68 Bulls Playoff Games, 94 NBA Finals
games, 34 Cubs and White Sox playoff games, and 70 World Series games.
B. Research Design
To estimate the effect of sports games on crime we aggregate crime reports by the half
hour and compare half hour blocks before, after, and during a game to the same half-hour blocks
on the same day-of-week and in the same month. All analyses use this time-day-month fixed
effects design and include year dummy variables.10 Year dummies should not be needed for a
correct model specification, as we have no a priori reason to believe that the frequency of games
has changed systematically over the period of study. Nonetheless, because crime has
9 The list of crimes and their general categories – crimes against property, crimes against person, and crimes against society are listed at: http://gis.chicagopolice.org/clearmap/crime_types.html). 10 We have also run the analyses with year-month dummies. The results do not change in any significant way.

9
systematically decreased over the study period, we include a dummy variable for each year as a
precaution and as a means of increasing the efficiency of our estimators. Finally, because
holidays may affect both game scheduling and levels of crime, we exclude all major holidays
from the analysis. The models we estimate are of the following form:
𝐶𝑟𝑖𝑚𝑒𝑠= β0+ β1𝑆𝑡𝑎𝑡𝑢𝑠+ β2𝑀𝑜𝑛𝑡ℎ𝐷𝑎𝑦𝐻𝑜𝑢𝑟+ β3𝑌𝑒𝑎𝑟
where crimes is the number of crimes reported during a half hour time-block, status is a series of
indicators for the temporal relationship between the half hour time-block and a sports game (i.e.,
there is no game, the time-block is 3 hours before a game, 2.5 hours before a game, and so on
until 3 hours after a game), MonthDayHour is a set of indicator variables for each time-block,
and year is a series of dummy variables for the year.
The coefficients of interest are those on the dummy variables indicating the relationship
between a half-hour block and the start/end of a game. We do not have data on the official end
time of the games, but we estimate that most games other than the Super Bowl end
approximately three hours after beginning. There is some measurement error that will affect the
estimates near the beginning and ends of games. For example, we regard a game starting at 8:40
as having started at 8:30. In addition, some games last longer than three hours or go into
overtime. Coefficients on the half-hour blocks post game will therefore represent, in part, the
effect of overtime periods on crime.
We estimate our model using ordinary least squares regression. For each individual game
status coefficient we report heteroskedasticity-robust standard errors. For all joint significance
tests, we cluster standard errors by date, as crime during each half-hour time block is not
independent of crime during other time blocks on the same day (e.g., a particularly cold-weather
day could reduce crime in multiple half-hour blocks).
Percent estimates are derived from Poisson regression models. This is the standard model
used for count data with zeros in the outcome variable, which precludes using a log-linear model
(Nichols, 2010). The coefficient on each game status dummy variable can be translated into an
approximate percentage change by exp(beta) - 1 (Wooldridge, 2012). We also estimated negative
binomial models, which are used to address overdispersion. The estimates are not significantly
different than Poisson estimates, and we do not report them here.
More on Treatment and Control
Before presenting our results, it is important to clarify our research design and its

implications for interpretation. We leverage the exogenous infusion of television diversion
provided by sports games to test for the effect of entertainment on crime. Without such an
exogenous infusion, a simple regression of television viewership on rates of crime would likely
be subject to omitted variable bias -- many things, such as weather, likely affect both crime and
TV viewing. As we have argued above, the scheduling of major sporting events within a given
month, day, and time should, however, both affect TV viewership and be random with respect to
crime.
If the cost of data were not an impediment, we could directly measure, through Nielsen
ratings, the effect of sporting events on TV viewership, and then the effect of the spike in
viewership on crime.11 We do not currently have access to this data and thus estimate instead the
“reduced form.” The magnitude of this “reduced” effect will depend on two major factors: (1)
the popularity of the sporting event and (2) the popularity of TV programming during the
comparison days. What determines the magnitude of the diversion -- and ultimately the effects
we find -- depends on the additional viewership the game generates. This is driven in part by
game popularity: more popular games offer a stronger treatment “dose.” But the magnitude of
the diversion is also driven by our comparison or “control” days. Monday night Bears games
provide an estimate of the effect of Bears games relative to a Monday night NFL game in which
the local team is not playing. In this sense, the estimate as a measure of the effect of sports game
watching on crime rates is conservative -- it is an estimate of the effect of the additional
viewership generated by the Bears as compared to any other NFL game. In the case of the Super
Bowl, on the other hand, there are rarely other major television events in the month in which the
Super Bowl falls, and thus we are able to compare Super Bowl Sunday to “normal” television
programming on an average Sunday in February.
IV. Results
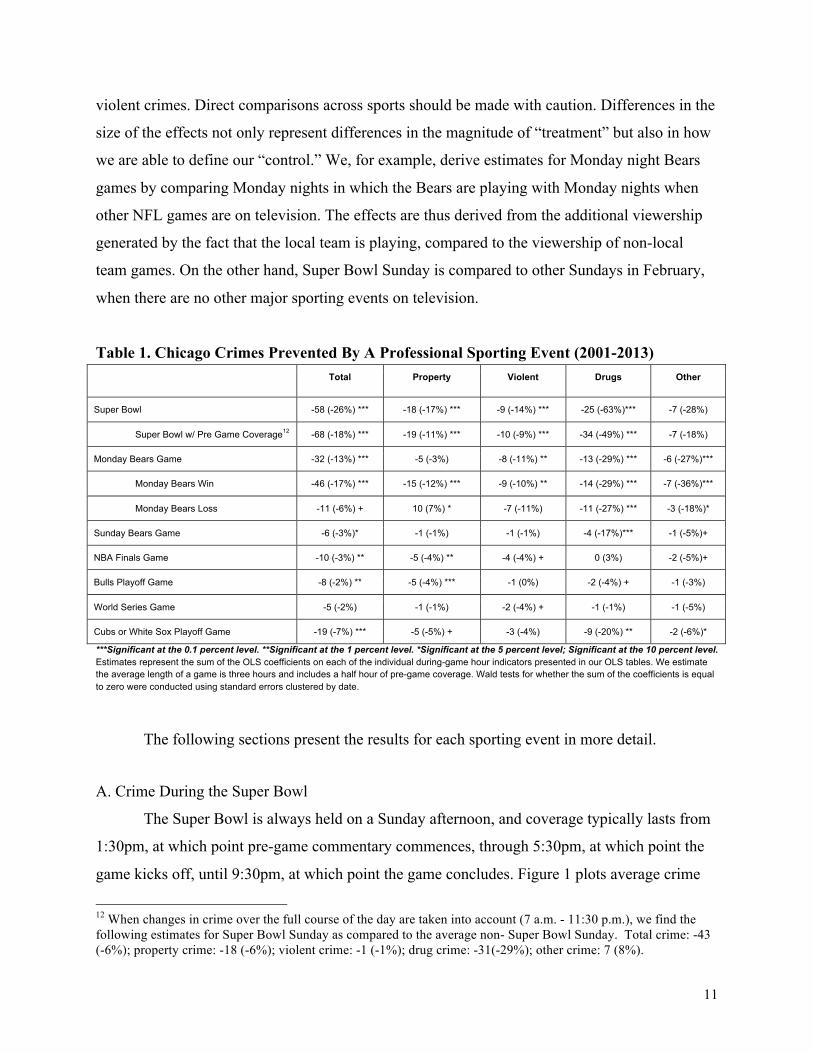
Table 1 summarizes the estimated reduction in crime during an average game for each
type of sporting event. It shows substantial and statistically significant effects for most sporting
events across all crime types. The drop in drug crimes is steeper than the drop in property or
11 Nielsen ratings are, however, an imperfect measure of TV viewership and particularly so with respect to sporting events. Ratings are based upon the number of televisions tuned to a given station. They do not account for multiple viewers watching a program on a single device. This is particularly problematic with respect to measuring televised sporting events given that many sports games are social events watched in groups.
11
violent crimes. Direct comparisons across sports should be made with caution. Differences in the
size of the effects not only represent differences in the magnitude of “treatment” but also in how
we are able to define our “control.” We, for example, derive estimates for Monday night Bears
games by comparing Monday nights in which the Bears are playing with Monday nights when
other NFL games are on television. The effects are thus derived from the additional viewership
generated by the fact that the local team is playing, compared to the viewership of non-local
team games. On the other hand, Super Bowl Sunday is compared to other Sundays in February,
when there are no other major sporting events on television.
Table 1. Chicago Crimes Prevented By A Professional Sporting Event (2001-2013)
Total Property Violent Drugs Other
Super Bowl -58 (-26%) *** -18 (-17%) *** -9 (-14%) *** -25 (-63%)*** -7 (-28%)
Super Bowl w/ Pre Game Coverage12 -68 (-18%) *** -19 (-11%) *** -10 (-9%) *** -34 (-49%) *** -7 (-18%)
Monday Bears Game -32 (-13%) *** -5 (-3%) -8 (-11%) ** -13 (-29%) *** -6 (-27%)***
Monday Bears Win -46 (-17%) *** -15 (-12%) *** -9 (-10%) ** -14 (-29%) *** -7 (-36%)***
Monday Bears Loss -11 (-6%) + 10 (7%) * -7 (-11%) -11 (-27%) *** -3 (-18%)*
Sunday Bears Game -6 (-3%)* -1 (-1%) -1 (-1%) -4 (-17%)*** -1 (-5%)+
NBA Finals Game -10 (-3%) ** -5 (-4%) ** -4 (-4%) + 0 (3%) -2 (-5%)+
Bulls Playoff Game -8 (-2%) ** -5 (-4%) *** -1 (0%) -2 (-4%) + -1 (-3%)
World Series Game -5 (-2%) -1 (-1%) -2 (-4%) + -1 (-1%) -1 (-5%)
Cubs or White Sox Playoff Game -19 (-7%) *** -5 (-5%) + -3 (-4%) -9 (-20%) ** -2 (-6%)* ***Significant at the 0.1 percent level. **Significant at the 1 percent level. *Significant at the 5 percent level; Significant at the 10 percent level. Estimates represent the sum of the OLS coefficients on each of the individual during-game hour indicators presented in our OLS tables. We estimate the average length of a game is three hours and includes a half hour of pre-game coverage. Wald tests for whether the sum of the coefficients is equal to zero were conducted using standard errors clustered by date.
The following sections present the results for each sporting event in more detail.
A. Crime During the Super Bowl
The Super Bowl is always held on a Sunday afternoon, and coverage typically lasts from
1:30pm, at which point pre-game commentary commences, through 5:30pm, at which point the
game kicks off, until 9:30pm, at which point the game concludes. Figure 1 plots average crime
12 When changes in crime over the full course of the day are taken into account (7 a.m. - 11:30 p.m.), we find the following estimates for Super Bowl Sunday as compared to the average non- Super Bowl Sunday. Total crime: -43 (-6%); property crime: -18 (-6%); violent crime: -1 (-1%); drug crime: -31(-29%); other crime: 7 (8%).

reports by the hour on Saturday night through Monday morning. The red line represents average
crime reports during non-Super Bowl weekends. The blue line represents the estimates of crime
on Super Bowl weekends. Average crime on Super Bowl Sunday is slightly higher before pre-
game coverage begins (four hours before the official start-time). This increase is driven primarily
by above-average drug and prostitution reports. Crime reports begin to decline during pre-game
coverage and are significantly lower until the end of the game, when they converge back to the
mean.
Figure 1
The Super Bowl regression results are presented in Table 2. The point estimate on each
indicator variable represents the estimated difference in crime reports between each half-hour
period on Super Bowl Sunday and the same half-hour periods on comparable non-Super Bowl
Sundays. In total, there are approximately 60 fewer crimes during the Super Bowl, which
represents a reduction of approximately 25 percent.
We find the largest drops during the Super Bowl game for drug crimes: there are over 60
percent fewer drug offenses reported during the Super Bowl. Violent and property crime are

13
down 15 to 20 percent during the Super Bowl game hours. There is, however, a spike in violent
crime after the game, which cancels out any reductions in violent crime found during the game.
Figure 2 shows the cumulative changes in each of these crime types over the course of Super
Bowl weekend. That is, the sum of the coefficients on the OLS models beginning at to through tN Table 2. Super Bowl Sunday: Crimes per Half-hour (OLS) ======================================================================================================= Total Property Violent Drugs Other (1) (2) (3) (4) (5) ------------------------------------------------------------------------------------------------------- 3.0 hrs pre -3.381*** (0.949) -0.680 (0.486) -0.852 (0.582) -1.345* (0.542) -0.364 (0.433) 2.5 hrs pre -2.417 (1.745) -0.418 (0.998) -0.314 (0.660) -1.854*** (0.484) -0.437 (0.559) 2.0 hrs pre -0.385 (1.250) -0.267 (0.892) 1.019 (0.601) -0.966 (0.602) -0.096 (0.358) 1.5 hrs pre -3.719 (2.548) -1.649 (1.161) 0.258 (1.319) -1.743** (0.534) -0.313 (0.459) 1.0 hrs pre -1.809* (0.842) -0.321 (1.045) -0.184 (0.508) -1.101** (0.385) -0.115 (0.326) 0.5 hrs pre -5.409** (1.929) -2.328 (1.357) -1.050 (0.947) -1.119** (0.418) -1.173** (0.425) Game 0-.5 hr -2.037 (1.489) 0.470 (1.048) -1.573** (0.566) -0.729 (0.681) -0.231 (0.539) Game .5-1 hr -4.349 (2.332) -2.912* (1.183) -1.201 (1.004) -0.897* (0.434) 0.568 (0.826) Game 1-1.5 hr -5.616*** (1.423) -2.121*** (0.623) -1.539* (0.701) -1.656*** (0.377) -0.181 (0.507) Game 1.5-2 hr -7.665*** (1.406) -2.146* (0.991) -0.599 (0.928) -3.949*** (0.508) -1.046* (0.520) Game 2-2.5 hr -6.813*** (1.204) -1.239 (0.827) -0.393 (0.696) -3.909*** (0.406) -0.729 (0.482) Game 2.5-3 hr -11.369*** (1.917) -4.464*** (1.176) -0.087 (1.079) -4.133*** (0.496) -2.461*** (0.379) Game 3-3.5 hr -6.757*** (1.496) 0.621 (1.462) -2.224** (0.765) -4.167*** (0.395) -0.923** (0.314) Game 3.5-4 hr -8.272*** (1.850) -3.384** (1.280) -0.226 (1.137) -4.222*** (0.502) -0.433 (0.538) 0.5 hrs post -1.823 (1.616) 0.290 (1.260) 1.300 (0.694) -2.744*** (0.509) -0.630 (0.418) 1.0 hrs post -3.186 (2.086) -2.558* (1.028) 2.404* (1.080) -2.614*** (0.505) -0.316 (0.742) 1.5 hrs post 0.338 (1.675) 1.123 (0.745) 0.353 (1.168) -1.731** (0.548) 0.572 (0.403) 2.0 hrs post -0.510 (1.312) -1.817* (0.719) 2.638* (1.179) -1.042 (0.670) -0.029 (0.382) ------------------------------------------------------------------------------------------------------- Notes: ***Significant at the 0.1 percent level. **Significant at the 1 percent level. *Significant at the 5 percent level. Figure 2

B. Local Chicago Team Games
For each of Chicago’s major professional sports team (the Bears (NFL), the White Sox
(MLB), the Cubs (MLB), and the Bulls (NBA)), in addition to looking at the general effect on
crime of a game, we also test for differential effects between home and away games and between
home team wins and losses. As noted in the literature review, previous literature suggests there
may be important differences across each of these categories. Rees and Schnepel (2009) show
that college football games may generate increases in crime for the hosting location. Card and
Dahl (2009), as well as Rees and Schnepel (2009), find games resulting in an unexpected win or
loss may increase frustration levels leading to rises in crime.
We find little evidence that wins or home games affect crime differently than losses or
away games. For none of the sports do we find differences between home and away games.
Insofar as home games may produce crime by concentrating individuals in and around stadiums,
the million plus people watching the games on television swamp whatever stadium effect there
may be. The relative importance of television viewership may explain the difference between our
findings and those of Rees and Schnepel (2009), who report increases in crime during college
games for hosting cities. Major professional sporting events generate a substantial number of
television viewers, whereas college games draw far fewer relative to their stadium crowds. We

15
also do not find differences in the magnitude of the effects for wins as compared to losses. The
only exception is Monday Night Chicago Bears games. Bears games do not generate notable pre
or post game effects, but the game-time reductions in crime are driven almost entirely by
winning games. In part, this may be a matter of noise: the Bears were fairly successful on
Monday nights in the last decade, so our sample size of losing games is only seven. In addition,
the substantial reductions in crime reports during games in which the Bears won, but not for
games in which the Bears lost, may be due to the fact that a good team both draws more viewers
and is likely to win. We thus present results for winning games and losing games separately.
Chicago Bears Games
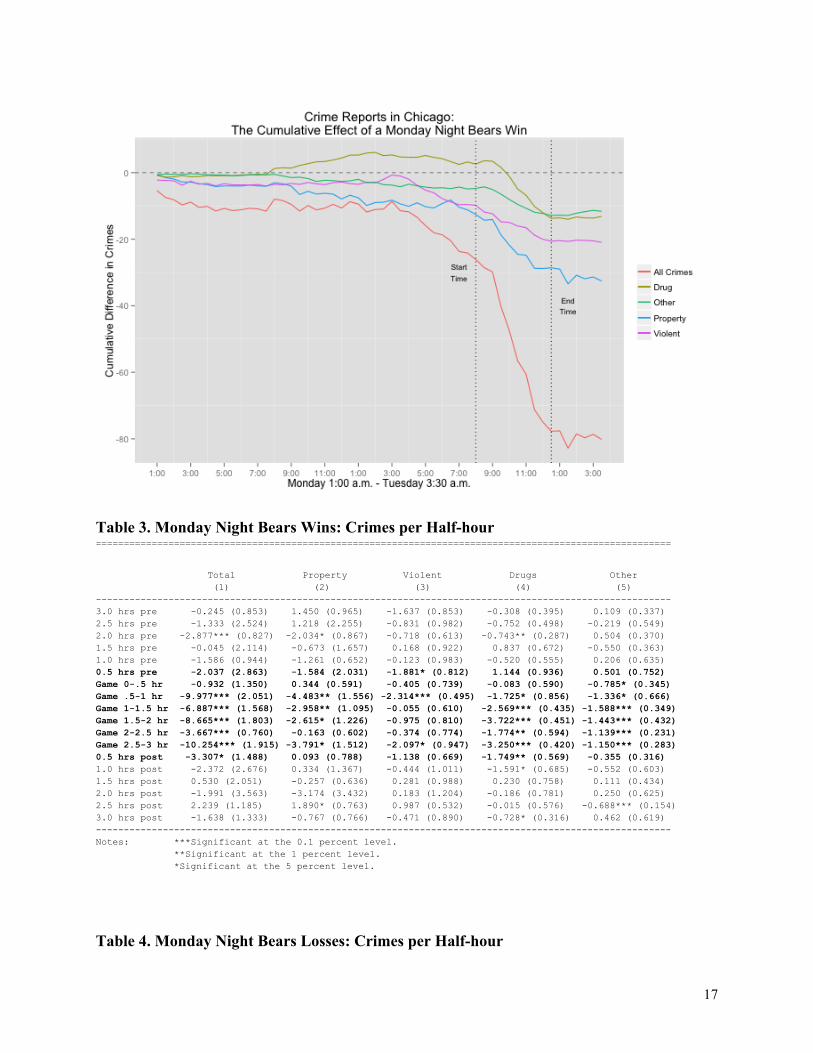
Figure 3 illustrates the model predictions for Monday night Bears games resulting in a
win compared to average crime reports trends over the course of a Monday in which the Bears
are not playing. There are close to 50 fewer crimes on average during these Monday night Bears
games as compared to nights without a Bears game; approximately 15 fewer property crimes on
these same nights, roughly 10 fewer violent crimes, and 15 fewer drug crimes. Figure 4 plots the
cumulative difference between Monday nights with a Bears win and Monday nights without a
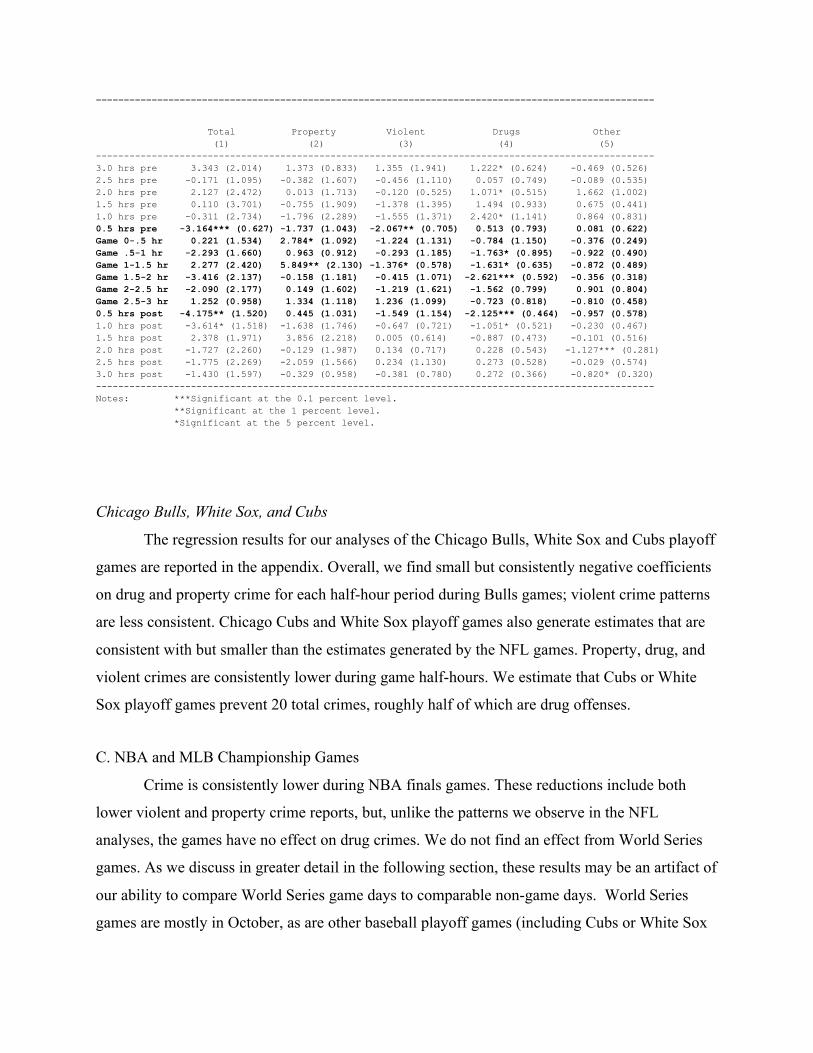
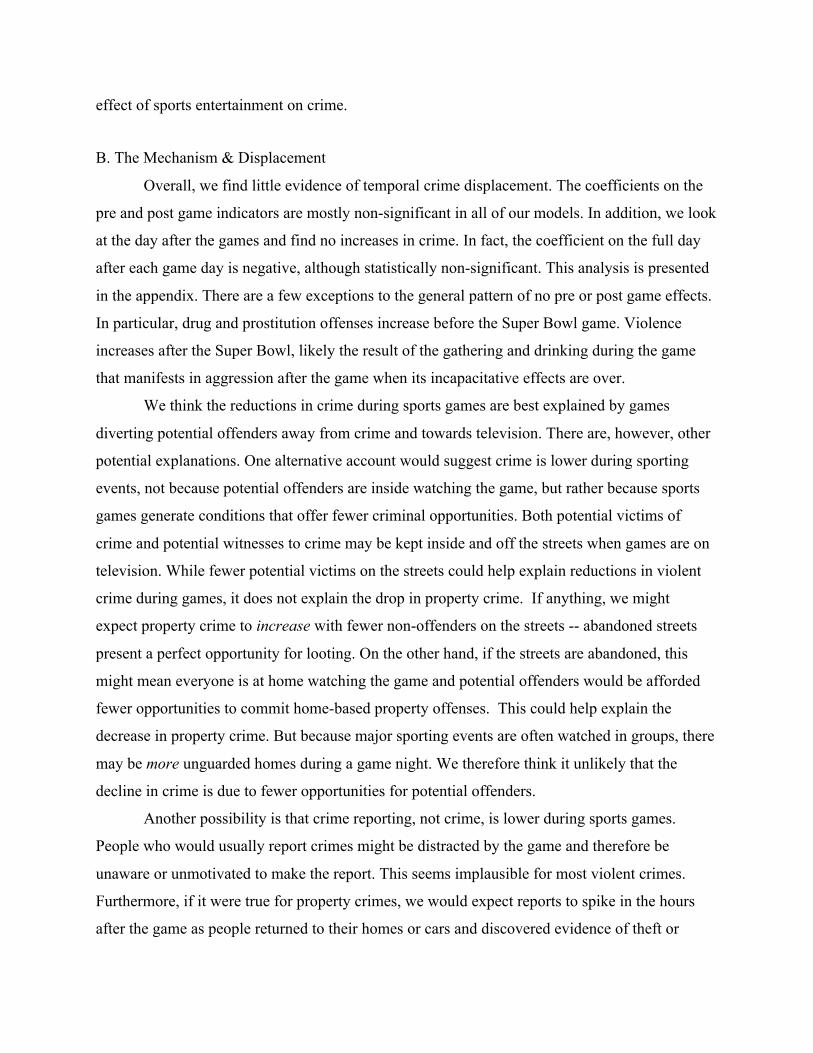
Bears game. Table 3 shows our OLS regression estimates for the NFL Bears games in which the
outcome was a win; table 4 presents the estimates for NFL Bear games in which the Bears lost.
We also run the analysis for Bears games on Sundays relative to Sundays without Bears games.
The aggregate reductions are presented in Table 1.
Figure 3
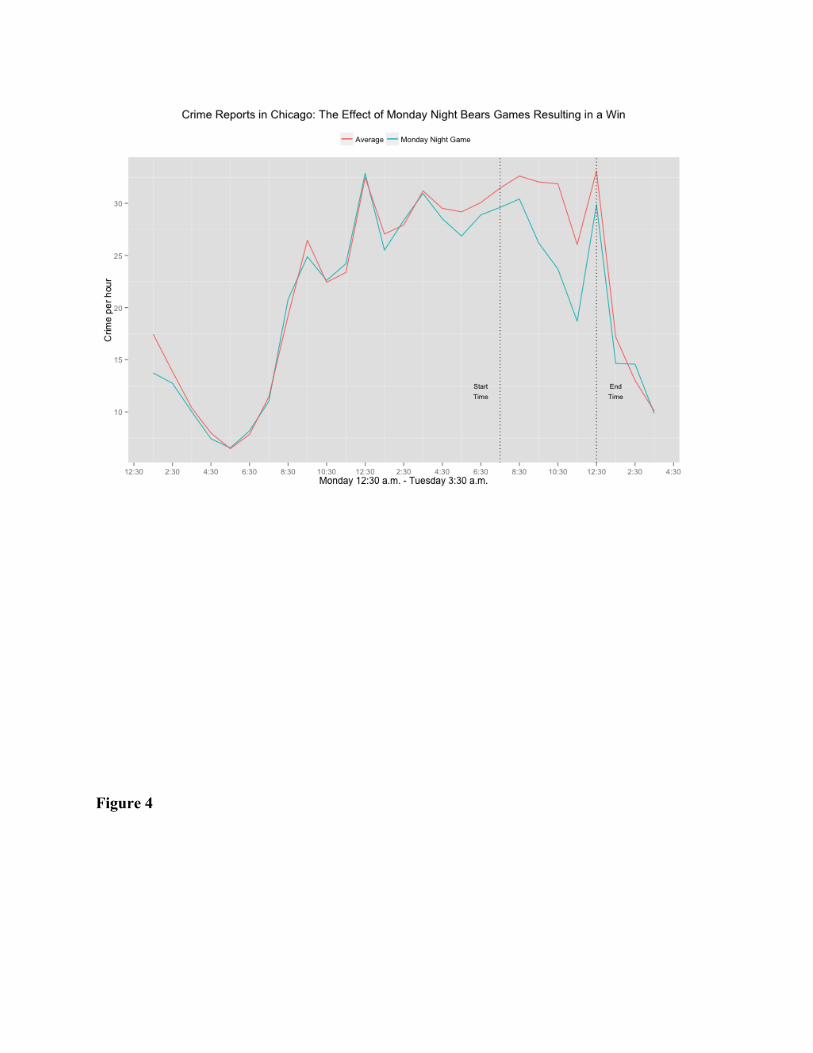
Figure 4
17
Table 3. Monday Night Bears Wins: Crimes per Half-hour ======================================================================================================= Total Property Violent Drugs Other (1) (2) (3) (4) (5) ------------------------------------------------------------------------------------------------------- 3.0 hrs pre -0.245 (0.853) 1.450 (0.965) -1.637 (0.853) -0.308 (0.395) 0.109 (0.337) 2.5 hrs pre -1.333 (2.524) 1.218 (2.255) -0.831 (0.982) -0.752 (0.498) -0.219 (0.549) 2.0 hrs pre -2.877*** (0.827) -2.034* (0.867) -0.718 (0.613) -0.743** (0.287) 0.504 (0.370) 1.5 hrs pre -0.045 (2.114) -0.673 (1.657) 0.168 (0.922) 0.837 (0.672) -0.550 (0.363) 1.0 hrs pre -1.586 (0.944) -1.261 (0.652) -0.123 (0.983) -0.520 (0.555) 0.206 (0.635) 0.5 hrs pre -2.037 (2.863) -1.584 (2.031) -1.881* (0.812) 1.144 (0.936) 0.501 (0.752) Game 0-.5 hr -0.932 (1.350) 0.344 (0.591) -0.405 (0.739) -0.083 (0.590) -0.785* (0.345) Game .5-1 hr -9.977*** (2.051) -4.483** (1.556) -2.314*** (0.495) -1.725* (0.856) -1.336* (0.666) Game 1-1.5 hr -6.887*** (1.568) -2.958** (1.095) -0.055 (0.610) -2.569*** (0.435) -1.588*** (0.349) Game 1.5-2 hr -8.665*** (1.803) -2.615* (1.226) -0.975 (0.810) -3.722*** (0.451) -1.443*** (0.432) Game 2-2.5 hr -3.667*** (0.760) -0.163 (0.602) -0.374 (0.774) -1.774** (0.594) -1.139*** (0.231) Game 2.5-3 hr -10.254*** (1.915) -3.791* (1.512) -2.097* (0.947) -3.250*** (0.420) -1.150*** (0.283) 0.5 hrs post -3.307* (1.488) 0.093 (0.788) -1.138 (0.669) -1.749** (0.569) -0.355 (0.316) 1.0 hrs post -2.372 (2.676) 0.334 (1.367) -0.444 (1.011) -1.591* (0.685) -0.552 (0.603) 1.5 hrs post 0.530 (2.051) -0.257 (0.636) 0.281 (0.988) 0.230 (0.758) 0.111 (0.434) 2.0 hrs post -1.991 (3.563) -3.174 (3.432) 0.183 (1.204) -0.186 (0.781) 0.250 (0.625) 2.5 hrs post 2.239 (1.185) 1.890* (0.763) 0.987 (0.532) -0.015 (0.576) -0.688*** (0.154) 3.0 hrs post -1.638 (1.333) -0.767 (0.766) -0.471 (0.890) -0.728* (0.316) 0.462 (0.619) ------------------------------------------------------------------------------------------------------- Notes: ***Significant at the 0.1 percent level. **Significant at the 1 percent level. *Significant at the 5 percent level. Table 4. Monday Night Bears Losses: Crimes per Half-hour
==================================================================================================== Total Property Violent Drugs Other (1) (2) (3) (4) (5) ---------------------------------------------------------------------------------------------------- 3.0 hrs pre 3.343 (2.014) 1.373 (0.833) 1.355 (1.941) 1.222* (0.624) -0.469 (0.526) 2.5 hrs pre -0.171 (1.095) -0.382 (1.607) -0.456 (1.110) 0.057 (0.749) -0.089 (0.535) 2.0 hrs pre 2.127 (2.472) 0.013 (1.713) -0.120 (0.525) 1.071* (0.515) 1.662 (1.002) 1.5 hrs pre 0.110 (3.701) -0.755 (1.909) -1.378 (1.395) 1.494 (0.933) 0.675 (0.441) 1.0 hrs pre -0.311 (2.734) -1.796 (2.289) -1.555 (1.371) 2.420* (1.141) 0.864 (0.831) 0.5 hrs pre -3.164*** (0.627) -1.737 (1.043) -2.067** (0.705) 0.513 (0.793) 0.081 (0.622) Game 0-.5 hr 0.221 (1.534) 2.784* (1.092) -1.224 (1.131) -0.784 (1.150) -0.376 (0.249) Game .5-1 hr -2.293 (1.660) 0.963 (0.912) -0.293 (1.185) -1.763* (0.895) -0.922 (0.490) Game 1-1.5 hr 2.277 (2.420) 5.849** (2.130) -1.376* (0.578) -1.631* (0.635) -0.872 (0.489) Game 1.5-2 hr -3.416 (2.137) -0.158 (1.181) -0.415 (1.071) -2.621*** (0.592) -0.356 (0.318) Game 2-2.5 hr -2.090 (2.177) 0.149 (1.602) -1.219 (1.621) -1.562 (0.799) 0.901 (0.804) Game 2.5-3 hr 1.252 (0.958) 1.334 (1.118) 1.236 (1.099) -0.723 (0.818) -0.810 (0.458) 0.5 hrs post -4.175** (1.520) 0.445 (1.031) -1.549 (1.154) -2.125*** (0.464) -0.957 (0.578) 1.0 hrs post -3.614* (1.518) -1.638 (1.746) -0.647 (0.721) -1.051* (0.521) -0.230 (0.467) 1.5 hrs post 2.378 (1.971) 3.856 (2.218) 0.005 (0.614) -0.887 (0.473) -0.101 (0.516) 2.0 hrs post -1.727 (2.260) -0.129 (1.987) 0.134 (0.717) 0.228 (0.543) -1.127*** (0.281) 2.5 hrs post -1.775 (2.269) -2.059 (1.566) 0.234 (1.130) 0.273 (0.528) -0.029 (0.574) 3.0 hrs post -1.430 (1.597) -0.329 (0.958) -0.381 (0.780) 0.272 (0.366) -0.820* (0.320) ---------------------------------------------------------------------------------------------------- Notes: ***Significant at the 0.1 percent level. **Significant at the 1 percent level. *Significant at the 5 percent level.
Chicago Bulls, White Sox, and Cubs
The regression results for our analyses of the Chicago Bulls, White Sox and Cubs playoff
games are reported in the appendix. Overall, we find small but consistently negative coefficients
on drug and property crime for each half-hour period during Bulls games; violent crime patterns
are less consistent. Chicago Cubs and White Sox playoff games also generate estimates that are
consistent with but smaller than the estimates generated by the NFL games. Property, drug, and
violent crimes are consistently lower during game half-hours. We estimate that Cubs or White
Sox playoff games prevent 20 total crimes, roughly half of which are drug offenses.
C. NBA and MLB Championship Games
Crime is consistently lower during NBA finals games. These reductions include both
lower violent and property crime reports, but, unlike the patterns we observe in the NFL
analyses, the games have no effect on drug crimes. We do not find an effect from World Series
games. As we discuss in greater detail in the following section, these results may be an artifact of
our ability to compare World Series game days to comparable non-game days. World Series
games are mostly in October, as are other baseball playoff games (including Cubs or White Sox

19
games). We are thus comparing one “treatment dosage” to another, and this may explain why
we do not find reductions in crime during World Series games. The regression output for the
NBA championships and World Series are included in the appendix.
V. Discussion
A. Summary
The results presented above demonstrate clear reductions in violent, property, and drug
crime reports in Chicago during the hours in which important sporting events are on television.
Moreover, as we discuss in greater detail below, the hours before and after a game do not
generally result in offsetting increases in crime. Thus, at least in the short term, major televised
sports games produce real declines in crime.
The differences in the magnitude of the effects we find can be partially understood in
relation to the “treatment,” that is, the television entertainment provided by a game. A more
popular game, such as the Super Bowl, offers a stronger “dose.” The sizes of the effects we find
generally correspond with game popularity. The Super Bowl, by far the most watched TV event,
generates the largest crime reductions. TV ratings in Chicago indicate that local team NFL
games, while less popular than the Super Bowl, are still significantly more popular than either
the NBA or the MLB. But in addition to differences in treatment dosage, the days to which we
compare each sporting event (our “controls”) also differ in terms of their treatment dosage. In
other words, some sporting events are compared to days in which other sporting events are on
television.
The fact that some of our control days are “partially treated” by the television airing of
non-local team games likely also explains some of the differences in the magnitude of effects we
find. Sunday football games are, for example, consistently among the most watched television
programs; fans frequently dedicate their Sundays to watching NFL games, whether or not their
home team is playing. As such, Sunday Bears games may draw in only a small extra number of
Chicago viewers. Similarly, our estimates of the effect of NBA and MLB playoffs rely on the
additional viewership generated by local team playoff games relative to playoff games in which
the local team is not playing. Likewise, Monday night Bears games are compared to Monday
nights airing non-local NFL team games. Because some share of local team sports fans also
watch the season games in which their team is not playing, our estimates likely understate the
effect of sports entertainment on crime.
B. The Mechanism & Displacement
Overall, we find little evidence of temporal crime displacement. The coefficients on the
pre and post game indicators are mostly non-significant in all of our models. In addition, we look
at the day after the games and find no increases in crime. In fact, the coefficient on the full day
after each game day is negative, although statistically non-significant. This analysis is presented
in the appendix. There are a few exceptions to the general pattern of no pre or post game effects.
In particular, drug and prostitution offenses increase before the Super Bowl game. Violence
increases after the Super Bowl, likely the result of the gathering and drinking during the game
that manifests in aggression after the game when its incapacitative effects are over.
We think the reductions in crime during sports games are best explained by games
diverting potential offenders away from crime and towards television. There are, however, other
potential explanations. One alternative account would suggest crime is lower during sporting
events, not because potential offenders are inside watching the game, but rather because sports
games generate conditions that offer fewer criminal opportunities. Both potential victims of
crime and potential witnesses to crime may be kept inside and off the streets when games are on
television. While fewer potential victims on the streets could help explain reductions in violent
crime during games, it does not explain the drop in property crime. If anything, we might
expect property crime to increase with fewer non-offenders on the streets -- abandoned streets
present a perfect opportunity for looting. On the other hand, if the streets are abandoned, this
might mean everyone is at home watching the game and potential offenders would be afforded
fewer opportunities to commit home-based property offenses. This could help explain the
decrease in property crime. But because major sporting events are often watched in groups, there
may be more unguarded homes during a game night. We therefore think it unlikely that the
decline in crime is due to fewer opportunities for potential offenders.
Another possibility is that crime reporting, not crime, is lower during sports games.
People who would usually report crimes might be distracted by the game and therefore be
unaware or unmotivated to make the report. This seems implausible for most violent crimes.
Furthermore, if it were true for property crimes, we would expect reports to spike in the hours
after the game as people returned to their homes or cars and discovered evidence of theft or

21
vandalism. We find no evidence of such spikes in reporting.
Finally, it is possible that crime reports are lower because law enforcement officials,
rather than making arrests, are busy watching or listening to the game. This is an unlikely
explanation for the consistent declines we find in all crime categories during sports games. We
would expect most property and violent crimes to be reported by the citizenry and not generally
subject to police discretion. On the other hand, police discretion may well explain the
particularly large reductions in drug crimes that we find during sports games. The discretionary
nature of drug law policing is well known (Skogan & Frydl, 2004). Drug crimes, like all
“victimless” crimes, are rarely reported to police and are therefore, in significant part, the
product of enforcement priorities and proactive targeting rather than a reflection of changes in
drug supply or use (Warner & Coomer, 2003). While it is likely the declines in drug offenses
during games are, at least in good part, explained by fewer individuals on the streets engaging in
drug activity, the drug effects above and beyond what we see for other crimes may well be
explained by the failure of police to pursue drug activity because they are themselves distracted
by the game. In summary, we think the most plausible explanation is that potential offenders are
diverted from crime by the televised airing of sports games.
VI. Conclusion
The fact that we find significant reductions in crime during televised sports games
implies some individuals trade off participating in criminal activity for watching sports. This
lends support to theories of crime that suggest some share of criminal behavior is recreational
and opportunistic. If crime is not predetermined and calculated but rather is itself a form of
recreation, the drops we find are not surprising -- they represent the substitution of one
diversionary activity for another. The absence of significant short-term temporal displacement
underscores the importance of the immediate situation or context as determinants of crime.
While we don’t know about idle hands, our paper suggests that idle eyes are the devil’s
playground.
Our findings speak not only to theories of criminal behavior but also have important
practical implications. First, our results are relevant to the debate over the effects of
entertainment on crime. While it has been suggested that the proliferation of modern technology
(e.g., the internet, TV, video games) may play a crime-reducing role by diverting individuals

who might otherwise be at risk of engaging in criminal activity (e.g. Zimring & Hawkins, 1997),
the idea has been subjected to relatively little empirical testing. We find strong evidence that
entertainment, specifically the entertainment provided by televised sports games, can reduce
criminal activity. The debate surrounding the effect of media on criminal behavior has been too
narrowly focused on the psychological link between violent entertainment and aggression.
Whatever short-term aggression-inducing effects movies, television, or video games have may
be negligible in comparison to their diversionary power.
Our findings are also relevant to more immediate and narrow issues. For example, our
results have implications for the current debate over whether to expand the NFL season and/or
increase the number of weeknight games. If other weeknight games generate crime reductions
similar to Monday night games and long-term crime displacement isn’t complete, additional
game nights may have social benefits. Finally, most major sports seasons are played during low-
crime winter months rather than in the summer when crime is substantially higher (roughly 30
percent in Chicago). Sporting events aired in the summer -- traditionally a time of reruns and
second-rate television -- could generate real crime savings.
23
References Adachi, Paul JC, and Teena Willoughby. "The Effect of Video Game Competition and Violence on Aggressive Behavior: Which Characteristic has the Greatest Influence?." Psychology of Violence 1.4 (2011): 259. Anderson, Craig A, and Brad J Bushman. "Effects of Violent Video Games on Aggressive Behavior, Aggressive Cognition, Aggressive Affect, Physiological Arousal, and Prosocial Behavior: A Meta-Analytic Review of the Scientific Literature." Psychological science 12, no. 5 (2001): 353-59. ———. "The Effects of Media Violence on Society." Science 295.5564 (2002): 2377-2379. Anderson, Craig A. "An Update on the Effects of Playing Violent Video Games."Journal of Adolescence 27.1 (2004): 113-122. ———. "Media Violence and the American Public Revisited." (2002). Baumann, Robert, Taylor Ciavarra, Bryan Englehardt, and Victor A Matheson. "Sports Franchises, Events, and City Livability: An Examination of Spectator Sports and Crime Rates." The Economic and Labour Relations Review 23, no. 2 : 83-97. (2012). Braga, Anthony A., Andrew V. Papachristos, and David M. Hureau. "The effects of hot spots policing on crime: An updated systematic review and meta-analysis." Justice Quarterly ahead-of-print (2012): 1-31. Burnett, John. Idle Hands: The Experience of Unemployment, 1790-1990. Routledge (2002). Clarke, Ronald. Situational Crime Prevention. Criminal Justice Press. (1997). Cunningham, A. Scott, Benjamin Engelstätter, and Michael R. Ward. “Understanding the effects of violent video games on violent crime.” No. 11-042. ZEW Discussion Papers, (2011). Dahl, Gordon, and Stefano DellaVigna. "Does movie violence increase violent crime?." The Quarterly Journal of Economics 124.2 (2009): 677-734. Duwe, Grant. "The benefits of keeping idle hands busy: The impact of a prisoner reentry employment program on post-release employment and offender recidivism." Crime & Delinquency (2012). Jacob, Brian, Lars Lefgren, and Enrico Moretti. “The Dynamics of Criminal Behaviour: Evidence from Weather Shocks,” Journal of Human Resources, 42, 489-527. (2007)

Kirby, Stuart, Brian Francis, and Rosalie O’Flaherty. "Can the FIFA World Cup Football (Soccer) Tournament be Associated with an Increase in Domestic Abuse?." Journal of Research in Crime and Delinquency . (2013) Marie, Olivier. “Police and Thieves in the Stadium: Measuring the (Multiple) Effects of Football Matches on Crime.” Research centre for education and the Labour Market (ROA), Faculty of Economics and Business Administration, Maastricht University (2010). Nichols, A. Regression for Nonnegative Skewed Dependent Variables. BOS10 Stata Conference 2, Stata Users Group, July 15–16, in Boston, United States of America. (2010). Rees, Daniel I, and Kevin T Schnepel. "College Football Games and Crime." Journal of Sports Economics 10, no. 1 (2009): 68-87. Skogan, Wesley, and Kathleen Frydl, eds. Fairness and effectiveness in policing: the evidence. National Academies Press. (2004). Uhlmann, Eric, and Jane Swanson. "Exposure to Violent Video Games Increases Automatic Aggressiveness." Journal of adolescence 27, no. 1 (2004): 41-52. Ward, Michael R. "Video games and crime." Contemporary Economic Policy29.2 (2011): 261-273. Warner, Barbara D., and Brandi Wilson Coomer. "Neighborhood drug arrest rates: are they a meaningful indicator of drug activity? A research note." Journal of Research in Crime and Delinquency 40, no. 2 (2003): 123-138. Weisburd, David, Laura A. Wyckoff, Justin Ready, John E. Eck, Joshua C. Hinkle, and Frank Gajewski. "Does Crime Just Move Around The Corner? A Controlled Study of Spatial Displacement and Diffusion Of Crime Control Benefits." Criminology 44, no. 3 (2006): 549-592. Wooldridge, Jeffrey. Introductory Econometrics: A Modern Approach. Cengage Learning. (2012). Zimring, Franklin E, and Gordon Hawkins. Crime Is Not the Problem: Lethal Violence in America. Oxford University Press New York. (1997).

25
Appendix Supplementary OLS Models: Table 5. Bulls Playoff Games: Crimes per Half-hour ============================================================================================= Total Property Violent Drugs Other (1) (2) (3) (4) (5) --------------------------------------------------------------------------------------------- 3.0 hrs pre -0.055 (0.784) 0.530 (0.483) -0.530 (0.478) -0.048 (0.214) -0.119 (0.208) 2.5 hrs pre -0.202 (0.577) -0.463 (0.358) -0.515 (0.325) 0.284 (0.211) 0.412** (0.159) 2.0 hrs pre -0.460 (0.732) 0.266 (0.549) -0.434 (0.417) -0.307 (0.221) 0.035 (0.202) 1.5 hrs pre 0.155 (0.618) -0.244 (0.342) 0.030 (0.372) 0.361 (0.225) -0.192 (0.172) 1.0 hrs pre 0.236 (0.793) -0.214 (0.466) 0.540 (0.365) -0.038 (0.250) -0.208 (0.207) 0.5 hrs pre -0.285 (0.701) -0.226 (0.408) -0.227 (0.365) 0.062 (0.244) -0.056 (0.204) Game 0-.5 hr -0.213 (0.732) -1.053* (0.532) 0.604 (0.428) -0.006 (0.273) 0.171 (0.218) Game .5-1 hr -0.917 (0.618) -0.255 (0.398) -0.384 (0.324) -0.324 (0.245) -0.108 (0.183) Game 1-1.5 hr -1.764** (0.626) -1.085* (0.428) -0.120 (0.418) -0.502 (0.304) -0.116 (0.220) Game 1.5-2 hr -1.139 (0.709) -0.304 (0.427) -0.605 (0.355) -0.134 (0.276) -0.009 (0.236) Game 2-2.5 hr -1.326 (0.772) -0.909* (0.421) 0.172 (0.495) -0.446 (0.316) -0.205 (0.241) Game 2.5-3 hr -0.451 (0.695) -0.344 (0.450) 0.580 (0.450) -0.391 (0.255) -0.420 (0.237) 0.5 hrs post -1.725 (0.910) -0.725 (0.509) -0.659 (0.489) -0.171 (0.324) -0.249 (0.233) 1.0 hrs post -1.034 (0.733) -0.056 (0.477) -0.753* (0.317) 0.065 (0.273) -0.167 (0.178) 1.5 hrs post -0.197 (0.904) -0.425 (0.540) 0.200 (0.439) 0.036 (0.316) -0.081 (0.240) 2.0 hrs post -0.502 (0.606) -0.577 (0.429) -0.011 (0.346) 0.051 (0.242) 0.005 (0.159) 2.5 hrs post -1.822 (1.131) -1.424 (0.764) -0.193 (0.464) -0.035 (0.244) -0.319 (0.214) 3.0 hrs post 0.848 (0.623) 0.431 (0.405) 0.188 (0.315) 0.266 (0.197) -0.025 (0.142) --------------------------------------------------------------------------------------------- Notes: ***Significant at the 0.1 percent level. **Significant at the 1 percent level. *Significant at the 5 percent level. Table 6. MLB Playoffs: Crimes per Half-hour ================================================================================================= Total Property Violent Drugs Other (1) (2) (3) (4) (5) ------------------------------------------------------------------------------------------------- 3.0 hrs pre -2.064 (1.417) -1.493* (0.711) -0.261 (0.682) -0.074 (0.827) -0.223 (0.253) 2.5 hrs pre -1.871 (1.124) -1.049 (0.699) 0.429 (0.534) -0.361 (0.739) -0.669** (0.210) 2.0 hrs pre -0.243 (1.557) 0.613 (0.800) -0.085 (0.760) 0.047 (0.893) -0.283 (0.274) 1.5 hrs pre -1.993 (1.019) -1.679** (0.643) 0.039 (0.564) -0.074 (0.664) 0.088 (0.283) 1.0 hrs pre 1.319 (1.369) 1.058 (0.853) -0.587 (0.698) 0.765 (1.068) 0.214 (0.372) 0.5 hrs pre -1.062 (1.336) -1.263 (0.791) -0.037 (0.577) -0.016 (0.425) 0.351 (0.280) Game 0-.5 hr -2.210 (1.484) -1.382 (1.064) -0.428 (0.684) -0.840 (0.579) 0.258 (0.355) Game .5-1 hr -2.552* (1.281) -1.460 (0.792) -0.005 (0.599) -0.664 (0.765) -0.365 (0.226) Game 1-1.5 hr -1.636 (1.377) -0.324 (0.911) -0.632 (0.569) -0.687 (0.781) -0.131 (0.347) Game 1.5-2 hr -2.560 (1.357) -0.619 (0.637) -0.518 (0.767) -1.687* (0.726) 0.131 (0.345) Game 2-2.5 hr -3.483** (1.234) -0.487 (0.849) -0.645 (0.669) -1.562** (0.531) -0.722** (0.268) Game 2.5-3 hr -3.655** (1.121) -0.879 (0.626) -0.062 (0.705) -1.847*** (0.557) -0.904** (0.275) 0.5 hrs post -1.883 (1.144) 1.236 (0.791) -0.731 (0.775) -1.776*** (0.445) -0.463 (0.304) 1.0 hrs post -0.363 (1.119) -0.129 (0.759) 0.991 (0.598) -1.319** (0.444) 0.023 (0.381) 1.5 hrs post 1.568 (1.273) 0.410 (0.733) 1.019 (0.675) -0.009 (0.391) 0.049 (0.391) 2.0 hrs post 0.364 (0.861) 0.942 (0.604) 0.949 (0.624) -0.929** (0.344) -0.316 (0.349) 2.5 hrs post -0.234 (1.466) -0.660 (0.994) 1.016 (0.612) -0.065 (0.390) -0.505 (0.375) 3.0 hrs post 0.680 (1.154) -0.011 (0.770) 0.604 (0.615) -0.242 (0.334) 0.329 (0.369) ------------------------------------------------------------------------------------------------- Notes: ***Significant at the 0.1 percent level. **Significant at the 1 percent level. *Significant at the 5 percent level.

Table 7. NBA Finals Games: Crimes per Half-hour ================================================================================================ Total Property Violent Drugs Other (1) (2) (3) (4) (5) ------------------------------------------------------------------------------------------------ 3.0 hrs pre 0.206 (0.719) 0.166 (0.501) -0.427 (0.407) -0.138 (0.190) 0.456* (0.207) 2.5 hrs pre -0.245 (0.682) -0.205 (0.449) -0.099 (0.426) 0.423* (0.193) -0.257 (0.149) 2.0 hrs pre -0.027 (0.803) -0.133 (0.591) 0.071 (0.384) -0.039 (0.238) 0.028 (0.232) 1.5 hrs pre -0.706 (0.654) -0.131 (0.482) -0.330 (0.353) -0.156 (0.253) 0.115 (0.178) 1.0 hrs pre -2.116* (0.829) -0.500 (0.548) -0.545 (0.440) -0.264 (0.266) -0.544* (0.227) 0.5 hrs pre -0.222 (0.720) -0.049 (0.437) -0.622 (0.420) 0.237 (0.287) 0.086 (0.231) Game 0-.5 hr 0.047 (0.737) 0.090 (0.545) -0.350 (0.421) 0.217 (0.311) -0.144 (0.250) Game .5-1 hr -0.989 (0.694) -0.561 (0.353) -0.212 (0.430) 0.121 (0.264) -0.291 (0.220) Game 1-1.5 hr -1.096 (0.906) 0.130 (0.517) -0.621 (0.465) -0.212 (0.335) -0.504* (0.227) Game 1.5-2 hr -0.650 (0.748) -0.441 (0.426) -0.342 (0.429) 0.315 (0.288) -0.249 (0.192) Game 2-2.5 hr -1.820 (0.967) -0.908 (0.562) -0.628 (0.478) -0.217 (0.336) 0.017 (0.270) Game 2.5-3 hr -2.638*** (0.762) -1.412** (0.484) -0.898* (0.457) 0.089 (0.273) -0.267 (0.232) 0.5 hrs post -2.582** (0.796) -1.626** (0.551) -0.348 (0.489) -0.153 (0.300) -0.345 (0.194) 1.0 hrs post -0.392 (0.643) -0.376 (0.377) -0.260 (0.442) -0.029 (0.229) 0.266 (0.198) 1.5 hrs post -0.687 (1.315) -0.237 (0.913) -0.822 (0.486) 0.202 (0.247) 0.374 (0.252) 2.0 hrs post -1.097 (0.926) 0.056 (0.586) -0.972* (0.436) 0.080 (0.197) -0.097 (0.191) 2.5 hrs post -0.828 (0.813) -0.215 (0.541) -1.017* (0.446) 0.145 (0.166) 0.101 (0.186) 3.0 hrs post -0.353 (0.572) -0.396 (0.328) -0.329 (0.414) 0.495** (0.169) -0.107 (0.142) ------------------------------------------------------------------------------------------------ Notes: ***Significant at the 0.1 percent level. **Significant at the 1 percent level. *Significant at the 5 percent level. Table 8. World Series: Crimes per Half-hour ============================================================================================= Total Property Violent Drugs Other (1) (2) (3) (4) (5) --------------------------------------------------------------------------------------------- 3.0 hrs pre -0.222 (0.675) 0.226 (0.393) 0.237 (0.364) -0.557 (0.285) -0.241 (0.173) 2.5 hrs pre -0.862 (0.628) -0.105 (0.412) -0.610 (0.395) -0.388 (0.267) 0.051 (0.201) 2.0 hrs pre 0.203 (0.664) 0.544 (0.510) -0.585 (0.389) 0.049 (0.326) 0.187 (0.206) 1.5 hrs pre -0.808 (0.760) -0.399 (0.489) -0.345 (0.408) -0.164 (0.254) 0.180 (0.167) 1.0 hrs pre -0.305 (0.799) 0.060 (0.527) 0.083 (0.383) -0.200 (0.233) -0.411* (0.172) 0.5 hrs pre -0.252 (0.871) 0.107 (0.596) -0.125 (0.393) 0.235 (0.274) -0.305 (0.191) Game 0-.5 hr -0.517 (0.815) -0.389 (0.603) -0.012 (0.417) 0.071 (0.269) -0.059 (0.195) Game .5-1 hr -0.573 (0.800) -0.310 (0.541) -0.302 (0.364) -0.212 (0.322) -0.097 (0.246) Game 1-1.5 hr 0.174 (0.877) 0.843 (0.480) -0.464 (0.411) -0.064 (0.329) -0.243 (0.234) Game 1.5-2 hr -0.752 (0.949) -0.050 (0.561) -0.456 (0.401) -0.352 (0.326) -0.059 (0.235) Game 2-2.5 hr -1.487 (0.902) -0.675 (0.559) -0.229 (0.439) -0.404 (0.369) -0.188 (0.184) Game 2.5-3 hr -0.533 (0.943) 0.423 (0.606) -0.545 (0.467) -0.170 (0.396) -0.303 (0.199) 0.5 hrs post -1.168 (0.889) -0.787 (0.490) -0.355 (0.389) -0.205 (0.364) 0.025 (0.214) 1.0 hrs post 0.214 (0.758) 0.422 (0.498) 0.122 (0.371) -0.212 (0.274) -0.098 (0.189) 1.5 hrs post -1.671* (0.754) 0.248 (0.483) -1.063** (0.353) -0.689* (0.279) -0.051 (0.186) 2.0 hrs post 0.140 (1.068) 0.944 (0.753) -0.121 (0.376) -0.474* (0.214) -0.052 (0.187) 2.5 hrs post -1.074 (1.041) -0.408 (0.750) 0.226 (0.396) -0.458* (0.203) -0.303 (0.209) 3.0 hrs post 0.332 (0.815) 1.117 (0.597) -0.546 (0.392) 0.016 (0.212) -0.124 (0.198) --------------------------------------------------------------------------------------------- Notes: ***Significant at the 0.1 percent level. **Significant at the 1 percent level. *Significant at the 5 percent level.

27
Day After Analysis: Table 9. Super Bowl Day After Analysis Estimate Std. Error t value Pr(>|t|) postgame -38.90 41.71 -0.933 0.354088 Year2003 -22.17 76.54 -0.290 0.772925 Year2004 -90.87 77.12 -1.178 0.242499 Year2005 -147.49 74.83 -1.971 0.052529 . Year2006 -119.99 74.83 -1.603 0.113166 Year2007 -299.99 74.83 -4.009 0.000146 *** Year2008 -169.31 76.54 -2.212 0.030090 * Year2009 -238.44 77.12 -3.092 0.002816 ** Year2010 -314.41 78.77 -3.992 0.000155 *** Year2011 -407.36 74.83 -5.444 6.68e-07 *** Year2012 -454.40 73.48 -6.184 3.26e-08 *** Year2013 -413.17 76.54 -5.398 8.00e-07 ** Table 10. Monday Night NFL Games Day After Analysis postgame -31.74 37.49 -0.846 0.398166 Year2002 -33.11 45.64 -0.726 0.468847 Year2003 -70.83 44.81 -1.581 0.115280 Year2004 -145.55 44.33 -3.283 0.001183 ** Year2005 -137.70 45.25 -3.043 0.002610 ** Year2006 -147.91 44.47 -3.326 0.001023 ** Year2007 -163.28 44.81 -3.644 0.000331 *** Year2008 -219.03 44.81 -4.888 1.89e-06 *** Year2009 -305.51 45.30 -6.745 1.18e-10 *** Year2010 -372.53 44.47 -8.376 4.98e-15 *** Year2011 -404.18 45.25 -8.931 < 2e-16 *** Year2012 -480.25 44.93 -10.689 < 2e-16 *** Year2013 -535.20 47.02 -11.382 < 2e-16 ***