enterprise resource planning
TRANSCRIPT
Enterprise Resource Planning Systems
1
History of organizational systems
• ERP emerged from MRPII
• MRPII grew from MRP
• MRPII extended MRP’s focus on production and inventory to other functions such as Order Processing, Finance etc.
• ERP is different from MRPII – replacing legacy apps, managing globalization, handling regulatory requirements and improving integration of functions
Introduction to ERP
• Extension of materials resource planning.
• ERP is a process of managing all resources and their use in the entire enterprise In a coordinated manner
• Enterprise is the group of people with common goal.
• Enterprise act as a single entity

What is ERP?
• Enterprise Resource Planning
• Support business through optimizing, maintaining, and tracking business functions
• Broken down into business processes – HRM
– Distribution
– Financials
– Manufacturing

ERP system: Definition
• ERP is a set of integrated business applications, or modules which carry out common business functions such as general ledger, accounting, or order management
• ERP is a package encompassing all major functions of the business.

What makes ERP different
• Integrated modules • Common definitions • Common database • Update one module, automatically updates
others • ERP systems reflect a specific way of doing
business • Must look at your value chains, rather than
functions
Characteristics of Enterprise Systems
• Integration: seamless integration of all the information flowing through a company – financial and accounting, human resource information, supply chain information, and customer information.

Packages: Enterprise systems are not developed in house.
• IS life cycle is different: 1)mapping organizational requirements to the processes and terminology employed by the vendor and 2) making informed choices about the parameter setting.
• Organizations that purchase enterprise systems enter into long-term relationships with vendors. Organizations no longer control their own destiny.
What is ERP offering?
• ERP is business process infrastructure
• ERP software automates and integrates the basic processes of a firm
• ERP Business Technology architecture
Business Function and Process
• Managers now think in terms of business process
• Take the customer’s perspective
1. Customer is always right
2. If not reread rule #1

Business Process
• A business process is a collection of activities that takes inputs and creates outputs that are a value to a customer
• A business process consists of activities or tasks that
transform information from one form to another to achieve
a business outcome.
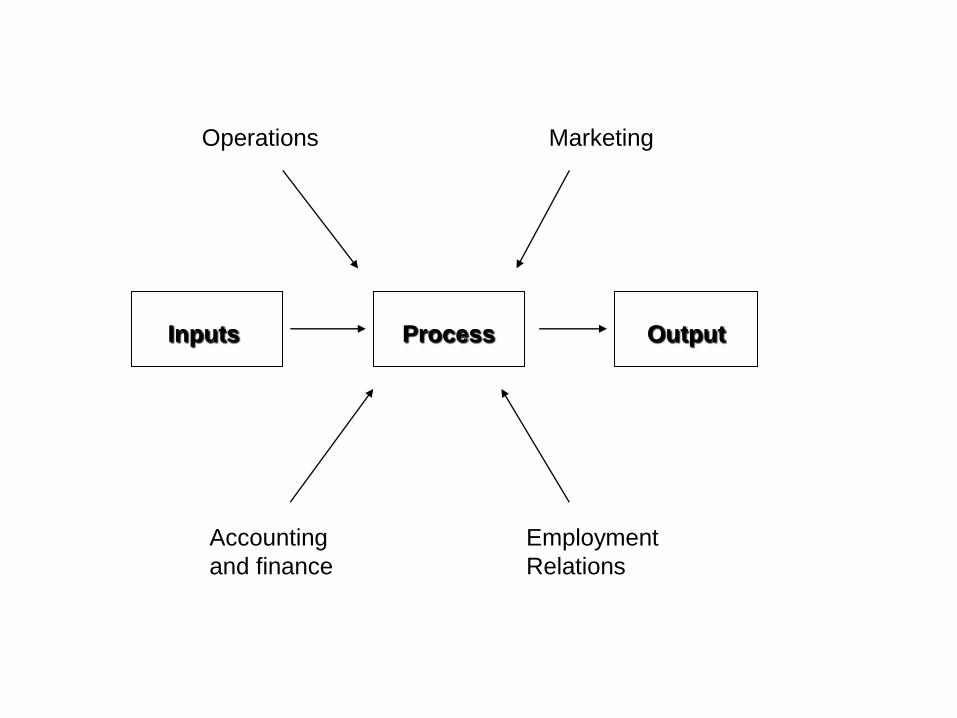
Inputs Process Output
Operations Marketing
Accounting
and finance
Employment
Relations
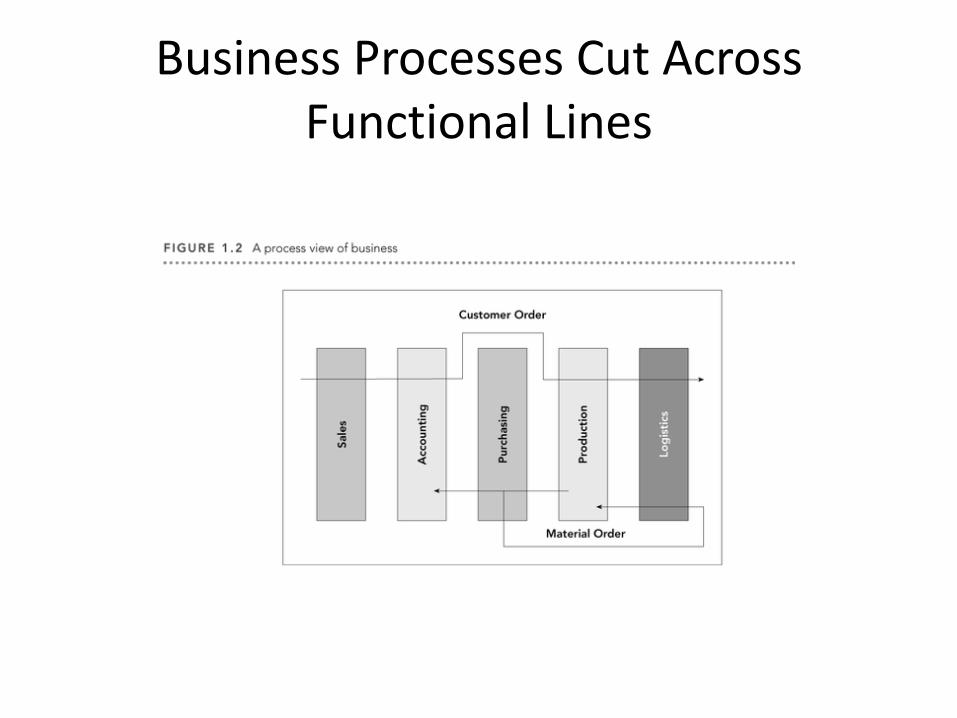
Business Processes Cut Across Functional Lines
Business process type
• Management processes used to manage system operations.
• Operational processes used to provide core business functions, which is often used interchangeably with the term business processes.
• Supporting processes that provide support for the other process types (for example IT support).
Business Function
• Business functions refer to a set of operations that are executed regularly to carry out a part of the mission for an organization. This term can also be defined as the essential functions such as sales and production that an organization cannot do without.

Integrated management information
OUTPUTS
PROCESSINPUTS
ENVIRONMENT

Characteristics 0f information
• Accuracy
• Relevancey
• timeliness
Role of the Enterprise
• Integrator
• Faciltator
• Owner of the project
• Understanding the responsibilities
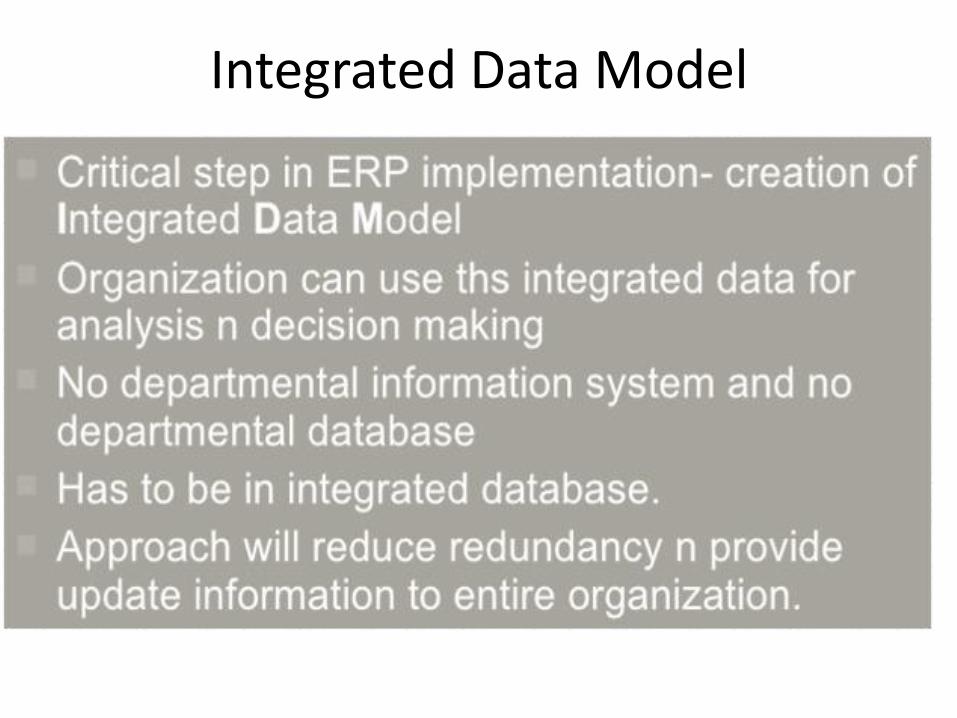
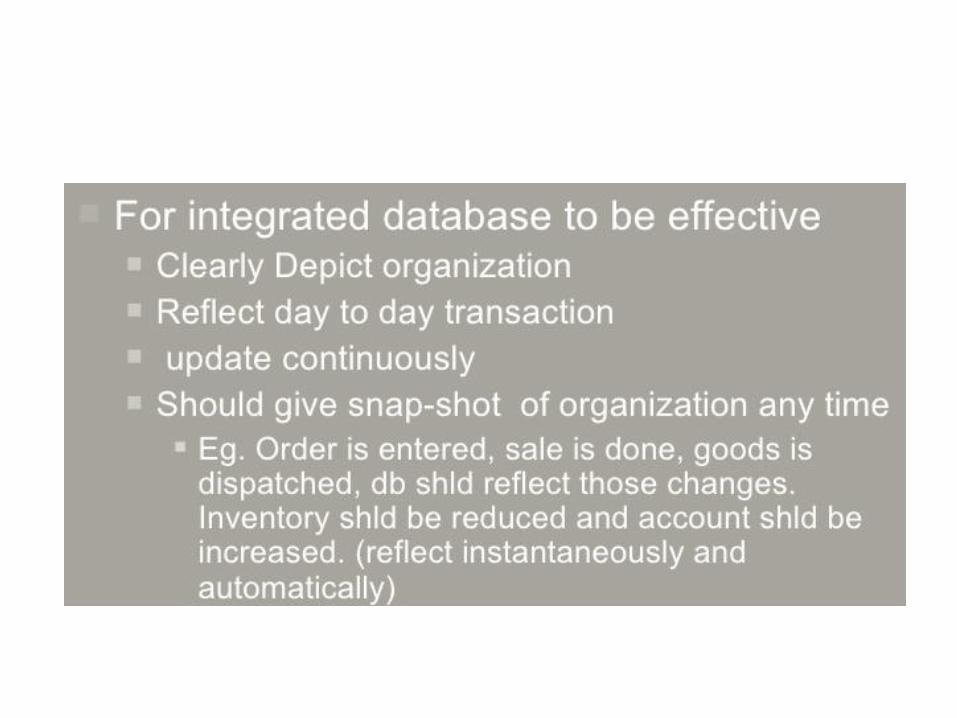
Integrated Data model
• Use of this integrated model is analysis and decision making
ERP Myths
• More work and procedure • Make many employee redundant and jobles • Sole of responsibility of the mgnt • Just for the managers/decision makers • Just for manufacturing organization • Impress customer • Package will take care of everything • One ERP package will suit every body • Very expensive

Reasons for the growth of erp
• Enable improved business performance
• Support business growth requirements
• Provide flexible,integrated,real time decision
• Eliminate limitation in legacy system

Adv of ERP
• Business integration
• Flexibility
• Better analysis and planning capabilities
• Use of latest technology
Example of before ERP Systems
• Faculty wants to buy a new Printer.
• For this reason Secretary gives a purchasing order by filling purchasing order forms.

New Printer Purchasing Process
1. Purchase order form for a new printer
2. Head of Department Confirmation- Faculty Head
3. Purchase order document sent to Account Office
4. Account Office Secretary sents the purchase order to the Responsibles
5. Purchase order- Responsible personal Confirmation
6. Purchasing department- Manager Confirmation
7. Transfer to Finance Department Secretary for processing
8. Finance Department Responsible’s Confirmation
9. Transfer to Rector’s Office
10. Rector’s Secretary- Confirmation
11. Confirmation Transfer, to Purchase Department Secretary
12. Purchase Responsible personal commends with Purchase
Example
• Faculty wants to buy a new HP Printer.
• For this reason Secretary gives a purchasing order with using Online ERP systems

After ERP Systems
SAP SYSTEM ONLINE
HEAD OF DEPARTMENT
REQUEST OF NEW
HP PRINTERCONFIRMATION
SAP SYSTEM ONLINE
PURCHASE
RESPONSIBLE
FINANCIAL
ACCOUNTING
SAP SYSTEM ONLINE
PURCHASEING MANAGERCONFIRMATION
SECRETARY
SAP SYSTEM ONLINE
FINANCE DEPARTMENTCONFIRMATION
SAP SYSTEM ONLINE
RECTORS OFFICECONFIRMATION
SAP SYSTEM ONLINE
PURCHASE DEPARTMENT
PURCHASE
OF NEW
HP PRINTER
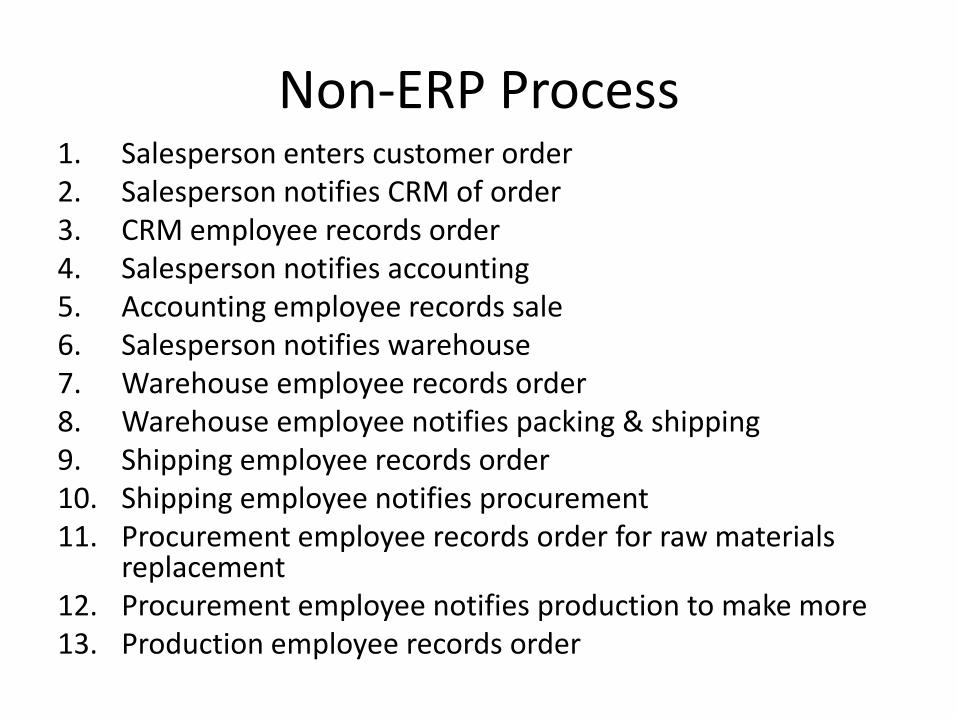
Non-ERP Process 1. Salesperson enters customer order 2. Salesperson notifies CRM of order 3. CRM employee records order 4. Salesperson notifies accounting 5. Accounting employee records sale 6. Salesperson notifies warehouse 7. Warehouse employee records order 8. Warehouse employee notifies packing & shipping 9. Shipping employee records order 10. Shipping employee notifies procurement 11. Procurement employee records order for raw materials
replacement 12. Procurement employee notifies production to make more 13. Production employee records order
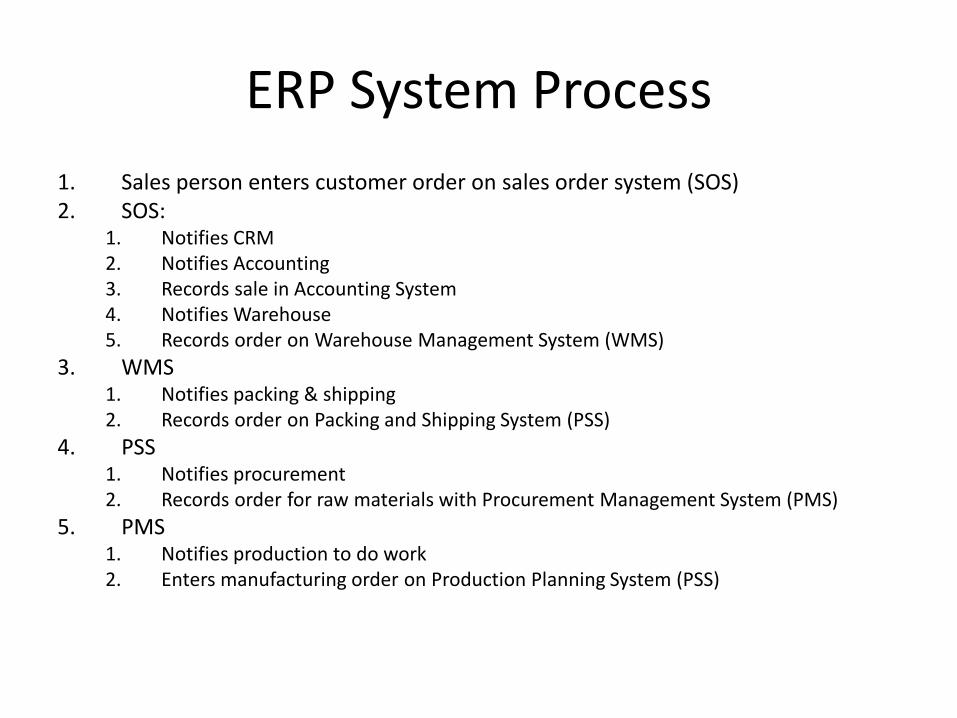
ERP System Process
1. Sales person enters customer order on sales order system (SOS) 2. SOS:
1. Notifies CRM 2. Notifies Accounting 3. Records sale in Accounting System 4. Notifies Warehouse 5. Records order on Warehouse Management System (WMS)
3. WMS 1. Notifies packing & shipping 2. Records order on Packing and Shipping System (PSS)
4. PSS 1. Notifies procurement 2. Records order for raw materials with Procurement Management System (PMS)
5. PMS 1. Notifies production to do work 2. Enters manufacturing order on Production Planning System (PSS)
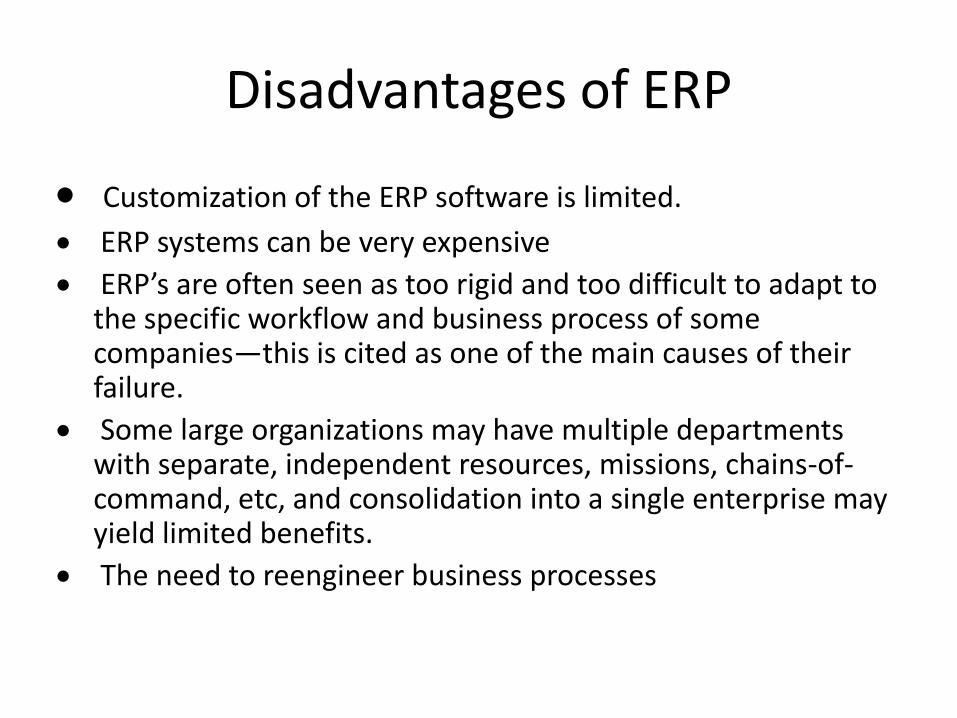
Disadvantages of ERP
Customization of the ERP software is limited.
ERP systems can be very expensive
ERP’s are often seen as too rigid and too difficult to adapt to the specific workflow and business process of some companies—this is cited as one of the main causes of their failure.
Some large organizations may have multiple departments with separate, independent resources, missions, chains-of-command, etc, and consolidation into a single enterprise may yield limited benefits.
The need to reengineer business processes

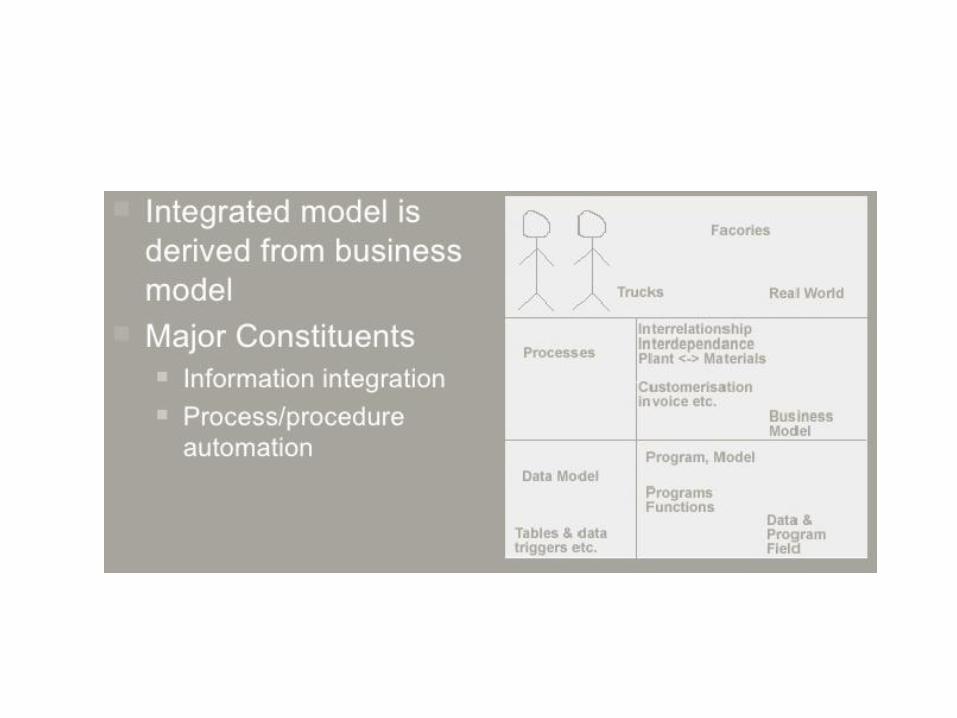
Business Modeling
• Business models are used to describe and classify businesses
• Interconnection and Independencies of the various sub system and business processes
• Integrated system making the processes managing its facilities and materials, the resources
Integrated Data Model

Benefits of ERP
• Information integration
• Reduction of lead-time
• On-time shipment
• Cycle time reduction
• Better customer satisfaction
• Improved supplier performance
• Increased flexibility
35
Benefits of ERP(ctd..)
• Reduced quality costs
• Improved resource utilization
• Better analysis and planning capabilities
• Improved information accuracy and decision-making capability
• Use of latest technology
36
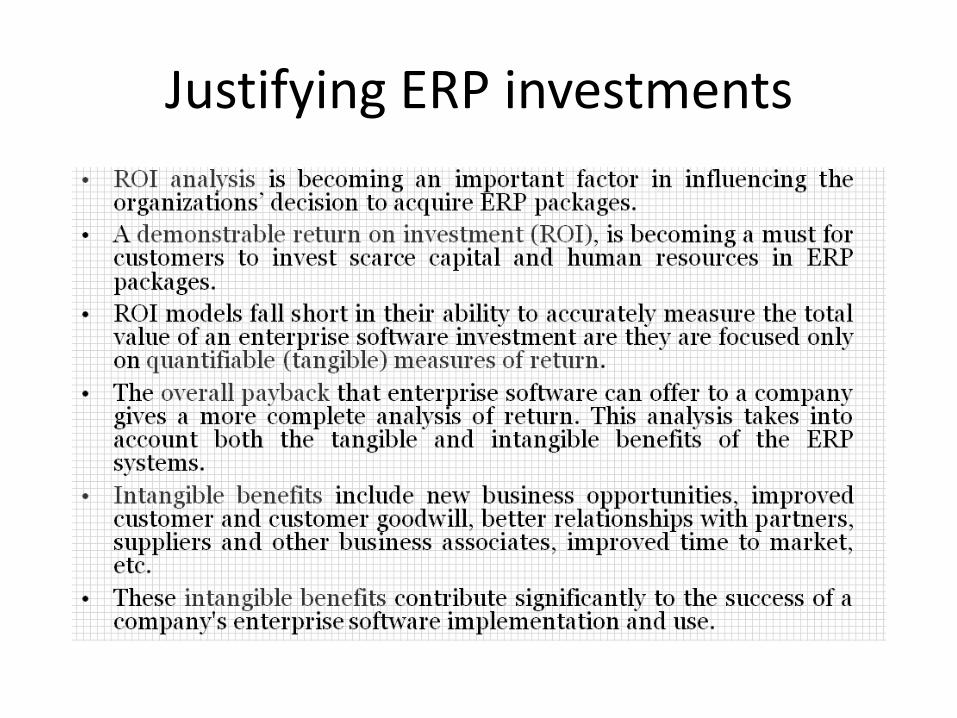
Justifying ERP investments
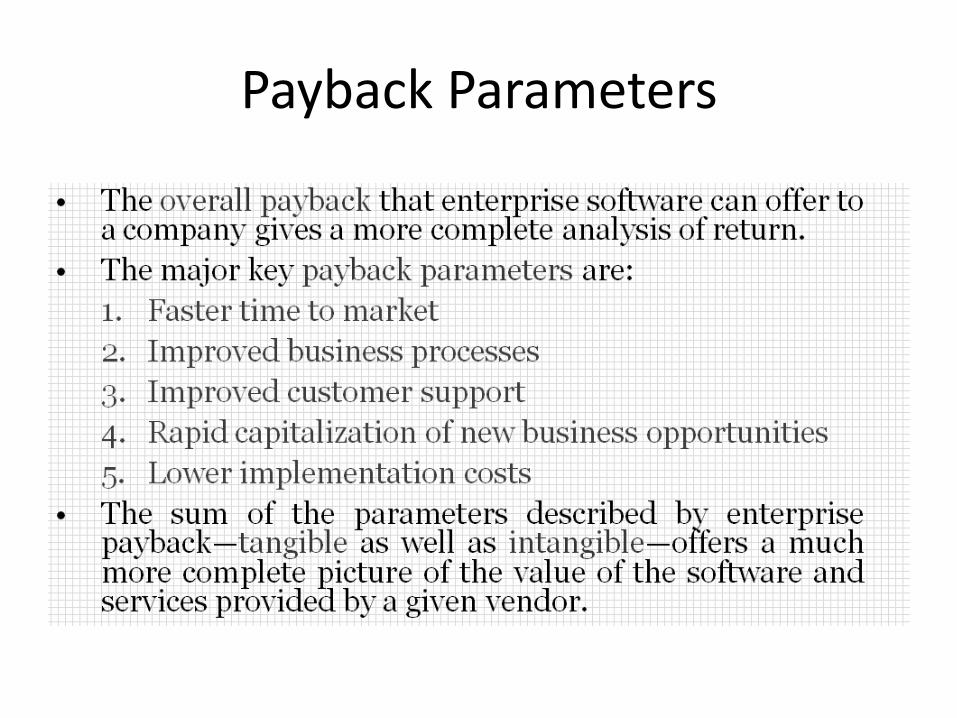
Payback Parameters

Tangible benefit from ERP system
Intangible benefits from ERP system
• Accounting
• Product and process design
• Production and material management
• Sales
• MIS function

Other factors (ERP investment)
• Lower implementation cost
• Lower production and business transaction cost
• Lower cost of reporting
• Lower personnel cost
• Lower business process change and Enhancement cost
• Supporting and enhancing the customer and partner experience
• Enabling new business opportunities
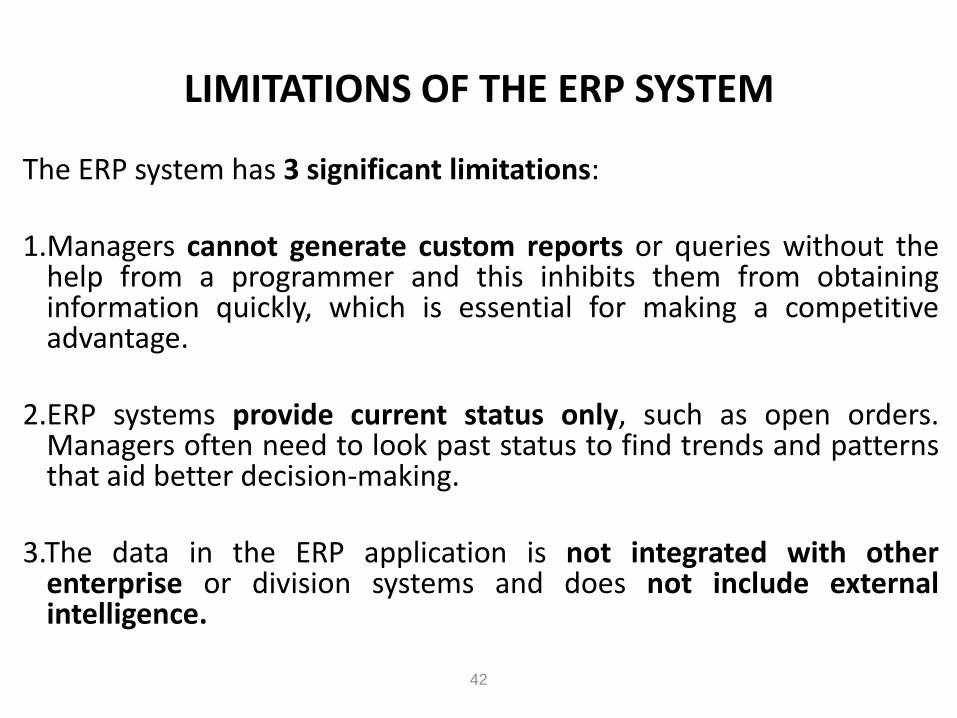
LIMITATIONS OF THE ERP SYSTEM
The ERP system has 3 significant limitations:
1.Managers cannot generate custom reports or queries without the help from a programmer and this inhibits them from obtaining information quickly, which is essential for making a competitive advantage.
2.ERP systems provide current status only, such as open orders. Managers often need to look past status to find trends and patterns that aid better decision-making.
3.The data in the ERP application is not integrated with other
enterprise or division systems and does not include external intelligence.
42
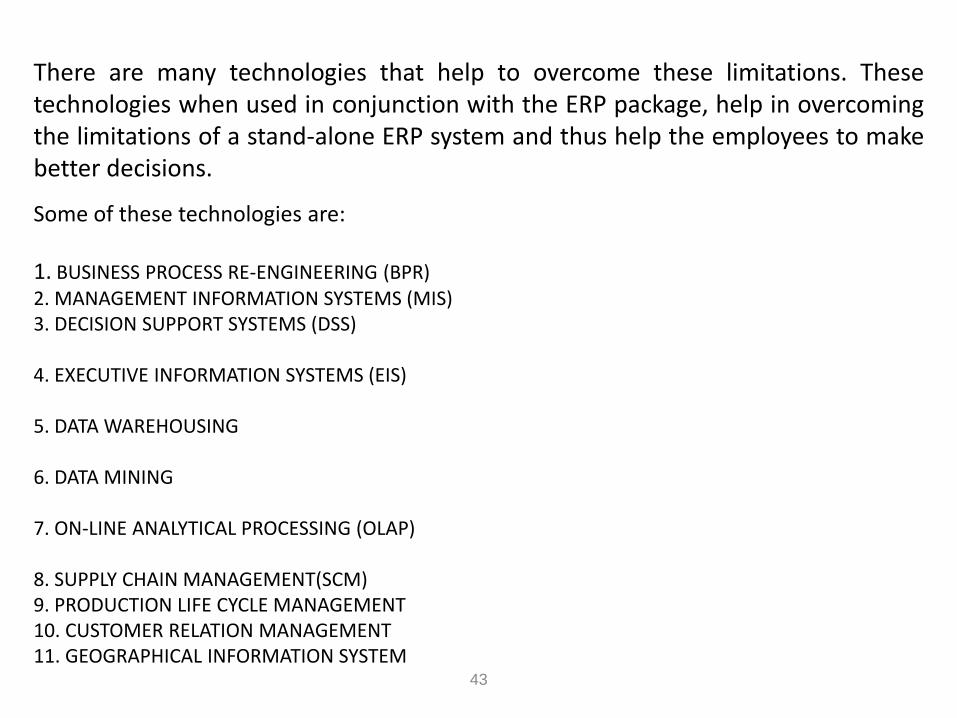
There are many technologies that help to overcome these limitations. These technologies when used in conjunction with the ERP package, help in overcoming the limitations of a stand-alone ERP system and thus help the employees to make better decisions.
Some of these technologies are:
1. BUSINESS PROCESS RE-ENGINEERING (BPR) 2. MANAGEMENT INFORMATION SYSTEMS (MIS) 3. DECISION SUPPORT SYSTEMS (DSS)
4. EXECUTIVE INFORMATION SYSTEMS (EIS)
5. DATA WAREHOUSING
6. DATA MINING 7. ON-LINE ANALYTICAL PROCESSING (OLAP)
8. SUPPLY CHAIN MANAGEMENT(SCM) 9. PRODUCTION LIFE CYCLE MANAGEMENT 10. CUSTOMER RELATION MANAGEMENT 11. GEOGRAPHICAL INFORMATION SYSTEM
43

BUSINESS PROCESS RE-ENGINEERING (BPR)
DEFINITION : • BPR as “ the fundamental rethinking and radical redesign of
business processes to achieve dramatic improvements in critical, contemporary measures of performance such as cost, quality, services and speed.”
• One of the main tools for making this change is the Information Technology (IT).
• Any BPR effort that fails to understand the importance of IT, and goes through the pre-BPR analysis and planning phases without considering the various IT options available, and the effort of the proposed IT solutions on the employees and the organization is bound to crash during take off.
44
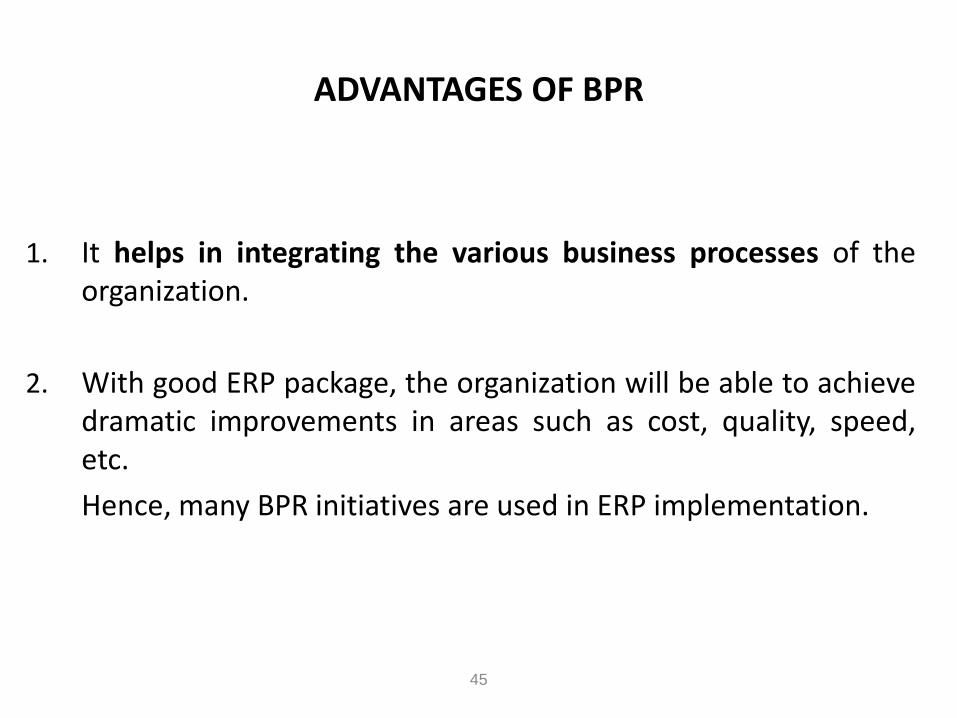
ADVANTAGES OF BPR
1. It helps in integrating the various business processes of the organization.
2. With good ERP package, the organization will be able to achieve dramatic improvements in areas such as cost, quality, speed, etc.
Hence, many BPR initiatives are used in ERP implementation.
45
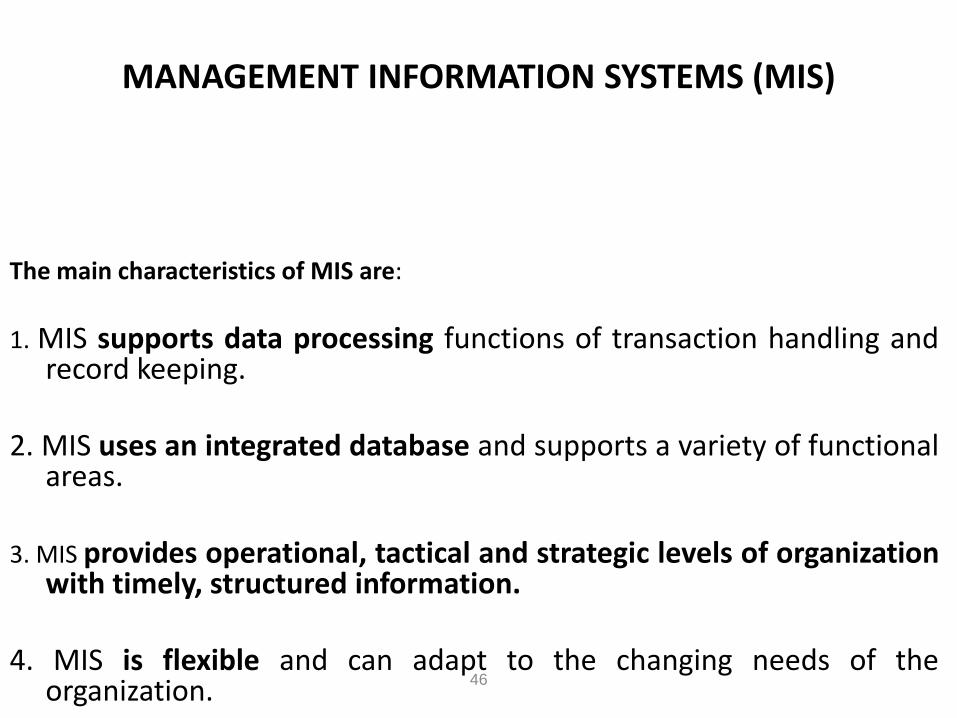
MANAGEMENT INFORMATION SYSTEMS (MIS)
The main characteristics of MIS are:
1. MIS supports data processing functions of transaction handling and record keeping.
2. MIS uses an integrated database and supports a variety of functional
areas. 3. MIS provides operational, tactical and strategic levels of organization
with timely, structured information.
4. MIS is flexible and can adapt to the changing needs of the organization. 46
DEFINITION :
MIS is a computer – based system that optimizes the collection, collation,
transfer and presentation of information throughout an organization, through an
integrated structure of databases and information flow.
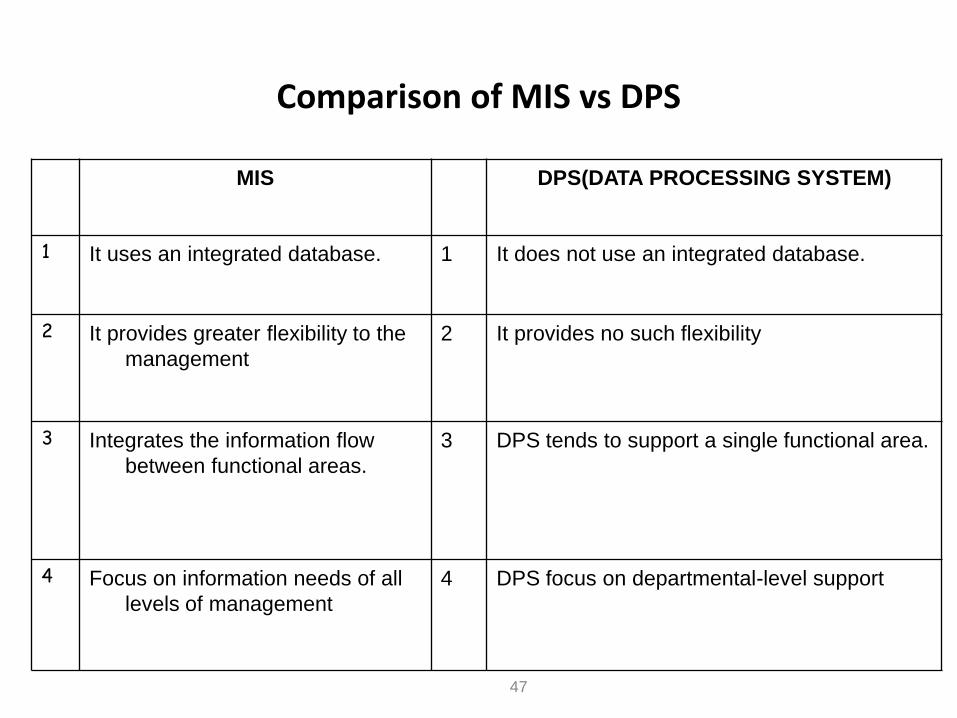
Comparison of MIS vs DPS
MIS DPS(DATA PROCESSING SYSTEM)
1 It uses an integrated database. 1 It does not use an integrated database.
2 It provides greater flexibility to the
management
2 It provides no such flexibility
3 Integrates the information flow
between functional areas.
3 DPS tends to support a single functional area.
4 Focus on information needs of all
levels of management
4 DPS focus on departmental-level support
47

DECISION SUPPORT SYSTEMS (DSS)
• Managers spend a lot of time and effort in gathering and analyzing information before making decisions. Decision support systems were created to assist managers in this task.
• A DSS can help close this gap and allow managers to improve the quality of their decisions.
• To do this, the DSS hardware and software employ the latest technological innovations, planning and forecasting models, 4th generation languages and even artificial intelligence.
48
DEFINITION:
Decision support systems are interactive information systems that
rely on an integrated set of user-friendly software and hardware tools, to
produce and present information targeted to support management in the
decision making process.

The main characteristics of a DSS are:
1.A DSS is designed to address semi-structured and unstructured problems.
2.The DSS mainly supports decision-making at the top management level.
3.DSS is interactive, user-friendly and can be used by the decision maker with little or no assistance from a computer professional.
4.DSS makes general purpose models, simulation capabilities and other analytical tools available to the decision maker.
49
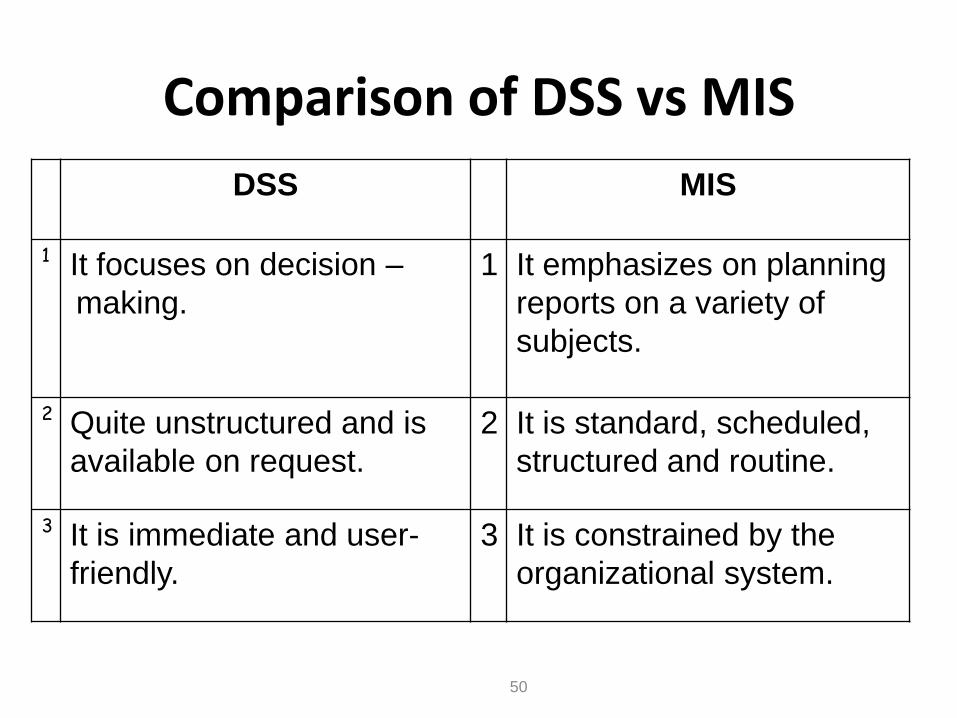
Comparison of DSS vs MIS
DSS MIS
1 It focuses on decision –
making.
1 It emphasizes on planning
reports on a variety of
subjects.
2 Quite unstructured and is
available on request.
2 It is standard, scheduled,
structured and routine.
3 It is immediate and user-
friendly.
3 It is constrained by the
organizational system.
50
EXECUTIVE INFORMATION SYSTEMS (EIS)
• Top level executives and decision makers face many problems and
pressures. They have to make the right decisions at the right time to take the company forward.
• An EIS is concerned with how the decisions affect an entire organization. • An EIS takes the following into considerations:
– The overall vision and mission of the company and the company goals. – Strategic planning and objectives. – Organizational structure. – Crisis management/ contingency planning. – Strategic control and monitoring of overall operations.
• Successful EIS are easy to use, flexible and customizable and use the latest technological innovations.
51
DEFINITION:
EIS is a decision support system especially made for senior level
executives.

DATA WAREHOUSING
1. If operational data is kept in the database of the ERP system, it can create a lot of problems.
2. As time passes, the amount of data will increase and this will affect the performance of the ERP system.
3. However once the operational use of the data is over, it should be removed from the operational databases.
52

IMPORTANCE OF DATA WAREHOUSING
• The primary concept of the data warehousing is that the data stored for the business analysis can be accessed most effectively by separating it from the data in operational systems.
• The most important reason for separating data for business analysis, from the operational data, has always been the potential performance degradation on the operational system that can result from the analysis processes.
• High performance and quick response time is almost universally critical for operational system.
53
DATA MINING
DEFINITION
Data mining is the process of identifying valid, novel,
potentially useful and ultimately comprehensible
information from databases that is used to make
crucial business decisions.
• The main reason for needing automated computer systems for intelligent data analysis is the enormous volume of existing and newly appearing data that require processing.
54
• The amount of data accumulated each day by various businesses, scientific and governmental organizations around the world is daunting.
• Research organizations, academic institutions and commercial organizations create and store huge amounts of data each day.
• It becomes impossible for human analysts to cope with such overwhelming amounts of data.
• Two other problems that surface when human analysts process data are:
i. The inadequacy of the human brain when searching for complex multi-factorial dependencies in the data.
ii. The lack of objectiveness in analyzing the data
55
ADVANTAGES
• A human expert is always a hostage of the previous experience of the investigating other system.
• Sometimes this helps, sometimes this hurts, but it is almost impossible to get rid of this fact.
• While data mining does not eliminate human participation in solving the task completely, it significantly simplifies the job and allows an analyst, who is not a professional in statistics and programming to manage the process of extracting knowledge from data.
56

ON-LINE ANALYTICAL PROCESSING (OLAP)
• Fast : means that the system is targeted to deliver most responses to users within about 5 seconds, with the simplest analysis not taking more than one second and very few taking more than 20 seconds.
• Analysis: means that the system can cope with any business logic and statistical analysis that is relevant for the application and the user, and keep it easy enough for the target user.
• Shared: means that the system implements all the security requirements for confidentiality and if multiple write access is needed, concurrent update locking at an appropriate level.
• Multi-dimensional: means that the system must provide a multi-dimensional conceptual view of the data, including full support for hierarchies and multiple hierarchies.
• Information: is refined data that is accurate, timely and relevant to the user.
57
DEFINITION OLAP can be defined i – Fast Analysis of Shared Multi-dimensional Information.

Importance
• OLAP technology is being used in an increasingly wide range of applications.
• The most common are sales and marketing analysis, financial reporting and consolidation and budgeting and planning.
• OLAP is being used for applications such as product profitability and pricing analysis; activity based coating; manpower planning and quality analysis or for that matter any management system that requires a flexible, top down view of an organization.
58
SUPPLY CHAIN MANAGEMENT(SCM)
1. Supply chains exist in both service and manufacturing organizations, although the complexity of the chain may vary greatly from industry to industry and firm to firm.
2. Traditionally, marketing, distribution, planning, manufacturing and the purchasing organizations along the supply chain operated independently.
59
DEFINITION:
A supply chain is a network of facilities and distribution
options that performs the function of procurement of materials,
transformation of these materials into intermediate and
finished products and the distribution of these finished
products to the customers.

3. These organizations have their own objectives which
are often conflicting.
4. There is a need for a mechanism through which these different functions can be integrated together.
5. Supply chain management is a strategy through which such integration can be achieved.
60
PRODUCT LIFE CYCLE MANAGEMENT(PLM)
• PRODUCT LIFE CYCLE PHASES
PRODUCTION DEVELOPMENT
MARKET INTRODUCTION
GROWTH, MATURITY,DELINE
ADV
REDUCE TIME TO MARKET
OPTIMALLY DEPLOY ENGG(CAD)
REDUCE PRODUCTT DEVELOPMENT COST
Get product design change quickly

Customer relationship management
• Method and technologies used by companies to manage their clients
• Corporate level strategy
• CRM packages(include policies, process, employee training,marketing…)
• Track customer interest and requirement

Geographical information systems(GIS)
• Computer based mapping and analyzing
• Integrated and common database
• Use individuals and any organization like

What is a Data Warehouse?
A single, complete and consistent store of data obtained from a variety of different sources made available to end users in a what they can understand and use in a business context.
64
What are the users saying...
• Data should be integrated across the enterprise
• Summary data has a real value to the organization
• Historical data holds the key to understanding data over time
• What-if capabilities are required
65

What is Data Warehousing?
A process of transforming data into information and making it available to users in a timely enough manner to make a difference
66
Data
Information

Evolution
• 60’s: Batch reports – hard to find and analyze information
– inflexible and expensive, reprogram every new request
• 70’s: Terminal-based DSS and EIS (executive information systems) – still inflexible, not integrated with desktop tools
• 80’s: Desktop data access and analysis tools – query tools, spreadsheets, GUIs
– easier to use, but only access operational databases
• 90’s: Data warehousing with integrated OLAP engines and tools
67

Application Areas
68
Industry Application
Finance Credit Card Analysis
Insurance Claims, Fraud Analysis
Telecommunication Call record analysis
Transport Logistics management
Consumer goods promotion analysis
Data Service providers Value added data
Utilities Power usage analysis

Application-Orientation vs. Subject-Orientation
69
Application-Orientation
Operational Database
Loans Credit Card
Trust
Savings
Subject-Orientation
Data Warehouse
Customer
Vendor
Product
Activity
OLTP vs. Data Warehouse
• OLTP systems are tuned for known transactions and workloads while workload is not known a priori in a data warehouse
• Special data organization, access methods and implementation methods are needed to support data warehouse queries (typically multidimensional queries)
– e.g., average amount spent on phone calls between 9AM-5PM in Pune during the month of December
70

OLTP vs Data Warehouse
• OLTP
– Application Oriented
– Used to run business
– Detailed data
– Current up to date
– Isolated Data
– Repetitive access
– Clerical User
• Warehouse (DSS)
– Subject Oriented
– Used to analyze business
– Summarized and refined
– Snapshot data
– Integrated Data
– Ad-hoc access
– Knowledge User (Manager)
71
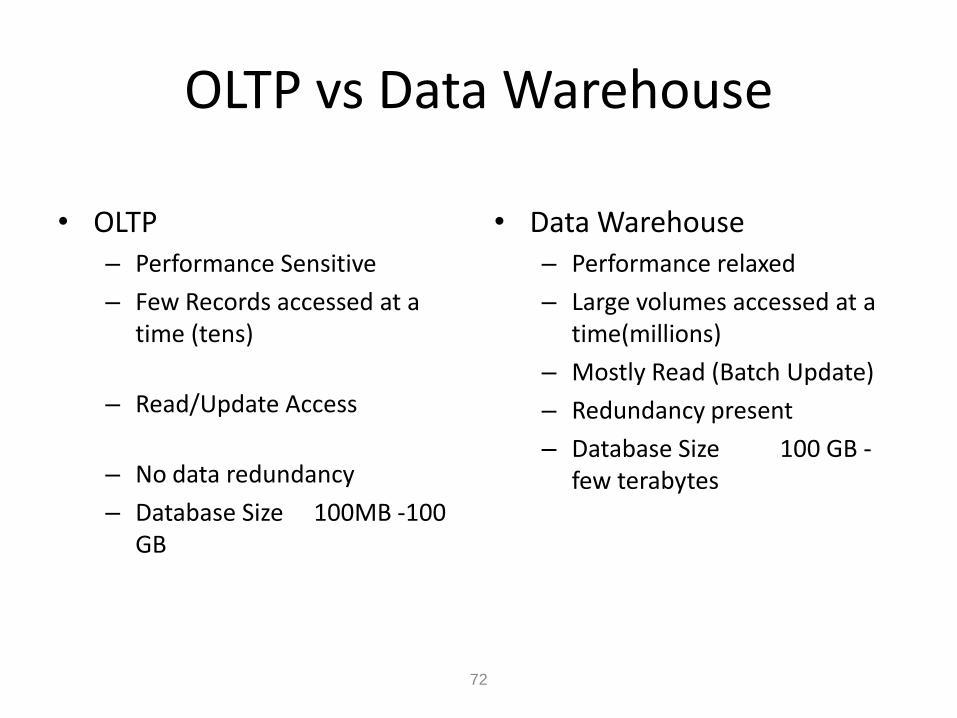
OLTP vs Data Warehouse
• OLTP – Performance Sensitive
– Few Records accessed at a time (tens)
– Read/Update Access
– No data redundancy
– Database Size 100MB -100 GB
• Data Warehouse – Performance relaxed
– Large volumes accessed at a time(millions)
– Mostly Read (Batch Update)
– Redundancy present
– Database Size 100 GB - few terabytes
72
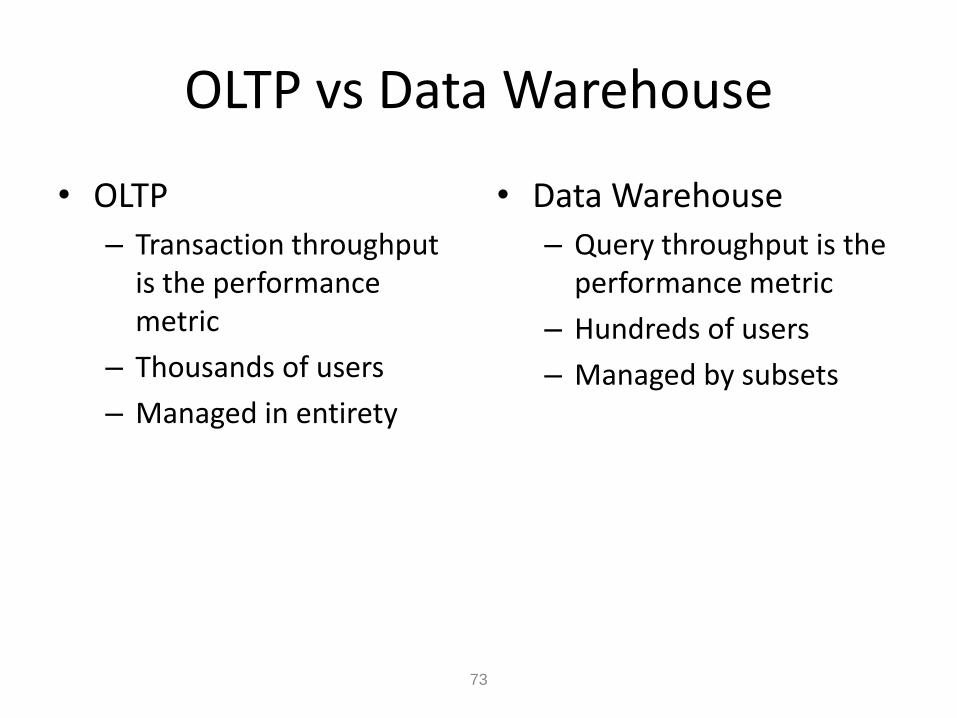
OLTP vs Data Warehouse
• OLTP
– Transaction throughput is the performance metric
– Thousands of users
– Managed in entirety
• Data Warehouse
– Query throughput is the performance metric
– Hundreds of users
– Managed by subsets
73
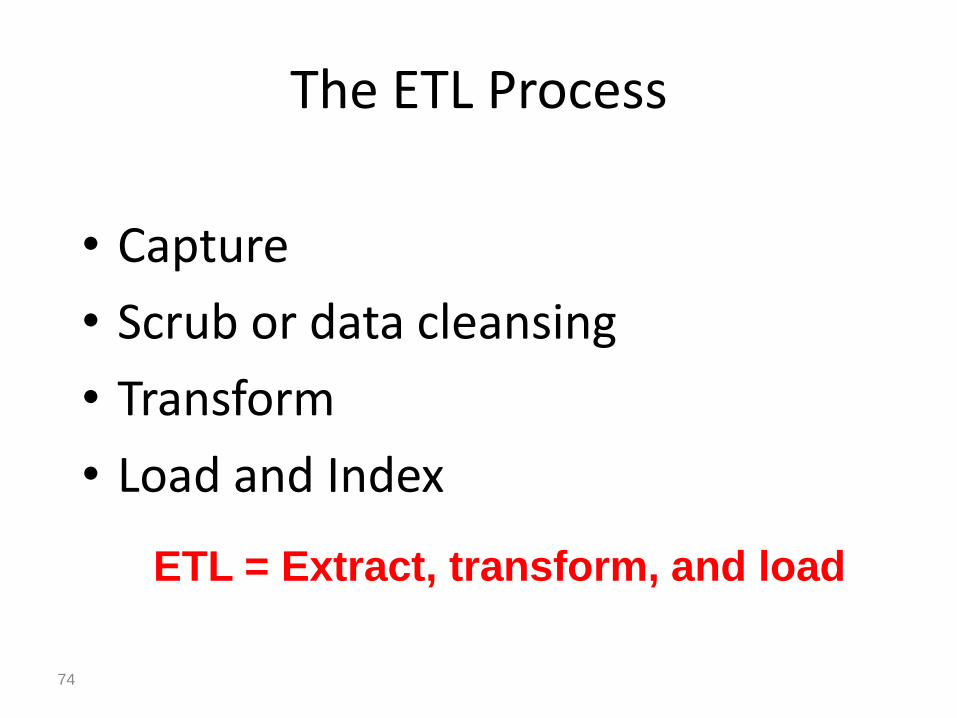
The ETL Process
• Capture
• Scrub or data cleansing
• Transform
• Load and Index
74
ETL = Extract, transform, and load

Steps in data reconciliation
Static extract = capturing a
snapshot of the source data at a
point in time
Incremental extract = capturing
changes that have occurred since
the last static extract
Capture = extract…obtaining a
snapshot of a chosen subset of the
source data for loading into the data
warehouse

76
Steps in data reconciliation (continued)
Scrub = cleanse…uses pattern
recognition and AI techniques to
upgrade data quality
Fixing errors: misspellings,
erroneous dates, incorrect field
usage, mismatched addresses,
missing data, duplicate data,
inconsistencies
Also: decoding, reformatting, time
stamping, conversion, key
generation, merging, error
detection/logging, locating missing
data
77
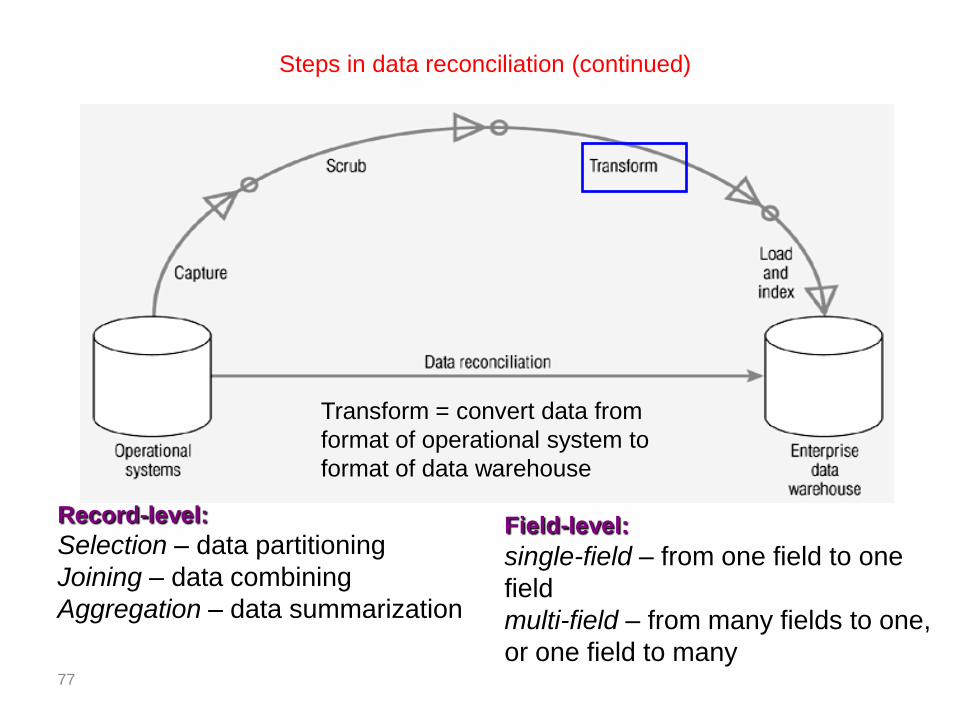
Steps in data reconciliation (continued)
Transform = convert data from
format of operational system to
format of data warehouse
Record-level:
Selection – data partitioning
Joining – data combining
Aggregation – data summarization
Field-level:
single-field – from one field to one
field
multi-field – from many fields to one,
or one field to many

78
Steps in data reconciliation (continued)
Load/Index= place transformed data
into the warehouse and create
indexes
Refresh mode: bulk rewriting of
target data at periodic intervals
Update mode: only changes in
source data are written to data
warehouse
Data Transformation • Data transformation is the component of data
reconciliation that converts data from the format of the source operational systems to the format of enterprise data warehouse.
• Data transformation consists of a variety of different functions:
– record-level functions,
– field-level functions and
– more complex transformation.
79
Definition • Data Warehouse:
– A subject-oriented, integrated, time-variant, non-updatable collection of data used in support of management decision-making processes
– Subject-oriented: e.g. customers, patients, students, products
– Integrated: Consistent naming conventions, formats, encoding structures; from multiple data sources
– Time-variant: Can study trends and changes
– No updatable: Read-only, periodically refreshed
• Data Warehousing: – The process of constructing and using a data
warehouse
80

Data Warehouse—Subject-Oriented
• - Organized around major subjects, such as customer, product, sales.
• - Focusing on the modeling and analysis of data for decision makers, not on daily operations or transaction processing.
• - Provide a simple and concise view around particular subject issues by excluding data that are not useful in the decision support process.
81

Data Warehouse - Integrated
• Constructed by integrating multiple, heterogeneous data sources – relational databases, flat files, on-line transaction
records
• Data cleaning and data integration techniques are applied. – Ensure consistency in naming conventions, encoding
structures, attribute measures, etc. among different data sources
• E.g., Hotel price: currency, tax, breakfast covered, etc.
– When data is moved to the warehouse, it is converted.
82
Data Warehouse -Time Variant
• The time horizon for the data warehouse is significantly longer than that of operational systems.
– Operational database: current value data.
– Data warehouse data: provide information from a historical perspective (e.g., past 5-10 years)
• Every key structure in the data warehouse
– Contains an element of time, explicitly or implicitly
– But the key of operational data may or may not contain “time element”.
83

Data Warehouse - Non Updatable
• A physically separate store of data transformed from the operational environment.
• Operational update of data does not occur in the data warehouse environment. – Does not require transaction processing, recovery,
and concurrency control mechanisms.
– Requires only two operations in data accessing: • initial loading of data and access of data.
84
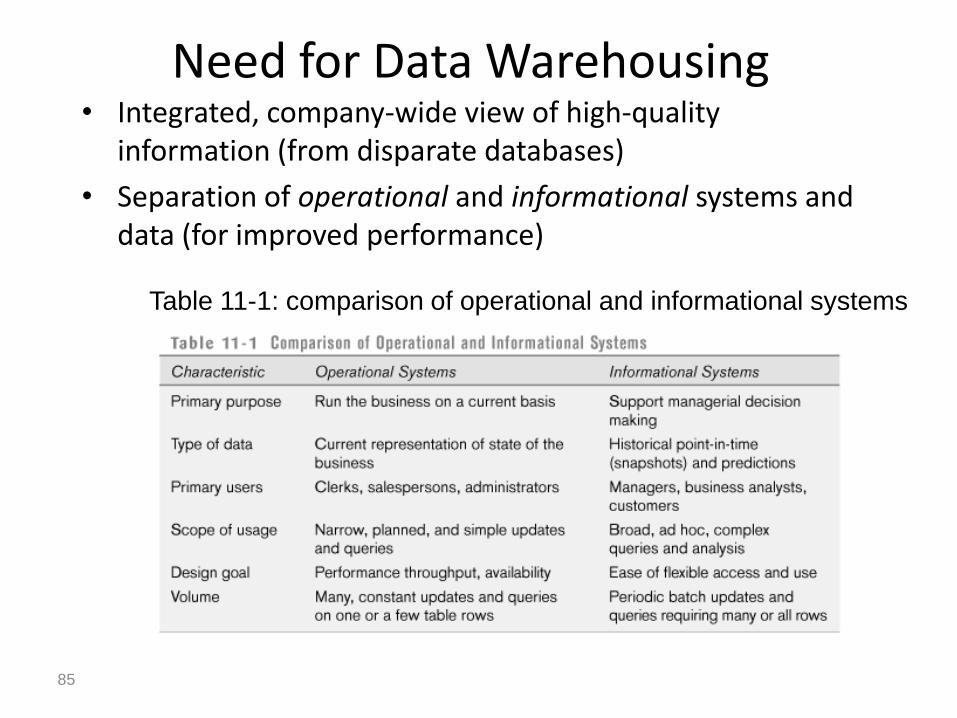
Need for Data Warehousing • Integrated, company-wide view of high-quality
information (from disparate databases)
• Separation of operational and informational systems and data (for improved performance)
85
Table 11-1: comparison of operational and informational systems
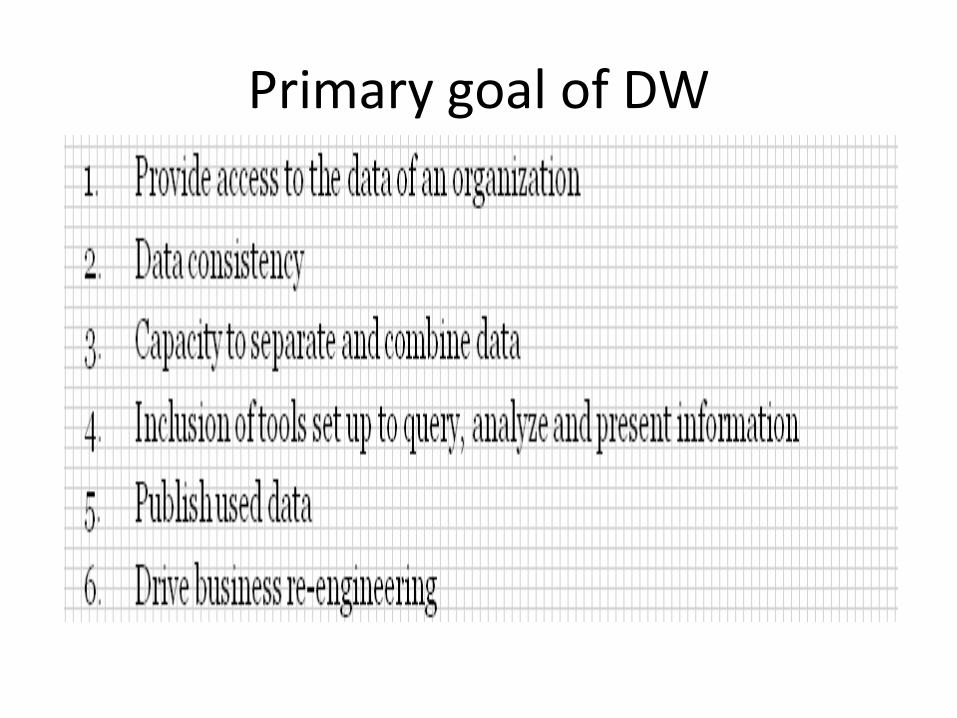
Primary goal of DW
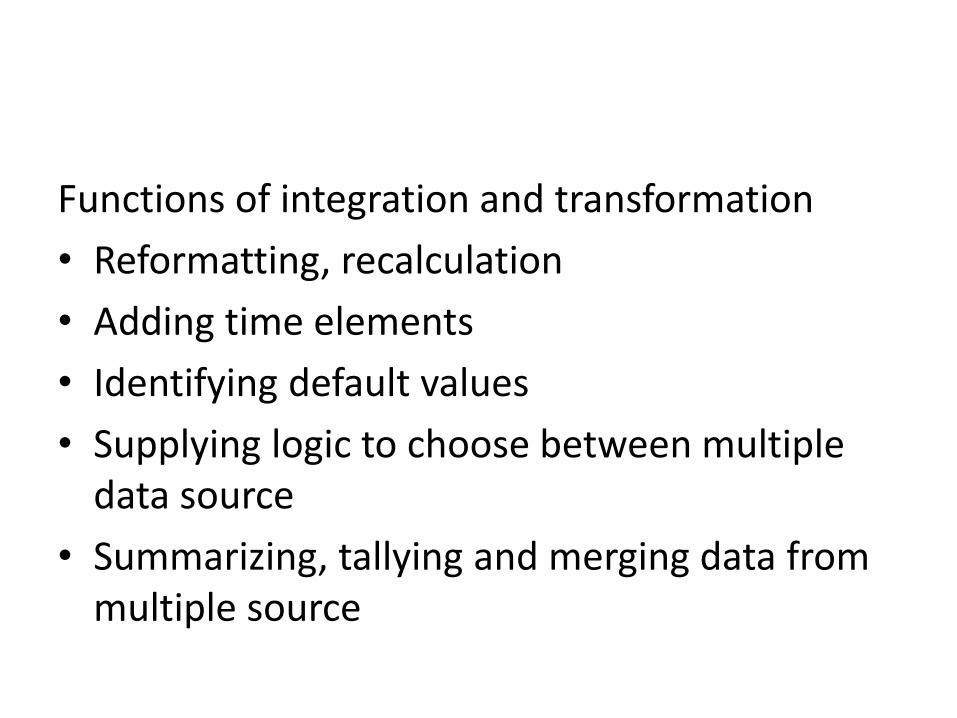
Functions of integration and transformation
• Reformatting, recalculation
• Adding time elements
• Identifying default values
• Supplying logic to choose between multiple data source
• Summarizing, tallying and merging data from multiple source
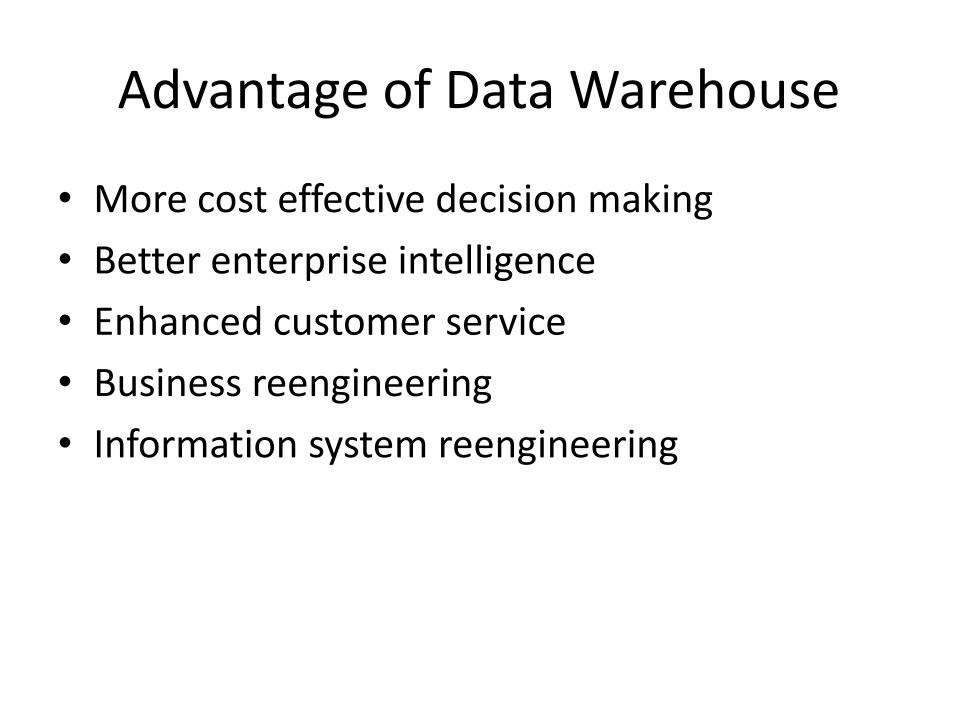
Advantage of Data Warehouse
• More cost effective decision making
• Better enterprise intelligence
• Enhanced customer service
• Business reengineering
• Information system reengineering

Obstacles of successful DW projects
• Complex extract, transformation and load characteristics
Source Vs Target
data transformation
Transaction based loading
• Immense volumes of daily data
• Load methodology( control and audit)
• Data warehouse recovery
• Datawarehouse validations
Mistakes to avoid in DW
• Starting the project without right sponsorship and top management
• Setting expectation
• Promotion the values of DW
• Loading the warehouse
• Believing the DW
• Choosing the DW manager
• Focusing on traditional internal records

Mistakes to avoid in DW
• Delivering data with overlapping and confusing definitions
• Believing the performance ,capacity and scalability promise
• Believing that once the datawarehouse is up and running until your problems are finished
Use of a DW
• Standard report and queries
• Queries against summarized data
• Data mining
• Interface with other datawarehouses

Why Mine Data? Commercial Viewpoint
• Lots of data is being collected and warehoused
– Web data, e-commerce
– purchases at department/grocery stores
– Bank/Credit Card transactions
• Computers have become cheaper and more powerful
• Competitive Pressure is Strong Provide better, customized services for an edge
Why Mine Data? Scientific Viewpoint
• Data collected and stored at enormous speeds (GB/hour)
– remote sensors on a satellite
– telescopes scanning the skies
– microarrays generating gene expression data
– scientific simulations generating terabytes of data
• Traditional techniques infeasible for raw data
• Data mining may help scientists
– in classifying and segmenting data
– in Hypothesis Formation
What is Data Mining?
• Many Definitions
– Non-trivial extraction of implicit, previously unknown and potentially useful information from data
– Exploration & analysis, by automatic or semi-automatic means, of large quantities of data in order to discover
meaningful patterns
What is (not) Data Mining?
• Look up phone number in phone directory
• Query a Web search engine for information about “Amazon”
• What is Data Mining?
– Certain names are more prevalent in certain US locations
– Group together similar documents returned by search engine according to
their context
Origins of Data Mining
• Draws ideas from machine learning/AI, pattern recognition, statistics, and database systems
• Traditional Techniques may be unsuitable due to
– Enormity of data
– High dimensionality of data
– Heterogeneous,
• distributed nature of data
3 Steps Data Mining Process • Stage 1: Exploration. This stage usually starts with
data preparation which may involve cleaning data, data transformations, selecting subsets of records
• Stage 2: Model building and validation. This stage involves considering various models and choosing the best one based on their predictive performance
• Stage 3: Deployment. That final stage involves using the model selected as best in the previous stage and applying it to new data in order to generate predictions or estimates of the expected outcome
Verification Versus Discovery
• In the past, decision support activities were primarily based on the concept of verification.
• This required a great deal of prior knowledge on the decision-maker’s part in order to verify a suspected relationship.
• With the advance of technology, the concept of verification began to turn into discovery.

Verification Versus Discovery – Define the business problem and obtain the
data to study it.
– Use data mining software to model the problem.
– Mine the data to search for patterns of interest.
– Review the mining results and refine them by respecifying the model.
– Once validated, make the model available to other users of the DW.
Data Mining Tasks
• Prediction Methods
Use some variables to predict unknown or future values of other variables.
• Description Methods
– Find human-interpretable patterns that describe the data.
Data Mining Tasks
• Classification [Predictive]
• Clustering [Descriptive]
• Association Rule Discovery [Descriptive]
• Sequential Pattern Discovery [Descriptive]
• Regression [Predictive]
• Deviation Detection [Predictive]

Some of the tools used for data mining are:
• Artificial neural networks - Non-linear predictive models that learn through training and resemble biological neural networks in structure.
• Decision trees - Tree-shaped structures that represent sets of decisions. These decisions generate rules for the classification of a dataset.
• Rule induction - The extraction of useful if-then rules from data based on statistical significance.
• Genetic algorithms - Optimization techniques based on the concepts of genetic combination, mutation, and natural selection.
• Nearest neighbor - A classification technique that classifies each record based on the records most similar to it in an historical database.
• Case based reasoning • Non-linear regression methods

Reasons for the growing popularity of Data Mining
• Growing Data Volume
• Limitations of Human Analysis
• Low Cost of Machine Learning
ADVANTAGES OF DATA MINING
• Automated prediction of trends and behaviors
• Automated discovery of previously unknown pattern
• Database can larger both depth and breath

ADVANTAGES OF DATA MINING
• Marking/Retailing: Data mining can aid direct marketers by providing them with useful and accurate trends about their customers’ purchasing behavior.
• Banking/Crediting: Data mining can assist financial institutions in areas such as credit reporting and loan information.

ADVANTAGES OF DATA MINING Cont…
• Law enforcement: Data mining can aid law enforcers in identifying criminal suspects as well as apprehending these criminals by examining trends in location, crime type, habit, and other patterns of behaviors.
• Researchers: Data mining can assist researchers by speeding up their data analyzing process; thus, allowing them more time to work on other projects.
DISADVANTAGES OF DATA MINING
• Privacy Issues: For example, according to Washing Post, in 1998, CVS had sold their patient’s prescription purchases to a different company
• American Express also sold their customers’ credit card purchases to another company.

DISADVANTAGES OF DATA MINING Cont…
• Security issues: Although companies have a lot of personal information about us available online, they do not have sufficient security systems in place to protect that information.
• Misuse of information: Some of the company will answer your phone based on your purchase history. If you have spent a lot of money or buying a lot of product from one company, your call will be answered really soon. So you should not think that your call is really being answer in the order in which it was receive.

Sample Data Mining Plan: Example
• Bank concerned about attrition for its Demand Deposit Accounts
– identify customers likely to leave, with sufficient warning of impending attrition to allow for some intervention (signature for impending attrition?)
• Hypothesis testing
– transaction data may be insufficient
– explore ideas about why customers might leave, and how to identify
• e.g. Regular bi-weekly direct deposit ceases: new job and no longer using direct deposits
• got married and spouse used another bank: reduction in balance and number if transactions, last-name change request

– Data requirements
• Careful attention to data generated by internal decisions:
– bank started charging for debit card transactions that were free
– bank turned down loan or credit increase request
• Is the data available?
– Preparing data for analysis
– Exploratory analysis of data
• queries, OLAP, hypothesis testing
• association rules
• Knowledge Discovery plan – classes of customers rather than an overall signature of attrition?
– Deviation from normal behavior indicating attrition potential
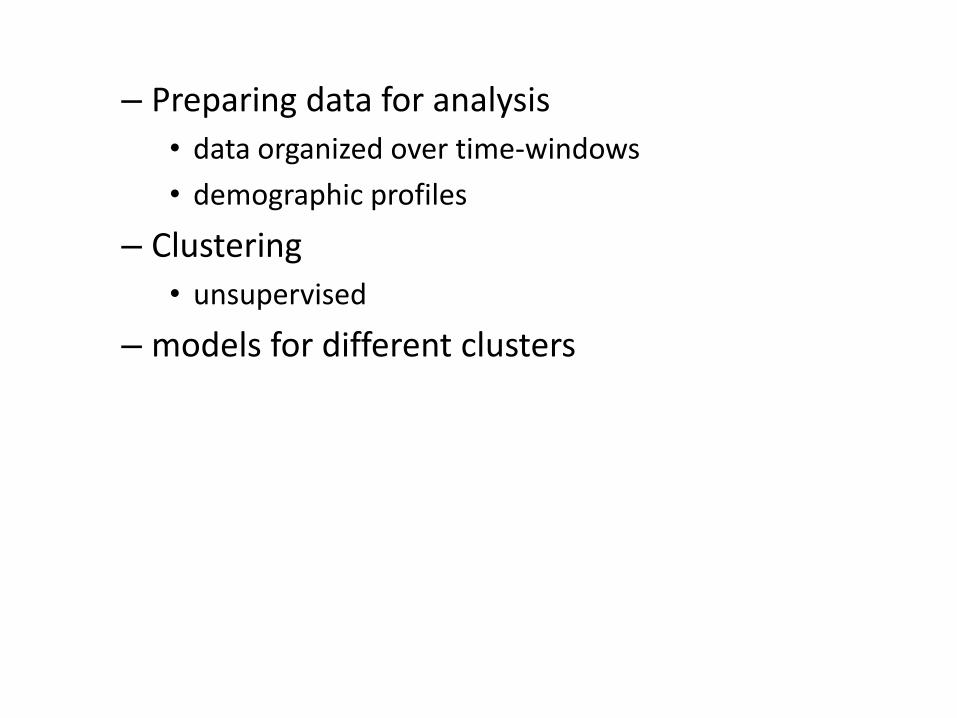
– Preparing data for analysis
• data organized over time-windows
• demographic profiles
– Clustering
• unsupervised
– models for different clusters
Example:improving direct mail
responses
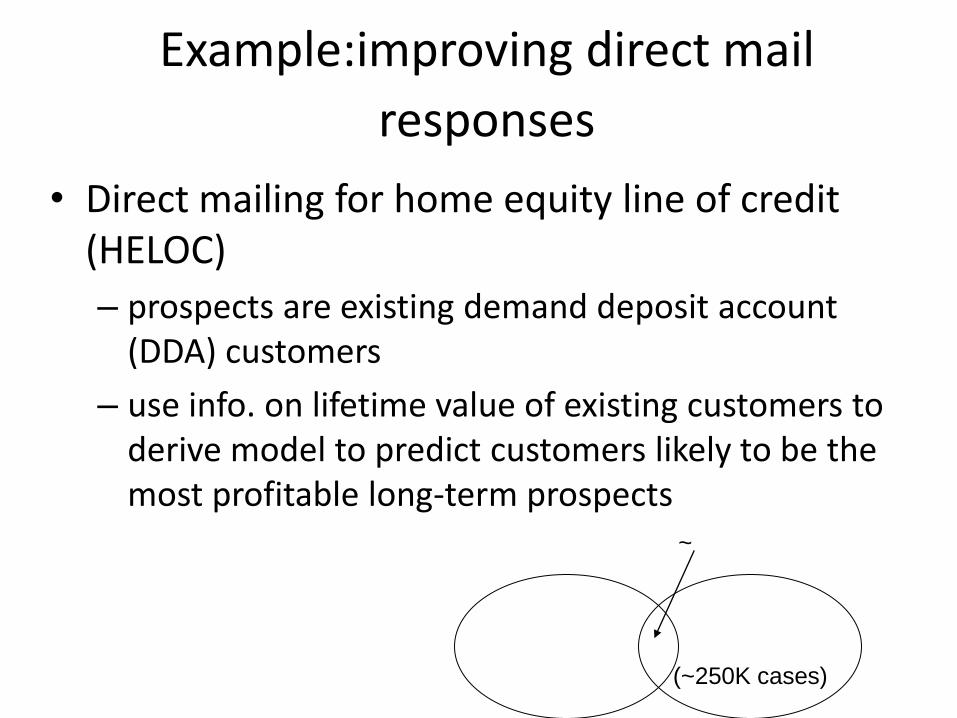
• Direct mailing for home equity line of credit (HELOC)
– prospects are existing demand deposit account (DDA) customers
– use info. on lifetime value of existing customers to derive model to predict customers likely to be the most profitable long-term prospects
DDA
customers
(~250K cases)
HELOC
customers
~ 40K cases

Example • Data
– DDA history of loan balances over 3,6,9,12,18 months, returned checks
– demographic data (age, income, length of residence, etc.), both internal and external
– property data sourced externally (home purchase price, loan-to-value ratio, etc.)
– credit worthiness data – response to previous mailings
– 120 variables selected
– less than half the DDAs had history records; missing fields; (45 K cases remaining for use -- prospects database)
– exclude variables like sex, race, age (legal restrictions)
• Neural network (radial basis function) model for value prediction
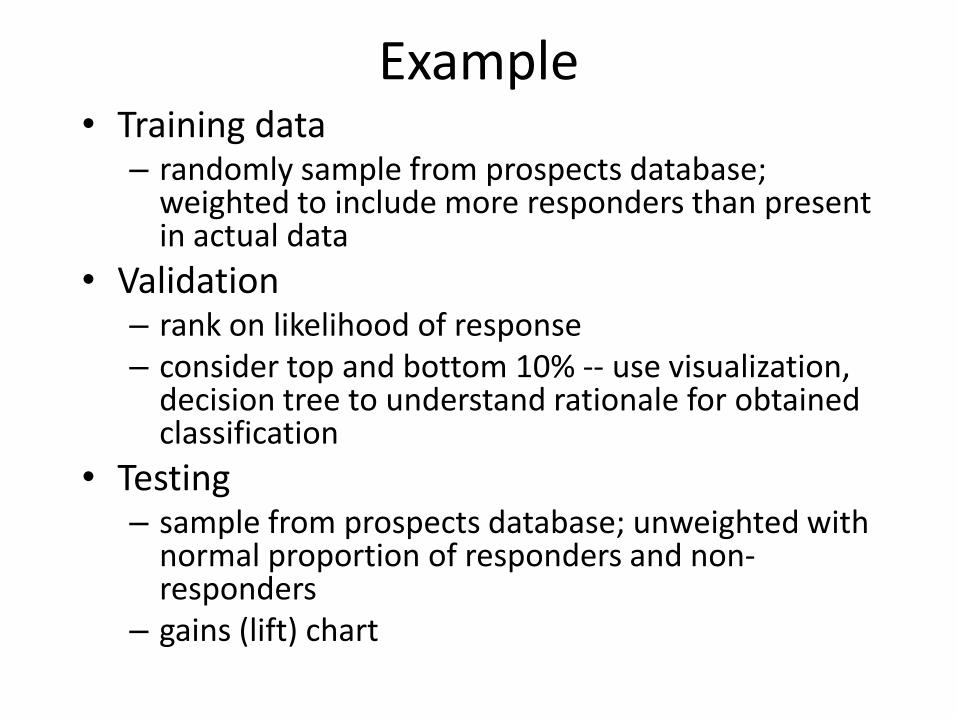
Example • Training data
– randomly sample from prospects database; weighted to include more responders than present in actual data
• Validation – rank on likelihood of response – consider top and bottom 10% -- use visualization,
decision tree to understand rationale for obtained classification
• Testing – sample from prospects database; unweighted with
normal proportion of responders and non-responders
– gains (lift) chart
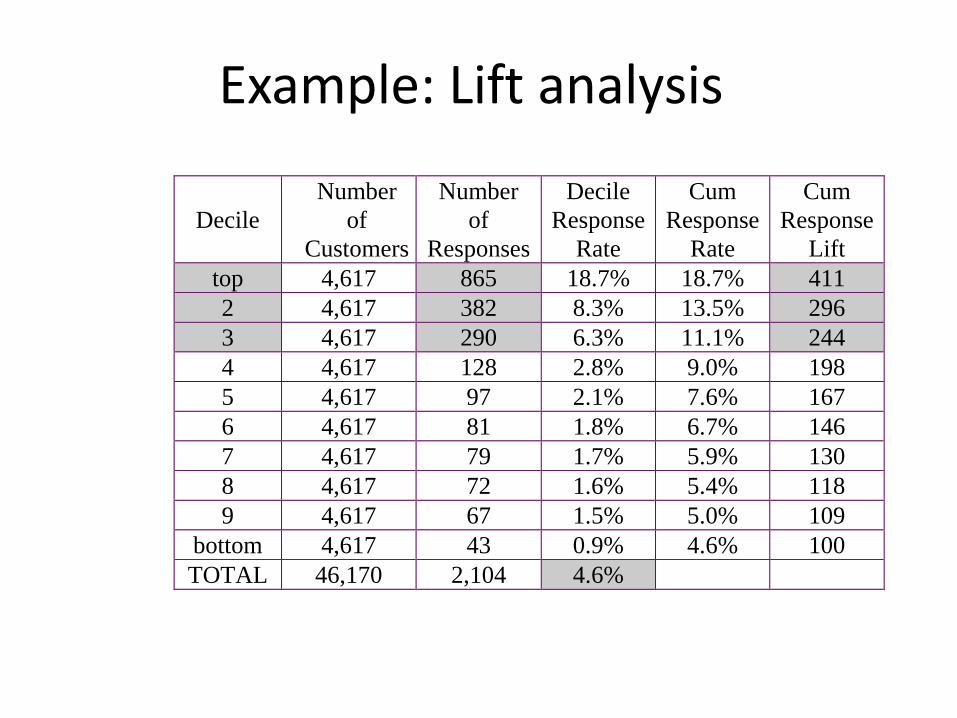
Example: Lift analysis
Decile
Number
of
Customers
Number
of
Responses
Decile
Response
Rate
Cum
Response
Rate
Cum
Response
Lift
top 4,617 865 18.7% 18.7% 411
2 4,617 382 8.3% 13.5% 296
3 4,617 290 6.3% 11.1% 244
4 4,617 128 2.8% 9.0% 198
5 4,617 97 2.1% 7.6% 167
6 4,617 81 1.8% 6.7% 146
7 4,617 79 1.7% 5.9% 130
8 4,617 72 1.6% 5.4% 118
9 4,617 67 1.5% 5.0% 109
bottom 4,617 43 0.9% 4.6% 100
TOTAL 46,170 2,104 4.6%

Online Analytical Processing (OLAP)
• OLAP designates a category of applications and technologies that allow the collection, storage, manipulation and reproduction of multidimensional data, with the goal of analysis.
• The process of converting raw data into business information through multidimensional analysis

What and Why OLAP?
• OLAP is the term that describes a technology that uses multi-dimensional view of aggregate data to provide quick access to strategic information for the purposes of advanced analysis.
• OLAP enables users to gain a deeper understanding and knowledge about various aspects of their corporate data through fast, consistent, interactive access to a variety of possible views of data.
• While OLAP systems can easily answer ‘who?’ and ‘what?’ questions, it is easier ability to answer ‘what if?’ and ‘why?’ type questions that distinguishes them from general-purpose query tools.
• The types of analysis available from OLAP range from basic navigation and browsing (referred to as ‘slicing’ and dicing’) , to calculations, to more complex analysis such as time series and complex modeling.
OLAP, by Dr. Khalil 119

OLAP Supports management-critical tasks through
analytical investigation of complex data associations captured in data warehouses:
Consolidation is the aggregation or roll-up of data.
Drill-down allows the user to see data in selective increasing levels of detail.
Slicing and Dicing enables the user to examine data from different viewpoints often performed along a time axis to depict trends and patterns.
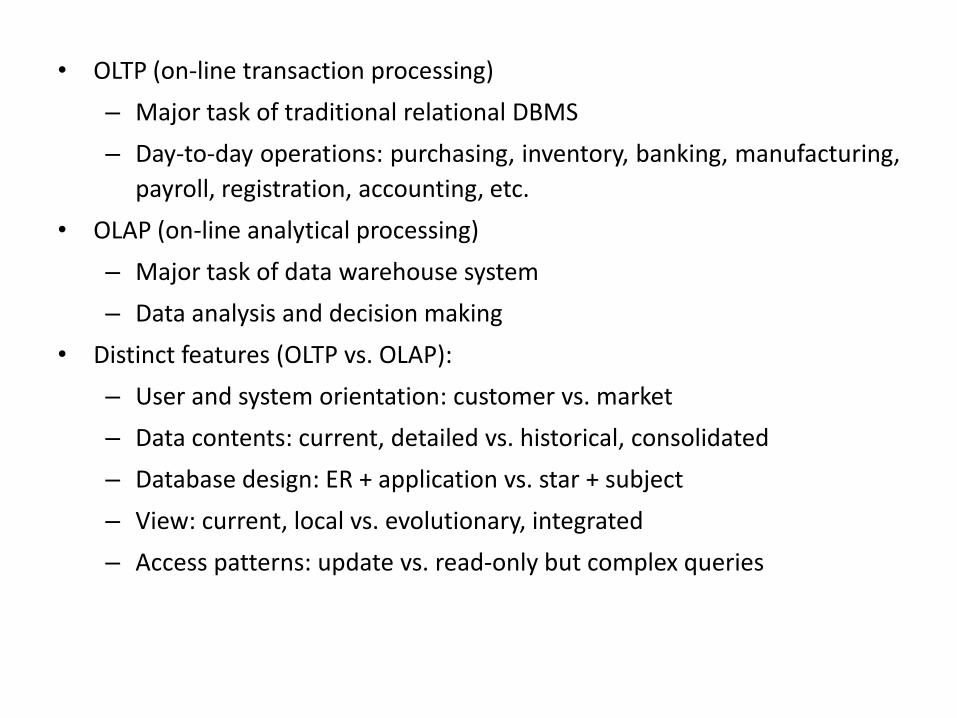
• OLTP (on-line transaction processing)
– Major task of traditional relational DBMS
– Day-to-day operations: purchasing, inventory, banking, manufacturing,
payroll, registration, accounting, etc.
• OLAP (on-line analytical processing)
– Major task of data warehouse system
– Data analysis and decision making
• Distinct features (OLTP vs. OLAP):
– User and system orientation: customer vs. market
– Data contents: current, detailed vs. historical, consolidated
– Database design: ER + application vs. star + subject
– View: current, local vs. evolutionary, integrated
– Access patterns: update vs. read-only but complex queries

OLTP vs. OLAP OLTP OLAP
users clerk, IT professional knowledge worker
function day to day operations decision support
DB design application-oriented subject-oriented
data current, up-to-date
detailed, flat relational
isolated
historical,
summarized, multidimensional
integrated, consolidated
usage repetitive ad-hoc
access read/write
index/hash on prim. key
lots of scans
unit of work short, simple transaction complex query
# records accessed tens millions
#users thousands hundreds
DB size 100MB-GB 100GB-TB
metric transaction throughput query throughput, response
122
February 18, 2014 123
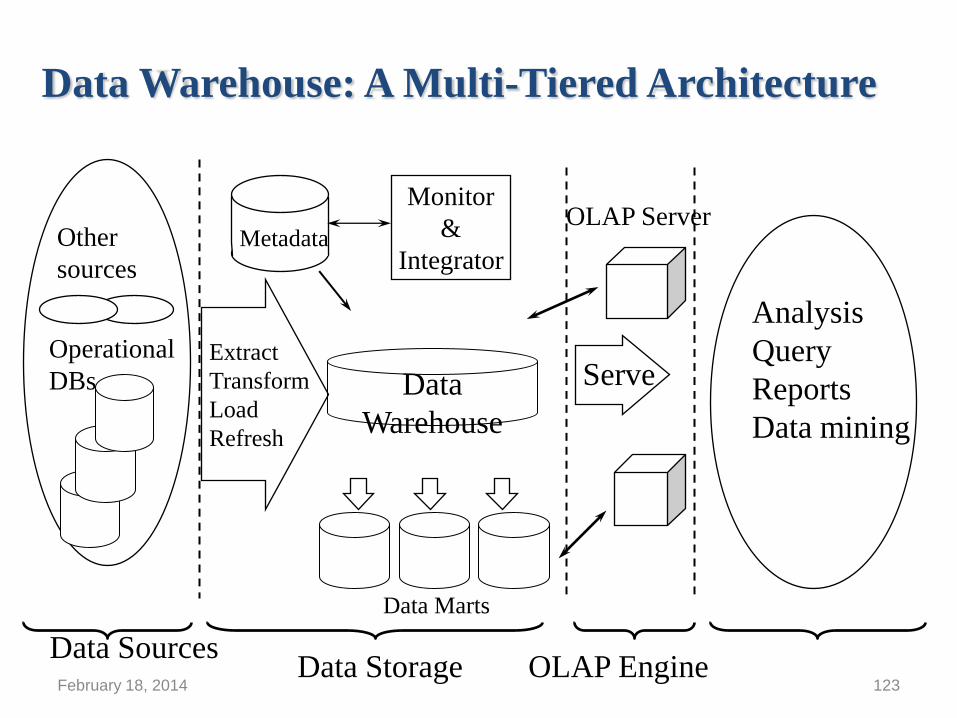
Data Warehouse: A Multi-Tiered Architecture
Data
Warehouse
Extract
Transform
Load
Refresh
OLAP Engine
Analysis
Query
Reports
Data mining
Monitor
&
Integrator Metadata
Data Sources Front-End Tools
Serve
Data Marts
Operational
DBs
Other
sources
Data Storage
OLAP Server
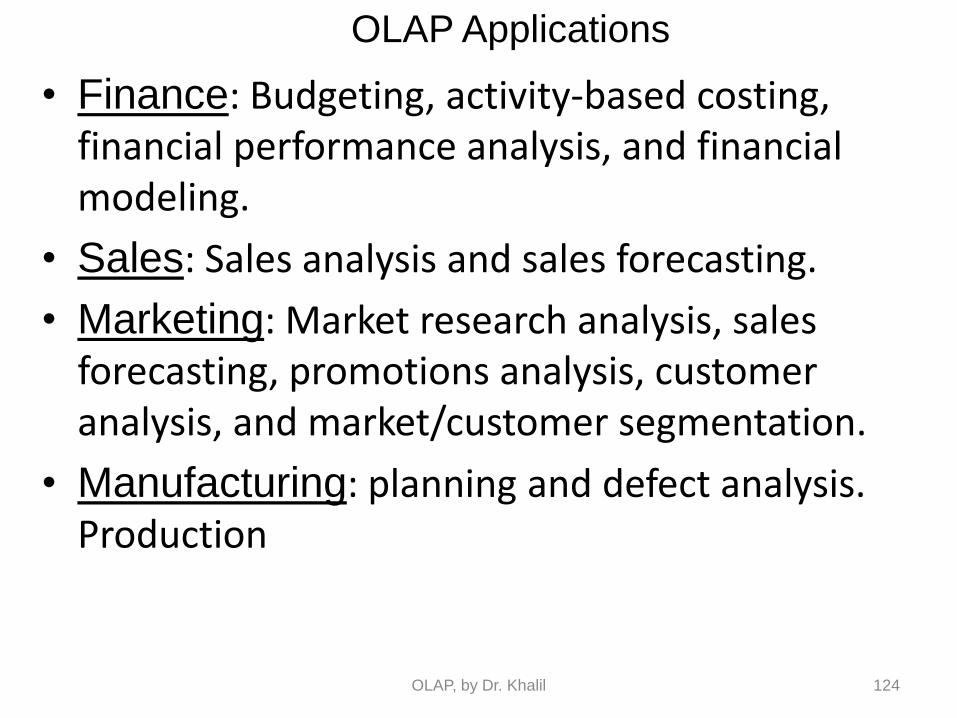
OLAP Applications
• Finance: Budgeting, activity-based costing, financial performance analysis, and financial modeling.
• Sales: Sales analysis and sales forecasting.
• Marketing: Market research analysis, sales forecasting, promotions analysis, customer analysis, and market/customer segmentation.
• Manufacturing: planning and defect analysis. Production
OLAP, by Dr. Khalil 124
Features of OLAP • Multi-dimensional views of data
• Calculation-intensive capabilities
• Time intelligence

Representation of Multi-Dimensional Data
• OLAP database servers use multi-dimensional structures to store data and relationships between data.
• Multi-dimensional structures are best-visualized as cubes of data, and cubes within cubes of data. Each side of a cube is a dimension.
OLAP, by Dr. Khalil 126

Representation of Multi-Dimensional Data
• Multi-dimensional databases are a compact and easy-to-understand way of visualizing and manipulating data elements that have many inter-relationships.
• The cube can be expanded to include another dimension, for example, the number of sales staff in each city.
• The response time of a multi-dimensional query depends on how many cells have to be added on-the-fly.
• As the number of dimensions increases, the number of cube’s cells increases exponentially.
OLAP, by Dr. Khalil 127
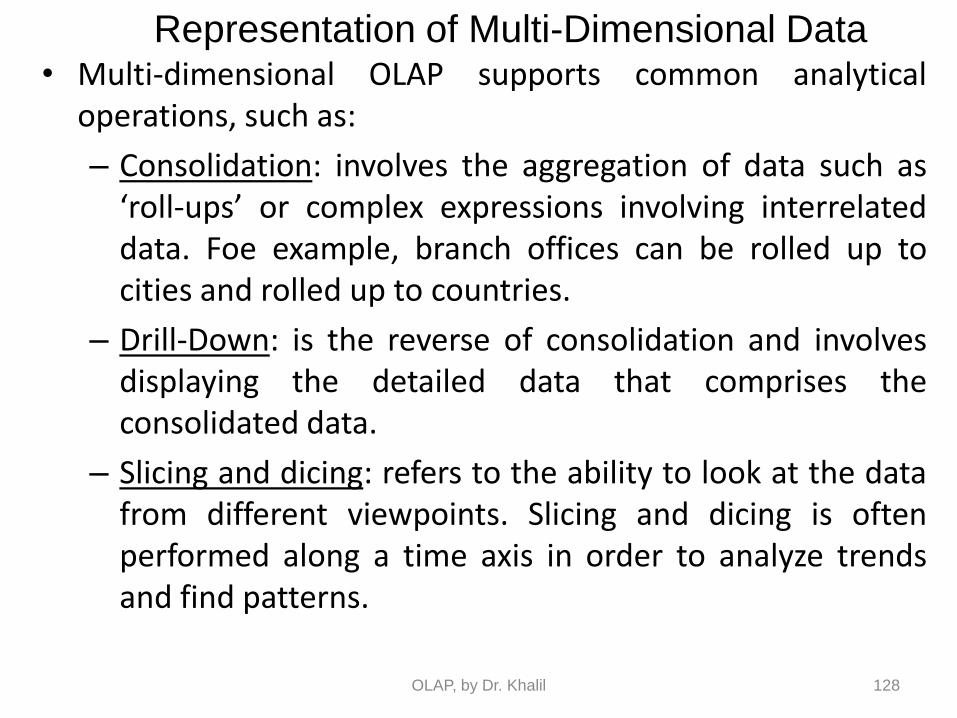
Representation of Multi-Dimensional Data • Multi-dimensional OLAP supports common analytical
operations, such as:
– Consolidation: involves the aggregation of data such as ‘roll-ups’ or complex expressions involving interrelated data. Foe example, branch offices can be rolled up to cities and rolled up to countries.
– Drill-Down: is the reverse of consolidation and involves displaying the detailed data that comprises the consolidated data.
– Slicing and dicing: refers to the ability to look at the data from different viewpoints. Slicing and dicing is often performed along a time axis in order to analyze trends and find patterns.
OLAP, by Dr. Khalil 128

OLAP Benefits • Increased productivity of business end-users, IT developers,
and consequently the entire organization.
• Reduced backlog of applications development for IT staff by making end-users self-sufficient enough to make their own schema changes and build their own models.
• Retention of organizational control over the integrity of corporate data as OLAP applications are dependent on data warehouses and OLTP systems to refresh their source data level.
• Reduced query drag and network traffic on OLTP systems or on the data warehouse.
• Improved potential revenue and profitability by enabling the organization to respond more quickly to market demands.
OLAP, by Dr. Khalil 129

OLAP Tools - Features
• In 1993, E.F. Codd formulated twelve rules as the basis for selecting OLAP tools:
– Multi-dimensional conceptual view
– Transparency
– Accessibility
– Consistent reporting performance
– Client-server architecture
– Generic dimensionality
– Dynamic sparse matrix handling
– Multi-user support
– Unrestricted cross-dimensional operations
– Intuitive data manipulation
– Flexible reporting
– Unlimited dimensions and aggregation levels
OLAP, by Dr. Khalil 130
Types OLAP • Multidimensional
• Relational
• Hybrid
• Desktop OLAP
• Real-Time OLAP
• Web-based OLAP

Multi-dimensional OLAP (MOLAP)
• MOLAP tools use specialized data structures and multi-dimensional database management systems (MDDBMS) to organize, navigate, and analyze data.
• To enhance query performance the data is typically aggregated and stored according to predicted usage.
• MOLAP data structures use array technology and efficient storage techniques that minimize the disk space requirements through sparse data management.
• The development issues associated with MOLAP:
– Only a limited amount of data can be efficiently stored and analyzed.
– Navigation and analysis of data are limited because the data is designed according to previously determined requirements.
– MOLAP products require a different set of skills and tools to build and maintain the database.
OLAP, by Dr. Khalil 132
Advantages of MOLAP • Fast query performance due to optimized storage,
multidimensional indexing and caching.
• Smaller on-disk size of data compared to data stored in relational database due to compression techniques.
• Automated computation of higher level aggregates of the data.
• It is very compact for low dimension data sets.
• Array models provide natural indexing.
• Effective data extraction achieved through the pre-structuring of aggregated data.
Disadvantages of MOLAP • Within some MOLAP Solutions the processing step (data
load) can be quite lengthy, especially on large data volumes. This is usually remedied by doing only incremental processing, i.e., processing only the data which have changed (usually new data) instead of reprocessing the entire data set.
• MOLAP tools traditionally have difficulty querying models with dimensions with very high cardinality (i.e., millions of members).
cont
• Some MOLAP products have difficulty updating and querying models with more than ten dimensions. This limit differs depending on the complexity and cardinality of the dimensions in question. It also depends on the number of facts or measures stored. Other MOLAP products can handle hundreds of dimensions.
• Some MOLAP methodologies introduce data redundancy.
Relational OLAP
• ROLAP works directly with relational databases. The base data and the dimension tables are stored as relational tables and new tables are created to hold the aggregated information.
• ROLAP tools do not use pre-calculated data cubes.
• ROLAP also has the ability to drill down to the lowest level of detail in the database.
Relational OLAP (ROLAP)
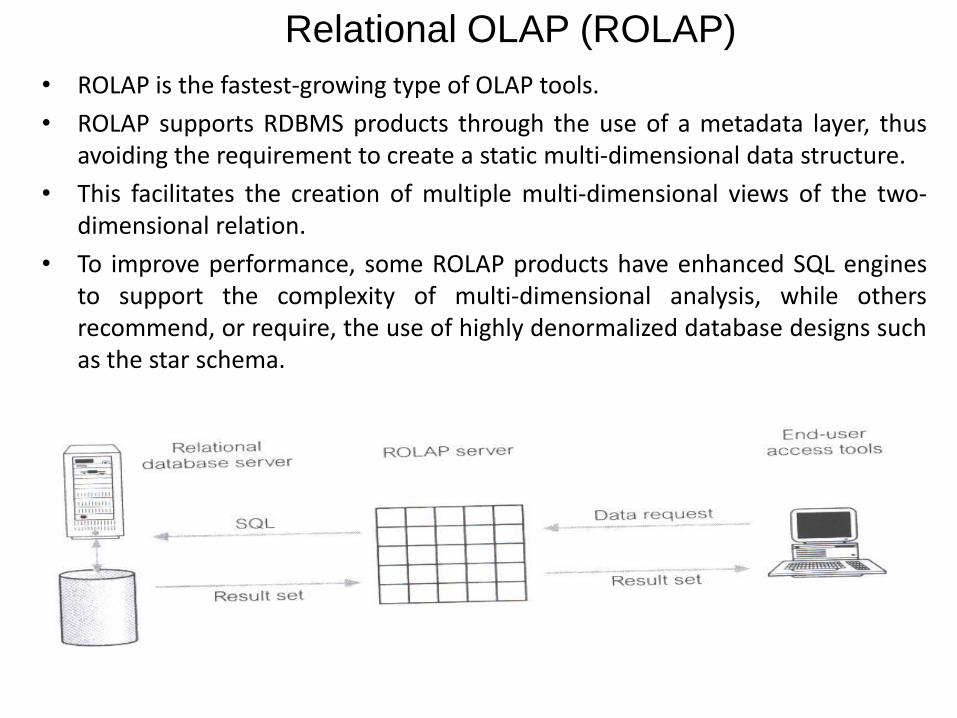
• ROLAP is the fastest-growing type of OLAP tools.
• ROLAP supports RDBMS products through the use of a metadata layer, thus avoiding the requirement to create a static multi-dimensional data structure.
• This facilitates the creation of multiple multi-dimensional views of the two-dimensional relation.
• To improve performance, some ROLAP products have enhanced SQL engines to support the complexity of multi-dimensional analysis, while others recommend, or require, the use of highly denormalized database designs such as the star schema.
OLAP, by Dr. Khalil 137

cont
• The development issues associated with ROLAP technology:
– Performance problems associated with the processing of complex queries that require multiple passes through the relational data.
– Development of middleware to facilitate the development of multi-dimensional applications.
– Development of an option to create persistent multi-dimensional structures, together with facilities o assist in the administration of these structures.

Advantages of ROLAP • ROLAP is considered to be more scalable in handling
large data volumes, especially models with dimensions with very high cardinality (i.e., millions of members).
• With a variety of data loading tools available, and the ability to fine tune the ETL code to the particular data model, load times are generally much shorter than with the automated MOLAP loads.
• The data are stored in a standard relational database and can be accessed by any SQL reporting tool (the tool does not have to be an OLAP tool).
cont • ROLAP tools are better at handling non-aggregatable facts
(e.g., textual descriptions). MOLAP tools tend to suffer from slow performance when querying these elements.
• By decoupling the data storage from the multi-dimensional model, it is possible to successfully model data that would not otherwise fit into a strict dimensional model.
• The ROLAP approach can leverage database authorization controls such as row-level security, whereby the query results are filtered depending on preset criteria applied, for example, to a given user or group of users (SQL WHERE clause).
Disadvantages of ROLAP • There is a consensus in the industry that ROLAP tools have
slower performance than MOLAP tools. However, see the discussion below about ROLAP performance.
• The loading of aggregate tables must be managed by custom ETL code. The ROLAP tools do not help with this task. This means additional development time and more code to support.
• When the step of creating aggregate tables is skipped, the query performance then suffers because the larger detailed tables must be queried. This can be partially remedied by adding additional aggregate tables, however it is still not practical to create aggregate tables for all combinations of dimensions/attributes.

cont • ROLAP relies on the general purpose database for querying and
caching, and therefore several special techniques employed by MOLAP tools are not available (such as special hierarchical indexing). However, modern ROLAP tools take advantage of latest improvements in SQL language such as CUBE and ROLLUP operators, DB2 Cube Views, as well as other SQL OLAP extensions. These SQL improvements can mitigate the benefits of the MOLAP tools.
• Since ROLAP tools rely on SQL for all of the computations, they are not suitable when the model is heavy on calculations which don't translate well into SQL. Examples of such models include budgeting, allocations, financial reporting and other scenarios.
Hybrid OLAP (HOLAP)
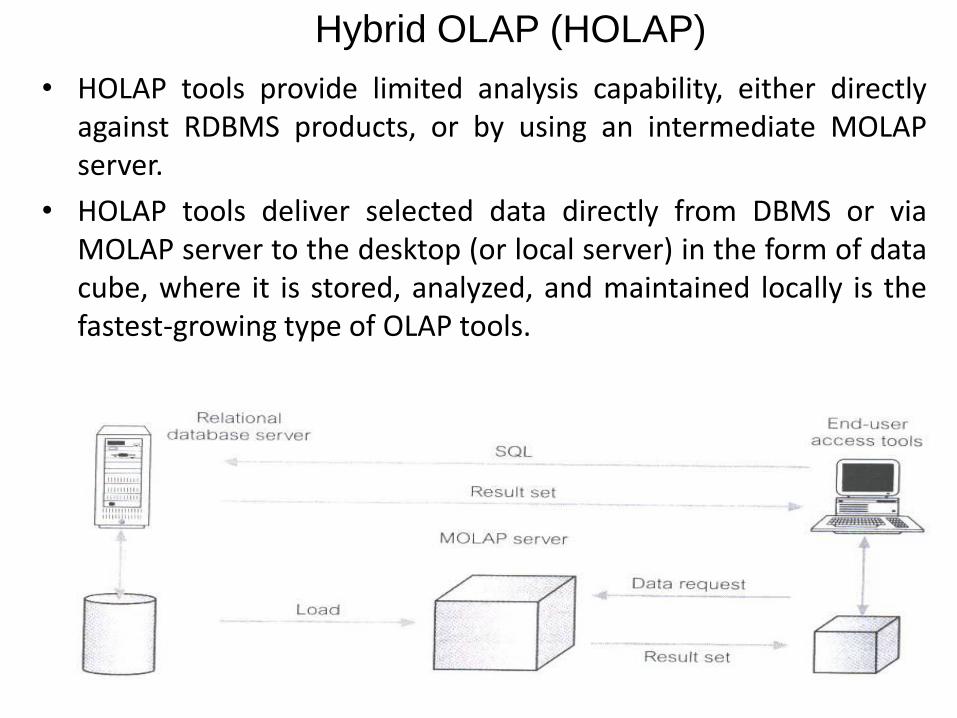
• HOLAP tools provide limited analysis capability, either directly against RDBMS products, or by using an intermediate MOLAP server.
• HOLAP tools deliver selected data directly from DBMS or via MOLAP server to the desktop (or local server) in the form of data cube, where it is stored, analyzed, and maintained locally is the fastest-growing type of OLAP tools.
OLAP, by Dr. Khalil 143
cont
• The issues associated with HOLAP tools:
– The architecture results in significant data redundancy and may cause problems for networks that support many users.
– Ability of each user to build a custom data cube may cause a lack of data consistency among users.
– Only a limited amount of data can be efficiently maintained.
Hybrid
• There is no clear agreement across the industry as to what constitutes "Hybrid OLAP", except that a database will divide data between relational and specialized storage.
• HOLAP addresses the shortcomings of MOLAP and ROLAP by combining the capabilities of both approaches. HOLAP tools can utilize both pre-calculated cubes and relational data sources

Desktop OLAP (DOLAP)
• DOLAP tools store the OLAP data in client-based files and support multi-dimensional processing using a client multi-dimensional engine. DOLAP requires that relatively small extracts of data are held on client machines. This data may be distributed in advance or on demand (possibly through the Web).
OLAP, by Dr. Khalil 146

cont
• The administration of a DOLAP database is typically performed by a central server or processing routine that prepares data cubes or sets of data for each user.
• The development issues associated with DOLAP are as follows: – Provision of appropriate security controls to support
all parts of the DOLAP environment. – Reduction in the effort involved in deploying and
maintaining the DOLAP tools. – Current trends are towards thin client machines.
RTOLAP - Real Time OLAP
• A Real Time OLAP Server will calculate the values on the fly, when they are required. The essential characteristic of RTOLAP system is in holding all the data in RAM.
Comparison • Some MOLAP implementations are prone to database
explosion, a phenomenon causing vast amounts of storage space to be used by MOLAP databases when certain common conditions are met: high number of dimensions, pre-calculated results and sparse multidimensional data.
• MOLAP generally delivers better performance due to specialized indexing and storage optimizations. MOLAP also needs less storage space compared to ROLAP because the specialized storage typically includes compression techniques.[15]
• ROLAP is generally more scalable. However, large volume pre-processing is difficult to implement efficiently so it is frequently skipped. ROLAP query performance can therefore suffer tremendously.
• Since ROLAP relies more on the database to perform calculations, it has more limitations in the specialized functions it can use.
• HOLAP encompasses a range of solutions that attempt to mix the best of ROLAP and MOLAP. It can generally pre-process swiftly, scale well, and offer good function support.

OLAP Server Architectures • Relational OLAP (ROLAP)
– Use relational or extended-relational DBMS to store and manage
warehouse data and OLAP middle ware
– Include optimization of DBMS backend, implementation of aggregation
navigation logic, and additional tools and services
– Greater scalability
• Multidimensional OLAP (MOLAP)
– Sparse array-based multidimensional storage engine
– Fast indexing to pre-computed summarized data
• Hybrid OLAP (HOLAP) (e.g., Microsoft SQLServer)
– Flexibility, e.g., low level: relational, high-level: array
• Specialized SQL servers (e.g., Redbricks)
– Specialized support for SQL queries over star/snowflake schemas
February 18, 2014 Data Mining: Concepts and Techniques 151

What is a Supply Chain?
A supply chain is the system of organizations, people, activities, information and resources involved in moving a product or service from supplier to customer.
Supply chain activities transform raw materials and components into a finished product that is delivered to the end customer.
Supplier Manufacturer Distributor Retailer Customers
What is Supply Chain Management (SCM) ?
• SCM is a set of approaches utilized to efficiently integrate suppliers, manufacturers, warehouses, and stores, so that merchandise is produced and distributed at the right quantities, to the right locations, and at the right time, in order to minimize systemwide costs while satisfying service level requirements.
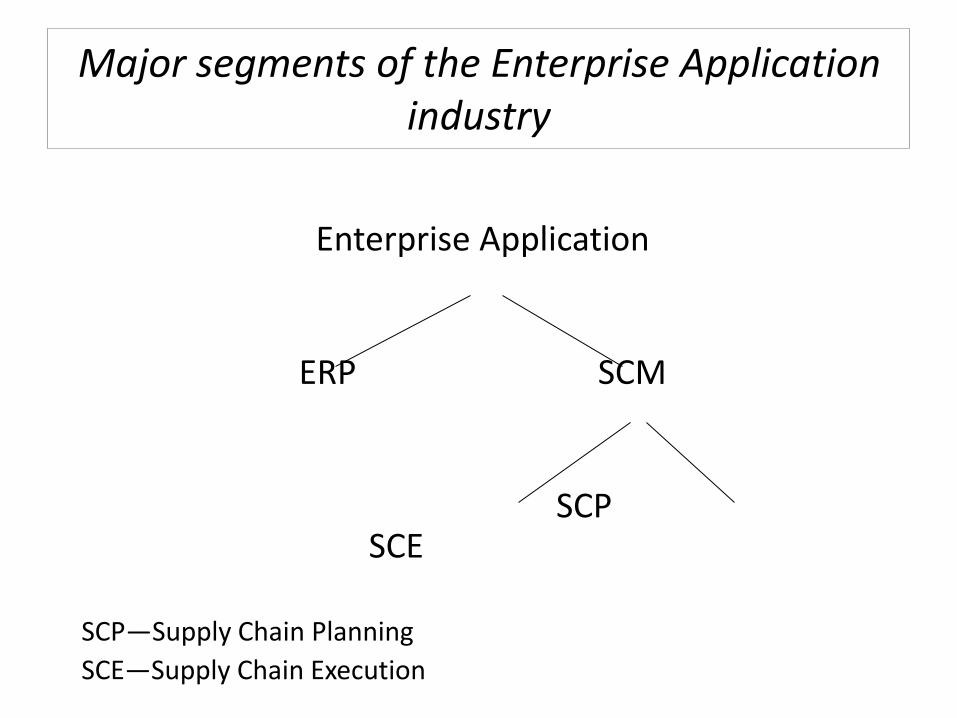
Major segments of the Enterprise Application industry
Enterprise Application
ERP SCM
SCP SCE
SCP—Supply Chain Planning
SCE—Supply Chain Execution

Origins of Supply Chain Management
1950s & 1960s
U.S. manufacturers focused on mass production techniques as
their principal cost reduction and productivity improvement strategies
1960s-1970s
Introduction of new computer technology lead to
development of Materials Requirements Planning (MRP) and Manufacturing Resource Planning (MRPII) to coordinate inventory management and improve internal communication
Origins of Supply Chain Management (Cont.)
1980s & 1990s
Intense global competition led U.S. manufacturers to adopt Supply Chain Management along with
Just-In-Time (JIT),
Total Quality Management (TQM), and
Business Process Reengineering (BPR) practices
Origins of Supply Chain Management –Cont.
2000s and Beyond Industrial buyers will rely more on third-party
service providers (3PLs) to improve purchasing and supply management
Wholesalers/retailers will focus on transportation and logistics more & refer to these as quick response, service response logistics, and integrated logistics
157

The Foundations of Supply Chain Management
Supply
Management
Supplier management, supplier evaluation,
supplier certification, strategic partnerships
Operations Demand management, MRP, ERP, inventory
visibility, JIT , TQM ( Six Sigma)
Distribution
Transportation management, customer
relationship management, distribution network,
perfect order fulfillment, global supply chains,
service response logistics
Integration Process integration, performance measurement
158

Important Elements of Supply Chain Management (Cont.)
Operations Trends:
– Demand management- match
demand to available capacity
– Linking buyers & suppliers via MRP and ERP systems
– Use JIT to improve the “pull” of materials to reduce inventory levels
– Employ TQM to improve quality compliance among suppliers
159
Important Elements of Supply Chain Management (Cont.)
Distribution Trends:
– Transportation management- tradeoff decisions between cost & timing of delivery/customer service via trucks, rail, water & air
– Customer relationship management- strategies to ensure deliveries, resolve complaints, improve communications, & determine service requirements
160

Important Elements of Supply Chain Management (Cont.)
Integration Trends:
– Supply Chain Process Integration- when supply chain participants work for common goals. Requires intra-firm functional integration. Based on efforts to change attitudes & adversarial relationships
– Supply Chain Performance Measurement- Crucial for firms to know if procedures are working
© 2009 South-Western, a
division of Cengage
Learning
161
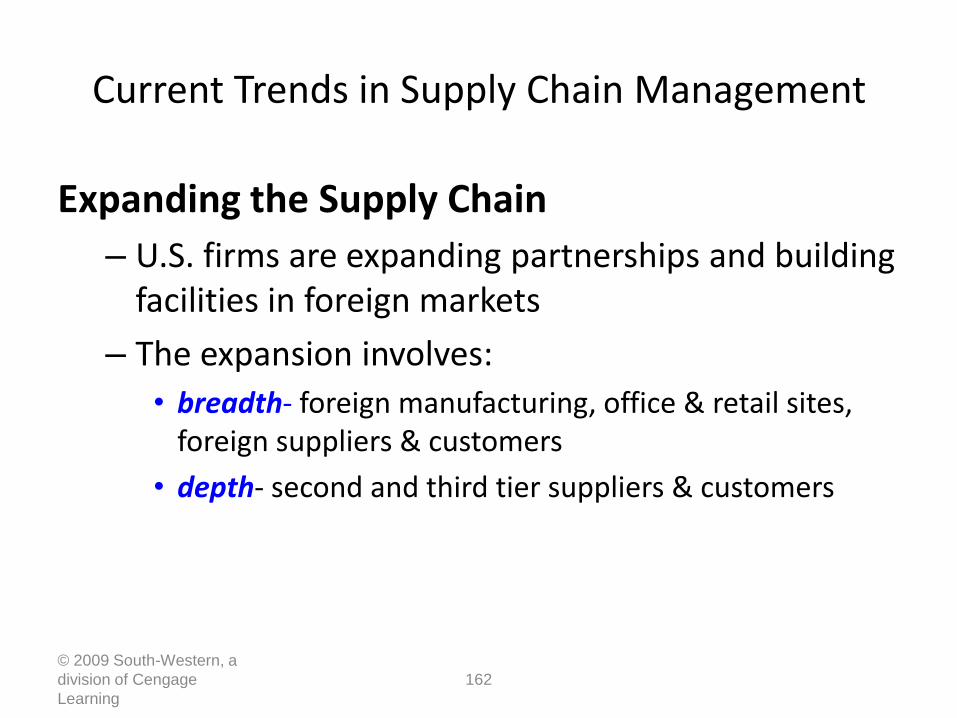
Current Trends in Supply Chain Management
Expanding the Supply Chain
– U.S. firms are expanding partnerships and building facilities in foreign markets
– The expansion involves:
• breadth- foreign manufacturing, office & retail sites, foreign suppliers & customers
• depth- second and third tier suppliers & customers
© 2009 South-Western, a
division of Cengage
Learning
162

Current Trends in Supply Chain Management (Cont.)
Increasing Supply Chain Responsiveness
– Firms will increasingly need to be more flexible and responsive to customer needs
– Supply chains will need to benchmark industry performance and meet and improve on a continuous basis
– Responsiveness improvement will come from more effective and faster product & service delivery systems
163
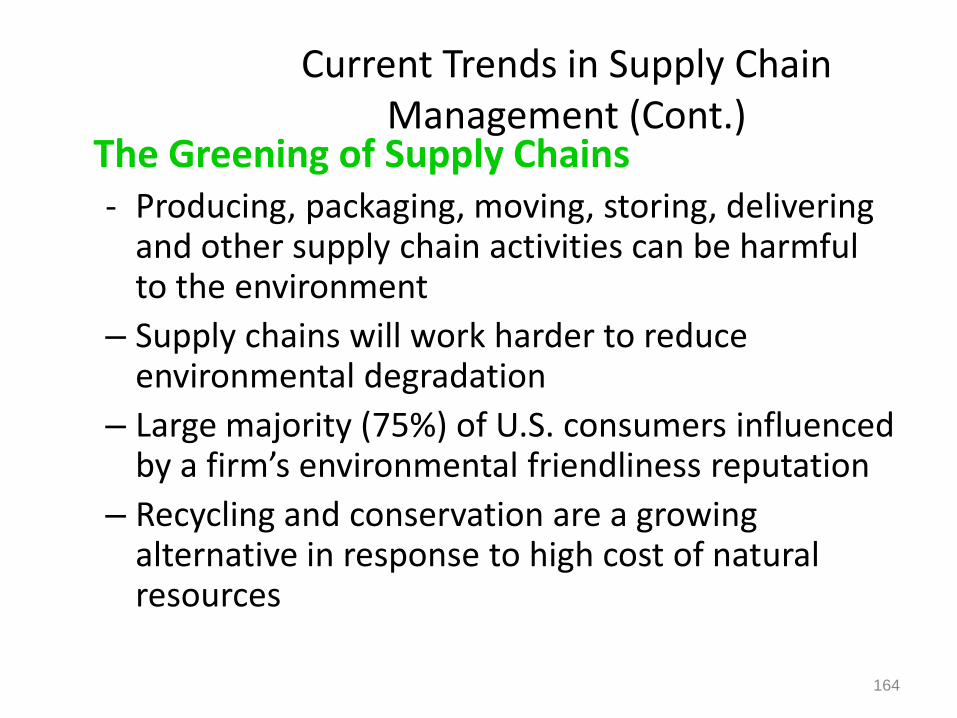
Current Trends in Supply Chain Management (Cont.)
The Greening of Supply Chains - Producing, packaging, moving, storing, delivering
and other supply chain activities can be harmful to the environment
– Supply chains will work harder to reduce environmental degradation
– Large majority (75%) of U.S. consumers influenced by a firm’s environmental friendliness reputation
– Recycling and conservation are a growing alternative in response to high cost of natural resources
164
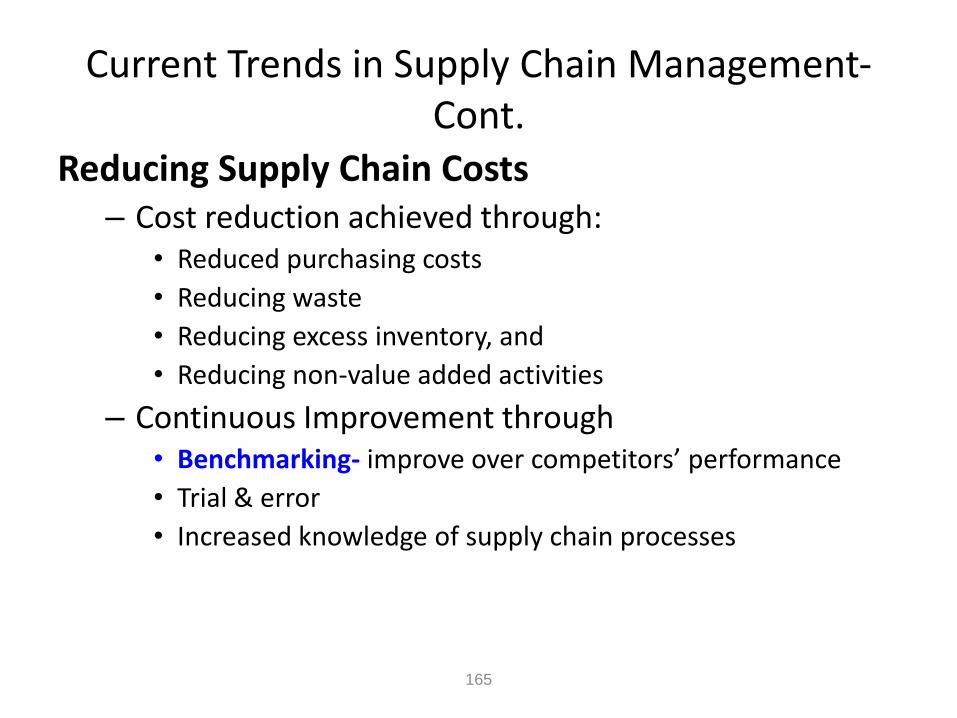
Current Trends in Supply Chain Management- Cont.
Reducing Supply Chain Costs – Cost reduction achieved through:
• Reduced purchasing costs
• Reducing waste
• Reducing excess inventory, and
• Reducing non-value added activities
– Continuous Improvement through • Benchmarking- improve over competitors’ performance
• Trial & error
• Increased knowledge of supply chain processes
165
Sharing data electronically-Adv
• Lower inventories
• Lower financing cost
• Shorter receivable cycles
• Faster response to market change
• Greater satisfaction and loyalty among customers
• Greater profitability
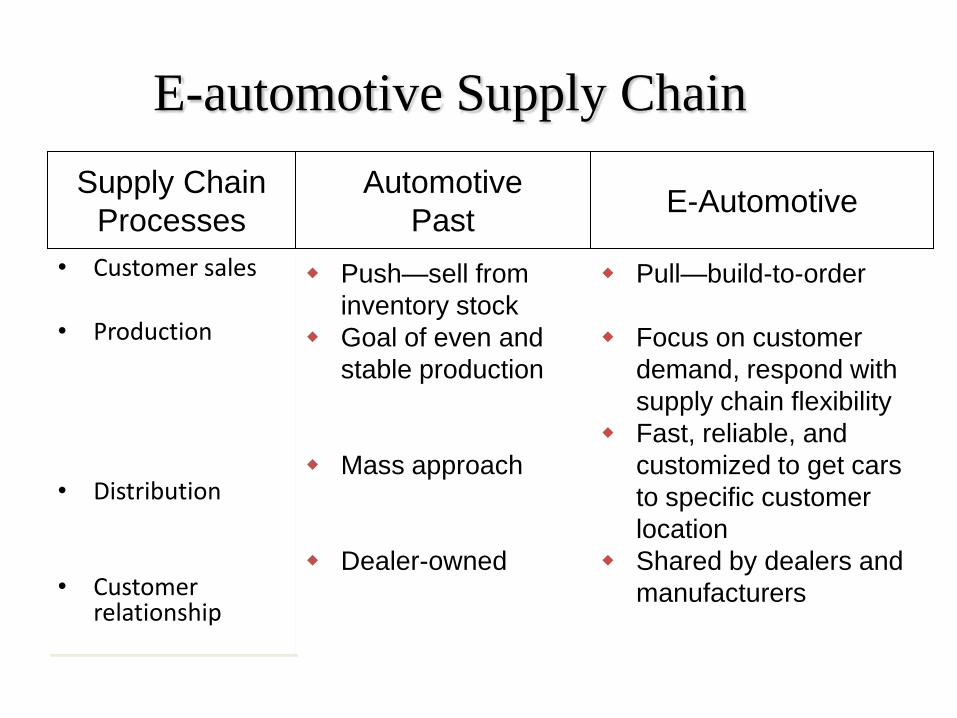
• Customer sales
• Production
• Distribution
• Customer relationship
Push—sell from
inventory stock
Goal of even and
stable production
Mass approach
Dealer-owned
E-Automotive
E-automotive Supply Chain
Pull—build-to-order
Focus on customer
demand, respond with
supply chain flexibility
Fast, reliable, and
customized to get cars
to specific customer
location
Shared by dealers and
manufacturers
Automotive
Past
Supply Chain
Processes
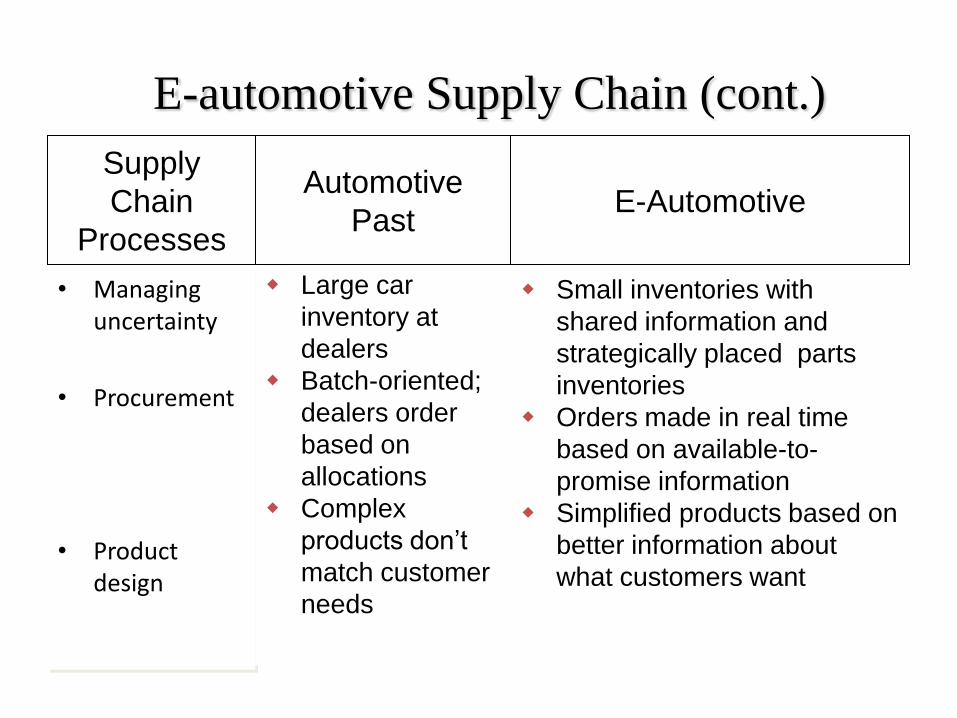
• Managing uncertainty
• Procurement
• Product design
Large car
inventory at
dealers
Batch-oriented;
dealers order
based on
allocations
Complex
products don’t
match customer
needs
E-Automotive
E-automotive Supply Chain (cont.)
Small inventories with
shared information and
strategically placed parts
inventories
Orders made in real time
based on available-to-
promise information
Simplified products based on
better information about
what customers want
Automotive
Past
Supply
Chain
Processes

Adv of SCM
• Supply chain planning and collaboration
• Supply chain execution
• Supply chain visibility design and analytics
• Business benefits
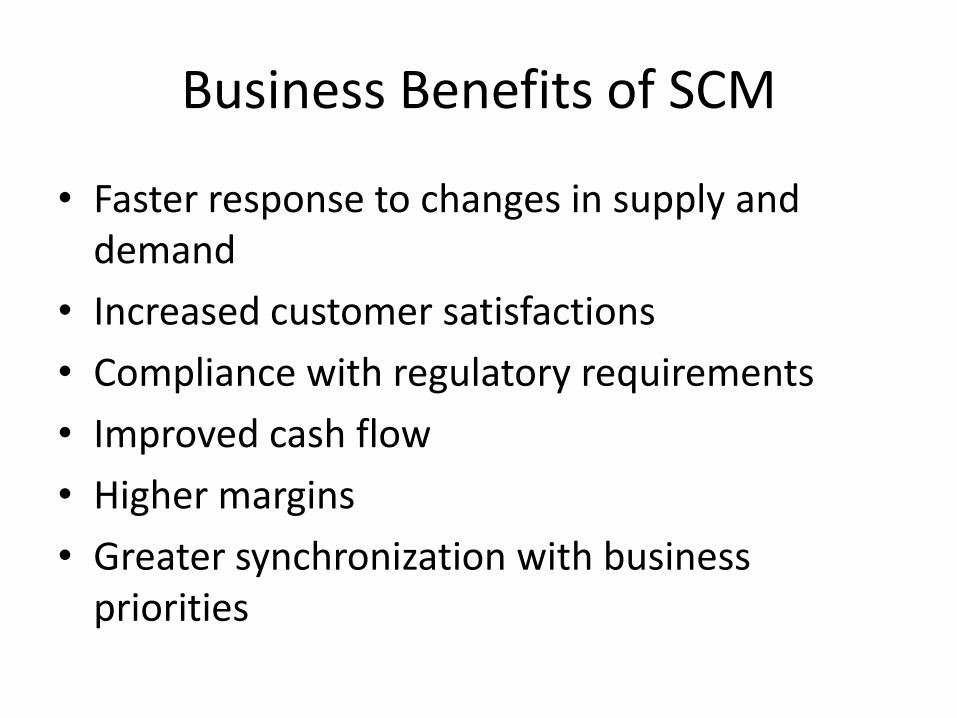
Business Benefits of SCM
• Faster response to changes in supply and demand
• Increased customer satisfactions
• Compliance with regulatory requirements
• Improved cash flow
• Higher margins
• Greater synchronization with business priorities
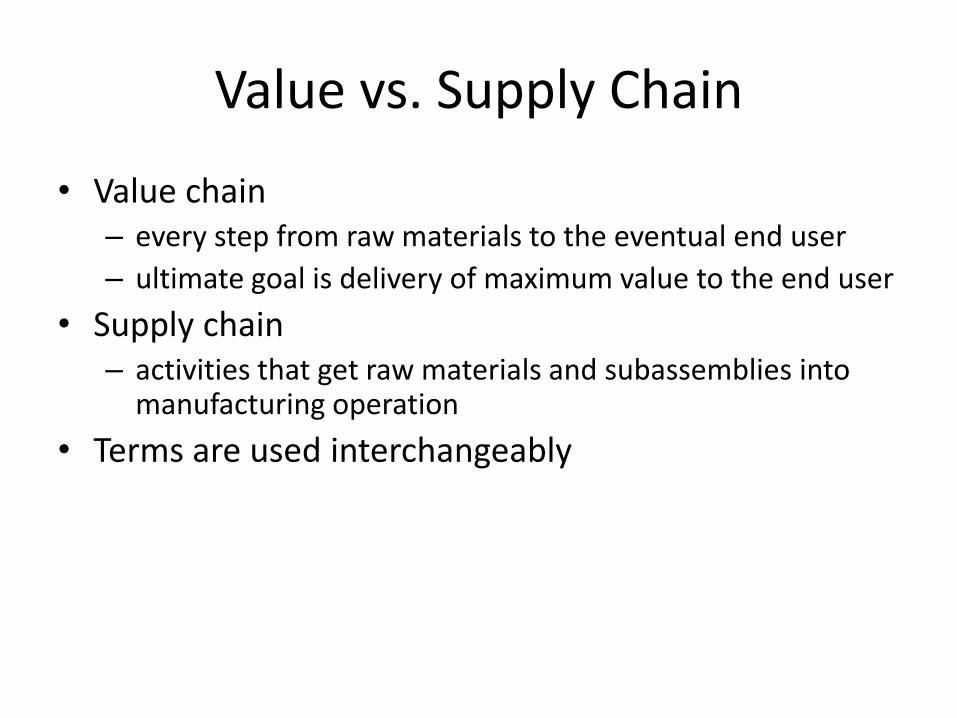
Value vs. Supply Chain
• Value chain – every step from raw materials to the eventual end user
– ultimate goal is delivery of maximum value to the end user
• Supply chain – activities that get raw materials and subassemblies into
manufacturing operation
• Terms are used interchangeably
Supply Chain Management – Important
• Why is supply chain management so important? – To gain efficiencies from procurement, distribution and logistics
– To make outsourcing more efficient
– To reduce transportation costs of inventories
– To meet competitive pressures from shorter development times, more new products, and demand for more customization
– To meet the challenge of globalization and longer supply chains
– To meet the new challenges from e-commerce
– To manage the complexities of supply chains
– To manage the inventories needed across the supply chain
Supply Chain Management
• Why is supply chain management difficult? – Different organizations in the supply chain may have different,
conflicting objectives
• Manufacturers: long run production, high quality, high productivity, low production cost
• Distributors: low inventory, reduced transportation costs, quick replenishment capability
• Customers: shorter order lead time, high in-stock inventory, large variety of products, low prices
– Supply chains are dynamic - they evolve and change over time
Supply Chain Management - Issues
• Strategic, tactical and operating issues – Strategic - long term and dealing with supply chain design
• Determining the number, location and capacity of facilities
• Make or buy decisions
• Forming strategic alliances
– Tactical - intermediate term
• Determining inventory levels
• Quality-related decisions
• Logistics decisions
– Operating - near term
• Production planning and control decisions
• Goods and service delivery scheduling
• Some make or buy decisions
Supply Chain Management - Issues
• Key issues in supply chain management include – Distribution network configuration
• How many warehouses do we need?
• Where should these warehouses be located?
• What should the production levels be at each of our plants?
• What should the transportation flows be between plants and warehouses?
– Inventory control
• Why are we holding inventory? Uncertainty in customer demand? Uncertainty in the supply process? Some other reason?
• If the problem is uncertainty, how can we reduce it?
• How good is our forecasting method?
Supply Chain Management
– Distribution strategies
• Direct shipping to customers?
• Classical distribution in which inventory is held in warehouses and then shipped as needed?
• Cross-docking in which transshipment points are used to take stock from suppliers’ deliveries and immediately distribute to point of usage?
– Supply chain integration and strategic partnering
• Should information be shared with supply chain partners?
• What information should be shared?
• With what partners should information be shared?
• What are the benefits to be gained?
Supply Chain Management
– Product design • Should products be redesigned to reduce logistics costs?
• Should products be redesigned to reduce lead times?
• Would delayed differentiation be helpful?
– Information technology and decision-support systems • What data should be shared (transferred)
• How should the data be analyzed and used?
• What infrastructure is needed between supply chain members?
• Should e-commerce play a role?
– Customer value • How is customer value created by the supply chain?
• What determines customer value? How do we measure it?
• How is information technology used to enhance customer value in the supply chain?
Supply Chain Management
• How can you assess how well your supply chain is performing? – The SCOR model - Supply Chain Operations Reference Model -
developed by the Supply Chain Council (http://www.supply-chain.org/) can be used to assess performance
– SCOR model metrics include:
• On-time delivery performance
• Lead time for order fulfillment
• Fill rate - proportion of demand met from on-hand inventory
• Supply chain management cost
• Warranty cost as a percentage of revenue
• Total inventory days of supply
• Net asset turns
Supply Chain Management
• Creating an effective supply chain – Develop strategic objectives and tactics
– Integrate and coordinate activities in the internal portion of the supply chain
– Coordinate activities with suppliers and customers
– Coordinate planning and execution across the supply chain
– Consider forming strategic partnerships
SCM - Inventory Management Issues
• Manufacturers would like to produce in large lot sizes because it is more cost effective to do so. The problem, however, is that producing in large lots does not allow for flexibility in terms of product mix.
• Retailers find benefits in ordering large lots such as quantity discounts and more than enough safety stock.
• The downside is that ordering/producing large lots can result in large inventories of products that are currently not in demand while being out of stock for items that are in demand.
SCM - Inventory Management Issues
• Ordering/producing in large lots can also increase the safety stock of suppliers and its corresponding carrying cost. It can also create what’s called the bullwhip effect.
• The bullwhip effect is the phenomenon of orders and inventories getting progressively larger (more variable) moving backwards through the supply chain. This is illustrated graphically on the next slide.
SCM - Inventory Management Issues
• Some of the causes of variability that leads to the bullwhip effect includes: – Demand forecasting Many firms use the min-max inventory policy.
This means that when the inventory level falls to the reorder point (min) an order is placed to bring the level back to the max , or the order-up-to-level. As more data are observed, estimates of the mean and standard deviation of customer demand are updated. This leads to changes in the safety stock and order-up-to level, and hence, the order quantity. This leads to variability.
– Lead time As lead time increases, safety stocks are increased, and order quantities are increased. More variability.
SCM - Inventory Management Issues
– Batch ordering. Many firms use batch ordering such as with a min-max inventory policy. Their suppliers then see a large order followed by periods of no orders followed by another large order. This pattern is repeated such that suppliers see a highly variable pattern of orders.
– Price fluctuation. If prices to retailers fluctuate, then they may try to stock up when prices are lower, again leading to variability.
– Inflated orders. When retailers expect that a product will be in short supply, they will tend to inflate orders to insure that they will have ample supply to meet customer demand. When the shortage period comes to an end, the retailer goes back to the smaller orders, thus causing more variability.
SCM - Inventory Management Issues
• Methods for coping with the bullwhip effect include: – Reducing uncertainty. This can be accomplished by centralizing
demand information.
– Reducing variability. This can be accomplished by using a technique made popular by WalMart and then Home Depot called everyday low pricing (EDLP). EDLP eliminates promotions as well as the shifts in demand that accompany them.
– Reducing lead time. Order times can be reduced by using EDI (electronic data interchange).
– Strategic partnerships. The use of strategic partnerships can change how information is shared and how inventory is managed within the supply chain. These will be discussed later.

SCM - Inventory Management Issues
• Other helpful techniques for improving inventory management include: – Cross-docking. This involves unloading goods arriving from a supplier
and immediately loading these goods onto outbound trucks bound for various retailer locations. This eliminates storage at the retailer’s inbound warehouse, cuts the lead time, and has been used very successfully by WalMart and Xerox among others.
– Delayed differentiation. This involves adding differentiating features to standard products late in the process. For example, Bennetton decided to make all of their wool sweaters in undyed yarn and then dye the sweaters when they had more accurate demand data. Another term for delayed differentiation is postponement.
SCM - Inventory Management Issues
– Direct shipping. This allows a firm to ship directly to customers rather than through retailers. This approach eliminates steps in the supply chain and reduces lead time. Reducing one or more steps in the supply chain is known as disintermediation. Companies such as Dell use this approach.

Supply Chain Management - Example
• Say we get an order from a European retailer to produce 10,000 garments. For this customer we might decide to buy yarn from a Korean producer but have it woven and dyed in Taiwan. So we pick the yarn and ship it to Taiwan. The Japanese have the best zippers … so we go to YKK, a big Japanese zipper manufacturer, and we order the right zippers from their Chinese plants. …the best place to make the garments is Thailand. So we ship everything there. …the customer needs quick delivery, we may divide the order across five factories in Thailand. Effectively, we are customizing the value chain to best meet the customer’s needs. (Interview of Victor Fung of Li & Fung in HBR, Sept-Oct 1998.)