enterprise inventory and service-level optimization … enterprise inventory and service-level...
TRANSCRIPT
Enterprise Inventory and Service-Level Optimization Analytics
Installation Guideversion 6.10SP3P3

© 2016 SAP SE, All Rights Reserved.
This manual, as well as the software described herein, is furnished under license and may be used or copied only within the terms of such license. The content of this manual is furnished for informational use only, is subject to change without notice, and should not be construed as a commitment by SAP SE. SAP assumes no responsibility or liability for any errors or inaccuracies that may appear in this documentation. Except as permitted by license, no part of this document may be reproduced, stored in a retrieval system, or transmitted, in any form or by any means, electronic, mechanical, recorded, or otherwise, without the prior written permission of SAP.
Revision 20160610
3
Table of contents
IntroductionPrerequisites . . . . . . . . . . . . . . . . . . . . . . . . . . . . . . . . . . . . . . . . . . . . . . . . . . . . . . . . . . . . . . . . . 5
About this guide . . . . . . . . . . . . . . . . . . . . . . . . . . . . . . . . . . . . . . . . . . . . . . . . . . . . . . . . . . . . . . 6
Chapter 1: Installing the Data MartData Mart Installation . . . . . . . . . . . . . . . . . . . . . . . . . . . . . . . . . . . . . . . . . . . . . . . . . . . . . . . . 10
Chapter 2: Installing and configuring EIS Analytics filesInstalling the EIS Analytics components . . . . . . . . . . . . . . . . . . . . . . . . . . . . . . . . . . . . . . . . . 14
Configuring Data Services for EIS Analytics Data Mart . . . . . . . . . . . . . . . . . . . . . . 14
Importing EIS Analytics files into the Business Objects Universe . . . . . . . . . . . . . . 16
Creating a Business Objects User . . . . . . . . . . . . . . . . . . . . . . . . . . . . . . . . . . . . . . . . 28
Set up email server and sender for EIS Analytics alerts . . . . . . . . . . . . . . . . . . . . . . . 29
Setup whether to consider batch size in replenishment workflow . . . . . . . . . . . . . . 30
Setup whether to have the ROP in the replenishment workflow consider unshifted merchandising stock . . . . . . . . . . . . . . . . . . . . . . . . . . . . . . . . . . . . . . . . . . 30
Setup email for replenishment workflow . . . . . . . . . . . . . . . . . . . . . . . . . . . . . . . . . . 31
Configuring Dashboard access to EIS . . . . . . . . . . . . . . . . . . . . . . . . . . . . . . . . . . . . 31
Configuring EIS Analytics for the EIS portal. . . . . . . . . . . . . . . . . . . . . . . . . . . . . . . 32
Setting up supply chain-specific attributes in the EIS Analytics universe . . . . . . . . . 33
Configuring an external data source . . . . . . . . . . . . . . . . . . . . . . . . . . . . . . . . . . . . . . 34
SAP Enterprise Inventory and Service-Level Optimization Analytics Installation Guide
4
Trigger ELT to complete the Data Mart Transfer . . . . . . . . . . . . . . . . . . . . . . . . . . . 35
EIS Analytics batch jobs . . . . . . . . . . . . . . . . . . . . . . . . . . . . . . . . . . . . . . . . . . . . . . . 35
Scheduling batch jobs to run on a periodic basis . . . . . . . . . . . . . . . . . . . . . . . . . . . . 36
Troubleshooting ETL jobs . . . . . . . . . . . . . . . . . . . . . . . . . . . . . . . . . . . . . . . . . . . . . 37
Updating EIS MIPO scenario names to ensure dashboards display properly . . . . . 37
InfoView preference update (browsers using JRE7 only) . . . . . . . . . . . . . . . . . . . . . 38
Accessing EIS Analytics with SAP Business Objects Mobile app. . . . . . . . . . . . . . . 38
Chapter 3: Maintaining EIS Analytics DashboardsCustomizing the EIS Analytics dashboards . . . . . . . . . . . . . . . . . . . . . . . . . . . . . . . . . . . . . . . 39
Changing the Minimum Inventory Target calculation . . . . . . . . . . . . . . . . . . . . . . . . 40
Changing the Maximum Inventory Target calculation. . . . . . . . . . . . . . . . . . . . . . . . 40
Changing the Bias calculation . . . . . . . . . . . . . . . . . . . . . . . . . . . . . . . . . . . . . . . . . . . 41
Changing the Demand Analytics dashboard gauge thresholds . . . . . . . . . . . . . . . . . 41
Changing the Demand Analytics dashboard graph colors . . . . . . . . . . . . . . . . . . . . . 42
Changing the Demand Analytics Sales-Forecast Numerical Spinner value. . . . . . . . 42
Changing the Performance Overview dashboard gauge thresholds . . . . . . . . . . . . . 43
Changing the Performance Overview colors . . . . . . . . . . . . . . . . . . . . . . . . . . . . . . . 43
Changing the Supply Analytics dashboard gauge thresholds . . . . . . . . . . . . . . . . . . . 44
Changing the Threshold for Planned Lead Time . . . . . . . . . . . . . . . . . . . . . . . . . . . . 45
Changing the Supply Analytics colors . . . . . . . . . . . . . . . . . . . . . . . . . . . . . . . . . . . . . 45
Changing the dashboard slicer attributes . . . . . . . . . . . . . . . . . . . . . . . . . . . . . . . . . . 46
Chapter 4: User Group PrivilegesSOPS Reader . . . . . . . . . . . . . . . . . . . . . . . . . . . . . . . . . . . . . . . . . . . . . . . . . . . . . . . . . . . . . . . 49
SOPS Writer . . . . . . . . . . . . . . . . . . . . . . . . . . . . . . . . . . . . . . . . . . . . . . . . . . . . . . . . . . . . . . . . 52
SOPS Administrator . . . . . . . . . . . . . . . . . . . . . . . . . . . . . . . . . . . . . . . . . . . . . . . . . . . . . . . . . 55
Chapter 5: Reject Message DefinitionsReject Message Definitions . . . . . . . . . . . . . . . . . . . . . . . . . . . . . . . . . . . . . . . . . . . . . . . . . . . . 63

5
Introduction
he SAP Enterprise Inventory and Service-Level Optimization (EIS) Analytics Module lets you monitor supply chain performance through intuitive visualizations of key product indicators and metrics derived from Enterprise Inventory and Service-Level Optimization.
This document describes how to install the EIS Analytics application. It includes information about the prerequisites required to use the EIS Analytics application with Enterprise Inventory and Service-Level Optimization.
PrerequisitesBefore installing this release, the following software components must be installed and configured:
Server:• SAP EIS 6.10, using Oracle 11g (EE or SE)
• SAP BusinessObjects 4. 1(BOBJ 4.1 )
• SAP BusinessObjects Web Intelligence (WebI)
• SAP Data Services (DS) 4.2
• SAP Live Office
Client:• Adobe Flash 11, compatible with BOBJ
• Oracle Java JRE, compatible with BOBJ
T

SAP Enterprise Inventory and Service-Level Optimization Analytics Installation Guide
6
About this guideThe SAP Enterprise Inventory and Service-Level Optimization Analytics Installation Guide describes the installation procedures and configuration settings needed to enable the Analytics and Intelligence Module, and a data dictionary detailing the Data Mart tables. This guide contains the following chapters:
• Chapter 1: Installing the Data Mart tables
• Chapter 2: Installing and configuring the EIS Analytics application
• Chapter 3: Maintaining the EIS Analytics application
• Chapter 4: User Group Privileges
• Chapter 5: Reject Message Definitions
Intended audience
The primary audience for this guide are IT personnel, Business Intelligence administrators, and database administrators (DBAs) at customer sites. Their focus is installing, configuring, and maintaining the third-party analysis software used to interface with the EIS Analytics application.
In addition, IT staff and DBAs may be responsible for configuring and maintaining a data loading process that occurs on a regularly scheduled basis. The Data Store and its associated EIS Analytics Data Mart can be configured to update automatically whenever MIPO scenario data gets updated. SAP Support can guide you in setting up automated processes, based on your company’s infrastructure.
Note: For installation of the SAP Enterprise Inventory and Service-Level Optimization (EIS) application server, refer to the EIS Installation and Upgrade Guide for supported stacks and installation details. For installation on a non-SAP Enterprise Inventory and Service-Level Optimization application server, refer to the SAP Business Objects XI Enterprise documentation for supported stacks and installation details.
Introduction
7
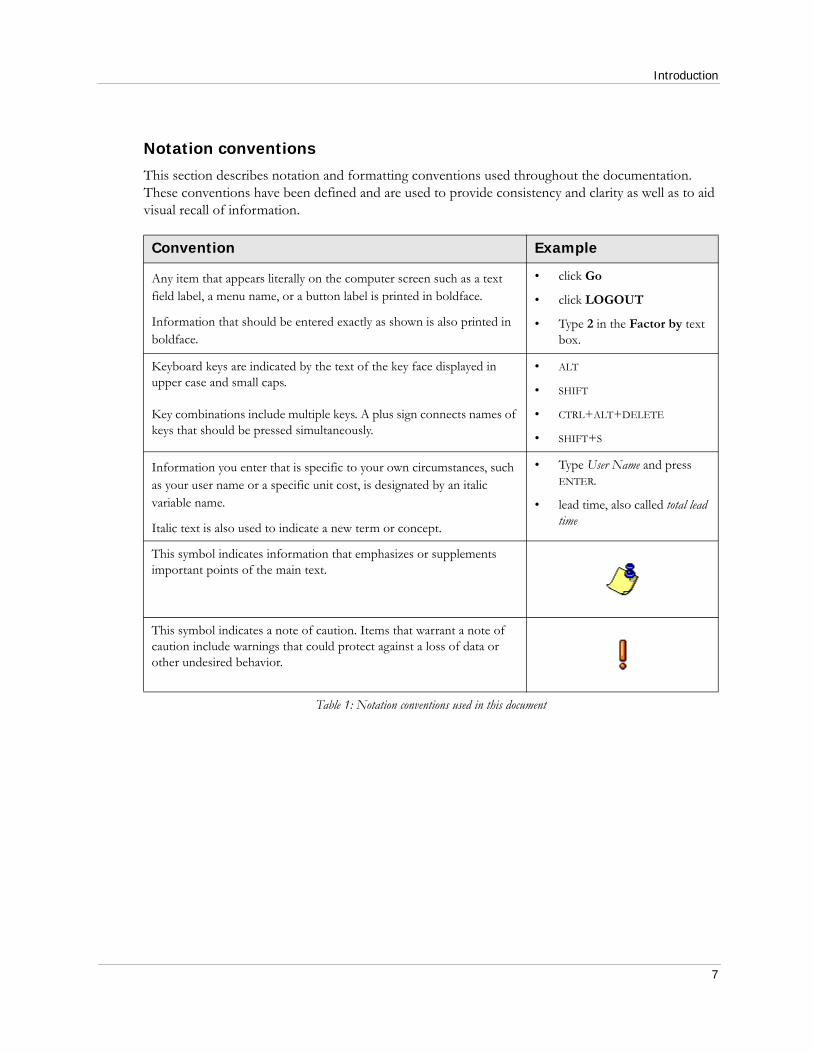
Notation conventions
This section describes notation and formatting conventions used throughout the documentation. These conventions have been defined and are used to provide consistency and clarity as well as to aid visual recall of information.
Convention Example
Any item that appears literally on the computer screen such as a text field label, a menu name, or a button label is printed in boldface.
Information that should be entered exactly as shown is also printed in boldface.
• click Go
• click LOGOUT
• Type 2 in the Factor by text box.
Keyboard keys are indicated by the text of the key face displayed in upper case and small caps.
Key combinations include multiple keys. A plus sign connects names of keys that should be pressed simultaneously.
• ALT
• SHIFT
• CTRL+ALT+DELETE
• SHIFT+S
Information you enter that is specific to your own circumstances, such as your user name or a specific unit cost, is designated by an italic variable name.
Italic text is also used to indicate a new term or concept.
• Type User Name and press ENTER.
• lead time, also called total lead time
This symbol indicates information that emphasizes or supplements important points of the main text.
This symbol indicates a note of caution. Items that warrant a note of caution include warnings that could protect against a loss of data or other undesired behavior.
Table 1: Notation conventions used in this document

SAP Enterprise Inventory and Service-Level Optimization Analytics Installation Guide
8

9
Chapter 1: Installingthe Data Mart
his chapter describes the specific configuration items related to the Data Mart data module. The Data Mart contains a subset of EIS MIPO data and resides in the Data Store schema. Additional Data Mart information resides on the MIPO schema. The Data Mart configuration
includes the following:
• Data Mart data model on Data Store schema
• Data Mart procedure and synonym updates on MIPO schema
Note: For information on the Data Store setup and configuration requirements, refer to the EIS Installation and Upgrade Guide.
T
Enterprise Inventory and Service Level Optimization Analytics Installation Guide
10
Prerequisites:
Before installing the Data Mart, ensure that Oracle 11g software has been installed on the database server.
It is also recommended that all servers in a customer’s environment support reverse DNS lookup.
Data Mart InstallationThe Data Mart tables reside as part of the Data Store schema. Data Store consists of an Oracle database schema that is installed as part of the MIPO database instance.
Installing EIS Analytics Data Mart tables on the Data Store schema
This section describes how to install the EIS Analytics Data Mart tables to the Data Store database schema (SOPS_DATASTORE) from a Windows or UNIX machine connected to the Oracle database server.
Prerequisites:
Gather the following information in preparation for the schema installation process:
• Name of the database instance created for the MIPO schema
• Full path name of the directory containing the schema installation files (e.g., /temp/datastore)
• Password for the user SYSTEM
Step 1: Copy Installation files to database server
Copy the EIS Analytics Data Mart installation files from the installation media to the database server. These files are located under the \AnalyticsAndIntelligenceModule<version>\Database\Datamart directory (where <version> represents the release number for the software application). Make sure you maintain the directory structure under the \Database directory.
Step 2: Update the Installation SQL script
Use a text editing tool to open the install.sql script you copied onto the database server. You will see the following configuration settings:
DEFINE DATASTORE_SCHEMA='SOPS_DATASTORE'
DEFINE MIPO_SCHEMA='SOPS_MIPO'
Note: For information on Oracle setup and requirements related to EIS applications, refer to the EIS Installation and Upgrade Guide.
Chapter 1: Installing the Data Mart
11
DEFINE DATASTORE_DATA_TS='DATASTORE_DATA'
DEFINE DATASTORE_INDEX_TS='DATASTORE_INDEX'
DEFINE TEMP_TS='TEMP'
Edit any configuration settings to match your current MIPO settings and save your changes.
Step 3: Run the Installation SQL script
Start the Command Prompt application and use the Change Directory command (cd) to access the database server and go to the location where you copied the installation files.
Log on the SQL*Plus as system administrator with system ID (e.g., [email protected]) and password.
If you are installing the Data Store, run the Data Store Installation script by typing the following at the command prompt:
@install
If you are upgrading the Data Store, run the Data Store Upgrade script by typing the following at the command prompt:
@upgrade
The script will notify you when the Data Mart install or upgrade is complete. For any error messages displayed during installation, see the datastore_install.log or datastore_upgrade.log file for more information.
Exit SQL*Plus by typing exit at the command prompt.
Note: If the log files contain unknown errors, contact SAP Support.
Errors can be generated when the installation script attempts to drop tables, sequences, indexes, or views that do not exist. It is safe to ignore these errors.

Enterprise Inventory and Service Level Optimization Analytics Installation Guide
12

13
Chapter 2: Installingand configuring EIS
Analytics files
his chapter provides instructions for installing the EIS Analytics application on an SAP Business Objects server. For more information about SAP Business Objects requirements see the SAP Help Portal.
Prerequisites:
Before installing the EIS Analytics application, ensure that the following software versions have been installed on the SAP Business Objects web server:
• SAP BusinessObjects Enterprise (BOE) XI 3.1 SP3 or BOE 4.0
• SAP Data Services (DS) Professional 4.1 SP1
Additionally, EIS 6.10 must be installed and configured on the application server.
It is also recommended that all servers in a customer’s environment support reverse DNS lookup.
Note: You can import the EIS Analytics 3.1 BIAR file into SAP Business Objects 4.X. For more information, see “Importing the BIAR File to Business Objects 4.X” on page 18.
T
Enterprise Inventory and Service-Level Optimization Analytics Installation Guide
14
Installing the EIS Analytics components The EIS Analytics application consists of customized files designed to push EIS data from the Data Store into the EIS Data Mart, so it can be transformed into the EIS Analytics Business Objects Universe for analysis through customized business intelligence tools.
These files include SQL objects, ETL files, and business intelligence archive (BIAR) files containing the EIS Analytics Universe, dashboards and web intelligence (WebI) reports.
Prerequisites:
An Oracle user account must be created and configured to own the EIS Analytics repository before the installation. Refer to the SAP Business Objects and Oracle documentation for permissions/roles associated with an Oracle account connected to the SAP Business Objects environment.
To install the EIS Analytics components:
1. Access the installation media and go to the AIM<version>/ directory (where <version> is the EIS Analytics version number).
2. The EIS Analytics application is contained in a .ZIP file. Unzip the file and copy the associated EIS Analytics files to the EIS directory on the web application server. The files should be organized by the following sub-directories:
AIM<version>/BOBJ/EIS.biar
AIM<version>/Webserver/launch_dashboard.jsp
AIM<version>/Webserver/crossdomain.xml
AIM<version>/DataServices/DataMart-ETL.atl
AIM<version>/DataServices/DM_Control.xls
Configuring Data Services for EIS Analytics Data Mart The SAP Data Services Management Console lets you create a local repository associated with the Data Mart in order to provide a connection between the Universe Designer and the Data Mart tables, as well as manage batch jobs, real-time jobs, and profile tasks.
Creating a local repository in Data Services 4.X
To create a local repository for the EIS Analytics application, log on to the Data Services Management Console and perform the following steps:
1. Start the Data Services Repository Manager.
2. Log on as an administrator.
3. In the Data Services Repository Manager dialog box, set the following information:
• Repository type – Local
• Database type – Oracle
Chapter 2: Installing and configuring EIS Analytics files
15
• Database version – Oracle 11g
• Hostname
• SID
• User name
• Password
4. Click Create.
5. If the repository already exists, you’ll be given the option to upgrade the existing repository. Click Upgrade to upgrade.
Register the Repository in Central Management Console for DS 4.X
To register the repository in the Central Management Console, perform the following steps:
1. Log onto the SAP BusinessObjects Central Management Console using an administration account.
2. From the drop-down menu, select Data Services.
3. Right-click on the Repositories folder and select Configure repository.
4. Enter the following information for the Analytics repository:
• Repository Name
• Database Type (Oracle)
• Database Server Name
• SID (same that you entered when creating the repository)
• User Name (same that you entered when creating the repository)
• Password (same that you entered when creating the repository)
5. Click Save.
Creating a local repository in Data Services 3.2
To create a local repository for the EIS Analytics application, log on to the Data Services Management Console and perform the following steps:
1. Start the Data Services Management Console.
2. Log on as an administrator.
3. From the Home page, select Administrator.
4. From the Administrator directory tree on the left side of the screen, select Management > Repositories.
5. Click Add.
6. Enter the following information:

Enterprise Inventory and Service-Level Optimization Analytics Installation Guide
16
• Repository Name that identifies its association with the EIS Analytics application.
• Database type > Oracle.
• Machine name identifying the database server.
• Database port for Oracle server connectivity.
• Service name/.SID identifying EIS database.
• Enter the Oracle username and password for the repository schema.
7. Click Apply.
The new repository should appear on Repositories screen.
Add the EIS Analytics repository to the Job server
To add the EIS Analytics repository to the Job server, log on to the Data Services Server Manager and perform the following steps:
1. Start the Data Services Server Manager.
2. Click Configuration Editor.
3. From the Job Server Configuration Editor, select JobServer record and click Edit.
4. To add a repository, click Add.
a. Select Oracle as the Database type
b. Enter the database connection name
c. Enter the Oracle username and password for the repository schema
d. click Apply.
5. Click OK to exit Job Server Properties dialog box.
6. Click OK to exit the Job Server Configuration Editor dialog box
7. Click Restart to exit Job Server Configuration Editor and restart the Data Service.
The repository should now be available on the batch job schedule.
Importing EIS Analytics files into the Business Objects UniverseThe EIS Analytics application includes customized files designed for the Business Objects Universe. These files must be imported into the Business Objects Enterprise and Data Services respectively.
Prerequisite:
When upgrading from a previous installation of the EIS Analytics application, you must first delete the AIM Dashboard.swf file before performing the import process, as this file will not be overwritten by the import. The Dashboard file can be deleted through the InfoView web application.
Chapter 2: Installing and configuring EIS Analytics files
17
Importing the the LCMBIAR Override File in Business Objects 4.X
If you’re upgrading to EIS Analytics 6.10.3.3, you must override the LCMBIAR file:
1. Log on to the Central Management Console (CMC).
2. Under Manage, click Promotion Management.
The Promotion Jobs tab opens.
3. Click Settings and choose Manage Systems.
The Promotion Management for SAP Business Objects Enterprise-Manage Systems window displays.
4. Click Add and enter the Host Name, Port Number, Display Name, and, optionally, Description of your system. Verify that the Mark as Origin box is not selected.
5. Click OK.
6. From the Import drop-down, click Override File.
7. Select either the EIS_Override.lcmbiar file, then click OK.
8. Click Override Settings.
9. If the window indicates that the system is logged into the CMS system (or the Type is not Destination), click Log Off and log onto the Destination system.
10. Click Connection Override, select the checkbox for smartopsdb data connection, then click Edit.
The Edit Connections Properties dialog box displays.
11. Enter all of the connections properties for your system and click Done.
12. Click Status next to the smartopsdb data connection and select Active.
13. Click Save.
14. Click the QaaWS Override tab, select the smartops qaaws override checkbox, and click Edit.
15. In the QaaWS Properties Service URL dialog box, enter the web service address, port, and web service provider access URL, and click Done.
16. Click Status next to the smartops qaaws override and select Active.
17. Click Save.
18. Click Close.
Note: If the access URL is not known, go to the CMC Home window, select Applications from Manage tasks. From the Applications window double click the Web Service application name. The Access URL is found on the Properties tab.

Enterprise Inventory and Service-Level Optimization Analytics Installation Guide
18
Importing the LCMBIAR File to Business Objects 4.X
If you’re installing or upgrading EIS Analytics 6.10.3.2 or higher, you will need to import an LCMBIAR file to BOBJ 4.X:
1. Log on to the Central Management Console (CMC).
2. Under Manage, click Promotion Management.
The Promotion Jobs tab opens.
3. From the Import drop-down, click Import file.
4. Select either the EIS_LCMBIAR (for installing as a new customer) or EIS_Upgrage.LCMBAIR (for upgrading) file, then click OK.
5. Log on to your destination CMC and then click Create.
The promotion job is created.
6. In the Promotion Jobs tab, select the checkbox next to the new job and click Promote. The status must be Success.
7. When the Promote screen displays, click Test Promote on the left-hand side, then click the Test Promote button.
8. Once the test promote has run, click on the Promote button.
Importing the BIAR File to Business Objects 4.X
You can run EIS Analytics on Business Objects 4.x, although EIS Analytics does not take advantage of the newer features available in the 4.x releases. To import the BIAR file into BusinessObjects 4.X:
Step 1: Choose the source and destination and select objects to import
1. Log on to BI Launch Pad on the Business Objects 4.x server and delete any EIS Analytics-related SWF files.
There are multiple SWF files located under Public Folders -> SmartOps -> AIM -Analytics and Intelligence Module -> Dashboards and Public Folders -> SmartOps -> AIM - Analytics and Intelligence Module --> Dashboards Support Materials.
2. Log into the Business Objects 4.x server 4.x Server using local administrator credentials.
3. Copy the BIAR file to 4.x server.
4. Launch the Business Objects Upgrade Management Tool.
5. Click Incremental Upgrade.
6. Click Next.
7. Choose a BIAR to Live upgrade.
8. In the Source section, use the Browse [...] button to enter a location for the file.

Chapter 2: Installing and configuring EIS Analytics files
19
9. In the Destination section, enter the following information:
CMS Name: Your Business Objects server name.
Username: The administrator username used to access the Business Objects server.
Password: The administrator password to access the Business Objects server.
10. Click Next.
11. Verify the following are selected in the list box:
• Corporate Categories
• Custom Access Levels
• Folders and Objects, including the sub-folder SmartOps
• Universes, including the sub-folder SmartOps
• Universes (information design tool), including the sub-folder SmartOps
• Users and User Groups.
12. Click Next.
13. Click Start.
14. Click Close.
Step 2: Assign security
1. Log onto the SAP BusinessObjects Central Management Console using an administration account.
2. From the Organize column, select Folders.
3. From the left side of the Folders screen, right-click on All Folders and select Properties.
4. In the User Security: Root Folder screen, click User Security.
5. Click Everyone, and then click the Assign Security button.
6. On the Assign Security screen, ensure that the Inherit from Parent Folder and the Inherit From Parent Group boxes are checked and that the View is available in the Available Access Levels list.
7. Click OK.
8. Click Close.
9. Right-click on the SmartOps folder and select User Security.
10. In the User Security: Smartops screen, click Everyone, and then click the Assign Security button.
11. Click the Remove Access button, and then click OK.
12. Click OK in the confirmation dialog box.
13. Click Close.

Enterprise Inventory and Service-Level Optimization Analytics Installation Guide
20
14. From the tabs on the left, click on the Universes icon (a multi-colored starburst).
15. In the Universes screen, right-click on the SmartOps folder and select User Security.
16. In the User Security: Smartops screen, click Everyone, and then click the Assign Security button.
17. Click the Remove Access button, and then click OK.
18. Click OK in the confirmation dialog box.
19. In the User Security: Smartops screen, click Universe Designer Users, and then click the Assign Security button.
20. Click the Remove Access button, and then click OK.
21. Click OK in the confirmation dialog box.
22. Click Close.
23. From the tabs on the left, click on the Connections icon (green pipes).
24. On the Connections screen, right-click on smartopsdb, and select User Security.
25. In the User Security: smartopsdb screen, click Everyone, and then click the Assign Security button.
26. Click the Remove Access button, and then click OK.
27. In the User Security: smartopsdb screen, click Universe Designer Users, and then click the Assign Security button.
28. Click the Remove Access button, and then click OK.
29. Click OK in the confirmation dialog box.
30. Click Close.
Step 3: Remove SmartOps user access to other Universes
1. Log onto the SAP BusinessObjects Central Management Console using an administration account.
2. Click Universes.
3. Right-click a non-SmartOps folder or Universe, and select User Security.
4. On the User Security screen for that folder or Universe, click SOPS Reader, and then click the Assign Security button.
5. Click the Remove Access button, and then click OK.
6. Click OK in the confirmation dialog box.
Note: If SOPS Reader does not appear, you’ll need to manually add the user groups. See “Step 1: Setting up Security” on page 28 for more information.
Chapter 2: Installing and configuring EIS Analytics files
21
7. Click Close.
8. Repeat steps 3 through 6 for all other non-SmartOps folders and Universes.
Importing BIAR file into BusinessObjects 3.1
To import the BIAR file, perform the following steps:
Step 1: Choose source and destination
1. Start the Import Wizard. (Start --> All Programs --> BusinessObjects XI 3.1 --> BusinessObjects Enterprise --> Import Wizard).
2. Click Next to get to the Source Environment step.
3. For the Source Environment, enter the following:
Source: select Business Intelligence Archive Resource (BIAR) file from the dropdown
BIAR file: Use the Browse [...] button to enter a location for the file.
4. Click Next.
5. For the Destination Environment, enter the following information:
CMS Name: Your Business Objects server name and port number (i.e., server_name:6400).
Username and Password: The administrator username and password to access the Business Objects server.
Authentication: Select Enterprise from the dropdown.
6. Click Next. You will now be on the “Select objects to import” step.
Step 2: Select objects to import
1. On the “Select objects to import” dialog box, click Clear All.
2. Individually select the following items in the list box:
Import users and user groups -->Import application rights
Import users and user groups -->Import root folder rights
Import Corporate Categories
Import Folders and objects --> Import application folders and objects.
Import universes
Import custom access levels
3. Click Next
4. On the “Import scenario” dialog box, ensure that the following is selected:
• Use the object's unique identifier to determine whether it already exits in the destination system.
Enterprise Inventory and Service-Level Optimization Analytics Installation Guide
22
• Update the destination object. In case of name conflict, rename it.
5. Click Next.
6. On the “Incremental import” dialog box, UNCHECK the following:
Overwrite Connection Contents.
7. Click Next.
8. On the “Users and groups” dialog box, click Clear All.
9. Deselect the Show groups hierarchically check box.
10. Shift-Click the following:
SOPS Reader
SOPS Writer
SOPS Administrator
11. Click Next.
12. On the “Custom Access Levels” dialog box, ensure that the following are selected:
SOPS Administrator
SOPS Reader
SOPS Writer
13. Click Next.
14. On the “Categories” dialog box, click Next.
15. On the “Folders and objects” dialog box:
Check the SmartOps folder (everything under should be selected it as well).
Leave the “Import all instances of each selected object” checkbox un-checked.
16. Click Next.
17. On the “Select application folders and objects” dialog box, click Clear All.
18. Click Next.
19. On the “Import options for universes and connections” dialog box, click the radio button for the third Import option (it has the text “Import the universes and connections that the selected Web Intelligence...”).
20. Uncheck the “Keep universe overloads...” option.
21. Click Next.
22. On the “Universe folder and universes’ dialog box:
Check the SmartOps folder (everything under should be selected it as well).
23. Click Next.

Chapter 2: Installing and configuring EIS Analytics files
23
24. On the “Import options for publications” dialog box, select the “Do not import recipients” option.
25. Click Next.
26. Click Next again on the “A note on importing reports” dialog box.
27. Click Finish.
28. A popup appears when the import is completed. Click Done.
Step 3: Assign security
1. Log onto the SAP BusinessObjects Central Management Console using an administration account.
2. From the Organize column, select Folders.
3. From the left side of the Folders screen, right-click on All Folders and select Properties.
4. In the User Security: Root Folder screen, click User Security.
5. Click Everyone, and then click the Assign Security button.
6. On the Assign Security screen, ensure that the Inherit from Parent Folder and the Inherit From Parent Group boxes are checked and that the View is available in the Available Access Levels list.
7. Click OK.
8. Click Close.
9. Right-click on the SmartOps folder and select User Security.
10. In the User Security: Smartops screen, click Everyone, and then click the Assign Security button.
11. Click the Remove Access button, and then click OK.
12. Click Close.
13. From the tabs on the left, click on the Universes icon (a multi-colored starburst).
14. In the Universes screen, right-click on the SmartOps folder and select User Security.
15. In the User Security: Smartops screen, click Everyone, and then click the Assign Security button.
16. Click the Remove Access button, and then click OK.
17. In the User Security: Smartops screen, click Universe Designer Users, and then click the Assign Security button.
18. Click the Remove Access button, and then click OK.
19. Click Close.
20. From the tabs on the left, click on the Connections icon (green pipes).
21. On the Connections screen, right-click on smartopsdb, and select User Security.
Enterprise Inventory and Service-Level Optimization Analytics Installation Guide
24
22. In the User Security: smartopsdb screen, click Everyone, and then click the Assign Security button.
23. Click the Remove Access button, and then click OK.
24. In the User Security: smartopsdb screen, click Universe Designer Users, and then click the Assign Security button.
25. Click the Remove Access button, and then click OK.
26. Click Close.
Step 4: Remove SmartOps user access to other Universes
1. Log onto the SAP BusinessObjects Central Management Console using an administration account.
2. Click Universes.
3. Right-click a non-SmartOps folder or Universe, and select User Security.
4. On the User Security screen for that folder or Universe, click SOPS Reader, and then click the Assign Security button.
5. Click the Remove Access button, and then click OK.
6. Click Close.
7. Repeat steps 3 through 6 for all other non-SmartOps folders and Universes.
Editing Universe Connections
To edit the EIS Analytics universe connections, perform the following steps:
1. Start the Universe Design Tool.
2. Log on as an administrator.
3. From the main menu, click File > Import.
4. From the Import Universe dialog box, click Browse to locate the \SmartOps\ folder, then click OK.
5. Hightlight AIMTemplate under Available Universes, then click OK. Universe successfully imported message appears.
6. From the main menu, click Tools > Connections.
7. On the Wizard Connection dialog box, highlight smartopsdb and click Edit.
8. On the Edit smartopsdb Connection dialog box, enter the following information:
• Oracle username and password for the Data Store schema.
• Service name/.SID identifying EIS database.
9. Click Next.
10. Click Next.

Chapter 2: Installing and configuring EIS Analytics files
25
11. Click Finish.
12. Click Finish to go back to Universe Design Tool.
13. Click File > Export.
14. Click OK to save it back to the Universe server.
Deleting existing jobs before importing the new ATL
Before you import the ATL, you must delete any existing jobs.
To delete existing jobs, perform the following steps:
1. Start the Data Services Designer.
2. Use an account with administrator privileges to log on to the EIS Analytics repository.
3. From the main menu, click Tools > Object Library.
4. Click the Jobs tab at the bottom of the screen.
5. Expand Batch Jobs.
6. Select all the jobs that begin with “J_Smartops” (hold the shift key to select multiple jobs).
7. Right click on a selected job and select Delete.
8. In the dialog box, click Yes.
Deleting the previous ETL before importing new ATL
Before you import the Data Services ATL file, you should delete the ETL of the previous version.
1. Start the Data Services Designer.
2. Use an account with administrator privileges to log on to the EIS Analytics repository.
3. Click the Projects tab at the bottom of the screen.
4. From the main menu, click Tools > Project Area.
5. Right-click on Smartops_Senario_Load.
6. Click Delete.
Note: If you have jobs scheduled, you must unschedule the jobs before you delete them.
Note: If you have a custom ETL for loading the Inventory History Table, export the ETL and re-import the ETL after upgrading.
Enterprise Inventory and Service-Level Optimization Analytics Installation Guide
26
7. In the dialog box, click Yes.
Importing Data Services ATL file
To import the ATL file, perform the following steps:
1. Start the Data Services Designer.
2. Use an account with administrator privileges to log on to the EIS Analytics repository.
3. From the Tools menu, select “Import From File”.
4. Navigate to the location of the DataMart-ETL.atl file.
5. If you are using Data Services 4.X, when prompted for a password, type password and click OK.
6. Accept the standard warning by clicking OK.
7. There is a message indicating that the import has succeeded.
Configuring the ETL for use
Once the ATL file has been imported into the Data Services Designer, do the following:
1. From the Data Services Designer, click the Datastores tab located at the bottom of the Local Object Library area.
2. From the Tables directory tree, right click on DataMart and select Edit.
3. From the Edit Datastore dialog box, click Advanced >>.
4. Click Edit.
5. From the Configurations for Datastore dialog box, Click the Create New Configuration icon.
6. Enter the configuration name.
7. Select the database type.
8. Select the database version as Oracle 11g.
9. Click OK.
10. Under Connection, do the following:
a. Set the Default configuration to Yes.
b. Enter the User name of the database (the same as used for the DataStore schema).
Note: You can see the objects in the lower left portion of the window as they are loaded (called the Local Object Library). These objects are located in the Projects tab, Jobs tab, Workflows tab, Dataflows tab, Transforms tab, Datastores tab, Formats tab, and Custom Functions tab.

Chapter 2: Installing and configuring EIS Analytics files
27
c. Enter the Password of the database (the same as used for the DataStore schema).
11. Under Aliases, enter the Alias Name.
12. Click Apply.
13. Click OK.
Repeat steps 1-13 for the Internal tables, but point to your MIPO schema.
Setting up the attribute configurations for Data Services
Once the ATL file has been imported into the Data Services Designer, you can set up the attribute configurations for your supply chain’s items and locations. These attribute settings are used to populate the dashboard slicers that provide drill-down capability through filtering data.
Step 1: Add attribute information to DM Control spreadsheet
1. Navigate to the EIS Analytics installation files to locate the following:
AIM<version>/DataServices/DM_Control.xls
2. Open DM_Control.xls with MS Excel.
3. Click on the CTRL_Item_Attrib tab.
4. Enter up to 10 item attribute names in the ATTRIB_NAME column.
5. Click on the CTRL_Loc_Attrib tab.
6. Enter up to 10 location attribute names in the ATTRIB_NAME column.
7. Save your changes.
Step 2: Associate DM Control spreadsheet to Data Services
1. Log on to the Data Services Designer as an administrator.
2. From the main menu, select Tools > Substitution Parameter Configurations...
3. Use the Substitution Parameters editor to add the DM Control spreadsheet file path to the substitution variable called $$Control_Directory_src (e.g., C:/DataMart).
Step 3: Setup the System Configurations
1. Log on to the Data Services Designer as an administrator.
2. From the main menu, select Tools > Editing the System Configurations.
3. Click on the Title bar of the Edit System Configurations window and type thr name for the system.
4. Select the system name from the drop-down menu for each of the following that corresponds to that system: Substitution Parameter, DataMart, and Internal.
5. Click OK.

Enterprise Inventory and Service-Level Optimization Analytics Installation Guide
28
Step 4: Copy DM Control spreadsheet to BusinessObjects server
1. Copy the DM Control spreadsheet to the local file system on the Data Services server.
Step 5: Run J_SmartOps_Setup_Ctrl job
You must run the J_SmartOps_Setup_Ctrl job to load the attribute configurations.
1. Log on to Data Services Management Console as an administrator.
2. Click Administrator.
3. From the Administrator directory tree, click to expand Batch.
4. Click on the EIS Analytics repository node.
5. Under the Batch window, click the Batch Job Configuration tab.
6. Locate the J_SmartOps_Setup_Ctrl job, then click Execute.
7. Under Execute Batch Job, click Execute.
Creating a Business Objects UserIf you do not already have Business Object Users created, you will need to create users to access the EIS Analytics application.
Step 1: Setting up Security
Before you create users, you need to add the SmartOps user groups to the universe and folders.
1. Log onto the SAP BusinessObjects Central Management Console using an administration account.
2. Either choose Folders from the drop-down, or click the Folders icon.
3. Right-click on All Folders and select Properties.
4. Click User Security.
5. If the SOPS Administrator, SOPS Reader, and SOPS Writer are not on the list, click Add Principals.
6. Click Group List.
7. Add the SOPS Administrator to the Selected users/groups column by clicking the arrow button.
8. Click Add and Assign Security.
9. Click SOPS Administrator and move it to the Assign Access Levels column by clicking the arrow button.
10. Click Apply, then OK.
11. Repeat steps 7 to 10 for SOPS Writer and then SOPS Reader.
12. Click Close.
Chapter 2: Installing and configuring EIS Analytics files
29
13. Right-click on the SmartOps folder and select Properties.
14. Repeat steps 4 to 12 for the SmartOps folder.
15. From the drop-down, select Connections, right-click on the Connections folder and repeat steps 4 to 12 for the Connections folder and the smartopsdb connection.
16. From the drop-down, select Universes.
17. Right-click on SmartOps and select Universe Security.
18. Click Add.
19. Click Group List.
20. Click SOPS Administrator and move it to the Selected users/groups column by clicking the arrow button, and click OK.
21. Close the window.
22. Right-click on Smartops again, and select User Security.
23. Repeat steps 5 to 12.
Step 2: Creating Business Object Users
To create a Business Object user:
1. Log onto the SAP BusinessObjects Central Management Console using an administration account.
2. Select Users and Groups either via the drop-down menu or by clicking the Users and Groups icon.
3. Click Manage > New > New User.
4. Enter an Account Name (this is the User ID).
5. Enter a Password and Confirm Password, then select the appropriate password option checkboxes for your organization’s security policy.
6. Optionally, enter the Full Name, Email and Description for the account.
7. Click Create & Close.
8. Click User List.
9. Right-click on the user you just created, and select Join Group.
10. Select the appropriate user group (SOPS Administrator, SOPS Writer, or SOPS Reader), then click the arrow to move the selected User Group to the Destination Groups column.
Set up email server and sender for EIS Analytics alertsTo set up email for the Job server, log on to the Data Services Server Manager and perform the following steps:

Enterprise Inventory and Service-Level Optimization Analytics Installation Guide
30
1. Start the Data Services Server Manager.
2. In the SMTP settings for smtp_to function section, type the following:
• In the Server field, type the name of the SMTP server.
• In the Sender field, type the address to use as the sender of the emails.
3. Click Apply.
4. Click Restart to exit Job Server Configuration Editor and restart the Data Service.
Setup whether to consider batch size in replenishment workflowAs part of the replenishment workflow, the J_SmartOps_Replenishment job can consider batch size when making recommendations for replenishment. To configure whether to consider batch size, you must configure a substitution variable:
1. Log on to the Data Services Designer as an administrator.
2. From the main menu, select Tools > Substitution Parameter Configurations...
3. Use the Substitution Parameters editor to add whether you want to enable batch size to the substitution variable called $$SmartOps_Is_Replenishment_Batch_Size_Enabled (i.e., YES or NO) Include YES if you want to consider batch size and NO if you do not.
4. Click OK.
Setup whether to have the ROP in the replenishment workflow consider unshifted merchandising stockAs part of the replenishment workflow, the J_SmartOps_Replenishment job can consider unshifted merchandising stock when calculating the reorder point (ROP), which has an impact on replenishment orders. To configure whether to consider unshifted merchandising stock when calculating ROP, you must configure a substitution variable:
1. Log on to the Data Services Designer as an administrator.
2. From the main menu, select Tools > Substitution Parameter Configurations...
3. Use the Substitution Parameters editor to add whether you want to consider unshifted merchandising stock when calculating ROP to the substitution variable called $$SmartOps_use_Merc_in_ROP (i.e., YES or NO) If you include YES, then the
Note: If you have replenishment configured, you MUST set this variable. If you do not wish to consider batch size, set the variable to NO.

Chapter 2: Installing and configuring EIS Analytics files
31
reorder point is the reorder point plus unshifted merchandising stock. If you include NO, then the reorder point does not include unshifted merchandising stock.
4. Click OK.
Setup email for replenishment workflowAs part of the replenishment workflow, the J_SmartOps_Replenishment job sends email when the job succeeds or fails. To configure to whom to send these emails, you must configure two substitution variables:
1. Log on to the Data Services Designer as an administrator.
2. From the main menu, select Tools > Substitution Parameter Configurations...
3. Use the Substitution Parameters editor to add the email addresses to which you want to send success emails to the substitution variable called $$SmartOps_Replenishment_Success_Email (i.e., [email protected]) To include more than one email address, separate the addresses with a comma (but no spaces).
4. Use the Substitution Parameters editor to add the email addresses to which you want to send failure emails to the substitution variable called $$SmartOps_Replenishment_Failure_Email (i.e., [email protected]) To include more than one email address, separate the addresses with a comma (but no spaces).
5. Click OK.
6. Set the replenishment job to run periodically (every five minutes is recommended). For more information about configuring batch jobs to run, see “EIS Analytics batch jobs” on page 35.
Configuring Dashboard access to EIS To configure dashboard access to EIS, perform the following steps:
Step 1: Create SmartOps account in Business Objects server
Note: Refer to the SAP Business Objects CMC documentation for creating administration accounts.
Step 2: Set up external access for EIS Analytics dashboard
1. Log on to the Infoview portal with an administrator account.
2. Under Navigate, click Document List.
3. Expand the Public Folders.
Note: If you have replenishment configured, you MUST set this variable. If you do not wish to consider unshifted merchandising stock when calculating the ROP, set the variable to NO.
Enterprise Inventory and Service-Level Optimization Analytics Installation Guide
32
4. Expand the SmartOps folder.
5. Expand the AIM - Analytics and Intelligence folder.
6. Select the Dashboards folder.
7. Right click the SAP Enterprise Inventory and Service-Level Optimization Dashboard and select Properties.
8. Copy the CUID of the SWF file. CUID looks like: ATNrWyHSbMpPnUXelSa.7DY.
9. On the BOBJ instance for the dashboard, navigate to the location of the launch_dashboard.jsp; for example:c:\Program Files (x86)\Business Objects\Tomcat55\webapps\InfoViewApp\ launch_dashboard.jsp).
10. Open launch_dashboard.jsp in a text editor.
11. Toward the bottom of the page find the line that starts as follows:
String Path = "../../OpenDocument/opendoc/openDocument.jsp?token=" +enterpriseSession.getLogonTokenMgr().getDefaultToken()+ "&iDo-cID=AeVwcaV7R6RJmbWHzhmuxFI&sIDType=CUID&sType=swf"
12. Replace the text between "iDocID=" and "&sIDType" to point to the CUID of the SWF file from step 8.
13. Towards the top of the jsp file there is a line "String cms =..."; replace vs-test1 with the cms server name.
14. Save the file.
15. Copy the updated jsp file to the following directory: <BOBJ Install>\Tomcat55\webapps\InfoViewApp
16. Copy the crossdomain.xml file to the following directory:<BOBJ Install>\Tomcat55\webapps\ROOT
17. Restart the Tomcat55 server.
Configuring EIS Analytics for the EIS portal The Module Settings feature contains the configuration settings used by the EIS Analytics application to launch from the EIS portal. You can access this module by doing the following:
1. Log on to the EIS application.
2. Select Module Settings under the Settings menu.
3. Select Analytics from the dropdown list.
4. Fill out the appropriate EIS Analytics parameters. A list of the parameters and their functions is provided below.

Chapter 2: Installing and configuring EIS Analytics files
33
Content DisplayParameter: Content DisplayRequired: YesBehavior: Determines the behavior of launching EIS Analytics through the EIS portal. The EIS Analytics application can either appear in the EIS portal frame or else appear as a separate window.Default: In the Frame
LinkParameter: LinkRequired: YesBehavior: Defines the location path of the EIS Analytics dashboard (e.g., http://<localservername>:8080/InfoViewApp/launch_dashboard.jsp)Default: N/A
Link TypeParameter: Link TypeRequired: YesBehavior: Defines whether the link points to an HTML, URL, or JavaScript file.Default: URL
When you are finished with your configuration, click OK. If you decide not to implement the changes you made, click Cancel.
If the configuration parameter change requires a restart (indicated in the first column), you must stop and restart the application server for your change to take effect. Clients connected to the EIS system must also stop and restart the EIS application for the change to take effect.
Setting up supply chain-specific attributes in the EIS Analytics universeAt installation time, there are two tasks to be performed in the universe in order to set up attributes for WebI and Dashboard users:
1. Create new, named objects in the AIMTemplate universe so that users can easily understand and use the attributes in reports.
2. Set up the dashboard “slicer” objects so that the dashboard correctly reflects the six attributes that will be used for filtering.
Creating named objects in the AIM template
To create the named objects:
1. From the Universe directory tree, click to expand the Item, Location, Node, or Stocking Point folder, depending on which attribute you are currently defining.
2. If some or all of the default attributes packed in EIS Analytics are not going to used, highlight each one and press Delete on the keyboard.

Enterprise Inventory and Service-Level Optimization Analytics Installation Guide
34
3. To create a new object in the selected folder, right-click on the folder and select Object.
4. In the Edit Properties dialog box:
a. Enter a name for the object in the Name field. This should be the name of the attribute.
b. Enter a description of the attribute in the Description field. This will available to any user who uses the universe fields in a WebI report.
c. Select the “>>” button to the right of the Select field.
d. Under columns navigate to the field you want to map the attribute to. For example, For the Item attribute listed in position 1 of the spreadsheet you will select DM_ITEM_ATTRIBUTE_N01? ITEM_ATTRIBUTE_NAME.
Setting up the dashboard slicer objects
To set up the dashboard slicer objects:
1. Open the AIM Template Universe.
2. Navigate Class list to SmartOps DM—Dashboard? Slicers.
3. Double click on Slicer 1.
4. Click >> and point is to the Attribute that you want this slicer to point to.
5. To customize the slicer name in the dashboard expand the (+) next to the Slicer X and double click on Slicer X Name.
6. Replace the text under the Select portion of the screen with what you want to display as the slicer name in the dashboard. This value must be inclosed in (‘) tick marks.
Configuring an external data source Along with EIS MIPO data, the EIS Analytics Data Mart can also be configured to include data from a secondary external source.
To configure the Data Mart for external data, you must log on to the Data Services Designer application and open the EIS Analytics Template. See the SAP Business Objects Data Services Designer documentation for more information about the application.
To configure the Data Mart for an external data source:
1. Log on to Data Services Designer with your EIS Analytics administration account.
2. Under the Local Object Library, select the Data Flow tab.
3. Click to expand the Data Flows folder.
4. Double click the DF_Stg_Inventory_History object to open the blank data flow node in the Deisgner workspace.

Chapter 2: Installing and configuring EIS Analytics files
35
5. Use the local object library and tool palette to add objects to the workspace in order to create a data flow linking external data tables, queries, etc. to the Stg_Inventory_History table.
6. When you are finished, save your changes.
Trigger ELT to complete the Data Mart TransferTo transfer scenarios to the Data Mart:
1. Log on to the Data Services Designer as an administrator.
2. Click on the Administrator icon.
3. From the left navigation panel, expand Batch.
4. Select your local repository.
5. Select the Batch Job Configuration tab.
6. Select the J_SmartOps_DM_Load_Manual job.
7. Click the Execute icon in the toolbar.
Wait for the job to say “J_SmartOps_DM_Load_Manual job has completed success-fully.”
EIS Analytics batch jobsThere are several EIS Analytics batch jobs you can run that perform various tasks. To access the batch jobs:
1. Log on to Data Services Management Console as an administrator.
2. Click Administrator.
3. From the Administrator directory tree, click to expand Batch.
Note: Once the DF_Stg_Inventory_History data flow node has been modified, it is recommended that the customized node be backed up through the Export tool in order to prevent losing customized data during a product upgrade. Refer to the SAP Business Objects Data Services Designer documentation for more information about the Export tool.
Note: The only jobs that should be scheduled to run on a periodic basis are J_SmartOps_DM_Load and J_SmartOps_Replenishment. Before running any job manually, deactivate the periodic jobs so that they do not run concurrently with the manual jobs. Run more than one job (manually or otherwise) at the same time may result in corrupted or lost data.

Enterprise Inventory and Service-Level Optimization Analytics Installation Guide
36
The following table identifies and describes the batch jobs:
Scheduling batch jobs to run on a periodic basisTo schedule an EIS Analytics batch job to run on a periodic basis:
1. Log on to Data Services Management Console as an administrator.
2. Click Administrator.
3. From the Administrator directory tree, click to expand Batch.
Batch Job Name Description
J_SmartOps_Cleanup_SmartOps_Scenarios This job deletes the non-historical, non-performance tracking fact tables in the EIS Analytics Data Mart, such as DM_FACT_STOCKING_POINT_PLAN, DM_FACT_DEMAND, DM_FACT_SUPPLY PATH, etc.
J_SmartOps_DM_Load This is the primary load process for the EIS Analytics Data Mart.
J_SmartOps_DM_Load_Manual This is the primary load process for a scenario.
J_SmartOps_Perf_ReBuild This job rebuilds the performance tracking table from the scenarios loaded into the Data Mart
J_SmartOps_Replenishment The job builds the replenishment table in the Data Mart and sends out emails in the event of a failure or success.
J_SmartOps_Replenishment_Manual The job builds the replenishment table in the Data Mart and sends out emails in the event of a failure or success.
J_SmartOps_Setup_Ctrl This job loads the attribute control files from a spreadsheet to the database.
J_SmartOps_Cleanup_Historical This job cleans up the tables that house historical data, such as the DM_FACT_INVENTORY_HISTORY table and the performance tracking group tables, and replenishment data.
NOTE: This operation removes all historical data and there is no recovery option once the data has been removed.
Table 2-1 EIS Analytics batch jobs

Chapter 2: Installing and configuring EIS Analytics files
37
4. Click on the EIS Analytics repository node.
5. Under the Batch window, click the Batch Job Configuration tab.
6. Locate the batch job you wish to schedule, then click Add Schedule.
7. Fill out Schedule Batch Job information, based on your company’s policy regarding scheduling batch jobs.
8. Click Apply.
The selected EIS Analytics batch job is now scheduled to run on a periodic basis.
Troubleshooting ETL jobsIf a job fails and does not automatically restart, truncate the DM_META_SYSTEM_STATE and DM_META_REPLENISHMENT_STATUS tables, then run the job again.
If the J_SmartOps_DM_Load or J_SmartOps_DM_Load_Manual job fails, you may have to delete the entries in the DM_SCENARIO_PUSH table in order for the system to repush scenarios that were only partially transferred from the Data Store to the Data Mart.
Updating EIS MIPO scenario names to ensure dashboards display properlyTo ensure that all MIPO base scenarios are properly handled by the EIS Analytics performance tracking group feature, these scenarios must use the following naming convention:
<supply chain name>#<unique scenario name>
Ensure that your supply chain files follow this naming convention when they are transferred to the MIPO application.
Note: Supply chain names may contain spaces before the supply chain name or before the # symbol, but they are ignored by the system. As a result, a performance tracking group (supply chain/scenario pair) called abc #scenario is seen as being the same group as abc#scenario.
Enterprise Inventory and Service-Level Optimization Analytics Installation Guide
38
If this scenario naming convention is not followed, the following dashboard will not display properly, as they use the performance tracking group:
• Demand History
• Performance Overview
• Target Performance
• Cost Curve
• Fix The Mix
InfoView preference update (browsers using JRE7 only)To ensure the EIS Analytics WebI files work correctly on browsers using the Java Runtime Environment (JRE) 7 or greater, it is recommended to change the InfoView preference for the default creative/editing tool.
1. Log into InfoView.
2. Select Preferences.
3. Select Web Intelligence.
4. Set the “Select a default creation/editing tool:” option to Interactive.
5. Press OK.
Accessing EIS Analytics with SAP Business Objects Mobile app You can use your iPhone or iPad to access the EIS Analytics WebI reports through the SAP Business Objects Mobile app. Download the application from iTunes, and follow the configuration instructions to connect the app to the BusinessObjects server.
For detailed information on downloading iTunes applications, refer to the Apple Support site.
For detailed information about the SAP Business Objects mobile app, refer to the SAP Help Portal.
39
Chapter 3: MaintainingEIS Analytics
Dashboards
his chapter provides instructions for maintaining the EIS Analytics application on an SAP Business Objects server. For more information about SAP Business Objects, refer to your SAP Help Portal.
Customizing the EIS Analytics dashboards The EIS Analytics dashboards can be customized, if necessary, in order to change graph thresholds and colors.
The SAP Business Objects Universe Designer enterprise software application can be used to access the EIS Analytics dashboard business objects to make any necessary adjustments. Refer to the Universe Designer user documentation for information on how to make modifications to existing dashboard files.
Note: It is recommended that any EIS Analytics files which are modified should be backed up before software upgrades, installation fixes, etc., as these files will get overwritten as part of the upgrade. An alternative would be to change the names of the modified files (e.g., append “_SAVE” to the file name) before upgrading EIS Analytics.
T

Enterprise Inventory and Service-Level Optimization Analytics Installation Guide
40
The following EIS Analytics default settings can be configured through the Business Objects Universe Designer application:
• Minimum Inventory Target calculation
• Maximum Inventory Target calculation
• Bias calculation
• Dashboard gauge thresholds
• Dashboard graph colors
• Dashboard attribute slicers
Changing the Minimum Inventory Target calculationTo update the Minimum Inventory Target calculation:
1. From the Universe directory tree, click to expand the Supply Chain-Specific Inventory Targets folder.
2. Double click the Min Inventory Target Units object to view the Edit Properties dialog box.
3. Edit the Select field to update the percentage value from 80% (0.8) to desired minimum percentage.
4. Update the Description field to reflect the new default value.
5. Click OK.
You can now export the EIS Analytics Template in order for your changes to take effect.
Changing the Maximum Inventory Target calculationTo update the Maximum Inventory Target calculation:
1. From the Universe directory tree, click to expand the Supply Chain-Specific Inventory Targets folder.
2. Double click the Max Inventory Target Units object to view the Edit Properties dialog box.
3. Edit the Select field to update the percentage value from 120% (1.2) to desired maximum percentage.
4. Update the Description field to reflect the new default value.
Note: To update these default settings you must log on to the Universe Designer application and Import the EIS Analytics Template universe. See the SAP Business Objects Universe Designer documentation for more information about the application.
Chapter 3: Maintaining EIS Analytics Dashboards
41
5. Click OK.
You can now export the EIS Analytics Template in order for your changes to take effect.
Changing the Bias calculationTo update the Bias calculation:
1. From the Universe directory tree, click to expand the Demand folder.
2. Click to expand the Demand Analytics folder.
3. Double click the Bias Analytics folder to view the Edit Properties dialog box.
4. Edit the Select field to update the Bias calculation from Bias Calculated Capped to either Bias Calculated Original or Bias Used in Adjustment.
5. Update the Description field to reflect the new default value.
6. Click OK.
You can now export the EIS Analytics Template in order for your changes to take effect.
Changing the Demand Analytics dashboard gauge thresholdsTo adjust the dashboard gauge threshold settings:
1. From the Universe directory tree, click to expand the Dashboard folder.
2. Click to expand the Demand Analytics Dashboard folder.
3. Click to expand the Customization Settings folder. There are six objects:
• Forecast Error Green to Yellow Transition Value
• Forecast Error Yellow to Red Transition Value
• Bias Green to Yellow Transition Value
• Bias Yellow to Red Transition Value
• Intermittency Green to Yellow Transition Value
• Intermittency Yellow to Red Transition Value
4. Edit the Select field to update the percentage value, in decimal form, to the desired minimum percentage.
5. Update the Description field to reflect the new default value.
6. Click OK.
You can now export the EIS Analytics Template in order for your changes to take effect.
Enterprise Inventory and Service-Level Optimization Analytics Installation Guide
42
Changing the Demand Analytics dashboard graph colorsThe EIS Analytics dashboard uses the default colors of red, yellow, and blue to display graphic data in the gauges, histograms, and bar charts. To change the default dashboard graph color settings:
1. From the Universe directory tree, click to expand the Dashboard folder.
2. Click to expand the Demand Analytics Dashboard folder.
3. Click to expand the Customization Settings folder. There are three default color objects:
• Green Color
• Yellow Color
• Red Color
4. Edit the Select field to update the HTML color code’s hexidecimal value to the desired color.
5. Update the Description field to reflect the new default color.
6. Click OK.
You can now export the EIS Analytics Template in order for your changes to take effect.
Changing the Demand Analytics Sales-Forecast Numerical Spinner valueThe Demand Analytics detail drill-downs contain numerical spinners that control the granularity of the Sales-Forecast chart. To change the default values for these spinners:
1. From the Universe directory tree, click to expand the Dashboard folder.
2. Click to expand the Demand Analytics Dashboard folder.
3. Click to expand the Customization Settings folder. There are four default spinner values:
• Default Number of Days in Sales-Forecast Chart (Default is 30)
• Default Number of Weeks in Sales-Forecast Chart (Default is 26)
• Default Number of Months in Sales-Forecast Chart (Default is 12)
• Default Number of Quarters in Sales-Forecast Chart (Default is 4)
4. Edit the Select field to update the default value.
Note: Refer to an HTML color code chart (available on the Internet) to get the correct color code number.

Chapter 3: Maintaining EIS Analytics Dashboards
43
5. Click OK.
You can now export the EIS Analytics Template in order for your changes to take effect.
Changing the Performance Overview dashboard gauge thresholdsTo adjust the dashboard gauge threshold settings:
1. From the Universe directory tree, click to expand the Dashboard folder.
2. Click to expand the Performance Overview Dashboard folder.
3. Click to expand the Performance Overview Customizations folder. There are five threshold objects:
• Performance Alerts Scorecard Threshold
• Performance Alerts Yellow to Red Transition Value
• Performance Alerts Green to Yellow Transition Value
• Inventory Performance Red to Yellow Transition Value
• Inventory Performance Yellow to Green Transition Value
4. Edit the Select field to update the percentage value, in decimal form, to the desired minimum percentage.
5. Update the Description field to reflect the new default value.
6. Click OK.
You can now export the EIS Analytics Template in order for your changes to take effect.
Changing the Performance Overview colorsThe Performance Overview dashboard uses the default colors of red, yellow, and green in the dashboard gauge. To change the default color settings for the gauge:
1. From the Universe directory tree, click to expand the Dashboard folder.
2. Click to expand the Performance Overview folder.
3. Click to expand the Performance Overview Customization folder. There are three default color objects:
• Red Color for Performance Overview
• Yellow Color for Performance Overview
• Green Color for Performance Overview
Enterprise Inventory and Service-Level Optimization Analytics Installation Guide
44
4. Edit the Select field to update the HTML color code’s hexidecimal value to the desired color.
5. Update the Description field to reflect the new default color.
6. Click OK.
You can now export the EIS Analytics Template in order for your changes to take effect.
Changing the Supply Analytics dashboard gauge thresholdsTo adjust the dashboard gauge threshold settings:
1. From the Universe directory tree, click to expand the Dashboard folder.
2. Click to expand the Supply Analytics Dashboard folder.
3. Click to expand the Supply Analytics Customization Settings folder. There are four threshold objects:
• Lead Time Error Green to Yellow Transition Value
• Lead Time Error Yellow to Red Transition Value
• Planned Lead Time Error Green to Yellow Transition Value
• Planned Lead Time Error Yellow to Red Transition Value
4. Edit the Select field to update the percentage value, in decimal form, to the desired minimum percentage.
5. Update the Description field to reflect the new default value.
6. Click OK.
You can now export the EIS Analytics Template in order for your changes to take effect.
Note: Refer to an HTML color code chart (available on the Internet) to get the correct color code number.
Note: The color values of the red, yellow, and green dots in the SS Delta % column of the Performance Overview table are not user editable.

Chapter 3: Maintaining EIS Analytics Dashboards
45
Changing the Threshold for Planned Lead TimeBy default, the threshold for Planned Lead Time is 0.1, that is 10%. To change the threshold for Planned Lead Time setting:
1. From the Universe directory tree, click to expand the Dashboard folder.
2. Click to expand the Supply Analytics Dashboard folder.
3. Click to expand the Supply Analytics Customization Settings folder.
4. Double-click the Threshold for Planned Lead Time.
5. Edit the Select field to update the percentage value, in decimal form, to the desired minimum percentage.
6. Update the Description field to reflect the new default value.
7. Click OK.
You can now export the EIS Analytics Template in order for your changes to take effect.
Changing the Supply Analytics colorsThe Supply Analytics dashboard uses the default colors of red, yellow, and green in the dashboard gauge. To change the default color settings for the gauge:
1. From the Universe directory tree, click to expand the Dashboard folder.
2. Click to expand the Supply Analytics Dashboard folder.
3. Click to expand the Supply Analytics Customization Settings folder. There are three default color objects:
• Red Color
• Yellow Color
• Green Color
4. Edit the Select field to update the HTML color code’s hexidecimal value to the desired color.
5. Update the Description field to reflect the new default color.
6. Click OK.
You can now export the EIS Analytics Template in order for your changes to take effect
Note: Refer to an HTML color code chart (available on the Internet) to get the correct color code number.
Enterprise Inventory and Service-Level Optimization Analytics Installation Guide
46
Changing the dashboard slicer attributes
The EIS Analytics dashboard uses customer-defined attribute information to filter data for analysis. The following slicers are available by default:
• Material
• Material Class
• Location
• Planner Code
• Business Unit
• Region
To change the slicer attribute settings:
1. From the Universe directory tree, click to expand the Dashboard folder.
2. Click to expand the Slicers folder.
3. Double click the Slicer object to view the Edit Properties dialog box. There are six default Slicer objects:
• Slicer 1
• Slicer 2
• Slicer 3
• Slicer 4
• Slicer 5
• Slicer 6
4. Edit the Select field to update the Attribute data table value to the desired attribute data table.
5. Double click the associated Slicer Name object.
6. Edit the Select field to change the Slicer Name to reflect the associated attribute data table
7. Click OK.
Note: The slicer dropdown can only display up to 500 attribute elements due to a limitation in the Xcelcius application.
Note: The EIS Analytics Data Mart has ten item attribute tables, ten target location attribute tables, and ten source or current location attributes that can be used for customized attribute data.

Chapter 3: Maintaining EIS Analytics Dashboards
47
8. Repeat steps 3 through 7 to change any other Slicer attribute filters.
You can now export the EIS Analytics Template in order for your changes to take effect.

Enterprise Inventory and Service-Level Optimization Analytics Installation Guide
48
49
Chapter 4: User GroupPrivileges
his chapter provides a list of SAP Business Objects access privileges associated with the three SOPS User Groups.
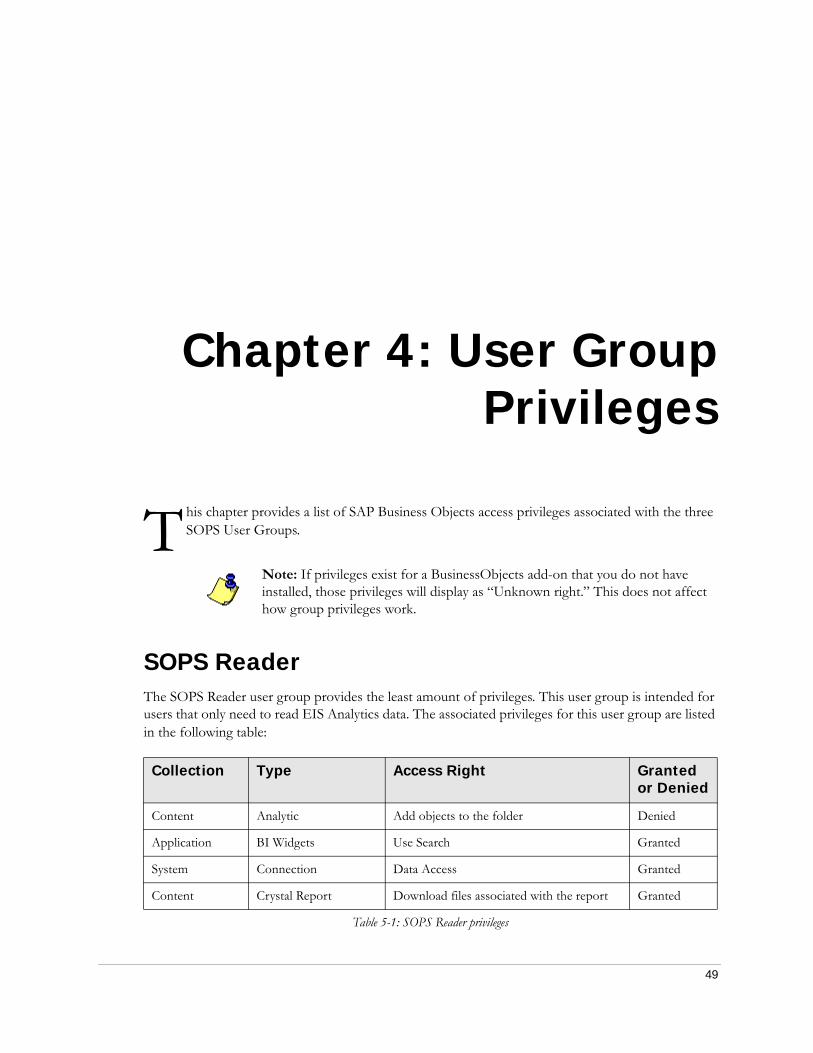
SOPS ReaderThe SOPS Reader user group provides the least amount of privileges. This user group is intended for users that only need to read EIS Analytics data. The associated privileges for this user group are listed in the following table:
Note: If privileges exist for a BusinessObjects add-on that you do not have installed, those privileges will display as “Unknown right.” This does not affect how group privileges work.
Collection Type Access Right Granted or Denied
Content Analytic Add objects to the folder Denied
Application BI Widgets Use Search Granted
System Connection Data Access Granted
Content Crystal Report Download files associated with the report Granted
Table 5-1: SOPS Reader privileges
T

Enterprise Inventory and Service-Level Optimization Analytics Installation Guide
50
Content Crystal Report Export the report's data Granted
Content Crystal Report Refresh the report's data Granted
General General Add objects to folders that the user owns Granted
General General Change user password Granted
General General View document instances Granted
General General View document instances that the user owns Granted
General General View objects Granted
General General View objects that the user owns Granted
Content Hyperlink Add objects to the folder Denied
Application InfoView Assign categories Granted
Application InfoView Change user's preferences Granted
Application InfoView Do a content search Granted
Application InfoView Do an advanced search Granted
Application InfoView View the favorites folder Granted
Application InfoView View the Inbox Granted
Content My InfoView Add objects to folders that the user owns Granted
Content My InfoView Copy objects that the user owns to another folder
Granted
Content My InfoView View objects Granted
Content My InfoView View objects that the user owns Granted
Content Publication Add objects to the folder Denied
System Universe Create and Edit Queries Based on Universe Granted
System Universe Data Access Granted
System Universe New List of Values Granted
Application Web Intelligence Create document Denied
Application Web Intelligence Edit SQL Denied
Collection Type Access Right Granted or Denied
Table 5-1: SOPS Reader privileges

Chapter 4: User Group Privileges
51
Application Web Intelligence Enable drill mode Granted
Application Web Intelligence View SQL Denied
Content Web Intelligence Report
Download files associated with the object Granted
Content Web Intelligence Report
Edit Query Denied
Content Web Intelligence Report
Export the report's data Granted
Content Web Intelligence Report
Refresh List of Values Granted
Content Web Intelligence Report
Refresh the report's data Granted
Content Web Intelligence Report
Save as CSV Granted
Content Web Intelligence Report
Save as excel Granted
Content Web Intelligence Report
Save as PDF Granted
Content Web Intelligence Report
Use Lists of Values Granted
Content Web Intelligence Report
View SQL Denied
Collection Type Access Right Granted or Denied
Table 5-1: SOPS Reader privileges
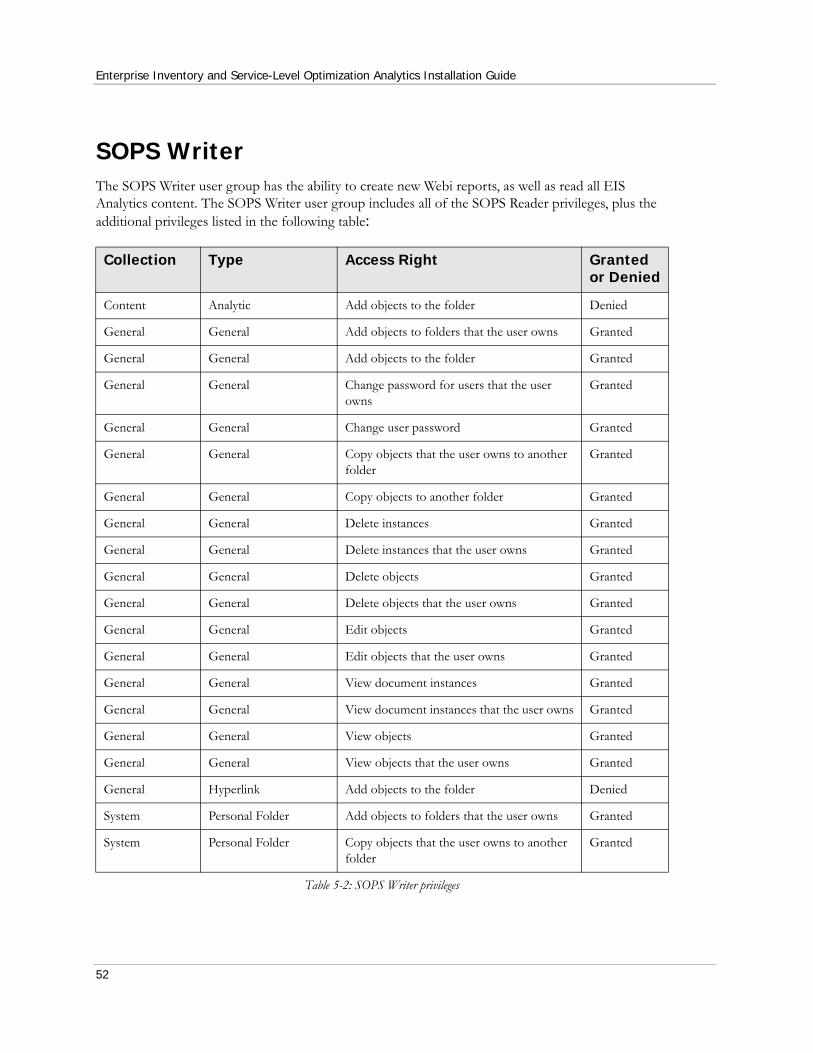
Enterprise Inventory and Service-Level Optimization Analytics Installation Guide
52
SOPS WriterThe SOPS Writer user group has the ability to create new Webi reports, as well as read all EIS Analytics content. The SOPS Writer user group includes all of the SOPS Reader privileges, plus the additional privileges listed in the following table:
Collection Type Access Right Granted or Denied
Content Analytic Add objects to the folder Denied
General General Add objects to folders that the user owns Granted
General General Add objects to the folder Granted
General General Change password for users that the user owns
Granted
General General Change user password Granted
General General Copy objects that the user owns to another folder
Granted
General General Copy objects to another folder Granted
General General Delete instances Granted
General General Delete instances that the user owns Granted
General General Delete objects Granted
General General Delete objects that the user owns Granted
General General Edit objects Granted
General General Edit objects that the user owns Granted
General General View document instances Granted
General General View document instances that the user owns Granted
General General View objects Granted
General General View objects that the user owns Granted
General Hyperlink Add objects to the folder Denied
System Personal Folder Add objects to folders that the user owns Granted
System Personal Folder Copy objects that the user owns to another folder
Granted
Table 5-2: SOPS Writer privileges
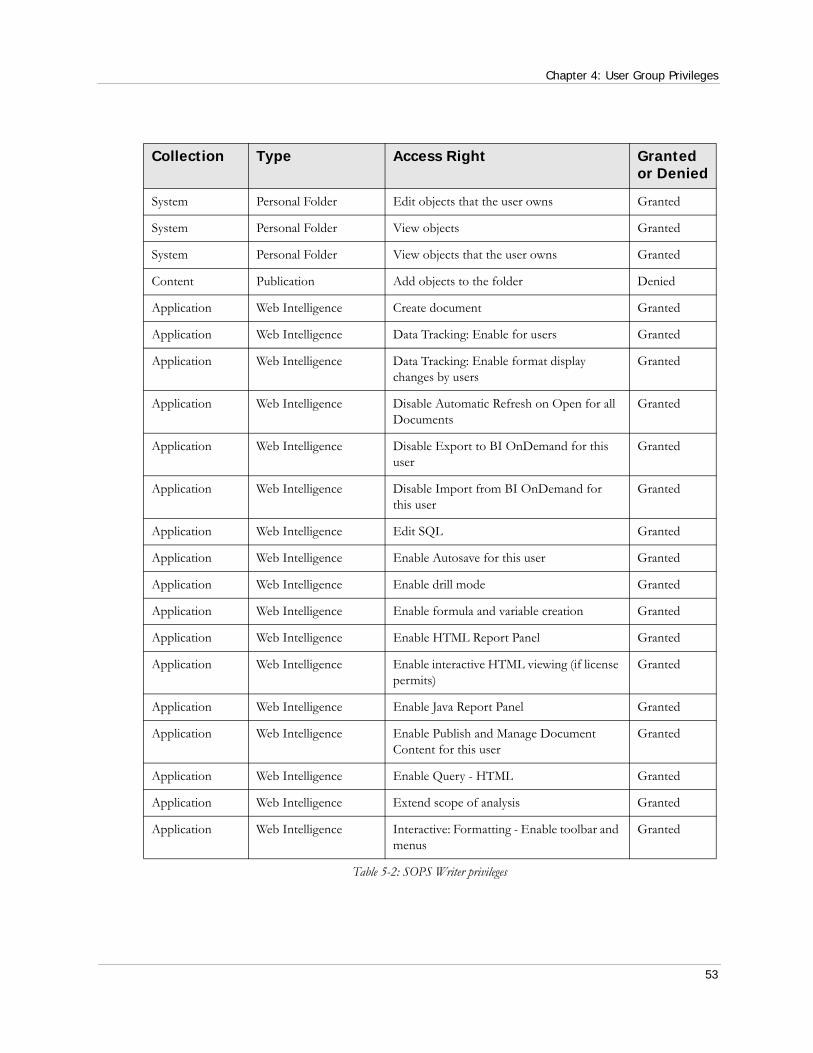
Chapter 4: User Group Privileges
53
System Personal Folder Edit objects that the user owns Granted
System Personal Folder View objects Granted
System Personal Folder View objects that the user owns Granted
Content Publication Add objects to the folder Denied
Application Web Intelligence Create document Granted
Application Web Intelligence Data Tracking: Enable for users Granted
Application Web Intelligence Data Tracking: Enable format display changes by users
Granted
Application Web Intelligence Disable Automatic Refresh on Open for all Documents
Granted
Application Web Intelligence Disable Export to BI OnDemand for this user
Granted
Application Web Intelligence Disable Import from BI OnDemand for this user
Granted
Application Web Intelligence Edit SQL Granted
Application Web Intelligence Enable Autosave for this user Granted
Application Web Intelligence Enable drill mode Granted
Application Web Intelligence Enable formula and variable creation Granted
Application Web Intelligence Enable HTML Report Panel Granted
Application Web Intelligence Enable interactive HTML viewing (if license permits)
Granted
Application Web Intelligence Enable Java Report Panel Granted
Application Web Intelligence Enable Publish and Manage Document Content for this user
Granted
Application Web Intelligence Enable Query - HTML Granted
Application Web Intelligence Extend scope of analysis Granted
Application Web Intelligence Interactive: Formatting - Enable toolbar and menus
Granted
Collection Type Access Right Granted or Denied
Table 5-2: SOPS Writer privileges
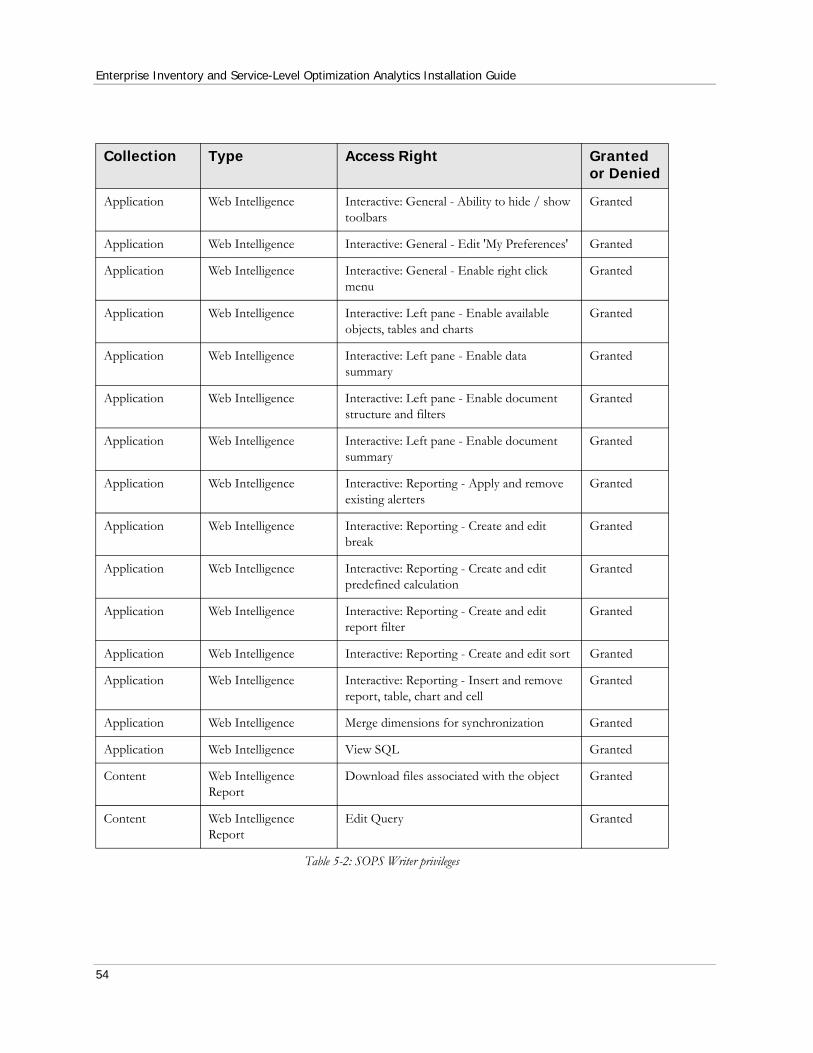
Enterprise Inventory and Service-Level Optimization Analytics Installation Guide
54
Application Web Intelligence Interactive: General - Ability to hide / show toolbars
Granted
Application Web Intelligence Interactive: General - Edit 'My Preferences' Granted
Application Web Intelligence Interactive: General - Enable right click menu
Granted
Application Web Intelligence Interactive: Left pane - Enable available objects, tables and charts
Granted
Application Web Intelligence Interactive: Left pane - Enable data summary
Granted
Application Web Intelligence Interactive: Left pane - Enable document structure and filters
Granted
Application Web Intelligence Interactive: Left pane - Enable document summary
Granted
Application Web Intelligence Interactive: Reporting - Apply and remove existing alerters
Granted
Application Web Intelligence Interactive: Reporting - Create and edit break
Granted
Application Web Intelligence Interactive: Reporting - Create and edit predefined calculation
Granted
Application Web Intelligence Interactive: Reporting - Create and edit report filter
Granted
Application Web Intelligence Interactive: Reporting - Create and edit sort Granted
Application Web Intelligence Interactive: Reporting - Insert and remove report, table, chart and cell
Granted
Application Web Intelligence Merge dimensions for synchronization Granted
Application Web Intelligence View SQL Granted
Content Web Intelligence Report
Download files associated with the object Granted
Content Web Intelligence Report
Edit Query Granted
Collection Type Access Right Granted or Denied
Table 5-2: SOPS Writer privileges
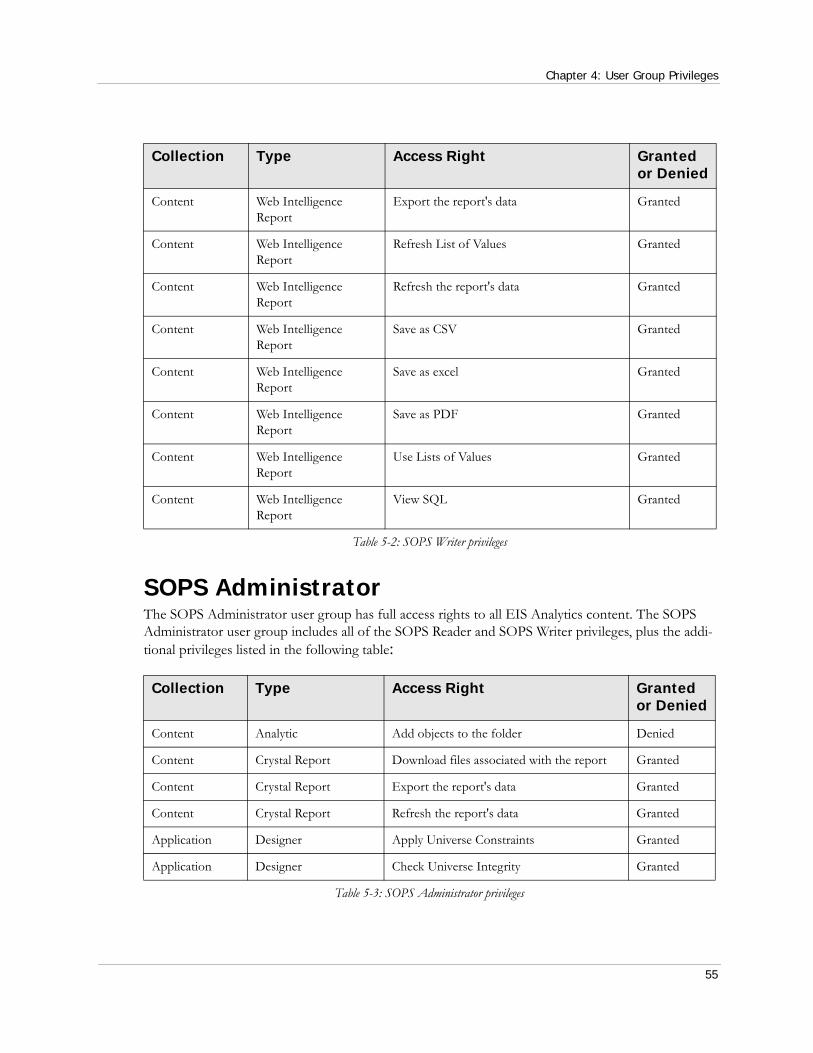
Chapter 4: User Group Privileges
55
SOPS AdministratorThe SOPS Administrator user group has full access rights to all EIS Analytics content. The SOPS Administrator user group includes all of the SOPS Reader and SOPS Writer privileges, plus the addi-tional privileges listed in the following table:
Content Web Intelligence Report
Export the report's data Granted
Content Web Intelligence Report
Refresh List of Values Granted
Content Web Intelligence Report
Refresh the report's data Granted
Content Web Intelligence Report
Save as CSV Granted
Content Web Intelligence Report
Save as excel Granted
Content Web Intelligence Report
Save as PDF Granted
Content Web Intelligence Report
Use Lists of Values Granted
Content Web Intelligence Report
View SQL Granted
Collection Type Access Right Granted or Denied
Content Analytic Add objects to the folder Denied
Content Crystal Report Download files associated with the report Granted
Content Crystal Report Export the report's data Granted
Content Crystal Report Refresh the report's data Granted
Application Designer Apply Universe Constraints Granted
Application Designer Check Universe Integrity Granted
Table 5-3: SOPS Administrator privileges
Collection Type Access Right Granted or Denied
Table 5-2: SOPS Writer privileges
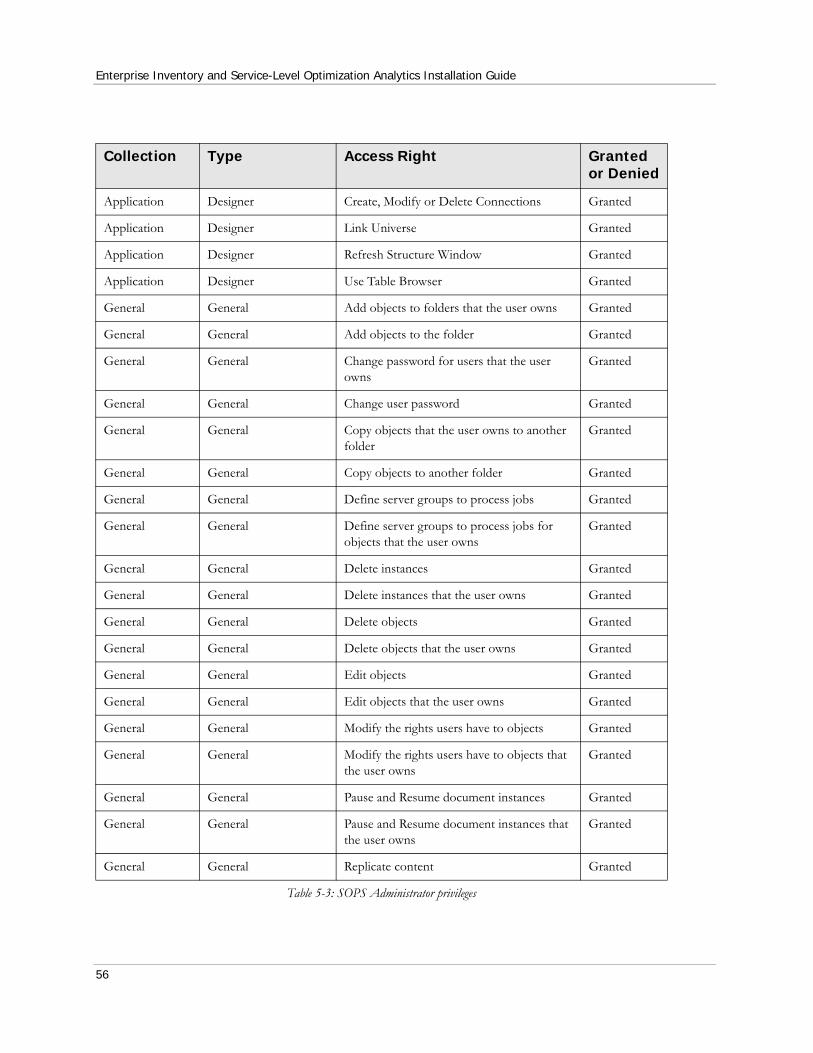
Enterprise Inventory and Service-Level Optimization Analytics Installation Guide
56
Application Designer Create, Modify or Delete Connections Granted
Application Designer Link Universe Granted
Application Designer Refresh Structure Window Granted
Application Designer Use Table Browser Granted
General General Add objects to folders that the user owns Granted
General General Add objects to the folder Granted
General General Change password for users that the user owns
Granted
General General Change user password Granted
General General Copy objects that the user owns to another folder
Granted
General General Copy objects to another folder Granted
General General Define server groups to process jobs Granted
General General Define server groups to process jobs for objects that the user owns
Granted
General General Delete instances Granted
General General Delete instances that the user owns Granted
General General Delete objects Granted
General General Delete objects that the user owns Granted
General General Edit objects Granted
General General Edit objects that the user owns Granted
General General Modify the rights users have to objects Granted
General General Modify the rights users have to objects that the user owns
Granted
General General Pause and Resume document instances Granted
General General Pause and Resume document instances that the user owns
Granted
General General Replicate content Granted
Collection Type Access Right Granted or Denied
Table 5-3: SOPS Administrator privileges
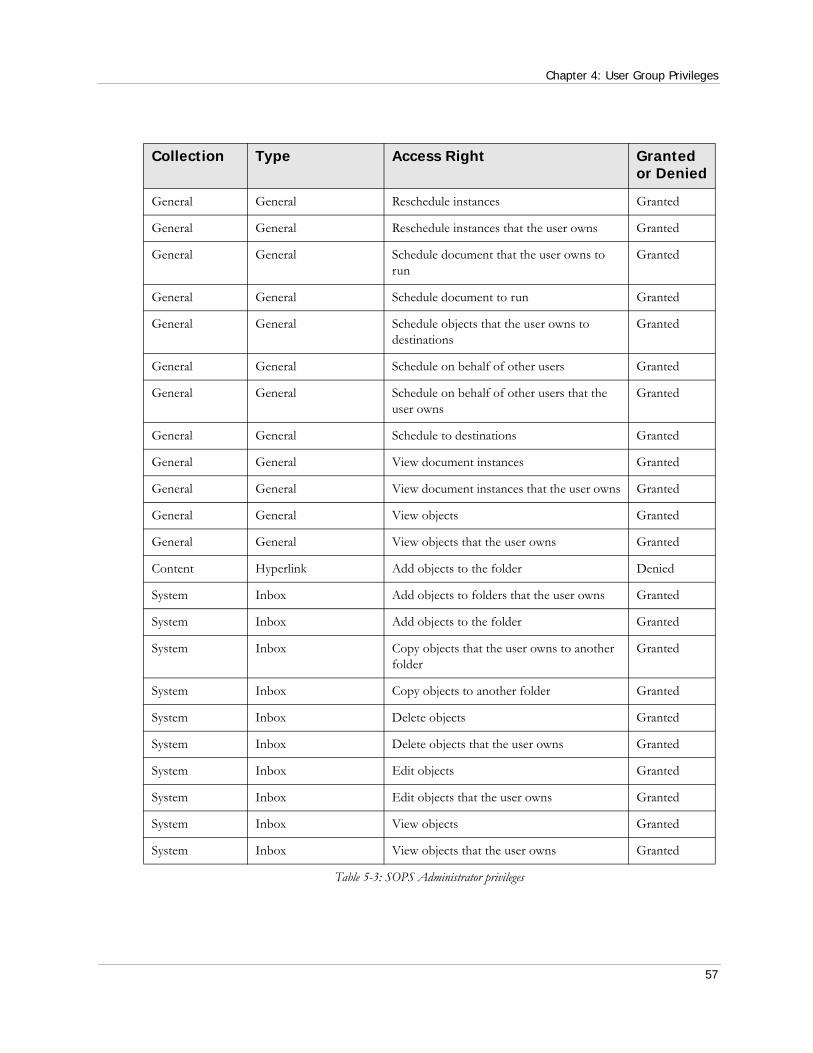
Chapter 4: User Group Privileges
57
General General Reschedule instances Granted
General General Reschedule instances that the user owns Granted
General General Schedule document that the user owns to run
Granted
General General Schedule document to run Granted
General General Schedule objects that the user owns to destinations
Granted
General General Schedule on behalf of other users Granted
General General Schedule on behalf of other users that the user owns
Granted
General General Schedule to destinations Granted
General General View document instances Granted
General General View document instances that the user owns Granted
General General View objects Granted
General General View objects that the user owns Granted
Content Hyperlink Add objects to the folder Denied
System Inbox Add objects to folders that the user owns Granted
System Inbox Add objects to the folder Granted
System Inbox Copy objects that the user owns to another folder
Granted
System Inbox Copy objects to another folder Granted
System Inbox Delete objects Granted
System Inbox Delete objects that the user owns Granted
System Inbox Edit objects Granted
System Inbox Edit objects that the user owns Granted
System Inbox View objects Granted
System Inbox View objects that the user owns Granted
Collection Type Access Right Granted or Denied
Table 5-3: SOPS Administrator privileges

Enterprise Inventory and Service-Level Optimization Analytics Installation Guide
58
Application InfoView Assign categories Granted
Application InfoView Change user's preferences Granted
Application InfoView Create categories Granted
Application InfoView Create folders Granted
Application InfoView Create personal categories Granted
Application InfoView Do a content search Granted
Application InfoView Do an advanced search Granted
Application InfoView Filter object listing by object type Granted
Application InfoView Organize Granted
Application InfoView Search for simple text Granted
Application InfoView Send documents Granted
Application InfoView View the favorites folder Granted
Application InfoView View the Inbox Granted
Content My InfoView Add objects to folders that the user owns Granted
Content My InfoView Add objects to the folder Granted
Content My InfoView Copy objects that the user owns to another folder
Granted
Content My InfoView Copy objects to another folder Granted
Content My InfoView Delete objects Granted
Content My InfoView Delete objects that the user owns Granted
Content My InfoView Edit objects Granted
Content My InfoView Edit objects that the user owns Granted
Content My InfoView Modify the rights users have to objects Granted
Content My InfoView Modify the rights users have to objects that the user owns
Granted
Content My InfoView View objects Granted
Content My InfoView View objects that the user owns Granted
Collection Type Access Right Granted or Denied
Table 5-3: SOPS Administrator privileges
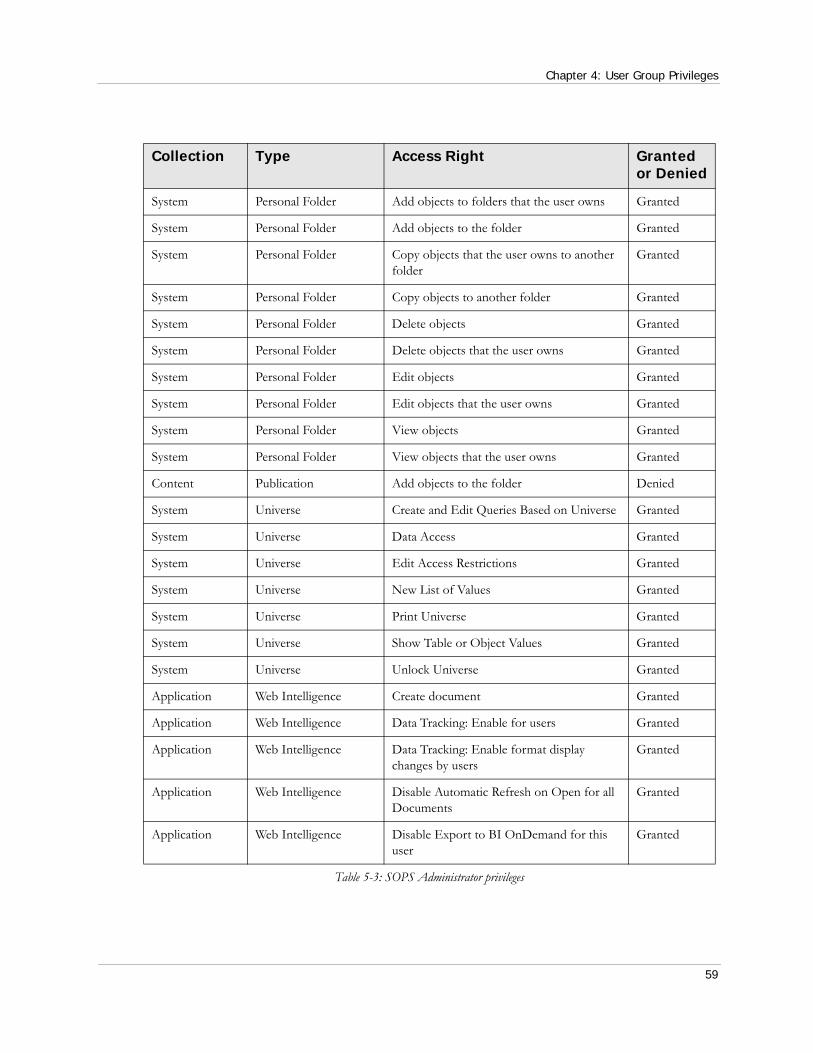
Chapter 4: User Group Privileges
59
System Personal Folder Add objects to folders that the user owns Granted
System Personal Folder Add objects to the folder Granted
System Personal Folder Copy objects that the user owns to another folder
Granted
System Personal Folder Copy objects to another folder Granted
System Personal Folder Delete objects Granted
System Personal Folder Delete objects that the user owns Granted
System Personal Folder Edit objects Granted
System Personal Folder Edit objects that the user owns Granted
System Personal Folder View objects Granted
System Personal Folder View objects that the user owns Granted
Content Publication Add objects to the folder Denied
System Universe Create and Edit Queries Based on Universe Granted
System Universe Data Access Granted
System Universe Edit Access Restrictions Granted
System Universe New List of Values Granted
System Universe Print Universe Granted
System Universe Show Table or Object Values Granted
System Universe Unlock Universe Granted
Application Web Intelligence Create document Granted
Application Web Intelligence Data Tracking: Enable for users Granted
Application Web Intelligence Data Tracking: Enable format display changes by users
Granted
Application Web Intelligence Disable Automatic Refresh on Open for all Documents
Granted
Application Web Intelligence Disable Export to BI OnDemand for this user
Granted
Collection Type Access Right Granted or Denied
Table 5-3: SOPS Administrator privileges

Enterprise Inventory and Service-Level Optimization Analytics Installation Guide
60
Application Web Intelligence Disable Import from BI OnDemand for this user
Granted
Application Web Intelligence Edit SQL Granted
Application Web Intelligence Enable Autosave for this user Granted
Application Web Intelligence Enable drill mode Granted
Application Web Intelligence Enable formula and variable creation Granted
Application Web Intelligence Enable HTML Report Panel Granted
Application Web Intelligence Enable interactive HTML viewing (if license permits)
Granted
Application Web Intelligence Enable Java Report Panel Granted
Application Web Intelligence Enable Publish and Manage Document Content for this user
Granted
Application Web Intelligence Enable Query - HTML Granted
Application Web Intelligence Extend scope of analysis Granted
Application Web Intelligence Interactive: Formatting - Enable toolbar and menus
Granted
Application Web Intelligence Interactive: General - Ability to hide / show toolbars
Granted
Application Web Intelligence Interactive: General - Edit 'My Preferences' Granted
Application Web Intelligence Interactive: General - Enable right click menu
Granted
Application Web Intelligence Interactive: Left pane - Enable available objects, tables and charts
Granted
Application Web Intelligence Interactive: Left pane - Enable data summary
Granted
Application Web Intelligence Interactive: Left pane - Enable document structure and filters
Granted
Application Web Intelligence Interactive: Left pane - Enable document summary
Granted
Collection Type Access Right Granted or Denied
Table 5-3: SOPS Administrator privileges

Chapter 4: User Group Privileges
61
Application Web Intelligence Interactive: Reporting - Apply and remove existing alerters
Granted
Application Web Intelligence Interactive: Reporting - Create and edit break
Granted
Application Web Intelligence Interactive: Reporting - Create and edit predefined calculation
Granted
Application Web Intelligence Interactive: Reporting - Create and edit report filter
Granted
Application Web Intelligence Interactive: Reporting - Create and edit sort Granted
Application Web Intelligence Interactive: Reporting - Insert and remove report, table, chart and cell
Granted
Application Web Intelligence Merge dimensions for synchronization Granted
Application Web Intelligence View SQL Granted
Content Web Intelligence Report
Download files associated with the object Granted
Content Web Intelligence Report
Edit Query Granted
Content Web Intelligence Report
Export the report's data Granted
Content Web Intelligence Report
Refresh List of Values Granted
Content Web Intelligence Report
Refresh the report's data Granted
Content Web Intelligence Report
Save as CSV Granted
Content Web Intelligence Report
Save as excel Granted
Content Web Intelligence Report
Save as PDF Granted
Content Web Intelligence Report
Use Lists of Values Granted
Collection Type Access Right Granted or Denied
Table 5-3: SOPS Administrator privileges
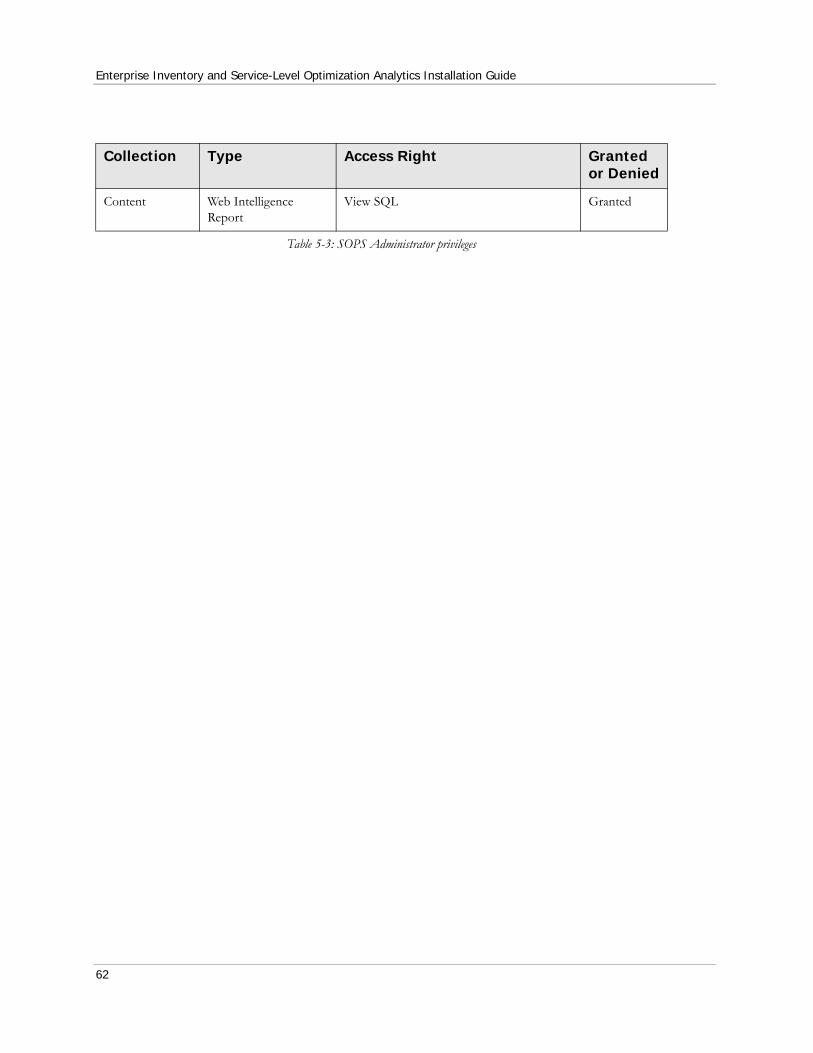
Enterprise Inventory and Service-Level Optimization Analytics Installation Guide
62
Content Web Intelligence Report
View SQL Granted
Collection Type Access Right Granted or Denied
Table 5-3: SOPS Administrator privileges

63
Chapter 5: RejectMessage Definitions
his chapter contains details on the message definitions related to the reject ID codes to be used as a reference when reviewing reject log data.
Reject Message Definitions
Reject ID
Package Name Message Classifi-cation
2000 PACK_DM_REPLENISHMENT ITEM_ID SHOULD NOT BE NULL IN THE STG_INVENTORY_REPLENISHMENT TABLE
Warning
2001 PACK_DM_REPLENISHMENT ITEM_ID NOT FOUND IN THE DM_ITEM TABLE
Warning
2002 PACK_DM_REPLENISHMENT LOCATION_ID SHOULD NOT BE NULL IN THE STG_INVENTORY_REPLENISHMENT TABLE
Warning
2003 PACK_DM_REPLENISHMENT LOCATION_ID NOT FOUND IN THE DM_LOCATION TABLE
Warning
2004 PACK_DM_REPLENISHMENT PERF_TRCK_GRP SHOULD NOT BE NULL IN THE STG_INVENTORY_REPLENISHMENT TABLE
Warning
Table 5-1 Reject message definitions
T
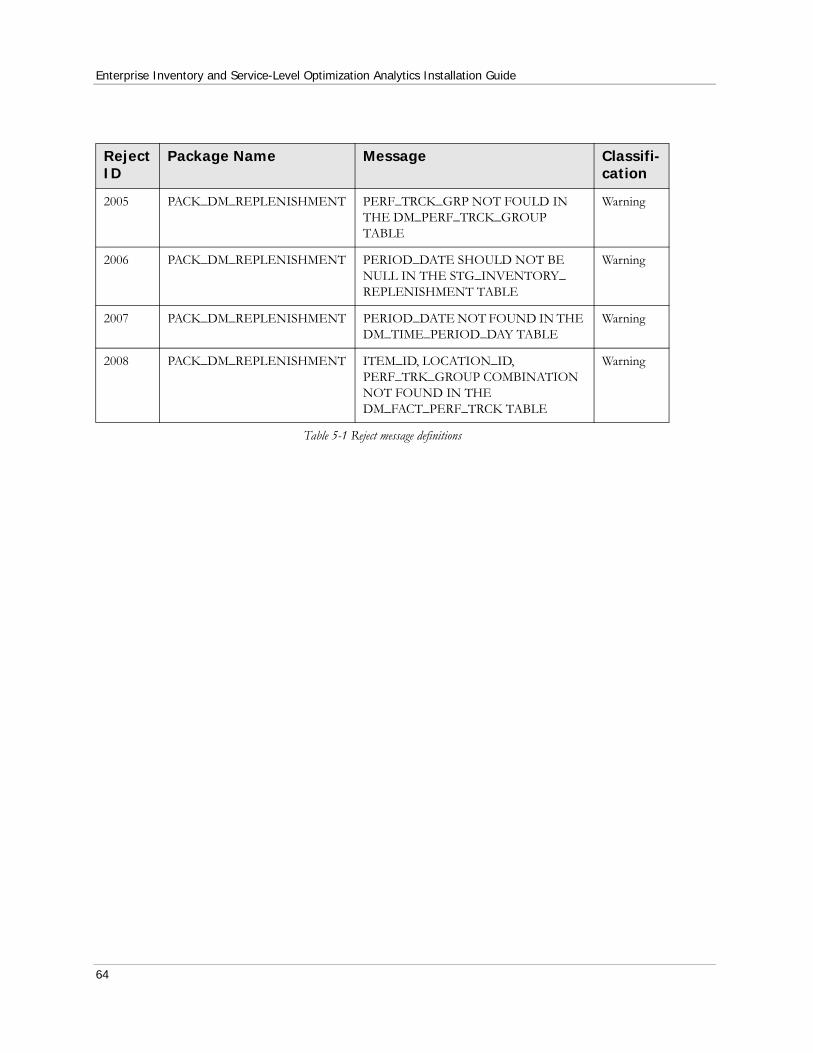
Enterprise Inventory and Service-Level Optimization Analytics Installation Guide
64
2005 PACK_DM_REPLENISHMENT PERF_TRCK_GRP NOT FOULD IN THE DM_PERF_TRCK_GROUP TABLE
Warning
2006 PACK_DM_REPLENISHMENT PERIOD_DATE SHOULD NOT BE NULL IN THE STG_INVENTORY_REPLENISHMENT TABLE
Warning
2007 PACK_DM_REPLENISHMENT PERIOD_DATE NOT FOUND IN THE DM_TIME_PERIOD_DAY TABLE
Warning
2008 PACK_DM_REPLENISHMENT ITEM_ID, LOCATION_ID, PERF_TRK_GROUP COMBINATION NOT FOUND IN THE DM_FACT_PERF_TRCK TABLE
Warning
Reject ID
Package Name Message Classifi-cation
Table 5-1 Reject message definitions