enterprise architecture for information system analysis552047/fulltext02.pdfenterprise architecture...
TRANSCRIPT
Enterprise Architecture for Information System Analysis
Modeling and assessing data accuracy, availability, performance and application usage
PER NÄRMAN
Doctoral ThesisStockholm, Sweden 2012

TRITA-EE 2012:035
ISSN 1653-5146
ISRN KTH/ICS/R--12/01--SE
Industrial Information and Control Systems
KTH, Royal Institute of Technology
Stockholm, Sweden
Submitted in partial fulfillment of the requirements for the degree of Doctor of Philosophy
© Per Närman, September 2012, Copyrighted articles are reprinted with kind permission from El-
sevier and Taylor & Francis.
Universitetsservice US AB
Abstract
Decisions concerning IT systems are often made without adequate decision-support. This has led
to unnecessary IT costs and failures to realize business benefits. The present thesis presents a
framework for analysis of four information systems properties relevant to IT decision-making.
The work is founded on enterprise architecture, a model-based IT and business management
discipline. Based on the existing ArchiMate framework, a new enterprise architecture framework
has been developed and implemented in a software tool. The framework supports modeling and
analysis of data accuracy, service performance, service availability and application usage.
To analyze data accuracy, data flows are modeled, the service availability analysis uses fault tree
analysis, the performance analysis employs queuing networks and the application usage analysis
combines the Technology Acceptance Model and Task-Technology Fit model.
The accuracy of the framework’s estimates was empirically tested. Data accuracy and service
performance were evaluated in studies at the same power utility. Service availability was tested in
multiple studies at banks and power utilities. Data was collected through interviews with system
development or maintenance staff. The application usage model was tested in the maintenance
management domain. Here, data was collected by means of a survey answered by 55 respondents
from three power utilities, one manufacturing company and one nuclear power plant.
The service availability studies provided estimates that were accurate within a few hours of
logged yearly downtime. The data accuracy estimate was correct within a percentage point when
compared to a sample of data objects. Deviations for four out of five service performance estimates
were within 15 % from measured values. The application usage analysis explained a high degree of
variation in application usage when applied to the maintenance management domain.
During the studies of data accuracy, service performance and service availability, records were
kept concerning the required modeling and analysis effort. The estimates were obtained with a total
effort of about 20 man-hours per estimate.
In summary the framework should be useful for IT decision-makers requiring fairly accurate,
but not too expensive, estimates of the four properties.
Keywords: Enterprise Architecture, Metamodeling, Decision-making, Data Accuracy, Service
Availability, Service Performance, Technology Acceptance Model, Task Technology Fit
iii

Sammanfattning
Beslut rörande IT fattas ofta med otillräckligt beslutsunderlag. Detta leder till onödigt höga IT-
kostnader och svårigheter att realisera IT-nyttor. Denna avhandling presenterar ett ramverk för ana-
lys av IT-systemegenskaper av intresse för IT-beslutsfattare.
Enterprise Architecture är en modellbaserad disciplin för IT- och verksamhetsutveckling och
utgör grunden för denna avhandling. Baserat på ramverket ArchiMate har ett nytt arkitekturramverk
utvecklats och implementerats i ett verktyg. Ramverket kan användas för att modellera och analysera
datakorrekthet, tjänstetillgänglighet, tjänsteprestanda och IT-systemanvändande.
För att utvärdera datakorrekthet modelleras dataflöden, tillgänglighetsanalysen använder sig av
felträdsanalys, prestandaanalysen baseras på köteori och systemanvändande på modellerna Techno-
logy Acceptance Model och Task-Technoloy Fit.
Tillförlitligheten i analysresultaten har testats empiriskt. Resultaten avseende datakorrekthet och
tjänsteprestanda testades i studier på samma elbolag, tjänstetillgänglighet undersöktes i flera studier
på elbolag och banker. I dessa fall samlades data in genom intervjuer med utvecklings- eller under-
hållspersonal. Systemanvändande testades inom domänen underhållsstyrning genom en enkät med
55 respondenter från tre elbolag, ett tillverkningsföretag och ett kärnkraftverk.
Uppskattningarna av tjänstetillgänglighet var korrekta sånär som ett fåtal timmars nertid på års-
basis, datakorrekthetsuppskattningen var mindre än en procent från det mätta värdet. Fyra av fem
tjänsteprestandaupps5kattningar var inom 15% från uppmätta värden. Analysen av systemanvän-
dande kunde användas för att förklara en stor del av variationen av systemanvändande i underhålls-
styrningsområdet.
I studierna avseende datakorrekthet, tjänstetillgänglighet och tjänsteprestanda undersöktes också
kostnaderna för att genomföra analyserna. Totalt krävdes det ungefär 20 timmar per uppskattning.
Sammanfattningsvis bör ramverket vara användbart för praktiker som behöver relativt korrekta,
men inte alltför dyra, uppskattningar av de fyra egenskaperna.
Nyckelord: arkitektur, metamodellerande, beslutsfattande, datakvalitet, tillgänglighet, prestanda,
systemanvändande
v

Acknowledgments
I relied quite heavily on the help and support of a number of people whose contributions deserve
acknowledgment. And since this is the Acknowledgments section, lets name them here:
Torsten Cegrell was not only kind enough to hire me, but together with Judy Westerlund has
created what I believe to be a uniquely rewarding working environment. Thank you both. Judy,
together with Annica Johanneson also proved to be particular helpful for me when I decided to stop
being a full-time employee and decided to venture out into the Real World.
Pontus Johnson and Mathias Ekstedt have both provided invaluable assistance in their role of
supervisors in which they have been teaching me the immense value of having a really, really good
metamodel.
Some of my fellow PhD students – the PERDAF posse – also put in a substantial amount of
work as paper co-authors and deserve recognition for this: Hannes Holm, Ulrik Franke, Markus
Buschle, David Höök, Moustafa Chenine, Johan König and Nicholas Honneth all contributed in
shaping this thesis to turn out as good as it eventually did. Khurram Shahzad also made significant
contributions by bringing the EAAT tool to a new level which greatly aided this work. Thank you
all, I hope you enjoyed the projects as much as I did.
My other dear co-workers – Mårten Simonsson, Magnus Gammelgård, Robert Lagerström, Jo-
han Ullberg, Teodor Sommestad, Joakim Lilliesköld, Erik Johansson, Lars Nordström, Liv Gignell,
Evelina Ericsson and everybody else at the department all deserve a big thank you for stimulating
projects, courses and coffee breaks.
A lot of kind people in Swedish organizations and companies volunteered their time to help
me collect empirical data. I owe you all a great deal and in particular I would like to thank Ulf
Larsson, Conny Peterson Edlund, Niclas Almlöv, Jalal Matini, Miguel Aguilar, Stefan Huss, Hans-
Erik Carlsson, Hans Kumlin, Mauno Kamarainen, Richard Hejdenberg, Göran Ericsson and Sven-
Olof Eriksson.
Both my bosses at Capgemini Consulting Per-Ola Niblaeus and Ulf Larsson have been very
kind and supportive about me finishing this thesis. Thank you for this, now I can focus solely on
becoming a better management consultant.
Mum, Dad, Kirsti and Donald have all helped by providing me with a lot of much-needed writing
time during the past two years. Without you, this thesis would not be finished this soon, thank you!
Finally, Pia – for all the love and patience, Wilhelm – for all the love and impatience. Thank
you!
Stockholm, September 2012
Per Närman
vii


Papers
List of included papers
Paper A: Per Närman, Hannes Holm, Pontus Johnson, Johan König, Moustafa Chenine, Mathias
Ekstedt, "Data Accuracy Assessment Using Enterprise Architecture," Enterprise Information Sys-
tems, vol. 5, issue 1, pp. 37-58, (jan) 2011, DOI:10.1080/17517575.2010.507878
Paper B: Per Närman, Ulrik Franke, Johan König, Markus Buschle, Mathias Ekstedt, "Enterprise
Architecture Availability Analysis Using Fault Trees and Stakeholder Interviews", Enterprise Infor-
mation Systems, DOI:10.1080/17517575.2011.647092
Paper C: Per Närman, Hannes Holm, Nicholas Honeth, Mathias Ekstedt, "Using Enterprise Ar-
chitecture Analysis and Interview Data to Estimate Service Response Time", accepted with minor
revisions to the special issue on Service Management & Engineering in the Journal of Strategic
Information Systems, (aug) 2012
Paper D: Per Närman, Hannes Holm, David Höök, Nicholas Honeth, Pontus Johnson, "Using
Enterprise Architecture and Technology Adoption Models to Predict Application Usage", Journal of
Systems and Software, vol. 85, issue 8, pp 1953-1967, (aug) 2012, DOI: 10.1016/j.jss.2012.02.035
Paper E: Per Närman, Markus Buschle, Mathias Ekstedt, "An Enterprise Architecture Framework
for Multi-Attribute Information Systems Analysis", accepted with minor revisions to the special
issue on Enterprise Modeling in the Journal of Software and Systems Modeling, (aug) 2012
Author contributions
In Paper A, the general research concept is due to Närman, Johnson and Holm, the metamodel is
designed by Närman, Johnson, König, the empirical data was collected by Holm and Närman, and
authoring was done by Närman, Holm, Chenine, König and Ekstedt.
In Paper B, the general research concept is due to Närman, Ekstedt, and Franke, the metamodel
was constructed by Närman, Franke, Ekstedt, König, and Buschle, the empirical data collection was
done by Närman and Franke, and the authoring by Närman, Franke, König, and Buschle.
In Paper C, the general research concept is due to Närman, Holm and Ekstedt the metamodel
was designed by Närman, Holm and Ekstedt, empirical data was collected by Holm and Närman,
and authoring was done by Närman, Holm, Ekstedt and Honeth.
In Paper D, the general research concept is due to Närman, Holm and Johnson, the metamodel
is designed by Närman, Holm and Johnson, empirical data was collected by Närman, Höök, Holm
and Honeth, analysis was performed by Holm and Närman, and authoring was done by Närman,
Holm and Honeth.
In Paper E, the general research concept is due to Närman and Ekstedt, the metamodel was
designed by Närman, Buschle and Ekstedt and implemented in the tool by Närman and Buschle,
and authoring was done by Närman.
ix
x
Publications not included in the thesis
Publication I: Johan König, Per Närman, Ulrik Franke, Lars Nordström, "An Extended Framework
for Reliability Analysis of ICT for Power Systems," Proceedings of IEEE Power Tech 2011, 2011
Publication II: Per Närman Markus Buschle Johan König Pontus Johnson, "Hybrid Probabilistic
Relational Models for System Quality Analysis," 14th Enterprise Distributed Object Computing
Conference (EDOC), Germany, 2010
Publication III: Oliver Holschke, Per Närman, Waldo Rocha Flores, Evelina Eriksson, Marten
Schönherr, "Using Enterprise Architecture Models and Bayesian Belief Networks for Failure Impact
Analysis," Journal of enterprise architecture, vol. 3, (no. 2,), (May) 2010
Publication IV: Ulrik Franke, Oliver Holschke, Markus Buschle, Per Närman, Jannis Rake-Revelant,
"IT consolidation - an optimization approach," Enterprise Distributed Object Computing Confer-
ence Workshops, EDOCW, 2010
Publication V: Magnus Gammelgård, Mathias Ekstedt, Per Närman, "A method for assessing the
business value of information system scenarios with an estimated credibility of the result," Inter-
national Journal of Services Technology and Management, vol. 13, (no. 1,) pp. 105-133, (apr)
2010
Publication VI: Stephan Aier, Sabine Buckl, Ulrik Franke, Bettina Gleichauf, Pontus Johnson,
Per Närman, Christian M. Schweda, Johan Ullberg, "A Survival Analysis of Application Life
Spans based on Enterprise Architecture Models," Lecture Notes in Informatics, pp. 141-154, 2009,
Proc. 3rd International Workshop on Enterprise Modelling and Information Systems Architectures
(EMISA 2009)
Publication VII: Per Närman, Pontus Johnson, Mathias Ekstedt, Moustafa Chenine, Johan König,
"Enterprise Architecture Analysis for Data Accuracy Assessments," In Proceedings of the Thir-
teenth IEEE International EDOC Conference, 2009
Publication VIII: Per Närman, Teodor Sommestad, Sofia Sandgren, Mathias Ekstedt, "A frame-
work for assessing the cost of IT investments," Portland International Conference on Management
of Engineering and Technology(PICMET), 2009
Publication IX: Ulrik Franke, David Höök, Johan König, Robert Lagerström, Per Närman, Jo-
han Ullberg, Pia Gustafsson, Mathias Ekstedt, "EAF2 - A Framework for Categorizing Enterprise
Architecture Frameworks," Proc. 10th ACIS International Conference on Software Engineering,
Artificial Intelligence, Networking and Parallel/Distributed Computing, pp. 327-332, 2009
Publication X: Oliver Holscke, Per Närman, Waldo Rocha Flores, Evelina Eriksson, Marten Schön-
herr, "Using Enterprise Architecture Models and Bayesian Belief Networks for Failure Impact Anal-
ysis," Lecture Notes in Computer Science: Service-Oriented Computing, ICSOC 2008 Workshops,
pp. 339-350, 2009
Publication XI:] Jakob Raderius, Per Närman, Mathias Ekstedt, "Assessing System Availability
Using an Enterprise Architecture Analysis Approach," Service-Oriented Computing — ICSOC
2008 Workshops: ICSOC 2008 International Workshops, Third Workshop on Trends in Enterprise
Architecture Research (TEAR 2008), 2009
Publication XII: Per Närman, Ulrik Franke, Lars Nordström, "Assessing the Quality of Service of
Powel’s Netbas at A Nordic Utility" Proc. 20th International Conference on Electricity Distribution,
2009

xi
Publication XIII: Per Närman, Pontus Johnson, Robert Lagerström, Ulrik Franke, Mathias Ekst-
edt, "Data Collection Prioritization for System Quality Analysis," Electronic Notes in Theoretical
Computer Science, pp. 29-42, 2009
Publication XIV: Dinusha Gunaratne, Moustafa Chenine, Mathias Ekstedt, Per Närman, "A Frame-
work to Evaluate a Functional Reference Model at a Nordic Distribution Utility," Nordic Distribu-
tion and Asset Management Conference (NORDAC 2008), 2008
Publication XV: Per Närman, Ulrik Franke, Lars Nordström, "Assessing the Quality of Service
of Powel’s Netbas at a Nordic Utility," Nordic Distribution and Asset Management Conference
(NORDAC 2008), 2008
Publication XVI: Per Närman, Marten Schönherr, Pontus Johnson, Mathias Ekstedt, Moustafa
Chenine, "Using Enterprise Architecture Models for System Quality Analysis," Proceedings of the
12th IEEE International EDOC Conference (EDOC 2008), 2008
Publication XVII: Per Närman, Pontus Johnson, Lars Nordström, "Enterprise Architecture: A
Framework Supporting System Quality Analysis," Proceedings of the IEEE International Annual
Enterprise Distributed Object Computing Conference (EDOC), 2007
Publication XVIII: Pontus Johnson, Robert Lagerström, Per Närman, Mårten Simonsson, "Ex-
tended Influence Diagrams for System Quality Analysis," Journal of Software, (sep) 2007
Publication XIX: Magnus Gammelgård Mathias Ekstedt Per Närman, "Evaluation of business
value of IT-system scenarios - a case study at a large north European power company," Portland
International Conference on Management of Engineering and Technology - PICMET 2007, 2007
Publication XX: Magnus Gammelgård Mathias Ekstedt Per Närman, Architecture Scenario Anal-
ysis - Estimating the Credibility of the Results, Seventeenth International Symposium of The Inter-
national Council on Systems Engineering, 2007
Publication XXI: Per Närman Elin Hammar Pontus Karlsson, "Standard-Based Outage Manage-
ment Process Modelling," CIRED 2007 International Conference on Electricity Distribution, pp. 4,
2007
Publication XXII: Robert Lagerström, Pontus Johnson, Per Närman, "Extended Influence Diagram
Generation," Interoperability for Enterprise Software and Applications Conference, 2007
Publication XXIII: Pontus Johnson, Robert Lagerström, Per Närman, Mårten Simonsson, "System
Quality Analysis with Extended Influence Diagrams," IEEE 11th European Conference on Software
Maintenance and Reengineering, 2007
Publication XXIV: Pontus Johnson, Robert Lagerström, Per Närman, Mårten Simonsson, "Enter-
prise Architecture Analysis with Extended Influence Diagrams," Information Systems Frontiers,
vol. 9, (no. 2,), (may) 2007
Publication XXV: Mathias Ekstedt, Pontus Johnson, Per Närman, Robert Lagerström, Pia Gustafs-
son, Selecting Enterprise Architecture Models, "Selecting Enterprise Architecture Models," En-
teprise Architecture, Studentlitteratur, 2007
Publication XXVI: Mathias Ekstedt, Pontus Johnson, Per Närman, Robert Lagerström, Moustafa
Chenine, Setting the Information Systems Goals, "Setting the Information Systems Goals," Enter-
prise Architecture, Studentlitteratur, 2007
xii
Publication XXVII: Magnus Gammelgård Per Närman Mathias Ekstedt Lars Nordström, "Busi-
ness Value Evaluation of IT Systems: Developing a Functional Reference Model," Proceedings of
the Conference on Systems Engineering Research, 2006
Publication XXVIII: Per Närman Lars Nordström Magnus Gammelgård Mathias Ekstedt, "Val-
idation and Refinement of an Asset Management Subset of the IEC 61968-1 Interface Reference
Model," Proceedings IEEE Power Systems Conference and Exposition, 2006
Publication XXIX: Per Närman Magnus Gammelgård Lars Nordström, "A Functional Reference
Model For Asset Management Applications Based on IEC 61968-1," Nordic Distribution and Asset
Management Conference, pp. 12, 2006
Publication XXX: Pontus Johnson, Robert Lagerström, Per Närman, Mårten Simonsson, "Ex-
tended Influence Diagrams for Enterprise Architectural Analysis," Proceedings of the 10th IEEE
International Annual Enterprise Distributed Object Computing Conference, pp. 10, 2006
Table of Contents
I Introduction 1
1 Introduction 31.1 Outline of Thesis . . . . . . . . . . . . . . . . . . . . . . . . . . . . . . . . . . . 3
1.2 Background . . . . . . . . . . . . . . . . . . . . . . . . . . . . . . . . . . . . . . 3
1.3 Research Goal . . . . . . . . . . . . . . . . . . . . . . . . . . . . . . . . . . . . . 5
2 Research Design 72.1 Purpose and scope . . . . . . . . . . . . . . . . . . . . . . . . . . . . . . . . . . . 7
2.2 Constructs . . . . . . . . . . . . . . . . . . . . . . . . . . . . . . . . . . . . . . . 9
2.3 Justificatory knowledge – kernel theories . . . . . . . . . . . . . . . . . . . . . . . 12
2.4 Principles of form and function . . . . . . . . . . . . . . . . . . . . . . . . . . . . 13
2.5 Artifact mutability . . . . . . . . . . . . . . . . . . . . . . . . . . . . . . . . . . 13
2.6 Testable propositions . . . . . . . . . . . . . . . . . . . . . . . . . . . . . . . . . 13
2.7 Principles of implementation . . . . . . . . . . . . . . . . . . . . . . . . . . . . . 15
2.8 Expository instantiation . . . . . . . . . . . . . . . . . . . . . . . . . . . . . . . . 15
2.9 Work Progress . . . . . . . . . . . . . . . . . . . . . . . . . . . . . . . . . . . . . 15
3 Results 173.1 The framework . . . . . . . . . . . . . . . . . . . . . . . . . . . . . . . . . . . . 17
3.2 The Data Accuracy Viewpoint . . . . . . . . . . . . . . . . . . . . . . . . . . . . 18
3.3 The Service Availability Viewpoint . . . . . . . . . . . . . . . . . . . . . . . . . . 19
3.4 The Service Response Time Viewpoint . . . . . . . . . . . . . . . . . . . . . . . . 20
3.5 The Application Usage Viewpoint . . . . . . . . . . . . . . . . . . . . . . . . . . 21
4 Related Works 23
5 Discussion and conclusion 255.1 Contributions . . . . . . . . . . . . . . . . . . . . . . . . . . . . . . . . . . . . . 25
5.2 Limitations and future works . . . . . . . . . . . . . . . . . . . . . . . . . . . . . 26
5.3 Conclusion . . . . . . . . . . . . . . . . . . . . . . . . . . . . . . . . . . . . . . 26
Bibliography 27
II Papers A to E 41
6 Paper A: Data Accuracy Assessment Using Enterprise Architecture 43
xiii

xiv TABLE OF CONTENTS
7 Paper B: Enterprise Architecture Availability Analysis Using Fault Trees and Stake-holder Interviews 67
8 Paper C: Using Enterprise Architecture Analysis and Interview Data to EstimateService Response Time 95
9 Paper D: Using Enterprise Architecture and Technology Adoption Models to PredictApplication Usage 127
10 Paper E: An Enterprise Architecture Framework for Multi-Attribute InformationSystems Analysis 145

Part I
Introduction
1

Chapter 1
Introduction
1.1 Outline of Thesis
This is a cumulative thesis comprising two parts. The first part contains this introduction describing
and summarizing the second part which contains the research articles that constitute the core of
the thesis. The introduction includes the background of the presented work, the research purpose
addressed in this thesis, an account of the research design, a summary of the main results, related
works and finally discussion and conclusion. The five papers (Paper A to Paper E) in part two in
this thesis describe the details of the research and results. The papers have either been published in
(A,D), accepted by (B) or accepted with minor revisions by (C,E) academic journals.
1.2 Background
Several studies have shown that the use of Information Technology (IT) is pervasive in today’s
business and significantly impacts business operations. For instance, Brynolfsson and Hitt [1] found
that capital IT expenditure made a substantial contribution to firm output. Melville et al. conducted a
major literature review and concluded that there was evidence of IT having a considerable business
impact [2]. Looking at a specific business domain of some relevance to this thesis, Pintelon et
al. [3] found that effective IT usage is a pre-requisite to implement and maintain an effective plant
maintenance strategy.
Meanwhile, many observations suggest that IT-investments often fail to generate improvements
in business productivity and performance [4]. Furthermore, there is a wealth of reports of major IT
project failures [5] and many accounts of IT projects delivered late or over budget [6].
Delone and McLean’s model for information system success posits that the higher the system
quality, service quality and information quality, the more users will be satisfied, use the systems and
achieve greater net benefits [7]. That IT system qualities has an impact on organizational perfor-
mance was also noted in the study by Gorla et al. [8]. Thus, measuring and assessing system quality
before embarking on major changes in the IT landscape can be a way of ensuring that business
benefits are realized and that IT-spending is targeted towards successful projects [9].
System or software quality can be defined in many ways. The ISO 9126-1 standard [10], now
superseded by the ISO 25010 [11], defines a software quality model consisting of the attributes
functionality, reliability, usability, efficiency, maintainability and portability. These attributes com-
prise sub-attributes, for instance functionality is made up of suitability, accuracy, interoperability,
security and functional compliance. This thesis focuses on a subset of these attributes: service
availability, service performance (here interpreted as service response time), data accuracy and ap-
plication usage.
3
4 CHAPTER 1. INTRODUCTION
IT service availability is crucial to ensure continuous business operations [12] and as such rated
very highly by IT system executives [13]. Not only are the direct costs of unavailable IT systems
high [14], but IT incidents disrupting business operations also have an adverse impact on the market
value of publicly traded companies [15]. Service response time is one important system attribute
which, when degraded, impairs user experience [16] implying the need for good service response
time management [17, 18]. Information quality has a substantial effect on organizational perfor-
mance [7,19]. Data accuracy is one important dimension of information and data quality; poor data
accuracy impairs organizational decision-making, drives cost of operations and reduces customer
satisfaction [20]. Application usage is a key concern in evaluating application portfolios, low ap-
plication usage is often associated with poor user and organization performance [7, 21, 22] and can
often be traced to poor usability of the applications [23].
The practice of assessing and monitoring these and other quality attributes has traditionally
been quite immature [24]. Companies that have undertaken the effort often relied on custom-made
questionnaires, monitoring equipment or other tools. In software engineering, there are methods
available to analyze quality attributes in the design phase using software architecture analysis [25–
27]. Software architecture often determines the quality attributes of the software and architectureanalysis thus provides interesting insight into how the software will behave once in operation.
Software architecture analysis is, however, mostly limited to depicting single applications or
components within single applications, making it an ill-suited tool for organizations with an appli-
cation and technology landscape spanning hundreds if not thousands of applications and technology
components.
Furthermore, to prevent IT system quality management from becoming fragmented and reliant
on multiple stovepipe solutions, it would be beneficial to integrate system quality management
into existing management practices which span cross-functional boundaries as suggested in Total
Quality Management literature [28].
One management discipline that has received a great deal of attention lately is Enterprise Archi-
tecture (EA), which is a holistic IT and business management approach. EA relies on the use of ar-
chitectural models depicting both business, IT applications, IT infrastructure and their interrelations
in an integrated model [29]. Many consider John Zachman’s article A Framework for Information
Systems Architecture [30] to be the starting point of EA. Since then, many authors have contributed
to the field, for instance in EA books such as [31–44], in doctoral theses such as [45–53], in arti-
cles such as [29, 54–89], with frameworks such as DoDAF [90], EAF2 [91], E2AF [92], FEA [93],
GERAM [94], IAF [95], MoDAF [96], NAF [97], TOGAF [98], ArchiMate [99] and with tools such
as Adaptive Enterprise Architecture Manager [100], ADOit [101], ARIS [102,103], EAT [104,105],
EA/Studio [106], planningIT [107], System Architect [108], Troux [109] or ABACUS [110]. The
adoption of these tools and frameworks have been beneficial in achieving more business-IT align-
ment, higher operational efficiencies and lower IT costs [31, 111–114].
There are many uses of EA models, they could be used for (i) documentation, (ii) design and
(iii) analysis [54]. EA documentation and analysis possess no intrinsic value in themselves, but can
be instrumental in providing good decision-support to decision makers in IT related domains [32].
However, very few of these frameworks offer support for EA analysis [115]. This thesis presents an
EA framework designed to make integrated EA analysis of several system properties possible.
A complicating factor in providing decision support is that decisions rarely are made under
conditions of absolute certainty. Uncertainty is caused partly by ignorance concerning the laws that
govern the particular domain of interest, for instance how the use of intrusion detection software
will impact the confidentiality of a data asset. Uncertainty may also be the result of not having all
facts available, for instance not knowing whether there is in fact any intrusion detection software
installed. Thus, in order for EA analysis to be useful in the sense aiding decision-making, there is a
need to cope with uncertainties [32, 115].
1.3. RESEARCH GOAL 5
Another chief concern with regard to the practical applicability of EA analysis is that practition-
ers are not willing to spend too many resources doing EA modeling and analysis [116, 117]. Thus,
an EA analysis method must be resource-efficient to be considered a viable option for practitioners.
1.3 Research Goal
The purpose of this thesis is to develop an EA modeling and analysis framework. The framework
method should support modeling and quantitative analysis of the properties service availability,
service response time, data accuracy and application usage. In addition to the modeling and analysis,
the thesis will also outline a method for how to collect the data needed for the analysis. Three
important constraints on the method and the framework are that it needs to be able to accommodate
uncertain input data, it should not be prohibitively expensive to use and it should be integrated in
the sense that the modeling language constructs should be possible to re-use for analysis of all four
properties.
In order to accomplish this and to make sure that the overall EA framework is sound, a number
of actions had to be taken. Firstly, individual analysis frameworks were created for the four re-
spective properties, secondly these frameworks were tested empirically to investigate whether they
were practically applicable and accurate, thirdly these metamodels were integrated into one single
metamodel which, fourthly, was implemented in a software tool.

Chapter 2
Research Design
This section will discuss the overall research design of the work presented in papers A-E using a
design science perspective.
Design science originated with Simon’s “Sciences of the Artificial” [118] and concerns the sys-
tematic and formalized creation of design artifacts to fulfill certain goals [119,120]. By concerning
itself with the construction of artifacts, design science differs from the more traditional sciences
which deal with theories of how and why things are [119, 120, 120–123]. Since this thesis’ main
contribution is a framework for modeling and analyzing system properties implemented in a soft-
ware tool, it can be considered an IT artifact [121]. IT artifacts are, in Gregor’s terminology [119],
theories for “design and action”. The remainder of this section will elaborate on the research design
of this thesis through the lens of eight criteria [119] concerning what constitutes such a theory:
1. Purpose and scope - what purpose(s) does the theory fill and what are the limit(s) to its use?
2. Constructs - which are the basic constructs involved in employing the theory?
3. Justificatory knowledge - How do you justify stating that the theory works?
4. Principles of form and function - How does the artifact behave?
5. Artifact mutability - how does the artifact vary with its environment?
6. Testable propositions - which are the theory’s testable propositions?
7. Principles of implementation - Which are the principles of implementations for practitioners?
8. Expository instantiation - Is there an instantiation to further understanding of the artifact?
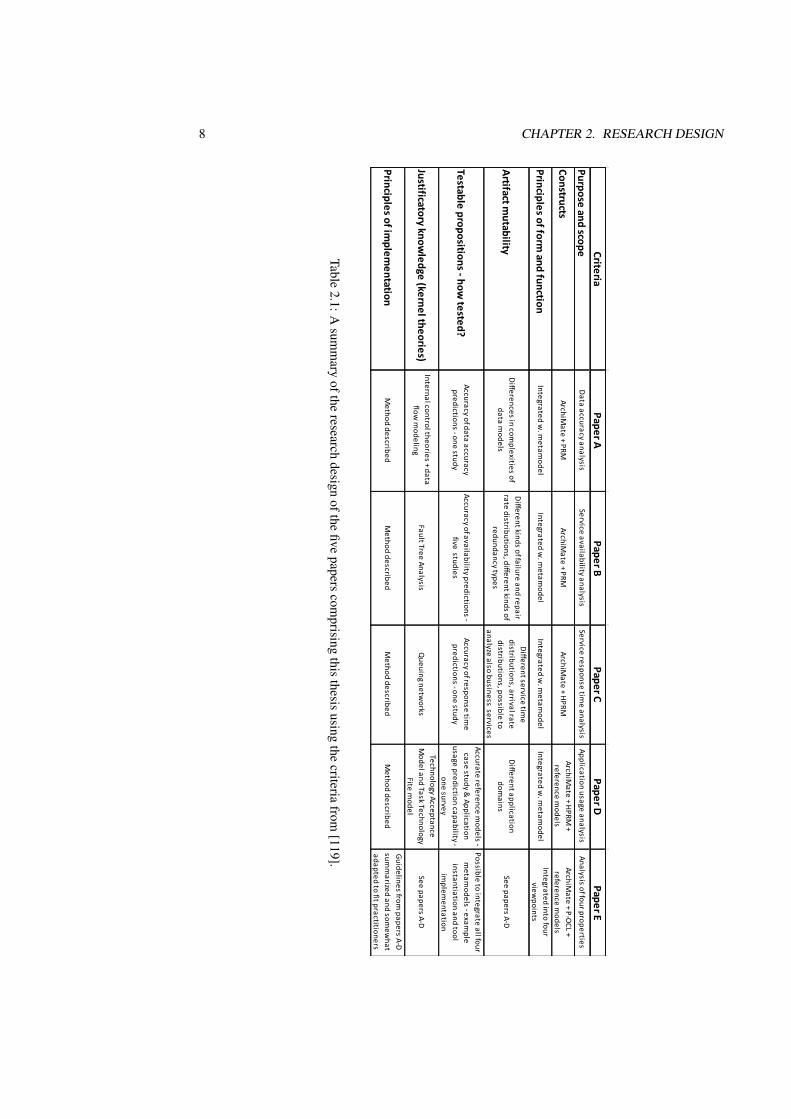
In Tab. 2.1 the content of papers A-E have been described using the eight criteria.
2.1 Purpose and scope
The purpose of the EA framework presented here can be summarized in a number of ‘meta re-
quirements’ as Walls et al. [123] phrases it. The artifact aids modeling of enterprise architectures
comprising both information systems as well as parts of the business environment so as to make
the models amenable to analysis. The purpose of this is to be able to use EA analysis to provide
decision-makers with high quality decision support. Papers A through D are concerned with de-
veloping and testing a modeling frameworks and methods for analysis of data accuracy (paper A),
service availability (paper B), service response time (paper C) and application usage (paper D).
7
8 CHAPTER 2. RESEARCH DESIGN
CriteriaPaper A
Paper BPaper C
Paper DPaper E
Purpose and scopeD
ata accuracy analysisService availability analysis
Service response time analysis
Application usage analysisAnalysis of four properties
ConstructsArchiM
ate + PRMArchiM
ate + PRMArchiM
ate + HPRM
ArchiMate + H
PRM +
reference models
ArchiMate + P-O
CL + reference m
odels
Principles of form and function
Integrated w. m
etamodel
Integrated w. m
etamodel
Integrated w. m
etamodel
Integrated w. m
etamodel
Integrated into four view
points
Artifact mutability
Differences in com
plexities of data m
odels
Different kinds of failure and repair
rate distributions, different kinds of redundancy types
Different service tim
e distributions, arrival rate distributions, possible to
analyze also business services
Different application
domains
See papers A-D
Testable propositions - how tested?
Accuracy of data accuracy predictions - one study
Accuracy of availability predictions - five studies
Accuracy of response time
predictions - one study
Accurate reference models -
case study & Application
usage prediction capability - one survey
Possible to integrate all four m
etamodels - exam
ple instantiation and tool
implem
entation
Justificatory knowledge (kernel theories)
Internal control theories + data flow
modeling
Fault Tree AnalysisQ
ueuing networks
Technology Acceptance M
odel and Task Technology Fite m
odelSee papers A-D
Principles of implem
entationM
ethod describedM
ethod describedM
ethod describedM
ethod describedG
uidelines from papers A-D
sum
marized and som
ewhat
adapted to fit practitioners
Tab
le2
.1:
Asu
mm
aryo
fth
eresearch
desig
no
fth
efi
ve
pap
ersco
mp
rising
this
thesis
usin
gth
ecriteria
from
[11
9].
2.2. CONSTRUCTS 9
An important requirement on the framework was that it should be integrated, and the purpose of
paper E was thus to integrate the four previous metamodels into one.
Another meta-requirement is that the modeling and analysis framework should be resource-
efficient to use also for organizations lacking automated software solutions for e.g. availability
monitoring. This has led to the use of data collection methods based on surveys and interviews, and
in particular in papers A-C it has been demonstrated that the modeling and analysis can be done
in a resource-efficient manner. Finally, the analysis engine should be able to take various kinds of
uncertainty into account.
2.2 Constructs
This section will elaborate on the modeling and analysis constructs employed in the thesis, starting
with ArchiMate, a number of formalisms and finally some reference models employed for domain-
specific modeling.
ArchiMate
All papers partially use constructs from the EA language ArchiMate [99]. ArchiMate is a mature,
open and general-purpose EA framework the use of which is increasing. The original version of
ArchiMate did not suffice to support the modeling required for the analysis and a number of classes
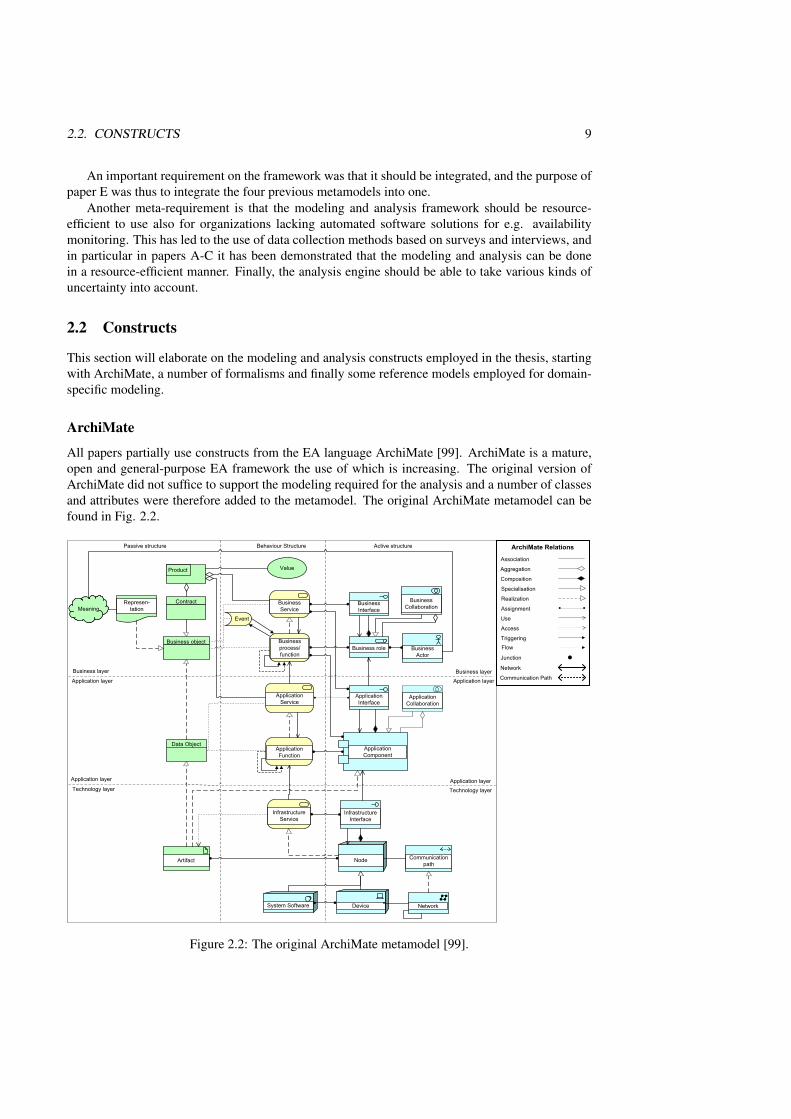
and attributes were therefore added to the metamodel. The original ArchiMate metamodel can be
found in Fig. 2.2.
ApplicationService
InfrastructureService
BusinessService
BusinessInterface
ApplicationInterface
InfrastructureInterface
ApplicationFunction
Data Object
Business object Businessprocess/function
Communicationpath
Network
Node
DeviceSystem Software
Artifact
Business role BusinessActor
BusinessCollaboration
Product
Represen-tation
Contract
Event
Value
ApplicationComponent
Business layerApplication layer
Application layerTechnology layer
Meaning
ApplicationCollaboration
Association
Aggregation
Composition
Specialisation
Realization
Assignment
Use
Access
TriggeringFlow
Junction
Network
Communication Path
ArchiMate Relations
Application layer
Business layer
Application layer
Technology layer
Active structureBehaviour StructurePassive structure
Figure 2.2: The original ArchiMate metamodel [99].
10 CHAPTER 2. RESEARCH DESIGN
The original ArchiMate metamodel contains active structure elements, passive structure ele-
ments and behavioral structure elements. Behavioral elements describe dynamic behavior. This
behavior isperformed by either IT systems or human beings and these are modeled as active struc-
ture elements. The passive structure describes the results of the behavior by modeling for instance
data objects or documents. ArchiMate differentiates between internal behavior elements, which
are directly linked to active structure elements, and external behavior elements i.e. different kinds
of sevices, which represent the behavior as seen by the users. The passive structure elements de-
scribe what is accomplished as a consequence of the behaviour. Examples of behaviour concepts
are BusinessProcesses or ApplicationServices, active structure components can be App-licationComponent or Roles and examples of passive structure elements are DataObjects.
Formalisms
ArchiMate does not contain any mechanisms for analysis, therefore its constructs were formalized
so as to integrate the architecture analysis with the modeling. In order to reason about uncertain-
ties, the formalisms were probabilistic. In papers A and B the Probabilistic Relational Modeling
(PRM) [124] formalism was employed and papers C and D used the Hybrid Probabilistic Relational
Modeling (HPRM) formalism [125]. The differences between these formalisms lie in the ability
to use continuous variables. Regular PRMs perform the analysis using discrete variables; each
attribute in the diagrams is a node in a regular Bayesian network [126] whereas HPRMs employ
hybrid Bayesian networks [127] which can use both continuous and discrete nodes in the networks.
Hybrid probabilistic Relational Models
The Hybrid Probabilistic Relational Model (HPRM) formalism allows integrated and modeling and
probabilistic analysis of complex phenomena through the merger of entity relation models with
Hybrid Bayesian networks [125]. The HPRM formalism is an extension of the Probabilistic Rela-
tional Model (PRM) formalism [124], which has been employed for enterprise architecture analysis
previously [45, 128].
An architecture metamodel M describes a set of classes, X = X1, . . . ,Xn. Each class is associ-
ated with a set of descriptive attributes A (X). Attribute A of class X is denoted X .A and its domain
of values is denoted V (X .A). Each class also has a set of reference slots (relationships). The set of
reference slots of a class X is denoted R(X). X .ρ is used to denote the reference slot ρ of class X .
For example, the class Car may have the attribute Car.Price and a reference slot Car.IsPoweredwhich range is the class Motor and domain is the class Car. Each reference slot ρ is typed with the
domain type Dom[ρ] = Xi and the range type Range[ρ] = Xj, where Xi;Xj ∈ X . A slot ρ denotes a
function from Xi to Xj, and its inverse ρ−1 denotes a function from Xj to Xi.
A probabilistic relational model Π specifies a probability distribution over all instantiations Iof the metamodel M . This probability distribution is specified in terms of a Hybrid Bayesian
network [127] which are formed by a qualitative dependency structure and associated quantitative
parameters.
The qualitative dependency structure is defined by associating with each attribute X .A a set
of parents Pa(X .A) through so called attribute relations. Each parent of X .A is defined as X .τ.Bwhere B ∈ A (X .τ) and τ is either empty, a single reference slot ρ or a sequence of reference
slots ρ1, . . . ,ρk (called a slot chain) such that for all i, Range[ρi] = Dom[ρi+1]. For instance, the
attribute Car.Price could be affected by the attribute Motor.Size through the attribute relation
IsPowered.Motor. Considering the quantitative dependency, each attribute of the HPRM is seen
as a node in a Hybrid Bayesian Network and thus has a probability distribution which is conditioned
on that of its parents. This is expressed in Hybrid Conditional Probability Tables (HCPT) defined
as follows [129]
2.2. CONSTRUCTS 11
Definition 1. For every attribute A(X), its parents Pa(X) are divided into two disjoint sets: dis-
crete parents DPa(A(X)) and continuous parents CPa(A(X)). Then, its HCPT P(A(X) j|Pa(A(X)))is a table indexed by its discrete parents DPa(A(X)) and with each entry representing one of the
following conditional relations:
1. If A(X) is a discrete variable with only discrete parents, a discrete probability distribution;
2. If A(X) is a discrete variable with continuous parents, a discrete probability distribution de-
pendent on CPa(A(X));
3. If A(X) is a continuous and deterministic variable, a deterministic equation dependent on
CPa(A(X)).
4. If A(X) is a continuous and stochastic variable, a deterministic equation dependent on CPa(A(X))plus a noise term having an arbitrary continuous probability distribution with parameters de-
pendent on CPa(A(X)) as well.
PRMs are a subset of HPRMs in the sense that they are confined to case 1 above.
Although the HPRMs overcome the limitations of PRMs, they come with a number of draw-
backs (i) intractability of inferrence – when dealing with hybrid Bayesian networks equations the
modeller may encounter difficulties in performing accurate inferrence [130] which almost always
necessitates approximate reasoning, and (ii) no way of querying models for structural information –
the PRMs are strictly limited to reasoning about object attributes. To overcome these drawbacks, the
framework has been re-implemented in the more expressive formalism known as the p-OCL, short
for probabilistic Object Constraint Language [131], which extends OCL [132] with probabilistic
reasoning. p-OCL was employed in paper E.
p-OCL
The Object Constraint Language (OCL) is a formal language typically used to describe constraints
on UML models [132]. These expressions typically specify invariant conditions that must hold for
the system being modeled, pre- and post conditions on operations and methods, or queries over
objects described in a model.
The probabilistic Object Constraint Language is an extension of OCL for probabilistic assess-
ment and prediction of system qualities, first introduced in [131]. The main feature of p-OCL is its
ability to express uncertainties of objects, relations and attributes in the UML-models and perform
probabilistic assessments incorporating these uncertainties [131].
A typical usage of p-OCL would thus be to create a model for predicting, e.g., the availability
of a certain type of application. Assume the simple case where the availability of the application
is solely dependent on the availability of the redundant servers executing the application; a p-OCL
expression might look like this,
c o n t e x t A p p l i c a t i o n :a t t r i b u t e a v a i l a b l e : Boolean =s e l f . s e r v e r −> e x i s t s ( s : S e r v e r | s . a v a i l a b l e )
The expression is not only a valid p-OCL expression, but also a valid OCL expression. The first
line defines the context of the expression, namely the application. In the second line, the attribute
available is defined as a function of the availability of the servers that execute it. In the example,
it is sufficient that there exists one available server for the application to be available.
Unlike regular OCL, p-OCL introduces two kinds of uncertainty. Firstly, attributes may be
stochastic. When attributes are instantiated, their values are thus expressed as probability distribu-
tions. For instance, the probability distribution of the instance myServer.available might be
P ( myServer . a v a i l a b l e ) =0 .99
12 CHAPTER 2. RESEARCH DESIGN
The probability that a myServer instance is available is thus 99%. For a normally distributed
attribute operatingCost of the type Real with a mean value of $ 3 500 and a standard deviation of
$ 200, the declaration would look like this,
P ( myServer . o p e r a t i n g C o s t ) =Normal ( 3 5 0 0 , 2 0 0 )
Secondly, the existence of objects and relationships may be uncertain. It may, for instance, be
the case that we no longer know whether a specific server is still in service or whether it has been
retired. This is a case of object existence uncertainty.
Such uncertainty is specified using an existence attribute E that is mandatory for all classes,
where the probability distribution of the instance myServer.E might be
P ( myServer . E ) =0 .8
We may also be uncertain of whether myServer is still in the cluster servicing a specific ap-
plication, i.e. whether there is a connection between the server and the application. Similarly, this
relationship uncertainty is specified with an existence attribute E on the relationships.
The EAAT tool described in [133] implements PRMs, HPRMs and p-OCL and was conse-
quently for modeling and analysis as described in papers B, C and E of this paper.
Reference models
In paper D a third kind of construct was used: reference models for task and functionality descrip-
tions within the maintenance management domain. Reference models are general and re-usable
models for a certain domain, for instance describing process workflows for certain industries, such
as the SAP business map for the media industry [134] or the ARTS data models for the retail indus-
try [135]. The reference models in this particular case are based on the IEC 61968-1 standard [136]
which includes a functional model for distribution management companies, including functional
descriptions of the domain of maintenance management. Using the so called Enterprise Contin-
uum from the framework TOGAF [137], one could characterize the reference models of this thesis
as a kind of "common-systems architectures" in the sense describing architecture common for all
applications in the domain of maintenance management.
2.3 Justificatory knowledge – kernel theories
The metamodels are all based on sound and previously published ‘kernel theories’ [123].
Data Accuracy
The metamodel in paper A depicting data accuracy takes its starting point a mixture of theories
about internal control [138] and data flow modeling [139]. Ballou [139] modeled data flow and
showed how data accuracy deteriorated due to various manipulations and Cushing [138] introduced
the notion of improvements as well as deteriorations of data accuracy.
Service Availability
The metamodel for service availability analysis in paper B uses Fault Tree Analysis as its kernel
theory [140]. Fault trees are built by modeling system components relations to a top event through
various combinations of components and logical gates, typically AND, OR and k− out − o f − n.
This provides the modeler with an estimate of likely system availability or reliability.
2.4. PRINCIPLES OF FORM AND FUNCTION 13
Service Response Time
The metamodel for service response time analysis in paper C uses queueing networks as its kernel
theory [141]. The work by [142–145] showed one way of introducing queueing models in an inte-
grated architecture modeling context spanning the business, application and infrastructure domain.
This approach constitutes the kernel theory for the response time viewpoint.
Application usage
The metamodel for service application usage analysis in paper D employs the Technology Accep-
tance Model (TAM) [146] and task-technology fit model [147] in combination in a manner similar
to Dishaw and Strong [148].
The TAM model posits that the usage of information systems can be explained by two variables;
the Perceived Usefulness (PU) and the Perceived Ease of Use (PEoU) of the information system
[146]. TTF is built on the idea that if the users perceive a information systems to have characteristics
(functionality) that fit their work tasks, they are more likely to use the technology and perform their
work tasks better. Dishaw and Strong [147] defined task-technology fit as ”the matching of thefunctional capability of available software with the activity demands of the task”,
The three first kernel theories are design science artifacts in themselves and as such employed
by practitioners in various engineering domains. The TAM and TTF models on the other hand are
products from the behavioral science branch of information systems research. All of these kernel
theories have been employed extensively previously and thus provide secure theoretical underpin-
nings for their respective metamodel.
2.4 Principles of form and function
The principles of form and function of the metamodels have been described in the form of PRMs
and HPRMs in papers A-D, and as p-OCL statements in paper E.
2.5 Artifact mutability
The EA framework needs to be adapted to fit its environment. This is particularly so for the ap-
plication usage metamodel (paper E) which requires functional and process descriptions to fit the
application domain. For service response time (paper C) it is possible to expand the viewpoint to
also encompass business services. The response time calculations are contingent upon assumptions
made about arrival rate and service time distributions (Poisson and exponential respectively); under
other assumptions other queuing models would apply. The availability equations (paper B) hold
under the assumptions of exponential failure rates and it is conceivable that other distributions, for
instance the log normal, should be used in some situations. The data modeling in paper A should be
able to accommodate more or less complex data models.
2.6 Testable propositions
The testable propositions associated with the present artifact are heuristic in Gregor’s terminology,
i.e. on the form "If you want to achieve Y in situation Z, then something like action X will help"
[119]. Papers A to D contain testable propositions of the form, "is it possible to yield accurate
acccuracy/availability/response time/application usage predictions using viewpoint X and input data
collection method Y", where X is one of the four properties and Y is either interviews or surveys.
The kernel theories are not tested per se since these are well-known and validated methods in their
14 CHAPTER 2. RESEARCH DESIGN
own rights, rather the tests concern the use of these theories in conjunction with architecture models
and the specific data collection methods.
In paper A, a study was performed at a Swedish power company. The objective of the study was
to test whether it was possible to use a specific metamodel with a specific analysis engine imple-
mented in a PRM to model and analyze how data accuracy deteriorates across a business process.
Input data for both the qualitative and quantitative modeling was elicited through interviews. The
accuracy of the output data set was estimated to 94.905%. When sampling 37 data objects from the
same data set, the accuracy was determined to be 94.6 %, a rather small difference suggesting that
the metamodel yields fairly good estimates. Input data for both qualitative and quantitative mod-
eling was collected through interviews which was rather fast when compared with the sampling of
the data objects. Sampling took (17 man-hours), while the modeling approach consumed (11 hours)
which indicates that the method is resource-efficient to use.
In paper B, the metamodel was tested in seven studies at banks, a major software vendor and
a power company with respect to the metamodel’s ability to model and analyze service availability
accurately. Furthermore, to investigate the feasibility of the approach, the time spent modeling and
analyzing was recorded in each case. Input data was elicited through interviews. In five out of the
seven cases it was possible to compare the assessments with accurate log file data. The difference
in yearly downtimes between the assessed values and the log data was no more than a few hours of
down time per year. Each study required less than twenty man-hours to perform. For the purpose of
wishing to obtain good decision support, this indicates that the suggested method yields sufficiently
accurate availability estimates.
In paper C, a study was conducted at a Swedish power company where a total of five application
services were evaluated using a metamodel. Input data came from interviews with system experts
and a survey with application users to determine workload. The results of these evaluations were
compared with measurements of the response times of said application services. The differences
were within 15% for four out of five services, the fifth being 36% off. Using the modeling approach
consumed a third of the time it took to measure the same values using the measurement approach
which leads us to believe that it is a resource-efficient and fairly accurate method.
In paper D, there were two testable propositions: (i) did the reference models accurately depict
the domain of maintenance management? and (ii) was it possible to use them in conjunction with
a metamodel to predict application usage? To test that the reference models adequately depicted
the domain, around ten interviews with maintenance management practitioners were performed.
The respondents came from both industry companies and vendors of computerized maintenance
management systems. The respondents helped shape the models into what they believed would be
a good representation of the domain. As for testing the model’s ability to predict application usage,
a survey was performed in which 79 respondents participated and of which 55 answers were useful.
The reference models together with a metamodel tailored for application usage predictions were
able to account for large variations in application usage.
With the exception of the studies in Paper D, all studies involved applying a method in a realistic
setting. Specifically, the researchers were the ones applying the method. Such studies may be
labeled action research studies [149], rather than case studies [150], in which researchers do not
become part of the unit of analysis in the same manner. The combination of design science and
action research is not a new suggestion [151], but [152] argue that design science and action research
have different goals ("discovery-through-design" vs. "discovery-throguh-action") and are therefore
disjunct entities. Without going into too much detail, suffice it to say that it should be possible to
use an action research study to test a design artifact.
As for the overall framework presented in paper E, the testable proposition is ‘is it possible to
integrate the four metamodels into one integrated metamodel and still retain the analysis capabilities
of the individual metamodels?’. The framework was integrated and successfully implemented in
2.7. PRINCIPLES OF IMPLEMENTATION 15
the tool EAAT. When testing the framework it yields correct predictions according to the original
metamodels and is consistent. Based on this it is possible to deduce that the integration succeeded.
2.7 Principles of implementation
Paper A-D provide descriptions of how the metamodels were tested in case studies and this should
illuminate how to practically use the metamodels. In paper E, a summary of the method guidelines
is provided for extra guidance. Since paper E also describes a tool implementation (which can be
downloaded 1), this will further aid practitioners in using the framework.
2.8 Expository instantiation
Each paper contains an expository instantiation to better communicate how the models work. In
papers A-D the examples were based on real cases, whereas paper E shows an example model of a
fictitious scenario.
2.9 Work Progress
The content of the present thesis is the result of an iterative process lasting more than five years.
Apart from documenting the work in this introduction and in papers A through E, the progress of
the research is reflected in some of Publications I through XXX. Publications V, XIX, XX, XXVII,
XXVIII, XXIX all depict a major research project producing a method for system quality analysis.
The method covers many of the properties of the present thesis, but was not model-based, which
made it difficult to integrate analysis with EA practice and leverage existing architecture content.
Publication XVII presents an early attempt at integrating system quality analysis, as outlined in Pub-
lication XXVI and using a formalism known as Extended Influence Diagrams, which was presented
in Publications XXIII, XXIV, XVIII, XXX. The framework presented in Publication XVII proved
difficult to match with most EA frameworks. It was therefore decided that rather than using the
system quality analysis theories as a starting point for the development of architecture framework it
would be better to use an existing architecture framework as a foundation. The result was presented
in Publication XVI, in which system quality analysis was integrated with the ArchiMate framework.
Using this approach led to Publication VII, which was the basis for Paper A of this thesis.
The Probabilistic Relational Model (PRM) formalism which is used for the analysis in Publica-
tion VII proved cumbersome when confronted with having to integrate simple continuous equations.
Publication II improves upon the PRM formalism and introduces the Hybrid Probabilistic Relational
Model formalism, which is employed in Papers C and D of this thesis.
The reference models of Paper D depict the maintenance management domain and this was
partly based on work made presented by the author in Publications XXVII, XXVIII and XXIX.
The five papers of this thesis were written more or less sequentially with one paper per property
(A-D) and one paper to integrate the work (E).
1please go to http://www.kth.se/ees/omskolan/organisation/avdelningar/ics/research/eat/downloads-1.46631

Chapter 3
Results
This chapter summarizes the results, starting with the overall framework, and proceeding to detail
the four viewpoints.
3.1 The framework
The result of this thesis is a framework comprising of a metamodel with four viewpoints. This
framework is presented in its entirety in paper E and is the synthesis of the metamodels presented
in papers A-D.
According to the ISO/IEC 42010 standard [153] viewpoints define reusable metamodel excerpts
with which views, i.e. architecture models conforming to a certain viewpoint, can be generated.
The viewpoints are tailored to support concerns of importance to stakeholders. Below, the overall
metamodel is superficially described followed by short expositions of the four viewpoints.
The passive structure elements of the metamodel are called DataSet and RepresentationSetand are slight alterations of the original ArchiMate DataObjects and Representations. The
modification consists in defining DataSet and Representation Set as sets comprising multiple
DataObjects or Representations. These are used for the Data Accuracy viewpoint.
The internal active structure elements consist of BusinessProcesses, ApplicationFunc-tions and InfrastructureFunctions. These interface with the external services through a
number of placeholder classes which are not found in the original ArchiMate language, Realizeand Use which allow the modeler to set attribute values on relations for the service response time
viewpoint, and Gate_Use and Gate_Realize which are logical gates depicting how availabil-
ity flows through the architecture in the availability viewpoint. The GateToGate_Realize and
GateToGate_Use classes are used as containers for intermediate attributes when multiple gates are
connected which is important in the service availability and the response time viewpoints.
The external services of the metamodel are ApplicationService and Infrastructure-Service. ApplicationServices and BusinessProcesses have a special relation as shown
in the Process-ServiceAssociation class which is used in the Application Usage viewpoint.
The active structure elements of the metamodel are represented as Roles, ApplicationCom-ponents and Nodes. Roles interface with ApplicationComponents through the RoleCom-ponentAssociation class for the Application Usage viewpoint. Furthermore, there is a class
between the ProcessServiceAssociation class and the ApplicationComponent class which
is called UsageRelation. This is also used in the Application Usage viewpoint.
The next Section outlines how the metamodel may be used, viewpoint by viewpoint.
17
18 CHAPTER 3. RESULTS
Service
Response Time
Workload
InternalBehavioralElement (Function)
Arrival FrequencyService Time
Realize_1
ActiveStructureElementCapacityAssigned
0..* 0...1Availability
Availability
Use_3
Gate_useType
Use_1
GateToGate_use_Bottom
0...1
Use
Use_2
Infrastructure Function ApplicationFunction
InfrastructureService ApplicationService
PassiveComponentSet
InputAccuracy
DataSet RepresentationSet
BusinessProcess
Write_Service
Read_Service
Write_Function
Read_Function
CorrectionDeterioration
CorrectionDeterioration
Node
ApplicationComponentUsage
Gate_realizeType
GateToGate_realize_top
Realize
1
0..1
Realize_2
Realize_31
1
Execution Pattern GateToGate_realizeWeight
Execution PatternGateToGate_us
eWeight (n)
GateToGate_use_Top
1
1
0..1
GateToGate_realize_bottom
1
1
FunctionalityTaskFulfillment
Functionality
ProcessService-Association
UsageRelation
Regr.Coeff.TTFUse_4
Use_5
IsAffected_1
IsAffected_2
Role
RoleComponent-Association
PerceivedUsefulnessPerceivedEaseofUse
Use_6
Use_7
Arrival Frequency
Accuracy
1
1
0..*
0..*
0..*
0..*
0..*
0..*
0..*
0..*
0..*
0..*
0..*
0..*
0..*
0..*
0..1
0..*
0...1
0..*0..*
0..*
1
1
1
1
0..*
0..*
0..*
BusinessService
EvidentialResponseTime
Precendence
EvidentialAvailability
Availability
Availability
AvailabilityEvidential availability
0..*
ResponseTime
WeightWeightedWorkload
WeightedResponseTime
WeightWeightedWorkload
WeightedResponseTime
Use_6
Legend
Original ArchiMatemetamodel class
ApplicationComponent
UsageClass attribute (output of analysis)
Role ComponentAssociation
Class not part of originalArchiMate metamodel
PerceivedUsefulness
Class relation with label
Class attribute(input to analysis)
Specialization relation
ResponseTime
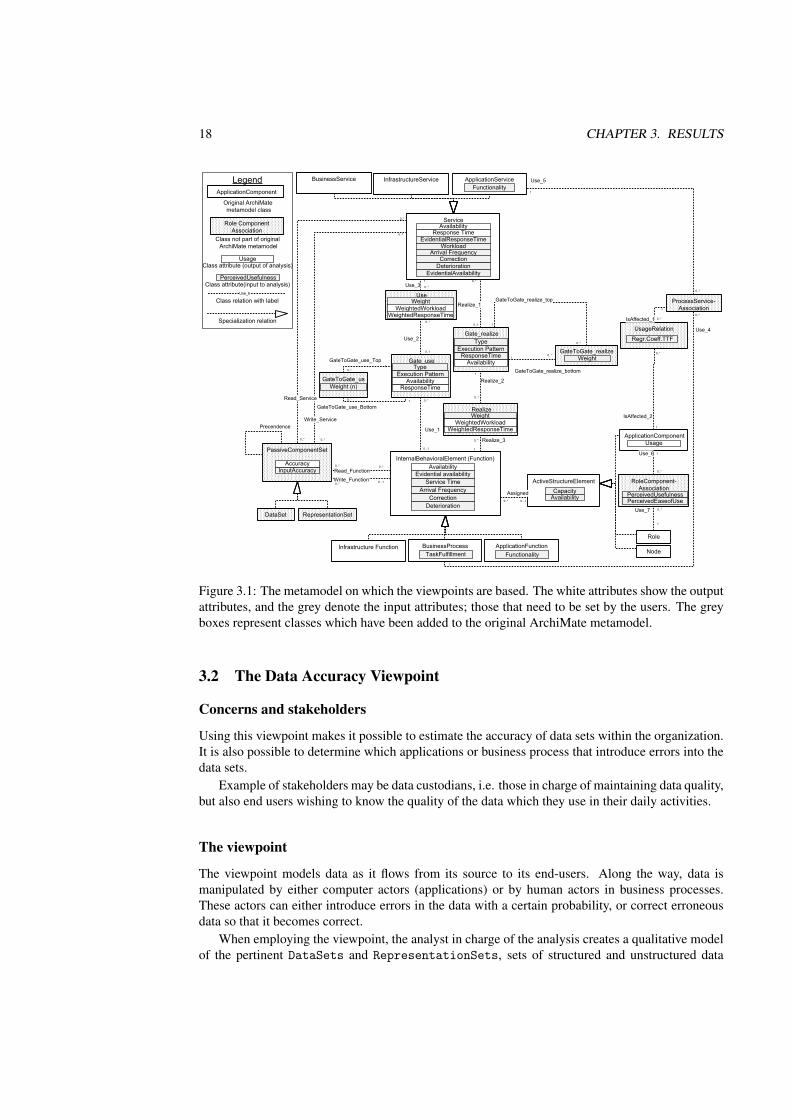
Figure 3.1: The metamodel on which the viewpoints are based. The white attributes show the output
attributes, and the grey denote the input attributes; those that need to be set by the users. The grey
boxes represent classes which have been added to the original ArchiMate metamodel.
3.2 The Data Accuracy Viewpoint
Concerns and stakeholders
Using this viewpoint makes it possible to estimate the accuracy of data sets within the organization.
It is also possible to determine which applications or business process that introduce errors into the
data sets.
Example of stakeholders may be data custodians, i.e. those in charge of maintaining data quality,
but also end users wishing to know the quality of the data which they use in their daily activities.
The viewpoint
The viewpoint models data as it flows from its source to its end-users. Along the way, data is
manipulated by either computer actors (applications) or by human actors in business processes.
These actors can either introduce errors in the data with a certain probability, or correct erroneous
data so that it becomes correct.
When employing the viewpoint, the analyst in charge of the analysis creates a qualitative model
of the pertinent DataSets and RepresentationSets, sets of structured and unstructured data

3.3. THE SERVICE AVAILABILITY VIEWPOINT 19
Service
InternalBehavioralElement(Function)
Infrastructure Function ApplicationFunction
InfrastructureService ApplicationService
PassiveComponentSet
InputAccuracy
DataSet RepresentationSet
BusinessProcess
Write_ServiceRead_Service
Write_FunctionRead_Function
CorrectionDeterioration
CorrectionDeterioration
Accuracy
0..*
0..*
0..*
0...1
0..*0..*
0..*
BusinessService
0...1
Precendence
Figure 3.2: The data accuracy viewpoint.
respectively, as well as the InternalBehaviorComponents and Services that read or write data
before reaching its final consumption point.
Next, the architects elicits quantitative estimates on how likely a Data Object or
Representation from the original DataSet or RepresentationSet is to be erroneous and how
likely the InternalBehaviorComponents and Services are to correct or deteriorate the Data-Objects or Representations as they flows from the source to their end-users. See Fig. 3.2.
3.3 The Service Availability Viewpoint
Concerns and stakeholders
The Service Availability viewpoint addresses the concern of determining the availability of services
in the present and future enterprise architecture. Some likely stakeholders for this viewpoint are
service managers and end-users.
The viewpoint
The service availability viewpoint (cf. Fig. 3.3) employs Fault Tree Analysis to analyze service
availability. This means that components are connected through logical gates. This viewpoint is
restricted to simple AND-gates and OR-gates. An AND-gate will continue to function if all the
components connected to it are functioning. An OR-gate will continue to function if at least one con-
nected component is up and running. Views based on this viewpoint feature combinations of logical
gates, here denoted Gate_Use and Gate_Realize depending on if a service is realized by a func-
tion or the other way around, and original ArchiMate constructs. The latter are ActiveStructure-Elements, InternalBehaviorElements or Services. The attribute Gate_Use/Realize.Typecan be set to AND or OR depending on which kind of gate one wants to model modeled.
The analysis begins by determining which service or services to investigate. The next step
is to qualitative model all components that are somehow needed for the service to function and
connect these with logical gates. Finally, quantitative estimates regarding average availabilities of
the components are elicited and the analysis is performed.
20 CHAPTER 3. RESULTS
Service
InternalBehavioralElement (Function)
Realize_1
ActiveStructureElementAssigned
0..* 0...1
Availability
Use_3
Gate_useType
Use_1GateToGate_use_Bottom 0...1
Use
Use_2
Infrastructure Function ApplicationFunction
InfrastructureService ApplicationService
BusinessProcess
NodeApplicationComponent
Gate_realizeType
GateToGate_realize_top
Realize1
0..1
Realize_2
Realize_3
1
1
GateToGate_realize
GateToGate_use
GateToGate_use_Top
1
1
0..1GateToGate_realize_bottom
1
1
0..*
0..*
0..*
0..*
0..*
0..*
0..*
0..*
0..*
0..*
BusinessService
AvailabilityAvailability
EvidentialAvailability
EvidentialAvailability
Availability
Availability
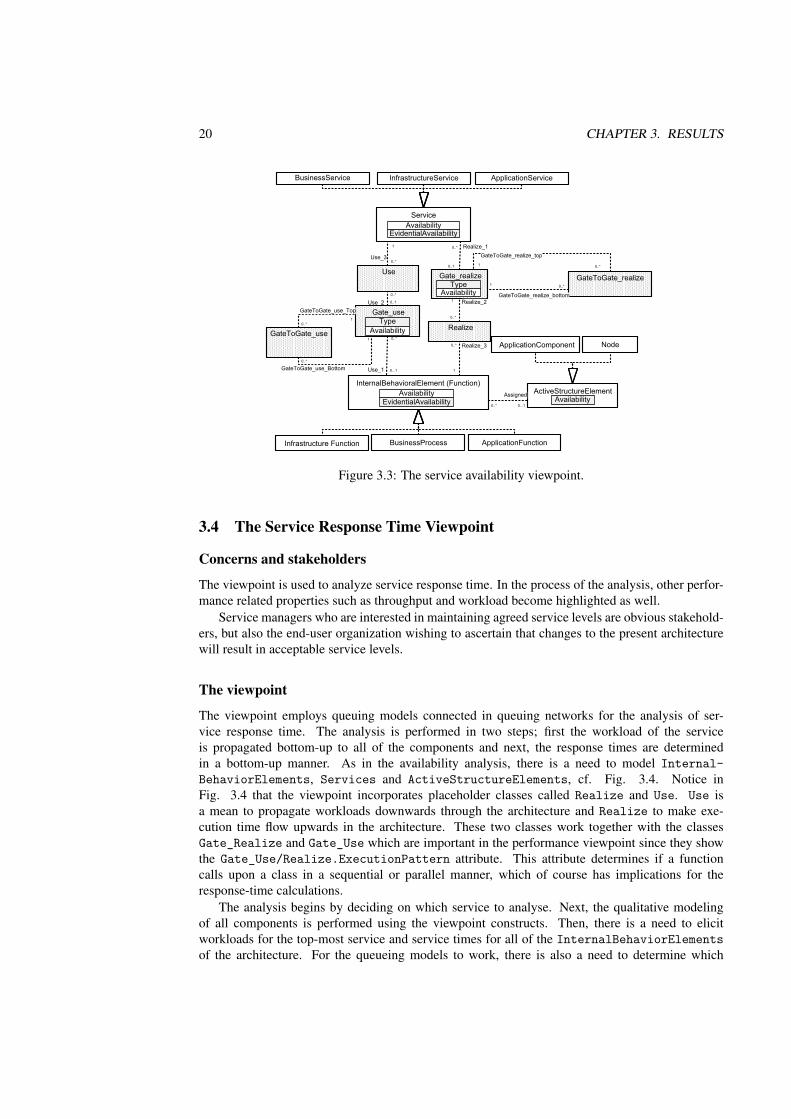
Figure 3.3: The service availability viewpoint.
3.4 The Service Response Time Viewpoint
Concerns and stakeholders
The viewpoint is used to analyze service response time. In the process of the analysis, other perfor-
mance related properties such as throughput and workload become highlighted as well.
Service managers who are interested in maintaining agreed service levels are obvious stakehold-
ers, but also the end-user organization wishing to ascertain that changes to the present architecture
will result in acceptable service levels.
The viewpoint
The viewpoint employs queuing models connected in queuing networks for the analysis of ser-
vice response time. The analysis is performed in two steps; first the workload of the service
is propagated bottom-up to all of the components and next, the response times are determined
in a bottom-up manner. As in the availability analysis, there is a need to model Internal-BehaviorElements, Services and ActiveStructureElements, cf. Fig. 3.4. Notice in
Fig. 3.4 that the viewpoint incorporates placeholder classes called Realize and Use. Use is
a mean to propagate workloads downwards through the architecture and Realize to make exe-
cution time flow upwards in the architecture. These two classes work together with the classes
Gate_Realize and Gate_Use which are important in the performance viewpoint since they show
the Gate_Use/Realize.ExecutionPattern attribute. This attribute determines if a function
calls upon a class in a sequential or parallel manner, which of course has implications for the
response-time calculations.
The analysis begins by deciding on which service to analyse. Next, the qualitative modeling
of all components is performed using the viewpoint constructs. Then, there is a need to elicit
workloads for the top-most service and service times for all of the InternalBehaviorElementsof the architecture. For the queueing models to work, there is also a need to determine which
3.5. THE APPLICATION USAGE VIEWPOINT 21
ServiceResponseTime
Workload
InternalBehavioralElement (Function)
Realize_1
ActiveStructureElement
Capacity
Assigned
0..* 0...1
Use_3
Gate_use
Use_1GateToGate_use_Bottom0...1
Use
Use_2
InfrastructureService ApplicationService
NodeApplicationComponent
Gate_realize
GateToGate_realize_top
RealizeWeight
1
0..1
Realize_2
Realize_3
1
1
ExecutionPattern
GateToGate_realize
ExecutionPatternGateToGate_use
GateToGate_use_Top
1
1
1
GateToGate_realize_bottom
1
1
Role
Arrival Frequency0..*
0..*
0..*
0..*
0..*
0..*
0..*
0..*
0..*
0..*
BusinessService
ResponseTime
WorkloadArrivalFrequency
ProcessingTimeServiceTimeThroughput
WeightedWorkload
EvidentialResponseTime
ResponseTime
WeightedResponseTime
WeightWeightedWorkload
WeightedResponseTime
WeightWeightedWorkload
WeightedResponseTime
WeightWeightedWorkload
WeightedResponseTime
Utilisation
Infrastructure Function ApplicationFunctionBusinessProcess
Type
Type
ResponseTime
1
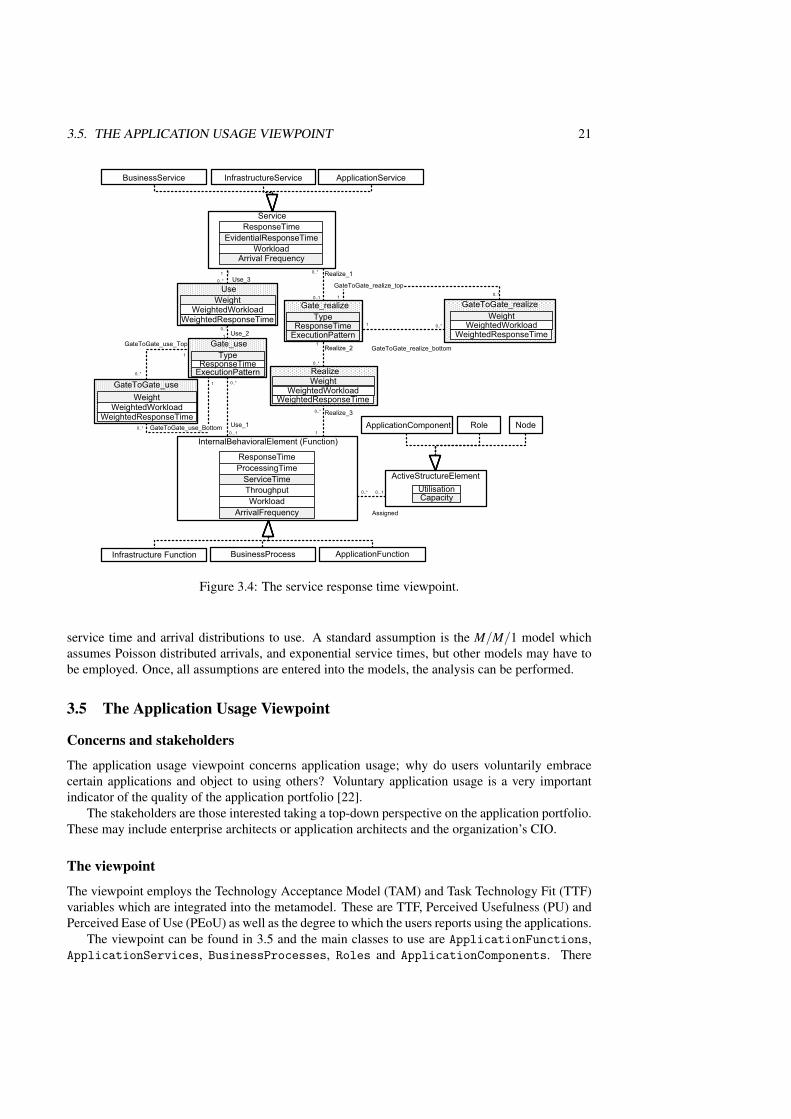
Figure 3.4: The service response time viewpoint.
service time and arrival distributions to use. A standard assumption is the M/M/1 model which
assumes Poisson distributed arrivals, and exponential service times, but other models may have to
be employed. Once, all assumptions are entered into the models, the analysis can be performed.
3.5 The Application Usage Viewpoint
Concerns and stakeholders
The application usage viewpoint concerns application usage; why do users voluntarily embrace
certain applications and object to using others? Voluntary application usage is a very important
indicator of the quality of the application portfolio [22].
The stakeholders are those interested taking a top-down perspective on the application portfolio.
These may include enterprise architects or application architects and the organization’s CIO.
The viewpoint
The viewpoint employs the Technology Acceptance Model (TAM) and Task Technology Fit (TTF)
variables which are integrated into the metamodel. These are TTF, Perceived Usefulness (PU) and
Perceived Ease of Use (PEoU) as well as the degree to which the users reports using the applications.
The viewpoint can be found in 3.5 and the main classes to use are ApplicationFunctions,
ApplicationServices, BusinessProcesses, Roles and ApplicationComponents. There
Chapter 4
Related Works
Related works span several fields including EA, EA analysis, Software Architecture, Software Ar-
chitecture Analysis methods as well as evaluation frameworks from outside the architecture com-
munity.
The ArchiMate EA framework [99] comes with attachments which allow for EA analysis,
specifically of performance and IT cost [142, 144] and the former is partly integrated in the frame-
work presented here. However, there is a lack of formal integration between the modeling language
and the analysis mechanisms which makes tool implementation difficult.
There is a stream of research on EA analysis of individual non-functional properties [115] such
as security [128], modifiability [45] or interoperability [158]. The metamodels presented in these
examples are, however, limited to analysis of single properties. An early attempt at EA analysis of
multiple properties was presented in the work by Gammelgård et al. [159], but with a no link to
architecture models.
The work by [160] proposed describing the EA of an entire enterprise and perform simulations
on it to identify opportunities to increase enterprise profitability. Although worthy of praise for
its ambition, the notion of simulating the entire enterprise has very little connection to IT decision
making. De Boear et al. [161] present an XML-based formalism for EA analysis, but offer very
few details on how specifically to undertake the analysis. Enterprise architecture patterns is a topic
gaining traction in the community, but these either support qualitative analysis [162] or focuses only
on business processes [163].
The ABACUS tool [110] offers several analysis possibilities including performance, total cost
of ownership and reliability analyses. Although there is some overlap with the present work in terms
of addressing concerns, (performance and availability) the ABACUS does not offer any support for
application usage or data accuracy analysis.
Yu et al. [164] suggest using i* which is a language for goal-modeling to support EA analysis.
Their goal was not, however, to supply a re-usable framework for EA analysis for particular non-
functional properties. Razavi et al. [165] suggest using AHP – Analytical Hierarchy Process –
together with EA scenarios to support decision-making. While containing frameworks for analysis
of various non-functional properties, there no firm link between the frameworks and a modeling
language, which makes the method poorly suited for architecture analysis. Addicks and Steffens
[166] propose a method for application landscape assessment using fuzzy logic. This method can
be used to assess landscape properties in an architectural context but offers, as yet, no support for
re-usable model fragments for specific assessments of for instance performance or data accuracy.
Architecture principles are often used as a part of EA initiatives [137]. Principles describe
succinct, high-level statements concerning the future direction of an organization’s architecture.
Principles are important guidelines for architecture governance, but alas, offer little guidance for
23
24 CHAPTER 4. RELATED WORKS
architects wishing to analyse their EA.
Within the Software Architecture community, architecture analysis has been mainstream since
at least the early 2000’s. ATAM [25] is one of the most widely used and supports analysis of a
row of properties including response time, availability, modifiability etc. Some other well-known
software architecture analysis methods are the SAAM (Software Architecture Analysis Method)
[25], the ABAS (Attribute-Based Architecture Styles) [167], the ARCADE-RARE [168] and the
work by [169]. These methods are able to analyze one or several properties such as performance,
availability or modifiability in the context of early software architecture design decisions. They are,
however, rather demanding in terms of data collection and often require the user to test the system’s
constituent components rather exhaustively. To perform this kind of thorough analysis becomes too
expensive in an enterprise architecture context, where there is usually a large number of components
to cover.
There are many frameworks for assessment of application portfolio health [22, 170–172]. None
of these, however, are able to explain why some applications are voluntarily used and why others
are not and are quite weak on discussing on how to measure other system qualities as well.
The software architecture community offers specific reliability and availability analysis frame-
works as well such as [173–182], but these too are rather cumbersome to use in an EA setting.
There are some dedicated EA availability analysis methods, but these are purely qualitative [183],
fail to take component redundancy into account [184, 185], or restrain themselves to the military
domain [186, 187].
Regarding response time analysis, there are three kinds of methods: [188] measurements – us-
ing experimental methods to directly measure response time [189], simulation-based methods –
creating executable response time simulation models [110,168,190], and analytical modeling – us-
ing queueing theory [141, 191–194] to measure response time [195, 196]. There are methods for
response time analysis of business processes (e.g. [197]), software applications (e.g. [195]), the in-
frastructure domain (e.g. [198]), or embedded systems (e.g. [199]) however, there are few attempts
at integrating these perspectives into one coherent method [143]. Both the IT governance frame-
work COBIT [18] and service management framework ITIL [17] propose capacity management
processes service response time management but do not go into detail on how to perform response
time analysis.
As for data accuracy, The Quality Entity Relationship (QER) model and the Polygen model
represent some of the earliest attempts at classifying data quality [200] using relational algebra but
without integrating the analysis with modeling. So called Information Product Maps models [201],
extended to an UML profile [202], are able to graphically depict information flow but without
quantitative data quality analysis. These methods do not, however, integrate analysis capabilities
with their modeling capabilities.
Chapter 5
Discussion and conclusion
This section will discuss the contributions and limitations of the EA framework and the research
design of this thesis
5.1 Contributions
The present framework offers practitioners integrated analysis and modeling capabilities related to
the properties data accuracy, service availability, service response time and application usage.
The properties themselves are relevant to IT decision makers which could be demonstrated by
comparing the attributes to Delone and McLean’s model for information system success [7,21]. As
mentioned in the introduction, the model posits that system quality, service quality and informa-
tion quality affect user satisfaction, user intention to use as well as system usage, and the higher
these factors are, the higher the net benefits will be [7]. The application usage viewpoint could be
mapped to both the user satisfaction and the system usage criteria, since it employs ratings of user
satisfactions as well as user ratings of application functionality, a system quality, to predict appli-
cation usage. The service availability and the service response time viewpoints are squarely within
the service quality dimension and data accuracy is relevant to the information quality dimension.
Not only has it been demonstrated that the analysis of these properties are feasible from an
accuracy perspective, all of the properties can be analyzed using data collection procedures (mainly
interviews and surveys), which could be easily adopted by virtually any organization. Furthermore,
it does not appear as if though the analysis should prove prohibitively expensive to perform.
To researchers, the present framework offers a foundation on which to integrate additional view-
points to extend the analysis capabilities, for instance by adding security or interoperability analyses.
The framework should also be a useful foundation for doing empirical analyses of trade-offs
between various system properties, e.g. to find out how data accuracy affects application usage.
To researchers within enterprise modeling, the present framework offers some input into which
constructs are of use when modeling to support architecture analysis. The extensions that have
been made to ArchiMate indicate areas of improvement: by including Gates for the fault tree
based availability analysis, by adding classes on the Realized and the Used relations to be able
to express weights for the response time case, by adding the ProcessServiceAssociation class
between the business process and the application services to be able to state the degree to which the
functionality and task requirements match, to add the class RoleComponentAssociation between
the Role class and the ApplicationComponent class thus being able to capture user opinions of
the application components. Furthermore, the addition of attributes could serve as input to the
ArchiMate work.
25
26 CHAPTER 5. DISCUSSION AND CONCLUSION
5.2 Limitations and future works
An obvious limitation with the current framework is that it comprises four properties only. In the
non-functional property sphere alone there are several other concerns which could be analyzed using
architecture models e.g. security [128], interoperability [131] or modifiability [45]. A fruitful next
step would be to add other viewpoints to the present framework by for instance integrating the
architecture metamodels mentioned above with the present framework.
As noticed in the the testable propositions section above, the framework has not been employed
to aid decision-making in actual decision situations. The proposition that EA aids decision-making
is commonly encountered [32, 115, 203], but with the exception of [159], there is little research
done on actually employing the EA frameworks to aid decisions. A case study involving the cur-
rent framework, a decision concerning the Enterprise Architecture and some evaluation framework
concerning decision quality would be very interesting.
The testing of the framework has been performed in very few cases: both service response time
and data accuracy in a single study, and application usage for one application domain only, albeit
with 55 useful respondents. More studies are thus needed to test the individual properties.
5.3 Conclusion
This thesis comprises five papers which describe how EA can be utilized to analyze data accuracy,
service availability, service response time and application usage. In the first four papers, metamodels
and methods for the analysis of the four individual properties were described, including empirical
testing of their performance viz. accuracy and expense of use. It was demonstrated that the results
were accurate and that the framework can be used at a reasonable cost. The fifth paper presents an
integration of the four individual analysis frameworks as well as the framework implemented in a
software tool.
Bibliography
[1] E. Brynjolfsson and L. Hitt, “Paradox lost? firm-level evidence on the returns to information
systems spending,” Management Science, vol. 42, no. 4, pp. pp. 541–558, 1996. [Online].
Available: http://www.jstor.org/stable/2634387
[2] N. Melville, K. Kraemer, and V. Gurbaxani, “Review: Information technology and organiza-
tional performance: An integrative model of it business value,” MIS Quarterly, vol. 28, no. 2,
pp. pp. 283–322, 2004.
[3] L. Pintelon, S. Pinjala, and A. Vereecke, “Evaluating the effectiveness of maintenance strate-
gies,” Journal of Quality in Maintenance Engineering, vol. 12, no. 1, pp. 7–20, 2006.
[4] E. Brynjolfsson, “The productivity paradox of information technology,” Commun. ACM,
vol. 36, pp. 66–77, December 1993. [Online]. Available: http://doi.acm.org/10.1145/163298.
163309
[5] R. Nelson, “It project management: infamous failures, classic mistakes, and best practices,”
MIS Quarterly Executive, vol. 6, no. 2, pp. 67–78, 2007.
[6] K. Molokken and M. Jorgensen, “A review of software surveys on software effort estima-
tion,” in Empirical Software Engineering, 2003. ISESE 2003. Proceedings. 2003 Interna-tional Symposium on. IEEE, 2003, pp. 223–230.
[7] W. H. DeLone and E. R. McLean, “The DeLone and McLean model of information systems
success: A ten-year update,” Journal of management information systems, vol. 19, no. 4, pp.
9–30, 2003.
[8] N. Gorla, T. Somers, and B. Wong, “Organizational impact of system quality, information
quality, and service quality,” The Journal of Strategic Information Systems, 2010.
[9] B. Boehm, J. Brown, and M. Lipow, “Quantitative evaluation of software quality,” in Pro-ceedings of the 2nd international conference on Software engineering. IEEE Computer
Society Press, 1976, pp. 592–605.
[10] ISO, ISO/IEC 9126-1:2001 Software engineering – Product quality – Part 1: Quality model,ISO - International Organization for Standardization Std., 2001.
[11] International Organization for Standardization, “Iso/iec 25010:2011 - systems and software
engineering – systems and software quality requirements and evaluation (square) – system
and software quality models,” International Organization for Standardization, International
standard ISO/IEC 25010:2011, 2001.
[12] D. Scott, “How to Assess Your IT Service Availability Levels,” Apr. 2009.
27
28 BIBLIOGRAPHY
[13] U. Franke, M. Ekstedt, R. Lagerström, J. Saat, and R. Winter, “Trends in enterprise architec-
ture practice ? a survey,” in Trends in Enterprise Architecture Research, ser. Lecture Notes in
Business Information Processing, vol. 70. Springer Berlin Heidelberg, 2010, pp. 16–29.
[14] IBM Global Services, “Improving systems availability,” IBM Global Services, Tech. Rep.,
1998.
[15] A. Bharadwaj, M. Keil, and M. Mähring, “Effects of information technology failures on the
market value of firms,” The Journal of Strategic Information Systems, vol. 18, no. 2, pp.
66–79, 2009.
[16] J. Palmer, “Web site usability, design, and performance metrics,” Information systems re-search, vol. 13, no. 2, pp. 151–167, 2003.
[17] J. Van Bon, Foundations of IT Service Management based on ITIL. Van Haren Pub, 2007.
[18] IT Governance Institute, Cobit 4.1. ISACA, 2007. [Online]. Available: http:
//www.isaca.org/Knowledge-Center/cobit/Pages/Downloads.aspx
[19] T. S. Teo and P. K. Wong, “An empirical study of the performance impact of computerization
in the retail industry,” Omega, vol. 26, no. 5, pp. 611 – 621, 1998. [Online]. Available:
http://www.sciencedirect.com/science/article/pii/S0305048398000073
[20] T. C. Redman, “The impact of poor data quality on the typical enterprise,”
Commun. ACM, vol. 41, pp. 79–82, February 1998. [Online]. Available: http:
//doi.acm.org/10.1145/269012.269025
[21] W. DeLone and E. McLean, “Information systems success: the quest for the dependent vari-
able,” Information systems research, vol. 3, no. 1, pp. 60–95, 1992.
[22] P. Weill and M. Vitale, “Assessing the health of an information systems applications portfolio:
An example from process manufacturing,” MIS quarterly, vol. 23, no. 4, pp. 601–624, 1999.
[23] V. Venkatesh, “Determinants of perceived ease of use: Integrating control, intrinsic moti-
vation, and emotion into the technology acceptance model,” Information systems research,
vol. 11, no. 4, pp. 342–365, 2000.
[24] L. Cysneiros, J. do Prado Leite, and J. de Melo Sabat Neto, “A framework for integrating non-
functional requirements into conceptual models,” Requirements Engineering, vol. 6, no. 2,
pp. 97–115, 2001.
[25] R. Kazman, L. Bass, M. Webb, and G. Abowd, “SAAM: A method for analyzing the proper-
ties of software architectures,” Proceedings of the 16th international conference on Softwareengineering, pp. 81–90, 1994.
[26] R. Kazman, M. Klein, M. Barbacci, T. Longstaff, H. Lipson, and J. Carriere, “The architec-
ture tradeoff analysis method,” Proceedings of the Fourth IEEE International Conference onEngineering of Complex Computer Systems, 1998. ICECCS’98., pp. 68–78, 2002.
[27] R. Kazman, L. Bass, and M. Klein, “The essential components of software architecture design
and analysis,” Journal of Systems and Software, vol. 79, no. 8, pp. 1207–1216, 2006.
[28] W. Deming, The new economics: For industry, government, education. The MIT Press,
2000.

BIBLIOGRAPHY 29
[29] R. Winter and R. Fischer, “Essential layers, artifacts, and dependencies of enterprise archi-
tecture,” Journal of Enterprise Architecture, vol. Volume 3, Number 2, pp. 7–18, 2007.
[30] J. A. Zachman, “A framework for information systems architecture,” IBM Syst. J., vol. 26,
no. 3, pp. 276–292, 1987.
[31] J. Ross, P. Weill, and D. Robertson, Enterprise architecture as strategy: Creating a founda-tion for business execution. Harvard Business Press, 2006.
[32] P. Johnson and M. Ekstedt, Enterprise architecture: models and analyses for informationsystems decision making. Studentlitteratur, Lund, 2007.
[33] C. Babers, The Enterprise Architecture Sourcebook, 2006.
[34] J. Carbone, IT Architecture Toolkit. Prentice Hall, 2004.
[35] M. Lankhorst, Enterprise Architecture At Work. Heidelberg: Springer, 2005.
[36] J. McGovern, S. Ambler, M. Stevens, J. Linn, V. Sharan, and E. Jo, A Practical Guide toEnterprise Architecture. Pearson Education, 2004.
[37] D. Minoli, Enterprise Architecture A to Z – Frameworks, Business Process Modeling, SOA,and Infrastructure Technology. Taylor & Francis Group, 2008.
[38] K. Niemann, From Enterprise Architecture to IT Governance – Elements of Effective IT Man-agement. Friedr. Vieweg & Sohn Verlag, 2006.
[39] M. Op’t Land, E. Proper, M. Waage, J. Cloo, and C. Steghuis, Enterprise Architecture –Creating Value by Informed Governance. Springer, 2009.
[40] C. O’Rourke, N. Fishman, and W. Selkow, Enterprise Architecture – Using the ZachmanFramework. Thomson Learning, 2003.
[41] C. Perks and T. Beveridge, Guide to Enterprise IT Architecture. Springer, 2003.
[42] J. Schekkerman, How to survive in the jungle of Enterprise Architecture Frameworks – Cre-ating or choosing an Enterprise Architecture Framework. Trafford Publishing, 2003.
[43] S. Spewak and S. Hill, Enterprise Architecture Planning - Developing a Blueprint for Data,Applications and Technology. John Wiley and Sons, 1992.
[44] F. Theuerkorn, Lightweight Enterprise Architectures. CRC Press LLC, 2005.
[45] R. Lagerström, P. Johnson, and D. Höök, “Architecture analysis of enterprise systems
modifiability-Models, analysis, and validation,” Journal of Systems and Software, vol. 83,
no. 8, pp. 1387–1403, 2010.
[46] M. Ekstedt, “Enterprise architecture for IT management: A CIO decision making perspective
on the electric power industry,” Ph.D. dissertation, Royal Institute of Technology (KTH),
Stockholm, Sweden, 2004.
[47] M. Gammelgård, “Business value assessment of IT investments – an evaluation method
applied to the electrical power industry,” Ph.D. dissertation, Royal Institute of Technology
(KTH), Stockholm, Sweden, 2007.
[48] N. Hämäläinen, “Evaluation and measurement in enterprise and software architecture man-
agement,” Ph.D. dissertation, University of Jyväskylä, Jyväskylä, Finland, 2008.
30 BIBLIOGRAPHY
[49] E. Johansson, “Assessment of enterprise information security – how to make it credible and
efficient,” Ph.D. dissertation, Royal Institute of Technology (KTH), Stockholm, Sweden,
2005.
[50] P. Johnson, “Enterprise software system integration – an architectural perspective,” Ph.D.
dissertation, Royal Institute of Technology (KTH), Stockholm, Sweden, 2002.
[51] Å. Lindström, “Using architectural principles to make the IT-strategy come true – focusing
on the electric power industry,” Ph.D. dissertation, Royal Institute of Technology (KTH),
Stockholm, Sweden, 2006.
[52] J. L. Plazaola Prado, “Strategic business and IT alignment assessment – a modeling approach
associated with enterprise architecture,” Ph.D. dissertation, Royal Institute of Technology
(KTH), Stockholm, Sweden, 2009.
[53] M. Simonsson, “Predicting IT governance performance: A method for model-based deci-
sion making,” Ph.D. dissertation, Royal Institute of Technology (KTH), Stockholm, Sweden,
2008.
[54] S. Kurpjuweit and R. Winter, “Viewpoint-based meta model engineering,” Enterprise Mod-elling and Information Systems Architectures (EMISA), 2007.
[55] ——, “Concern-oriented business architecture engineering,” in Proc. of the 24th Annual ACMSymposium on Applied Computing (SAC), Hawaii, 2009.
[56] F. Armour, S. Kaisler, and S. Liu, “Building an enterprise architecture step by step,” ITProfessional, vol. 1, no. 4, pp. 31–39, Jul/Aug 1999.
[57] A. Bahrami, D. Sadowski, and S. Beahrami, “Enterprise architecture for business process
simulation,” in Simulation Conference Proceedings, vol. 2, Dec 1998, pp. 1409–1413.
[58] W. Barnett, A. Presley, M. Johnson, and D. Liles, “An architecture for the virtual enterprise,”
in IEEE International Conference on Systems, Man, and Cybernetics, vol. 1, Oct 1994, pp.
506–511.
[59] A. Barros, K. Duddy, M. Lawley, Z. Milosevic, K. Raymond, and A. Wood, “Processes, roles,
and events: UML concepts for enterprise architecture,” in UML 2000–The Unified ModelingLanguage, vol. 1939/2000. Springer, January 2000, pp. 62–77.
[60] P. Bernus, “Enterprise models for enterprise architecture and ISO9000:2000,” Annual Re-views in Control, vol. 27, no. 2, pp. 211 – 220, 2003.
[61] M. Boster, S. Liu, and R. Thomas, “Getting the most from your enterprise architecture,” ITProfessional, vol. 2, no. 4, pp. 43–51, Jul/Aug 2000.
[62] C. Braun and R. Winter, “A comprehensive enterprise architecture metamodel and its imple-
mentation using a metamodeling platform,” in Proc. of the Workshop in Enterprise Modellingand Information Systems Architectures. EMISA, 2005, pp. 64–79.
[63] M. R. Davoudi and F. S. Aliee, “A New AHP-based Approach towards Enterprise Architec-
ture Quality Attribute Analysis,” in Proc. 3rd International Conference on Research Chal-lenges in Information Science (RCIS), Fès, Morocco, Apr. 2009.
[64] A. Ernst, J. Lankes, C. Schweda, and A. Wittenburg, “Tool support for enterprise architecture
management-strengths and weaknesses,” in 10th IEEE International Enterprise DistributedObject Computing Conference, 2006, pp. 13–22.
BIBLIOGRAPHY 31
[65] U. Frank, “Perspective enterprise modeling (MEMO) - conceptual framework and modeling
languages,” in Proceedings of 35th Hawaii International Conference on System Sciences,
2002.
[66] U. Franke, W. R. Flores, and P. Johnson, “Enterprise architecture dependency analysis using
fault trees and bayesian networks,” in Proc. 42nd Annual Simulation Symposium (ANSS),www.scs.org, Mar. 2009, pp. 209–216.
[67] R. Foorthuis, S. Brinkkemper, and R. Bos, “An artifact model for projects conforming to
enterprise architecture,” in Proceedings of the First Practice of Enterprise Modeling (PoEM)conference. Springer, November 2008.
[68] P. Gustafsson, D. Höök, E. Ericsson, and J. Lilliesköld, “Analyzing IT impacts on organiza-
tionl structure – a case study,” in Portland International Center for Management of Engineer-ing and Technology (PICMET) Conference Proceedings, Aug. 2009.
[69] K. Hjort-Madsen, “Enterprise architecture implementation and management: A case study
on interoperability,” in Proceedings of the 39th Annual Hawaii International Conference onSystem Sciences, vol. 4, Jan. 2006.
[70] J. Hoogervorst, “Enterprise architecture: enabling integration, agility and change,” in Inter-national Journal of Cooperative Information Systems, vol. 13, no. 3, September 2004, pp.
213–233.
[71] J. Huschens and M. Rumpold-Preining, “IBM Insurance Application Architecture (IAA) - An
overview of the Insurance Business Architecture,” Handbook on Architectures of InformationSystems, vol. 2, pp. 669–692, 2006.
[72] D. Höök, L. Nordström, and P. Johnson, “An enterprise architecture based method for quan-
tified analysis of ICT system impact on maintenance management,” in ICOMS Asset Man-agement Conference Proceedings, Jun. 2009.
[73] B. Iyer and R. M. Gottlieb, “The four-domain architecture: an approach to support enterprise
architecture design,” IBM Systems Journal, vol. 43, no. 3, pp. 587–597, 2004.
[74] M. Janssen and K. Hjort-Madsen, “Analyzing enterprise architecture in national govern-
ments: The cases of denmark and the netherlands,” in Proc. of the 40th Annual HawaiiInternational Conference on System Sciences, Jan. 2007.
[75] P. Johannesson, B. Andersson, M. Bergholtz, and H. Weigand, “Enterprise modeling for value
based service analysis,” in Proceedings of the First Practice of Enterprise Modeling (PoEM)conference. Springer, November 2008.
[76] H. Jonkers, R. van Burren, F. Arbab, F. de Boer, M. Bonsangue, H. Bosma, H. ter Doest,
L. Groenewegen, J. Scholten, S. Hoppenbrouwers, M.-E. Iacob, W. Janssen, M. Lankhorst,
D. van Leeuwen, E. Proper, A. Stam, L. van der Torre, and G. van Zanten, “Towards a
language for coherent enterprise architecture descriptions,” in Proceedings of the SeventhIEEE International Enterprise Distributed Object Computing Conference, Sept. 2003, pp.
28–37.
[77] J. König and L. Nordström, “Assessing impact of ICT system quality on operation of active
distribution grids,” in IEEE PowerTech, Jul. 2009.
[78] O. Noran, “An analysis of the Zachman framework for enterprise architecture from the
GERAM perspective,” in Annual Reviews in Control. Elsevier, 2003.
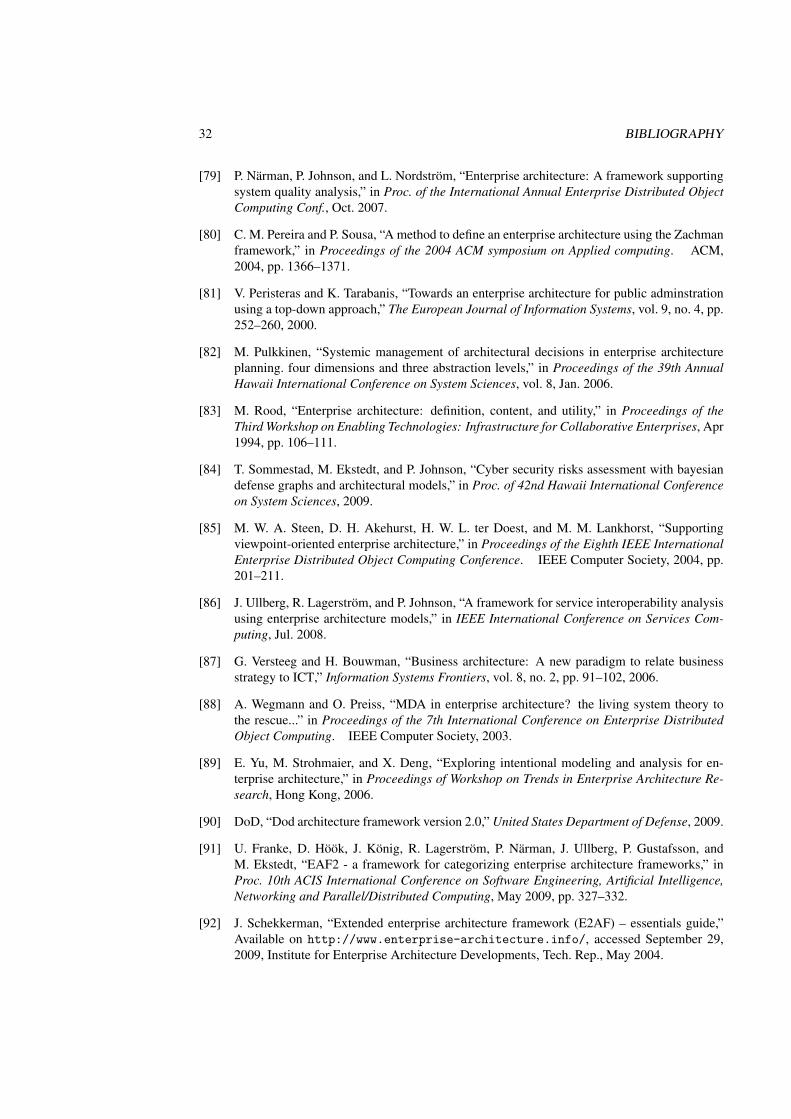
32 BIBLIOGRAPHY
[79] P. Närman, P. Johnson, and L. Nordström, “Enterprise architecture: A framework supporting
system quality analysis,” in Proc. of the International Annual Enterprise Distributed ObjectComputing Conf., Oct. 2007.
[80] C. M. Pereira and P. Sousa, “A method to define an enterprise architecture using the Zachman
framework,” in Proceedings of the 2004 ACM symposium on Applied computing. ACM,
2004, pp. 1366–1371.
[81] V. Peristeras and K. Tarabanis, “Towards an enterprise architecture for public adminstration
using a top-down approach,” The European Journal of Information Systems, vol. 9, no. 4, pp.
252–260, 2000.
[82] M. Pulkkinen, “Systemic management of architectural decisions in enterprise architecture
planning. four dimensions and three abstraction levels,” in Proceedings of the 39th AnnualHawaii International Conference on System Sciences, vol. 8, Jan. 2006.
[83] M. Rood, “Enterprise architecture: definition, content, and utility,” in Proceedings of theThird Workshop on Enabling Technologies: Infrastructure for Collaborative Enterprises, Apr
1994, pp. 106–111.
[84] T. Sommestad, M. Ekstedt, and P. Johnson, “Cyber security risks assessment with bayesian
defense graphs and architectural models,” in Proc. of 42nd Hawaii International Conferenceon System Sciences, 2009.
[85] M. W. A. Steen, D. H. Akehurst, H. W. L. ter Doest, and M. M. Lankhorst, “Supporting
viewpoint-oriented enterprise architecture,” in Proceedings of the Eighth IEEE InternationalEnterprise Distributed Object Computing Conference. IEEE Computer Society, 2004, pp.
201–211.
[86] J. Ullberg, R. Lagerström, and P. Johnson, “A framework for service interoperability analysis
using enterprise architecture models,” in IEEE International Conference on Services Com-puting, Jul. 2008.
[87] G. Versteeg and H. Bouwman, “Business architecture: A new paradigm to relate business
strategy to ICT,” Information Systems Frontiers, vol. 8, no. 2, pp. 91–102, 2006.
[88] A. Wegmann and O. Preiss, “MDA in enterprise architecture? the living system theory to
the rescue...” in Proceedings of the 7th International Conference on Enterprise DistributedObject Computing. IEEE Computer Society, 2003.
[89] E. Yu, M. Strohmaier, and X. Deng, “Exploring intentional modeling and analysis for en-
terprise architecture,” in Proceedings of Workshop on Trends in Enterprise Architecture Re-search, Hong Kong, 2006.
[90] DoD, “Dod architecture framework version 2.0,” United States Department of Defense, 2009.
[91] U. Franke, D. Höök, J. König, R. Lagerström, P. Närman, J. Ullberg, P. Gustafsson, and
M. Ekstedt, “EAF2 - a framework for categorizing enterprise architecture frameworks,” in
Proc. 10th ACIS International Conference on Software Engineering, Artificial Intelligence,Networking and Parallel/Distributed Computing, May 2009, pp. 327–332.
[92] J. Schekkerman, “Extended enterprise architecture framework (E2AF) – essentials guide,”
Available on http://www.enterprise-architecture.info/, accessed September 29,
2009, Institute for Enterprise Architecture Developments, Tech. Rep., May 2004.
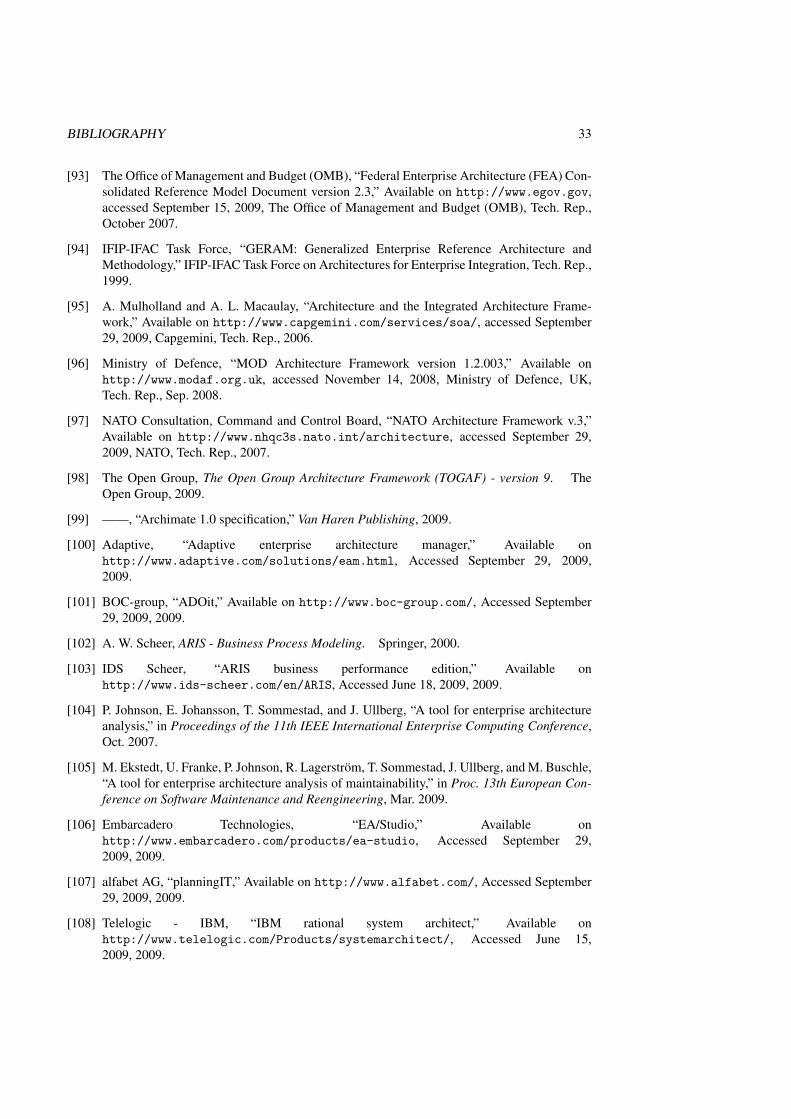
BIBLIOGRAPHY 33
[93] The Office of Management and Budget (OMB), “Federal Enterprise Architecture (FEA) Con-
solidated Reference Model Document version 2.3,” Available on http://www.egov.gov,
accessed September 15, 2009, The Office of Management and Budget (OMB), Tech. Rep.,
October 2007.
[94] IFIP-IFAC Task Force, “GERAM: Generalized Enterprise Reference Architecture and
Methodology,” IFIP-IFAC Task Force on Architectures for Enterprise Integration, Tech. Rep.,
1999.
[95] A. Mulholland and A. L. Macaulay, “Architecture and the Integrated Architecture Frame-
work,” Available on http://www.capgemini.com/services/soa/, accessed September
29, 2009, Capgemini, Tech. Rep., 2006.
[96] Ministry of Defence, “MOD Architecture Framework version 1.2.003,” Available on
http://www.modaf.org.uk, accessed November 14, 2008, Ministry of Defence, UK,
Tech. Rep., Sep. 2008.
[97] NATO Consultation, Command and Control Board, “NATO Architecture Framework v.3,”
Available on http://www.nhqc3s.nato.int/architecture, accessed September 29,
2009, NATO, Tech. Rep., 2007.
[98] The Open Group, The Open Group Architecture Framework (TOGAF) - version 9. The
Open Group, 2009.
[99] ——, “Archimate 1.0 specification,” Van Haren Publishing, 2009.
[100] Adaptive, “Adaptive enterprise architecture manager,” Available on
http://www.adaptive.com/solutions/eam.html, Accessed September 29, 2009,
2009.
[101] BOC-group, “ADOit,” Available on http://www.boc-group.com/, Accessed September
29, 2009, 2009.
[102] A. W. Scheer, ARIS - Business Process Modeling. Springer, 2000.
[103] IDS Scheer, “ARIS business performance edition,” Available on
http://www.ids-scheer.com/en/ARIS, Accessed June 18, 2009, 2009.
[104] P. Johnson, E. Johansson, T. Sommestad, and J. Ullberg, “A tool for enterprise architecture
analysis,” in Proceedings of the 11th IEEE International Enterprise Computing Conference,
Oct. 2007.
[105] M. Ekstedt, U. Franke, P. Johnson, R. Lagerström, T. Sommestad, J. Ullberg, and M. Buschle,
“A tool for enterprise architecture analysis of maintainability,” in Proc. 13th European Con-ference on Software Maintenance and Reengineering, Mar. 2009.
[106] Embarcadero Technologies, “EA/Studio,” Available on
http://www.embarcadero.com/products/ea-studio, Accessed September 29,
2009, 2009.
[107] alfabet AG, “planningIT,” Available on http://www.alfabet.com/, Accessed September
29, 2009, 2009.
[108] Telelogic - IBM, “IBM rational system architect,” Available on
http://www.telelogic.com/Products/systemarchitect/, Accessed June 15,
2009, 2009.
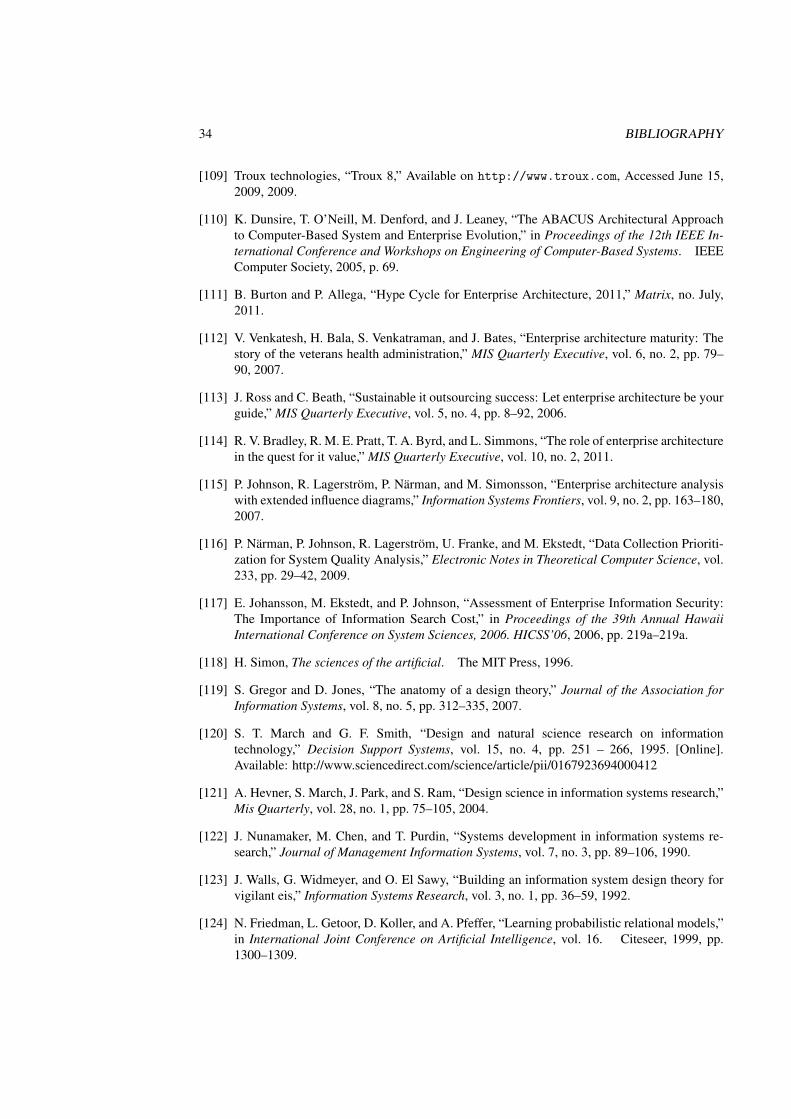
34 BIBLIOGRAPHY
[109] Troux technologies, “Troux 8,” Available on http://www.troux.com, Accessed June 15,
2009, 2009.
[110] K. Dunsire, T. O’Neill, M. Denford, and J. Leaney, “The ABACUS Architectural Approach
to Computer-Based System and Enterprise Evolution,” in Proceedings of the 12th IEEE In-ternational Conference and Workshops on Engineering of Computer-Based Systems. IEEE
Computer Society, 2005, p. 69.
[111] B. Burton and P. Allega, “Hype Cycle for Enterprise Architecture, 2011,” Matrix, no. July,
2011.
[112] V. Venkatesh, H. Bala, S. Venkatraman, and J. Bates, “Enterprise architecture maturity: The
story of the veterans health administration,” MIS Quarterly Executive, vol. 6, no. 2, pp. 79–
90, 2007.
[113] J. Ross and C. Beath, “Sustainable it outsourcing success: Let enterprise architecture be your
guide,” MIS Quarterly Executive, vol. 5, no. 4, pp. 8–92, 2006.
[114] R. V. Bradley, R. M. E. Pratt, T. A. Byrd, and L. Simmons, “The role of enterprise architecture
in the quest for it value,” MIS Quarterly Executive, vol. 10, no. 2, 2011.
[115] P. Johnson, R. Lagerström, P. Närman, and M. Simonsson, “Enterprise architecture analysis
with extended influence diagrams,” Information Systems Frontiers, vol. 9, no. 2, pp. 163–180,
2007.
[116] P. Närman, P. Johnson, R. Lagerström, U. Franke, and M. Ekstedt, “Data Collection Prioriti-
zation for System Quality Analysis,” Electronic Notes in Theoretical Computer Science, vol.
233, pp. 29–42, 2009.
[117] E. Johansson, M. Ekstedt, and P. Johnson, “Assessment of Enterprise Information Security:
The Importance of Information Search Cost,” in Proceedings of the 39th Annual HawaiiInternational Conference on System Sciences, 2006. HICSS’06, 2006, pp. 219a–219a.
[118] H. Simon, The sciences of the artificial. The MIT Press, 1996.
[119] S. Gregor and D. Jones, “The anatomy of a design theory,” Journal of the Association forInformation Systems, vol. 8, no. 5, pp. 312–335, 2007.
[120] S. T. March and G. F. Smith, “Design and natural science research on information
technology,” Decision Support Systems, vol. 15, no. 4, pp. 251 – 266, 1995. [Online].
Available: http://www.sciencedirect.com/science/article/pii/0167923694000412
[121] A. Hevner, S. March, J. Park, and S. Ram, “Design science in information systems research,”
Mis Quarterly, vol. 28, no. 1, pp. 75–105, 2004.
[122] J. Nunamaker, M. Chen, and T. Purdin, “Systems development in information systems re-
search,” Journal of Management Information Systems, vol. 7, no. 3, pp. 89–106, 1990.
[123] J. Walls, G. Widmeyer, and O. El Sawy, “Building an information system design theory for
vigilant eis,” Information Systems Research, vol. 3, no. 1, pp. 36–59, 1992.
[124] N. Friedman, L. Getoor, D. Koller, and A. Pfeffer, “Learning probabilistic relational models,”
in International Joint Conference on Artificial Intelligence, vol. 16. Citeseer, 1999, pp.
1300–1309.
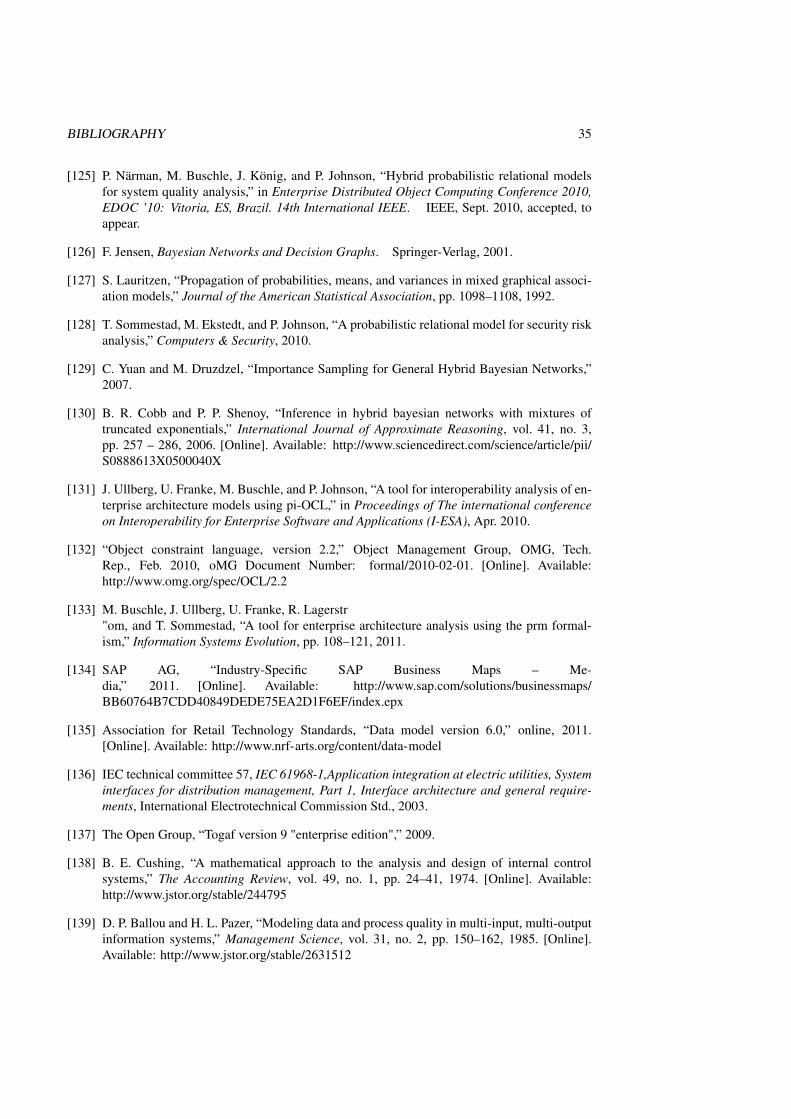
BIBLIOGRAPHY 35
[125] P. Närman, M. Buschle, J. König, and P. Johnson, “Hybrid probabilistic relational models
for system quality analysis,” in Enterprise Distributed Object Computing Conference 2010,EDOC ’10: Vitoria, ES, Brazil. 14th International IEEE. IEEE, Sept. 2010, accepted, to
appear.
[126] F. Jensen, Bayesian Networks and Decision Graphs. Springer-Verlag, 2001.
[127] S. Lauritzen, “Propagation of probabilities, means, and variances in mixed graphical associ-
ation models,” Journal of the American Statistical Association, pp. 1098–1108, 1992.
[128] T. Sommestad, M. Ekstedt, and P. Johnson, “A probabilistic relational model for security risk
analysis,” Computers & Security, 2010.
[129] C. Yuan and M. Druzdzel, “Importance Sampling for General Hybrid Bayesian Networks,”
2007.
[130] B. R. Cobb and P. P. Shenoy, “Inference in hybrid bayesian networks with mixtures of
truncated exponentials,” International Journal of Approximate Reasoning, vol. 41, no. 3,
pp. 257 – 286, 2006. [Online]. Available: http://www.sciencedirect.com/science/article/pii/
S0888613X0500040X
[131] J. Ullberg, U. Franke, M. Buschle, and P. Johnson, “A tool for interoperability analysis of en-
terprise architecture models using pi-OCL,” in Proceedings of The international conferenceon Interoperability for Enterprise Software and Applications (I-ESA), Apr. 2010.
[132] “Object constraint language, version 2.2,” Object Management Group, OMG, Tech.
Rep., Feb. 2010, oMG Document Number: formal/2010-02-01. [Online]. Available:
http://www.omg.org/spec/OCL/2.2
[133] M. Buschle, J. Ullberg, U. Franke, R. Lagerstr
"om, and T. Sommestad, “A tool for enterprise architecture analysis using the prm formal-
ism,” Information Systems Evolution, pp. 108–121, 2011.
[134] SAP AG, “Industry-Specific SAP Business Maps – Me-
dia,” 2011. [Online]. Available: http://www.sap.com/solutions/businessmaps/
BB60764B7CDD40849DEDE75EA2D1F6EF/index.epx
[135] Association for Retail Technology Standards, “Data model version 6.0,” online, 2011.
[Online]. Available: http://www.nrf-arts.org/content/data-model
[136] IEC technical committee 57, IEC 61968-1,Application integration at electric utilities, Systeminterfaces for distribution management, Part 1, Interface architecture and general require-ments, International Electrotechnical Commission Std., 2003.
[137] The Open Group, “Togaf version 9 "enterprise edition",” 2009.
[138] B. E. Cushing, “A mathematical approach to the analysis and design of internal control
systems,” The Accounting Review, vol. 49, no. 1, pp. 24–41, 1974. [Online]. Available:
http://www.jstor.org/stable/244795
[139] D. P. Ballou and H. L. Pazer, “Modeling data and process quality in multi-input, multi-output
information systems,” Management Science, vol. 31, no. 2, pp. 150–162, 1985. [Online].
Available: http://www.jstor.org/stable/2631512

36 BIBLIOGRAPHY
[140] M. Stamatelatos, W. Vesely, J. Dugan, J. Fragola, J. Minarick, and
J. Railsback, “Fault tree handbook with aerospace applications,” 2002,
http://www.hq.nasa.gov/office/codeq/doctree/fthb.pdf.
[141] J. Buzen, “Computational algorithms for closed queueing networks with exponential
servers,” Communications of the ACM, vol. 16, no. 9, pp. 527–531, 1973.
[142] M. Iacob and H. Jonkers, “Quantitative analysis of service-oriented architectures,” Interna-tional Journal of Enterprise Information Systems, vol. 3, no. 1, pp. 42–60, 2007.
[143] ——, “Quantitative analysis of enterprise architectures,” Interoperability of Enterprise Soft-ware and Applications, pp. 239–252, 2006.
[144] M.-E. Iacob and H. Jonkers, “Analysis of enterprise architectures,” Telematica Instituut (TI)„
Tech. Rep., 2004.
[145] M. Lankhorst, Enterprise architecture at work: Modelling, communication and analysis.
Springer-Verlag GmbH, 2009.
[146] F. D. Davis, “Perceived usefulness, perceived ease of use, and user acceptance of information
technology,” MIS Quarterly, vol. 13, no. 3, pp. 319–340, 1989. [Online]. Available:
http://www.jstor.org/stable/249008
[147] M. Dishaw and D. Strong, “Supporting software maintenance with software engineering
tools: A computed task-technology fit analysis,” Journal of Systems and Software, vol. 44,
no. 2, pp. 107–120, 1998.
[148] ——, “Extending the technology acceptance model with task-technology fit constructs,” In-formation & Management, vol. 36, no. 1, pp. 9–21, 1999.
[149] P. Checkland and S. Holwell, “Action research,” Information Systems Action Research, pp.
3–17, 2007.
[150] R. K. Yin, Case study research: Design and Methods. Washington D.C.: SAGE Publica-
tions, 2003.
[151] P. Järvinen, “Action research is similar to design science,” Quality & Quantity, vol. 41, no. 1,
pp. 37–54, 2007.
[152] R. Baskerville, “What design science is not,” European Journal of Information Systems,
vol. 17, no. 5, pp. 441–443, 2008.
[153] I. O. for Standardization, “Iso/iec 42010:2007 - systems and software engineering – recom-
mended practice for architectural description of software-intensive systems,” JTC 1/SC 7 -Software and systems engineering, 2007.
[154] K. Smit and W. Slaterus, Information Model for Maintenance Management (IMMM). Cap
Gemini Publishing, 1992.
[155] K. Johansson, Driftsäkerhet och underhåll. Studentlitteratur, 1997.
[156] J. Woodhouse, “Putting the total jigsaw puzzle together: PAS 55 standard for the integrated,
optimized management of assets,” in International Maintenance Conference, 2006.

BIBLIOGRAPHY 37
[157] M. Kans and A. Ingwald, “Analysing it functionality gaps for maintenance management,”
in Proceedings of the 4th World Congress of Engineering Asset Management (WCEAM)2009 : Engineering Asset Lifecycle Management, 2009, the original pulication is available at
www.springerlink.com.
[158] J. Ullberg, R. Lagerström, and P. Johnson, “A framework for service interoperability analysis
using enterprise architecture models,” in IEEE International Conference on Services Com-puting, 2008.
[159] M. Gammelgård, M. Ekstedt, and P. Naärman, “A method for assessing the business value
of information system scenarios with an estimated credibility of the result,” InternationalJournal of Services Technology and Management, vol. 13, no. 1, pp. 105–133, 2010.
[160] C. Glazner, “Understanding enterprise behavior using hybrid simulation of enterprise archi-
tecture,” Ph.D. dissertation, Massachusetts Institute of Technology, 2009.
[161] F. De Boer, M. Bonsangue, J. Jacob, A. Stam, and L. Van der Torre, “Enterprise architecture
analysis with xml,” in System Sciences, 2005. HICSS’05. Proceedings of the 38th AnnualHawaii International Conference on. IEEE, 2005, p. 222b.
[162] A. Ernst, “Enterprise architecture management patterns,” in Proceedings of the 15th Confer-ence on Pattern Languages of Programs. ACM, 2008, p. 7.
[163] A. Sasa and M. Krisper, “Enterprise architecture patterns for business process support analy-
sis,” Journal of Systems and Software, 2011.
[164] E. Yu, M. Strohmaier, and X. Deng, “Exploring intentional modeling and analysis for en-
terprise architecture,” in Enterprise Distributed Object Computing Conference Workshops,2006. EDOCW’06. 10th IEEE International. IEEE, 2006, pp. 32–32.
[165] M. Razavi, F. Shams Aliee, and K. Badie, “An ahp-based approach toward enterprise archi-
tecture analysis based on enterprise architecture quality attributes,” Knowledge and Informa-tion Systems, vol. 28, no. 2, pp. 449–472, 2011.
[166] J. Addicks and U. Steffens, “Supporting landscape dependent evaluation of enterprise appli-
cations,” in Multikonferenz Wirtschaftsinformatik, 2008, pp. 1815–1825.
[167] M. Klein, R. Kazman, L. Bass, J. Carriere, M. Barbacci, and H. Lipson, “Attribute-based
architecture styles,” in Software architecture: TC2 first Working IFIP Conference on SoftwareArchitecture (WICSA1): 22-24 February 1999, San Antonio, Texas, USA. Kluwer Academic
Pub, 1999, p. 225.
[168] K. Barber, T. Graser, and J. Holt, “Enabling iterative software architecture derivation using
early non-functional property evaluation,” 2002.
[169] P. Bengtsson and J. Bosch, “Scenario-based software architecture reengineering,” in SoftwareReuse, 1998. Proceedings. Fifth International Conference on. IEEE, 2002, pp. 308–317.
[170] S. Buckl, A. Ernst, F. Matthes, and C. Schweda, “An Information Model for Land-
scape Management–Discussing Temporality Aspects,” Proceedings of the Service-OrientedComputing–ICSOC 2008 Workshops, pp. 363–374, 2009.
[171] G. Riempp and S. Gieffers-Ankel, “Application portfolio management: a decision-oriented
view of enterprise architecture,” Information Systems and E-Business Management, vol. 5,
no. 4, pp. 359–378, 2007.
38 BIBLIOGRAPHY
[172] D. Simon, K. Fischbach, and D. Schoder, “Application portfolio management – an integrated
framework and a software tool evaluation approach,” Communications of the Association forInformation Systems, vol. 26, no. 1, p. 3, 2010.
[173] W.-L. Wang, D. Pan, and M.-H. Chen, “Architecture-based software reliability
modeling,” Journal of Systems and Software, vol. 79, no. 1, pp. 132 – 146, 2006.
[Online]. Available: http://www.sciencedirect.com/science/article/B6V0N-4HCMS6Y-1/2/
f03a4ed3a74f4121c3e6588eed4f24e7
[174] W. Wang, Y. Wu, and M. Chen, “An architecture-based software reliability model,” in De-pendable Computing, 1999. Proceedings. 1999 Pacific Rim International Symposium on.
IEEE, 2002, pp. 143–150.
[175] R. Reussner, H. Schmidt, and I. Poernomo, “Reliability prediction for component-based soft-
ware architectures,” Journal of Systems and Software, vol. 66, no. 3, pp. 241–252, 2003.
[176] S. Yacoub, B. Cukic, and H. Ammar, “A scenario-based reliability analysis approach for
component-based software,” Reliability, IEEE Transactions on, vol. 53, no. 4, pp. 465 – 480,
dec. 2004.
[177] V. Cortellessa, H. Singh, and B. Cukic, “Early reliability assessment of uml based software
models,” in WOSP ’02: Proceedings of the 3rd international workshop on Software andperformance. New York, NY, USA: ACM, 2002, pp. 302–309.
[178] J. Laprie and K. Kanoun, “X-ware reliability and availability modeling,” Software Engineer-ing, IEEE Transactions on, vol. 18, no. 2, pp. 130–147, 2002.
[179] C. Leangsuksun, L. Shen, T. Liu, H. Song, and S. Scott, “Availability prediction and model-
ing of high mobility OSCAR cluster,” in Cluster Computing, 2003. Proceedings. 2003 IEEEInternational Conference on. IEEE, 2005, pp. 380–386.
[180] J. Ledoux, “Availability modeling of modular software,” Reliability, IEEE Transactions on,
vol. 48, no. 2, pp. 159–168, 2002.
[181] M. Jaeger, G. Rojec-Goldmann, and M. Gero, “Qos aggregation in web service composi-
tions,” 2005.
[182] G. Rodrigues, D. Rosenblum, and S. Uchitel, “Using scenarios to predict the
reliability of concurrent component-based software systems,” Lecture Notes in ComputerScience, vol. 3442, pp. 111–126, 2005. [Online]. Available: http://dx.doi.org/10.1007/
978-3-540-31984-9_9
[183] J. Raderius, P. Närman, and M. Ekstedt, “Assessing System Availability Using an Enterprise
Architecture Analysis Approach,” in Proceedings of 3rd Workshop on Trends in EnterpriseArchitecture Research (TEAR 2008), Sydney, Australia. Springer, 2009.
[184] O. Holschke, P. Närman, W. Flores, E. Eriksson, and M. Schönherr, “Using enterprise archi-
tecture models and bayesian belief networks for failure impact analysis,” in Service-OrientedComputing–ICSOC 2008 Workshops. Springer, 2009, pp. 339–350.
[185] S. Buckl, U. Franke, O. Holschke, F. Matthes, C. Schweda, T. Sommestad, and J. Ullberg,
“A pattern-based approach to quantitative enterprise architecture analysis,” in 15th AmericasConference on Information Systems (AMCIS). Association for Information Systems, 2009.
BIBLIOGRAPHY 39
[186] U. Franke, W. R. Flores, and P. Johnson, “Enterprise architecture dependency analysis using
fault trees and bayesian networks,” 42nd Annual Simulation Symposium (ANSS), 2009.
[187] U. Franke, P. Johnson, E. Ericsson, W. R. Flores, and K. Zhu, “Enterprise architecture anal-
ysis using fault trees and MODAF,” in Proc. CAiSE Forum 2009, vol. 453, Jun. 2009, pp.
61–66, iSSN 1613-0073.
[188] R. Jain, The art of computer systems performance analysis : techniques for experimentaldesign, measurement, simulation, and modeling. New York: Wiley, 1991.
[189] D. Montgomery, Design and analysis of experiments. Wiley New York, 1991.
[190] M. de Miguel, T. Lambolais, M. Hannouz, S. Betgé-Brezetz, and S. Piekarec, “UML exten-
sions for the specification and evaluation of latency constraints in architectural models,” in
Proceedings of the 2nd international workshop on Software and performance. ACM, 2000,
pp. 83–88.
[191] P. Buchholz, “A class of hierarchical queueing networks and their analysis,” Queueing Sys-tems, vol. 15, no. 1, pp. 59–80, 1994.
[192] J. Buzen, “Fundamental operational laws of computer system performance,” Acta Informat-ica, vol. 7, no. 2, pp. 167–182, 1976.
[193] M. Reiser and S. Lavenberg, “Mean-value analysis of closed multichain queuing networks,”
Journal of the ACM (JACM), vol. 27, no. 2, pp. 313–322, 1980.
[194] S. Lam and Y. Lien, “A tree convolution algorithm for the solution of queueing networks,”
Communications of the ACM, vol. 26, no. 3, p. 215, 1983.
[195] C. Smith and L. Williams, Performance Solutions: a practical guide to creating responsive,scalable software. Addison-Wesley Boston, MA;, 2002.
[196] D. Petriu and X. Wang, “From uml descriptions of high-level software architectures to lqn
performance models,” Applications of Graph Transformations with Industrial Relevance, pp.
217–221, 2000.
[197] W. Van der Aalst and K. Van Hee, “Business process redesign: a Petri-net-based approach,”
Computers in Industry, vol. 29, no. 1-2, pp. 15–26, 1996.
[198] P. Harrison and N. Patel, Performance Modelling of Communication Networks and ComputerArchitectures (International Computer S. Addison-Wesley Longman Publishing Co., Inc.
Boston, MA, USA, 1992.
[199] S. Demathieu, F. Thomas, C. André, S. Gérard, and F. Terrier, “First experiments using the
uml profile for marte,” in Object Oriented Real-Time Distributed Computing (ISORC), 200811th IEEE International Symposium on. IEEE, 2008, pp. 50–57.
[200] R. Wang, M. Ziad, and Y. Lee, Data quality. Kluwer Academic Pub, 2001.
[201] Y. W. Lee, L. L. Pipino, J. D. Funk, and R. Y. Wang, Journey to data quality. Cambridge,
Mass.: MIT Press, 2006.
[202] R. Y. Wang, Information quality. Armonk, N. Y.: M. E. Sharpe, 2005.
[203] S. Kurpjuweit and R. Winter, “Viewpoint-based meta model engineering,” EMISA 2007, p.
143, 2007.