ensuring the fairness of gre writing prompts: assessing ... · ensuring the fairness of gre writing...
TRANSCRIPT
July 2005
GRE Board Report No. 02-07R ETS RR-05-11
Markus Broer Yong-Won Lee
Saba Rizavi Don Powers
Ensuring the Fairness of GRE Writing Prompts: Assessing
Differential Difficulty
GRE®
R E S E A R C H R E P O R T


Ensuring the Fairness of GRE Writing Prompts:
Assessing Differential Difficulty
Markus Broer
Supreme Education Council of Qatar, Qatar
Yong-Won Lee, Saba Rizavi, and Don Powers
ETS, Princeton, NJ
GRE Board Research Report No. 02-07R
ETS RR-05-11
July 2005
The report presents the findings of a research project funded by and carried out under the auspices of the Graduate
Record Examinations Board.
Educational Testing Service, Princeton, NJ 08541
*********************
Researchers are encouraged to express freely their professional judgment. Therefore, points of view or opinions stated in Graduate Record Examinations Board reports do no necessarily represent official Graduate Record Examinations
Board position or policy.
The Graduate Record Examinations and ETS are dedicated to the principle of equal opportunity, and their programs, services,
and employment policies are guided by that principle.
*********************
As part of its educational and social mission and in fulfilling the organization's non-profit Charter and Bylaws, ETS has and continues to learn from and also to lead research that furthers educational and measurement research to advance quality and
equity in education and assessment for all users of the organization's products and services.
EDUCATIONAL TESTING SERVICE, ETS, the ETS logos, GRADUATE RECORD EXAMINATIONS, GRE, and
TOEFL are registered trademarks of Educational Testing Service. The TEST OF ENGLISH AS A FOREIGN
LANGUAGE is a trademark of Educational Testing Service. Advanced Placement Program, AP, and SAT are registered
trademarks of the College Board Entrance Examination Board.
Educational Testing Service Princeton, NJ 08541
Copyright © 2005 by Educational Testing Service. All rights reserved.
Abstract
Three polytomous DIF detection techniques — the Mantel test, logistic regression, and
polySTAND — were used to identify GRE® Analytical Writing prompts (“Issue” and
“Argument”) that are differentially difficult for (a) female test takers; (b) African American,
Asian, and Hispanic test takers; and (c) test takers whose strongest language skills are in a
language other than English. Prompts in the gender comparison showed low differential item
functioning (DIF) values. Higher DIF values were found in the White versus African American
comparison (for Argument prompts), while a smaller number of prompts showed moderate DIF
to the disadvantage of the Hispanic (for Argument prompts), Asian American (for Issue
prompts), and English as a second language groups (for Issue prompts). No DIF values were
found that were large enough to warrant the removal of prompts from the item pool. Several
potential causes of high DIF values for some prompts are discussed with respect to the content
characteristics of these prompts.
Key words: ESL, ethnic minorities, gender, GRE, item characteristics, polytomous DIF, prompts,
writing assessment
i
Acknowledgments
We would like to thank Ourania Rotou for preparing the GRE dataset; John Willey for carrying
out the statistical analysis for the Mantel test; Youn-Hee Lim for assisting us in preparing the
datasets for logistic regression analysis; Mary Fowles and Cynthia Welsh for their help regarding
the GRE prompt characteristics and the prompt review; Cecilia Rosenblum, Marlene Mujica-Fill,
Sylvia Ledesma, Pablo Garcia Gomez, Luis Saldivia, Jean Williams, Mel Kubota, and Jennifer
Bivens-Tatum for reviewing prompt characteristics in the ethnic minority group comparisons;
and Paul Holland, John Donoghue, Neil Dorans, and Steve Sireci for their advice on DIF
techniques.
ii
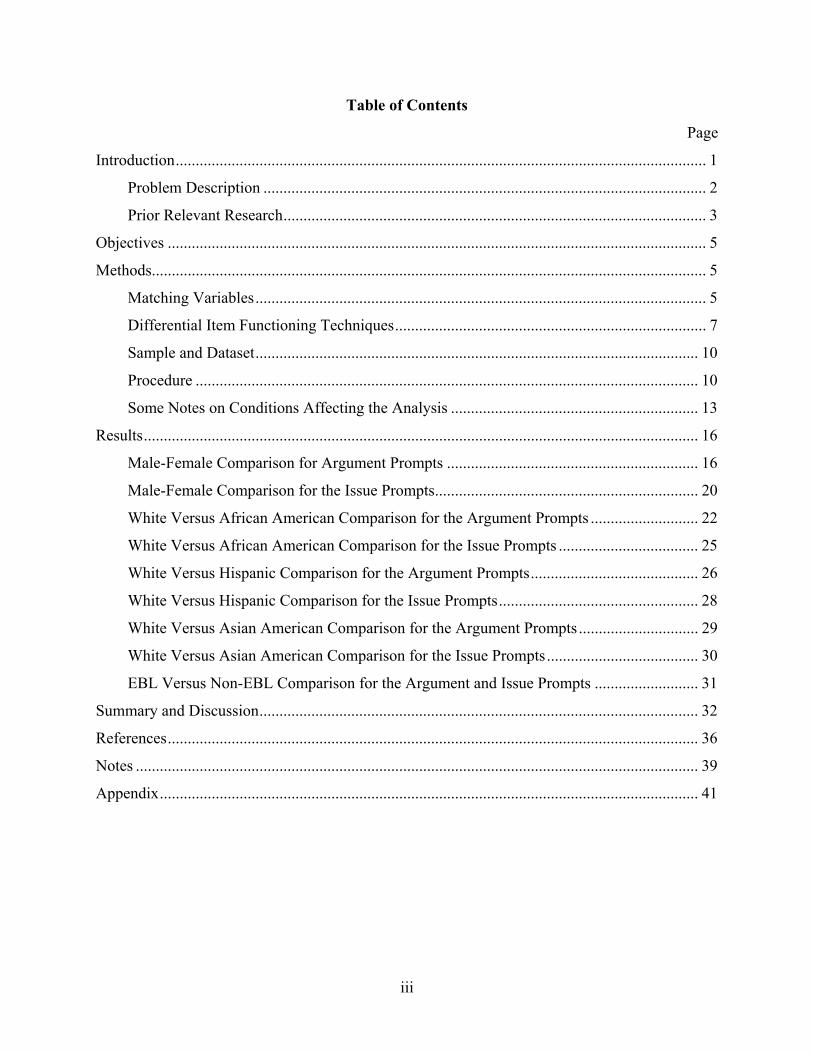
Table of Contents
Page
Introduction..................................................................................................................................... 1
Problem Description ............................................................................................................... 2
Prior Relevant Research.......................................................................................................... 3
Objectives ....................................................................................................................................... 5
Methods........................................................................................................................................... 5
Matching Variables................................................................................................................. 5
Differential Item Functioning Techniques.............................................................................. 7
Sample and Dataset............................................................................................................... 10
Procedure .............................................................................................................................. 10
Some Notes on Conditions Affecting the Analysis .............................................................. 13
Results........................................................................................................................................... 16
Male-Female Comparison for Argument Prompts ............................................................... 16
Male-Female Comparison for the Issue Prompts.................................................................. 20
White Versus African American Comparison for the Argument Prompts ........................... 22
White Versus African American Comparison for the Issue Prompts ................................... 25
White Versus Hispanic Comparison for the Argument Prompts.......................................... 26
White Versus Hispanic Comparison for the Issue Prompts.................................................. 28
White Versus Asian American Comparison for the Argument Prompts.............................. 29
White Versus Asian American Comparison for the Issue Prompts...................................... 30
EBL Versus Non-EBL Comparison for the Argument and Issue Prompts .......................... 31
Summary and Discussion.............................................................................................................. 32
References..................................................................................................................................... 36
Notes ............................................................................................................................................. 39
Appendix....................................................................................................................................... 41
iii
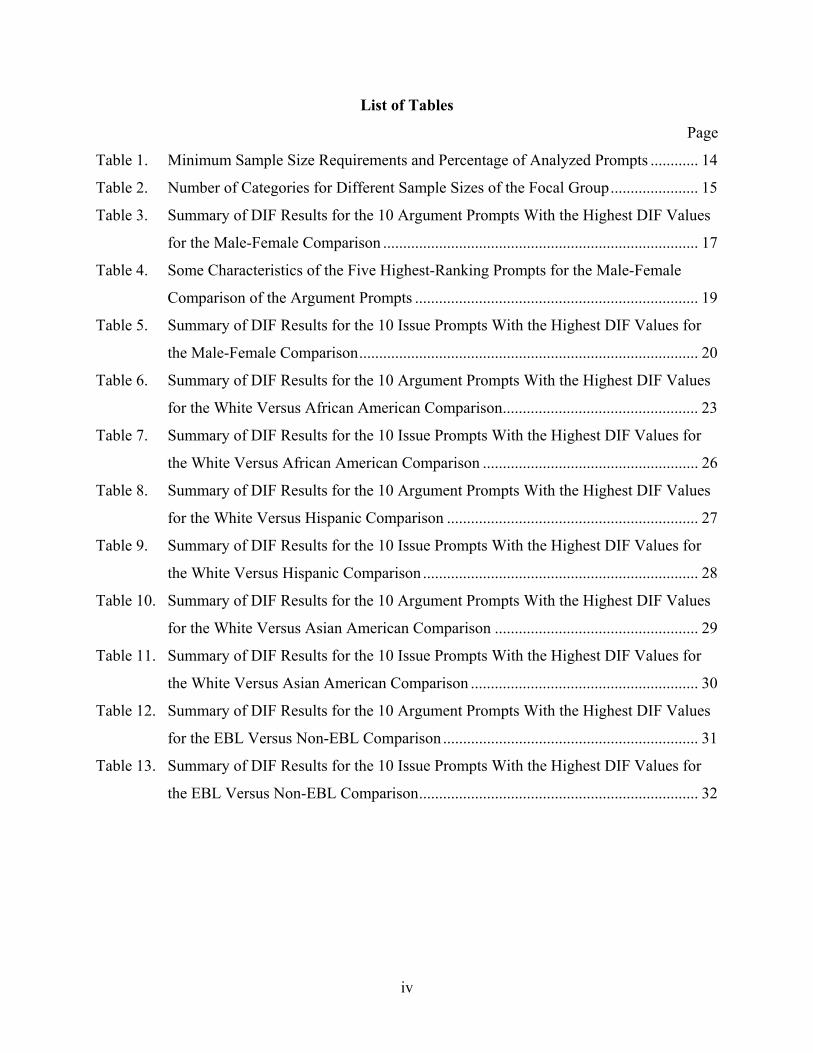
List of Tables
Page
Table 1. Minimum Sample Size Requirements and Percentage of Analyzed Prompts ............ 14
Table 2. Number of Categories for Different Sample Sizes of the Focal Group...................... 15
Table 3. Summary of DIF Results for the 10 Argument Prompts With the Highest DIF Values
for the Male-Female Comparison ............................................................................... 17
Table 4. Some Characteristics of the Five Highest-Ranking Prompts for the Male-Female
Comparison of the Argument Prompts ....................................................................... 19
Table 5. Summary of DIF Results for the 10 Issue Prompts With the Highest DIF Values for
the Male-Female Comparison..................................................................................... 20
Table 6. Summary of DIF Results for the 10 Argument Prompts With the Highest DIF Values
for the White Versus African American Comparison................................................. 23
Table 7. Summary of DIF Results for the 10 Issue Prompts With the Highest DIF Values for
the White Versus African American Comparison ...................................................... 26
Table 8. Summary of DIF Results for the 10 Argument Prompts With the Highest DIF Values
for the White Versus Hispanic Comparison ............................................................... 27
Table 9. Summary of DIF Results for the 10 Issue Prompts With the Highest DIF Values for
the White Versus Hispanic Comparison ..................................................................... 28
Table 10. Summary of DIF Results for the 10 Argument Prompts With the Highest DIF Values
for the White Versus Asian American Comparison ................................................... 29
Table 11. Summary of DIF Results for the 10 Issue Prompts With the Highest DIF Values for
the White Versus Asian American Comparison ......................................................... 30
Table 12. Summary of DIF Results for the 10 Argument Prompts With the Highest DIF Values
for the EBL Versus Non-EBL Comparison ................................................................ 31
Table 13. Summary of DIF Results for the 10 Issue Prompts With the Highest DIF Values for
the EBL Versus Non-EBL Comparison...................................................................... 32
iv
List of Figures
Page
Figure 1. Logistic regression of expected essay score per matching variable 1 score for an
argument prompt (A107). ...............................................................................................18
Figure 2. PolySTAND of observed essay score per matching variable 1 score for an argument
prompt (A107). ...............................................................................................................18
Figure 3. Logistic regression of expected essay score per matching variable 1 score for an
issue prompt (I35). ..........................................................................................................21
Figure 4. PolySTAND of observed essay score per matching variable 1 score for an issue
prompt (I35). ...................................................................................................................22
Figure 5. PolySTAND and impact values adjusted by their respective standard deviation for
all 79 prompts in the White versus African American comparison (in descending
order of polySTAND EZ values)....................................................................................24
v

Introduction
Direct assessments of writing skill (i.e., essay tests such as the GRE Analytical Writing
measure) have considerable appeal because, unlike their less direct, multiple-choice counterparts,
they actually require examinees to write, not merely to recognize the conventions of standard
written English. Along with their appeal, however, these tests carry a special burden that does
not encumber traditional multiple-choice tests. The trade-off is that direct writing assessments
typically require much more time per item and, as a result, typically contain far fewer items than
do multiple-choice measures. They have, in fact, sometimes been characterized as one-item (or
two-item) tests. This characterization is probably not entirely fair, as the elaborate responses
elicited by essay prompts are invariably richer than those yielded by typical multiple-choice
items.
Nonetheless, the point is well taken that much is demanded of a limited number of
questions. Because so much depends on so few questions, the “luck of the draw” comes into play
to a far greater extent for such assessments than it does for multiple-choice measures. Thus, it is
incumbent on test developers to craft essay prompts that are fair to all examinees and as
comparable to one another as possible. The hope is that no test taker will be unfairly
disadvantaged by being administered a prompt whose content is so unfamiliar or uninspiring as
to hinder the demonstration of analytical writing skills.
The GRE Program already does much to ensure the fairness of the Analytical Writing
measure. Currently, prospective test takers are assured that the measure is fair because:
In creating this assessment for the GRE Board, Educational Testing Service (ETS®)
[has] followed a rigorous test development process that was guided by faculty
committees representing different academic institutions, disciplines, and cultural
perspectives…. All topics have passed stringent reviews for fairness and, in national
field test trials, [have] proved accessible and appropriate for entry-level graduate
students across many disciplines and various cultural groups. Reading training and
scoring procedures were designed to ensure scoring accuracy, fairness, and reliability,
and and to enhance the overall validity of the assessment (ETS, 2004).
1
Problem Description Despite considerable effort to ensure equitable assessment, the GRE program’s claims of
fairness are often challenged simply because of mean differences in the performances of various
subgroups of examinees. It should be noted, however, that simple differences in mean scores on
an item across different examinee subgroups are not evidence of bias or unfairness. In some
cases, examinees from two different groups may actually differ in the ability of interest, and
differences in item performance are to be expected. These results are often called item impact
(Ackerman, 1992; Clauser & Mazor, 1998). In fact, the real fairness issue should be the extent to
which differential item functioning (DIF) is present in any of the GRE prompts. DIF occurs
when examinees of equal ability, but with different group membership (e.g., male, female), have
unequal probabilities of success on an item (Angoff, 1993; Clauser & Mazor, 1998; Hambleton,
Swaminathan, & Rogers, 1991). To minimize the likelihood of this situation, test developers
attempt to craft prompts that are as nearly equivalent as possible and thus, to the extent possible,
ensure that all essay prompts function similarly for all test takers. In this way, any between-
group difference in performance on a prompt will be due to construct-relevant factors rather than
to influences that are irrelevant to the assessment of analytical writing ability. In addition,
though, it is desirable to have some procedure — differential item functioning (DIF) — to detect
when this condition has not been fully met.
The identification of a satisfactory DIF procedure for essay prompts is not an easy
undertaking for a number of reasons. For multiple-choice items, well-researched methods exist
for detecting items that are differentially difficult for certain subgroups of test takers. However,
there are currently no entirely satisfactory, well-researched comparable procedures for
determining when essay prompts are differentially difficult for matched subgroups of test takers.
One of the biggest problems in this regard is the absence of a reliable, internal criterion
on which test takers can be matched with respect to the overall ability or skill being measured by
the test. This overall matching must be accomplished before between-subgroup performance
comparisons can be made for individual items. For standardized multiple-choice measures, the
total score on the test serves this function. For direct writing assessments, a comparable internal
matching criterion is not usually available. Unfortunately, this is the case for the GRE Analytical
Writing assessment, which contains a single essay prompt for each of two task types (Issue and
Argument). In such cases, the usual (less-than-satisfactory) strategy is to use an external
2
matching criteria — for example, scores on multiple-choice tests that measure similar
knowledge, skills, or abilities. An even less attractive possibility is to use performance on one
task (e.g., Argument) as the matching variable for the other task (e.g., Issue). Problems with this
approach arise because one task may measure a somewhat different aspect of the construct than
the other one does. In addition, performance on a single task does not usually constitute a reliable
enough measure to allow sufficiently precise matching.
A further complication is that essay responses are scored polytomously, not simply as
correct or incorrect, leaving open the possibility that, in addition to ability level, the item score
level may also be a possible interacting variable (Dorans & Schmitt, 1993; French & Miller,
1996). That is, because of the polytomous nature of essay scores, DIF can occur in some or all
score categories.
Prior Relevant Research Several well-established DIF detection procedures for dichotomous items have been
extended to polytomous items, including
• item response theory (IRT)-based procedures (Raju, 1988; Wainer, Sireci, & Thissen,
1991)
• the extended SIBTEST (Shealy & Stout, 1993)
• the standardization approach (Dorans & Kulick, 1986),
• the Mantel test of linear association — a generalization of the Mantel-Haenszel
procedure that accommodates polytomous items1 (Agresti, 1990; Mantel, 1963;
Zwick & Thayer, 1996)
• logistic regression-based procedures (French & Miller, 1996; Swaminathan &
Rogers, 1990; Zumbo, 1999)
• logistic discriminant function analysis (Miller & Spray, 1993)
• analysis of covariance (Sireci, Harter, Yang, & Bhola, 2003; Sireci, Yang, Harter, &
Ehrlich, 2004)
Penfield and Lam (2000) conducted a comparative evaluation of these DIF methods for
polytomously scored items and recommended using a combination of methods that included the
standardization method and logistic regression as the most favorable approach to DIF
investigation for performance assessments (see also Potenza & Dorans, 1995, for a
3
comprehensive review). In this study, we used two of the methods recommended by Penfield and
Lam (2000) as well as the Mantel test, a method that has been widely researched for multiple-
choice items.
Welch and Miller (1995) studied different DIF detection procedures and different
combinations of external and internal matching variables in investigations of DIF for essay
items. One of the most important findings from this study was that, in most cases, combining a
multiple-choice test score of related content with one essay score as the matching criterion
reduced the apparent degree of DIF substantially (when compared to a criterion made up of only
scores on the multiple-choice items), and even further when a second essay score was added. The
researchers argued that the most likely explanation for this DIF pattern concerned potential
construct differences between the multiple-choice and the essay items. Under such
circumstances, using only multiple-choice test scores as a matching variable, or some other
matching variables dominated by multiple-choice test scores, does not match examinees
satisfactorily on the very construct measured by the essay items. As a result, the ability of the
DIF methodology to separate DIF from impact diminishes. In this sense, the major obstacle to
applying currently available DIF methodology to performance assessments is the difficulty
associated with finding appropriate matching variables that enable the separation of DIF from
impact (i.e., mean score differences due to true ability differences between groups).
Another problem for DIF is that not all detection techniques (like the Mantel-Haenszel
procedure) are sensitive enough to identify nonuniform DIF. Nonuniform DIF exists when the
probability of answering the item correctly is not uniformly different across all levels of ability
for the two groups being compared; that is, there is interaction between ability level and group
membership (Mellenbergh, 1982). (Uniform DIF exists when the probability of answering an
item correctly is uniformly greater for one group than another at all levels of ability.) One class
of DIF detection techniques that can be used to examine nonuniform DIF is based on item
response theory (e.g., Thissen, Steinberg, & Wainer, 1993; Williams, 1997). These methods,
however, also require a reliable, internal matching criterion and, in addition, may pose some
special problems when applying them to the GRE Writing Measure.2 Two other procedures that
are deemed effective for identifying both uniform and nonuniform DIF in polytomous items are
(a) a logistic regression modeling procedure (French & Miller, 1996; Lee, Breland, & Muraki,
2004; Swaminathan & Rogers, 1990) and (b) a logistic discriminant function analysis (Miller &
4
Spray, 1993), a method that is similar to logistic regression but where the roles of the item score
and group membership indicators are reversed. In this study, only the logistic regression
procedure was used to investigate nonuniform DIF, because the results are conceptually easier to
understand in relation to the standard definition of DIF.
Lee et al. (2004) employed logistic regression to study whether matched examinees with
non-Indo-European native language backgrounds are unduly disadvantaged on some writing
prompts used in the Test of English as a Foreign Language™ (TOEFL®) when compared to
examinees with European native language backgrounds. For their matching variable, Lee et al.
created an English language ability score by standardizing and summing TOEFL Reading,
Listening, and Structure scores. Approximately one-third of the prompts analyzed exhibited
statistically significant matched group differences (p < .05). The authors concluded, however,
that the effect size (i.e., R2 difference between the nested models) was far too small, practically
speaking, for any prompt to be classified as being differentially difficult for any of the matched
groups studied. In their research, Clauser, Nungester, Mazor, and Ripkey (1996) studied both the
Mantel-Haenszel procedure and logistic regression. Best results were obtained when using a
logistic regression model based on group membership and four relevant subtests. The model was
specified so that each of the four subtest scores was forced to enter the equation for each item.
Objectives The aim of the research reported here was to evaluate the usefulness of several alternative
DIF methods for detecting GRE essay prompts that may function differently for specified
subgroups of matched GRE test takers. Each of the two prompt types used in the GRE Writing
assessment (Issue and Argument) were analyzed. An attempt was also made to compare the
impact on DIF estimates of using different matching variables created by combining multiple-
choice test scores and essay scores.
Methods
Matching Variables Two main matching variables were used in the analysis described here. Both entailed a
composite score of the verbal section plus the “other prompt” (i.e., when the Argument prompt
was studied, the other prompt was the Issue prompt, and vice versa). It should be noted that when
5
the simple arithmetic mean of the verbal section and other prompt scores is used as a matching
variable, the verbal score is, in effect, weighted far more heavily than is the other prompt
because of the difference in valid score range for the two sections (i.e., 200–800 for verbal, 1–6
for essay). Thus, for the purpose of evaluating different weighting schemes, standardized (z)
scores were created first for each component so that the scores for both sections had a mean of 0
and a standard deviation of 1. These z-scores were then weighted differentially for the two
components in each of the two matching variables used in this study.
In determining the weights for the verbal section and essay scores in each of the two
matching variables, both construct similarity and test length of each component were taken into
consideration. Matching variable 1 was defined as follows:
Matching variable 1 = (zverbal + zother prompt)/2
This is simply the mean of the z-scores of the verbal section and the other prompt score in
which the two components received approximately equal weights in spite of the different number
of items used in each component. It should be noted that the “other essay prompt” component
consisted of a single polytomously scored item, but this component can be viewed as
representing the test construct of the studied prompt more closely than the multiple-choice verbal
items. This weighing scheme also produced the highest correlations between the studied prompts
and the matching variable.
However, one can argue that this formulation places too much weight on a single
polytomously scored prompt (i.e., the essay score component). Therefore, we also created
another matching variable in which the weight of the essay score component was significantly
decreased, compared to the first matching variable. Matching variable 2 was defined as follows:
Matching variable 2 = [zverbal + (zother prompt/7.6)]/2
This is simply the mean of the z-scores of the verbal scores and the z-scores of the other
prompt scores divided by 7.6. The logic for the weighting applied in this second matching
variable is as follows: There is one threshold in dichotomous items (0–1), whereas there are 5
threshold levels in essay items (1–2, 2–3, 3–4, 4–5, 5–6). We argue that an essay item should
6
therefore be “worth” 5 multiple-choice items in the verbal section. Since there are 38 items in the
verbal section, the resulting weight adjustment is 7.6 (i.e., 38/5).3
Differential Item Functioning Techniques The Mantel test. One of the most widely used methods for studying DIF in multiple-
choice items is the Mantel-Haenszel procedure (Holland & Thayer, 1988; Mantel & Haenszel,
1959). In DIF investigation, we usually compare the performance of two groups of examinees:
the focal group and the reference group. The focal group is a group of primary interest (e.g.,
females), whereas the reference group (e.g., males) is taken as a standard against which the focal
group is compared (Holland & Thayer, 1988). The Mantel-Haenszel procedure compares, for a
given item, the probability of obtaining a right answer in the reference group to the probability of
obtaining a right answer in the focal group, when the examinees in the two groups are matched
on total test scores. Mantel’s (1963) test of conditional linear association (Agresti, 1990), which
accommodates polytomous items, was used here to study DIF in the GRE Analytical Writing
measure.
The Mantel test is capable of handling 2-by-j (j > 2) contingency tables. Assuming two
groups (focal and reference) and a j-category ordered response variable (the essay scores), with
observations at each of k ability levels, there are 2j cells at each of the k ability levels.
Specifically, for the kth matched set of members of the focal and reference groups at response
level j on the studied item (essay prompt), there will be Ajk members in the focal group and Bjk
members in the reference group. With the score Yj assigned to the jth level of response, a
summary chi-square, with one degree of freedom, is computed as
=2m
∑ ∑
∑∑ ∑ ∑
−
K
k
J
jjjk
K
k
J
j
K
k
J
jjjkjjk
YAVar
YAEYA2
,
where for level k,
7
−−
−=
∑ ∑∑
J
j
J
jjjkjjk
kk
kRkFJ
jjjk YMYMT
TTnn
YAVar2
22 )1(
,
where Tk is the total number of examinees at level k, mjk = Ajk + Bjk, and
( )∑
∑∑ +
+=
K
k kRkF
J
jjjkjk
kF
J
jjjk nn
YBAnYAE
(cf., Welch & Miller, 1995).
Logistic regression procedure. French and Miller (1996) and Zumbo (1999)
demonstrated that the logistic regression procedure could be extended to studying polytomous
DIF as well. Logistic regression has two main advantages over linear regression. The first is that
the dependent variable need not be continuous, unbounded, or measured on an interval or ratio
scale. The second is that it does not require a linear relationship between the dependent and
independent variables.
The logistic regression method that was employed is the proportional odds-ratio model. A
three-step modeling process based on logistic regression (Zumbo, 1999) was used as the main
method of analysis for the sequential investigation of gender DIF. It should be noted that the
logistic regression method was not used for racial/ethnic group DIF investigations due to sample
size requirements. The R2 differences between several nested models were used as an effect size
measure, based on Jodoin and Gierl’s (2001) and Zumbo’s (1999) DIF classification schemes.
Since the final essay score is an average of two raters’ ratings, the dependent variable in
this study is in increments of 0.5, with 11 valid score categories (i.e., 1.0, 1.5, 2.0, 2.5, 3.0, 3.5,
4.0, 4.5, 5.0, 5.5, 6.0). Polytomous essay scores were dichotomized into 10 binary response
variables according to the cumulative-logit dichotomization scheme (Agresti, 1990; French &
Miller, 1996). For each essay prompt, these 10 binary variables were regressed on the 3
independent variables (i.e., the matching variable, the group variable, and the matching-score-by-
group interaction term) in a stepwise fashion. The logistic regression equation for each
dichotomized variable (i) for an essay prompt can be written as:
8
))],((exp[11
)],(exp[1)],(exp[
),|(DxgDxg
DxgDxUP
ii
ii −+
=+
= ,
where Ui represents the binary responses for a dichotomized response variable i (Ui = 0 or 1), x is
the matching variable score that is treated as a continuous variable, and D is the design matrix of
the covariate variables. In this equation, the function gi (x, D) is called a logit. The logit is a
linear combination of the matching variable score (x), a covariate variable (D), and an interaction
term (xD). If we want to analyze the DIF for M levels of an analysis group covariate (e.g., focal
group = 0, reference group = 1), as in our GRE essay data, we can rewrite the logit gi (x, D) as:
mmii xDDxDxg 3210),( ββββ +++= ,
where β0i is the intercept for a dichotomized variable (i); β1 is the slope parameter associated
with the matching variable score; β2 is the parameter associated with the analysis group variable,
Dm; and β3 is the slope parameter associated with the ability score-by-group interaction (cf., Lee
et al., 2004).
Polytomous standardization (polySTAND) statistic. The Advanced Placement Program®
(AP®) currently uses smoothed conditional means (that are conditioned on the scores of the
multiple-choice section, free-response item section, or the composite of both) and polySTAND
— an extension of the standardization approach (Dorans & Kulick, 1986) for polytomous DIF
analysis. (Most of the AP tests involve a combination of dichotomously scored multiple-choice
items and polytomously scored free-response items.) Graphical displays of smoothed conditional
means as well as an overall index (polySTAND) are used to compare the performance of
different groups on an essay (Potenza & Dorans, 1995; Tateneni, 2001).
PolySTAND is a summary statistic; it is the sum of differences in smoothed conditional
means between groups 1 and 2, weighted by the relative frequency of individuals at each
matching variable score level. The formula is given by:
∑∑
=
=−
= n
i i
iin
i i
n
xxn
1
211)(
PolySTAND ,
9
where n are the criterion score levels; 1ix and 2ix are the smoothed conditional means of groups 1
and 2 on the essay prompt at the ith criterion score level; and is the total sample size at the iin th
criterion score level (cf., Tateneni, 2001).4
Sample and Dataset The study relied on operational data from some 397,806 GRE General Test
examinees who took the test between October 2002 and October 2003. Thus, the sample is
quite representative of the full GRE test-taking population. In total, 117 Argument prompts
and 109 Issue prompts were administered to these test takers. About 42,405 test takers (about
10.7% of the total sample) indicated that English was not their best language (non-EBL). For
comparisons involving gender or race/ethnicity, only test takers who indicated that English
was their best language (EBL) were included in the analysis. Of the 355,401 test takers who
indicated that English was their best language, about 39% were male and about 60% were
female, with some test takers of unidentified gender. Among the four racial/ethnic groups,
the White group was the largest (about 61%) followed respectively by the African American
(7%), Asian American (6%), and Hispanic American groups (2%). The dataset was cleaned
for missing and out-of-range values for key variables. The analysis does not include essay
scores of 0, as we believe that this score cannot be viewed as a score that represents a
continuation of the 1 to 6 scale, but rather represents a qualitatively different score category
(e.g., off-topic essays).
Procedure Our initial assumption was that, because we lacked a purely internal matching variable,
reliance on any single DIF detection method might yield biased results. Thus, basing the results
on only one DIF detection method could further increase the risk of falsely flagging prompts.
(Evidence will be presented later that this is probably a more serious problem than failing to
identify prompts that do function differently.)
Because we did not believe that any of the DIF methods would yield unequivocal results,
we combined the results of the DIF methods employed in this investigation and then focused on
those prompts that exceeded values that are likely to have a practical impact on test performance
(see the classification scheme below). As will be shown later, the methods were in considerable,
though not perfect, agreement. The correlations among DIF values from the three different
10
methods ranged from .83 to .90 for the Argument prompts and from .86 to .89 for the Issue
prompts.
Six different DIF values were computed for each prompt by using matching variables 1
and 2 with each of the three procedures (i.e., Mantel-Haenszel, logistic regression, and
polySTAND). In each method, the DIF values for all the studied prompts based on the two
matching variables were examined in terms of magnitude and direction. These prompts were
then ordered from highest to lowest in absolute DIF values separately in each of the six
conditions (3 procedures × 2 matching variables), and rank numbers were assigned to each of
them (ranking number 1 indicates the highest DIF). Then, an average rank was calculated from
the ranks of both matching variables in each procedure. Finally, a mean rank of the procedures
was calculated for those prompts that had large enough samples to be studied (or where DIF
values were nonzero in the case of the logistic regression procedure).5
In order to make the polySTAND DIF measure comparable across different prompts and
to convey a better idea of the size of its effect, the polySTAND value was divided by the
combined standard deviation of the reference and focal groups. The polySTAND effect size (PS
EZ) measure is independent of sample size, while the Mantel test is not. To correct for different
categorizations based on different sample sizes of the prompts, the Mantel test measure (i.e., a
summary chi-square statistic) was divided by the sample size of the focal group for ranking
purposes.6 It should be also mentioned that impact values (standardized mean score differences
between groups) were also computed for each prompt and compared with the PS EZ effect size
values to examine the empirical relationship between these two indices for some of the
racial/ethnic group comparisons (e.g., White vs. African American comparisons).
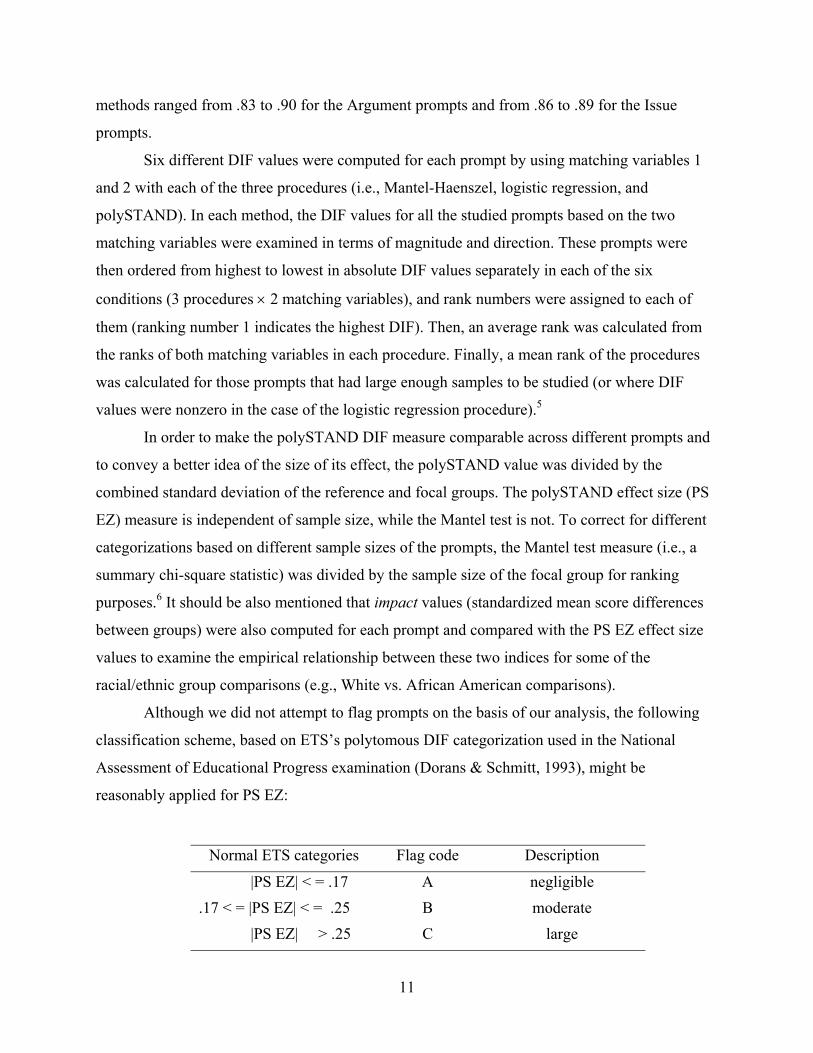
Although we did not attempt to flag prompts on the basis of our analysis, the following
classification scheme, based on ETS’s polytomous DIF categorization used in the National
Assessment of Educational Progress examination (Dorans & Schmitt, 1993), might be
reasonably applied for PS EZ:
Normal ETS categories Flag code Description
|PS EZ| < = .17 A negligible .17 < = |PS EZ| < = .25 B moderate |PS EZ| > .25 C large
11

Given the absence of a purely internal matching variable (and the increased prospect of
false positive results), however, this study can give no definitive answer regarding specific
values that should be used. Nonetheless, a preliminary analysis suggested that DIF values tend to
increase when less construct-relevant, non-essay components (e.g., multiple-choice verbal and
quantitative sections) are added to the matching variable for the essay items, and vice versa (see
also Summary and Discussion for more details). This is also consistent with previous research
(Welch & Miller, 1995). Under such circumstances, one practical suggestion would be to
increase the threshold for flagging GRE prompts in the following way:
Categories for GRE prompts Flag code
|PS EZ| < = .25 A .25 < = |PS EZ| < = .35 B |PS EZ| > .35 C
The use of these less conservative criteria does make a difference with respect to
conclusions about the prevalence of DIF in our study data. And, of course, an argument can be
made for using the original, more conservative criteria. We decided, therefore, not to flag
prompts until further investigation could be carried out about appropriate cut-off values (see the
Summary and Discussion section), but rather to present a ranking of the prompts in each
comparison, along with their respective PS EZ values, in order to give test developers more
information regarding potentially problematic prompts. Using a matrix of major prompt
characteristics developed by the GRE content team for the purpose of this study, we investigated
whether or not certain prompt features were associated with higher DIF values (see the
appendix).
Furthermore, we combined the psychometric analysis with a qualitative content review as
follows. For the Argument prompts, we assembled two groups of 3 prompts each that included
those with the highest DIF values, and two groups of 3 prompts each that showed no DIF (12
prompts in total) for each of the two racial/ethnic group comparisons (i.e., White vs. African
American, White vs. Hispanic American).
12
For the Issue prompts, however, this review was performed only for the White versus
Asian American comparison, because most of prompts flagged in this comparison were Issue
prompts. We presented these sets to a group of ETS assessment experts that included at least one
reviewer from the focal ethnic group (for example, reviewers from a Latino/Hispanic
background reviewed DIF and non-DIF prompts in the White versus Hispanic group
comparison). In order to discourage post hoc hypothesis formation, the reviewers were not told
which prompts were identified as showing DIF. We decided not to present individual prompts to
reviewers at this stage, because a trial review revealed that this task would be too difficult and
too time-consuming. Every person in the group was asked first to read all the prompts in the four
groups. Then, each one made a decision regarding which two prompt groups were the ones likely
to show DIF based on the characteristics they identified. The decisions were then compared with
the psychometric findings. Afterwards, the reviewers discussed the characteristics they believed
distinguished the DIF prompts from the non-DIF prompts.
Some Notes on Conditions Affecting the Analysis Sample size restrictions. The sample size was sufficient to study nearly all prompts for
the male-female comparison. However, because of sample size restrictions, fewer prompts could
be investigated for other focal groups.
Due to the large sample size requirements for logistic regression, this method could be
employed only for the male-female comparison. For the White versus Ethnic group comparisons,
and for the English as a best language (EBL) versus non-EBL comparison, only the polySTAND
procedure and the Mantel test were used. Also, in these comparisons, some prompts were deleted
from the analyses because they had not yet been administered to sufficiently large numbers of
examinees.
Table 1 shows the minimum sample size requirements for the focal group that were
imposed for the polySTAND procedure and the Mantel test.
13
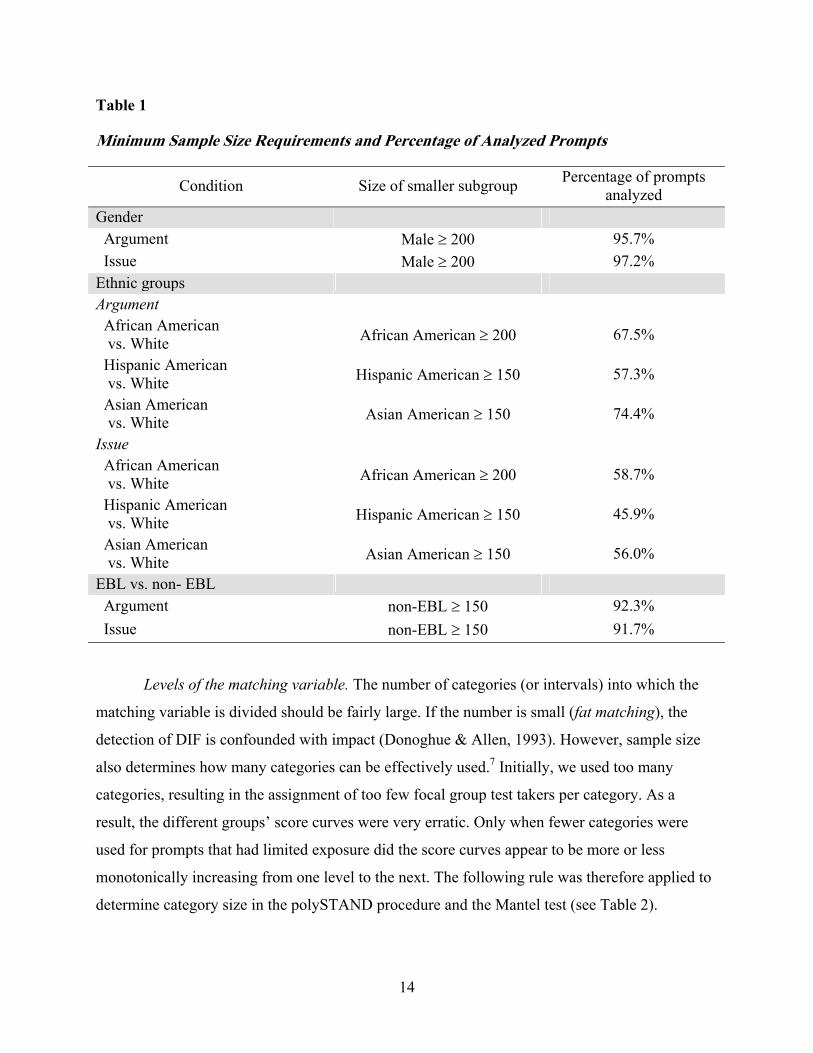
Table 1
Minimum Sample Size Requirements and Percentage of Analyzed Prompts
Condition Size of smaller subgroup Percentage of prompts analyzed
Gender Argument Male ≥ 200 95.7% Issue Male ≥ 200 97.2% Ethnic groups Argument African American vs. White African American ≥ 200 67.5%
Hispanic American vs. White Hispanic American ≥ 150 57.3%
Asian American vs. White Asian American ≥ 150 74.4%
Issue African American vs. White African American ≥ 200 58.7%
Hispanic American vs. White Hispanic American ≥ 150 45.9%
Asian American vs. White Asian American ≥ 150 56.0%
EBL vs. non- EBL Argument non-EBL ≥ 150 92.3% Issue non-EBL ≥ 150 91.7%
Levels of the matching variable. The number of categories (or intervals) into which the
matching variable is divided should be fairly large. If the number is small (fat matching), the
detection of DIF is confounded with impact (Donoghue & Allen, 1993). However, sample size
also determines how many categories can be effectively used.7 Initially, we used too many
categories, resulting in the assignment of too few focal group test takers per category. As a
result, the different groups’ score curves were very erratic. Only when fewer categories were
used for prompts that had limited exposure did the score curves appear to be more or less
monotonically increasing from one level to the next. The following rule was therefore applied to
determine category size in the polySTAND procedure and the Mantel test (see Table 2).
14
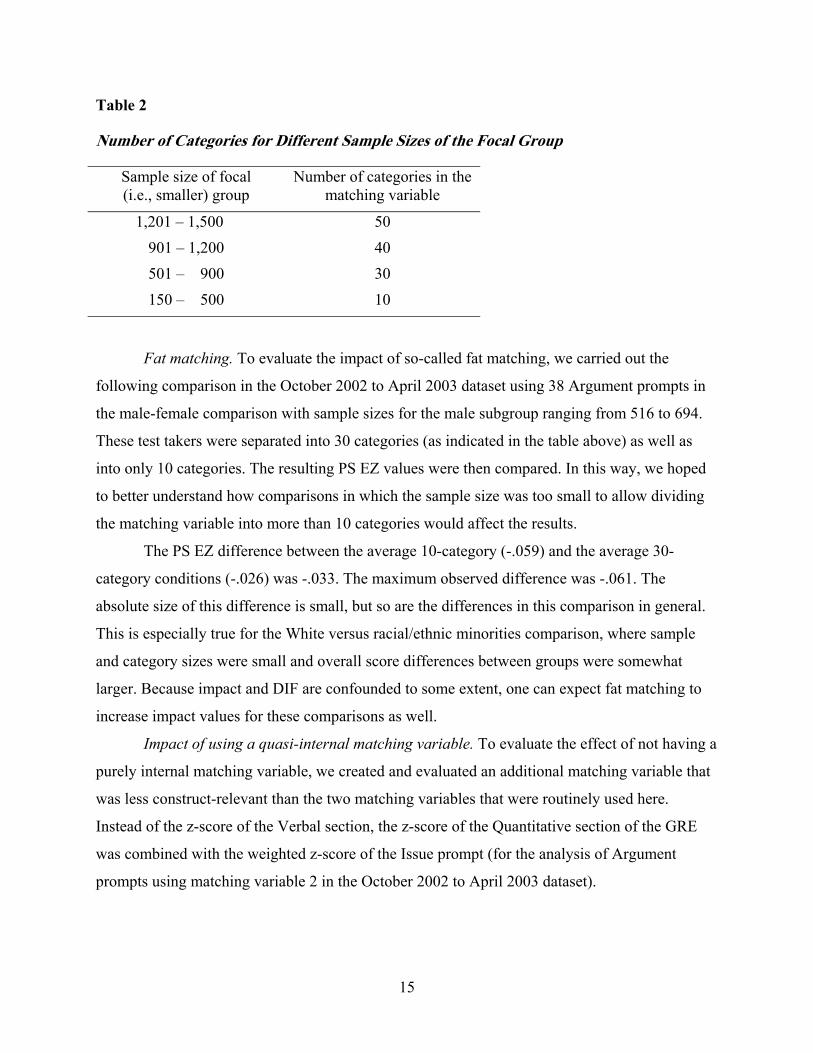
Table 2
Number of Categories for Different Sample Sizes of the Focal Group
Sample size of focal (i.e., smaller) group
Number of categories in the matching variable
1,201 – 1,500 50 901 – 1,200 40 501 – 900 30 150 – 500 10
Fat matching. To evaluate the impact of so-called fat matching, we carried out the
following comparison in the October 2002 to April 2003 dataset using 38 Argument prompts in
the male-female comparison with sample sizes for the male subgroup ranging from 516 to 694.
These test takers were separated into 30 categories (as indicated in the table above) as well as
into only 10 categories. The resulting PS EZ values were then compared. In this way, we hoped
to better understand how comparisons in which the sample size was too small to allow dividing
the matching variable into more than 10 categories would affect the results.
The PS EZ difference between the average 10-category (-.059) and the average 30-
category conditions (-.026) was -.033. The maximum observed difference was -.061. The
absolute size of this difference is small, but so are the differences in this comparison in general.
This is especially true for the White versus racial/ethnic minorities comparison, where sample
and category sizes were small and overall score differences between groups were somewhat
larger. Because impact and DIF are confounded to some extent, one can expect fat matching to
increase impact values for these comparisons as well.
Impact of using a quasi-internal matching variable. To evaluate the effect of not having a
purely internal matching variable, we created and evaluated an additional matching variable that
was less construct-relevant than the two matching variables that were routinely used here.
Instead of the z-score of the Verbal section, the z-score of the Quantitative section of the GRE
was combined with the weighted z-score of the Issue prompt (for the analysis of Argument
prompts using matching variable 2 in the October 2002 to April 2003 dataset).
15
The objective was to see if DIF values would increase (leading to more false positives) or
decrease (thus providing less power for detecting DIF when present) for the gender and
racial/ethnic group comparisons under this condition.
Comparing the DIF values obtained by using this matching variable with those obtained
by matching variables employed for this study (which, though not perfect, are clearly closer to
representing the measured construct), we found that the PS EZ values were higher in all of the
prompts in this study that had this specially constructed matching variable. This suggests that the
effect of using a less construct-relevant, non-essay test score as part of the matching variable for
studying the essay prompts will result in higher DIF values (and therefore likely more false
positive values) as compared to a more appropriate combination of non-essay verbal test score
and essay prompt and, by inference, as compared to a hypothetical ideal matching variable
consisting of various writing measures.
Results
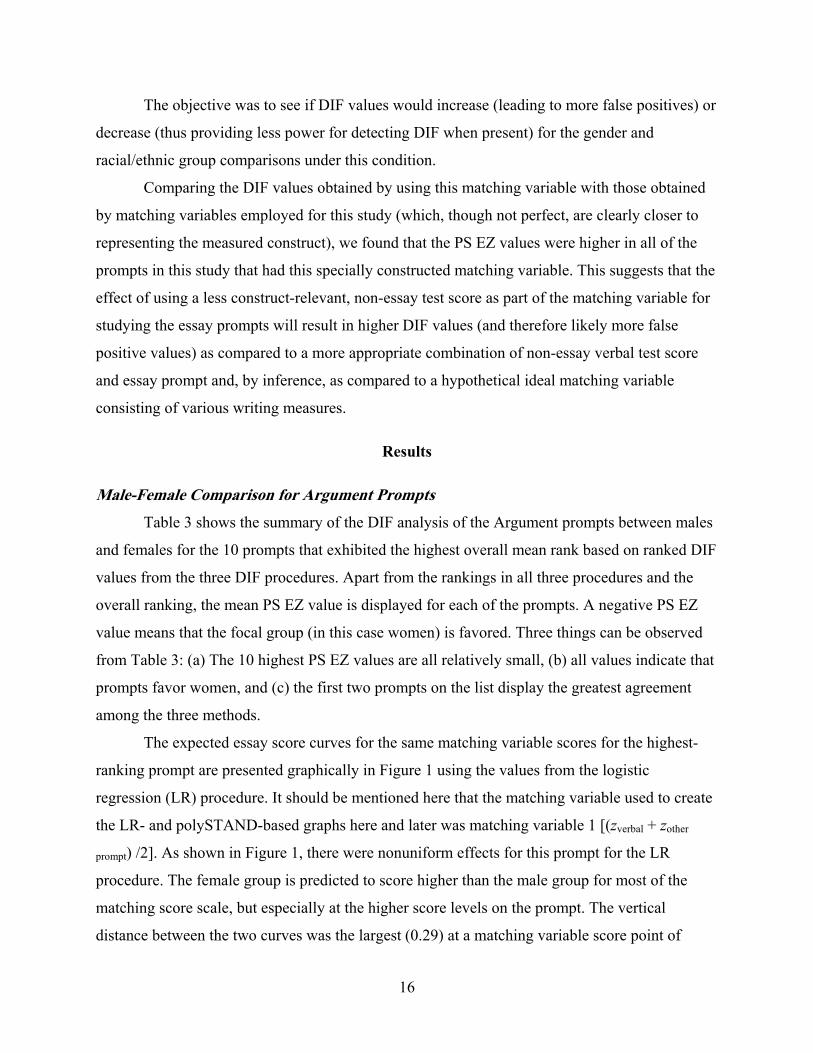
Male-Female Comparison for Argument Prompts Table 3 shows the summary of the DIF analysis of the Argument prompts between males
and females for the 10 prompts that exhibited the highest overall mean rank based on ranked DIF
values from the three DIF procedures. Apart from the rankings in all three procedures and the
overall ranking, the mean PS EZ value is displayed for each of the prompts. A negative PS EZ
value means that the focal group (in this case women) is favored. Three things can be observed
from Table 3: (a) The 10 highest PS EZ values are all relatively small, (b) all values indicate that
prompts favor women, and (c) the first two prompts on the list display the greatest agreement
among the three methods.
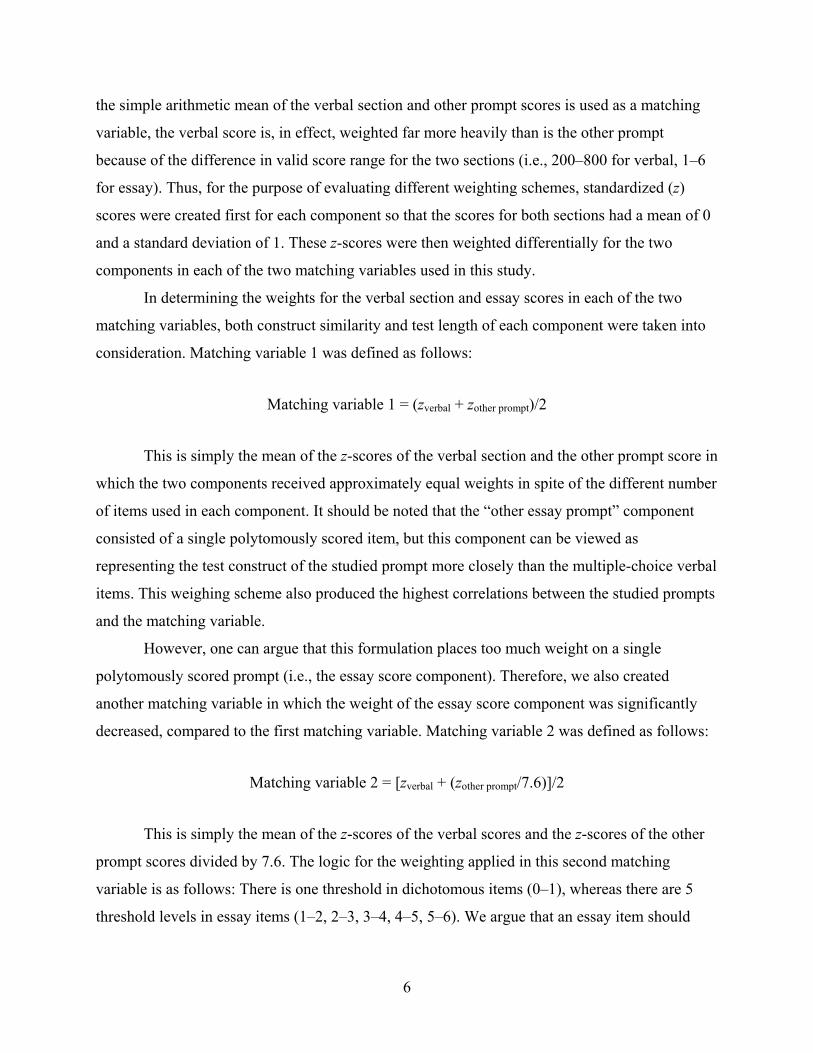
The expected essay score curves for the same matching variable scores for the highest-
ranking prompt are presented graphically in Figure 1 using the values from the logistic
regression (LR) procedure. It should be mentioned here that the matching variable used to create
the LR- and polySTAND-based graphs here and later was matching variable 1 [(zverbal + zother
prompt) /2]. As shown in Figure 1, there were nonuniform effects for this prompt for the LR
procedure. The female group is predicted to score higher than the male group for most of the
matching score scale, but especially at the higher score levels on the prompt. The vertical
distance between the two curves was the largest (0.29) at a matching variable score point of
16
about 2, while the two lines crossed at a matching variable score point of around -3. When the
differences between the two curves were averaged across the actual score range of about -2.8 to
2.4 in the data, the average difference was about 0.18 (favoring females).
Table 3
Summary o DIF Results for the 10 Argument Prompts With the Highest DIF Values for the Male-Female Comparison
f
Prompt # Total N Males Overall rank
Rank in Mantel
Rank in LR
Rank in PS EZ
Mean rank
PS EZ value
A107 3,363 1,313 1 1 1.5 2 1.5 -0.206
A18 3,886 1,573 2 2 3 3 2.7 -0.177
A109 4,189 1,604 3 4.5 6.5 5.5 5.5 -0.155
A98 2,715 1,055 4 5 6.5 6 5.8 -0.153
A65 2,989 1,185 5 8 4.5 6 6.2 -0.151
A20 4,691 1,874 6 6 7 9.5 7.5 -0.142
A12 2,722 1,026 7 6 12 6 8 -0.146
A74 3,938 1,600 8 7 13 14.5 11.5 -0.124
A72 2,546 1,052 9 11 15.5 14 13.5 -0.126
A36 3,544 1,315 10 9 19 14 14 -0.127
Note. Prompts are ordered according to their overall mean rank in all three procedures in the left
part of the table. The right part of the table displays the PS EZ values for each of the prompts.
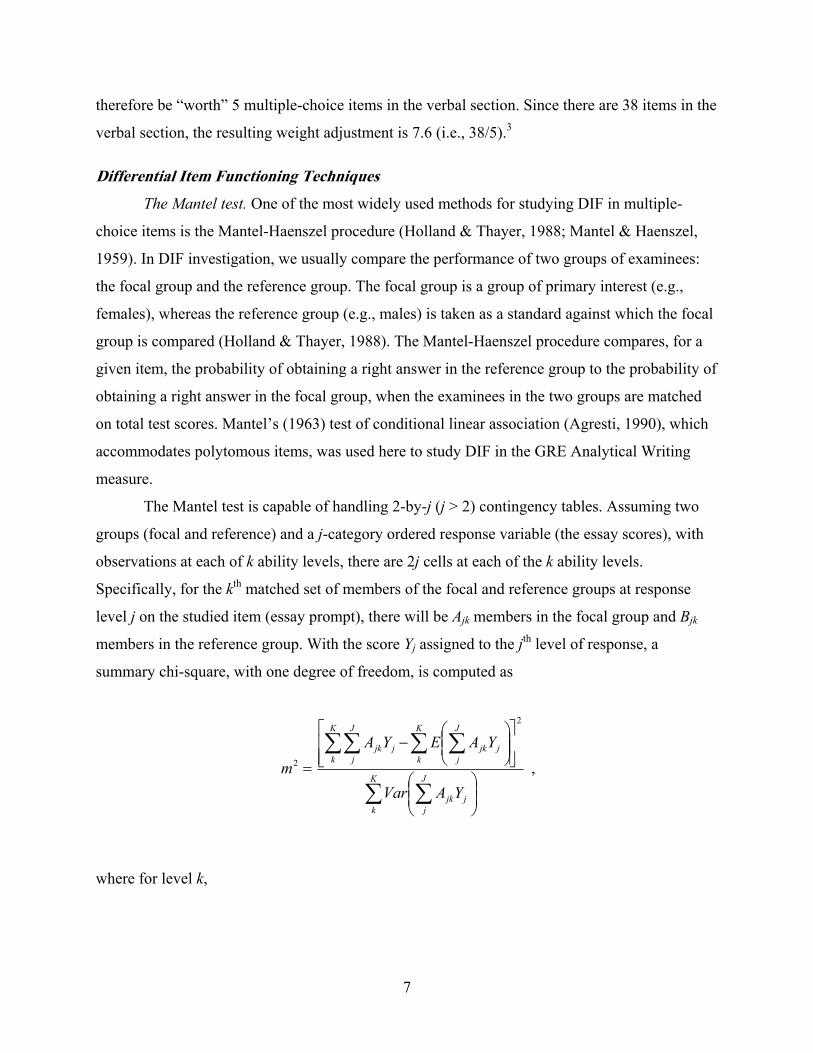
In contrast to the logistic regression-based expected essay score curves shown in Figure
1, Figure 2 shows connected points for observed essay score values for males and females at
every level of the matching variable (in this case, 50 levels). As shown in Figure 2, the female
group scored higher at most of the matching score levels, and such a pattern was more clearly
observed at the higher score levels. The conditioned observed mean essay score difference
between the male and female groups was the largest (about 0.78) at a matching score level of 44.
In sum, both the logistic regression and standardization methods showed a similar DIF pattern
for this particular prompt.
17

Expected Essay Score Curves for Dominantly Uniform Effect (R-Squared Effect Size: U = .0109; NU = .0009)
1.01.52.02.53.03.54.04.55.05.56.0
-5 -4 -3 -2 -1 0 1 2 3 4 5
Matching Score (Verbal + Issue)
Expe
cted
Ess
ay S
core
Male
Female
Figure 1. Logistic regression of expected essay score per matching variable 1 score for an
argument prompt (A107).
Observed Essay Score per Matching Score Level
1.01.52.02.53.03.54.04.55.05.56.0
1 5 9 13 17 21 25 29 33 37 41 45 49
Matching Score (Verbal + Issue) Level
Obs
erve
d Es
say
Scor
e
MalesFemales
Figure 2. PolySTAND of observed essay score per matching variable 1 score for an
argument prompt (A107).
18
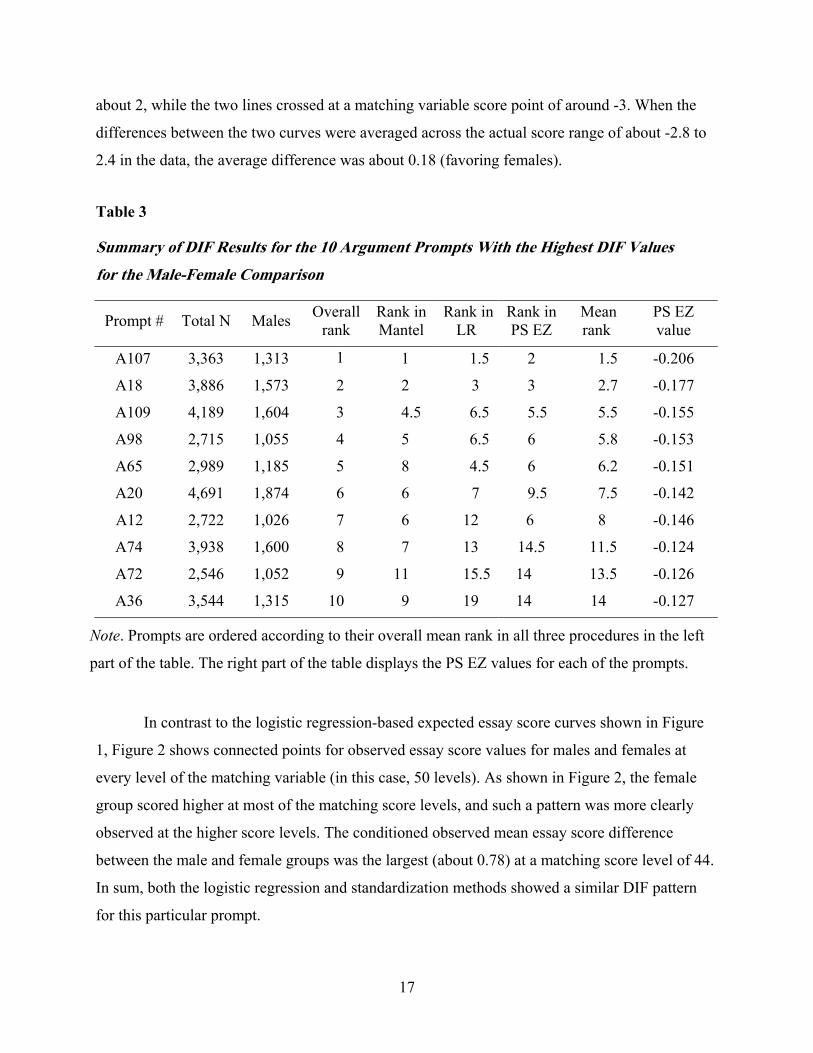
Prompt content analysis. The first step in the content review was to examine the matrix
of prompt characteristics. Table 4 gives an example of the five highest-ranking prompts and a
small selection of characteristics in the matrix. A close content inspection of these prompts
revealed that all of these five prompts require test takers to analyze the logical fallacies related to
“alternative explanations and solutions” and “causations versus correlation/reasonableness,”
while four of the five prompts dealt with “pragmatic topics.” However, these are very common
features, and a correlation of PS EZ values with the presence of these features revealed only very
small values (around .15). In contrast, the topic “health/safety,” which is present in the four
highest-ranking prompts, is not as common, and the correlation is .29 — fairly high in
comparison to other correlations found in this investigation. However, DIF values were too small
to signal the need for concern about prompts with this characteristic.
Table 4
Some Characteristics of the Five Highest-Ranking Prompts for the Male-Female Comparison of the Argument Prompts
Prompt # HS SSHC PT AES Ambiguity CCR TUE
A107 1 0 1 1 1 1 0
A18 1 1 1 1 0 1 1
A109 1 0 1 1 0 1 0
A98 1 0 0 1 0 1 0
A65 0 1 1 1 0 1 0
Proportion of prompts that share this characteristic
.218 .136 .436 .464 .018 .482 .218
Note. HS = Health and Safety; SSHC= Social Science, History, and Culture; PT = Pragmatic
Topics; AES= Alternative Explanations and Solutions; CCR = Causation versus
Correlation/Reasonableness; TUE = Typicality/Unrepresentative Evidence.
19
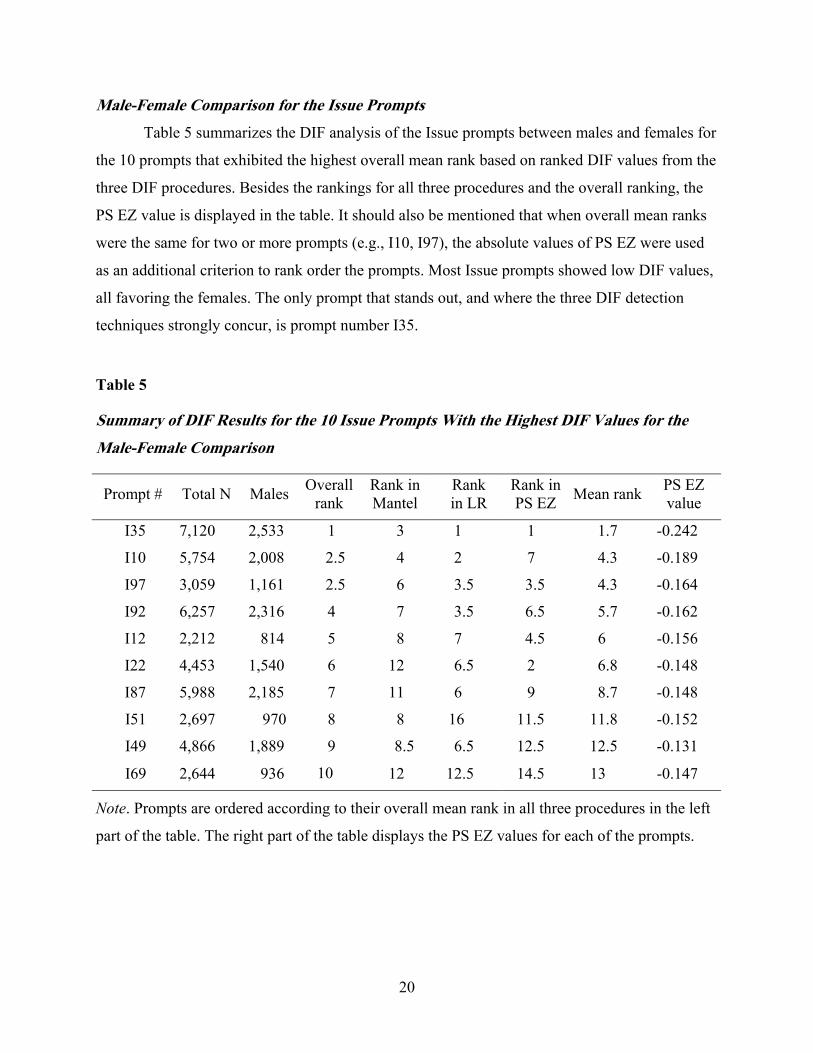
Male-Female Comparison for the Issue Prompts Table 5 summarizes the DIF analysis of the Issue prompts between males and females for
the 10 prompts that exhibited the highest overall mean rank based on ranked DIF values from the
three DIF procedures. Besides the rankings for all three procedures and the overall ranking, the
PS EZ value is displayed in the table. It should also be mentioned that when overall mean ranks
were the same for two or more prompts (e.g., I10, I97), the absolute values of PS EZ were used
as an additional criterion to rank order the prompts. Most Issue prompts showed low DIF values,
all favoring the females. The only prompt that stands out, and where the three DIF detection
techniques strongly concur, is prompt number I35.
Table 5
Summary o DIF Results for the 10 Issue Prompts With the Highest DIF Values for the Male-Female Comparison
f
Prompt # Total N Males Overall rank
Rank in Mantel
Rank in LR
Rank in PS EZ Mean rank PS EZ
value
I35 7,120 2,533 1 3 1 1 1.7 -0.242
I10 5,754 2,008 2.5 4 2 7 4.3 -0.189
I97 3,059 1,161 2.5 6 3.5 3.5 4.3 -0.164
I92 6,257 2,316 4 7 3.5 6.5 5.7 -0.162
I12 2,212 814 5 8 7 4.5 6 -0.156
I22 4,453 1,540 6 12 6.5 2 6.8 -0.148
I87 5,988 2,185 7 11 6 9 8.7 -0.148
I51 2,697 970 8 8 16 11.5 11.8 -0.152
I49 4,866 1,889 9 8.5 6.5 12.5 12.5 -0.131
I69 2,644 936 10 12 12.5 14.5 13 -0.147
Note. Prompts are ordered according to their overall mean rank in all three procedures in the left
part of the table. The right part of the table displays the PS EZ values for each of the prompts.
20
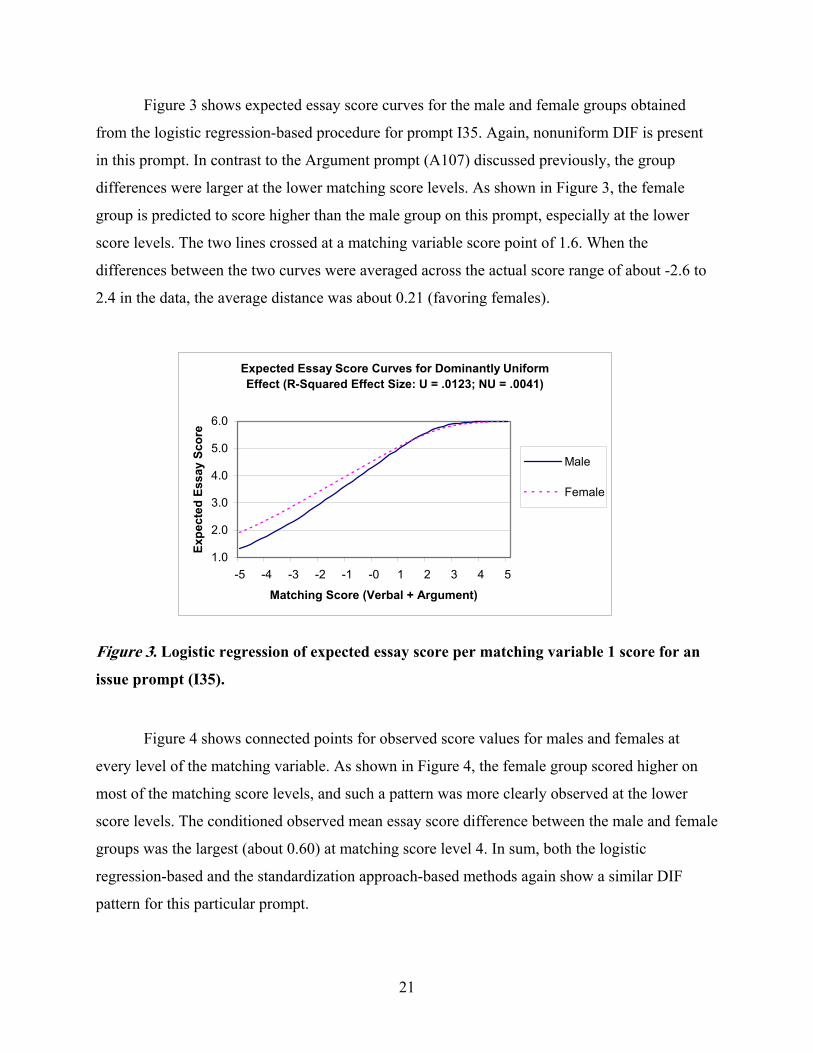
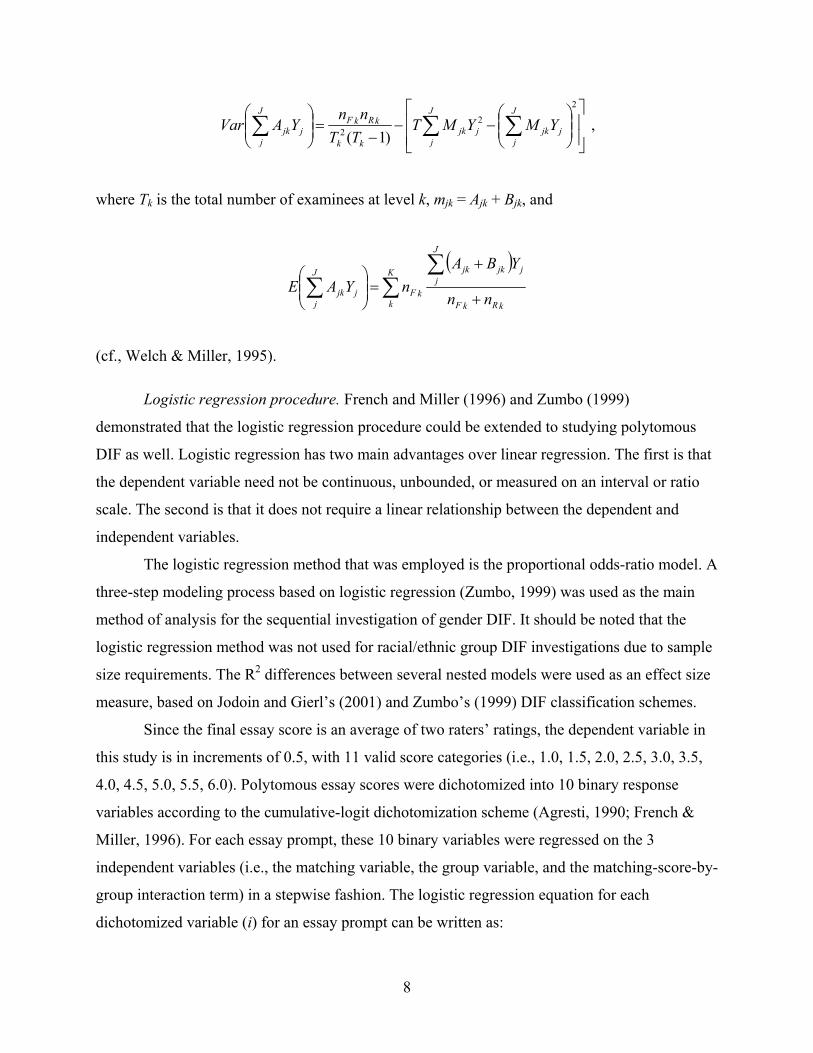
Figure 3 shows expected essay score curves for the male and female groups obtained
from the logistic regression-based procedure for prompt I35. Again, nonuniform DIF is present
in this prompt. In contrast to the Argument prompt (A107) discussed previously, the group
differences were larger at the lower matching score levels. As shown in Figure 3, the female
group is predicted to score higher than the male group on this prompt, especially at the lower
score levels. The two lines crossed at a matching variable score point of 1.6. When the
differences between the two curves were averaged across the actual score range of about -2.6 to
2.4 in the data, the average distance was about 0.21 (favoring females).
Expected Essay Score Curves for Dominantly Uniform Effect (R-Squared Effect Size: U = .0123; NU = .0041)
1.0
2.0
3.0
4.0
5.0
6.0
-5 -4 -3 -2 -1 -0 1 2 3 4 5
Matching Score (Verbal + Argument)
Expe
cted
Ess
ay S
core
Male
Female
Figure 3. Logistic regression of expected essay score per matching variable 1 score for an
issue prompt (I35).
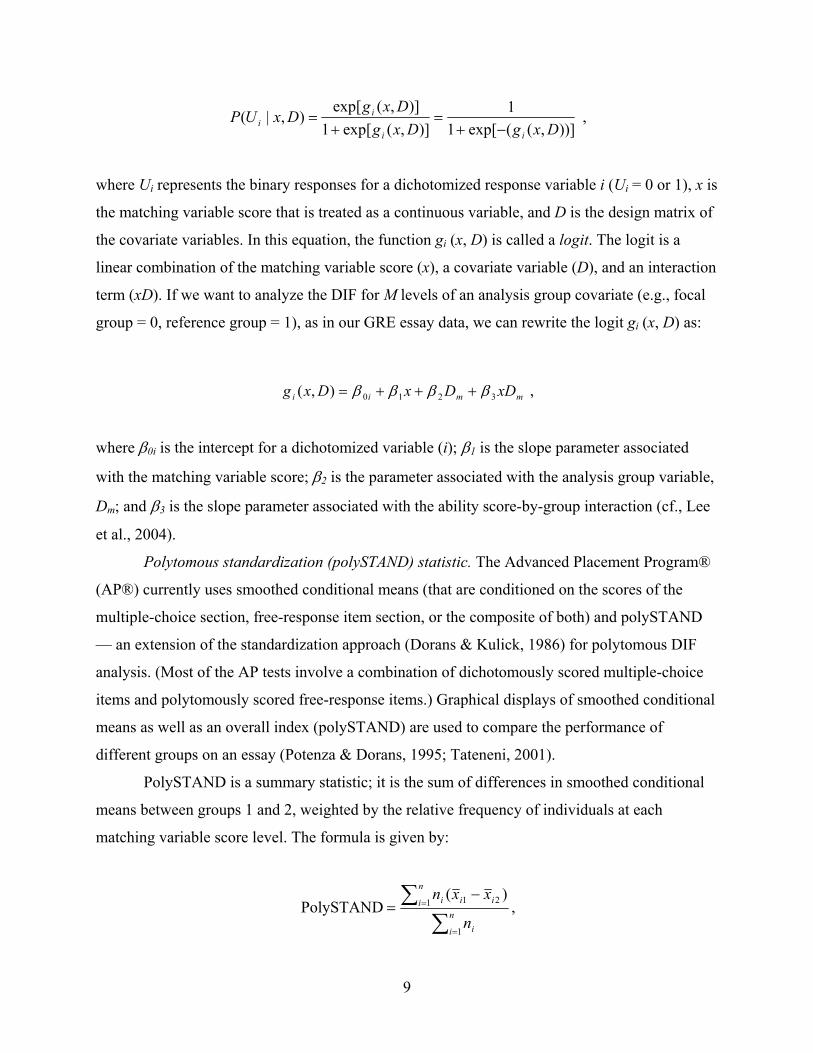
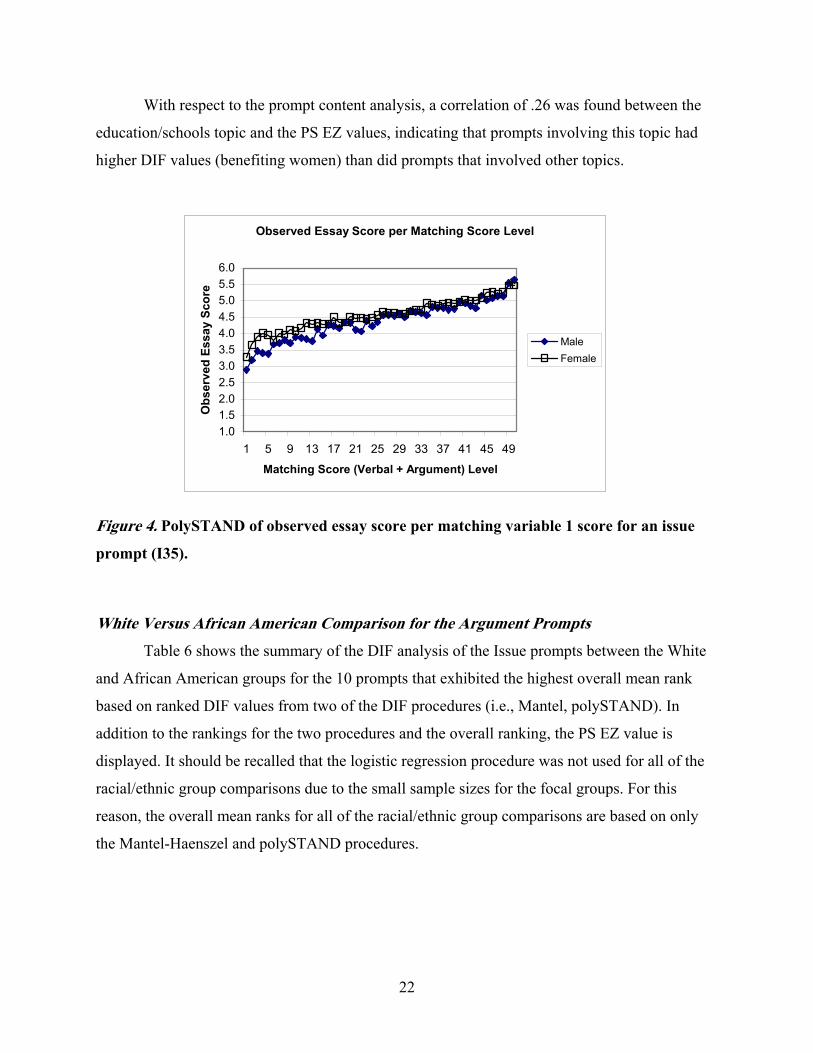
Figure 4 shows connected points for observed score values for males and females at
every level of the matching variable. As shown in Figure 4, the female group scored higher on
most of the matching score levels, and such a pattern was more clearly observed at the lower
score levels. The conditioned observed mean essay score difference between the male and female
groups was the largest (about 0.60) at matching score level 4. In sum, both the logistic
regression-based and the standardization approach-based methods again show a similar DIF
pattern for this particular prompt.
21
With respect to the prompt content analysis, a correlation of .26 was found between the
education/schools topic and the PS EZ values, indicating that prompts involving this topic had
higher DIF values (benefiting women) than did prompts that involved other topics.
Observed Essay Score per Matching Score Level
1.01.52.02.53.03.54.04.55.05.56.0
1 5 9 13 17 21 25 29 33 37 41 45 49
Matching Score (Verbal + Argument) Level
Obs
erve
d Es
say
Scor
e
MaleFemale
Figure 4. PolySTAND of observed essay score per matching variable 1 score for an issue
prompt (I35).
White Versus African American Comparison for the Argument Prompts Table 6 shows the summary of the DIF analysis of the Issue prompts between the White
and African American groups for the 10 prompts that exhibited the highest overall mean rank
based on ranked DIF values from two of the DIF procedures (i.e., Mantel, polySTAND). In
addition to the rankings for the two procedures and the overall ranking, the PS EZ value is
displayed. It should be recalled that the logistic regression procedure was not used for all of the
racial/ethnic group comparisons due to the small sample sizes for the focal groups. For this
reason, the overall mean ranks for all of the racial/ethnic group comparisons are based on only
the Mantel-Haenszel and polySTAND procedures.
22
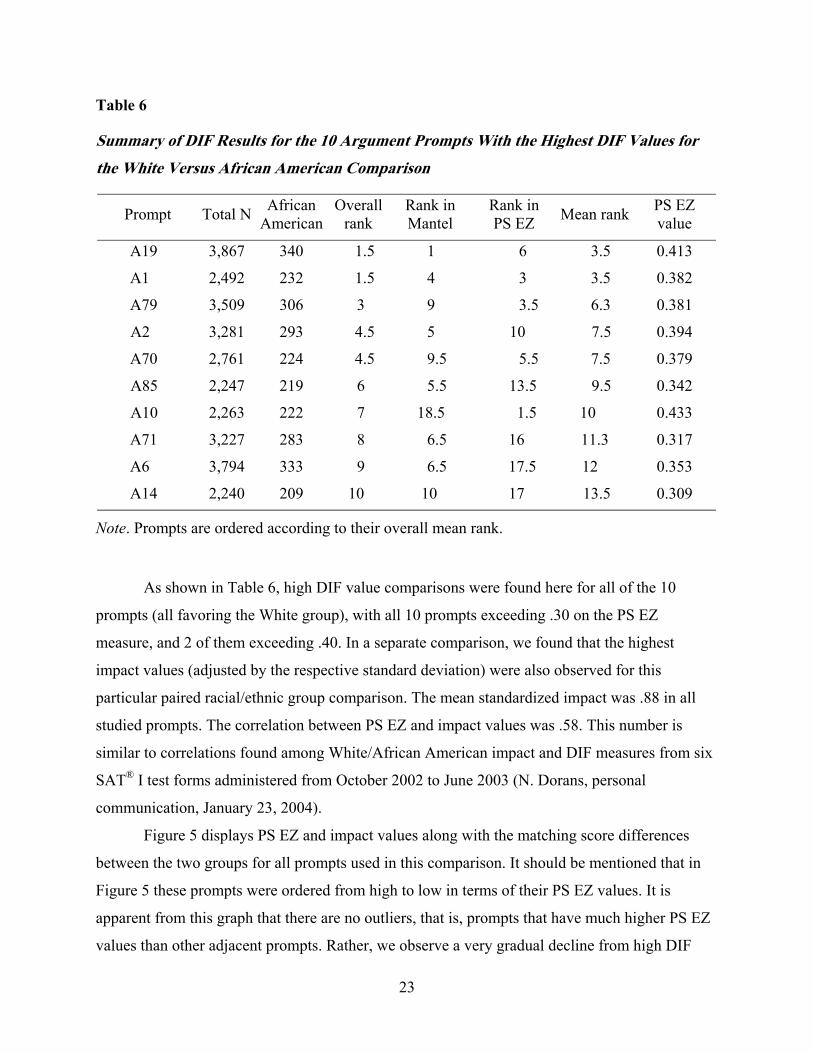
Table 6
Summary o DIF Results for the 10 Argument Prompts With the Highest DIF Values for the White Versus African American Comparison
f
Prompt Total N African American
Overallrank
Rank in Mantel
Rank in PS EZ Mean rank PS EZ
value
A19 3,867 340 1.5 1 6 3.5 0.413
A1 2,492 232 1.5 4 3 3.5 0.382
A79 3,509 306 3 9 3.5 6.3 0.381
A2 3,281 293 4.5 5 10 7.5 0.394
A70 2,761 224 4.5 9.5 5.5 7.5 0.379
A85 2,247 219 6 5.5 13.5 9.5 0.342
A10 2,263 222 7 18.5 1.5 10 0.433
A71 3,227 283 8 6.5 16 11.3 0.317
A6 3,794 333 9 6.5 17.5 12 0.353
A14 2,240 209 10 10 17 13.5 0.309
Note. Prompts are ordered according to their overall mean rank.
As shown in Table 6, high DIF value comparisons were found here for all of the 10
prompts (all favoring the White group), with all 10 prompts exceeding .30 on the PS EZ
measure, and 2 of them exceeding .40. In a separate comparison, we found that the highest
impact values (adjusted by the respective standard deviation) were also observed for this
particular paired racial/ethnic group comparison. The mean standardized impact was .88 in all
studied prompts. The correlation between PS EZ and impact values was .58. This number is
similar to correlations found among White/African American impact and DIF measures from six
SAT® I test forms administered from October 2002 to June 2003 (N. Dorans, personal
communication, January 23, 2004).
Figure 5 displays PS EZ and impact values along with the matching score differences
between the two groups for all prompts used in this comparison. It should be mentioned that in
Figure 5 these prompts were ordered from high to low in terms of their PS EZ values. It is
apparent from this graph that there are no outliers, that is, prompts that have much higher PS EZ
values than other adjacent prompts. Rather, we observe a very gradual decline from high DIF
23
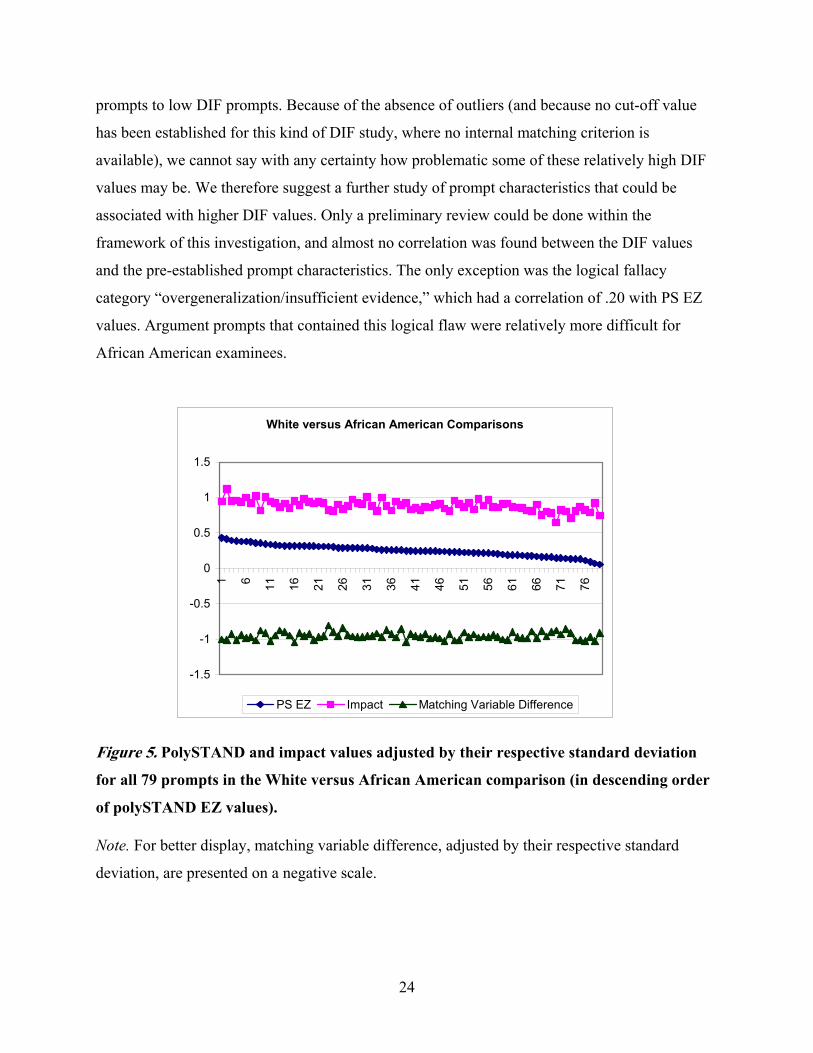
prompts to low DIF prompts. Because of the absence of outliers (and because no cut-off value
has been established for this kind of DIF study, where no internal matching criterion is
available), we cannot say with any certainty how problematic some of these relatively high DIF
values may be. We therefore suggest a further study of prompt characteristics that could be
associated with higher DIF values. Only a preliminary review could be done within the
framework of this investigation, and almost no correlation was found between the DIF values
and the pre-established prompt characteristics. The only exception was the logical fallacy
category “overgeneralization/insufficient evidence,” which had a correlation of .20 with PS EZ
values. Argument prompts that contained this logical flaw were relatively more difficult for
African American examinees.
White versus African American Comparisons
-1.5
-1
-0.5
0
0.5
1
1.5
1 6 11 16 21 26 31 36 41 46 51 56 61 66 71 76
PS EZ Impact Matching Variable Difference
Figure 5. PolySTAND and impact values adjusted by their respective standard deviation
for all 79 prompts in the White versus African American comparison (in descending order
of polySTAND EZ values).
Note. For better display, matching variable difference, adjusted by their respective standard
deviation, are presented on a negative scale.
24
However, there might be other features that have not been captured by the present
classification scheme that could be present in the prompts showing relatively high DIF values.
Given the results of this investigation, GRE test development experts may want to conduct
further content analyses of the prompt texts and develop alternative classifications.
It is more likely that less tangible characteristics are responsible for higher DIF in certain
prompts, and that these characteristics will defy easy categorization. Or possibly, certain
combinations of characteristics may play a role. One relatively easy and worthwhile avenue to
follow would be a categorization of sentence complexity and the number of different points
made in the text (different from text length), which increases processing load and perhaps affects
prompt difficulty on a differential basis for different examinee subgroups.
The identification of groups of DIF prompts via content analysis was mixed. Of four
reviewers, two identified both groups correctly, while two identified only one group correctly
(i.e., no better than chance). The two who identified both groups correctly were both reviewers
from racial/ethnic minorities (African American and Hispanic), while the other two reviewers
were White.
Reviewers noted that the Argument prompts with the highest DIF values were ones that
contained a greater number of statements. Moreover, these statements were relatively complex.
(As one reviewer noted, “One can get lost in the topic.”) In contrast, the non-DIF groups of
prompts were said to have a very light reading load. For example, about one particular prompt, a
reviewer noted that “one point leads to the next, they build on each other.”
White Versus African American Comparison for the Issue Prompts In contrast to their Argument counterparts, the Issue prompts shown in Table 7 all
exhibited much smaller PS EZ DIF values for the White versus African American comparison,
with none exceeding .30 and only six exceeding .25, even though all of these prompts favored
the White group. Therefore, no further review was undertaken for prompts in this comparison.
25
Table 7
Summary o DIF Results for the 10 Issue Prompts With the Highest DIF Values for the White Versus African American Comparison
f
Prompt # Total N African American
Overall rank
Rank in Mantel
Rank in PS EZ
Mean rank
PS EZ value
I93 3,115 273 1 1 5 3 0.277
I60 3,838 359 2.5 2 4.5 3.3 0.295
I43 2,368 270 2.5 5.5 1 3.3 0.291
I34 2,139 242 4 4.5 6 5.3 0.262
I15 1,831 238 5.5 5.5 8 6.8 0.239
I94 2,957 324 5.5 11 2.5 6.8 0.291
I13 4,140 449 7 13 5.5 9.3 0.265
I26 2,962 284 8 3.5 17.5 10.5 0.203
I22 3,328 407 9 11.5 11.5 11.5 0.227
I71 4,317 386 10 13.5 13 13.3 0.211
Note. Prompts are ordered according to their overall mean rank.
White Versus Hispanic Comparison for the Argument Prompts The 10 highest PS EZ values in this comparison, shown in Table 8, are smaller than those
in the White versus African American group comparison for the Argument prompt type. The
average impact of the 67 studied prompts was also lower (.47) than that of those in the White
versus African American group comparison, favoring the focal (White) group. The extent of DIF
found was comparable to that found in the Issue prompt comparison in the White versus African
American comparison. Nevertheless, the decision was made to submit low and high DIF prompts
for expert review to gather information about characteristics that could negatively affect this
group. Also, the Argument prompts seemed to lend themselves better to in-depth content
analysis than did the Issue prompts because they provide more concrete contexts for analysis and
thinking.
26
Table 8
Summary o DIF Results for the 10 Argument Prompts With the Highest DIF Values for the White Versus Hispanic Comparison
f
Prompt # Total N Hispanic American
Overall rank
Rank in Mantel
Rank in PS EZ Mean rank PS EZ
value
A85 2,247 151 1 5 1.5 3.3 0.308
A108 4,419 231 2 2.5 4.5 3.5 0.264
A83 2,936 188 3 4.5 4.5 4.5 0.281
A6 3,794 195 4 2 8 5 0.265
A106 2,874 176 5 6 5.5 5.8 0.241
A68 4,516 265 6.5 4 10 7 0.239
A78 2,877 172 6.5 5 9 7 0.234
A38 3,245 178 8 10 6 8 0.235
A31 3,320 188 9 11.5 6.5 9 0.268
A76 2,244 160 10 13 7.5 10.3 0.231
Note. Prompts are ordered according to their overall mean rank.
The results of the reviewers’ analysis were similar to the ones described before: Two
reviewers identified the groups correctly, while two other reviewers identified only one of the
DIF groups. Of the two who identified both groups correctly, one was White and one was a
member of a racial/ethnic minority group (African American). Of the other two reviewers, one
was also White and the other was a member of a racial/ethnic minority group (Hispanic
American). No substantial correlations were found between DIF values and other predefined
prompt characteristics. While the five prompts with the highest PS EZ values were all in the
category “causation versus correlation,” the correlation between the PS EZ values and the
classification codes for the “causation versus correlation/reasonableness” category over all
prompts was only .12.
The main characteristic that was identified as being common to high-DIF prompts was a
high quantitative content, which was hypothesized to confuse lower ability examinees from the
Hispanic American group: “The numbers in the prompt texts make you think you have to do
27
something with them,” one reviewer noted. Moreover, when there was quantitative content in the
non-DIF prompts, the task seemed simpler.
Again, a higher reading load was mentioned for the prompts exhibiting higher DIF. In
contrast, the prompts with low DIF values dealt more with social topics, and it was argued that
social commitment levels are high among members of this racial/minority group, which could
help offset other effects that might lead to a disadvantage for this group.
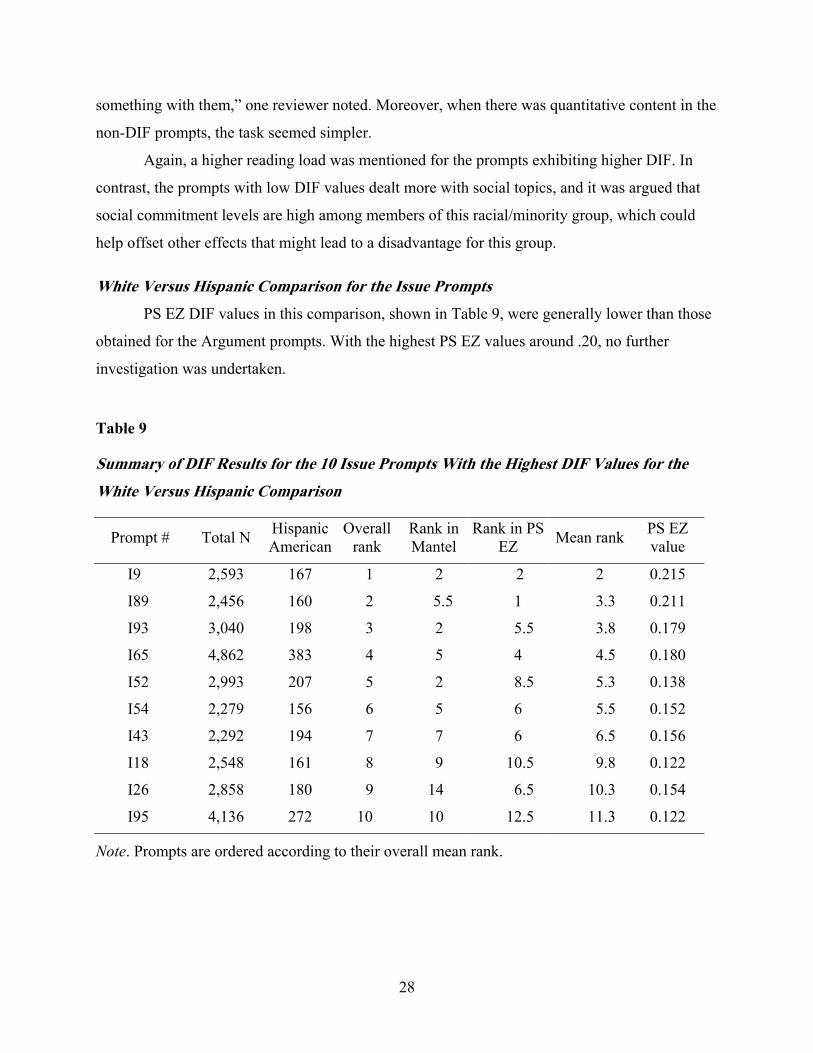
White Versus Hispanic Comparison for the Issue Prompts PS EZ DIF values in this comparison, shown in Table 9, were generally lower than those
obtained for the Argument prompts. With the highest PS EZ values around .20, no further
investigation was undertaken.
Table 9
Summary o DIF Results for the 10 Issue Prompts With the Highest DIF Values for the White Versus Hispanic Comparison
f
Prompt # Total N Hispanic American
Overall rank
Rank in Mantel
Rank in PS EZ Mean rank PS EZ
value
I9 2,593 167 1 2 2 2 0.215
I89 2,456 160 2 5.5 1 3.3 0.211
I93 3,040 198 3 2 5.5 3.8 0.179
I65 4,862 383 4 5 4 4.5 0.180
I52 2,993 207 5 2 8.5 5.3 0.138
I54 2,279 156 6 5 6 5.5 0.152
I43 2,292 194 7 7 6 6.5 0.156
I18 2,548 161 8 9 10.5 9.8 0.122
I26 2,858 180 9 14 6.5 10.3 0.154
I95 4,136 272 10 10 12.5 11.3 0.122
Note. Prompts are ordered according to their overall mean rank.
28
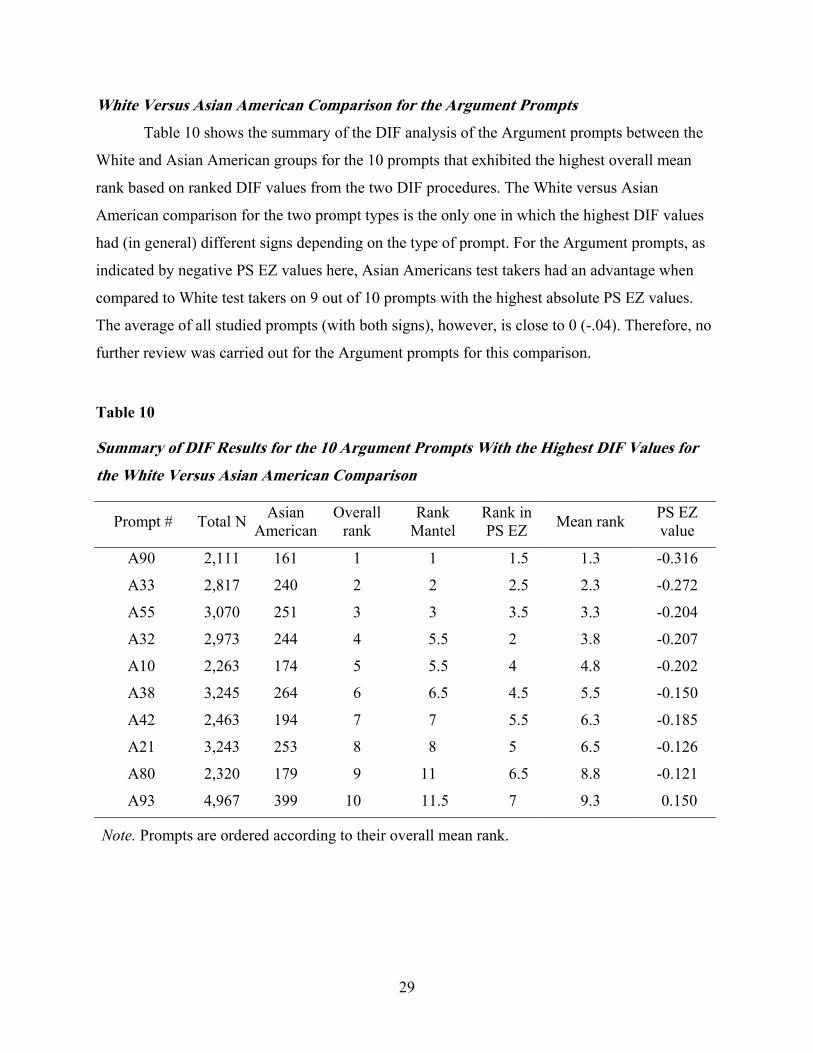
White Versus Asian American Comparison for the Argument Prompts Table 10 shows the summary of the DIF analysis of the Argument prompts between the
White and Asian American groups for the 10 prompts that exhibited the highest overall mean
rank based on ranked DIF values from the two DIF procedures. The White versus Asian
American comparison for the two prompt types is the only one in which the highest DIF values
had (in general) different signs depending on the type of prompt. For the Argument prompts, as
indicated by negative PS EZ values here, Asian Americans test takers had an advantage when
compared to White test takers on 9 out of 10 prompts with the highest absolute PS EZ values.
The average of all studied prompts (with both signs), however, is close to 0 (-.04). Therefore, no
further review was carried out for the Argument prompts for this comparison.
Table 10
Summary o DIF Results for the 10 Argument Prompts With the Highest DIF Values for the White Versus Asian American Comparison
f
Prompt # Total N Asian American
Overall rank
Rank Mantel
Rank in PS EZ Mean rank PS EZ
value
A90 2,111 161 1 1 1.5 1.3 -0.316
A33 2,817 240 2 2 2.5 2.3 -0.272
A55 3,070 251 3 3 3.5 3.3 -0.204
A32 2,973 244 4 5.5 2 3.8 -0.207
A10 2,263 174 5 5.5 4 4.8 -0.202
A38 3,245 264 6 6.5 4.5 5.5 -0.150
A42 2,463 194 7 7 5.5 6.3 -0.185
A21 3,243 253 8 8 5 6.5 -0.126
A80 2,320 179 9 11 6.5 8.8 -0.121
A93 4,967 399 10 11.5 7 9.3 0.150
Note. Prompts are ordered according to their overall mean rank.
29
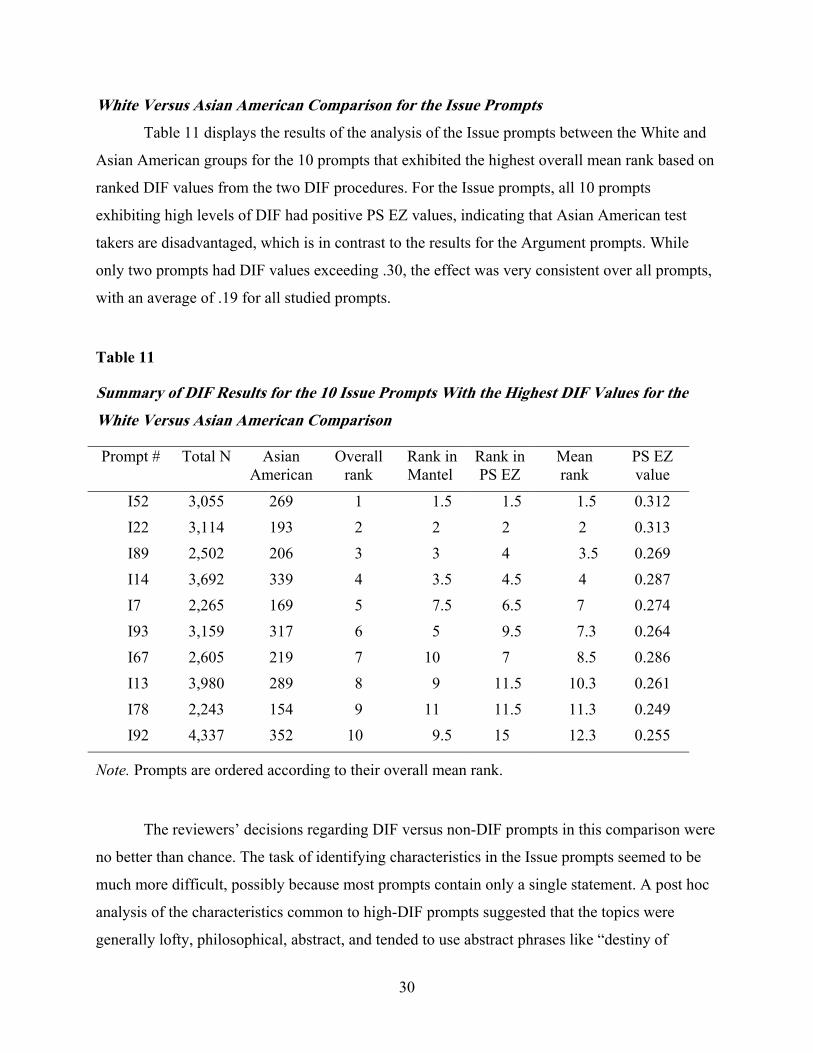
White Versus Asian American Comparison for the Issue Prompts Table 11 displays the results of the analysis of the Issue prompts between the White and
Asian American groups for the 10 prompts that exhibited the highest overall mean rank based on
ranked DIF values from the two DIF procedures. For the Issue prompts, all 10 prompts
exhibiting high levels of DIF had positive PS EZ values, indicating that Asian American test
takers are disadvantaged, which is in contrast to the results for the Argument prompts. While
only two prompts had DIF values exceeding .30, the effect was very consistent over all prompts,
with an average of .19 for all studied prompts.
Table 11
Summary o DIF Results for the 10 Issue Prompts With the Highest DIF Values for the White Versus Asian American Comparison
f
Prompt # Total N Asian American
Overall rank
Rank in Mantel
Rank in PS EZ
Mean rank
PS EZ value
I52 3,055 269 1 1.5 1.5 1.5 0.312 I22 3,114 193 2 2 2 2 0.313 I89 2,502 206 3 3 4 3.5 0.269 I14 3,692 339 4 3.5 4.5 4 0.287 I7 2,265 169 5 7.5 6.5 7 0.274 I93 3,159 317 6 5 9.5 7.3 0.264 I67 2,605 219 7 10 7 8.5 0.286 I13 3,980 289 8 9 11.5 10.3 0.261 I78 2,243 154 9 11 11.5 11.3 0.249 I92 4,337 352 10 9.5 15 12.3 0.255
Note. Prompts are ordered according to their overall mean rank.
The reviewers’ decisions regarding DIF versus non-DIF prompts in this comparison were
no better than chance. The task of identifying characteristics in the Issue prompts seemed to be
much more difficult, possibly because most prompts contain only a single statement. A post hoc
analysis of the characteristics common to high-DIF prompts suggested that the topics were
generally lofty, philosophical, abstract, and tended to use abstract phrases like “destiny of
30
society” or “the condition of humanity” — concepts that may have different cross-cultural
connotations.
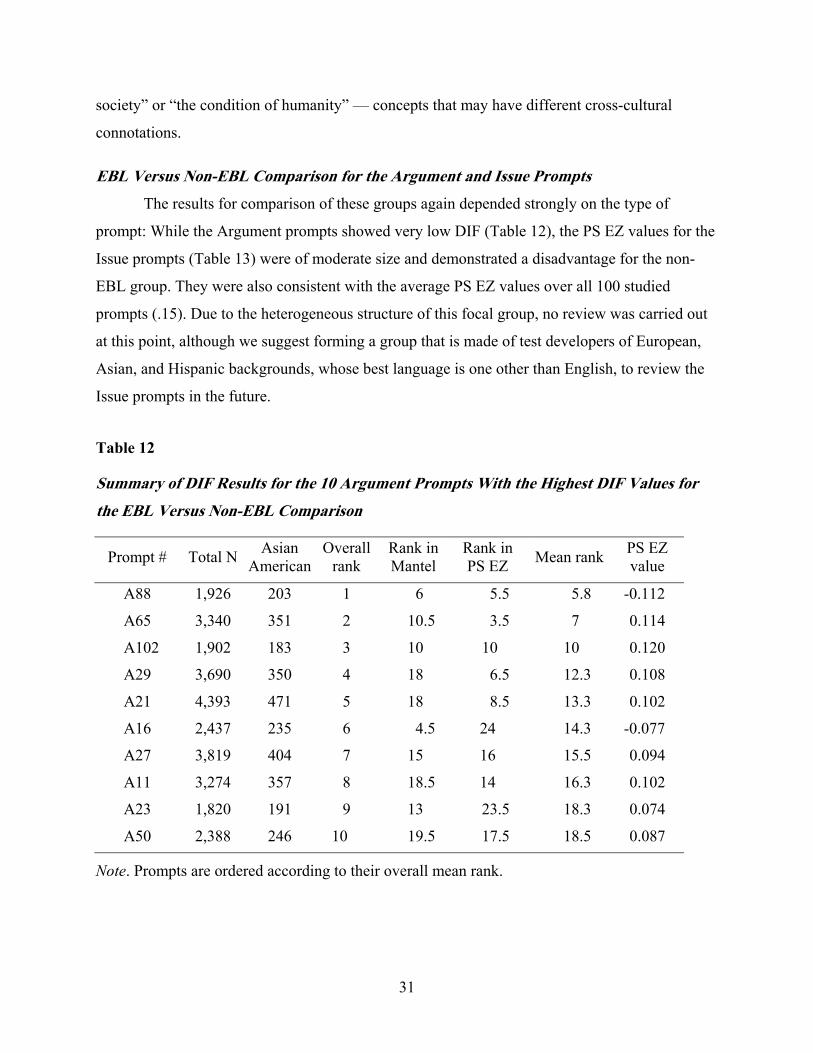
EBL Versus Non-EBL Comparison for the Argument and Issue Prompts The results for comparison of these groups again depended strongly on the type of
prompt: While the Argument prompts showed very low DIF (Table 12), the PS EZ values for the
Issue prompts (Table 13) were of moderate size and demonstrated a disadvantage for the non-
EBL group. They were also consistent with the average PS EZ values over all 100 studied
prompts (.15). Due to the heterogeneous structure of this focal group, no review was carried out
at this point, although we suggest forming a group that is made of test developers of European,
Asian, and Hispanic backgrounds, whose best language is one other than English, to review the
Issue prompts in the future.
Table 12
Summary o DIF Results for the 10 Argument Prompts With the Highest DIF Values for the EBL Versus Non-EBL Comparison
f
Prompt # Total N Asian American
Overall rank
Rank in Mantel
Rank in PS EZ Mean rank PS EZ
value
A88 1,926 203 1 6 5.5 5.8 -0.112
A65 3,340 351 2 10.5 3.5 7 0.114
A102 1,902 183 3 10 10 10 0.120
A29 3,690 350 4 18 6.5 12.3 0.108
A21 4,393 471 5 18 8.5 13.3 0.102
A16 2,437 235 6 4.5 24 14.3 -0.077
A27 3,819 404 7 15 16 15.5 0.094
A11 3,274 357 8 18.5 14 16.3 0.102
A23 1,820 191 9 13 23.5 18.3 0.074
A50 2,388 246 10 19.5 17.5 18.5 0.087
Note. Prompts are ordered according to their overall mean rank.
31
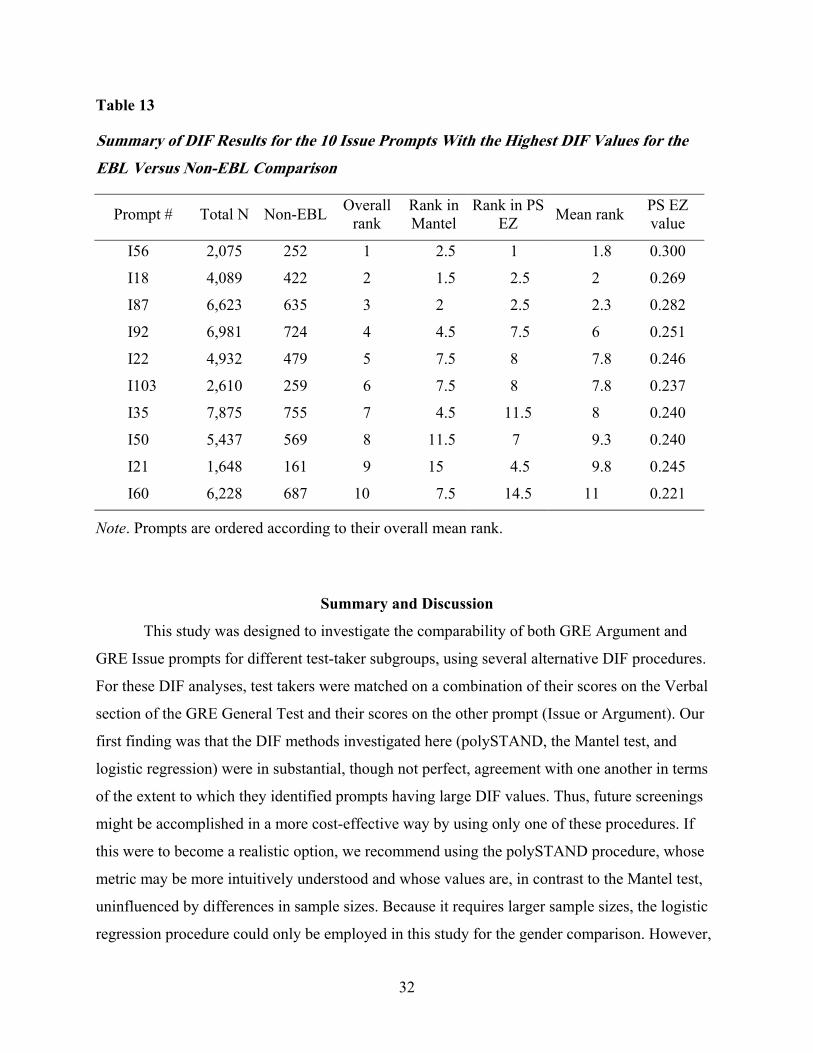
Table 13
Summary o DIF Results for the 10 Issue Prompts With the Highest DIF Values for the EBL Versus Non-EBL Comparison
f
Prompt # Total N Non-EBL Overall rank
Rank in Mantel
Rank in PS EZ Mean rank PS EZ
value
I56 2,075 252 1 2.5 1 1.8 0.300
I18 4,089 422 2 1.5 2.5 2 0.269
I87 6,623 635 3 2 2.5 2.3 0.282
I92 6,981 724 4 4.5 7.5 6 0.251
I22 4,932 479 5 7.5 8 7.8 0.246
I103 2,610 259 6 7.5 8 7.8 0.237
I35 7,875 755 7 4.5 11.5 8 0.240
I50 5,437 569 8 11.5 7 9.3 0.240
I21 1,648 161 9 15 4.5 9.8 0.245
I60 6,228 687 10 7.5 14.5 11 0.221
Note. Prompts are ordered according to their overall mean rank.
Summary and Discussion
This study was designed to investigate the comparability of both GRE Argument and
GRE Issue prompts for different test-taker subgroups, using several alternative DIF procedures.
For these DIF analyses, test takers were matched on a combination of their scores on the Verbal
section of the GRE General Test and their scores on the other prompt (Issue or Argument). Our
first finding was that the DIF methods investigated here (polySTAND, the Mantel test, and
logistic regression) were in substantial, though not perfect, agreement with one another in terms
of the extent to which they identified prompts having large DIF values. Thus, future screenings
might be accomplished in a more cost-effective way by using only one of these procedures. If
this were to become a realistic option, we recommend using the polySTAND procedure, whose
metric may be more intuitively understood and whose values are, in contrast to the Mantel test,
uninfluenced by differences in sample sizes. Because it requires larger sample sizes, the logistic
regression procedure could only be employed in this study for the gender comparison. However,
32
this procedure may become a more feasible DIF research tool for the GRE after further data
collection, since it is not only capable of answering questions about nonuniform DIF (across
different score levels), but can also be used to study possible interaction between groups (e.g.,
between racial/ethnic groups and gender groups or between gender groups and groups
determined by the examinees’ major field of study).
We also found, as expected, that the matching variables that were available for studying
DIF in essay prompts were not entirely adequate, since they do not constitute a truly internal
matching criterion. Moreover, as one of the reviewers of this report noted, because GRE Verbal
and Writing scores measure different constructs, they cannot be expected to order subgroups of
test takers in the same way. This reviewer thus questioned whether it made sense
psychometrically to use GRE Verbal scores as part of the matching criterion, and he was
concerned that using this criterion might result in the flagging of some prompts simply because
they were less highly related to verbal ability. This point is indisputable, of course, and suggests
the need for an extremely thorough review of any flagged prompts, and the development of
compelling rationales, before any action is taken.
To prove that a less construct-relevant matching variable is likely to result in inaccurately
high DIF values rather than in decreased detection power, we decreased the purity of the
matching variable further by substituting the GRE quantitative ability score for the GRE verbal
ability score. This substitution indeed resulted in considerably higher DIF values, again
reinforcing the need for caution when making any decisions about the possible lack of fairness of
flagged prompts.
Of the two matching variables used in the analysis (both of which entailed a composite
score of the GRE Verbal section plus the other prompt), the matching variable in which the other
prompt score received more weight than in the Verbal matching variable, resulted in lower DIF
values. This is also consistent with the findings from Welch and Miller’s (1995) study on writing
prompt DIF.
In order to better understand how another factor might influence DIF values, for some
gender comparisons we increased the numbers within each score category (by decreasing the
number of levels of the matching variables from 30 to 10), and evaluated the effect of this
modification. Our interest in the cruder, 10-level matching related to the fact that many prompts
in the racial/ethnic group comparisons relied on relatively small sample sizes, which permitted us
33

to divide the matching variables into only 10 levels. The effect of fat matching (i.e., larger
samples within score categories) was higher DIF values for the gender comparisons, indicating
that DIF values would likely have been lower for the ethnic group comparisons if larger sample
sizes had been available for “thinner matching.”
Thus, under optimal conditions for DIF analysis (that is, with a pure matching criterion
and larger sample sizes), DIF values would most likely have been lower than those computed in
this study, although it is not known by how much. Because our matching criterion was not
entirely adequate, a possibility for eventual follow-up research would entail developing a better
matching variable (for example, by asking GRE test takers to write multiple essays on various
GRE writing prompts, thus providing a truer internal matching criterion). The DIF values found
in the presence of such a matching criterion could be compared to those obtained using the two
matching variables used here. The difference of DIF values in this study and the proposed
follow-up could provide insight as to how much the DIF values found in our more economical
approach were inflated as a result of our using a less construct-related matching criterion. In the
event that the differences are consistent over several prompts and groups, and taking into
consideration other factors like impact and sample size, one could use this information to define
new flagging values for prompts that lack a purely internal matching criterion.
Because of the reasons detailed above, we decided against flagging prompts based on
specific cut-off values. Instead, we ranked all prompts based on averaged ranks over different
DIF methods and conducted a preliminary analysis of prompt characteristics that could be
associated with higher DIF values.
The largest DIF values to the disadvantage of the focal group were found for the African
American group for the Argument prompts. Moderate values were observed for the African
American, Asian American, and the non-EBL groups for the Issue prompts and for the Hispanic
group for the Argument prompts. To the advantage of the focal group, moderate DIF values were
found for the Asian American group for the Argument prompts, and low (although consistent)
values were observed in the gender comparison (favoring the female group) for both prompt
types.
Even though prompts showed a range of DIF values, no outliers (i.e., prompts that
exhibited substantially higher DIF values than the others) were found. Our analyses did not,
therefore, suggest the need to delete any prompts from the currently used pools of GRE
34
Argument and Issue prompts. However, we suggest that further investigation may be necessary
to ensure that some combinations of Issue and Argument prompts (i.e., high-ranked Argument
prompts paired with high-ranked Issue prompts) are avoided, especially for African American
test takers.
Finally, this investigation took preliminary steps to link DIF values to prompt
characteristics, but further investigation in this area is clearly indicated. Pre-established prompt
features showed only low to moderate correlations with DIF values. For example, with respect to
gender comparisons for the Argument prompts, DIF values correlated .29 with whether or not
topics dealt with health and safety issues (health/safety topics being even more easy for women
than other topics). Most characteristics, however, showed no relationship at all with DIF values.
However, there might be other features that have not been captured by the existing classification
scheme that could account for relatively high DIF for certain groups for the prompts we studied.
Based on the DIF results provided in this investigation, GRE test development experts might
wish to develop alternative classifications of prompts that can be used to further analyze prompt
texts.
It is more likely that less tangible, harder-to-classify characteristics are responsible for
higher DIF in certain prompts. As suggested by our expert reviewers, one relatively easy and
possibly worthwhile avenue to explore would be a categorization of sentence complexity and an
analysis of the number of different points made in the text (in contrast to overall text length),
which increases processing load. These points were mentioned as one possible factor that might
explain the relatively higher DIF values in the Argument prompt for the African American and
Hispanic groups. For the latter group, the high quantitative content of some prompts was
hypothesized to be another characteristic that might contribute to higher DIF values.
Finally, we suggest that the kind of review we have begun here might be broadened,
perhaps by including more reviewers with ethnic minority backgrounds. These additional
reviewers and a broader classification scheme might in turn provide additional insights that could
be incorporated in future reviews of new prompts before they are employed operationally. We
also note that the content of all GRE prompts is routinely reviewed for the potential introduction
of bias against a particular group. Notes from this content or sensitivity review could also be
incorporated in this review process in the future.
35

References
Ackerman, T. A. (1992). A didactic explanation of item bias, item impact, and item validity from
a multidimensional perspective. Journal of Educational Measurement, 29(1), 67-91.
Agresti, A.(1990). Categorical data analysis. New York: Wiley.
Angoff, W. H. (1993). Perspectives on differential item functioning methodology. In P. W.
Holland & H. Wainer (Eds.), Differential item functioning (pp. 3-23). Hillsdale, NJ:
Lawrence Erlbaum.
Clauser, B. E., & Mazor, K. M. (1998). Using statistical procedures to identify differentially
functioning test items. Educational Measurement: Issues and Practice, 17(1), 31-44.
Clauser, B. E., Nungester, R. J., Mazor, K., & Ripkey, D. (1996). A comparison of alternative
matching strategies for DIF detection in tests that are multidimensional. Journal of
Educational Measurement, 33, 202-214.
Donogue, J. R., & Allen, N. L. (1993). Thin versus thick matching in the Mantel-Haenszel
procedure for detecting DIF. Journal of Educational Statistics, 18(2), 131-154.
Dorans, N. J., & Kulick, E. (1986). Demonstrating the utility of the standardization approach to
assessing unexpected differential item performance on the Scholastic Aptitude Test.
Journal of Educational Measurement, 23, 355-368.
Dorans, N. J., & Schmitt, A. (1993). Constructed response and differential item functioning: A
pragmatic approach (ETS RR-91-47). Princeton, NJ: ETS.
ETS. (2004). The writing assessment. Retrieved November 1, 2004, from the GRE Web site at
http://www.gre.org/stuwrit.html.
French, A. W., & Miller, T. R. (1996). Logistic regression and its use in detecting differential
item functioning in polytomous items. Journal of Educational Measurement, 33, 315-
332.
Hambleton, R. K., Swaminathan, H., & Rogers, H. J. (1991). Fundamentals of item response
theory. Newbury Park, CA: Sage.
Holland, P. W., & Thayer, D. T. (1988). Differential item performance and the Mantel-Haenszel
procedure. In H. Wainer & H. I. Braun (Eds.), Test validity (pp. 129-145). Hillsdale, NJ:
Lawrence Erlbaum.
36
Jodoin, M. G., & Gierl, M. J. (2001). Evaluating Type I error and power rates using an effect size
measure with the logistic procedure for DIF detection. Applied Measurement in
Education, 14, 329-349.
Lee, Y.-W., Breland, H., & Muraki, E. (2004). Comparability of TOEFL CBT essay prompts for
different native language group (TOEFL RR-77). Princeton, NJ: ETS.
Mantel. N. (1963). Chi-square test with one degree of freedom: Extensions of the Mantel-
Haenszel procedure. Journal of American Statistical Association, 58, 690-700.
Mantel, N., & Haenszel, W. (1959). Statistical aspects of the analysis of data from retrospective
studies of disease. Journal of the National Cancer Institute, 22, 719 – 748.
Mellenbergh, G. J. (1982). Contingency table models for assessing item bias. Journal of
Educational Statistics, 7, 105-107.
Miller, T., & Spray, J. A. (1993). Logistic discriminant function analysis for DIF identification
of polytomously scored items. Journal of Educational Measurement, 30, 107-122.
Penfield, R. D., & Lam, T. C. M. (2000). Assessing differential item functioning in performance
assessment: Review and recommendations. Educational Measurement: Issues and
Practice, 20, 19(3), 5-15.
Potenza, M. T., & Dorans, N. J. (1995). DIF assessment for polytomously-scored items: A
framework for classification and evaluation. Applied Psychological Measurement, 19,
23-37.
Raju, N. (1988). The area between two item characteristic curves. Psychometrika, 54, 495-502.
Shealy, R., & Stout, W. (1993). A model-based standardization approach that separates true bias
from group ability differences and detects test bias as well as item bias. Psychometrika,
58, 159-194.
Sireci, S. G., Harter, J., Yang, Y., & Bhola, D. (2003). Evaluating the equivalence of an
employee attitude survey across languages, cultures, and administration formats.
International Journal of Testing, 3, 129-150.
Sireci, S. G., Yang, Y., Harter, J., & Ehrlich, E. (2004, April). Evaluating guidelines for test
adaptations: An empirical analysis of translation quality. Paper presented at the 2004
annual meeting of the National Council on Measurement in Education, San Diego, CA.
SPSS (1999). SPSS Base 10.0 User’s guide. Chicago, IL: SPSS.
37
Swaminathan, H., & Rogers, J. (1990). Detecting differential item functioning using logistic
regression procedures. Journal of Educational Measurement, 27, 361-370.
Tateneni, K. (2001). Essay performance of male and female candidates taking the AP English
Language and English Literature Exams. (Analysis paper for the Advanced Placement
Exam). Princeton, NJ: Educational Testing Service.
Thissen, D., Steinberg, L., & Wainer, H. (1993). Detection of differential item functioning using
the parameters of item response models. In P. W. Holland & H. Wainer (Eds.),
Differential item functioning (p. 3-23). Hillsdale, NJ: Lawrence Erlbaum.
Wainer, H., Sereci, S. G., & Thissen, D. (1991). Differential testlet functioning: Definitions and
detection. Journal of Educational Measurement, 28, 197-219.
Welch, C., & Miller, T. (1995). Assessing differential item functioning in direct writing
assessments: Problems and an example. Journal of Educational Measurement, 32, 163-
178.
Williams, V. S. L. (1997). The “unbiased” anchor: Bridging the gap between DIF and item bias.
Applied Measurement in Education, 10, 253-267.
Zumbo, B. D. (1999). A handbook on the theory and methods of differential item functioning
(DIF): Logistic regression modeling as a unitary framework for binary and Likert-type
(ordinal) item scores. Ottawa, Ontario, Canada: Directorate of Human Resources
Research and Evaluation, Department of National Defense.
Zwick R., & Thayer, D. T. (1996). Evaluating the magnitude of differential item functioning in
polytomous items. Journal of Educational Statistics, 21, 187-201.
38
Notes 1 It was referred to in the proposal as the “Generalized Mantel-Haenszel” procedure, but a
reviewer noted that this was an imprecise term that has been wrongly repeated in some
literature. 2 One can argue that IRT-based methodology can also be used by obtaining theta estimates from
a calibration of only two essay prompts (i.e., the studied prompt plus the other prompt)
assigned to each examinee in the writing section, and using the estimate as an internal matching
variable. It should be noted, however, that the examinees do not take the same pair of Issue and
Argument prompts on the computer-based GRE. Rather, the testing software selects Argument
prompts from a pool of prompts and assigns one prompt to each examinee. The examinees also
have the option of choosing one prompt out of the two Issue prompts from a pair of the prompts
assigned to each examinee. For this reason, using an IRT-based methodology for prompt DIF
investigation is not straightforward. 3 One can say that this weighting scheme seems rather arbitrary, and a more elaborate
methodology (e.g., IRT item information statistics) could also have been used to decide the
optimal worth of a single polytomously scored essay item, compared to a single dichotomously
scored multiple-choice item. It should be pointed out, however, that the main reason for using
the second matching variable was to examine the impact on DIF of decreasing the weight of the
more construct-relevant (essay) component to the matching variable, whatever the weighting
scheme is. In that sense, the psychometric stringency in deciding an optimal weight for the
essay item is not an important issue in this study. 4 No smoothing was carried out in this investigation. 5 One can argue that rank-ordering prompts based on DIF values in each method does not take
into account actual variability among prompts in terms of DIF values. Thus, while the ranks for
the DIF values for all the prompts analyzed will be very much clustered, the DIF values
themselves may be disperse. Nevertheless, it should be noted that the main reason for
computing the mean ranks of the prompts over different methods is to identify prompts that had
the large DIF values consistently across different methods, for content expert review. 6 It should be noted that the pooled (combined) standard deviation in the case of the polySTAND
measure was used to make the resulting PS EZ values comparable over different prompts. The
resulting PS EZ values show how much a prompt is “DIFed” in terms of a pooled standard
39

deviation for each item. In other words, this is not done to control for different sample sizes
(which does not affect the polySTAND procedure) but for different variability of scores in
different prompts. In contrast, the adjustment in the Mantel test is done to control for different
sample sizes of the prompts that do have an effect on the chi-square statistic. We used the
sample sizes for the smaller (focal) group rather than the total group to make such an
adjustment for the following two reasons: (a) This would be consistent with the categorization
scheme for matching variables, which is based on the smaller group, not the total group, and (b)
this scheme seemed to produce better results (i.e. the ranks of polySTAND procedure and the
Mantel test seemed to be better matched). 7 The data were categorized based on percentile groups, with each group containing
approximately the same number of cases. The procedure “categorize variables” in SPSS (SPSS,
1999) was used to do it. For this reason, the score range for each category depends on the
prompt, not on the way it was categorized.
40
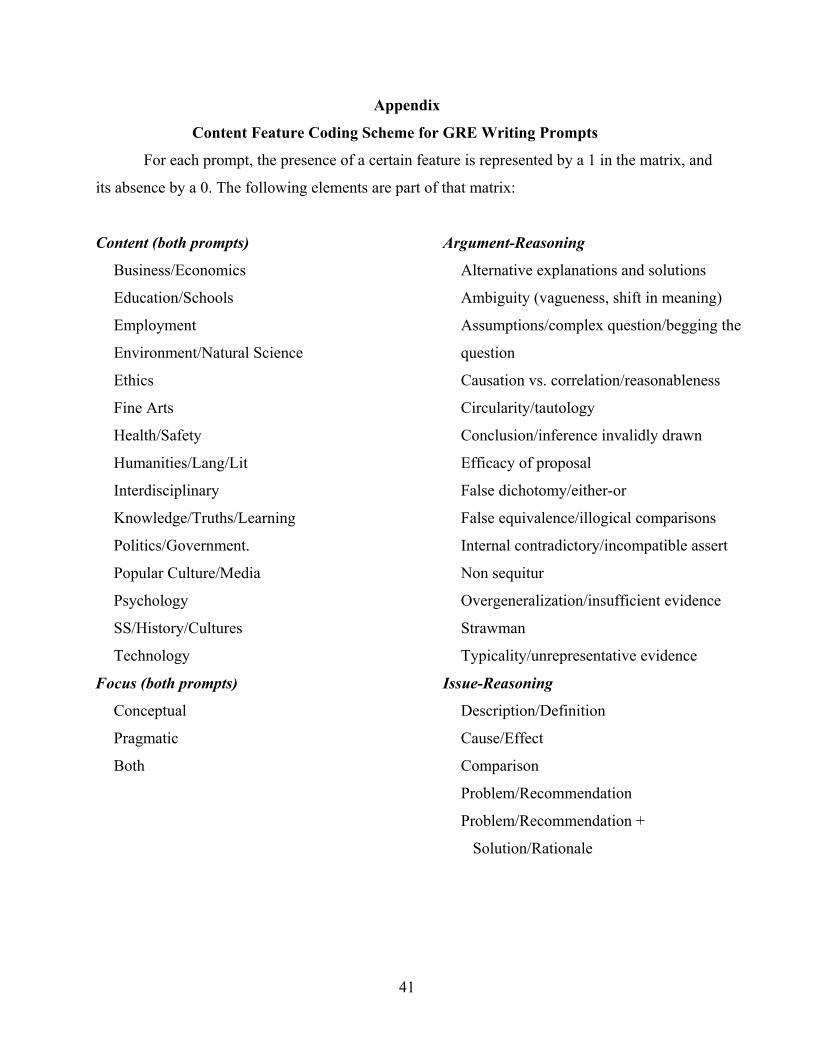
Appendix
Content Feature Coding Scheme for GRE Writing Prompts
For each prompt, the presence of a certain feature is represented by a 1 in the matrix, and
its absence by a 0. The following elements are part of that matrix:
Content (both prompts)
Business/Economics
Education/Schools
Employment
Environment/Natural Science
Ethics
Fine Arts
Health/Safety
Humanities/Lang/Lit
Interdisciplinary
Knowledge/Truths/Learning
Politics/Government.
Popular Culture/Media
Psychology
SS/History/Cultures
Technology
Focus (both prompts)
Conceptual
Pragmatic
Both
Argument-Reasoning
Alternative explanations and solutions
Ambiguity (vagueness, shift in meaning)
Assumptions/complex question/begging the
question
Causation vs. correlation/reasonableness
Circularity/tautology
Conclusion/inference invalidly drawn
Efficacy of proposal
False dichotomy/either-or
False equivalence/illogical comparisons
Internal contradictory/incompatible assert
Non sequitur
Overgeneralization/insufficient evidence
Strawman
Typicality/unrepresentative evidence
Issue-Reasoning
Description/Definition
Cause/Effect
Comparison
Problem/Recommendation
Problem/Recommendation +
Solution/Rationale
41
GRE-ETS PO Box 6000
Princeton, NJ 08541-6000 USA
To obtain more information about GRE programs and services, use one of the following:
Phone: 1-866-473-4373 (U.S., U.S. Territories*, and Canada)
1-609-771-7670 (all other locations)
Web site: www.gre.org
* America Samoa, Guam, Puerto Rico, and US Virgin Islands