ensemble coding of semantic information: are numerical
TRANSCRIPT
Illinois State University Illinois State University
ISU ReD: Research and eData ISU ReD: Research and eData
Theses and Dissertations
6-4-2016
Ensemble Coding Of Semantic Information: Are Numerical Ensemble Coding Of Semantic Information: Are Numerical
Averages Generated In Parallel? Averages Generated In Parallel?
Kassandra R. Lee Illinois State University, [email protected]
Follow this and additional works at: https://ir.library.illinoisstate.edu/etd
Part of the Cognitive Psychology Commons
Recommended Citation Recommended Citation Lee, Kassandra R., "Ensemble Coding Of Semantic Information: Are Numerical Averages Generated In Parallel?" (2016). Theses and Dissertations. 578. https://ir.library.illinoisstate.edu/etd/578
This Thesis is brought to you for free and open access by ISU ReD: Research and eData. It has been accepted for inclusion in Theses and Dissertations by an authorized administrator of ISU ReD: Research and eData. For more information, please contact [email protected].
ENSEMBLE CODING OF SEMANTIC INFORMATION: ARE NUMERICAL
AVERAGES GENERATED IN PARALLEL?
Kassandra R. Lee
54 Pages
Previous research has shown evidence for the activation of ensemble coding
mechanisms at multiple levels of processing complexity (Ariely, 2001; Haberman &
Whitney, 2009). Here we investigated the use of ensemble mechanisms for semantic
information, as well as the role of serial and parallel processing and automaticity in
generating semantic ensemble representations. Twenty-seven undergraduate students
completed tasks in which they reported the average value of an entire digit display or
only a subset of digits, or searched for individual digits within the display. Results show
that participants could average sets of numbers following only a short presentation, and
that reaction times did not increase across increasing display sizes, consistent with
parallel processing. Furthermore, participants were able to attend to a full set of digits,
but accurately report the average of a specific subset without knowing which subset
(defined by color) was relevant ahead of time. Additional research is necessary to further
clarify the role of automaticity in ensemble tasks using semantic information and to
sufficiently control for low-level, perceptual features of the displays.

KEYWORDS: Ensemble Coding, Visual Crowding, Semantic Information

ENSEMBLE CODING OF SEMANTIC INFORMATION: ARE NUMERICAL
AVERAGES GENERATED IN PARALLEL?
KASSANDRA R. LEE
A Thesis Submitted in Partial
Fulfillment of the Requirements
for the Degree of
MASTER OF SCIENCE
Department of Psychology
ILLINOIS STATE UNIVERSITY
2016

© 2016 Kassandra R. Lee

ENSEMBLE CODING OF SEMANTIC INFORMATION: ARE NUMERICAL
AVERAGES GENERATED IN PARALLEL?
KASSANDRA R. LEE
COMMITTEE MEMBERS:
Amrita Puri, Chair
J. Cooper Cutting

i
ACKNOWLEDGMENTS
I would like to thank Dr. Amrita Puri for her continued support, encouragement,
and patience throughout this project. It wouldn’t have been possible without you! I would
also like to thank Dr. Cooper Cutting for his time and advice, Dr. Margaret Nauta for her
input, and Dr. Kenith Sobel for his help with experimental design and stimuli. I want to
thank my cohort (J.B., E.L., D.S., and T.S.) and lab buddy, S.C. for always challenging
me and surrounding me with a great support system. Finally, I would like to send love
and thanks to my fiancé, M.C., and my family for always supporting me.
K. R. L.
ii
CONTENTS
Page
ACKNOWLEDGMENTS i
CONTENTS ii
FIGURES iv
CHAPTER
I. INTRODUCTION TO ENSEMBLE CODING 1
Ensemble Coding of Higher-Level Stimuli 4
Ensemble Coding of Semantic Information 6
Potential Contributions of Parallel vs. Serial Processing to Ensemble
Representations 7
Parallel and Serial Processing For Numerals 10
Automaticity of Ensemble Coding of Numerical Value 11
Current Research 12
II. METHOD 16
Participants 16
Stimuli and Displays 17
Visual Search Tasks 17
Ensemble, Whole Display, Pre-Cue, and Post-Cue Tasks 18
Measures 21
Accuracy 21
Reaction Time 22
Procedure 22
Data Analysis 23
iii
III. RESULTS 25
Serial vs. Parallel Processing 26
Serial Search Task 28
Parallel Search Task 29
Ensemble Task 30
Whole Display Task and Pre-/Post-Cue Tasks 35
Summary of Results 37
IV. DISCUSSION 39
Interpretation and Relevance of Results 39
Serial vs. Parallel Processing in Numerical Ensembles 39
Automaticity of Averaging Numerical Subsets 42
Conclusions, Limitations, and Future Research 44
REFERENCES 48
iv
FIGURES
Figure Page
1. Serial Search and Parallel Search Tasks 18
2. Ensemble Task Display 19
3. Pre-Cue Task Display 20
4. Post-Cue Task Display 21
5. Serial Search RTs 28
6. Parallel Search RTs 29
7. Ensemble Task RTs 32
8. Search and Ensemble Task RTs 33
9. Ensemble Task Accuracy 35
10. Pre-/Post-Cue Tasks v. Comparable Conditions in Whole Display Task 37

1
CHAPTER I
INTRODUCTION TO ENSEMBLE CODING
As we move through our environment, we constantly perceive information that
our sensory systems must selectively sort and process. During an everyday activity such
as walking through a crowded street, there is an abundance of noisy visual information to
be processed. We see bright billboards, street signs, and faces, both familiar and
unfamiliar. For some of these stimuli, it is important to be able to gather specific
information, but for others, it may be more important to extract the gist, or summary
information, about a group of stimuli. Haberman and Whitney (2009) expressed this idea
by describing how we can perceive a field of grass without processing every blade in the
field. In fact, it seems that one function of our visual system is to extract useful
information from groups of similar stimuli all at once, creating an efficient, or rapid and
useful representation of our environment (Ariely, 2001; Chong & Treisman, 2003;
Haberman & Whitney, 2007; Parkes, Lund, Angelucci, Solomon, & Morgan, 2001).
Generating such summary representations is sometimes referred to as ensemble
coding, a process that may reflect simultaneous parallel processing of multiple elements
as opposed to serially processing individual objects (Alvarez, 2011; Ariely, 2001).
Returning to the example of the field, we understand that there are many blades of grass,
and if we choose, we can visually distinguish and examine individual blades of grass.
2
However, processing a field in this way is highly inefficient and not realistic in many
real-world situations. Instead, it appears that our visual system is able to process some
information from all of the blades in parallel, creating a holistic representation of the
field, while sacrificing more detailed information about specific blades (Haberman &
Whitney, 2009).
In a review, Alvarez (2011) emphasizes the importance of ensemble coding by
asking us to consider the visual information that we gather from objects outside the focus
of our attention and/or in our peripheral vision. As observers, we are aware that such
objects are lacking individual detail to the extent that we feel we cannot gather much
useful information from any one of them. One related deficit, deemed ‘visual crowding’,
describes the situation in which objects in our peripheral visual field are more difficult to
perceive in detail because they are surrounded by other objects. Visual crowding has been
shown to occur due to interference between low-level features of stimuli, such as the
orientation of angled lines (Parkes et al., 2001), as well as higher level interference
attributes of stimuli, such as the gender of faces (Farzin, Rivera, & Whitney, 2010; Louie,
Bressler, & Whitney, 2007; Whitney & Levi, 2011). Ensemble coding, or summary-
statistical representation, allows us to combine information about these similar objects
outside of the central vision and recoup a precise measure from the group or set. It has
been shown that generating this average information leads to sacrifices in obtaining
individual details about specific items in a scene (Ariely, 2001; Haberman & Whitney,
2009), but in turn, provides an efficient representation of the whole scene.
3
Ensemble coding has been demonstrated for various types of low-level feature
information, such as the orientation of simple lines or spatial location (Alvarez & Oliva,
2008; Alvarez & Oliva, 2009; Dakin & Watt, 1997; Parkes et al., 2001). For example,
participants are able to select from a group of striped patches which patch contains stripes
of a different angle, or orientation (Dakin & Watt, 1997), and it is also reported that
participants are able to identify average orientation in conditions of reduced attention
(Alvarez & Oliva, 2009). Additionally, Alvarez and Oliva (2008) demonstrated that
participants can gather summary statistical information regarding object location despite
being asked to focus on a distractor task. Participants were able to accurately identify an
average central point of circles after they disappeared from the screen with a level of
accuracy that suggested that they were pooling information from all (rather than a small
subset) of the circles shown during the distractor task.
The visual system has also been shown to form summary statistical
representations of features such as the average size and variability in size of a group of
objects (e.g., Ariely, 2001; Chong & Treisman, 2003; Oriet & Corbett, 2008).
Importantly, Ariely (2001) showed that although participants were able to obtain highly
precise mean information from circle sets, as well as information about the size
variability, they performed relatively poorly when asked to identify specific size
information about any one circle in the set. This finding shows that the ability to identify
mean information is independent of in-depth processing of information from individual
stimuli in the set, and further exemplifies the idea that we do not need to gather detailed
information about specific blades of grass in order to form a useful representation of the
entire field. Additionally, there is evidence for ensemble coding of other low-level
4
features such as direction and speed of motion of groups of stimuli (Watamaniuk,
Sekuler, and Williams, 1989; Williams and Sekuler, 1984). From orientation, shape, and
spatial location to movement direction, it has been shown that we can gather different
types of average information about a variety of low-level features from relatively simple
visual stimuli.
Ensemble Coding of Higher-Level Stimuli
In daily life, even though we naturally must process basic, low-level features of
visual stimuli such as line orientation, our ability to process more complex aspects of
stimuli, such as the identity of objects and faces, is critical to success. In fact, faces in
particular are thought to be processed in a way that is distinct from other classes of
objects. It is thought that upright faces are processed in a holistic manner, taking into
account the ‘global’ configuration of features. But when faces are inverted, we no longer
engage holistic processing; instead, we become reliant on the low-level characteristics of
the individual features (basic contours, brightness, etc.) themselves rather than the
configuration of the whole (Farah, Wilson, Drain, & Tanaka, 1998; Tanaka & Farah,
1993; Valentine, 1988; Yin, 1969). This shows that upright facial processing is unique,
either due to a special mechanism dedicated to face processing, or as some have
proposed, the high degree of expertise that we develop related to facial recognition and
processing (Gauthier & Tarr, 1997).
Haberman and Whitney (2007) demonstrated that summary statistical
representations are generated not only for low-level features of simple stimuli but also for
higher level attributes of complex stimuli such as faces. The authors morphed faces
5
displaying varying emotions and of different genders to produce an array of faces
expressing emotions ranging from happy to sad and neutral to disgusted, and with gender
ranging from male to female. Participants were able to indicate whether a test face
expressed more of one emotion or the other compared to the mean of a group of the
morphed faces shown for only 2 seconds, despite being unable to report emotions from
individual faces in the set. The same pattern was observed for gender. Thus, the
extraction of summary information extends to emotions as well as other high-level
properties of faces such as gender. Haberman and Whitney (2009) further demonstrated
that observers have the ability to flexibly and rapidly (within a 500 ms stimulus
presentation) estimate the average emotional expression of a group of faces even when
the task instructions were unrelated to identifying the mean emotion, suggesting that they
implicitly represented the average expression of the face sets.
Myczek and Simons (2008) argued that participants might create ensemble
representations by gathering information only from a subset while ignoring the full set.
To rule out that possibility, Haberman and Whitney (2010) again used a paradigm that
included groups of face stimuli showing similar emotions. However, two of the faces
displayed emotions different from the rest, making those faces identifiable outliers.
Results showed that participants computed the appropriate summary statistical
representation for the majority of the faces, and appeared to discount the outliers. This is
evidence that participants had to gather information from the full set of stimuli in order to
identify which faces were the outliers before discounting them. This study showed that
observers were able to gather information from a subset when necessary, but still also
gathered information from the full set.
6
Beyond facial expression and gender, Sweeny and Whitney (2014) found
evidence that we can extract mean eye gaze-direction from a crowd of faces. Because
eye-gaze is identified as a high-level cooperation of head and pupil rotation information,
this finding provides additional support that ensemble coding occurs at levels of visual
processing beyond low-level feature information, as demonstrated by previous research
(e.g., De Souza, Eifuki, Tamura, Nishijo, & Ono, 2005; Perrett, et al., 1985). Taken
together, these previous studies have shown that not only can summary information be
gathered from a visual scene, but that this is done implicitly, rapidly, efficiently, and at
different levels of processing complexity.
Ensemble Coding of Semantic Information
In addition to possessing various low-level and more complex visual properties,
many stimuli in the real world are also associated with semantic information.
Alphanumeric characters such as letters and digits are ubiquitous in our daily experience,
and contain not only characteristic low-level perceptual features such as their shape, but
also serve as symbols with specific meanings. Because these characters contain
information representing such different levels of processing, they provide a useful tool
for investigating how higher level semantic information interacts with low-level attributes
to shape visual perception. Sobel, Puri, and Hogan (2014) discuss whether visual
perception is unaffected by higher-level cognition, an idea backed by supporters such as
Pylyshyn (1999) and Firestone and Scholl (2015). Sobel and colleagues challenge this
idea by providing evidence that semantic meaning can influence performance during a
visual search task. This leads to the question, do the mechanisms that support ensemble
7
coding in the visual domain also operate for semantic information? Sobel and colleagues
(2014) reported that when controlling for perceptual differences between stimuli, visual
search for digits was faster when the targets could be grouped based on numerical value,
suggesting that semantic information associated with digits influences visual search
independently of perceptual factors. Do semantic meanings influence ensemble
representations? Van Opstal, de Lange, and Dehaene (2011) showed that ensemble
coding may also occur at a semantic level by demonstrating that participants could
rapidly average and sum groups of Arabic numbers (the numbers were displayed for less
than 800 ms). Further research has demonstrated that participants were able to extract
numeric meaning from familiar digits more quickly than from either familiar letters or
shapes in a classification task (Corbett, Oriet, & Rensink, 2006). These findings are
important because they provide evidence that we are able to extract summary statistical
information at a level even beyond the domain of high-level visual processing.
Potential Contributions of Parallel vs. Serial Processing to Ensemble
Representations
The studies described above demonstrate that the extraction of summary
information occurs very quickly. For example, participants were highly accurate when
judging the average size of a display of objects even when the display was only presented
for only 500 ms (Ariely, 2001). In this same study, it was found that participants’
performance was unaffected as the number of objects in the display increased. This
finding may be indicative of participants’ ability to assess different elements of the
objects simultaneously, or in a parallel manner (Egeth, 1966). For example, in visual
8
search tasks, when the target letters possesses very different features from the distractors
(e.g. an X vs. Os), reaction times (RTs) increase relatively little with additional distractor
items, consistent with the idea that observers process salient, low-level visual attributes of
the items in parallel. On the other hand, when targets contain similar or overlapping
features with the distractors such as a red T among green Ts and red Ls, the visual search
task is completed by serially inspecting each item until the target is found (Duncan &
Humphreys, 1989; Treisman & Gelade, 1980). Because RTs were relatively unaffected
by the number of circles in the display in Ariely’s (2001) study, participants may have
been processing these simple objects in a parallel fashion.
Chong and Treisman (2005) also found that the number of objects in a stimulus
array had no effect on participants’ accuracy of mean size discrimination, and found
further support for the idea of parallel mean extraction by using a cueing paradigm to
determine whether participants could extract the mean size of subsets of circle stimuli.
Participants were provided with a color cue either before or after they viewed an array.
Regardless of when participants saw the color cue, their task was to determine the
average size of a specific subset of circles (specified by color). There was no difference
in performance between the pre-cued and post-cued conditions, indicating that in the
post-cued condition, participants were able to gather information from both subsets at the
same time just as accurately as when they knew which subset to attend to ahead of time
(pre-cued). This finding suggests that participants extracted information from both
subsets of circles in parallel to generate a representation of the average (Chong &
Treisman, 2005). Other research by Alvarez and Oliva (2008) also supported this

9
conclusion by showing that participants could accurately generate summary
representations of object locations even without directly attending to the objects.
Townsend (1990) discussed that although parallel and serial processing may both
lead to ensemble representations (e.g., Van Opstal et al., 2011), being able to distinguish
the contribution of each will provide insights into the mental operations supporting
ensemble tasks. As reported by Van Opstal et al., (2011), one might expect to see an
increase in participants’ RTs when they are extracting an average from a greater number
of objects if they are processing according to a serial model, but not a parallel model. If
participants are processing all objects at once (in parallel) then they should be able to do
this quickly for all objects, without a change in RT, and regardless of the number of
objects. For serial processing however, participants would need to individually assess
each additional object to gather information. Because Van Opstal and colleagues
observed increasing RTs with increasing display size during the Arabic numerals
averaging task, they suggested that there could be a serial processing component involved
in ensemble numerical averaging. This claim, however, can be called to question after
further investigation of earlier research.
Townsend (1990) and Egeth (1966) reported that although researchers often
assume that parallel processing implies RT consistency across display sizes, this is not
necessarily the case. Egeth (1966) found that parallel processing can lead to an increase
in average RTs that occur due to the addition of more stimuli. This idea is supported even
in Townsend’s (1990) unlimited-capacity parallel processing model which continuously
increases in the number of items being presented simultaneously. The idea is that there is
10
a physiological limit on how quickly an individual item can be processed, but not on how
slowly. Therefore, as more items are added to a set, the chances of including an item with
a long outlier time increase, which then increase the overall reaction time. Stated more
simply, because the overall RT is only as fast as the slowest item processing time,
displaying more items would increase the chance of having a slower overall RT. Because
of this, Egeth and Townsend reported that it is natural for processing times to differ
across trials even in a parallel processing scenario, predicting that the RT for an array of
items may increase based on the array size. This finding could explain the increase in
RTs observed in Van Opstal and colleagues (2011) while still lending the numerical
ensemble task to a parallel processing model.
Parallel and Serial Processing for Numerals
Van Opstal et al. (2011) studied ensemble representations of Arabic digits
because they were interested in whether the semantic components of prime displays
affected participants’ perception of a digit array even when they were not consciously
aware of the primes. One component of this research involved assessing participants’
RTs for the digit arrays in order to determine whether they were processing summary
statistical information in a parallel or serial manner. Addition of a group of digits was
identified as a serial process, such that participants accomplished the goal by identifying
and adding each number to the next, one-by-one. Digit averaging, on the other hand, was
identified as more of a parallel process in which participants concurrently assess the
weight of all numbers to identify an average value. Van Opstal and colleagues concluded
that participants accurately performed ensemble coding of higher-level, semantic

11
attributes in a parallel fashion, consistent with previous work investigating low-level
stimuli (Alvarez & Oliva, 2008; Ariely, 2001; Chong & Treisman, 2005). However, a
closer look at their results reveals variability in RTs across display sizes in the averaging
condition, such that the question still remains whether the extraction of average
numerical value does in fact involve rapid parallel processing, and if so, does ensemble
coding at the semantic level occur automatically across the entire display or only for
relevant subsets of items?
Automaticity of Ensemble Coding of Numerical Value
Chong and Treisman (2005) explored automaticity of processing of low-level
information by studying how participants gather summary statistical information from
subsets of circles. With their cueing paradigm, Chong and Treisman found no statistical
differences between pre-cued and post-cued trials, indicating that participants were able
to identify the mean sizes of both colors of circles as accurately as the mean of only one
subset. In other words, despite being uninformed about which color would be relevant to
their final decision when they were presented with the array, participants performed the
averaging task just as well as when they were pre-cued. This finding was present even
when participants viewed the circle display for 200 ms, suggesting a rapid and automatic
parallel extraction of the mean circle size. Other research has explored automaticity of
processing at the level of semantic information.
Naparstek and Henik (2010) investigated whether the automaticity of numerical
value and numerosity processing is task specific. Participants took part in either a
comparative judgement task or a parity judgement task. For the comparative judgment
12
task, participants were asked to indicate whether the numerical value or numerosity, of
the stimuli was smaller or larger than five. In this task all of the numerals were congruent
(i.e. participants saw all 5’s or all 7’s) and were presented among distractor items. For the
parity judgment task, participants were asked to indicate whether the numerical value or
numerosity of the stimuli was even or odd. Again, all of the numbers presented in any
one trial were the same. For both the comparative judgement task and the parity
judgement task there were congruent (numerical value and numerosity were the same)
and incongruent (numerical value and numerosity were different) trials. By comparing
RTs, Naparstek and Henik found that only in the comparative judgment task were
participants automatically processing the numerical value of digit stimuli in the congruent
trials. So even though participants’ responses were based on one digit and not the average
of many, Naparstek and Henik found that the comparative judgement task led to
automatic processing of numerical value during a congruity task.
Current Research
The current research aims to further investigate the nature of ensemble
representations at the semantic level. There is compelling evidence that ensemble coding
of low- and high-level visual attributes occurs rapidly, in parallel, and automatically
(Ariely, 2001; Chong & Treisman, 2005; Van Opstal et al., 2011); however, less is
known about the mechanisms involved in extracting summary information at the
semantic level. Despite their claim of parallel processing of the mean value of a digit
display, the differences in RTs across display sizes in Van Opstal and colleagues’ (2011)
study may reflect a serial processing contribution to the numerical averaging task. The

13
current study will involve a more rigorous attempt to dissociate serial and parallel
contributions to ensemble coding of numerical value in a task similar to that used by Van
Opstal and colleagues. Arabic digits are convenient stimuli for this purpose because they
have exact means and have been successfully used in previous research investigating
ensemble representations (Van Opstal et al., 2011; Corbett et al., 2006). Participants’ RTs
across increasing numbers of stimuli in the display will be compared to RT patterns
generated from serial and parallel visual search tasks performed by the same participants,
so that conclusions can be drawn regarding the type of processing occurring in the
ensemble coding task.
Furthermore, the extent to which the formation of summary statistical
representations of semantic information occurs automatically across all items or only
subsets of items is still unclear. The pre-cue and post-cue paradigm used by Chong and
Treisman (2005) to investigate automaticity of averaging circle size will be used here to
determine whether the meanings associated with all items in a display automatically
contribute to an ensemble representation at the semantic level. If the averages of subsets
of digits are processed at the same level of efficiency regardless of pre-cued or post-cued
conditions, this would suggest that the processing of ensemble information at the
semantic level proceeds automatically for subsets of stimuli as shown for low-level visual
attributes by Chong and Treisman (2005). Based on previous research that used similar
tasks (i.e., asking about numerical value and having participants complete a comparative
judgement task), it is further expected that support will be found for automatic processing
(See above: Naparstek & Henik, 2010).
14
The current experiment proposes several hypotheses to address the questions
regarding semantic ensemble processing as outlined above: 1a) the numerical averaging
task will result in differences in RTs as more digits are included in the task. Specifically,
it is likely that participants will have slightly longer RTs (perform more slowly) when
there are more digits to process. (1b) The differences in RTs for the ensemble task are
predicted to be small and to ultimately look more similar to RT patterns generated by the
parallel search than the serial search task. We will also examine accuracy for these tasks
in order to rule out or identify any speed-accuracy trade-offs. It is possible that
participants will perform better in the search tasks as compared to the ensemble task. 2a)
Participants will show no difference in accuracy between the pre-cued and 5 digit array
single color subset conditions in the whole display task, indicating that they will be able
to efficiently select a colored subset of numbers to average when compared to a full set of
same-colored numbers. We would also expect to see equal accuracy between the pre-cue
and 10 digit arrays in the whole display task; this would provide further evidence that
participants are gathering average information from a subset with an efficiency that is
comparable to gathering information from a large, full set. Finally, (2b) participants will
show no difference in averaging ability for the pre-cued and post-cued conditions,
indicating no advantage for participants when they are pre-cued compared to when they
are not, meaning that the segregation of the two groups based on perceptual features and
subsequent extraction of ensemble semantic information occurs in the absence of
attending to one or the other.
Hypothesis (1a) will characterize the RT patterns across display sizes for
gathering summary statistical averages for Arabic digits, while hypothesis (1b) will
15
directly compare RT patterns in the ensemble coding task to parallel and serial visual
search RT patterns in order to support the claim that the ensemble task occurs using
parallel processing. Further hypotheses will investigate the idea that we can average
subsets of numbers (2a) even when we are not able to identify which subset may be
relevant ahead of time (2b). Hypothesis (2b) will additionally address the idea of rapid,
automatic generation of semantic ensemble representations from perceptually segregated
subsets.
The current study aims to determine whether high-level semantic information
contributes to ensemble representations of visual stimuli (specifically Arabic digits) in a
similar manner as both low-level and other higher level information. This is important
because processing of numeric meaning occurs at a higher level of processing beyond
that of visual surface perception, (i.e., Arabic numerals do not physically match the
values that they represent) (Van Opstal et al., 2011), and the processing of this
information is relevant to perceptual tasks in our daily lives.

16
CHAPTER II
METHOD
Participants
For the current study, we predicted a medium effect size (f =.5) based on Cohen’s
guidelines (Cohen, 1988). A preliminary power analysis was conducted using G*Power
3.1 software (Faul, Erdfelder, Lang, & Buchner, 2007) and the following criteria: f = .5, α
= .05, β = .95, yielding an estimated minimum sample size of 10 participants for each set
of tasks in this study.
Undergraduate students from a large public university in the Midwestern U.S.
were recruited via an online recruitment system. Participants were split into two groups
that completed different tasks (tasks for each group explained in Procedures). Of the 19
participants, one participant was excluded due to slow RTs (RT plus or minus 2.5 SDs
from the mean) in the ensemble task, one for slow RTs in the search tasks, and one for
low accuracy in the search tasks. Thus, a total of three datasets were excluded across the
three tasks to allow for within-subjects comparisons across tasks. The remaining 16
participants were included in data analyses (13 female, M age = 20.06, SD = 0.77). There
were originally 20 participants in the whole display and pre-/post-cue tasks group. Of
those 20, four were excluded for low accuracy (<60%) on the pre-cue task, one for low
accuracy on the post-cue condition, and one for low accuracy in both cue conditions.
17
Three additional participants were excluded for slow RTs (plus-or-minus 2.5 SDs from
the mean; no RT exceeded 1565 ms).1 There were a total of 11 participants included in
the analyses (8 female, M age = 20.45, SD = 1.04). In total, data from 27 participants
were included in the final analyses. Inclusion criteria required that students have normal
or corrected-to-normal vision. Students received class credit in exchange for their
participation. All experimental procedures were approved by the university’s Institutional
Review Board.
Stimuli and Displays
Visual Search Tasks
Stimuli consisted of arrays of digits ranging from 1- 9 that were presented in
white text against a black background. Participants were asked to search for the number
greater than or less than five, and to report on which side of the display the number was
located by using the keyboard. The ‘z’ key was pressed for left side of the display, and
the ‘/’ was pressed for right. The parallel processing visual search task or the pop-out
visual search looked similar, except the target digit was presented in a different color
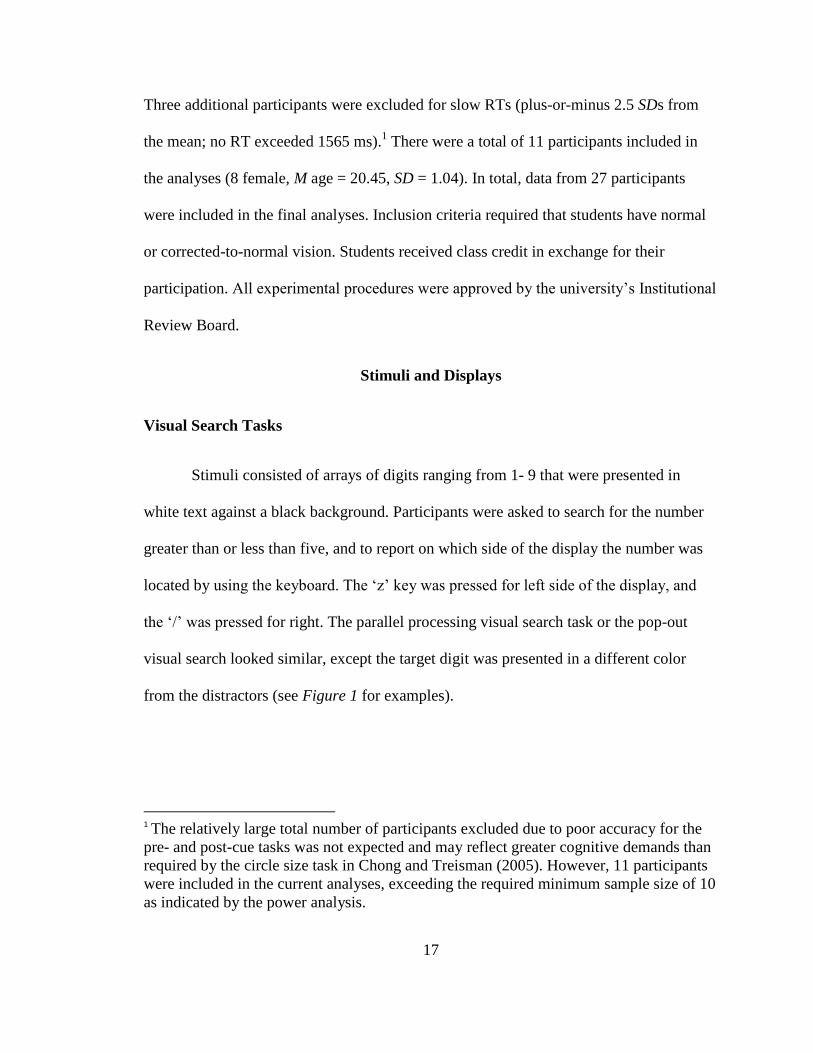
from the distractors (see Figure 1 for examples).
1 The relatively large total number of participants excluded due to poor accuracy for the
pre- and post-cue tasks was not expected and may reflect greater cognitive demands than
required by the circle size task in Chong and Treisman (2005). However, 11 participants
were included in the current analyses, exceeding the required minimum sample size of 10
as indicated by the power analysis.
18
Figure 1. Serial Search and Parallel Search Tasks. A 500 ms fixation screen was followed
by a digit display that remained on the screen until participants responded by pressing ‘z’
or ‘/’ to indicate the location of the target (left or right). In this example, participants
looked for a number less than 5. In the serial search task, the target did not contain a
salient unique feature (upper right), whereas in the parallel search task, targets were
presented in red and thus “popped out” (lower left).
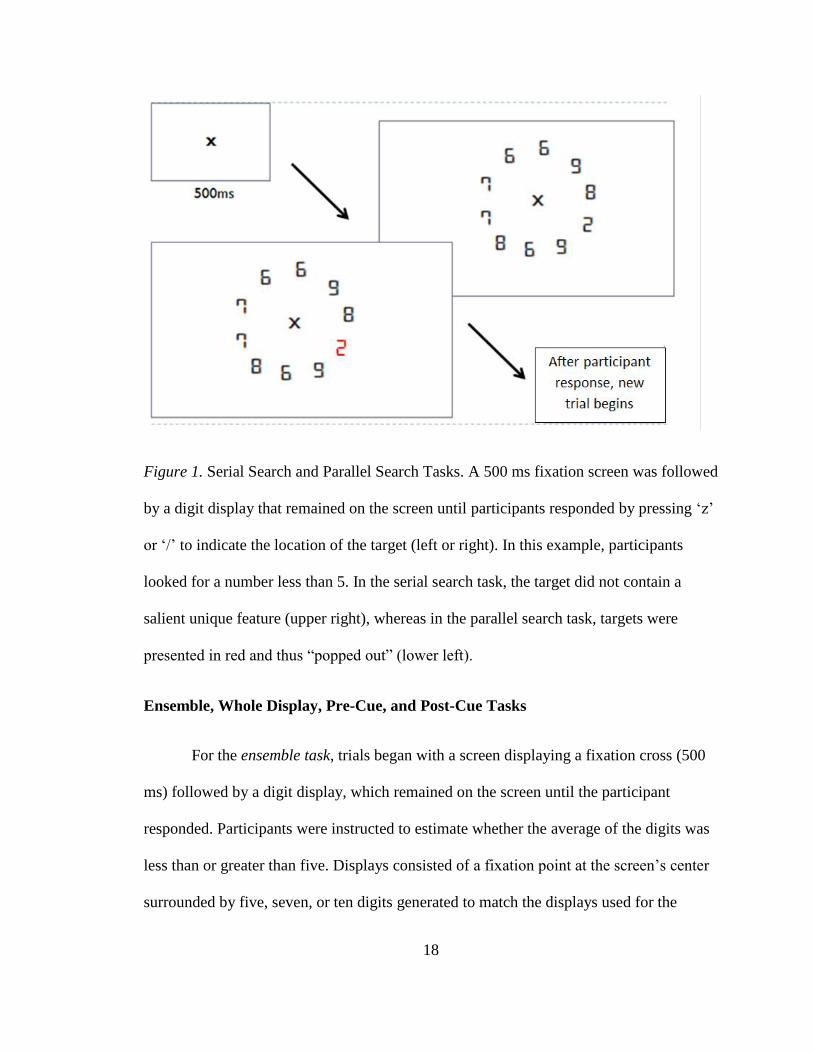
Ensemble, Whole Display, Pre-Cue, and Post-Cue Tasks
For the ensemble task, trials began with a screen displaying a fixation cross (500
ms) followed by a digit display, which remained on the screen until the participant
responded. Participants were instructed to estimate whether the average of the digits was
less than or greater than five. Displays consisted of a fixation point at the screen’s center
surrounded by five, seven, or ten digits generated to match the displays used for the
19
search tasks (see Figure 2 for examples). Participants responded using the ‘z’ key to
indicate “less than 5” and the ‘/’ key for “greater than 5”. A second averaging task, the
whole digit task, was identical to the ensemble task, except the digits exactly matched
those used for the pre-/post-cue displays, and were presented for 1500 ms. This task was
used to compare performance for a whole display to the subsets in the pre- and post-cue
tasks.
Figure 2. Ensemble Task Display. Participants viewed a fixation screen for 500 ms
before viewing a digit display of 5, 7, or 10 digits. This display remained on the screen
until participants made a response indicating whether the average was less than or greater
than 5, but participants were prompted to respond as quickly as possible.

20
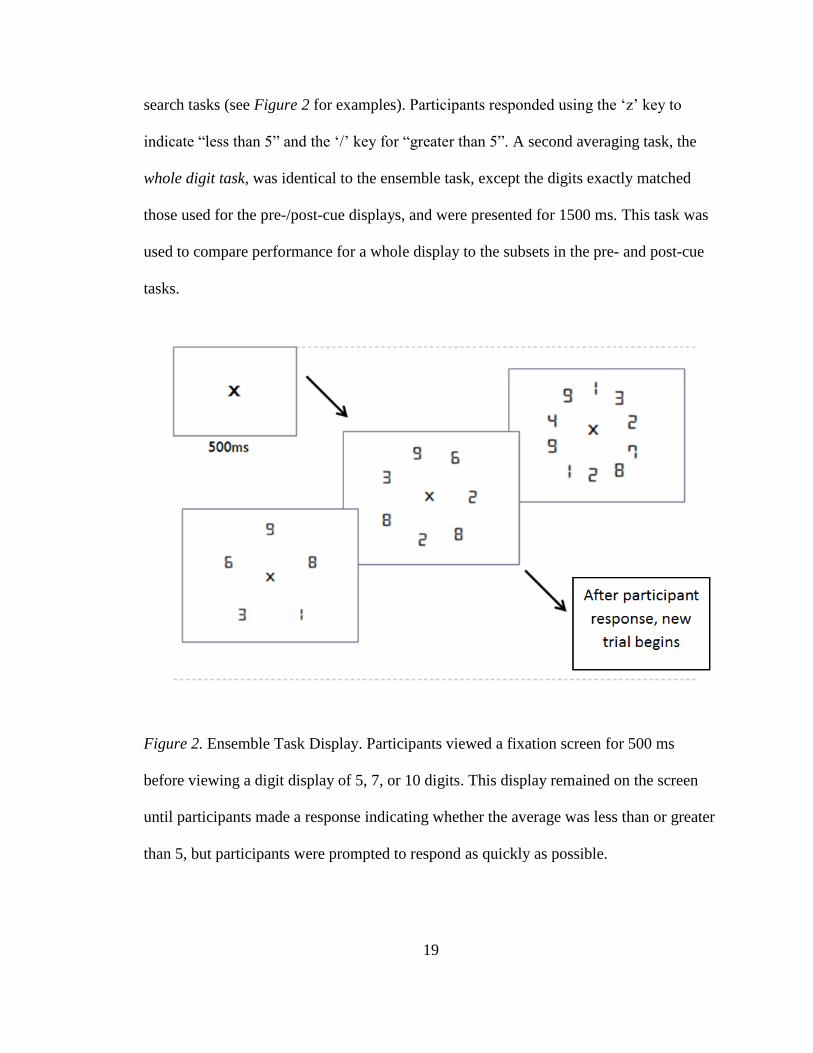
For the pre-/post-cue ensemble task, the digit displays (1500 ms) were colored red
and green, with half of the digits corresponding to each color. Depending on the
condition, a cue was shown before (pre-) or after (post-) the digit displays for 250 ms to
inform participants which subset of digits they would be averaging (see Figure 3 and
Figure 4 for examples). Again, participants responded using the ‘z’ key for ‘less than’
responses, and the ‘/’ key for ‘greater than’.
Figure 3. Pre-Cue Task Display. Participants saw the first screen containing the relevant
color cue for 250 ms before viewing the digit display for 1500 ms. The final screen was a
response screen in which participants reported whether the average of the digits that
matched the color with which they were cued was less than 5 or greater than 5.
21
Figure 4. Post-Cue Task Display. Participants saw digit display screen for 1500 ms
before viewing the color cue. The final screen was a response screen where participants
reported whether the average of the digits that matched the color with which they were
cued with was less than 5 or greater than 5.
Measures
Accuracy
In the ensemble tasks, participants determined the numeric average of the target
digit display in a comparative judgment manner by reporting whether the average was
less than 5 or greater than 5. In the search tasks, participants reported on which side of
the display a particular number was located. Accuracy of participants’ reported averages
and digit locations were recorded.
22
Reaction Time
Participants’ reaction times in response to the target digit display (when reporting
in the comparative judgement task) were recorded for the ensemble task, the whole
display task, and the search tasks. For the pre-/post-cue task, RT was not of primary
interest because participants were color-cued at different points in the stimulus display.
Procedure
Half of the participants completed the search tasks and the ensemble task, while
the other half completed the pre/post ensemble task and the whole display task.
Participants who completed the first set of experiments completed 240 trials (40 for each
display size for each of the two types of visual searches) of a visual search task that
included both “pop-out”, or parallel, search displays and displays requiring serial search
through the items. Participants’ RTs and accuracy were recorded for these tasks. For the
ensemble coding task, participants completed 168 trials (56 for each display size) that
began with a screen displaying a centered fixation cross for 500 ms, followed by a target
digit display for 1500 ms. The target display consisted of a fixation point randomly
surrounded by five, seven, or ten Arabic digits that matched the displays used in the
search tasks. The number five was excluded from the list of possible digits so as to not
interfere with participants’ ability to determine the average of the digits. This process also
required that the randomization procedure exclude a combination of digits whose exact
average is five. Following the digit presentation, participants viewed a screen asking
them to report whether the average of the digits presented was less than or greater than
23
five. Participants responded on a keyboard, pressing ‘z’ for a less than response, and ‘/’
for a greater than response.
For the pre-/post-cue ensemble task, participants randomly received 75 colored
pre-cued and post-cued trials for a total of 150 trials. On this task, only 10 digit displays
were used. For the pre-cued trials, participants first viewed a screen with a fixation point
colored either green or red (250 ms). The color of the fixation point cued participants to
the color of the subset of digits in the upcoming display to which they should attend. The
digit display screen was presented for 1500 ms and contained ten digits (five green digits
and five red digits), followed by a screen that instructed participants to respond, using a
key press, whether the subset of digits presented in their cued color averaged to less than
or greater than five. For the post-cued trials, the fixation screen was immediately
followed by the digit display screen (1500 ms) and then a post-cue screen (250 ms),
which indicated whether the participant should report the average for the red or green
subset. Participants then viewed the response screen as in the pre-cued trials. Along with
the pre-/post-cue task, participants also completed the whole display task, identical to the
ensemble task in Session 1, except the digit displays were generated so that digits used in
the 5 and 10-item displays exactly matched the pre- and post-cue displays.
Data Analysis
Reaction times were compared across digit display sizes (5, 7, and 10) for both of
the visual search tasks and ensemble task (hyp. 1a). A 3 (Task: parallel search/serial
search/averaging) x 2 (Target Type: < 5/> 5) x 3 (Display Size: 5/7/10 items) ANOVA
was conducted on RTs with the number of digits in the display as a factor to assess

24
whether there was an effect of number of targets on participants’ RTs for both the visual
search and ensemble coding tasks. In addition, RTs across different display sizes were
compared for visual search tasks and the ensemble task (hyp. 1b.). The appropriate
follow-up tests were conducted following the ANOVA. A 4 (Condition: Pre-/Post-
/Ensemble 5 Items/Ensemble 10 Items) x 2 (Target Type: < 5/> 5) ANOVA was
conducted to compare participants’ accuracy on the pre- and post-cue digit ensemble
tasks. Paired samples T-tests were used to assess differences in accuracy between the pre-
cue and whole display 5 and 10 conditions (hyp. 2a), as well as between the pre- and
post-cued conditions (hyp. 2b). Statistical analyses were conducted in SPSS, version 20
(IBM, 2011).
25
CHAPTER III
RESULTS
In this study, we wanted to compare how reaction times (RTs) change as a
function of display size across a numerical ensemble task, a serial search task, and a
parallel search task. The goal was to determine whether generating ensemble
representations at the semantic level occurs by extracting information from multiple
items in parallel, as has been described for lower level visual attributes (Alvarez & Oliva,
2008; Ariely, 2001; Dakin & Watt, 1997; Parkes et al., 2001). RT patterns indicative of
parallel processing are commonly seen in visual search tasks in which the target contains
a unique, salient feature, such as in the parallel search task utilized here. Alternatively,
ensembles based on high-level, semantic information such as numerical value could
instead require serial processing of each item, and thus RTs would markedly increase
with display size as they do in more difficult visual search tasks that require detailed
examination of individual items (Duncan & Humphreys, 1989; Treisman & Gelade,
1980). If the numerical ensemble task relies on a parallel processing mechanism as has
been shown for low-level feature ensemble representations, RT patterns for the ensemble
task should resemble the RT patterns generated by the parallel search task, with much
smaller increases in RT with increasing display size than for the serial search task.
In addition, we wanted to see if subjects performed just as well when they were
post-cued to a specific subset of digits within a display as when they were pre-cued.

26
Chong and Treisman (2005) demonstrated that participants performed equally well when
estimating the average size of subsets of colored circles across both a pre-cued condition,
in which participants were cued to attend to a specific subset before its presentation, and
a post-cued condition, in which they were cued only after its presentation. That
participants were able to report average circle size even when they were uninformed
about which set to attend to during a 200 ms presentation suggests that we are able to
rapidly and automatically extract ensemble information based on low-level visual
information. Here, we hypothesized and tested whether the same holds true for higher
level, semantic information.
We addressed these two ideas with a separate set of analyses for each, as
described below.
Serial vs. Parallel Processing
A 3 (Task: Ensemble/Serial Search/Parallel Search) x 2 (Target Type: < 5/>5) x 3
(Display Size: 5/ 7/ 10 items) repeated measures ANOVA was conducted on RTs. There
was a significant main effect of Task, F(2, 30) = 92.60, p <. 001, such that overall, RTs
for the ensemble task were longer (M = 804.32, SD =160.97) than RTs for the serial
search task (M = 708.08, SD = 117.10), which in turn were longer than for the parallel
search task (M = 398.74, SD = 33.07) (see Figure 8). A significant main effect of Target
Type, F(1, 15) = 17.18, p < .005, was a result of faster RTs in the greater-than-5
compared to the less-than-5 condition for the ensemble (> 5: M = 766.98, SD = 140.71; <
5: M = 841.66, SD = 181.22) and serial tasks (> 5: M = 680.58, SD = 105.47; < 5: M =
735.59 SD = 128.72). There was also a main effect of Display Size, F(2, 30) = 11.59, p <
27
.001, such that as display size increased, so did RTs (5 items: M = 621.11, SD = 101.69; 7
items: M = 634.74, SD = 98.48; 10 items: M = 655.30, SD = 110.97).
These main effects were qualified by a significant Task x Target Type x Display
Size interaction, F(4, 60) = 15.230, p <.001. We examined this three-way interaction by
conducting a 2 (Target Type) x 3 (Display Size) repeated measures ANOVA for each
task type followed by simple effects analyses and pairwise comparisons when
appropriate. Results of these follow-up analyses are broken up by task, and follow a
description of the overall results for accuracy, below.
A 3 (Task: Ensemble/Serial Search/Parallel Search) x 2 (Target Type: < 5/>5) x 3
(Display Size: 5/ 7/ 10 items) repeated measures ANOVA was also conducted on
accuracy. There was a significant main effect of Task, F(2, 30) = 17.92, p <.001, such
that overall performance was worse in the ensemble task (M = .90 SD = .08) compared to
the serial search (M = 0.97, SD =.03) and parallel search (M = .98, SD =.03) tasks. There
was also a main effect of Target Type, F(1, 15) = 6.610, p < .05, such that performance
was higher in the greater-than-5 condition for both the ensemble task (M = .92, SD =
0.06) and the serial search task (M = 0.97, SD = 0.03) compared to the less-than-5
condition (ensemble, M = 0.88, SD = 0.10; serial, M = 0.97, SD = 0.14). There was no
main effect of Display Size, F(2, 30) = 1.86, p = .17.
These main effects were qualified by a significant Task x Target Type x Display
Size interactions, F(4, 60) = 9.27, p <.001. In order to understand this three-way
interaction, we conducted a 2 (Target Type) x 3 (Display Size) repeated measures
ANOVA for each task type followed by simple effects analyses and pairwise
28
comparisons, just as for RTs. These results are reported in the sections below, after RT
follow-ups.
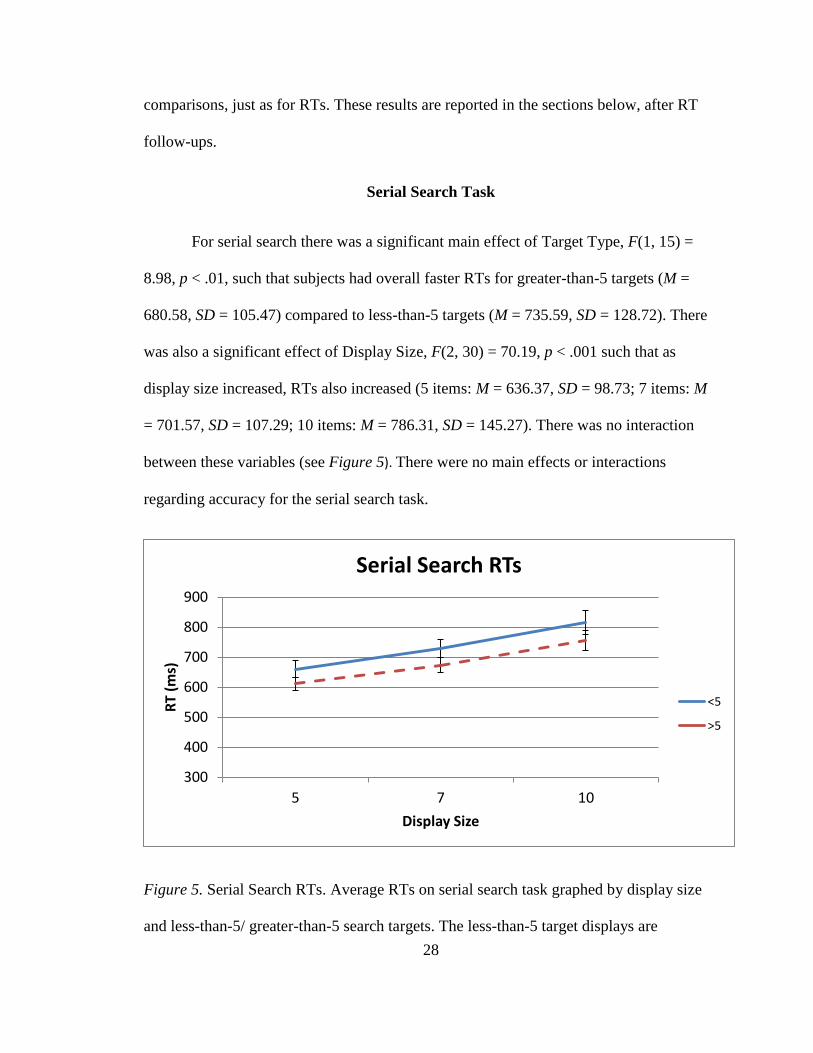
Serial Search Task
For serial search there was a significant main effect of Target Type, F(1, 15) =
8.98, p < .01, such that subjects had overall faster RTs for greater-than-5 targets (M =
680.58, SD = 105.47) compared to less-than-5 targets (M = 735.59, SD = 128.72). There
was also a significant effect of Display Size, F(2, 30) = 70.19, p < .001 such that as
display size increased, RTs also increased (5 items: M = 636.37, SD = 98.73; 7 items: M
= 701.57, SD = 107.29; 10 items: M = 786.31, SD = 145.27). There was no interaction
between these variables (see Figure 5). There were no main effects or interactions
regarding accuracy for the serial search task.
Figure 5. Serial Search RTs. Average RTs on serial search task graphed by display size
and less-than-5/ greater-than-5 search targets. The less-than-5 target displays are
300
400
500
600
700
800
900
5 7 10
RT
(ms)
Display Size
Serial Search RTs
<5
>5
29
presented with a solid blue line, and are overall slightly slower than the greater-than-5
targets. The graph depicts the main effect of display size, such that RTs increased with
increasing display size, F(2, 30) = 70.19, p < .001. Error bars represent standard error of
the mean.
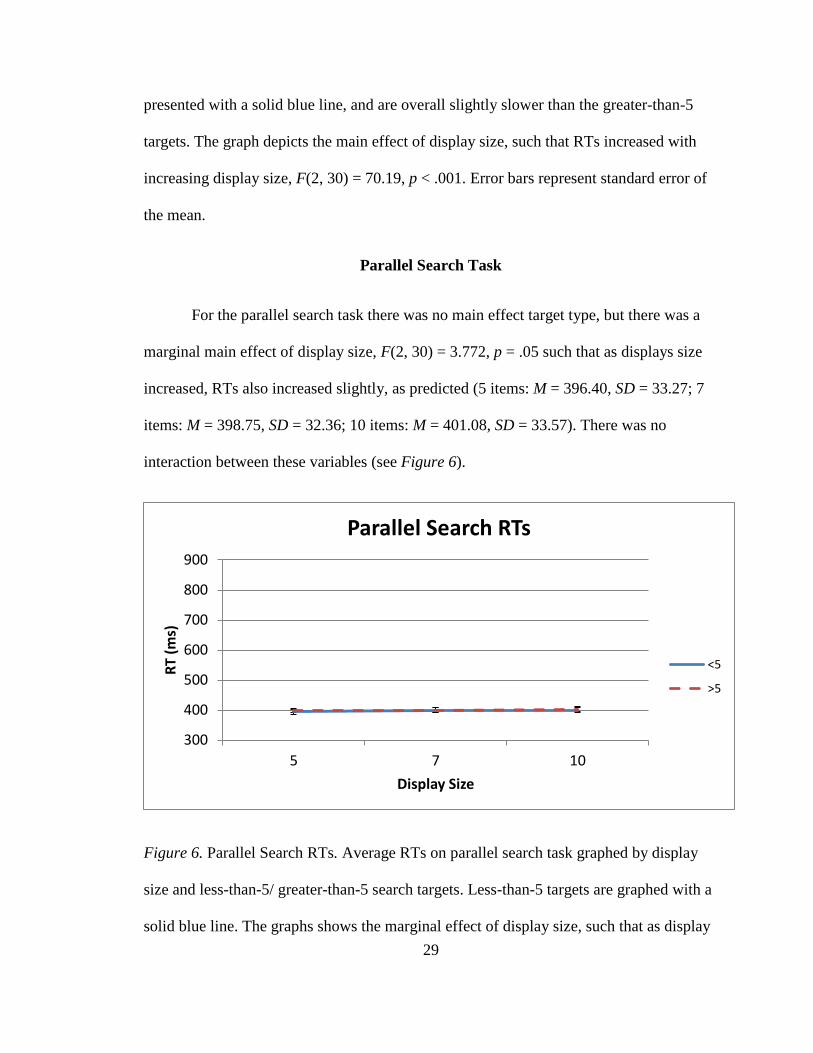
Parallel Search Task
For the parallel search task there was no main effect target type, but there was a
marginal main effect of display size, F(2, 30) = 3.772, p = .05 such that as displays size
increased, RTs also increased slightly, as predicted (5 items: M = 396.40, SD = 33.27; 7
items: M = 398.75, SD = 32.36; 10 items: M = 401.08, SD = 33.57). There was no
interaction between these variables (see Figure 6).
Figure 6. Parallel Search RTs. Average RTs on parallel search task graphed by display
size and less-than-5/ greater-than-5 search targets. Less-than-5 targets are graphed with a
solid blue line. The graphs shows the marginal effect of display size, such that as display
300
400
500
600
700
800
900
5 7 10
RT
(ms)
Display Size
Parallel Search RTs
<5
>5
30
size increased, RTs also slightly increased, F(2, 30) = 3.772, p = .05. Error bars represent
standard error of the mean.
A 2 (Task: serial v. parallel search) x 3 (Display Size) ANOVA was conducted to
compare the increases in RTs for both tasks, collapsed across target type. There was a
main effect of Task, F(1, 31) = 220.308, p < .001, such that the overall RTs for the serial
search (M = 708.08, SD = 119.13) were slower than for the parallel search (M = 398.74,
SD = 32.58). There was also a main effect of Display Size, F(2, 62) = 98.045, p = .000,
due to an overall increase in RTs with increasing display size (5 items: M = 516.38, SD =
66.91; 7 items: M = 550.16, SD = 70.82; 10 items: M = 593.69, SD = 89.84) (see Figure
8). There was also a significant interaction between Task and Display Size, F(2, 62) =
73.314, p < .001, which was further investigated using one-way ANOVAS.
A main effect of Display Size was observed for the serial search task, F(2, 62) =
87.980, p < .001, but not for the parallel search task, F(2, 62) = 2.120, p = .129,
indicating that the large increase in RTs across display size in the serial, compared to
parallel, task is driving the significant interaction between task and display size. There
were no main effects or interactions regarding subject accuracy for the parallel search
task.
Ensemble Task
For the ensemble task, there was a main effect of Target Type, F(1, 15) = 12.161,
p < .01 due to faster RTs for the greater-than-5 condition (M = 766.98, SD = 140.71) than
the less-than-5 condition (M = 841.66, SD = 181.23). A significant main effect of Display
Size, F(2, 30) = 5.401, p < .05 revealed that larger display sizes yielded faster RTs (5: M
31
= 830.57, SD = 173.05; 7: M = 803.89, SD = 155.77; 10: M = 778.50, SD = 154.08).
Since there was also significant interaction between Target Type and Display Size, F(2,
30) = 21. 134, p < .001, we conducted two one-way ANOVAs to assess the simple effect
of display size for each target type.
There was a simple main effect of Display Size for the greater-than-5 condition, F(2,
30) = 23.343, p < .001, but not for less-than-5 condition. For trials in which the average
of the display was greater than 5, RTs decreased with increasing display size (5 items: M
= 849.05, SD = 172.32; 7 items: M = 752.79, SD = 117.2756; 10 items: M = 699.10, SD =
132.53).
Follow-up paired-samples t-tests were conducted to compare RTs across display
sizes for the greater-than-5 condition. There was a significant difference shown between
all pairs of the display sizes, (all ps <.01) indicating significantly shorter RTs as display
size increased (see Figure 7).

32
Figure 7. Ensemble Task RTs. Average RTs on ensemble coding task graphed by display
size and less-than-5/ greater-than-5 search targets. The less-than-5 targets are graphed
with a solid blue line, showing overall slower RTs compared to the greater-than-5 targets
for the 7 and 10 digit displays. The graph also shows an effect of Display Size in the
greater-than-5 condition such that RTs decreased with increasing display size. Error bars
represent standard error of the mean.
300
400
500
600
700
800
900
5 7 10
RT
(ms)
Display Size
Ensemble Task RTs
<5
>5
33
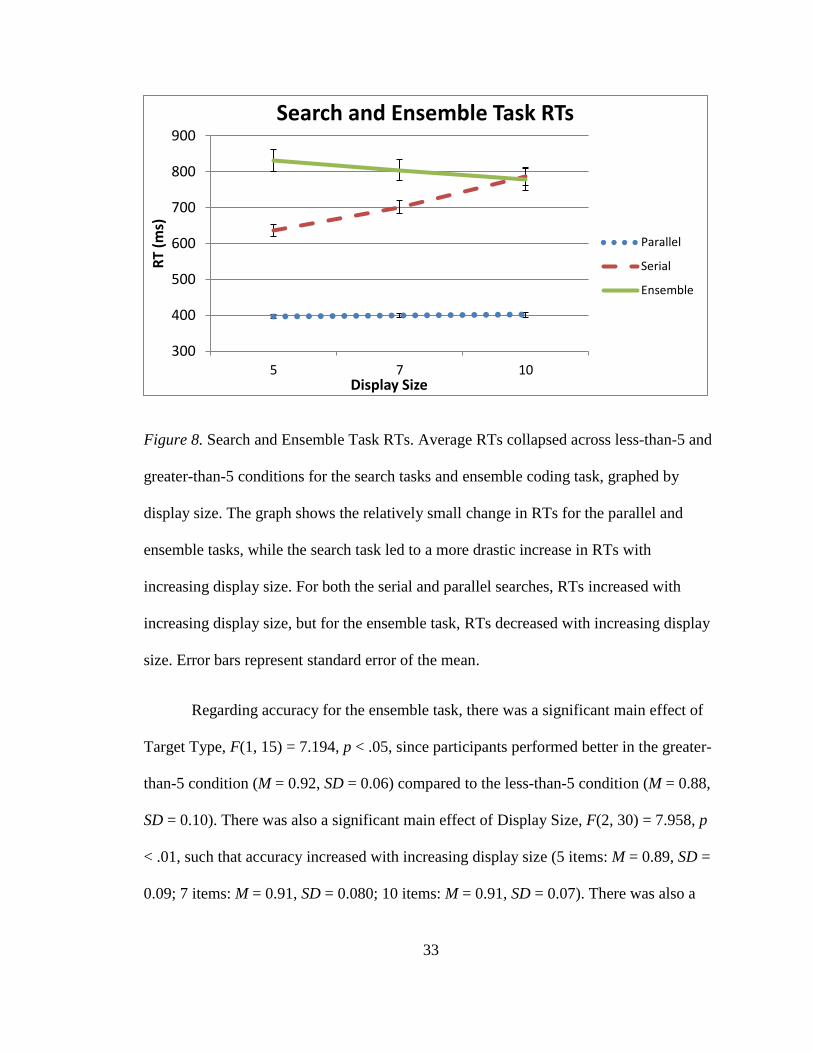
Figure 8. Search and Ensemble Task RTs. Average RTs collapsed across less-than-5 and
greater-than-5 conditions for the search tasks and ensemble coding task, graphed by
display size. The graph shows the relatively small change in RTs for the parallel and
ensemble tasks, while the search task led to a more drastic increase in RTs with
increasing display size. For both the serial and parallel searches, RTs increased with
increasing display size, but for the ensemble task, RTs decreased with increasing display
size. Error bars represent standard error of the mean.
Regarding accuracy for the ensemble task, there was a significant main effect of
Target Type, F(1, 15) = 7.194, p < .05, since participants performed better in the greater-
than-5 condition (M = 0.92, SD = 0.06) compared to the less-than-5 condition (M = 0.88,
SD = 0.10). There was also a significant main effect of Display Size, F(2, 30) = 7.958, p
< .01, such that accuracy increased with increasing display size (5 items: M = 0.89, SD =
0.09; 7 items: M = 0.91, SD = 0.080; 10 items: M = 0.91, SD = 0.07). There was also a
300
400
500
600
700
800
900
5 7 10
RT
(ms)
Display Size
Search and Ensemble Task RTs
Parallel
Serial
Ensemble

34
significant interaction between Target Type and Display Size, F(2, 30) = 9.310, p < .005.
One-way ANOVAs were conducted to further assess the interaction.
The simple main effect of Display Size in the greater-than-5 condition was
significant, F (2, 30) = 20.430, p < .001, showing an increase in accuracy with increasing
display size in the greater-than-5 condition (5 items: M = 0.87, SD = 0.09; 7 items: M =
0.94, SD = 0.04; 10 items: M = 0.96, SD = 0.04). The simple main effect of the less-than-
5 condition was non-significant.
Follow-up pairwise comparisons were conducted to compare accuracy across
display sizes for the greater-than-5 condition. There were no significant differences
between the 7 and 10 item displays, but significant differences between the 5 and 7 item
displays as well as the 5 and 10 item displays (both ps <.005), indicating that the
differences between the 5 item and the two larger item displays is driving the interaction
between target type and display size, ultimately leading to increased accuracy with
increasing display size in the greater-than-5 condition (see Figure 9).
35
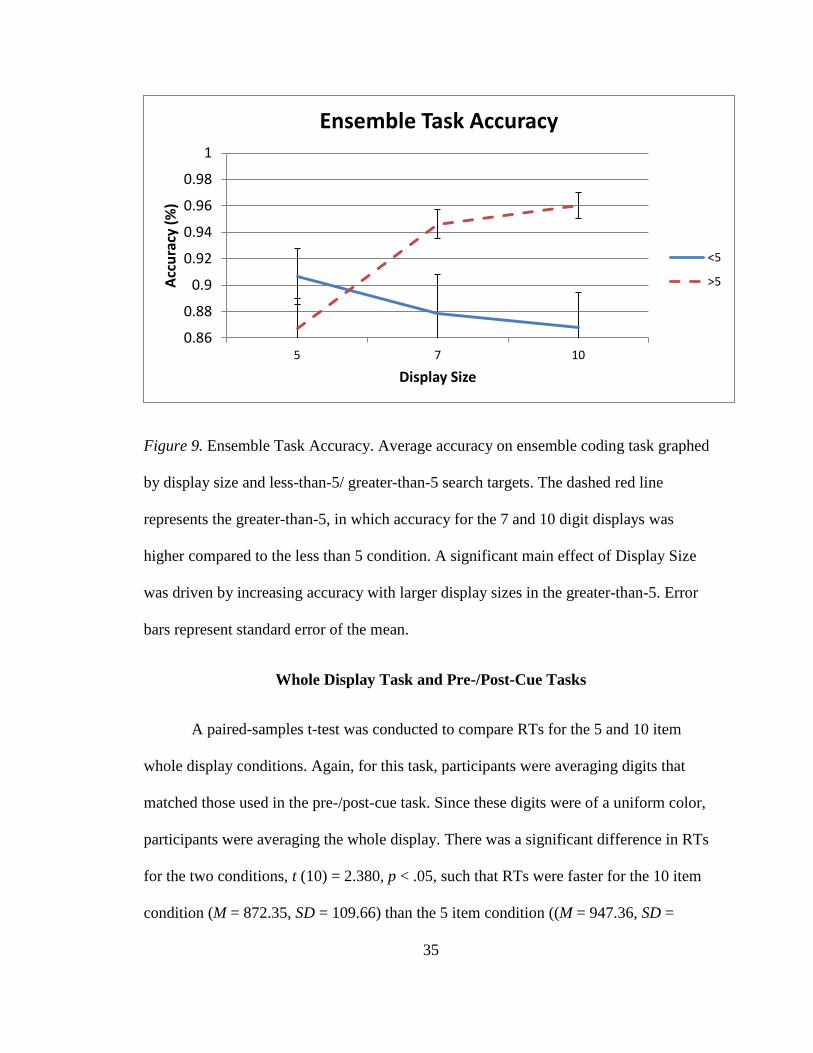
Figure 9. Ensemble Task Accuracy. Average accuracy on ensemble coding task graphed
by display size and less-than-5/ greater-than-5 search targets. The dashed red line
represents the greater-than-5, in which accuracy for the 7 and 10 digit displays was
higher compared to the less than 5 condition. A significant main effect of Display Size
was driven by increasing accuracy with larger display sizes in the greater-than-5. Error
bars represent standard error of the mean.
Whole Display Task and Pre-/Post-Cue Tasks
A paired-samples t-test was conducted to compare RTs for the 5 and 10 item
whole display conditions. Again, for this task, participants were averaging digits that
matched those used in the pre-/post-cue task. Since these digits were of a uniform color,
participants were averaging the whole display. There was a significant difference in RTs
for the two conditions, t (10) = 2.380, p < .05, such that RTs were faster for the 10 item
condition (M = 872.35, SD = 109.66) than the 5 item condition ((M = 947.36, SD =
0.86
0.88
0.9
0.92
0.94
0.96
0.98
1
5 7 10
Acc
ura
cy (
%)
Display Size
Ensemble Task Accuracy
<5
>5
36
178.03). This result is consistent with our finding of faster RTs for larger displays in the
ensemble task described above.
Although RT data was collected for the pre-/post-cue tasks, it was not analyzed
for the purpose of this study due to the forced differences in response times between
tasks. Specifically, unlike for the pre-cue task, in the post-cue task, participants were
unable to respond immediately following the stimulus display because they had to wait
until they were shown the post-cue. Thus, it would not be appropriate to compare RTs
across the pre- and post-cue tasks.
A 4 (Condition: Pre-/Post-/Whole 5 Items/Whole 10 Items) x 2 (Target Type: <
5/> 5) repeated measures ANOVA was conducted to compare subjects’ accuracy on the
pre- and post-cued digit ensemble tasks. This analysis design was selected because the
whole-display condition was treated as a separate task since there was no 5 item display
for the pre-/post-cue condition. With this analysis, we were able to compare all of the
tasks by target type. There was a significant main effect of Condition, F (3, 30) = 8.606, p
< .001, due to overall higher accuracy for the whole-digit task (M = 0.96, SD = 0.03) than
for the pre/post tasks (M = 0.90, SD = 0.05) regardless of target type. There was no main
effect of Target Type, and there was no significant interaction. Collapsing across target
type, there was no significant difference in accuracy between the pre- (M = 0.91, SD =
0.03) and post-cue (M = 0.90, SD = 0.05) conditions, t (10) = .537, p = .60, or the 5 item
and 10 item conditions of the whole display task, t (10) = .1.307, p = .220 (see Figure
10).
37
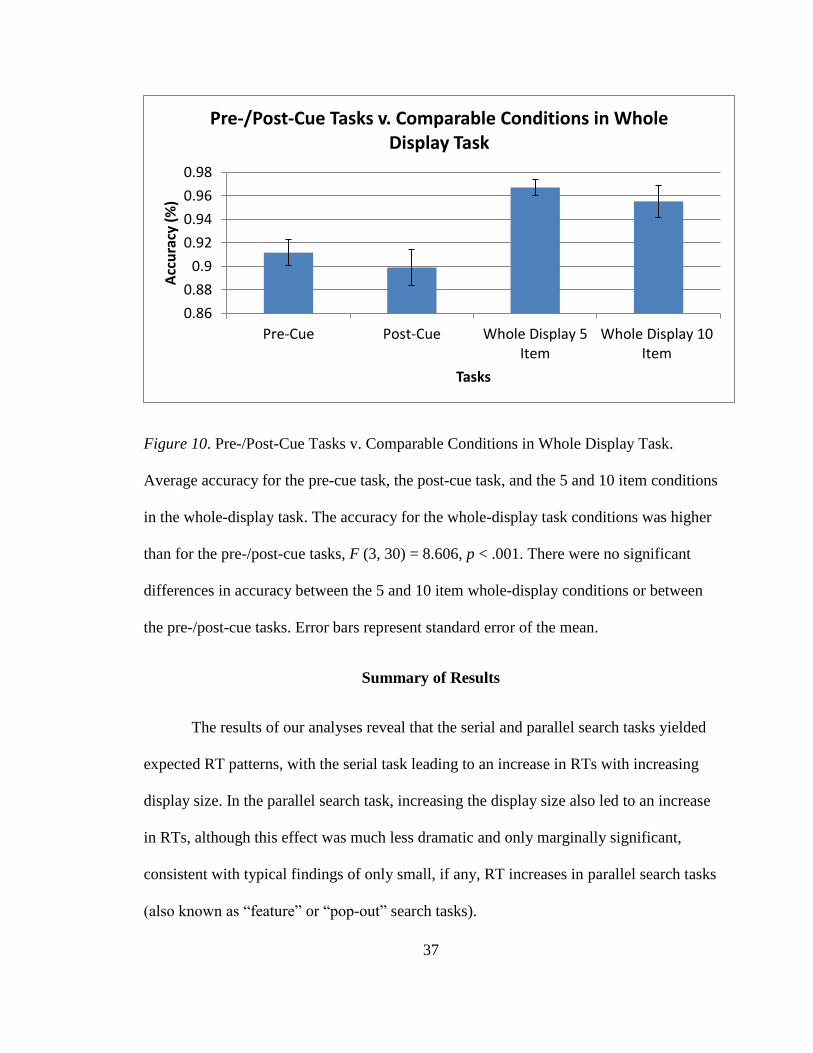
Figure 10. Pre-/Post-Cue Tasks v. Comparable Conditions in Whole Display Task.
Average accuracy for the pre-cue task, the post-cue task, and the 5 and 10 item conditions
in the whole-display task. The accuracy for the whole-display task conditions was higher
than for the pre-/post-cue tasks, F (3, 30) = 8.606, p < .001. There were no significant
differences in accuracy between the 5 and 10 item whole-display conditions or between
the pre-/post-cue tasks. Error bars represent standard error of the mean.
Summary of Results
The results of our analyses reveal that the serial and parallel search tasks yielded
expected RT patterns, with the serial task leading to an increase in RTs with increasing
display size. In the parallel search task, increasing the display size also led to an increase
in RTs, although this effect was much less dramatic and only marginally significant,
consistent with typical findings of only small, if any, RT increases in parallel search tasks
(also known as “feature” or “pop-out” search tasks).
0.86
0.88
0.9
0.92
0.94
0.96
0.98
Pre-Cue Post-Cue Whole Display 5Item
Whole Display 10Item
Acc
ura
cy (
%)
Tasks
Pre-/Post-Cue Tasks v. Comparable Conditions in Whole Display Task

38
The critical analysis for our study showed that RTs for the numerical ensemble
task were significantly longer than for both the serial and parallel search tasks, but
ultimately generated patterns most similar to those observed for the parallel search task.
Accuracy was higher overall for the whole-digit display task compared to the pre-
and post-cue tasks, regardless of target type. The comparison of primary interest was
between the pre- and post-cued conditions, for which we found no significant differences
in accuracy. Within the whole-digit displays, there were no significant differences in
accuracy between the 5 and 10 item displays.
39
CHAPTER IV
DISCUSSION
Interpretation and Relevance of Results
The current research aimed to assess the role of parallel processing in ensemble
coding of semantic information, as well as determine whether the ability to gather low-
level ensemble information from subsets of stimuli automatically (i.e., without prior cues
as to which set will be relevant) holds for semantic-level information as it does for low-
level stimulus attributes (Chong and Treisman, 2005). Previous research has
demonstrated ensemble coding for low-level visual information (e.g., Alvarez & Oliva,
2008; Parkes et al., 2001; Ariely, 2001), as well as for more complex stimuli such as
faces (e.g., Haberman & Whitney, 2007). The current study is unique in that we believe it
provides evidence of an ability to gather numerical averages of groups of digits, and that
this ensemble coding mechanism extends to even higher level, semantic information.
Furthermore, we observed RT patterns that indicate the use of parallel processing during
such tasks, and accuracy patterns that show participants’ ability to average subsets of
digits without being aware of which subsets are relevant ahead of time.
Serial vs. Parallel Processing in Numerical Ensembles
When identical types of digit displays were presented in an ensemble coding task,
a serial visual search task, and a parallel visual search task (in which the target was
presented in a salient color), RTs for the ensemble task were slower than for both search
40
tasks. This overall difference in RTs across the three tasks is discussed below. However,
the key finding with respect to whether ensemble representations at the semantic level are
generated via serial or parallel mechanisms is that unlike in the search tasks, for ensemble
estimation, RTs reduced overall as display size increased. This reduction was driven by
the large target (greater-than-5) condition; in contrast, RTs in the less-than-5 condition
remained consistent across display sizes. This overall decrease in RTs with increasing
display size was counter to hypothesis (1a) in which we predicted a small increase as is
often seen in parallel search tasks (Egeth, 1966; Treisman & Gelade, 1980). Nonetheless,
the ensemble task generated a pattern more similar to the parallel than the serial search,
supporting hypothesis (1b) that extracting ensemble information at the semantic level
occurs in parallel across the display.
This decrease in RTs (and increase in accuracy) with increasing display size in the
ensemble task may align with the results of Sweeny and Whitney’s (2014) research on
perceiving the average direction of eye gaze. In their study, participants were able to
accurately gather ensemble gaze direction from sets of faces, and in fact, participants
reported more accurate eye gaze estimates for larger subsets of face stimuli. Sweeny and
Whitney suggest that when more information is available to contribute to the ensemble
representation, estimates will be more accurate (Sweeny & Whitney, 2014). Along these
lines, the increase in display size for the current study could have led to faster RTs and
more accurate estimates (at least in the greater-than 5 condition) because larger displays
provide more items from which to gather information when estimating the average value
of the digits.
41
Alternatively, we cannot rule out that the faster RTs for larger displays sizes
observed in the greater-than-5 condition in the ensemble task could also potentially be
explained by low-level differences between the less-than-5 and greater-than-5 conditions.
In the greater-than-5 condition, the digit displays tended to have more lines constituting
the digit than in the less-than-5 condition, which may have provided a cue to the correct
response based on the overall luminance of the display. What is not clear is why for the
less-than-5 condition, accuracy remained consistent, as did RTs. For this condition,
display sizes likely contained more of the number “1”, which may have been salient due
to their unique shape comprised of a singular line. It may be that “1”s were not as salient
as the brightness cues, or even that the “7”s included in the greater than 5 displays
balanced it out because they also contained a prominent singular line. These displays also
contained more digits to gather information from, but this did not seem to be useful in the
less-than-5 condition as it was for the greater-than-5 condition. It is interesting that in the
serial search task, participants also displayed faster RTs in the greater-than-5 compared to
the less-than-5 condition. It is possible that larger displays may have biased participants
towards a “greater-than-5” response.
To return to the findings of overall differences in RTs and accuracy across the
three tasks, RTs were slower and accuracy was lower for the ensemble task compared to
both of the search tasks. This difference between the ensemble and search tasks can
potentially be explained by differences in task demands. In the parallel search task,
participants’ attention was likely immediately drawn to the “pop-out” digit, generating
the fastest RTs. In the serial search task, participants responded immediately after
searching for a digit less-than-5 or greater-than-5, whereas for the ensemble task,
42
participants were asked to estimate the average, a process which may involve inherently
greater uncertainty. Note that whereas RTs for both the serial search and the parallel
search increased across display sizes, in the parallel search task, RTs increased by less
than 10 ms from the smallest to largest display size, compared to a 150 ms increase for
the serial search task. This pattern was predicted based on Egeth (1966) who found small
increases in RTs as display sizes increased even in parallel tasks. Our data also confirm
slower RTs for the serial search compared to the parallel search. This is expected because
the salient target in the parallel search captures participants’ attention, whereas in the
serial search participants would have to scan each item in the display until finding the
target (Duncan & Humphreys, 1989; Treisman & Gelade, 1980). Overall, RT patterns on
the ensemble task more closely resembled those observed in the parallel search task,
demonstrating that participants did not need to examine each digit individually in order to
incorporate it into a representation of the average, but rather were able to extract
information from items across the entire display in parallel.
Automaticity of Averaging Numerical Subsets
As discussed above, comparing a semantic ensemble task to visual search tasks
suggests that we can gather semantic information from multiple items in a display
simultaneously. We also wanted to investigate the ability to generate ensemble
representations of subsets within a display. To do this we presented participants with
color cues either before or after a display that informed them about which colored subset
of digits to respond to. In a similar task, but with circle sets, Chong and Treisman (2005)
reported no difference in the ability of participants to report average size after being
43
either pre-cued or post-cued to the relevant subset. Thus, participants were able to extract
the average circle size of the subsets even when they were not aware of which subset of
circles they should attend to. Findings of this study may also suggest that the ability to
gather semantic information occurs quickly for subsets of stimuli, indicating a potential
automatic component that allows for attention to a full set, yet report information for only
a subset. A whole-digit display task was used in the current study to compare
performance on averaging the whole vs. subsets.
Comparing the whole digit display task to the pre- and post-cue task revealed
overall higher accuracy for the whole display task. This goes against our prediction of no
difference between the 5 item display in the whole display task and the pre-cued
condition (hypothesis 2a), and also shows that compared to the 10 item display,
participants are less accurate for the subset task, indicating the possibility that they are
not gathering the average strictly from the subset of interest, but rather are attempting to
incorporate information from digits in the other subset. Although this difference could
indicate that participants were not extracting an ensemble average from the pre- and post-
cued displays in a similar manner to the whole-display task, the difference could also be
due to an additional working memory component involved in the pre-/post-cue tasks. For
the whole-display task, participants immediately reported the average, whereas in the pre-
and post-cue tasks, participants had to either remember the cued color while viewing the
stimulus display (pre-cued), or maintain information about the stimulus display while
viewing the cue color (post-cue). These additional requirements could have led to
decreased accuracy in the pre-/post-cue tasks. The decreased performance due to a
heavier cognitive load is in accordance with the cognitive load theory, originally
44
explained by Sweller (1988) as problem-solving ineffectiveness due to the division of
cognitive processes among two different tasks. Because holding the color cue in memory
and estimating the average are different tasks, they could contribute to a greater conflict
between cognitive resources during task completion for the pre-/post-cued tasks.
Despite lower accuracy in the pre- and post-cue tasks as compared to the whole
display task, accuracy was not different between the pre- and post-cue tasks. Consistent
with hypothesis (2b), participants were able to average subsets of digits as accurately
when they had to attend to the full set to gather information (post-cue task) as when they
knew ahead of time to which subset they should attend (pre-cue task). This result
suggests a degree of automaticity in extracting ensemble semantic information from
perceptually defined subsets, as shown by Chong and Treisman (2003) for circle size.
Conclusions, Limitations, and Future Research
The current study provides novel insights into the ways that our visual system
uses ensemble coding. Results suggest that we gather ensemble information from
semantic stimuli using a parallel processing mechanism, and that we can also gather this
information from subsets of digits in a display. However, there are several limitations of
the study that may impact the interpretation of the findings and will be important to
address in future research.
One major limitation of the study is the potential negative influence of low-level
cues on performance on the ensemble coding tasks. For ensemble coding as well as visual
crowding phenomena, it has been shown that low-level features contribute substantially
to perception of a cluttered display (Ariely, 2001; Chung, Levi, & Legge, 2001; Parkes,

45
Lund, Angelucci, Solomon, & Morgan, 2001; Pelli et al., 2004). In the current study,
although we were interested in the contribution of semantic information to perception of
the average of digit displays, it is nonetheless possible that participants used low-level
features such as overall luminance to make decisions about the average numerical value
of displays. This limits our ability to draw strong conclusions regarding the role of
semantic information in ensemble coding based on the results of the present study. To
help control for low-level confounds, future research could replicate the current task
using two-digit numbers so as to better account for brightness and other low-level
differences. With two-digit numbers there is more opportunity to match less-than-5 and
greater-than-5 displays with regard to the number of lines (more lines in the tens place
could be balanced by fewer in the ones place), allowing screen luminance to be matched
across conditions and minimizing the possibility that participants could rely on brightness
to make their judgments. Using double-digit numbers would also work to control for
other perceptual features, such as salient line orientation of the “1” or “7” digits in this
experiment.
Another limitation of the current study was the need to exclude the data from a
greater number of participants from the pre-/post-cue tasks as compared to the whole-
display task due to chance-level accuracy or by nature of being an outlier for RTs. Since
we were conducting repeated-measures analyses, we also had to remove data from these
participants from the whole-display task, even though their performance on that task may
have been sufficient for analysis. This means that performance on the whole-display task
could have been different than what our analyses allowed with the remaining participants.
Furthermore, exclusion of several datasets reflecting poor performance from the pre- and
46
post-tasks resulted in an average performance that could be viewed as artificially inflated.
However, the accuracy of the excluded participants was within the range that could be
considered chance performance (< 60% correct), whereas the remaining participants on
average scored well above chance (> 90% correct). In addition, the greater number of
participants excluded for low accuracy were actually from the pre-cue condition, meaning
that the post-cue performance could not have been inflated by removing low-accuracy
cases. This further supports the idea that there was no advantage in the pre-cue condition.
In fact, the lower accuracy in this condition could potentially represent a disadvantage for
being pre-cued. This unexpected accuracy difference among excluded participants could
be due to the pre-cue task requiring participants to hold the cued color in mind while
gathering the ensemble, or some other unexpected difficulty within the task. The
differences in excluded participant accuracy were not due to pre-cue/post-cue
presentation order because about half of those who were excluded from the pre-cued
analyses received this condition before the post-cue condition, while the other half
received it after. Nonetheless, a greater number of participants would help to parse out
differences if they exist between the pre- and post-cue conditions.
Future research could also assess the role of automaticity in ensemble perception
of semantic information in more detail. In the current study, the cues were always
congruent. Thus, we cannot assess whether participants automatically extracted
information from a subset of the display when not attending to that subset. Here,
participants were aware of the need to attend to the whole set, rather than attending
entirely to the wrong set of digits. By incorporating the use of congruent and incongruent
pre-cues, researchers could investigate whether participants automatically, without
47
attention, gather information from one subset, despite being cued to the other subset. If
they were cued incongruently, then they would attend to the set opposite to the one that
they were later asked to report. If they still report the average with high accuracy, this
would mean that participants are able to extract the average of an ignored subset while
actively attending to a different subset.
The current study calls for methodological follow-ups in order to further assess
our ability to gather ensemble information from semantic stimuli, as well as to obtain
additional evidence addressing the potential automaticity of this process. Nonetheless, the
current research provides useful information that can pave the way for future research
aimed at revealing the strategies employed by our perceptual systems in order to make
sense of our cluttered environment. Here, we have provided preliminary evidence that
builds on the work of Van Opstal and colleagues (2011) and Chong and Treisman (2005)
to show that we can rapidly gather useful semantic information about multiple items in
parallel and use that information to make ensemble judgments about the group or subsets
within the group. The novelty of this current study is grounded in the uniqueness of
semantic stimuli in that they have both low-level perceptual features as well as high-level
semantic meaning. This means that our investigation of these stimuli (in terms of
ensemble coding) has provided additional evidence for our ability to rapidly gather
information about groups of numbers that are processed at a level beyond that of only
low-level perception (Ariely, 2001; Alvarez & Oliva, 2008; Alvarez & Oliva, 2009;
Dakin & Watt, 1997; Parkes et al., 2001). We have also identified potential directions for
future work that will allow for better understanding of the mechanisms that underlie this
ability.
48
REFERENCES
Alvarez, G. A. (2011). Representing multiple objects as an ensemble enhances visual
cognition. Trends in Cognitive Sciences, 15, 122-131. doi:
10.1016/j.tics.2011.01.003
Alvarez, G. A. & Oliva, A. (2008). The representation of simple ensemble visual features
outside the focus of attention. Psychological Science, 19, 392-398. doi:
10.1111/j.1467-9280.2008.02098.x
Alvarez, G. A., & Oliva, A. (2009). Spatial ensemble statistics are efficient codes that can
be represented with reduced attention. Proceedings of the National Academy of
Sciences, 106, 7345-7350. www.pnas.org/cgi/doi/10.1073/pnas.0808981106
Ariely, D. (2001). Seeing sets: Representation by statistical properties. Psychological
Science, 12, 157-162. doi: 10.1111/1467-9280.00327
Chong, S. C., & Treisman, A. (2003). Representation of statistical properties. Vision
Research, 43, 393-404.
49
Chong, S. C., & Treisman, A. (2005). Statistical processing: Computing the average size
in perceptual groups. Vision Research, 45, 891-900.
Chung, S. T. Levi, D. M. Legge, G. E. (2001). Spatial-frequency and contrast properties
of crowding. Vision Research, 41, 1833–1850.
Cohen, J. (1988). The analysis of variance. Statistical Power Analysis for the Behavioral
Sciences (273-406). Hillsdale, New Jersey: Lawrence Erlbaum Associates.
Corbett, J. E., Oriet, C., & Rensink, R.A. (2006). The rapid extraction of numeric
meaning. Vision Research, 46, p. 1559-1573. doi:10.1016/j.visres.2005.11.015
Dakin, S. C., & Watt, R. J. (1997). The computation of orientation statistics from visual
texture. Vision Research, 37, 3181-3192.
De Souza, W. C., Eifuki, S., Tamura, R., Nishijo, H., & Ono, T. (2005). Differential
characteristics of face neuron responses within the anterior superior temporal
sulcus of macaques. Journal of Neurophysiology, 94, 1252–1266.
doi:10.1152/jn.00949.2004
Duncan, J., & Humphreys, G. (1989). Visual search and stimulus similarity.
Psychological Review, 96, 433-458.
Egeth, H. E. (1966). Parallel versus serial processes in multidimensional stimulus
discrimination. Perception & Psychophysics, 1, 245-252. doi:
10.3758/BF03207389
50
Farah, M. J., Wilson, K. D., Drain, M., & Tanaka, J. N. (1998). What is special about
face perception? Psychological Review, 105, 482-498. doi: 10.1.1.117.4804
Farzin, F., Rivera, S. M., & Whitney, D. (2010). Holistic crowding of mooney faces.
Journal of Vision, 9(6), 1-29. doi: 10.1167/9.6.18.
Faul, F., Erdfelder, E., Lang, A. G., & Buchner, A. (2007). G* Power 3: A flexible
statistical power analysis program for the social, behavioral, and biomedical
sciences. Behavior Research Methods, 39, 175-191. doi:10.3758/BF03193146
Firestone, C., & Scholl, B. (2015). Cognition does not affect perception: Evaluating the
evidence for top-down effects. Behavioral and Brain Sciences, 1,1-77. doi:
10.1017/S0140525X15000965
Gauthier, I., & Tarr, M. J. (1997) Becoming a “greeble” expert: Exploring mechanisms
for face recognition. Vision Research, 37, 1673-1682. doi:10.1016/S0042-
6989(96)00286-6
Haberman, J., & Whitney, D. (2007). Rapid extraction of mean emotion and gender from
sets of faces. Current Biology, 17, R751-R753.
Haberman, J., & Whitney, D. (2009). Seeing the mean: Ensemble coding for sets of
faces. Journal of Experimental Psychology: Human Perception and Performance,
35, 718-734. doi: 10.1037/a0013899
Haberman, J., & Whitney, D. (2010). The visual system discounts emotional deviants
when extracting average expression. Attention, Perception, & Psychophysics, 72,
1825-1838. doi: 10.3758/APP.72.7.1825

51
Haberman, J., Harp, T., & Whitney, D. (2009). Averaging facial expression over time.
Journal of Vision, 9, 1-13. doi: 10.1167/9.11.1
He S, Cavanagh P, Intriligator J. Attentional resolution. Trends in Cognitive
Neuroscience 1997:1. doi: 10.1016/S1364-6613(97)89058-4
IBM Corp. Released 2011. IBM SPSS Statistics for Windows, Version 20.0. Armonk,
NY: IBM Corp
Krueger, L. E. (1984). The category effect in visual search depends on physical rather
than conceptual differences. Perception & Psychophysics, 35, 558–564. doi:
10.3758/BF03205953
Louie, E. G., Bressler, D. W., & Whitney, D. (2007). Holistic crowding: Selective
interference between configural representations of faces in crowded scenes.
Journal of Vision, 7, 1-11. doi: 10.1167/7.2.24
Myczek, K., & Simons, D. J. (2008). Better than average: Alternatives to statistical
summary representations for rapid judgments of average size. Perception &
Psychophysics, 70, 772-788. doi: 10.3758/PP.70.5.772
Naparstek, S., & Henik, A. (2010). Count me in! On the automaticity of numerosity
processing. Journal of Experimental Psychology: Learning, Memory, and
Cognition, 36, 1053-1059. doi: 10.1037/a0019766
Oriet, C., & Corbett, J. (2008). Evidence for rapid extraction of average size in RSVP
displays of circles [Abstract]. Journal of Vision, 8:13. doi:10.1167/8.6.13
52
Parkes, L., Lund, J., Angelucci, A., Solomon, J. A., & Morgan, M. (2001). Compulsory
averaging of crowded orientation signals in human vision. Nature Neuroscience,
4, 739–744.
Pelli, D. G., Palomares. M., & Majaj, N., J. (2004). Crowding is unlike ordinary masking:
Distinguishing feature integration from detection. Journal of Vision, 4, 1136–
1169. doi:10.1167/4.12.12
Perrett, D. I., Smith, A. J., Potter, D. D., Mistlin, A. J., Head, A. S., Milner, A. D., &
Jeeves, M. A. (1985). Visual cells in the temporal cortex sensitive to face view
and gaze direction. Proceedings of the Royal Society B: Biological Sciences, 223,
293–317.
Pylyshyn, Z. (1999). Is vision continuous with cognition? The case for cognitive
impenetrability of visual perception. Behavioral and Brain Sciences, 22, 341–365.
doi:10.1017/S0140525X99002022
Sweller, J. (1988). Cognitive load during problem solving: Effects on learning. Cognitive
Science, 12, 257-285.
Sweeny, T. D., & Whitney, D. (2014). Perceiving crowd attention: Ensemble perception
of a crowd’s gaze. Psychological Science, 25, 1903-1913. doi:
10.1177/0956797614544510
Sobel, K. V., Puri, A. M., & Hogan, J. (2014). Target grouping in visual search for
multiple digits. Attention, Perception, and Psychophysics, 76:2584-5. doi:
10.3758/s13414-014-0761-9
53
Tanaka, J. W., & Farah, M. J. (1993). Parts and wholes in face recognition. The Quarterly
Journal of Experimental Psychology, 46A, 225-245.
Townsend, J. T. (1990). Serial vs. parallel processing: Sometimes they look like
tweedledum and tweedledee but they can (and should) be distinguished.
Psychological Science, 1, 46-54.
Treisman, A. (2005). Statistical processing: Computing the average size in perceptual
groups. Vision Research, 45, 891-900. doi:10.1016/j.visres.2004.10.004
Treisman, A. M., & Gelade, G. (1980). A feature-integration theory of attention.
Cognitive Psychology, 12, 97-136.
Watamaniuk, S. N. J., Sekuler, R., &Williams, D. W. (1989). Direction perception in
complex dynamic displays: The integration of direction information. Vision
Research, 29, 49-59.
Whitney, D., & Levi, D. M. (2011). Visual crowding: A fundamental limit on conscious
perception and object recognition. Trends in Cognitive Sciences, 15, 168.
oi:10.1016/j.tics.2011.02.005
Williams, D. W., & Sekuler, R. (1984). Coherent global motion percepts from stochastic
local motions. Vision Research, 24, 55–62. doi: 10.1145/988525.988533
Wolfe, J. M., & Horowitz, T. S. (2004). What attributes guide the deployment of visual
attention and how do they do it? Nature Reviews Neuroscience, 5, 1–7.
doi:10.1038/nrn1411

54
Valentine, T. Upside-down faces: A review of the effect of inversion upon face
recognition. British Journal of Psychology, 79, 471-491. doi: 10.1111/j.2044-
8295.1988.tb02747.x
Van Opstal, F., de Lange, F. P., & Dehaene, S. (2011). Rapid parallel semantic
processing of numbers without awareness. Cognition, 120, 136-147.
doi:10.1016/j.cognition.2011.03.005
Yin, R. K. Looking at upside down faces. Journal of Experimental Psychology, 81, 141-
145. http://dx.doi.org/10.1037/h0027474