enric carrera-gallissà influence of silk-like finishing ... · 82 carrera-alliss e, capdevila...
TRANSCRIPT
82 Carrera-Gallissà E, Capdevila X,Valldeperas J. Influence of Silk-Like Finishing Process Variables on Fabric Properties.FIBRES & TEXTILES in Eastern Europe 2017; 25, 4(124): 82-88. DOI: 10.5604/01.3001.0010.2778
Influence of Silk-Like Finishing Process Variables on Fabric PropertiesDOI: 10.5604/01.3001.0010.2778
AbstractA 100% PES woven fabric was subjected to a silk-like finishing treatment using a two-factor (soda concentration and vaporisation time), three-level experimental design on a pilot plant in order to examine the influence of process variables on fabric drape and hand, and also to relate weight loss to the properties of the finished fabric. Weight loss in the fabric was significantly related to the process variables studied. By contrast, the vaporisation time af-fected no drape indicator, even though it interacted significantly with the soda concentration, which influenced three of the five indicators examined. Also the vaporisation time affected no FAST property, but its interaction with the soda concentration had a significant effect on all drape-related FAST parameters. Regression equations accurately predicting drape indicators and physico-mechanical properties of the fabric studied from its weight loss are proposed.
Key words: silk-like finishing, drape, FAST.
Enric Carrera-Gallissà1,*, Xavier Capdevila1, Josep Valldeperas2
1 Polytechnic University of Catalonia, Textile and Paper Department,
Terrassa, Spain* E-mail: [email protected]
2 Polytechnic University of Catalonia, Terrassa Institute of Textile Research
and Industrial Cooperation, Terrassa, Spain
of fibres leaves a slightly grainy, wavy surface that confers a softer touch and increased drape to fabrics.
Some authors have investigated the hy-drolysis of polyester fibre with various bases in non-aqueous media as well as in aqueous sodium hydroxide [4, 5]. Fabric weight loss resulting from the silk-like finishing process has been the subject of several studies since the 1980s, which have revealed that treating fabric with soda has no effect on the fibre cross-sec-tion [2, 6] but alters fibre and yarn thick-ness [7, 8]. The process has also been studied in relation to the mechanical properties of fabric yarns [2, 7], loss of tensile strength [9]; specific structure energy [7], bending stiffness [10], drop properties [11], air permeability [7]; wa-ter vapour and liquid water transfer [12], the contact angle and wicking [7, 12], hand properties [6] and the effects of weight loss in polyester microfibre-based fabrics on their physical and mechanical properties [13]. Other authors have ex-
amined the influence of silk-like finish-ing variables and their effects on polymer surfaces [2].
There have also been several studies on the action of sodium hydroxide in alco-holic media (methanol, ethanol, propanol and butanol) on polyester fabrics and its influence on fabric weight loss, tensile strength, density, crystallinity, thermal properties, surface properties (under an electron microscope) and the dielectric constant [14]. A study on the dielectric constant revealed that weight loss by the effect of polyester fabric hydrolysis dif-fers for treatments with sodium hydrox-ide and those with a sodium alkoxide in a non-aqueous medium.
ObjectivesIndustrially the silk-finishing process is controlled mainly via fabric weight loss through the effect of soda treatment. The loss, however, is merely a means to an end rather than the aim. The pri-
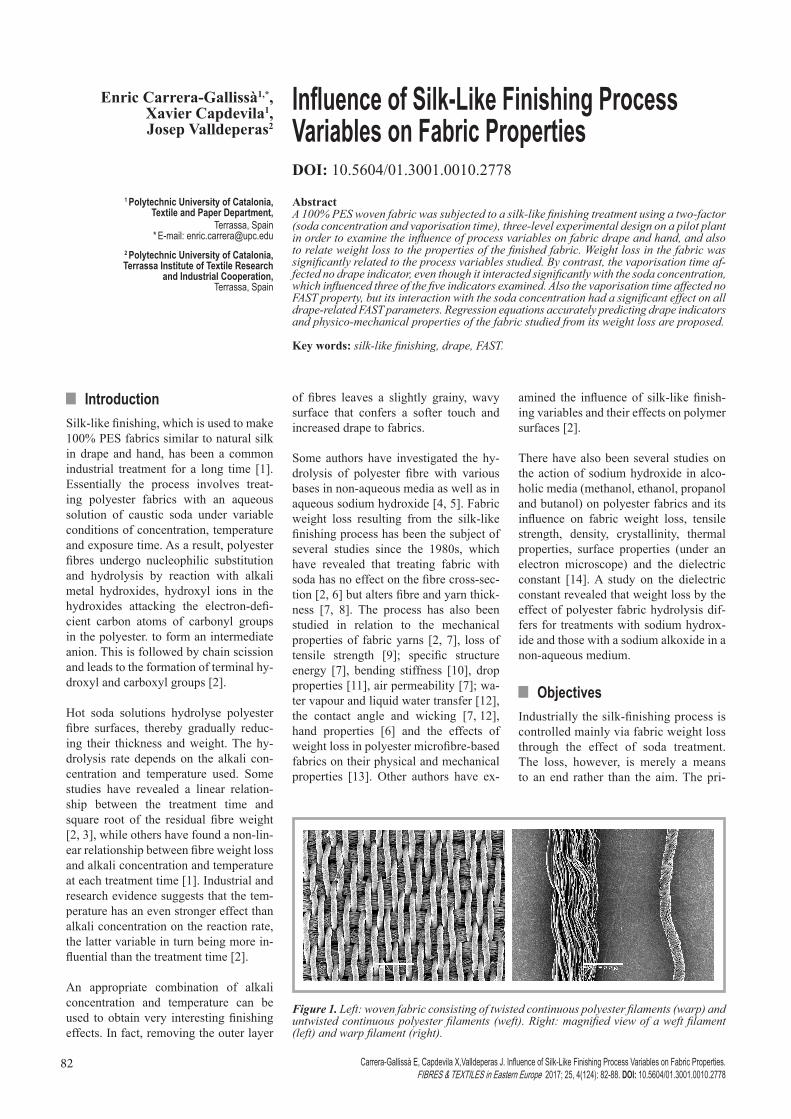
Figure 1. Left: woven fabric consisting of twisted continuous polyester filaments (warp) and untwisted continuous polyester filaments (weft). Right: magnified view of a weft filament (left) and warp filament (right).
IntroductionSilk-like finishing, which is used to make 100% PES fabrics similar to natural silk in drape and hand, has been a common industrial treatment for a long time [1]. Essentially the process involves treat-ing polyester fabrics with an aqueous solution of caustic soda under variable conditions of concentration, temperature and exposure time. As a result, polyester fibres undergo nucleophilic substitution and hydrolysis by reaction with alkali metal hydroxides, hydroxyl ions in the hydroxides attacking the electron-defi-cient carbon atoms of carbonyl groups in the polyester. to form an intermediate anion. This is followed by chain scission and leads to the formation of terminal hy-droxyl and carboxyl groups [2].
Hot soda solutions hydrolyse polyester fibre surfaces, thereby gradually reduc-ing their thickness and weight. The hy-drolysis rate depends on the alkali con-centration and temperature used. Some studies have revealed a linear relation-ship between the treatment time and square root of the residual fibre weight [2, 3], while others have found a non-lin-ear relationship between fibre weight loss and alkali concentration and temperature at each treatment time [1]. Industrial and research evidence suggests that the tem-perature has an even stronger effect than alkali concentration on the reaction rate, the latter variable in turn being more in-fluential than the treatment time [2].
An appropriate combination of alkali concentration and temperature can be used to obtain very interesting finishing effects. In fact, removing the outer layer
83FIBRES & TEXTILES in Eastern Europe 2017, Vol. 25, 4(124)
mary aim of this work was to examine the influence of process variables of the silk-like finishing treatment on fabric drape, as well as the relationship be-tween weight loss and the properties of the finished fabric.
Material and methodsThe present study was conducted on a 100% PES fabric (see Figure 1), the characteristics of which are summarised in Table 1. The fabric was subjected to a silk-like finishing treatment on a Pad-Steam pilot plant, comprising an impreg-nation vat, vaporisation zone, washing train and drying zone (see Figure 2). The plant is located at the Chemical Textile Technology Laboratory of the Textile Research and Industrial Cooperation In-stitute of Terrassa (INTEXTER), Univer-sitat Politècnica de Catalunya (UPC).
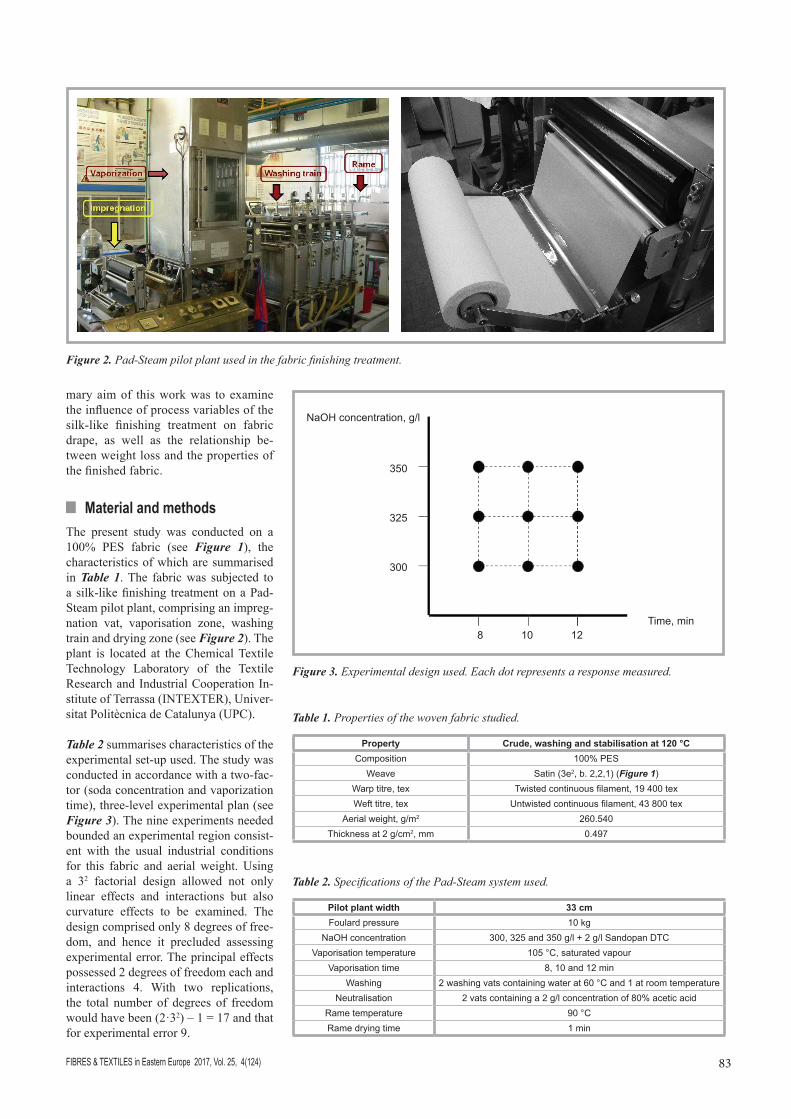
Table 2 summarises characteristics of the experimental set-up used. The study was conducted in accordance with a two-fac-tor (soda concentration and vaporization time), three-level experimental plan (see Figure 3). The nine experiments needed bounded an experimental region consist-ent with the usual industrial conditions for this fabric and aerial weight. Using a 32 factorial design allowed not only linear effects and interactions but also curvature effects to be examined. The design comprised only 8 degrees of free-dom, and hence it precluded assessing experimental error. The principal effects possessed 2 degrees of freedom each and interactions 4. With two replications, the total number of degrees of freedom would have been (2·32) – 1 = 17 and that for experimental error 9.
Table 1. Properties of the woven fabric studied.
Property Crude, washing and stabilisation at 120 °CComposition 100% PES
Weave Satin (3e2, b. 2,2,1) (Figure 1)Warp titre, tex Twisted continuous filament, 19 400 texWeft titre, tex Untwisted continuous filament, 43 800 tex
Aerial weight, g/m2 260.540Thickness at 2 g/cm2, mm 0.497
Figure 2. Pad-Steam pilot plant used in the fabric finishing treatment.
Table 2. Specifications of the Pad-Steam system used.
Pilot plant width 33 cmFoulard pressure 10 kg
NaOH concentration 300, 325 and 350 g/l + 2 g/l Sandopan DTCVaporisation temperature 105 °C, saturated vapour
Vaporisation time 8, 10 and 12 minWashing 2 washing vats containing water at 60 °C and 1 at room temperature
Neutralisation 2 vats containing a 2 g/l concentration of 80% acetic acidRame temperature 90 °CRame drying time 1 min
Figure 3. Experimental design used. Each dot represents a response measured.
NaOH concentration, g/l
350
325
300
Time, min8 10 12
FIBRES & TEXTILES in Eastern Europe 2017, Vol. 25, 4(124)84
variability. Cluster analysis, which was additionally used to examine the results in graphical form, singled out three clus-ters that coincided with the three factors in the underlying structure. A criterion for distinguishing fabrics with an iden-tical drape ratio in terms of drape shape based on sequential application of four of the seven initially selected indicators was developed and experimentally validated.
In this study, drape was assessed using five of the seven indicators selected by the authors in a previous work on the evaluation of fabric drape [15].
The specific indicators used were as fol-lows:
Drape ratio (%DR) [17], which was cal-culated from
9
symmetry and variability. Cluster analysis, which was additionally used to
examine the results in graphical form, singled out three clusters that coincided
with the three factors in the underlying structure. A criterion for distinguishing
fabrics with an identical drape ratio in terms of drape shape based on sequential
application of four of the seven initially selected indicators was developed and
experimentally validated.
In this study, drape was assessed using five of the seven indicators selected by
the authors in a previous work on the evaluation of fabric drape [15].
The specific indicators used were as follows:
a) Drape ratio (%DR) [17], which was calculated from
(1)
the parameters of which are illustrated in Fig. 4.
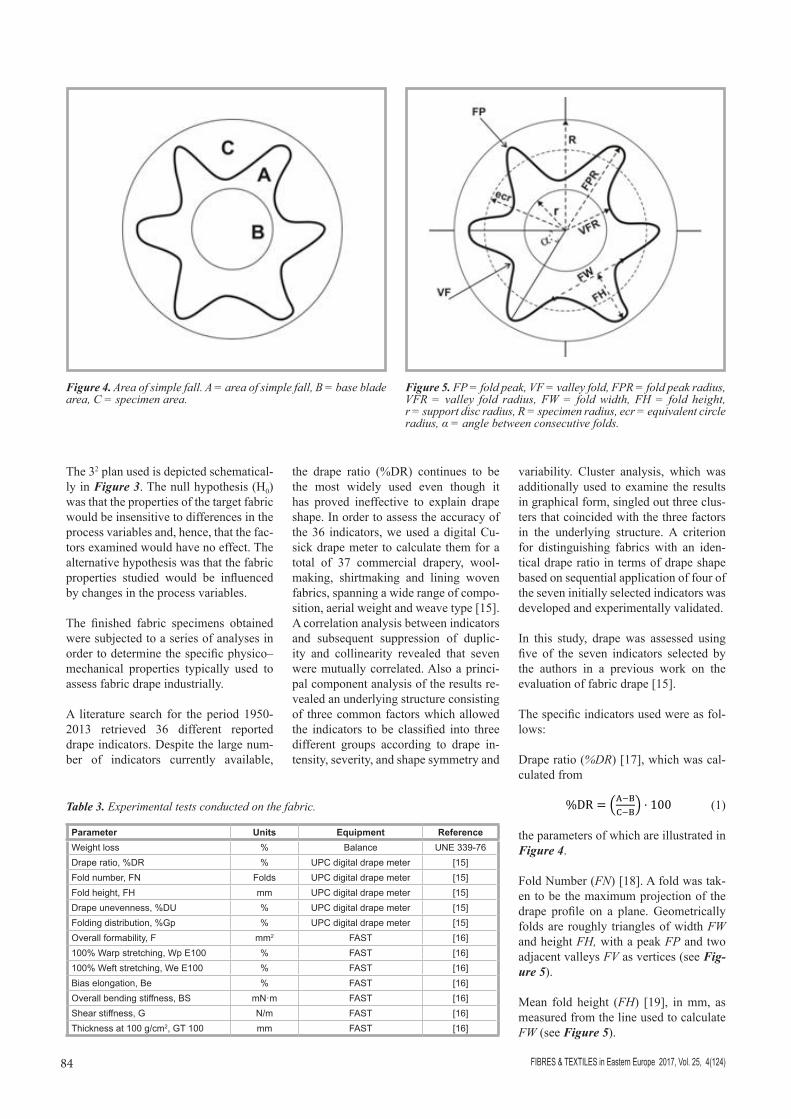
Figure 4. Area of simple fall. A = area of simple fall, B = base blade area, C =
specimen area.
(1)
the parameters of which are illustrated in Figure 4.
Fold Number (FN) [18]. A fold was tak-en to be the maximum projection of the drape profile on a plane. Geometrically folds are roughly triangles of width FW and height FH, with a peak FP and two adjacent valleys FV as vertices (see Fig-ure 5).
Mean fold height (FH) [19], in mm, as measured from the line used to calculate FW (see Figure 5).
Table 3. Experimental tests conducted on the fabric.
Parameter Units Equipment ReferenceWeight loss % Balance UNE 339-76Drape ratio, %DR % UPC digital drape meter [15]Fold number, FN Folds UPC digital drape meter [15]Fold height, FH mm UPC digital drape meter [15]Drape unevenness, %DU % UPC digital drape meter [15]Folding distribution, %Gp % UPC digital drape meter [15]Overall formability, F mm2 FAST [16]100% Warp stretching, Wp E100 % FAST [16]100% Weft stretching, We E100 % FAST [16]Bias elongation, Be % FAST [16]Overall bending stiffness, BS mN·m FAST [16]Shear stiffness, G N/m FAST [16]Thickness at 100 g/cm2, GT 100 mm FAST [16]
Figure 4. Area of simple fall. A = area of simple fall, B = base blade area, C = specimen area.
Figure 5. FP = fold peak, VF = valley fold, FPR = fold peak radius, VFR = valley fold radius, FW = fold width, FH = fold height, r = support disc radius, R = specimen radius, ecr = equivalent circle radius, α = angle between consecutive folds.
The 32 plan used is depicted schematical-ly in Figure 3. The null hypothesis (H0) was that the properties of the target fabric would be insensitive to differences in the process variables and, hence, that the fac-tors examined would have no effect. The alternative hypothesis was that the fabric properties studied would be influenced by changes in the process variables.
The finished fabric specimens obtained were subjected to a series of analyses in order to determine the specific physico–mechanical properties typically used to assess fabric drape industrially.
A literature search for the period 1950-2013 retrieved 36 different reported drape indicators. Despite the large num-ber of indicators currently available,
the drape ratio (%DR) continues to be the most widely used even though it has proved ineffective to explain drape shape. In order to assess the accuracy of the 36 indicators, we used a digital Cu-sick drape meter to calculate them for a total of 37 commercial drapery, wool-making, shirtmaking and lining woven fabrics, spanning a wide range of compo-sition, aerial weight and weave type [15]. A correlation analysis between indicators and subsequent suppression of duplic-ity and collinearity revealed that seven were mutually correlated. Also a princi-pal component analysis of the results re-vealed an underlying structure consisting of three common factors which allowed the indicators to be classified into three different groups according to drape in-tensity, severity, and shape symmetry and
85FIBRES & TEXTILES in Eastern Europe 2017, Vol. 25, 4(124)
= —FHFHi
n
n
i=1 (2)
Drape unevenness (%DU) [20]. This is the coefficient of variation between con-secutive folds and accounts for drape symmetry in each specimen, but not for drape shape. This indicator is expressed as a percentage and can range from 0% (maximum symmetry) to 100% (mini-mum symmetry).
11
d) Drape unevenness (%DU) [20]. This is the coefficient of variation
between consecutive folds and accounts for drape symmetry in each
specimen, but not for drape shape. This indicator is expressed as a
percentage and can range from 0% (maximum symmetry) to 100%
(minimum symmetry).
(3)
e) Fold distribution (%Gp) [21]. This is the percent coefficient of
variation for the peak length (FPR, Fig. 4), and provides a measure of
variability in the fold shape and symmetry in each specimen.
(4)
The physical and mechanical properties of the fabrics related to the drape were
examined using FAST equipment [16].
Table 3 shows the tests, equipment and methodology used. All specimens were
conditioned in accordance with UNE 40-139-75 and all tests conducted at the
Textile Physics Laboratory of the Textile and Paper Engineering Department of
the Universitat Politècnica de Catalunya.
(3)
Fold distribution (%Gp) [21]. This is the percent coefficient of variation for the peak length (FPR, Figure 4), and pro-vides a measure of variability in the fold shape and symmetry in each specimen.
11
d) Drape unevenness (%DU) [20]. This is the coefficient of variation
between consecutive folds and accounts for drape symmetry in each
specimen, but not for drape shape. This indicator is expressed as a
percentage and can range from 0% (maximum symmetry) to 100%
(minimum symmetry).
(3)
e) Fold distribution (%Gp) [21]. This is the percent coefficient of
variation for the peak length (FPR, Fig. 4), and provides a measure of
variability in the fold shape and symmetry in each specimen.
(4)
The physical and mechanical properties of the fabrics related to the drape were
examined using FAST equipment [16].
Table 3 shows the tests, equipment and methodology used. All specimens were
conditioned in accordance with UNE 40-139-75 and all tests conducted at the
Textile Physics Laboratory of the Textile and Paper Engineering Department of
the Universitat Politècnica de Catalunya.
(4)
The physical and mechanical properties of the fabrics related to the drape were examined using FAST equipment [16].
Table 3 shows the tests, equipment and methodology used. All specimens were conditioned in accordance with UNE 40-139-75 and all tests conducted at the Textile Physics Laboratory of the Textile and Paper Engineering Department of the Universitat Politècnica de Catalunya.
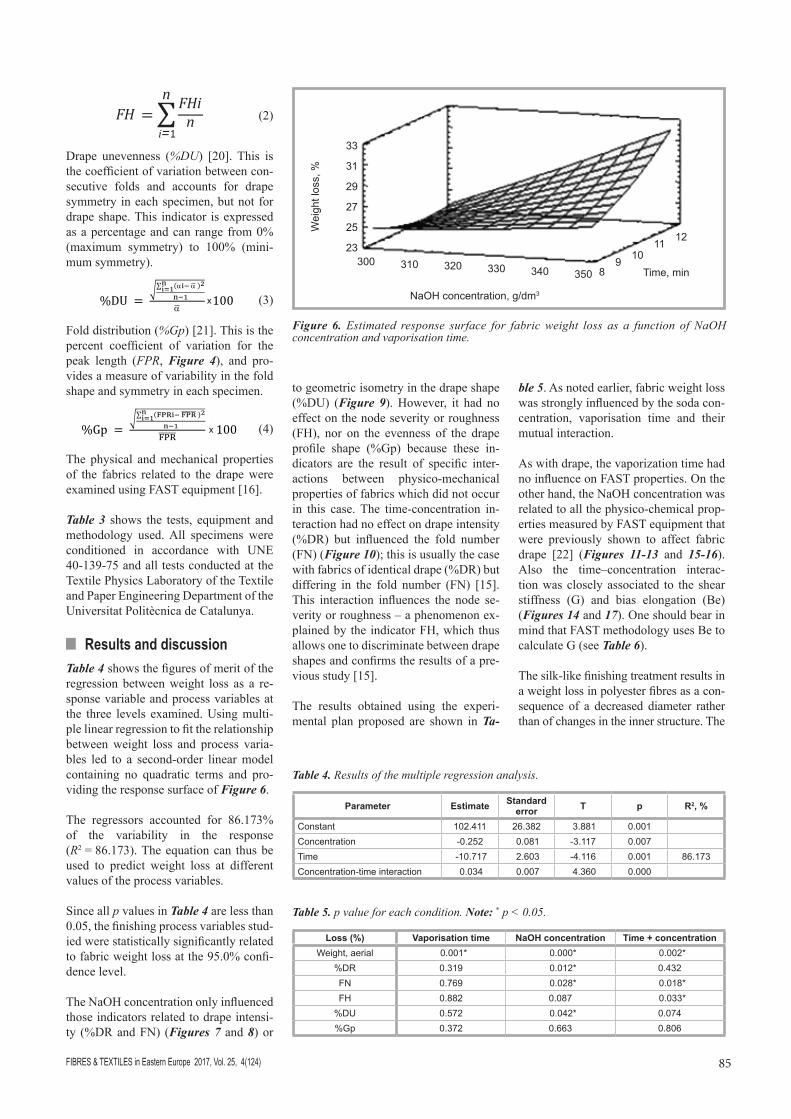
Results and discussionTable 4 shows the figures of merit of the regression between weight loss as a re-sponse variable and process variables at the three levels examined. Using multi-ple linear regression to fit the relationship between weight loss and process varia-bles led to a second-order linear model containing no quadratic terms and pro-viding the response surface of Figure 6.
The regressors accounted for 86.173% of the variability in the response (R2 = 86.173). The equation can thus be used to predict weight loss at different values of the process variables.
Since all p values in Table 4 are less than 0.05, the finishing process variables stud-ied were statistically significantly related to fabric weight loss at the 95.0% confi-dence level.
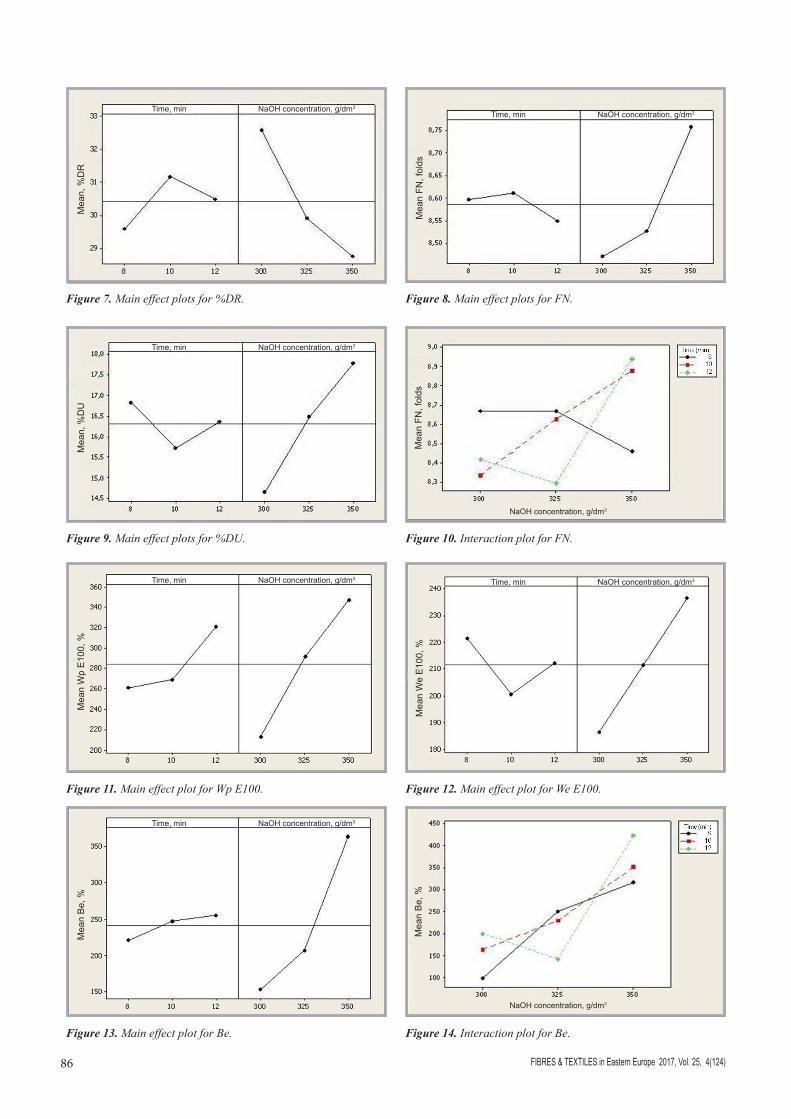
The NaOH concentration only influenced those indicators related to drape intensi-ty (%DR and FN) (Figures 7 and 8) or
Table 4. Results of the multiple regression analysis.
Parameter Estimate Standard error T p R2, %
Constant 102.411 26.382 3.881 0.001Concentration -0.252 0.081 -3.117 0.007Time -10.717 2.603 -4.116 0.001 86.173Concentration-time interaction 0.034 0.007 4.360 0.000
33
31
29
27
25
23300 310 320 330 340 350 8
9
10 11 12
Wei
ght l
oss,
%
NaOH concentration, g/dm3
Time, min
Figure 6. Estimated response surface for fabric weight loss as a function of NaOH concentration and vaporisation time.
to geometric isometry in the drape shape (%DU) (Figure 9). However, it had no effect on the node severity or roughness (FH), nor on the evenness of the drape profile shape (%Gp) because these in-dicators are the result of specific inter-actions between physico-mechanical properties of fabrics which did not occur in this case. The time-concentration in-teraction had no effect on drape intensity (%DR) but influenced the fold number (FN) (Figure 10); this is usually the case with fabrics of identical drape (%DR) but differing in the fold number (FN) [15]. This interaction influences the node se-verity or roughness – a phenomenon ex-plained by the indicator FH, which thus allows one to discriminate between drape shapes and confirms the results of a pre-vious study [15].
The results obtained using the experi-mental plan proposed are shown in Ta-
ble 5. As noted earlier, fabric weight loss was strongly influenced by the soda con-centration, vaporisation time and their mutual interaction.
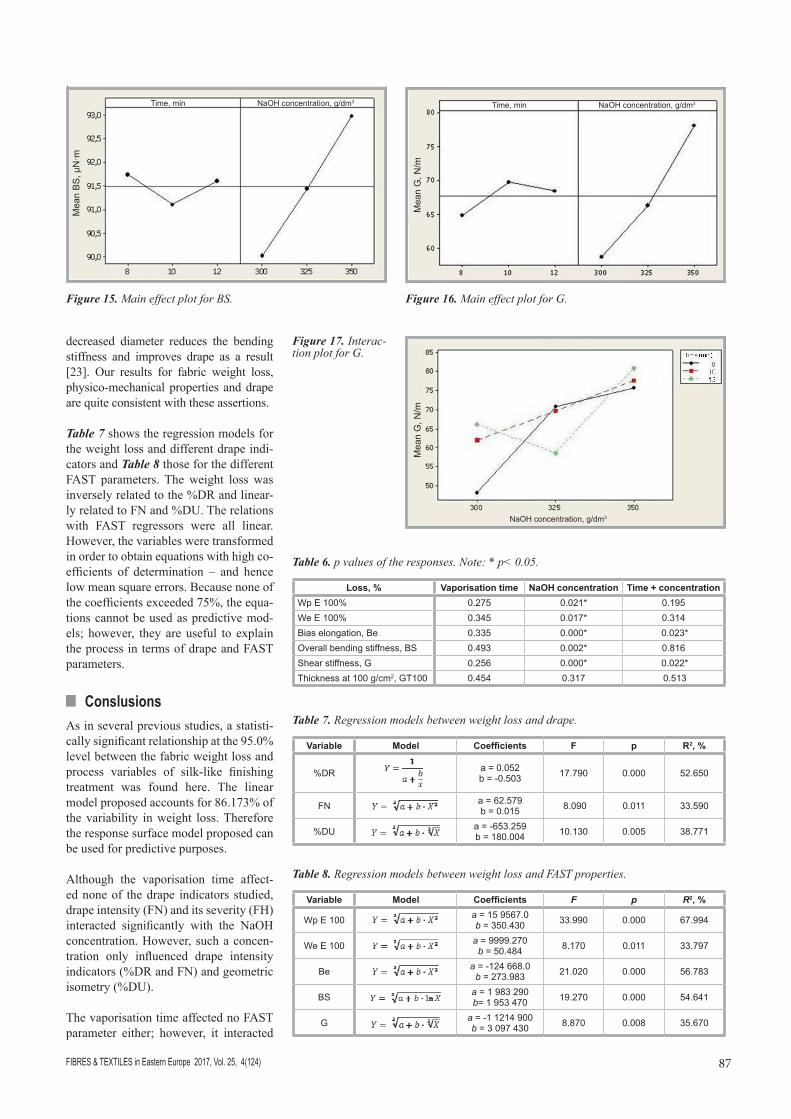
As with drape, the vaporization time had no influence on FAST properties. On the other hand, the NaOH concentration was related to all the physico-chemical prop-erties measured by FAST equipment that were previously shown to affect fabric drape [22] (Figures 11-13 and 15-16). Also the time–concentration interac-tion was closely associated to the shear stiffness (G) and bias elongation (Be) (Figures 14 and 17). One should bear in mind that FAST methodology uses Be to calculate G (see Table 6).
The silk-like finishing treatment results in a weight loss in polyester fibres as a con-sequence of a decreased diameter rather than of changes in the inner structure. The
Table 5. p value for each condition. Note: * p < 0.05.
Loss (%) Vaporisation time NaOH concentration Time + concentrationWeight, aerial 0.001* 0.000* 0.002*
%DR 0.319 0.012* 0.432FN 0.769 0.028* 0.018*FH 0.882 0.087 0.033*
%DU 0.572 0.042* 0.074%Gp 0.372 0.663 0.806
x
x
FIBRES & TEXTILES in Eastern Europe 2017, Vol. 25, 4(124)86
Figure 11. Main effect plot for Wp E100. Figure 12. Main effect plot for We E100.
Figure 13. Main effect plot for Be. Figure 14. Interaction plot for Be.
Figure 7. Main effect plots for %DR. Figure 8. Main effect plots for FN.
Figure 9. Main effect plots for %DU. Figure 10. Interaction plot for FN.
Mea
n, %
DR
Time, min NaOH concentration, g/dm3
Mea
n, %
DU
Time, min NaOH concentration, g/dm3
Mea
n W
p E
100,
%
Time, min NaOH concentration, g/dm3
Mea
n B
e, %
Time, min NaOH concentration, g/dm3
Mea
n FN
, fol
ds
Time, min NaOH concentration, g/dm3
Mea
n FN
, fol
ds
NaOH concentration, g/dm3
Mea
n W
e E
100,
%
Time, min NaOH concentration, g/dm3
Mea
n B
e, %
NaOH concentration, g/dm3
87FIBRES & TEXTILES in Eastern Europe 2017, Vol. 25, 4(124)
decreased diameter reduces the bending stiffness and improves drape as a result [23]. Our results for fabric weight loss, physico-mechanical properties and drape are quite consistent with these assertions.
Table 7 shows the regression models for the weight loss and different drape indi-cators and Table 8 those for the different FAST parameters. The weight loss was inversely related to the %DR and linear-ly related to FN and %DU. The relations with FAST regressors were all linear. However, the variables were transformed in order to obtain equations with high co-efficients of determination – and hence low mean square errors. Because none of the coefficients exceeded 75%, the equa-tions cannot be used as predictive mod-els; however, they are useful to explain the process in terms of drape and FAST parameters.
ConslusionsAs in several previous studies, a statisti-cally significant relationship at the 95.0% level between the fabric weight loss and process variables of silk-like finishing treatment was found here. The linear model proposed accounts for 86.173% of the variability in weight loss. Therefore the response surface model proposed can be used for predictive purposes.
Although the vaporisation time affect-ed none of the drape indicators studied, drape intensity (FN) and its severity (FH) interacted significantly with the NaOH concentration. However, such a concen-tration only influenced drape intensity indicators (%DR and FN) and geometric isometry (%DU).
The vaporisation time affected no FAST parameter either; however, it interacted
Figure 15. Main effect plot for BS. Figure 16. Main effect plot for G.
Figure 17. Interac-tion plot for G.
Table 6. p values of the responses. Note: * p< 0.05.
Loss, % Vaporisation time NaOH concentration Time + concentrationWp E 100% 0.275 0.021* 0.195We E 100% 0.345 0.017* 0.314Bias elongation, Be 0.335 0.000* 0.023*Overall bending stiffness, BS 0.493 0.002* 0.816Shear stiffness, G 0.256 0.000* 0.022*Thickness at 100 g/cm2, GT100 0.454 0.317 0.513
Table 7. Regression models between weight loss and drape.
Variable Model Coefficients F p R2, %
%DR
21
—and hence low mean square errors. Because none of the coefficients
exceeded 75%, the equations cannot be used as predictive models; however,
they are useful to explain the process in terms of drape and FAST parameters.
Table 7. Regression models between weight loss and drape
Variable Model Coefficients F p R2 (%)
%DR a = 0.052b = –0.503
17.790 0.000 52.650
FNa = 62.579b = 0.015
8.090 0.011 33.590
%DUa = –653.259b = 180.004
10.130 0.005 38.771
a = 0.052b = -0.503 17.790 0.000 52.650
FN
21
—and hence low mean square errors. Because none of the coefficients
exceeded 75%, the equations cannot be used as predictive models; however,
they are useful to explain the process in terms of drape and FAST parameters.
Table 7. Regression models between weight loss and drape
Variable Model Coefficients F p R2 (%)
%DR a = 0.052b = –0.503
17.790 0.000 52.650
FNa = 62.579b = 0.015
8.090 0.011 33.590
%DUa = –653.259b = 180.004
10.130 0.005 38.771
a = 62.579b = 0.015 8.090 0.011 33.590
%DU
21
—and hence low mean square errors. Because none of the coefficients
exceeded 75%, the equations cannot be used as predictive models; however,
they are useful to explain the process in terms of drape and FAST parameters.
Table 7. Regression models between weight loss and drape
Variable Model Coefficients F p R2 (%)
%DR a = 0.052b = –0.503
17.790 0.000 52.650
FNa = 62.579b = 0.015
8.090 0.011 33.590
%DUa = –653.259b = 180.004
10.130 0.005 38.771a = -653.259b = 180.004 10.130 0.005 38.771
Table 8. Regression models between weight loss and FAST properties.
Variable Model Coefficients F p R2, %
Wp E 100
22
Table 8. Regression models between weight loss and FAST properties.
Variable Model Coefficients F p R2 (%)
Wp E 100 a = 15 9567.0
b = 350.430
33.990 0.000 67.994
We E 100 a = 9999.270
b = 50.484
8.170 0.011 33.797
Be a = –124 668.0
b = 273.983
21.020 0.000 56.783
BS a = 1 983 290
b= 1 953 470
19.270 0.000 54.641
G a = –1 1214 900
b = 3 097 430
8.870 0.008 35.670
Conclusions
As in several previous studies, a statistically significant relationship at the
95.0% level between the fabric weight loss and process variables of silk-like
finishing treatment was found here. The linear model proposed accounts for
86.173% of the variability in weight loss. Therefore the response surface model
proposed can be used for predictive purposes.
Although the vaporisation time affected none of the drape indicators studied,
drape intensity (FN) and its severity (FH) interacted significantly with the NaOH
concentration. However, such a concentration only influenced drape intensity
indicators (%DR and FN) and geometric isometry (%DU).
a = 15 9567.0b = 350.430 33.990 0.000 67.994
We E 100
22
Table 8. Regression models between weight loss and FAST properties.
Variable Model Coefficients F p R2 (%)
Wp E 100 a = 15 9567.0
b = 350.430
33.990 0.000 67.994
We E 100 a = 9999.270
b = 50.484
8.170 0.011 33.797
Be a = –124 668.0
b = 273.983
21.020 0.000 56.783
BS a = 1 983 290
b= 1 953 470
19.270 0.000 54.641
G a = –1 1214 900
b = 3 097 430
8.870 0.008 35.670
Conclusions
As in several previous studies, a statistically significant relationship at the
95.0% level between the fabric weight loss and process variables of silk-like
finishing treatment was found here. The linear model proposed accounts for
86.173% of the variability in weight loss. Therefore the response surface model
proposed can be used for predictive purposes.
Although the vaporisation time affected none of the drape indicators studied,
drape intensity (FN) and its severity (FH) interacted significantly with the NaOH
concentration. However, such a concentration only influenced drape intensity
indicators (%DR and FN) and geometric isometry (%DU).
a = 9999.270b = 50.484 8.170 0.011 33.797
Be
22
Table 8. Regression models between weight loss and FAST properties.
Variable Model Coefficients F p R2 (%)
Wp E 100 a = 15 9567.0
b = 350.430
33.990 0.000 67.994
We E 100 a = 9999.270
b = 50.484
8.170 0.011 33.797
Be a = –124 668.0
b = 273.983
21.020 0.000 56.783
BS a = 1 983 290
b= 1 953 470
19.270 0.000 54.641
G a = –1 1214 900
b = 3 097 430
8.870 0.008 35.670
Conclusions
As in several previous studies, a statistically significant relationship at the
95.0% level between the fabric weight loss and process variables of silk-like
finishing treatment was found here. The linear model proposed accounts for
86.173% of the variability in weight loss. Therefore the response surface model
proposed can be used for predictive purposes.
Although the vaporisation time affected none of the drape indicators studied,
drape intensity (FN) and its severity (FH) interacted significantly with the NaOH
concentration. However, such a concentration only influenced drape intensity
indicators (%DR and FN) and geometric isometry (%DU).
a = -124 668.0b = 273.983 21.020 0.000 56.783
BS
22
Table 8. Regression models between weight loss and FAST properties.
Variable Model Coefficients F p R2 (%)
Wp E 100 a = 15 9567.0
b = 350.430
33.990 0.000 67.994
We E 100 a = 9999.270
b = 50.484
8.170 0.011 33.797
Be a = –124 668.0
b = 273.983
21.020 0.000 56.783
BS a = 1 983 290
b= 1 953 470
19.270 0.000 54.641
G a = –1 1214 900
b = 3 097 430
8.870 0.008 35.670
Conclusions
As in several previous studies, a statistically significant relationship at the
95.0% level between the fabric weight loss and process variables of silk-like
finishing treatment was found here. The linear model proposed accounts for
86.173% of the variability in weight loss. Therefore the response surface model
proposed can be used for predictive purposes.
Although the vaporisation time affected none of the drape indicators studied,
drape intensity (FN) and its severity (FH) interacted significantly with the NaOH
concentration. However, such a concentration only influenced drape intensity
indicators (%DR and FN) and geometric isometry (%DU).
a = 1 983 290b= 1 953 470 19.270 0.000 54.641
G
22
Table 8. Regression models between weight loss and FAST properties.
Variable Model Coefficients F p R2 (%)
Wp E 100 a = 15 9567.0
b = 350.430
33.990 0.000 67.994
We E 100 a = 9999.270
b = 50.484
8.170 0.011 33.797
Be a = –124 668.0
b = 273.983
21.020 0.000 56.783
BS a = 1 983 290
b= 1 953 470
19.270 0.000 54.641
G a = –1 1214 900
b = 3 097 430
8.870 0.008 35.670
Conclusions
As in several previous studies, a statistically significant relationship at the
95.0% level between the fabric weight loss and process variables of silk-like
finishing treatment was found here. The linear model proposed accounts for
86.173% of the variability in weight loss. Therefore the response surface model
proposed can be used for predictive purposes.
Although the vaporisation time affected none of the drape indicators studied,
drape intensity (FN) and its severity (FH) interacted significantly with the NaOH
concentration. However, such a concentration only influenced drape intensity
indicators (%DR and FN) and geometric isometry (%DU).
a = -1 1214 900b = 3 097 430 8.870 0.008 35.670
Mea
n B
S, µ
N·m
Time, min NaOH concentration, g/dm3
Mea
n G
, N/m
Time, min NaOH concentration, g/dm3
Mea
n G
, N/m
NaOH concentration, g/dm3
FIBRES & TEXTILES in Eastern Europe 2017, Vol. 25, 4(124)88
significantly with the NaOH concentra-tion in Be and G. Such a concentration influenced all FAST parameters associat-ed to the drape.
Weight loss resulting from the silk-like finishing treatment affected the physi-co-mechanical properties associated to the drape intensity (%DR and FN) and shape (FH) as well as the geometric isometry (%DU) and drape profile une-venness (%Gp), namely bending stiff-ness, shear stiffness and stretching.
The equations of the regression models proposed allow fabric weight loss to be explained in terms of drape and FAST parameters. The models, however, only account for part (33-67%) of the shared variability in weight loss.
Our results regarding fabric weight loss, FAST parameters and drape indicators confirm previous conclusions about the consequences of a decreased diameter in polyester fibres through the effect of the silk-like finishing treatment.
AcknowledgementsExperimental assistance from the staff at the Chemical Textile Technology Laboratory of the Textile Research and Industrial Cooper-ation Institute (INTEXTER) is gratefully ac-knowledged.
References 1. Dave J, Kumar R and Srivastava HC.
Studies on modification of polyester fab-rics I: alkaline hydrolysis. J. Appl. Pol. Sci.1987; 33 (2): 445-477.
2. Zeronian S H, Collins M J. Surface modifi-cation of polyester by alkaline treatments. Textile Progress 1989; 20 (2): 1-34.
3. Gacén J. Fibras de Poliéster. 2nd ed. Ter-rassa: Universitat Politècnica de Cata-lunya, 1991, p. 331.
4. Namboori CG, Haith MS. Journal of Ap-plied Polymer Science, 1968. Vol. 12 (9): 1999-2005.
5. Raslan WM, Bendak A. Changes in-duced in silk-like polyester properties by alkoxides treatment. Journal of Applied Polymer Science 2005; 98: 1829-1837.
6. Soon LJ, Seon RH. Alkaline softening of polyester fabrics treated with aque-ous NaOH solutions containing CTAB & EDA. Proceedings of the 3rd Asian Tex-tile Conference 1995; I: 256-261.
7. Sanders EM. Zeronian SH. An analysis of the moisture-related properties of hy-drolyzed polyester. Journal of Applied Polymer Science 1982; 27: 4477-4491.
8. Haghighat Kish M, Nouri M. Effects of sodium hydroxide and calcium hydroxide
on polyester fabrics. Journal of Applied Polymer Science, 1999; 72: 631-637.
9. Shet RT, Zeronian SH, Needles HL, Sid-diqui SA. Modification of polyester and polyester/cotton by alkali treatment. Tex-tile Chemist and Colorist 1982; 14: 233-237.
10. Needles HL, Brook DB, Keighley JH. How alkali treatment affect selected properties of polyester, cotton and poly-ester/cotton fabrics. AATC; 1985, 17 (9): 177-180.
11. Davis M, Amirbayat J. The effect of weight reduction on the performance of a polyester fiber satin bending, shear, drape and drop. Journal of the Textile Institute 1994; 85(3): 376-382.
12. Needles HL, Brook DB, Keighley JH. How alkali treatment affect selected properties of polyester, cotton and poly-ester/cotton fabrics. AATC 1985; 17 (9): 177-180.
13. Mousazadegan F, Saharkhiz S, Maroufi M. Weight reduction of microfiber poly-ester fabric and the effect on its physical and mechanical properties. Journal of the Textile Institute 2010; 101 (8): 716-728.
14. Raslan WM, Bendak A. Changes in-duced in silk-like polyester properties by alkoxides treatment. Journal of Applied Polymer Science 2005; 98: 1829-1837.
15. Carrera-Gallissà E, Capdevila X, Vall-deperas J. Evaluating drape shape in woven fabrics. The Journal of the Textile Institute 2017; 108 (3): 325-336.
16. De Boss A, Tester DH. A system for fab-ric objective measurement and its appli-cation in fabric and garment manufac-ture. CSIRO Report No. WT92.02. 1994.
17. Cusick G E. A Study of Fabric Drape. University of Manchester, 1962.
18. Chu CC, Milton MP, Hamburguer WJ. Investigation of the factors affecting the drapeability of fabrics. Textile Research Journal 1960; 20: 66-67.
19. May-Plumlee T, Eischen J, Kenkare N, Pandurangan P. Evaluating 3D Drape Simulations: Methods and Metrics. Ed-inburgh ed. 22-24 September 2003.
20. Al-Gaadi B, Göktepe F, Halász M. A new method in fabric drape measurement and analysis of the drape formation pro-cess. Textile Research Journal 2012; 82 (5): 502-512.
21. Jevsnik S. Gersak J. Modelling the fused panel for a numeric simulation of drape. Fibres & Textiles in Eastern Eu-rope 2004; 12, 1(45): 47-52.
22. Jedda H, Ghith A, Sakli F. Prediction of fabric drape using FAST system. The Journal of The Textiles Institute 2007; 98 (3): 219-225.
23. Mousazadegan F, Saharkhiz S, Maroufi M. Weight reduction of microfiber poly-ester fabric and the effect on its physical and mechanical properties. The Journal of the Textile Institute 2010; 101 (8): 716-728.
Received 08.09.2016 Reviewed 27.03.2017
63FIBRES & TEXTILES in Eastern Europe 2013, Vol. 21, No. 6(102)
Received 27.09.2012 Reviewed 28.04.2013
fluenced the results of electrical measure-ment.
Acknowledgements I would like to extend my gratitude to Fibre-inoks A.S. for providing weft yarns containing metal yarns, to MENSA A.S. for weaving the fabrics, to the Turkish Standart Enstitute (TSE) Ankara Electric Laboratory for making it possible to carry out the fabric tests in their laboratory, and to the Central Research Laboratory at Mustafa Kemal University In-stitute of Science for the SEM photographs of the fabrics
References1. Bedeloglu Çelik A, Sünter N, Bozkurt Y.
Electrically Conductive Textiles, Produc-tion Methods and Usage Areas. Tekstil ve Mühendis 2010; 79: 7-17.
2. Palamutcu S, Dağ N. Functional Textiles I: Electromagnetic Shielding Purposed Textile Surfaces. Electronic Journal of Textile Technologies 2009; 3, 1: 87-101.
3. Anderson K, Seyam AM. The Road to true Wearable Electronics. JTATM 2002; 2, 2: 1-20.
4. Bonaldi RR, Siores E, Shah T. Electro-magnetic Shielding Characterisation of Several Conductive Fabrics for Medical Applications. Journal of Fiber Bioengi-neering and Informatics 2010; 2, 4: 237-245.
5. Rocha AM. Development of Textile Based High Tech Products: The New Challenge. Wearable E-Health Systems For Personalised Health Management. Editors: Lymeis, A., Rossi, D., IOS Press: 330-334, 2004.
6. Cheng IC, Wagner S. Overwiew of flex-ible electronics Technology. Eds. Wong WS, Salleo A. Electronic Materials: Sci-ence & Technology- Flexible Electron-ics: Materials and Applications Springer, 200.
7. Kiekens P, Jayaraman S. Intelligent Tex-tiles and Cloting for Ballistic and NBC Protection, 2011.
8. Jones R. The future of nanotechnology. Physics World 2004; 17, 8: 25-29.
9. http://www.ht-metalfiber.com/en/prod-uct/content_8767.html (accessed 17.05.2012).
10. Anonymous, 2011. Processing and fin-ishing of Polymeric Materials, John Wiley & Sons Inc (2), 1488 pages.
11. Desai AA. Metallic fibres. http://www.fi-bre2fashion.com/industry-article/3/213/metallic-fibres13.asp, 18 pages (ac-cessed 08.04.2012).
12. Weber W, Rabaey JM, Aarts EHL. Am-bient Intelligence. Springer, 375 pages 2005.
13. Wang X, Xu W, Li W, Cui W. Study on the Electrical Resistance of Textiles un-der Wet Condition. 2009 79: 753-760.
14. Neelakandan R, Madhusoothanan M. Electrical Resistivity Studies on Polyani-line Coated Polyester Fabrics. Journal of Engineered Fibers and Fabrics 2010; 5, 3: 25-29.
15. Kumar NM, Thilagavathi G. Develop-ment and characterization of electrically conductive polyaniline coated fabrics. Indian Journal of Chemical 2012: 434-441.
16. Varesano A, Tonin C. Improving Electri-cal Performances of Wool Textiles: Syn-thesis of Conducting Polypyrrole on the Fiber Surface. 2011; 78, 12:110-115.
17. Abbasi AMR, Mangat MM, Baheti V, Militky J. Thermal Properties of Cotton Fabric Coated with Polypyrrole. Journal of Bioengineering & Informatics 2012; 5, 2: 163-168.
18. Gutiérrez M, Li H, Patton J. Thin Film Surface Resistivity. In partial fulfillment of course requirements for Mate210 Ex-perimental Methods in Materials Engi-neering. 2002, 24pages,http://www.sjsu.edu./faculty/selvaduray/page/papers/mate210/thinfilm.pdf.
19. Liu K, Sun Y, Zhou R, Zhu H, Wang J, Lu L, Fan S, Jiany K. Carbon nanotube yarns with high tensile strength made by a twisting shrinking method. Nanotech-nology 2010; 21: 1-7.
20. Protective clothing - Electrostatic prop-erties - Part 1: Test method for meas-urement of surface resistivity. Turkish Standard Institute, 13 pages. TS EN 1149-1 , 1999.
21. Protective clothing - Electrostatic prop-erties - Part 2: Test method for measure-ment of the electrical resistance through a material (vertical resistance). Turk-ish Standard Institute, 9 pages. TS EN 1149-2, 2000.
22. Glasziou PP, Del Mar C, Salisbury J. Ev-idence Based Practice Workbook. 2nd Ed., Blackwell Publishing, 202 pages, 2009.
23. Velten K. Mathematical Modeling and Simulation. Wiley-VCH, 348 pages, 2009.
24. Freund RJ, Wilson WJ, Sa P. Regres-sion Analysis- Statistical Modeling of a Response Variable. 2nd Ed., Elsevier, 459 pages, 2006.
25. Giles HF Jr., Wagner JR Jr., Mount EM. III. Extrusion: The Definitive Processing Guide and Handbook. 3rd Ed. William Andrew Inc., 542 pages, 2007.
26. Anonymous. “Electrical Magnetic Prop-erties of Metals”. ASM International Ma-terials Properties Database Committee, 2000; 285 pages.
27. Boctor SA. “Electric Circuit Analysis”, Prentice-Hall 1987; 847 pages.
Institute of Biopolymers and Chemical Fibres
Multifilament Chitosan
Yarn
The Institute of Bioploymers and Chemical Fibres is in possession of the know- how and equipment to start the production of continuous chitosan fibres on an extended lab scale. The Institute is highly experienced in the wet – spinning of polysaccharides, especially chitosan. The Fibres from Natural Polymers department, run by Dr Dariusz Wawro, has elaborated a proprietary environmently-friendly method of producing continuous chitosan fibres with bobbins wound on in a form suitable for textile processing and medical application.
We are ready, in cooperation with our customers, to conduct investigations aimed at the preparation of staple and continuous chitosan fibres tailored to specific needs in preparing non-woven and knit fabrics.
We presently offer a number of chitosan yarns with a variety of mechanical properties, and with single filaments in the range of 3.0 to 6.0 dtex.
The fibres offer new potential uses in medical products like dressing, implants and cell growth media.
For more information please contact: Dariusz Wawro Ph.D., D. Sc., Eng
Instytut Biopolimerów i Włókien Chemicznych ul. Skłodowskiej-Curie 19/27;
90-570 Łódź, Poland; Phone: (48-42) 638-03-68, Fax: (48-42) 637-65-01
E-mail: [email protected]
Multifilament chitosan yarn