enonprofits study 031006 - fundraising123.org · the mission of the advocacy institute () is to...
TRANSCRIPT


A U T H O R S
S P O N S O R S
S U P P O R T E R S

eNonprofit Benchmarks Study PAGE1
ACKNOWLEDGEMENTS
This report was written by Benjamin Smith, Karen Matheson and Sarah DiJulio.
We would like to thank Michael Ward and Katelyn Sabochik, of M+R Strategic Services,for leading key sections of the report. Along with M+R data analyst Karen Matheson,M+R intern Lisa Sturdivant collected and analyzed data for the study. StatisticalConsultant Assaf Oron reviewed study data and methodology for accuracy, and DavidMorgan edited the study. The Advocacy Institute's Jennifer Milewski, BeaconfireConsulting's Michael Cervino, Convio's Mandy O'Neil, Donordigital's Nick Allen, SarahHaug and Madeline Stanionis, GetActive Software's Bill Pease and Kevin Suer, andKintera's Greg Nelson served on an advisory committee providing guidance for theproject and key financial support as the study's co-sponsors. Additionally, they draftedthe case studies complementing each chapter and reviewed the final report. MarkRovner, Environmental Defense's Kira Marchenese and the Nonprofit TechnologyEnterprise Network's (NTEN) Joe Baker also participated in the advisory committee.Graphic design for the study and Web site provided by Vizualle.
Special thanks to the Beldon Fund and the Surdna Foundation for their grants to theAdvocacy Institute in support of the eNonprofit Benchmarks Study and publication.
About the Advocacy InstituteThe mission of the Advocacy Institute (www.advocacy.org) is to make social justice leadershipstrategic, effective and sustainable in pursuit of a just world. Its work supports a globalcommunity of advocates tackling critical social issues. Since 1985, the Advocacy Institute hasworked with exceptional leaders from more than 2,500 nonprofits and NGOs in over 65countries, providing custom-designed leadership and advocacy training.
About M+R Strategic ServicesM+R is dedicated to helping our clients advance their missions in order to bring aboutpositive change. We do this by helping organizations and campaigns we believe in developsmart and effective strategies, hone their messages, mobilize their members, buildgrassroots support, raise money, and communicate effectively with the media, the publicand decision-makers, both online and offline. Find out more online at www.mrss.com.
The complete report is available online at www.e-benchmarksstudy.com.
For more information about the report, please contact:
Ben Smith, M+R Strategic Services, 917.438.4626, [email protected] Milewski, Advocacy Institute, 202.777.7557, [email protected]© 2006 M+R Strategic Services and the Advocacy Institute

CONTENTS
I. Summary of Key Findings
II. Introduction
III. Return on Investment: Hallmarks of a Successful Program
IV. E-Mail Messaging: Cornerstone of Nonprofit Online Programs
V. E-Mail List Growth: Just How Big Is That E-Mail List?
VI. E-Mail List Composition: Who Are These "Online Subscribers," Anyway?
VII. Online Advocacy: Mobilizing Subscribers for Online Action
VIII. Online Fundraising: Making Online Programs Pay Off
IX. Best Practices
X. Methodology and Discussion of Metrics
Appendix A: In-Depth Nonprofit Study Partners Questionnaire
Appendix B: Broader Nonprofit Online Survey
Appendix C: Aggregate Data From Technology Vendors
eNonprofit Benchmarks StudyPAGE2
3
5
7
10
18
26
30
38
47
49
54
57
60

eNonprofit Benchmarks Study PAGE3Summary of Key Findings
CHAPTER I
I. SUMMARY OF KEYFINDINGS
The eNonprofit Benchmarks Study provides a snapshot of key metrics and benchmarks fornonprofit e-mail communications, online fundraising and online advocacy, primarily takenfrom an in-depth review of statistics from 15 nonprofit organizations – six environmentalorganizations, six civil/legal rights organizations, and three international aid organizations.Key findings of the study include:
• Greater Online Advocacy Results: Organizations generating the most onlineadvocacy actions had several key characteristics in common, including larger e-maillists; longer-lived online advocacy programs; larger online communications budgets;and a higher volume of advocacy e-mail messages.
• Investment Pays Off: Not surprisingly, organizations with larger onlinecommunications budgets built larger e-mail lists, generated more advocacy activity,and raised more funds online.
• E-Mail Open Rates in Decline: E-Mail message open rates averaged 25 percentbetween September 2004 and September 2005, a decline from the previous 12-monthaverage of 30 percent. Average response rates to e-mail advocacy appeals were 10percent, while average response rates to e-mail fundraising appeals were just 0.3percent.
• E-Mail Lists Continue to Grow – and Shrink: List churn (where e-mail addressesbecome undeliverable or unsubscribed) is a considerable problem for organizations.Even though the nonprofits studied more than doubled their list size with new recruitsover a 12-month period, their overall list growth was only about 73 percent as somenew recruits were offset by heavy email list loss.
• Online Actions Speak Louder Than Dollars: Not surprisingly, more e-mailsubscribers took online action than made an online donation. Between September 2004and September 2005, an average of 47 percent of all e-mail subscribers took at leastone online action, while just 6 percent of subscribers made an online donation. Therewere significant discrepancies among issue areas; international aid e-mail lists aremade up of just 37 percent activists, but 17 percent of their subscribers made an onlinedonation. On the other hand, environmental organizations have lists made up of 61percent activists, while just 4 percent of their subscribers made an online donation.

• A Rise in Online Fundraising: Despite modest online donation rates, by September2005, online annual fundraising totals increased by 40 percent on average from theyear before, likely driven (in part) by the public’s overwhelming response to the Asiantsunami disaster. Participating organizations averaged $2.5 million in online donationslast year, with a $97 average gift. International aid organizations led the way, with anaverage of $9.6 million raised last year and an average gift of $121.
While the size of an organization is not necessarily the prime measure for success onthe Internet, a robust and strategic use of funds and other resources to sell a nonprofit’smessage to legislators, business leaders, potential donors and the general public, usingall the online tools at one’s disposal - even in conjunction with other communicationsmedia, like direct mail-is mandatory. As demonstrated by the case studies illustratingmany of the key points of this report, nonprofit organizations of even modest size canmeet the challenges of advocacy, public education and fundraising by using innovativeand aggressive tactics to spread their word, expand their subscriber base, and marketthemselves online. What is especially key is being able to measure the successes (andfailures) of online initiatives through proper tracking of key metrics, such as e-mailmessage open and response rates, in order to maximize the benefits of the Internet as akey tool to a nonprofit’s communications success.
eNonprofit Benchmarks StudyPAGE4Summary of Key FindingsCHAPTER I

II. INTRODUCTION
In the dot.com world, the bottom line is relatively easy to measure – it usually comesdown to dollars and cents, a return on investment. For nonprofit organizations, successis more difficult to define. Measuring the effectiveness of nonprofits’ work on the Internetdepends upon many factors. How many people were educated? Informed? Served?Engaged? Activated? How much money was raised? Did legislative policy change?Corporate policy? Public opinion?
Additionally, since the nature of competition among nonprofits differs from businesses(yes, nonprofits do compete), how does one nonprofit compare its results to those ofother nonprofits engaged in similar online efforts? Comparisons among organizations aredifficult enough when it comes to traditional advocacy, fundraising and communicationsactivities; effectiveness online is even harder to gauge. This is because the Internet is arelatively new medium, and conventional wisdom and best practices are only now beingestablished firmly. As such, measuring online performance presents both a challengeand an opportunity.
While online activities can be measured – how many people opened an e-mail message,clicked on a link, responded to an advocacy alert, filled out an online petition, or donatedmoney – what do these measurements mean? Often many nonprofits do not know howto interpret this data, much less use it effectively to evaluate their performance and fine-tune their online practices.
The metrics and benchmarks in this study will serve as a tool by which organizationscan measure their own online performance, and compare their performance to that ofother nonprofit organizations active online.
The eNonprofit Benchmarks Study analyzes metrics from three sources:
1. Nonprofit study partners – 15 key national nonprofits in the environmental, civil/legalrights-based and international aid sectors with substantial online communications andmarketing programs;
2. Aggregate data from Convio, GetActive Software and Kintera – three major providersof online communications tools for nonprofits; and
3. An online survey of the broader nonprofit community (to which 85 organizationsresponded).
More details about the sources of data, and method of collecting and analyzing data, areincluded in the Methodology section at the end of this report.
eNonprofit Benchmarks Study PAGE5Introduction
CHAPTER II

Organizations will be able to use this study to begin to understand how to look at andanalyze their own online communications data. It will provide context and comparisonsfor organizations doing their own ongoing reporting. This study could serve as alaunching pad for helping groups conduct extremely important but often neglectedReturn on Investment (ROI) analysis. Comprehensive ROI analysis can help nonprofitsquantify the benefits they derive from their online communications programs and steerfuture investments.
eNonprofit Benchmarks StudyPAGE6IntroductionCHAPTER II

eNonprofit Benchmarks Study PAGE7Return on Investment: Hallmarks of a Successful Program
CHAPTER III
III. RETURN ON INVESTMENT:HALLMARKS OF ASUCCESSFUL PROGRAM
OverviewHow does a nonprofit organization decide where to invest their scarce organizationalresources? What about when they are trying to decide which strategies are worthinvesting in? In order to make decisions about resource allocation, nonprofit leadersneed to better anticipate what kind of results they may get for their investment.
Return on Investment (ROI) is incredibly difficult to track – many of the “outcomes” areonline and offline advocacy activities that can be difficult to quantify. Did a particularactivity move a legislator? Did it sway public opinion?
There are many ways to measure return on investment. However, given the hugediscrepancies in how different organizations manage their programs, allocate costs andevaluate results, we’ve chosen to focus on the overall organizational investment in onlinecommunications and the impact it has on key hallmarks of a successful program. (Later inthis study we will separately address the return on investment for paid advertising torecruit new subscribers.)
Returns on Overall Programmatic InvestmentsFor the nonprofit study partners, relationships were identified between organizationalinvestment in online communications and an organization’s results. The organizationsthat invested more resources into their programs were more successful, in bothgenerating advocacy activity and raising significant funds online.
For years many organizations felt that the Internet should be effectively “free,” but thereality is that successful programs come with a price. This study found that the mostsuccessful organizations were those with a larger annual online communications budget,more online communications staff, and a more significant total 5-year investment inonline communications.

eNonprofit Benchmarks StudyPAGE8Return on Investment: Hallmarks of a Successful ProgramCHAPTER III
There was actually relatively little relationship between an overall organizational budgetand size and their results. Even very small organizations had successful onlineprograms if and when resources were invested in their programs.
As you can see in the table below, the most successful organizations were those thatprioritized investments in online communications. There is a clear relationship betweenthe overall online communications budget and the number of subscribers, the growth ofthe e-mail list, and the total advocacy actions taken.
As ROI Table 2 (below) indicates, for online fundraising, when international aidorganizations were excluded, the same trend is apparent. (International aid groups wereexcluded because of the atypically large amount of donations they recently received forthe tsunami disaster.)
Clearly, online advocacy and online fundraising success are related to the overall onlinecommunications budget. Organizations with larger online communications budgets aremore successful at recruiting subscribers, generating online advocacy actions, and raisingmoney online.
However, readers should keep in mind that simply dedicating more funds to an onlineprogram absent a strategic plan will probably not yield these types of results for everyorganization. There may be other factors that reinforce the linkage between onlinecommunications budget and online advocacy and fundraising success. Organizations with
Number of In-Depth Study Partners
AverageDeliverable E-MailSubscribers
AverageNumber of NewSubscribers
AverageNumber ofAdvocacyActions
4 127,000 31,000 196,000
4 234,000 79,000 291,000
Total Annual OnlineCommunications Budget
Under $300,000
300,000 - $600,000
5 327,000 224,000 635,000Over $600,000
ROI: TABLE 1
Number of In-Depth Study Partners
Average Overall TotalOnline Giving (Rightsand Enviro Only)
Average Overall TotalOnline Giving (AllGroups)
4 $103,000 $94,000
3 $689,000 $3,525,000
Total Annual OnlineCommunications Budget
Under $300,000
300,000 - $600,000
4 $908,000 $4,943,000Over $600,000
ROI: TABLE 2

larger budgets may be larger, more established nonprofits with stronger brand identities,which may help lead to greater online success. In addition, there are a number of otherfactors that can contribute to success in each of these key areas (e.g., better messaging).However, the study did not look at other such factors which are less quantifiable.
Organizations looking to improve their results may be able to modestly improve theirresults without a substantially larger financial investment, simply by adhering to some ofthe best practices laid out later in this study.
eNonprofit Benchmarks Study PAGE9Return on Investment: Hallmarks of a Successful Program
CHAPTER III

IV. E-MAIL MESSAGING:CORNERSTONE OF NONPROFITONLINE PROGRAMS
OverviewAlong with an organization’s Web site, e-mail messaging is the most importantcomponent of many nonprofit organizations’ online communications programs. Thissection looks at the success rates of e-mail communications from the study’s 15 in-depthnonprofit partners. The types of e-mail messages included were advocacy e-mails,fundraising e-mails, and e-newsletters. In addition to the data from the nonprofit partners,the study examined self-reported data from our broader nonprofit online survey.
In order to evaluate the efficacy of e-mail messages, we examined four key metrics:
1. Open rates; 2. Click-through rates; 3. Advocacy and fundraising page completion rates; and 4. Advocacy and fundraising response rates.
Measuring SuccessFor the purposes of this study, we define a successful e-mail messaging program as onethat receives high open rates to all messages and high response rates to advocacy andfundraising e-mails.
E-Mail Messaging Table 1 outlines key average metrics from our 15 nonprofit partnersbetween September 1, 2004 and September 1, 2005. Open rates remained fairlyconsistent across the environmental, rights and international aid organizations. Theenvironmental organizations studied had much higher response rates to advocacy e-mails,while the international aid organizations had higher response rates to fundraising e-mails.
eNonprofit Benchmarks StudyPAGE10E-Mail Messaging: Cornerstone of Nonprofit Online ProgramsCHAPTER IV
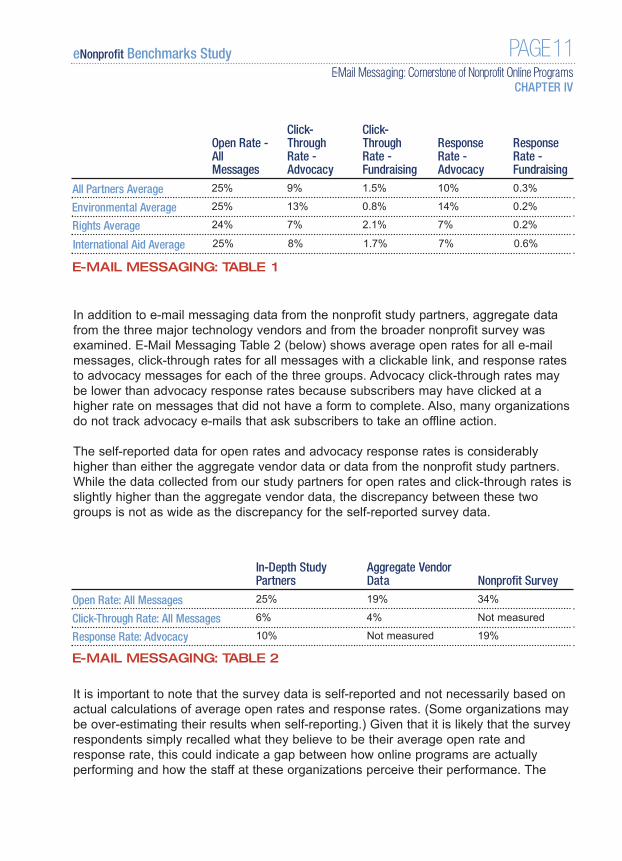
In addition to e-mail messaging data from the nonprofit study partners, aggregate datafrom the three major technology vendors and from the broader nonprofit survey wasexamined. E-Mail Messaging Table 2 (below) shows average open rates for all e-mailmessages, click-through rates for all messages with a clickable link, and response ratesto advocacy messages for each of the three groups. Advocacy click-through rates maybe lower than advocacy response rates because subscribers may have clicked at ahigher rate on messages that did not have a form to complete. Also, many organizationsdo not track advocacy e-mails that ask subscribers to take an offline action.
The self-reported data for open rates and advocacy response rates is considerablyhigher than either the aggregate vendor data or data from the nonprofit study partners.While the data collected from our study partners for open rates and click-through rates isslightly higher than the aggregate vendor data, the discrepancy between these twogroups is not as wide as the discrepancy for the self-reported survey data.
It is important to note that the survey data is self-reported and not necessarily based onactual calculations of average open rates and response rates. (Some organizations maybe over-estimating their results when self-reporting.) Given that it is likely that the surveyrespondents simply recalled what they believe to be their average open rate andresponse rate, this could indicate a gap between how online programs are actuallyperforming and how the staff at these organizations perceive their performance. The
eNonprofit Benchmarks Study PAGE11E-Mail Messaging: Cornerstone of Nonprofit Online Programs
CHAPTER IV
In-Depth StudyPartners
Aggregate VendorData Nonprofit Survey
25% 19% 34%
6% 4% Not measured
Open Rate: All Messages
Click-Through Rate: All Messages
10% Not measured 19%Response Rate: Advocacy
E-MAIL MESSAGING: TABLE 2
Open Rate - AllMessages
Click-ThroughRate -Advocacy
Click-ThroughRate - Fundraising
ResponseRate -Advocacy
ResponseRate -Fundraising
25% 9% 1.5% 10% 0.3%
25% 13% 0.8% 14% 0.2%
All Partners Average
Environmental Average
24% 7% 2.1% 7% 0.2%Rights Average
E-MAIL MESSAGING: TABLE 1
25% 8% 1.7% 7% 0.6%International Aid Average

open and response rates reported in the survey could either represent the ideal forthese organizations – the rates they wish they were achieving – or perhaps they aresimply recalling a few of their best-performing messages, and assume all messagesperform at that level.
Regardless of the reason for the discrepancy, the large difference between the self-reported data and the actual study data indicates that some nonprofit organizations mightbenefit from a more accurate assessment of their e-mail communications programs.
E-Mail Advocacy: Key Metrics
When we discuss online advocacy actions, we mean any advocacy action which can betracked back to a link in an e-mail sent to subscribers. For the purposes of this study,advocacy actions are defined as online petitions or advocacy campaigns generatingfaxes or letters to legislators or other decision makers.
E-Mail Messaging Table 3 (below) reflects the open, click-through, page completion andresponse rates taken from the nonprofit study partners during the September 2004 toSeptember 2005 period. Click-through rates for advocacy messages were calculated asthe number of people who clicked on any trackable link in an advocacy e-mail messagedivided by the number of people who received the e-mail message (this includesmessages asking subscribers to attend offline events, make phone calls, or an activityother than filling out an advocacy form online). As explained above, click-through ratesmay be lower than response rates because subscribers may have clicked at a higherrate on messages that did not have a form to complete. Response rates for advocacymessages were calculated as the total number of actions divided by the total number ofrecipients of e-mail messages containing a link to an advocacy page only. As a result,the average click-through rate was lower than the average response rate for thecombined in-depth study partners and environmental groups. Page completion rateswere calculated as the number of people who completed a form divided by the numberof people who clicked on the link to get to that form.
eNonprofit Benchmarks StudyPAGE12E-Mail Messaging: Cornerstone of Nonprofit Online ProgramsCHAPTER IV
Open RateClick-ThroughRate
PageCompletionRate Response Rate
26% 9% 84% 10%
26% 13% 91% 14%
All Partners
Environmental
26% 8% 79% 7%International Aid
E-MAIL MESSAGING: TABLE 3
Averages for E-Mail Advocacy - Key Metrics
25% 7% 81% 7%Rights

From our sample, the environmental organizations had a substantially higher response ratethan the other types of organizations. Not only were their overall response rates twice thatof the other issue areas, page completion rates for these organizations were also higher.Note, however, that we found the differences between the environmental organizations’metrics compared to the other organizations to be mildly statistically significant.
E-Mail Fundraising: Key Metrics
This section examines online fundraising results that can be tracked from an e-mailmessage with a link to an online fundraising page.
E-Mail Messaging Table 4 reflects the open, click-through, page completion, andresponse rates for online fundraising messages during the September 2004 toSeptember 2005 period.
Although the international aid groups had a higher response rate to fundraising appealsthan environmental and rights groups, this higher response rate is small and thesignificance of this amount is mildly supported by our data. (NOTE: As you will see in theOnline Fundraising section, the international aid organizations raised significantly moremoney online than the other types of organizations overall. Much of this is thought to belinked to the Asian tsunami, which increased online fundraising for international aidgroups dramatically. However, most of the tsunami-related online donations tointernational aid organizations came independently of e-mail messaging, so it is unlikelythat the tsunami gave a significant boost to fundraising e-mail response rates.)
eNonprofit Benchmarks Study PAGE13E-Mail Messaging: Cornerstone of Nonprofit Online Programs
CHAPTER IV
Open RateClick-ThroughRate
PageCompletionRate Response Rate
23% 1.5% 22% 0.3%
22% 0.8% 32% 0.2%
All Partners
Environmental
23% 2.1% 33% 0.6%International Aid
E-MAIL MESSAGING: TABLE 4
Averages for E-Mail Fundraising - Key Metrics
23% 1.7% 7% 0.2%Rights

Effects of Message Length and Day of Week on Advocacy MessagesThe study examined the impact of time of day and day of the week on open, click-through, and response rates for advocacy messages. Also examined was the impact ofmessage length and writing grade level (based on MS Word’s grade-level evaluator). Asample of 154 advocacy messages was taken from the nonprofit study partners.
No discernable performancepatterns were found for time ofday and writing grade level.
As E-Mail Messaging Graph 1 tothe right demonstrates, the studydid not identify a clearrelationship between word countand response rate. There wasmildly significant evidence thatmessages under 250 words hadon average a 2.5 percent lowerresponse rate. However, whenthe study examined word lengthfor e-mail messages fromnonprofit study partners with thehighest response rates, we foundsome short messages and somelonger messages.
E-Mail Messaging Table 5 reflects the results of the open, click-through, and responserates by day of the week advocacy messages were sent out.
From our sample, the messages sent Thursday and Friday showed a statisticallysignificant higher click-through rate – 6 percent higher – than messages sent Monday
eNonprofit Benchmarks StudyPAGE14E-Mail Messaging: Cornerstone of Nonprofit Online ProgramsCHAPTER IV
Open Rate Click-Through Rate Response Rate
26% 12% 11%
23% 12% 10%
Weekday
Monday Average
Tuesday Average
25% 12% 8%Wednesday Average
E-MAIL MESSAGING: TABLE 5
Advocacy Messaging Metrics by Weekday
27% 18% 11%Thursday Average
26% 18% 11%Friday Average
E-MAIL MESSAGING: GRAPH 1

through Wednesday. The slight differences in the open and response rates were notsupported by our data set. This does defy conventional wisdom in online marketing thatsending e-mail messages on Fridays reduces response rates.
Volume and Frequency of E-Mail MessagesThe study attempted to determine if a relationship exists between the number of e-mailmessages sent by an organization per month and open rates, click-through rates andresponse rates. (By message volume and frequency, we mean the number of messagesan organization sent to subscribers.) For the in-depth study partners, we categorizedmessages into the following three groups:
1. Number of overall e-mails sent; 2. Number of e-mails sent to the whole list; and 3. Number of e-mails sent to segmented portions of the list.
Within each of these categories we recorded the number of overall messages, advocacymessages, fundraising messages and newsletter messages.
The only pattern the study identified was the number of overall messages sent to thewhole list. In general, organizations that sent more messages to their whole list typicallyhad lower open rates. We did not see this pattern for click-through and response rates.
The Effect of Targeting Advocacy MessagesBy “targeting” advocacy e-mail messages, the study is referring to sending advocacy e-mail messages to segments of the entire list based on specific criteria. For the purposesof this study, we examined targeting based on geography and interest area. Anadvocacy message targeted by geography is defined as one in which the audience isselected based on their address (e.g., only list members who live in a specific zip code,state or region of the country). An advocacy message targeted by interest area isdefined as one sent to a specific segment of the list based on either self-reportedinterests or interests as determined by patterns of activity that would indicate an interestarea (e.g., a list member took a survey to indicate their interest in a specific topic orrepeatedly took action on a specific issue so as to indicate interest in this issue area).
eNonprofit Benchmarks Study PAGE15E-Mail Messaging: Cornerstone of Nonprofit Online Programs
CHAPTER IV
Open RateClick-ThroughRate
PageCompletionRate
ResponseRate
26% 9% 80% 11%
26% 7% 75% 8%
Geographically-Targeted Messages
Interest Area-Targeted Messages
24% 6% 73% 7%Whole List (Not Targeted) Messages
E-MAIL MESSAGING: TABLE 6
Effects of Targeting - Key Metric Averages

E-Mail Messaging Table 6 compares open rates, click-through rates, page completionrates and response rates for advocacy messages targeted by geography and interestarea with messages sent to the whole list.
Targeting based on geography and issue interest area increased e-mail open rates,click-through rates, page completion rates, and response rates as compared tomessages sent to the whole list. Many online communications professionals oftenrecommend sending messages to subscribers based on geo-targeting or issue interestmatch criteria as a best practice and a way of boosting response rates, so this is not asurprising result. These messages may be more appealing to subscribers because theytouch on topics closer to home or closer to their personal interests.
Targeting by geography had a particular impact, increasing overall click-through rates by3 percent, page completion rates by almost 7 percent, and response rates by 4 percent.Note, however, that while the impact geo-targeting has on messages was supported byour data set and considered statistically significant, interest area targeting’s impacts arenot considered statistically significant.
Of the nonprofit study partners, nine collected issue interest information about theirsubscribers, while only five of the partners used this information for message targetingpurposes. Similarly, of the 85 nonprofits that participated in the broader nonprofit survey,21 organizations had issue interest data for their list members, but only 11 indicated theyuse that information to target e-mail messages. This shows that a substantial number ofgroups are not using information that could increase the effectiveness of their e-mails.
Change in Advocacy Message Metrics Over TimeFor this section of the study, we compared open rates, click-through rates, pagecompletion rates, and response rate averages between the 2003-2004 and 2004-2005periods. The averages in E-Mail Messaging Table 7 are for advocacy e-mail messagesonly.
eNonprofit Benchmarks StudyPAGE16E-Mail Messaging: Cornerstone of Nonprofit Online ProgramsCHAPTER IV
Open RateClick-ThroughRate
PageCompletionRate Response Rate
32% 26% N/A 9% 86% 84% 11% 10%
31% 26% N/A 13% 88% 91% 15% 14%
All Partners Average
Environmental Average
33% 25% N/A 7% 88% 81% 10% 7%Rights Average
E-MAIL MESSAGING: TABLE 7
Comparing Advocacy Message Averages, 2003-2004 and 2004-2005
30% 26% N/A 8% 80% 79% 9% 7%International Aid Average
’03-’04 ’04-’05 ’03-’04 ’04-’05 ’03-’04 ’04-’05 ’03-’04 ’04-’05

eNonprofit Benchmarks Study PAGE17E-Mail Messaging: Cornerstone of Nonprofit Online Programs
CHAPTER IV
Data from our nonprofit study partners illustrate the decline in open, completion andresponse rates from 2003-2004 to 2004-2005. Although the open rate decline wassupported by our data, note that the declines in page completion and response rateswere not found to be statistically significant.
What are the causes of such a drop in e-mail open rates over time? There may beseveral factors to blame. E-Mail programs such as Microsoft Outlook 2003 are usingmore restrictive image blocker systems that allow users to read the text of an e-mailmessage while blocking any embedded images. Since open rates are tracked usingembedded images, tracking technology may underreport the messages actually opened.There were no significant differences in page completion and response rates from yearto year, which may indicate that these metrics use a more consistently accurate trackingtechnology.
It is also possible that “list fatigue” is a factor in declining performance of e-mail opensand advocacy response rates. List fatigue generally refers to inactive subscribers whostop engaging with your e-mails – while they do not bother to unsubscribe, they do stopopening the e-mails they get. Subscribers may be receiving too many e-mails from toomany people, businesses and organizations, all of which may be leading to an overalldecline in response rates to e-mails.1
1 EmailLabs estimates that for many e-mail lists, 30%-50% of subscribers may be inactive.
(http://www.emaillabs.com/articles/email_articles/email_list_churn_html.html)

V. E-MAIL LIST GROWTH: JUSTHOW BIG IS THAT E-MAIL LIST?
OverviewWhile most people agree that “size isn’t everything,” when it comes to an onlinecommunications program, one important marker of success is the size of anorganization’s e-mail list. Not only does it indicate how many people are being reachedwith their message, it can be an important indicator of an organization’s ability togenerate online advocacy activity and to raise funds online. While list quality is also animportant contributing factor to online advocacy and fundraising outcomes, there is noquestion that many organizations will continue to use the size of their e-mail list as animportant metric in evaluating their program.
This section examined the e-mail list size of our nonprofit study partners broken down byorganization type, and key factors that contribute to both the growth and shrinkage of an e-mail list. For a more in-depth look at what individual methods and strategies organizationsare using to grow their e-mail list, see the Return on Investment section later in the study.
Key MetricsThe e-mail list size for our in-depth study partners ranged from as few as 10,000subscribers to almost 600,000, with an average of 245,000 subscribers as shown in thetable below. While each organizational category had a range of list sizes, the greatestaverage list size was among the rights organizations, at more than 328,000 subscribers.The environmental organizations also had sizeable e-mail lists, averaging nearly230,000. The international aid organizations had the smallest e-mail lists on average(just over 108,000).
eNonprofit Benchmarks StudyPAGE18E-Mail List Growth: Just How Big Is That E-Mail List?CHAPTER V
245,000
230,000
328,000
All Partners
Environmental
Rights
108,000International Aid
E-MAIL LIST GROWTH: TABLE 1
Average List Size (Fall 2005)
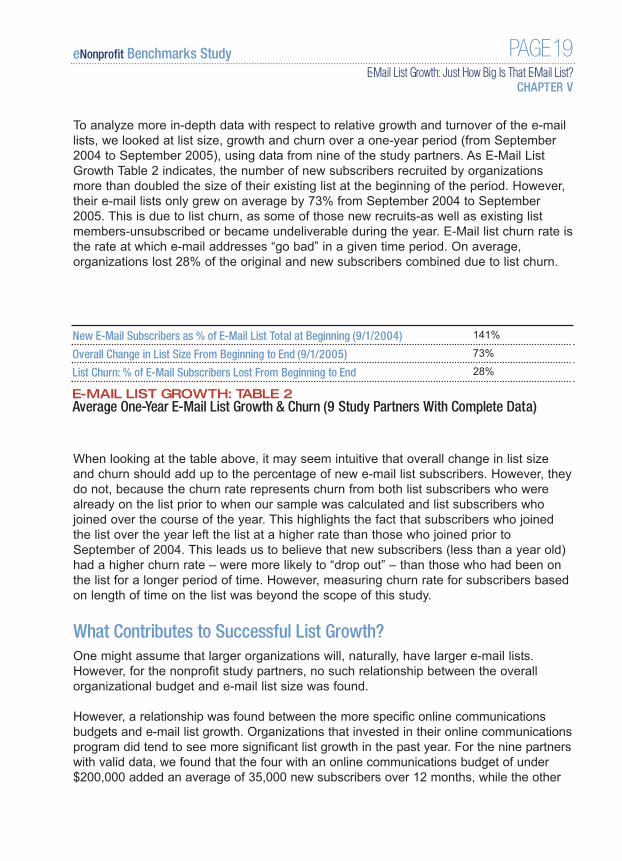
To analyze more in-depth data with respect to relative growth and turnover of the e-maillists, we looked at list size, growth and churn over a one-year period (from September2004 to September 2005), using data from nine of the study partners. As E-Mail ListGrowth Table 2 indicates, the number of new subscribers recruited by organizationsmore than doubled the size of their existing list at the beginning of the period. However,their e-mail lists only grew on average by 73% from September 2004 to September2005. This is due to list churn, as some of those new recruits-as well as existing listmembers-unsubscribed or became undeliverable during the year. E-Mail list churn rate isthe rate at which e-mail addresses “go bad” in a given time period. On average,organizations lost 28% of the original and new subscribers combined due to list churn.
When looking at the table above, it may seem intuitive that overall change in list sizeand churn should add up to the percentage of new e-mail list subscribers. However, theydo not, because the churn rate represents churn from both list subscribers who werealready on the list prior to when our sample was calculated and list subscribers whojoined over the course of the year. This highlights the fact that subscribers who joinedthe list over the year left the list at a higher rate than those who joined prior toSeptember of 2004. This leads us to believe that new subscribers (less than a year old)had a higher churn rate – were more likely to “drop out” – than those who had been onthe list for a longer period of time. However, measuring churn rate for subscribers basedon length of time on the list was beyond the scope of this study.
What Contributes to Successful List Growth?One might assume that larger organizations will, naturally, have larger e-mail lists.However, for the nonprofit study partners, no such relationship between the overallorganizational budget and e-mail list size was found.
However, a relationship was found between the more specific online communicationsbudgets and e-mail list growth. Organizations that invested in their online communicationsprogram did tend to see more significant list growth in the past year. For the nine partnerswith valid data, we found that the four with an online communications budget of under$200,000 added an average of 35,000 new subscribers over 12 months, while the other
eNonprofit Benchmarks Study PAGE19E-Mail List Growth: Just How Big Is That E-Mail List?
CHAPTER V
141%
73%
New E-Mail Subscribers as % of E-Mail List Total at Beginning (9/1/2004)
Overall Change in List Size From Beginning to End (9/1/2005)
28%List Churn: % of E-Mail Subscribers Lost From Beginning to End
E-MAIL LIST GROWTH: TABLE 2
Average One-Year E-Mail List Growth & Churn (9 Study Partners With Complete Data)

five partners, all of which had online communications budgets greater than $400,000,added an average of 178,000 subscribers over 12 months.
Interestingly, investments in online advertising were not a prerequisite to having a largee-mail list. Data comparing specific investments in online advertising and e-mail list sizeshowed no significant relationship between these variables. It may be concluded that anoverall investment in an organization’s online communications budget which couldtranslate to investments in more staff, better technology, more content, more effectiveearned and viral marketing, and a more robust program in general have a greater impacton list growth than direct investments in paid recruitment alone.
Return on Investment for Paid Online AdvertisingUnfortunately, most organizations do not have thorough systems for tracking theirvarious methods of recruiting new subscribers and the long-term value of thosesubscribers over time. Given that these same groups normally have very sophisticatedmechanisms for tracking this type of lifetime value via their direct mail programs, manyorganizations should replicate their endeavors by doing more sophisticated tracking ofonline results in the future.
This study focuses on one measurable “cost” of an online program – the cost ofacquiring an online activist or subscriber and two measurable “returns” – lifetime onlineactions taken and the funds raised from those subscribers.
This analysis examined subscribers recruited between 12-18 months previously, andtheir ongoing performance over their lifetime on the e-mail list. The chart below showsthree critical paid advertising tactics that organizations use to build their e-mail list.
Due to the fact that many organizations are just now beginning to track their online ROI forsubscriber acquisition, this section uses results from just eight nonprofit study partners.From these eight partners, data was gathered from two to four partners in each category ofthe following paid Web site promotion methods: e-mail marketing (e.g., prospect e-mails toexternal, permission-based e-mail lists); banner ads; and co-registration (e.g., opt-ins onregistration forms from third party Web sites). Because this data comes from a very smallsample, the results should not necessarily be applied to other organizations.
As E-Mail List Growth Table 3 indicates, each recruitment method has an initial up-front cost– the cost at the time of acquisition, and the cost per current member 12-18 months later.The cost increase is due to list churn – the rate at which e-mail addresses unsubscribe orotherwise become unreachable. While it may have cost $10,000 to recruit 5,000 subscribersoriginally, if only 2,500 of those subscribers are still reachable 18 months later, thatrecruitment cost is effectively increased, and proved more expensive than anotherrecruitment source from which 4,000 of 5,000 subscribers are still reachable. In the studysample, the cost per current member is double the initial cost of acquisition on average.
eNonprofit Benchmarks StudyPAGE20E-Mail List Growth: Just How Big Is That E-Mail List?CHAPTER V

In this small sample, e-mail marketing performed better than the other recruiting tactics.While performing moderately better at the time of acquisition, e-mail marketing was moreeffective 12-18 months later because those sources had a lower churn rate. Additionally,e-mail marketing recruits generated the most actions and appear on track to recoup theirinitial acquisition costs through follow-up online donations.
List Churn E-Mail list churn rate is the rate at which e-mail addresses “go bad” in a given timeperiod. The average churn rate for the nine study partners with full data was 28 percentover a period of one year. In other words, on average, more than a quarter of theirsubscriber e-mail addresses go bad each year. For the purposes of this study, churn ratewas calculated as the number of subscribers who became unreachable in a 12-monthperiod, divided by the total number of subscribers in the system during that entire 12-month period.
It is important to note that there are multiple reasons an e-mail address may becomeunreachable. One easily identifiable factor is the rate at which individual activists“unsubscribe” from the e-mail list. As E-Mail List Growth Chart 1 below indicates, anaverage of 5 percent of the study partners’ subscribers unsubscribed in a 12-monthperiod.
However, a larger factor in the high turnover in e-mail addresses is what the study refersto as “other churn,” accounting for, on average, 23 percent of the study partners’ e-maillists going bad. This includes e-mail addresses that begin to permanently bounce(generate an error message) when subscribers switch from one e-mail provider toanother. [Some small amount of “other churn” could be a result of organizationsremoving addresses, such as eliminating those subscribers who have not taken anyaction in the previous 12 months.]
eNonprofit Benchmarks Study PAGE21E-Mail List Growth: Just How Big Is That E-Mail List?
CHAPTER V
Cost per NewSubscriber
Cost perCurrentSubscriber
Actions per$1000
Funds Raisedper $1000
$2.24 $4.47 727 $455
$1.89 $3.33 977 $784
Average for All Types
E-Mail Marketing
$2.40 $3.75 572 $67Banner Ads
E-MAIL LIST GROWTH: TABLE 3
Paid Web Site Promotion Metrics
$1.99 $4.91 647 $366Co-Reg / Opt-ins

Note that because some subscriberswere added near the end of the 12-month period, it is possible thatsome organizations have a lowerchurn rate simply because a largenumber of their subscribers haveonly been on the e-mail list for threemonths, and potentially bad e-mailaddresses have had less time toregister as bouncing. Also, list churnis difficult to accurately track with thetechnology that most organizationscurrently use (unless organizationsimplement their own trackingprocess and record the results in anoffline system on an ongoing basis).
For readers of this report attemptingto compare their organization’schurn rate with the average churnrates that we have provided, pleasebear this in mind.
eNonprofit Benchmarks StudyPAGE22E-Mail List Growth: Just How Big Is That E-Mail List?CHAPTER V
E-MAIL LIST GROWTH: CHART 1
12-Month List Retention and Churn Averages

eNonprofit Benchmarks Study PAGE23An In-Depth Look
AN IN-DEPTH LOOK:Viral List Building: Online List Growth Can Be ContagiousKevin Suer, GetActive Software
The Humane Society of the United States (HSUS) experienced major list growthsuccess with the Petition for Poultry, an online petition that took advantage of ahighly effective list growth technique known as “viral list building.”
Viral list building puts recruitment tools into the hands of existing onlineconstituents, enabling them to recruit other subscribers themselves. The term“viral” is used because recruitment is self-propagating-as new constituents join,they are in turn acting as recruiters themselves. Viral list building generallyrequires little-to-no cost to recruit new audiences.
A key ingredient to successful viral list building is the coordinated use of amessage or call to action that is appealing, timely and topical. The Petition forPoultry illustrates this approach. In 2004, just weeks before Thanksgiving, HSUSlaunched the Petition for Poultry demanding protection of poultry under thefederal Humane Methods of Slaughter Act. Launched just before Thanksgiving,the petition was especially timely and topical. Petition signers could join HSUS’se-mail list and use a tell-a-friend feature to encourage signers to send thepetition to other people.
This action resonated deeply with its audience, and viral list building results wereimpressive. The Petition for Poultry grew HSUS’s e-mail list virally by over16,000 new members (7 percent) in just three weeks. Thousands signed thepetition, surpassing its original goal of 25,000 signatures to reach more than57,000 signatures by Thanksgiving, and 146,000 signers to date.
HSUS’s viral list building success hinges on a fundamental tenet: Generateexcitement and passion for your campaign, and leverage tools that allow yoursubscribers to tap into their social networks, promoting and sharing that passion.

AN IN-DEPTH LOOK:Return on Investment: The Wilderness SocietySarah DiJulio, M+R Strategic Services
In order to track the effectiveness of paid advertising and viral marketing efforts,The Wilderness Society instituted a rigorous tracking program to track thesources of all new online subscribers; the cost of acquisition (for paid sources);and the relative return on investment for each source in terms of online advocacyand fundraising results.
ROI Table 3 below lists several major sources of recruitment for a campaigncarried out roughly 12 months previously.
In the above table, one can see that some vendors provide much higher qualityactivists and donors than others, and with a greater or lesser return oninvestment. The “Actions per Month per Subscriber” indicates the performance ofthose subscribers as activists, and the “Funds Raised per Subscriber” indicatestheir performance as donors. For the paid sources, one can also see the relativevalue of the subscribers based on the actions taken per $1,000 invested, and thefunds raised per $1,000 invested.
eNonprofit Benchmarks StudyPAGE24An In-Depth Look
Cost perCurrentSubscriber
Actionsper MonthperSubscriber
FundsRaised perSubscriber
Actionsper$1000
FundsRaised per$1000
$ __ 0.76 $2.66 __ $ __
$0.75 0.55 $1.28 9,494 $1,699
Vendor
Partner Cross Promotion
Direct E-Mail #1
$2.16 0.56 $1.04 3,123 $480Direct E-Mail #2
ROI: TABLE 3
Paid Web Site Promotion Metrics
$1.93 0.61 $0.65 2,830 $334Direct E-Mail #3
N/A 0.20 $0.60 N/A N/ACo-Registration Opt-Ins
$3.79 0.15 $0.27 587 $70Advertising Network
$5.80 0.38 $9.92 799 $1,622Keyword Advertisements

eNonprofit Benchmarks Study PAGE25An In-Depth Look
The best sources of high quality activists – those that take the most actions permonth, and that deliver the most actions per $1,000 spent – were recruited frompartner cross-promotions and direct e-mail advertisements.
Search engine keyword recruitment sources yielded a lower volume of new listmembers at a relatively high cost per member (between $5-$6 per newsubscriber). However, they have proven to be extremely strong donors.
Although the co-registration opt-ins (subscribers recruited via a registrationprocess on a third-party Web site) do not have costs associated with them (dueto a tracking issue), one can easily see that these subscribers are performingquite poorly as activists, and only modestly as donors.
The single worst source of new subscribers was the advertising network, whichoriginally cost just $2 per subscriber, but due to a very high churn rate has seenso much turnover that, one year later, the cost has jumped up to $3.79 persubscriber. Unfortunately, this higher cost does not reflect a higher qualitythese subscribers are at the bottom of the list in terms of actions taken anddonations generated.
With this information in hand, The Wilderness Society has been able to adjust itsonline marketing program in order to focus its efforts on the best sources ofactivists and donors. In part as a result of this strategy, The Wilderness Societyincreased its online advocacy participation rates from 12 percent to 18 percent,and more than doubled online giving.

VI. E-MAIL LIST COMPOSITION:WHO ARE THESE “ONLINESUBSCRIBERS,” ANYWAY?
Overview It is true that a David can compete with a Goliath. Sometimes an organization with asmall, high quality list can achieve results equal to or greater than an organization withan e-mail list two to three times larger. So what is a high quality e-mail list? The qualityand types of online subscribers can have a significant impact on a nonprofitorganization’s ability to generate advocacy activity, raise funds, and generate meaningfulonline results.
Basic List Composition – Activists & DonorsAs E-Mail List Composition Chart 1 (next page) indicates, the study found that, onaverage, just under 50 percent of the nonprofit study partners’ e-mail lists were made upof online activists.2 This number was notably lower for the international aidorganizations, and highest for environmental organizations. Nearly 6 percent of theparticipants’ e-mail lists were made up of online donors.3 This data was somewhatskewed by the international aid organizations, which had a much higher percentage ofdonors on their list. This is likely due to the December 2004 Asian tsunami, whichcaused a dramatic jump in online donations for many international aid organizations inearly 2005.
eNonprofit Benchmarks StudyPAGE26E-Mail List Composition: Who Are These “Online Subscribers,” Anyway?CHAPTER VI
2 Defined as having taken at least one online action that was tracked by the online software. 3 Defined as having made at least one online donation that was tracked by the online software.

Length of Time on the List and Impact on Activist QualityFor this chart we evaluated only results from the nonprofit study partners with more thanthree years of data about their subscribers. It is interesting to note that – even in casesof organizations with substantial programs for three or more years, and some for manymore years than that – on average, two-thirds of their e-mail lists were made up ofsubscribers recruited in the past two years.
There are many factors that could contribute to the high number of new subscribers,including:
• An increased emphasis in online communications in the past two years (many groups maybe investing more resources in online communications programs now than in the past).
• High turnover rate (for some groups, this means that they have to recruit a substantialnumber of new people each year).
• E-mail address turnover (because some subscribers may be simply switching their e-mail addresses as they change e-mail providers, thus registering as new subscriberseach time).
The amount of time a subscriber is on the e-mail list has a significant impact on theirlikelihood to participate in online activism campaigns. As E-Mail List Composition Table 1(next page) indicates, subscribers who have been on the list for several years have, on
eNonprofit Benchmarks Study PAGE27E-Mail List Composition: Who Are These “Online Subscribers,” Anyway?
CHAPTER VI
0%All Partners Environmental
Online Activists
Rights Based International Aid
10%
20%
30%
40%
50%
60%
70%
80%
47%
6%
61%
4%
53%
3%
37%
17%
Online Donors
E-MAIL LIST COMPOSITION: CHART 1
List Composition
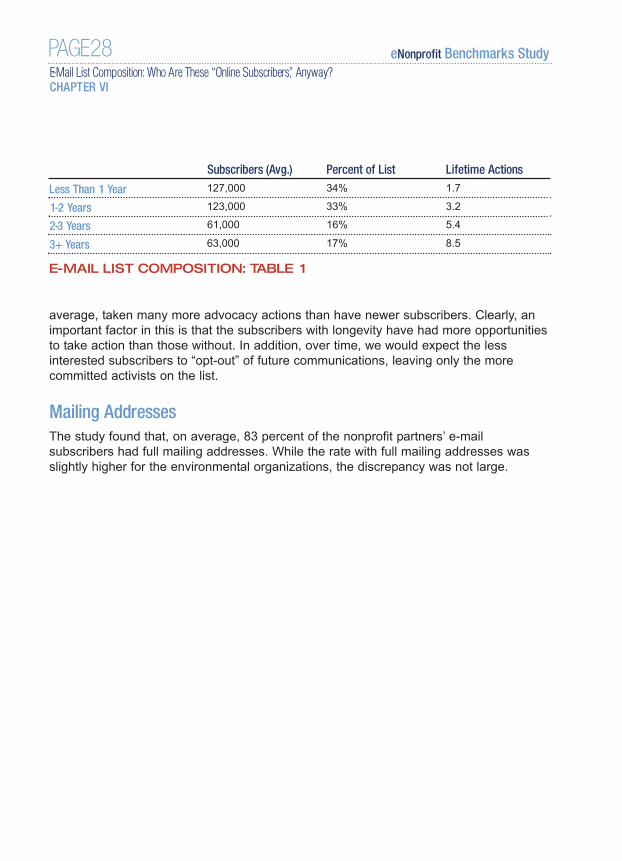
average, taken many more advocacy actions than have newer subscribers. Clearly, animportant factor in this is that the subscribers with longevity have had more opportunitiesto take action than those without. In addition, over time, we would expect the lessinterested subscribers to “opt-out” of future communications, leaving only the morecommitted activists on the list.
Mailing AddressesThe study found that, on average, 83 percent of the nonprofit partners’ e-mailsubscribers had full mailing addresses. While the rate with full mailing addresses wasslightly higher for the environmental organizations, the discrepancy was not large.
eNonprofit Benchmarks StudyPAGE28E-Mail List Composition: Who Are These “Online Subscribers,” Anyway?CHAPTER VI
Subscribers (Avg.) Percent of List Lifetime Actions
127,000 34% 1.7
123,000 33% 3.2
Less Than 1 Year
1-2 Years
61,000 16% 5.42-3 Years
E-MAIL LIST COMPOSITION: TABLE 1
63,000 17% 8.53+ Years

eNonprofit Benchmarks Study PAGE29An In-Depth Look
AN IN-DEPTH LOOK:Demographics of Online Subscribers vs. Other Subscribers: AreThey Different?Michael Cervino, Beaconfire Consulting
The question is asked with increasing frequency: “Are my online subscribersdifferent from my ‘traditional’ subscribers?”
Survey results of several organizations’ online and offline constituents indicatethe answer is, “Yes, but maybe not for long.”
An analysis conducted for two humanitarian and two civil liberties organizationsindicate that their online subscribers are on average 15 years younger than theirtraditional donors. Their online constituents are also more highly-educated andwealthier. But for two of these organizations, the differences in age, educationand income are less pronounced that they were two years ago.
As for online activism, two of these surveys indicate that approximately two ofthree constituents believe taking action online has an impact on the politicalprocess. At the same time, more than half say that taking action in the realworld has more impact on the political process-an attitude more strongly heldthe more active a constituent is in offline activities.
VII. ONLINE ADVOCACY:MOBILIZING SUBSCRIBERSFOR ONLINE ACTION
OverviewAttempts to measure the effectiveness of nonprofit online activism programs often taketwo directions. The first focuses on the influence that online advocacy tools and tacticshave on decision makers and the impact they have on public policy. The second focuseson how efficiently organizations mobilize the greatest number of people to take thegreatest number of actions. This study will not attempt to address the former, as it’s ariddle much too complex to address here (see sidebar, “E-Activism’s Impact on Issues,Legislators and Public Policy”). This study, however, will address the latter topic, with anexamination of transactional data from online advocacy forms, identifying somequantifiable factors that provide a partial picture about the performance of nonprofitonline advocacy programs.
The specific online advocacy variables the study measured include:• Total number of citizen letters generated to decision makers;• Total number of advocacy actions taken;• Average online advocacy completion rate; and• Average citizen letter personalization rate.
While the performance of the e-mails that drive people to participate in online advocacyforms is also a key component, e-mail action alerts are covered separately in the E-MailMessaging section.
Online Advocacy Effectiveness – Advocacy Actions Taken and Letters
SentNonprofit organizations launch online advocacy forms often with the goal of generatinggrassroots citizen pressure on important decision makers, including political leaders,
eNonprofit Benchmarks StudyPAGE30Online Advocacy: Mobilizing Subscribers for Online ActionCHAPTER VII
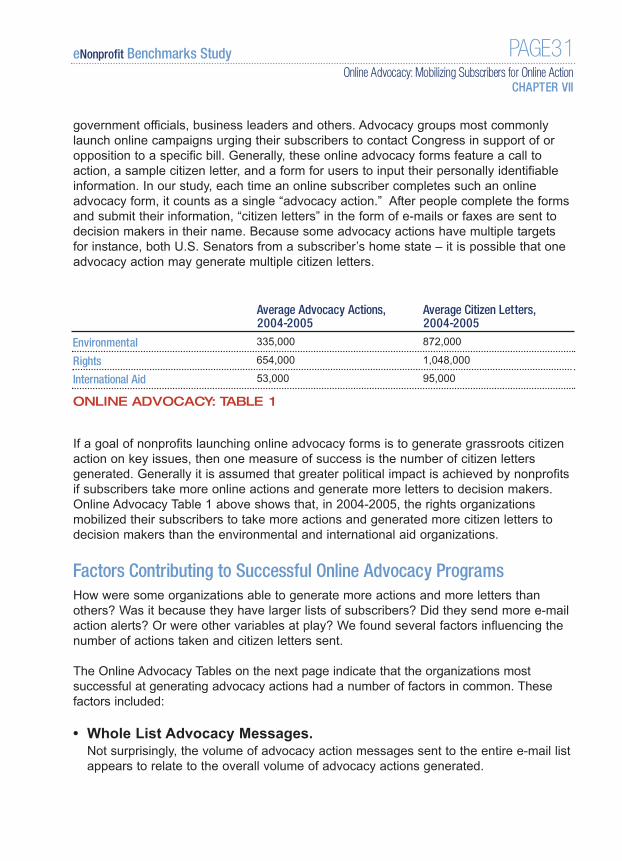
government officials, business leaders and others. Advocacy groups most commonlylaunch online campaigns urging their subscribers to contact Congress in support of oropposition to a specific bill. Generally, these online advocacy forms feature a call toaction, a sample citizen letter, and a form for users to input their personally identifiableinformation. In our study, each time an online subscriber completes such an onlineadvocacy form, it counts as a single “advocacy action.” After people complete the formsand submit their information, “citizen letters” in the form of e-mails or faxes are sent todecision makers in their name. Because some advocacy actions have multiple targetsfor instance, both U.S. Senators from a subscriber’s home state – it is possible that oneadvocacy action may generate multiple citizen letters.
If a goal of nonprofits launching online advocacy forms is to generate grassroots citizenaction on key issues, then one measure of success is the number of citizen lettersgenerated. Generally it is assumed that greater political impact is achieved by nonprofitsif subscribers take more online actions and generate more letters to decision makers.Online Advocacy Table 1 above shows that, in 2004-2005, the rights organizationsmobilized their subscribers to take more actions and generated more citizen letters todecision makers than the environmental and international aid organizations.
Factors Contributing to Successful Online Advocacy ProgramsHow were some organizations able to generate more actions and more letters thanothers? Was it because they have larger lists of subscribers? Did they send more e-mailaction alerts? Or were other variables at play? We found several factors influencing thenumber of actions taken and citizen letters sent.
The Online Advocacy Tables on the next page indicate that the organizations mostsuccessful at generating advocacy actions had a number of factors in common. Thesefactors included:
• Whole List Advocacy Messages. Not surprisingly, the volume of advocacy action messages sent to the entire e-mail listappears to relate to the overall volume of advocacy actions generated.
eNonprofit Benchmarks Study PAGE31Online Advocacy: Mobilizing Subscribers for Online Action
CHAPTER VII
Average Advocacy Actions,2004-2005
Average Citizen Letters, 2004-2005
335,000 872,000
654,000 1,048,000
Environmental
Rights
53,000 95,000International Aid
ONLINE ADVOCACY: TABLE 1

• Organizational List Size. Organizational list size is related to the number of advocacy actions and lettersgenerated, which is rather intuitive, as organizations with larger e-mail lists are likelyable to generate a larger number of actions.
• Duration of Online Advocacy Program. Organizations with long-standing online advocacy programs may have a greater degreeof experience and expertise, leading to greater success. The study also examined theaverage length of time individual subscribers were subscribed to the e-mail list. Whilewe did find generally that lists with subscribers on the list for longer periods generatedmore advocacy actions, it is highly correlated to the duration of the online advocacyprogram. After careful analysis, the study concludes that the duration of online advocacyprograms was the primary factor relating to average advocacy actions.
eNonprofit Benchmarks StudyPAGE32Online Advocacy: Mobilizing Subscribers for Online ActionCHAPTER VII
Average Advocacy Actions2004-2005
Number of In-Depth StudyPartners
211,000 4
292,000 4
Average Whole List Advocacy Messages (per month)
Less Than One
One to Two
748,000 3Two or More
ONLINE ADVOCACY: TABLE 2
Average Advocacy Actions2004-2005
Number of In-Depth StudyPartners
96,000 4
340,000 4
Average E-Mail List size
Under 100,000
100,000 - 300,000
676,000 4Over 300,000
ONLINE ADVOCACY: TABLE 3
Average Advocacy Actions2004-2005
Number of In-Depth StudyPartners
64,000 4
389,000 5
Average Duration of Program(Years)
Less Than Four
Four to Five
748,000 3Six or More
ONLINE ADVOCACY: TABLE 4

• Online Communications Budget. The most successful programs at generating online advocacy actions also had thelargest online communications budgets.
Online Advocacy Response & Conversion RatesOne metric used by many nonprofits engaged in online advocacy is response rate.Response rate is the percentage of subscribers receiving an e-mail action alert that thentake the online action requested. [Many different technology vendors and organizationsuse different methods of calculating response rates. For a more in-depth look at how wecalculated response rates for the purpose of this study, see the Methodology section.]
As seen in Online Advocacy Table 6, our data marginally supports that environmentalorganizations had the highest average advocacy response rate for both years.
Another key metric is advocacy page completion rates, which is the percentage ofpeople visiting an advocacy form page that complete the action. The average advocacypage completion rate for all organizations was 84 percent during 2004-2005. As withresponse rates, the environmental organizations had the highest average advocacypage completion rates.
eNonprofit Benchmarks Study PAGE33Online Advocacy: Mobilizing Subscribers for Online Action
CHAPTER VII
Average Advocacy Actions2004-2005
Number of In-Depth StudyPartners
196,000 4
291,000 4
Average Online CommunicationsBudget
Under $200,000
$200,000 - $500,000
635,000 3Over $500,000
ONLINE ADVOCACY: TABLE 5
Average Response Rates 2003-2004
Average Response Rates 2004-2005
11% 10%
15% 14%
All Partners
Environmental
10% 7%Rights
ONLINE ADVOCACY: TABLE 6
9% 7%International Aid
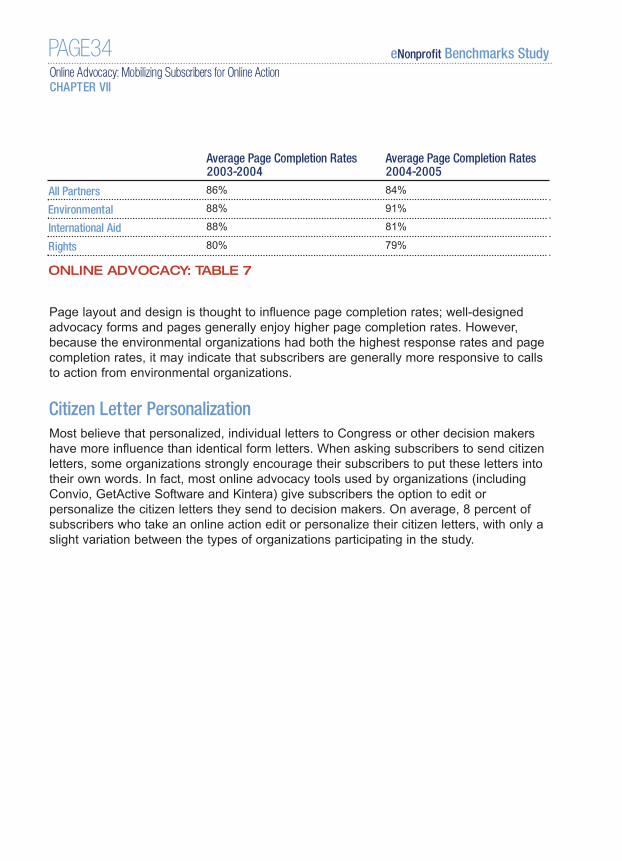
Page layout and design is thought to influence page completion rates; well-designedadvocacy forms and pages generally enjoy higher page completion rates. However,because the environmental organizations had both the highest response rates and pagecompletion rates, it may indicate that subscribers are generally more responsive to callsto action from environmental organizations.
Citizen Letter PersonalizationMost believe that personalized, individual letters to Congress or other decision makershave more influence than identical form letters. When asking subscribers to send citizenletters, some organizations strongly encourage their subscribers to put these letters intotheir own words. In fact, most online advocacy tools used by organizations (includingConvio, GetActive Software and Kintera) give subscribers the option to edit orpersonalize the citizen letters they send to decision makers. On average, 8 percent ofsubscribers who take an online action edit or personalize their citizen letters, with only aslight variation between the types of organizations participating in the study.
eNonprofit Benchmarks StudyPAGE34Online Advocacy: Mobilizing Subscribers for Online ActionCHAPTER VII
Average Page Completion Rates2003-2004
Average Page Completion Rates2004-2005
86% 84%
88% 91%
All Partners
Environmental
88% 81%International Aid
ONLINE ADVOCACY: TABLE 7
80% 79%Rights

eNonprofit Benchmarks Study PAGE35An In-Depth Look
AN IN-DEPTH LOOK:Taking Online Activists Into the Real WorldBen Smith, M+R Strategic Services
Mathew Grimm, Environmental Defense
Organizations that integrate online and offline advocacy strategies will not onlyhave greater political impact, but inviting online subscribers to take offline actioncan even lead to increased levels of online engagement down the road.
Environmental Defense experienced such a lift after a major offline organizinginitiative. In 2004, as part of its national global warming campaign, EnvironmentalDefense used Meetup.com, the online tool for arranging social and networkingget-togethers, to organize monthly, global warming advocacy meetings acrossthe country. While the grassroots component of the campaign was anchored byan online petition, activists were also invited to participate in local Meetups.
In terms of political impact, Environmental Defense’s Meetup effort was a mixedsuccess. Thousands of Environmental Defense subscribers registered forMeetups, but fewer subscribers actually attended Meetups than was hoped, andit was difficult to secure volunteers to lead most events in cities withoutEnvironmental Defense offices (where staff members participated).
However, inviting online subscribers to participate in offline events had anunintended benefit: increasing the online activism levels of subscribers whoparticipated in offline Meetup events. According to the Online Activism Table 5below, while Meetup participants were more engaged than non-participantsacross several key online engagement variables, Meetup participants becameeven more active themselves after participating in the meetings.
Meetup participation may have also led to higher list-retention rates than online-only participants. The percentage of Meetup participants who remainedsubscribed since attending a 2004 Meetup was 95%; comparably, of thesubscribers who did not attend a Meetup only 54% remained subscribed over thesame time period.

Participation in offline events takes more personal commitment from subscribers,and it may be that this increased commitment is what drives higher levels ofonline action-what led them to attend a Meetup in the first place. However, datastrongly suggests that involving your online subscribers in real, on-the-groundactivities will make your subscribers more active in your online program as well.
eNonprofit Benchmarks StudyPAGE36An In-Depth Look
E-MailOpens
AdvocacyActions
“Tell aFriend”
OnlineDonations
E-MailOpens
AdvocacyActions
“Tell aFriend”
OnlineDonations
2.3 4.0 6.3 3.4 3.1 5.2 9.4 4.4
Rate at WhichMeetupParticipants WereMore EngagedThan Online-OnlySubscribers
ONLINE ADVOCACY: TABLE 8
2 Years Before Meetup Since Meetup

eNonprofit Benchmarks Study PAGE37An In-Depth Look
AN IN-DEPTH LOOK:E-Activism’s Impact on Issues, Legislators and Public PolicyJennifer Milewski, Advocacy Institute
Measuring some aspects of the effectiveness of online action campaigns – openrates, response rates, conversion rates, etc. – is relatively straightforward.However, it is much more difficult to measure the influence that E-activism hason the real-world outcomes of public policy debates.
In lieu of spending too much time attempting to measure online advocacy’sinfluence, nonprofits should instead focus on strategies to improve their onlinecampaigns and maximize their effectiveness. What works? The deceptivelysimple answer is to be strategic.
• Know what you want to accomplish. Have very clear goals for your E-activism campaign. Goals could involve building support for or opposition tospecific legislation, changing the behavior of corporations, or simply raisingpublic awareness about an issue.
• Know your audiences. Not all legislators, nor all activists, are equally e-savvy; how will your e-activist communications or actions be received?
• Know your capacities. Some online efforts require more resources thanothers to make them effective. What can your organization (and your vendors)realistically take on?
• Know your tools. Different technologies offer different possibilities; what canvarious online tools do, and what are the conditions and the combinations withother strategies that can make them most effective?
• Be timely and relevant. Ensure that your campaign is timely, and connectswith your audience in a way that is relevant to their interests.
• Integrate with a broader campaign. Online campaigns alone are rarelyenough to win. Coordinate E-activism tactics with offline, grassroots, field andmedia tactics. If your organization does not have an offline component, buildalliances with others that do.
Online activism’s greatest impact may prove to be the attitudinal sea change it isbringing about both in policymakers and the electorate. The new tide of onlinecommunication is pulling Congress into greater two-way exchange with theirconstituents, fostering greater levels of political engagement, and flooding theelectorate with a powerful sense of their own agency in shaping the political process.4
4 The Congressional Management Foundation’s excellent report, Communicating with Congress, provides
critical insights into how e-communication is being received on Capitol Hill, and what that means forgrassroots e-activists.
VIII. ONLINE FUNDRAISING:MAKING ONLINE PROGRAMSPAY OFF
OverviewOnline fundraising programs come in all shapes and sizes. The study’s nonprofitpartners had vastly different approaches – and outcomes – to online fundraising.
Total Online Donations
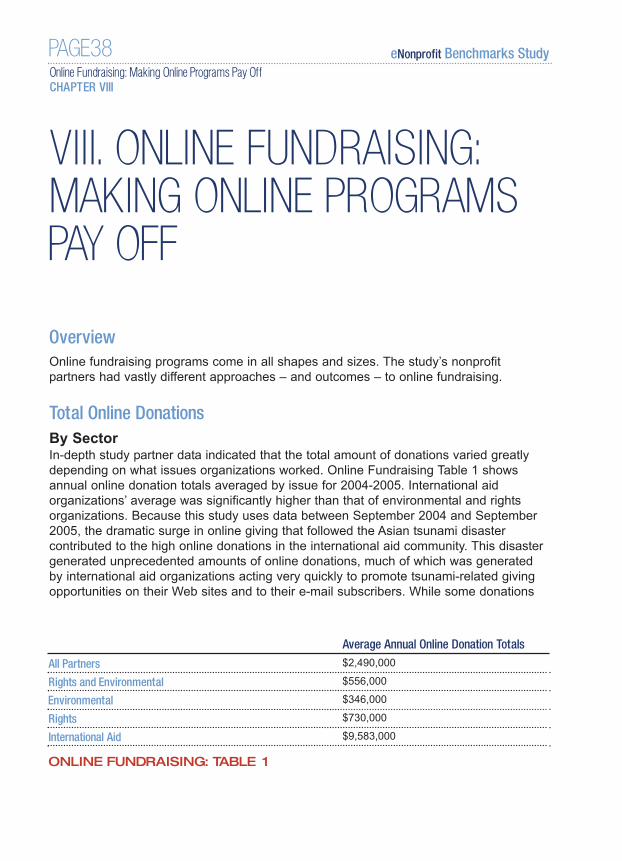
By SectorIn-depth study partner data indicated that the total amount of donations varied greatlydepending on what issues organizations worked. Online Fundraising Table 1 showsannual online donation totals averaged by issue for 2004-2005. International aidorganizations’ average was significantly higher than that of environmental and rightsorganizations. Because this study uses data between September 2004 and September2005, the dramatic surge in online giving that followed the Asian tsunami disastercontributed to the high online donations in the international aid community. This disastergenerated unprecedented amounts of online donations, much of which was generatedby international aid organizations acting very quickly to promote tsunami-related givingopportunities on their Web sites and to their e-mail subscribers. While some donations
eNonprofit Benchmarks StudyPAGE38Online Fundraising: Making Online Programs Pay OffCHAPTER VIII
Average Annual Online Donation Totals
$2,490,000
$556,000
All Partners
Rights and Environmental
$346,000Environmental
ONLINE FUNDRAISING: TABLE 1
$730,000Rights
$9,583,000International Aid

were generated by e-mail appeals to subscribers, most of the tsunami online fundscame as people responded to media coverage of the tragedy and went to organizationalWeb sites to give unsolicited online donations. This is a likely factor in the charts thatfollow highlighting online fundraising by international aid organizations.
By E-Mail List SizeAn analysis of self-reported responses to the broader nonprofit survey from the 29respondents with complete online giving data indicated that there was a positive anddefinite relationship between a group’s e-mail list size and the total amount of onlinedonations they generated. Online Fundraising Table 2 (below) shows the average andmedian gift sizes of the survey respondents categorized by their self-reported e-mail listsize. The median is the middle value of a data set – roughly half of the data points aresmaller and half of the data points are larger.
The large differences between the averages and medians per category are due to thefact that some of organizations had extremely high annual online totals which inflatedthe averages. In this case, the medians give a more accurate picture of the performanceof a typical organization within each list size bracket.
By YearFor the eight nonprofit study partners with complete fundraising data for the previous twoyears, average online fundraising totals were 40 percent higher during the 2004-2005period than the previous year. In fact, with just one exception, all organizationssubstantially increased their online revenue last year.
Online Giving Patterns
Gift SizeOnline Fundraising Table 3 (next page) indicates that the average gift size was $97 forstudy partners, and $95 according to aggregate data from all Convio, GetActive andKintera clients.
eNonprofit Benchmarks Study PAGE39Online Fundraising: Making Online Programs Pay Off
CHAPTER VIII
Average Annual Online DonationTotals
Median Annual Online DonationTotals
$20,000 $3,000
$196,000 $74,000
List Size
Under 10,000
10,000-70,000
$9,106,000 $2,150,000Over 70,000
ONLINE FUNDRAISING: TABLE 2
Broader Nonprofit Survey List Size/Donation Totals Data
A closer examination of the nonprofit study partners shows that their average gift amountin 2004-2005 ranged from $35 to $300. When organizations with the lowest and highestaverage donation amounts were dropped, average gift sizes for the remaining partnerswas between $60 and $140.
Average gift size across all of the partners was nearly $100, with the median at $70. Themedian indicates that half of the nonprofit study partners’ average gifts were greater than$70 and half of the partners had an average gift size of less than $70. The differencebetween the average and median signifies that there were quite a few large donations
eNonprofit Benchmarks StudyPAGE40Online Fundraising: Making Online Programs Pay OffCHAPTER VIII
Average Gift Size Median Gift Size
$97 $70
$62 $69
All Partners
Environmental
$114 $77Rights
ONLINE FUNDRAISING: TABLE 3
$121 $142International Aid
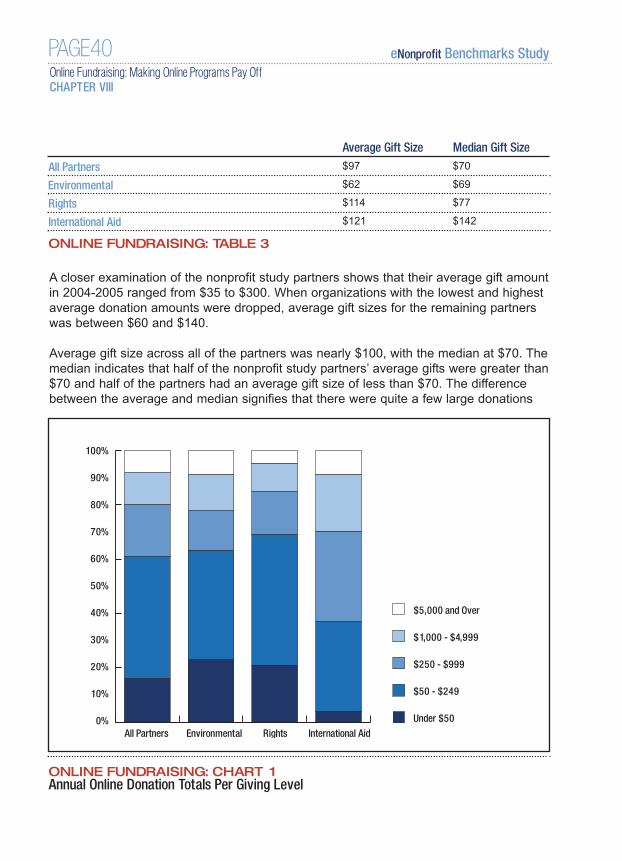
ONLINE FUNDRAISING: CHART 1
Annual Online Donation Totals Per Giving Level
0
20
40
60
80
100
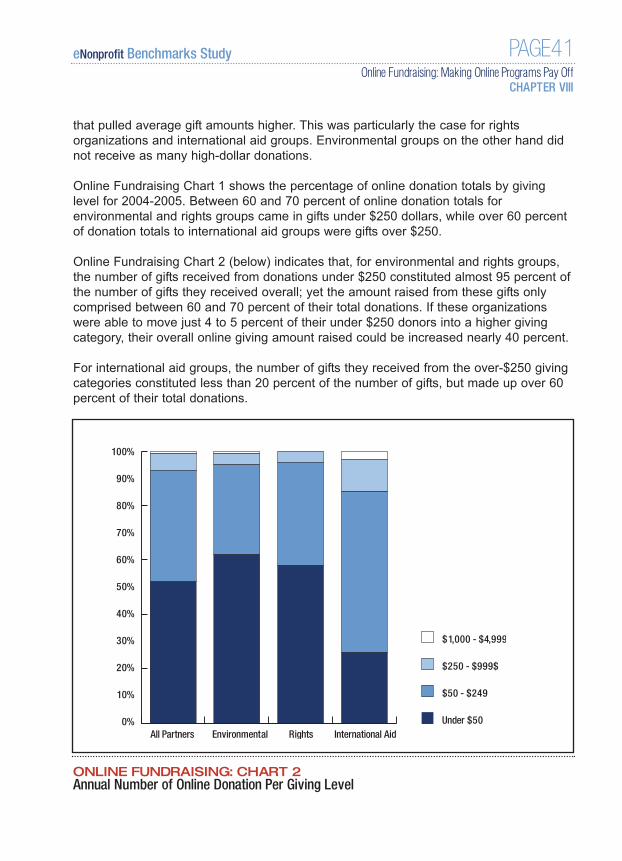
that pulled average gift amounts higher. This was particularly the case for rightsorganizations and international aid groups. Environmental groups on the other hand didnot receive as many high-dollar donations.
Online Fundraising Chart 1 shows the percentage of online donation totals by givinglevel for 2004-2005. Between 60 and 70 percent of online donation totals forenvironmental and rights groups came in gifts under $250 dollars, while over 60 percentof donation totals to international aid groups were gifts over $250.
Online Fundraising Chart 2 (below) indicates that, for environmental and rights groups,the number of gifts received from donations under $250 constituted almost 95 percent ofthe number of gifts they received overall; yet the amount raised from these gifts onlycomprised between 60 and 70 percent of their total donations. If these organizationswere able to move just 4 to 5 percent of their under $250 donors into a higher givingcategory, their overall online giving amount raised could be increased nearly 40 percent.
For international aid groups, the number of gifts they received from the over-$250 givingcategories constituted less than 20 percent of the number of gifts, but made up over 60percent of their total donations.
eNonprofit Benchmarks Study PAGE41Online Fundraising: Making Online Programs Pay Off
CHAPTER VIII
ONLINE FUNDRAISING: CHART 2
Annual Number of Online Donation Per Giving Level
0
20
40
60
80
100

Fundraising E-Mail Message Response As Online Fundraising Table 4 (below) indicates, 0.3 percent of partner subscribers whoreceived an e-mail fundraising appeal donated money. As discussed in the E-MailMessaging section of this study, the response to e-mail fundraising appeals issignificantly lower than e-mail requests to take an advocacy action. On any given e-mailfundraising appeal, fewer people are going to click on a link and go to the donationpage, and even fewer are going to complete the donation page. Since this ask requiresa substantially larger commitment from the subscriber than signing an online letter, thisis not surprising.
International aid groups again out performed environmental and rights groups, with a 0.6percent response rate for e-mail fundraising appeals. Interestingly, even as environmentalorganizations have higher response rates than rights groups, they raised less overallonline than the rights organizations (see Online Fundraising Table 1 above). This may bein part because they have smaller e-mail lists and a lower average gift size than therights organizations.
Donor Retention From Year to YearData indicate that 16 percent of the online donors who donated online between 2003and 2004 were repeat online donors in 2004-2005. Organizations that sent morefundraising appeals had higher online donor retention rates during this period.
Online Repeat DonorsIn 2004-2005, for ten of the fifteen nonprofit partners, less than 15 percent of their giftscame from repeat online donors. For four partners, between 19 and 51 percent of theirgifts come from repeat donors. These four groups included both rights andenvironmental organizations. With international aid groups, a large proportion of theirdonations may have come from disaster relief, which might attract a larger proportion ofone-time givers.
eNonprofit Benchmarks StudyPAGE42Online Fundraising: Making Online Programs Pay OffCHAPTER VIII
Average Click-Through Rate
Page CompletionRate
Average ResponseRate
1.5% 22% 0.3%
0.8% 32% 0.2%
All Partners
Environmental
2.1% 7% 0.2%Rights
ONLINE FUNDRAISING: TABLE 4
1.7% 33% 0.6%International Aid

Recurring GiftsA recurring online gift program allows donors to pledge a certain amount and divide thisamount over a specific number of payments (e.g., monthly payments over the course ofa year). For the nonprofit study partners, recurring gifts were a small part of onlinegiving, both in number of people participating and annual amount raised. Eight of thepartners had some sort of recurring gift program and all eight of these programsincluded less than 5 percent of the total donor pool. Except for one organization, theannual amount of money raised from recurring gifts accounted for less than 5 percent ofthe total annual amount raised online. Rather than discount online recurring givingprograms, we might assume that because of the relative newness of online fundraising,online recurring giving programs need more time and attention to attract more moneyand donors.
Factors That Drive Successful Online Fundraising ProgramsOnline fundraising success is defined by the amount of money raised by anorganization. From both the nonprofit study partners and the broader nonprofit survey,some patterns emerged among organizations that were more successful at onlinefundraising.
These organizations displayed the following characteristics:
• Larger e-mail list size;• More Web site traffic;• Larger online communications budgets; • Online fundraising programs that have been in place for a longer period of time; and• Online fundraising coordinated with online advocacy (See Online Fundraising Table 5,
below, from the broader, self-reported nonprofit survey).
eNonprofit Benchmarks Study PAGE43Online Fundraising: Making Online Programs Pay Off
CHAPTER VIII
Online Advocacy Program No Online Advocacy Program
$343,000 $113,000
$25,000 $3,000
Average Annual Online Donation Totals
Median Annual Online Donation Totals
ONLINE FUNDRAISING: TABLE 5
Broader Nonprofit Survey Annual Donation Totals
AN IN-DEPTH LOOK:Direct Mail Prospecting to Online Supporter ListsBrian Hauf, Convio
In the fall of 2003, the Brady Campaign, a gun control advocacy organization, setfour goals for its online fundraising efforts:
1) Raise funds for impending legislative battles on Capitol Hill; 2) Attract new donors to support its cause; 3) Move e-mail subscribers to contact decision makers; and 4) Integrate e-mail subscribers into other direct marketing channels to raise
funds and deepen commitment to its cause.
The Brady Campaign’s online fundraising initiative was integrated with its onlineactivism and campaign efforts. Beginning in 2004 and utilizing an innovativemicro-site, petition campaigns, activism-oriented e-mail messages, and calls to“tell a friend,” the Brady Campaign grew its e-mail list from 38,000 to 175,000subscribers. These list building and activism initiatives were then followed byseveral fundraising appeals seeking donations to specific campaign initiatives(like print and TV ads). Typical response rates to these fundraising appealsranged from 0.19 to 0.37 percent; this compares to typical e-mail acquisitionappeal rates of 0.1 percent. Average gifts ranged from $24 to $46. And newdonors via the Internet grew from 311 in 2002 to 3,244 in 2004.
Having collected postal mailing addresses via its online petition drive forapproximately 23 percent of its e-mail list, the Brady Campaign then sent a directmail solicitation to online non-donors for whom mail addresses were available. Theresult was a 1.26 percent response rate, as compared to the overall mailingresponse rate of 1.11 percent by the group’s standard direct mail rental lists. Thisrepresents an increase of nearly 14 percent. The average gift from e-mail constituentsin response to the direct mail appeal was $24.22, 19% higher than the overallmailing average gift of $20.52. The key acquisition metric – the net cost per acquireddonor for the e-mail list – was $6.22 compared with $15.71 for the overall mailing.
The Brady Campaign will be tracking the lifetime value of these new donors. Butinitial measures point to success at converting online non-donors to donorsacross three channels – e-mail, direct mail and telemarketing.
eNonprofit Benchmarks StudyPAGE44An In-Depth Look

eNonprofit Benchmarks Study PAGE45An In-Depth Look
AN IN-DEPTH LOOK:
Disaster Relief: Humane Society Raises Over $18 Million Onlinefor Katrina’s Animal VictimsNick Allen & Sarah Haug, Donordigital
Along with the terrible human toll from Hurricanes Katrina and Rita in 2005,hundreds of thousands of dogs, cats and other animals were also victims of theGulf disaster. The Humane Society of the United States (HSUS) reacted almostimmediately, both on the ground (with teams rescuing animals) and on the Web(with an online outreach and fundraising effort).
The HSUS online team temporarily replaced the HSUS home page with anonline disaster center splash page. The Disaster Center provided up-to-the-minute hurricane updates, slideshow footage of the devastation and the animalsleft behind, and a place to quickly and easily donate. HSUS sent a series ofurgent e-mail appeals and disaster updates over five weeks, with less frequentbut informative updates being sent through December 2005.
The results? An astounding $18 million in donations from e-mail appeals andWeb site visitors, with an average gift 166% higher than the average gift donatedprior to the online disaster relief efforts. HSUS also recruited thousands of newe-mail subscribers, as new donors and Web visitors signed up or took action onfeatured online advocacy campaigns.
What worked? Nimbleness, responding quickly to the disaster; saturation mediacoverage; promotion of the HSUS effort on major news sites and hundreds ofother third-party Web sites; a very active 650,000-person e-mail list of advocates,subscribers and donors; an information-packed Web site; and a talented 24/7online fundraising and marketing staff.

AN IN-DEPTH LOOK:Pass-Along FundraisingGreg Nelson, Kintera
In campaign after campaign, statistics support one of the strongest-held beliefsof fundraising professionals: Your current subscribers truly are your bestfundraisers. And with online pass-along fundraising strategies, they can do it inan efficient and personalized way, with often good results.
Pass-along online fundraising generally works like this: Organizations implementonline fundraising tools which allow subscribers to create their own personalfundraising Web pages. While these fundraising pages are usually branded by theorganization, subscribers can customize the page, often with a photo and text.Subscribers then send e-mails to personal networks of friends, family andcolleagues inviting them to visit their fundraising page to donate toward your cause.
Traditional fundraising can be slow, burden participants with managing a lot ofpaper, and often limits their “ask” scope to local contacts. But pass-along onlinefundraising empowers individuals to engage their nationwide – and eveninternational – networks.
The Children’s Hospital Foundation in Denver used pass-along fundraising fortheir 2005 Courage Classic cycling event. They saw an immediate impact overthe previous year:
• Participants raised nearly $250,000 online in 2005 – a 223% increase over2004.
• Twenty-four percent of the event total was raised online, compared with 9%the previous year.
• Participants who used online pass-along fundraising raised on average $1,054,compared with $577 by those who did not.
The combination of online technology and personal solicitation makes pass alongfundraising a win-win method to generate revenue and support.
eNonprofit Benchmarks StudyPAGE46An In-Depth Look

IX. BEST PRACTICES
Nonprofit organizations can improve the overall success of their online communicationsprogram in many ways. Based on the results of this study, we have developed a list of bestpractices that organizations may want to consider following to improve the performance oftheir online communications programs. By learning from the lessons of other nonprofits,organizations may be able to increase the effectiveness of e-mail messaging, onlineadvocacy and online fundraising, in addition to recruiting more online subscribers.
Please note that, as with any strategic communications, we would strongly recommendtesting what works best for your online subscribers prior to making a wholesale change inyour program. What works best for other organizations may not work for all organizations.
1. Budget for Success. Given the clear relationship between the size of an organization’s onlinecommunications budget and their results, nonprofits that want to achieve greatersuccess online should consider increasing their online communications budgets. Forthe study partners we saw a clear relationship between the online communicationsbudget and two key indicators of success: the amount raised in online donations andthe total number of advocacy actions taken.
2. Grow Your E-Mail List to Increase Online Advocacy and Fundraising
Impact. The study found that organizations with larger e-mail lists were better able to achieveonline fundraising success, and saw significantly greater results in terms of onlineadvocacy outcomes. If either of these are a priority for your organization, growingyour e-mail list is one key way to improve your results.
3. Anticipate and Track List Churn. When planning for e-mail list growth, organizations must anticipate list churn. With 28percent of all e-mail subscribers becoming unreachable, on average, within a 12-month period, it is critical to compensate for list churn and substantially grow an e-mail list. Organizations should also establish tracking mechanisms to track churn rate.
4. Increase Retention of List Subscribers. Organizations with a greater percentage of subscribers retained on e-mail lists forlonger than one year saw higher action participation rates and generated more citizenletters. Organizations should pursue list management strategies to increase thelongevity of e-mail list subscribers by increasing retention rates and reducing churn.
eNonprofit Benchmarks Study PAGE47Best PracticesCHAPTER IX
5. Carefully Track Marketing and Recruitment Efforts. Successful return on investment analysis absolutely depends on an organizationestablishing careful tracking mechanisms up front, before online marketing programsare launched. Because of the way many vendors store and report data, it is oftenimpossible to reconstruct accurate results for advertising campaigns that took placejust a few months ago. Organizations should know what data points you want totrack before recruitment campaigns are launched. In addition to measuringsubscriber retention, some organizations may want to measure the amount of onlineactivism generated, funds donated, and offline activists recruited.
6. Test Optimizing Day of the Week for Advocacy Message Launch. Study data indicate that advocacy messages sent on Thursdays and Fridays receiveslightly higher open rates than e-mail messages sent on other days of the week. Wewould strongly recommend, however, that organizations test this with their own e-mail list prior to making a wholesale change in the day of week they send their e-mail messages.
7. Carefully Target and Segment E-Mail Messages. Data indicate that advocacy messages targeted by geographic area yield higheropen and response rates for online activism and online fundraising than messagessent to the entire list. To boost response rates, organizations should developstrategies to more carefully target some e-mail messages.
8. Act Quickly to Respond to Timely Events. Some of the success that international aid organizations had with online fundraisingin 2004-2005 was due to the dramatic surge in online fundraising in support of Asiantsunami relief efforts. This was made possible, in part, by reacting quickly to thisemergency, to make information about relief efforts and donation opportunitiesavailable via organizational Web sites and to e-mail subscribers. All organizationsshould have rapid response fundraising plans in place to move quickly in responseto urgent events and give subscribers opportunities to donate online.
eNonprofit Benchmarks StudyPAGE48Best PracticesCHAPTER IX

eNonprofit Benchmarks Study PAGE49Methodology and Discussion of Metrics
CHAPTER X
X. METHODOLOGY ANDDISCUSSION OF METRICS
The eNonprofit Benchmarks Study collected online engagement data for onlinetransactions occurring, in most cases, between September 2003-September 2004 andSeptember 2004-September 2005. Data for the study came from three sources.
1. In-Depth Nonprofit Study PartnersThe study’s nonprofit partners group consisted of 15 U.S.-based national nonprofitorganizations: six rights based groups, three international aid organizations, and sixenvironmental organizations. For one of these in-depth study partners, only a few keydata points were collected and analyzed in the study because of a recent technologyconversion. The groups include:5
Environmental:• Earthjustice (www.earthjustice.org)• Environmental Defense (www.environmentaldefense.org)• Defenders of Wildlife (www.defenders.org)• Save Our Environment (www.saveourenvironment.org)• Union of Concerned Scientists (www.ucsusa.org)• The Wilderness Society (www.wildernesssociety.org)
Civil/Legal Rights:• Amnesty International (www.amnestyusa.org)• Human Rights Campaign (www.hrc.org)• Human Rights First (www.humanrightsfirst.org)• Leadership Conference on Civil Rights (www.civilrights.org)• NARAL Pro-Choice America (www.naral.org)• Planned Parenthood Federation of America (www.plannedparenthood.org)
5 Each organization may have additional affiliated Web sites and URLs which may be counted amongtheir overall traffic and response numbers. For easy reference, their main organizational Web sites arelisted here.

International Aid:• CARE USA (www.careusa.org)• International Planned Parenthood Federation / Western Hemisphere Region
(www.ippfwhr.org)• Oxfam America (www.oxfamamerica.org)
Each organization has active e-mail messaging, online activism and online fundraisingprograms, and each utilizes Convio, GetActive Software or Kintera, three of the leadingnonprofit e-mail messaging, online advocacy and online fundraising technology vendors.
Data from the nonprofit study partners was gathered in the following ways:• A two-page questionnaire with 17 questions, collecting basic organizational data that
was completed by the organizations themselves.• M+R’s data analyst and data intern carefully combed through each partner’s e-mail
systems, databases and reporting tools to gather data on e-mail communications,fundraising, and e-mail transactional history. Data was collected in Access for furtherquerying capabilities. [Aggregate data tables from the in-depth partners will beavailable online at www.e-benchmarksstudy.com.]
Data collection was complex, taking nearly three months. Each study partner useddifferent technology tools for tracking and storing data, and the quality and consistencyof the data varied organization by organization.
The most complex part of the data gathering and analysis was e-mail communicationsdata. Data was collected from 13 nonprofit partners on e-mail messages sent betweenSeptember of 2004 and September of 2005 and between September of 2003 andSeptember of 2004. Ten partners sent out fewer than 350 separate e-mails in that timeperiod, and M+R’s data analyst and data intern put data on each message into an Excelspreadsheet, coding each message into message-type categories (including Advocacy,Fundraising, E-news, and Other). Advocacy messages were further coded into OnlineAdvocacy Campaign and Offline Advocacy Campaign categories. All messages werethen categorized as sent to the Whole List or to a Segment of the List. Messages sent toa Segment of the List were then categorized as to what type of segmentation strategywas used (Geo-Target or Interest Category).
For the two partners with over 1,000 messages sent during the respective time periods,random samples of their messages were taken to calculate e-mail messaging rates. Forone nonprofit partner without a full year’s worth of messaging data, we forecasted fromthe three months of data that was available.
2. Aggregate Data From Technology Vendors Aggregate online engagement data was collected across the hundreds of nonprofitclients of Convio, GetActive Software and Kintera. Data types collected in aggregate
eNonprofit Benchmarks StudyPAGE50Methodology and Discussion of MetricsCHAPTER X

from the vendors closely match the data collected from the nonprofit partners.With the understanding that each vendor has its own way of storing data and calculatingnumbers, the aggregate vendor data that we collected included the following metrics:
• Average Message Open Rate;• Average Message Click-Through Rate; and• Average Online Gift Size.
Each vendor calculated each data point across all of its clients using the 2005 year(January 1 to December 31). Two of the vendors provided one annual data point, while athird provided a monthly breakdown that was then averaged.
Message open rates were calculated by two of the technology vendors the same as itwas calculated for the nonprofit study partners, while one vendor calculated the open rateby dividing the number of HTML e-mails opened by the number of HTML e-mails sentThis calculation removes the effect of plain text e-mails, but could result in lower thanactual open rates because number of HTML e-mails sent does not exclude the number ofe-mails that bounced. Calculating open rate based on e-mails sent or received are bothcommonly accepted practices within the e-mail service provider industry (ESP).
Message click-through rates were also calculated by two of the technology vendors thesame as it was calculated for the nonprofit study partners. The third technology vendorcalculated click-through rate by dividing the total number of e-mails in which a recipientclicked on at least one link by the total number of e-mails sent. This calculation could belower than the actual click-through rate because, as above, the number of e-mails sentdoes not exclude the number of bouncing e-mails. The differences in these calculationsdid not produce vast differences in outcome as the click-through rates from each vendordid not vary more than 0.8 percent.
All three vendors calculated average online gift size by dividing the total dollars raisedfrom donation transactions across all clients (in 2005) by the total number of successfuldonations.
3. Broader Nonprofit Online Survey Data and information about online practices was collected from 85 nonprofitorganizations that participated in an online survey open to all such organizations. Surveyrespondents represented a broad range of nonprofits of different sizes working in variousissue areas. Data from this survey was self-reported by the organizations taking thesurvey. Survey respondents answered 32 questions about their online communicationsprograms. [A copy of the survey questions and answers can be seen in Appendix B.]The survey was launched online in the end of November 2005 and closed in the end ofDecember 2005. A breakdown of organization types that participated is found inMethodology Table 1.
eNonprofit Benchmarks Study PAGE51Methodology and Discussion of Metrics
CHAPTER X

The survey was promoted formallyand informally to the broadernonprofit community through avariety of channels. It wasdistributed online via M+R StrategicServices’ Web site, as well as toseveral e-mail groups and listservsused by the nonprofit Internetcommunity, including ProgressiveExchange, the NonprofitTechnology Enterprise Network’s(N-TEN) e-mail. The eNonprofitBenchmarks Study advisory groupmembers also forwarded the surveyto colleagues, peers and clients. Inaddition, survey respondents wereasked to forward the survey toother organizations after completingthe survey themselves.
Data for the study comes fromthese three sources, with thesources highlighted in each sectionso as to be clear to the reader. Inmost cases, the time frames for thedata analysis are September 2003-September 2004 and September2004-September 2005.
GlossaryThe following are definitions forterms used throughout the report:
Click-Through Rate: Calculated as the number of people who clicked on any trackable link in an e-mailmessage divided by the number of people who received the e-mail message. Peoplewho clicked multiple times in one e-mail were only counted once. For example, if asubscriber clicks on every link in a message ten times, this was counted the same is ifthe subscriber had clicked once on a single link.
eNonprofit Benchmarks StudyPAGE52Methodology and Discussion of MetricsCHAPTER X
Number ofRespondents
16
9
Type of Nonprofit Organization
Other
Education
9Health and Mental Health
5Community and Economic Development
5Environment, Wildlife and Animal Welfare
5Network of Nonprofit Organizations
4Disaster Relief
4Media and Media Watch Dog
4Poverty and Hunger
3Children and Youth
3Housing and Homelessness
3Technology, Computer and Internet Policy
3Volunteering and Community Service
2Gay, Lesbian, Bi & Trans Issues
2Human Rights and Civil Liberties
1Crime and Safety
1Disability Issues
1Family and Parenting
1Immigration
1Job Training and Workplace Issues
1Peace and Conflict Issues
METHODOLOGY: TABLE 1
Survey Respondents

Open Rate: Calculated as the number of HTML-version of an e-mail message opened divided by thenumber of people who received the HTML-version of the e-mail. The number ofsubscribers who received an e-mail is calculated by subtracting the number of bouncesfrom the total number of e-mails sent. (An e-mail bounce is an e-mail address thatbounces back to the sender because the recipient’s mailbox was full, the attachmentsize was too large, there was a connection problem, or the e-mail address was simplyinvalid.) Open rates do not include plain text e-mail recipients because it is calculated byloading an image pixel in the body of a recipient’s e-mail. Because plain text e-mailrecipients are excluded, the reported open rate may be lower than the true open rate.Open rate data for e-mails opened by plain text viewers is not available. However, e-maillists for the nonprofit study partners tend to have a relatively small number of plain texte-mail subscribers, so we do not believe the discrepancy to be major.
Page Completion Rate: Calculated as the number people who completed a form divided by the number ofpeople who clicked on the link to get to that form.
Response Rate: Calculated as the number of people who took the main action requested from an e-mailmessage divided by the number of people who received the e-mail message. For thepurposes of the study, this generally only applies when the action is completing anonline advocacy form or an online donation form.
M+R attempted to standardize the nonprofit study partner data sets in every waypossible; please note that this dataset is a small high-dimensional sample. Because ofthe labor intensity required to extract multiple data points from several messagingcampaigns, we were unable to include more partners in this study. Additionally, the typesof attributes measured in this study are not absolute and thus make it difficult to drawbroader conclusions.
eNonprofit Benchmarks Study PAGE53Methodology and Discussion of Metrics
CHAPTER X

APPENDIX ABelow is the questionnaire provided to the 15 in-depth nonprofit study partners, followed bya table of aggregated answers. We are not able to show answers to all of these questionsbecause many of the answers cannot be grouped together into a number or category.
Aggregate data tables from the in-depth partners will be available online at www.e-benchmarksstudy.com.
Questionnaire1+2. Organization Name and Contact (name, e-mail address, mailing address, phone number):
3. Technology Vendor for Online Activism, Messaging, Fundraising & MemberManagement (circle those that apply):
• Convio• GetActive Software• Kintera
4. Staffing:• Total Staff:• Total Online Communications Staff:
5. Budget (current fiscal year, including staff costs):• Total Annual Overall Organizational Budget (current fiscal year):• Total Annual Marketing & Communications Budget:• Total Annual Online Communications Budget:• Online Communications Budget Breakdown:
• Total Annual Web Site Budget:• Total Annual Online Advocacy Budget:• Total Annual Online Advertising Budget:• Total Annual Online Fundraising Budget:
6. Previous Estimated 5-Year Investment in Online Communications:• Total $ Amount:• Web Site Investment:• Online Advocacy:• Online Ads/Marketing:• Online Fundraising:• Other:
7. Length of Online Program, In Years:• Web Site:• E-Mail Messaging Lists:• Online Advocacy Program:
eNonprofit Benchmarks StudyPAGE54In-Depth Nonprofit Study Partners Questionnaire APPENDIX A

• Online Fundraising Program:8. Web Site Traffic: http://www._____.org/
• Annual Visits (use 9/1/2004-9/1/2005):• Annual Unique Visitors (use 9/1/2004-9/1/2005):• Monthly Visits:• Monthly Unique Visitors:• Web Site Address:
9. E-Mail Subscribers (provide breakdowns if messaging streams are separated): Doesyour organization maintain separate lists for activism, e-mail newsletters and donorappeals, or are they consolidated into one list?
10. Offline Constituency Communications:• # of Direct Mail Donors (9/1/2004-9/1/2005):• Total Direct Mail offline gifts, excluding online giving (9/1/2004-9/1/2005):• # of Offline Activists/Volunteers (if applicable):• Total Direct Mail Giving (total offline and online giving between 9/1/2004-9/1/2005):
11. Conversion From Direct Mail - Are direct mail donors who then gave online identified?
12. Has your organization used its e-mail subscribers as direct mail prospects (e.g., Haveyou sent direct mail fundraising appeals to non-donated e-mail subscribers)?
• No• Yes (If yes, please briefly describe how often.)
13. Do you have results of direct mail prospecting to e-mail subscribers to share?
14. Has your organization utilized any of the following special online fundraising tactics:• Friend-to-Friend Fundraising (e.g., Convio’s TeamRaiser, GetActive’s
Community Networking Module, Kintera’s Friends Asking Friends):• Paid Ads to Acquire New Donors:• Emergency Relief:• If so, please briefly describe:
15. Does your organization collect “interest” information about subscribers (e.g., checkboxes at sign up, importing interest info collected offline, etc.)?
• No• Yes (If yes, does your organization use that data to target messages?)
16. Paid activist/subscriber recruitment tactics your group has used in the last year (withsource codes saved):
• Paid:• Earned:• Other:
17. Do you have a membership program? If so, briefly describe.
eNonprofit Benchmarks Study PAGE55In-Depth Nonprofit Study Partners Questionnaire
APPENDIX A

eNonprofit Benchmarks StudyPAGE56In-Depth Nonprofit Study Partners Questionnaire APPENDIX A
Average Median
186 120
5 4
$58,220,000 $22,300,000
$2,441,833 $2,200,000
$215,061 $155,000
$145,944 $104,000
$46,727 $30,000
$117,389 $114,000
4.6 5
3.6 4
Question
4. Staffing
Total Staff:
Total Online Communications Staff:
5. Budget (current fiscal year, including staff costs)
Total Annual Overall Organizational Budget:
Total Annual Marketing & Communications Budget:
Total Annual Web Site Budget:
Total Annual Online Advocacy Budget:
Total Annual Online Advertising Budget:
Total Annual Online Fundraising Budget:
7. Length of Online Program in Years:
Online Advocacy Program:
Online Fundraising Program:
APPENDIX A
Questionnaire Answers (for select questions only)
Yes No
$485,726 $436,000Total Annual Online Communications Budget:
Online Communications Budget Breakdown:
7.6 8Web Site:
5.2 5E-Mail Messaging Lists:
10. Offline Constituency Communications
163,414 100,000Number of Direct Mail Donors (9/04-9/05):
$16,591,209 $6,000,000Total direct mail giving (9/04-9/05):
11. Are direct mail donors who then gave onlineidentified?
8 3
12. Has your organization used its e-mail subscribers asdirect mail prospects?
8 4
14. Has your organization used any of the followingspecial online fundraising tactics:
Friend-to-Friend Fundraising: 4 2
Paid Ads to Acquire New Donors: 6 3
Emergency Relief: 4 4
15. Does your organization collect “interest” informationabout subscribers?
9 5
If yes, do you use it? 5 4

eNonprofit Benchmarks Study PAGE57Broader Nonprofit Online Survey
APPENDIX B
Average Median
See Methodology Section
626 22
6 1
$20,002,247 $2,200,000
1,203,962 154,933
1,078,909 75,784
102,469 11,794
93,230 18,250
5 5
4 4
Question
1. What is the general mission of your nonprofitorganization?
2. Which of the following online products or activitiesdoes your nonprofit organization produce or engage in?(Please check all that apply)
Web site:
E-Mail News, Newsletters or Updates:
Online Activism (action alerts, advocacy campaigns, etc.):
Online Fundraising:
Other (please specify):
3. How many full-time staff does your organization employ?
4. How many full-time online communications staff doesyour organization employ?
5. What is the overall budget of your organization?
6. Number of annual visits:
7. Number of annual unique visitors:
8. Number of monthly visits:
9. Number of monthly unique visitors:
10. How long has your organization had the followingonline products or programs (in years)?
Web Site:
E-Mail Messaging Lists:
APPENDIX B
Broader Nonprofit Online Survey
Yes No
82 2
73 11
38 46
54 30
16
3 3Online Advocacy Program:
3 2Online Fundraising Program
APPENDIX B
Below is the survey data collected from the 85 nonprofit organizations that participated inthe 32-question broader nonprofit online survey.

eNonprofit Benchmarks StudyPAGE58Broader Nonprofit Online Survey APPENDIX B
Average Median
97,043 1,050
138,431
4 2
34% 33%
2 0.5
19% 12%
41% 23%
4 5
Question
Number of fundraising e-mail appeal recipients:
15. How many total individual e-mails did you send to yoursubscribers or list members in the past 12 months?
16. On average, how many messages would any oneperson on your e-mail list(s) receive from yourorganization in an average month?
17. What is the overall average unique open rate for e-mail messages you sent to your e-mail list over thepast 12 months?
18. On average, how many online actions/onlinepetitions/advocacy campaigns does your organizationlaunch each month?
19. What is your organization’s overall average responserate to online advocacy actions in the past 12months?
20. What is your mix of local versus national advocacy?
Local Advocacy (%):
As a tool for educating your supporters on the issuesyou work on:
APPENDIX B: CONTINUED
Broader Nonprofit Online Survey
Yes No
53% 50%National Advocacy (%):
5 522. On a scale of 1 to 6 (1 being low), how would you rate the
strategic importance of the Internet to your organization?
4 4As a tool for recruiting new activists and supporters:
3 3As a tool for cultivating potential donors:
62,560 5,300
86,471 1,675
11. How many total unique, active, non-bouncing e-mailaddresses do you have on file?
12. If managed separately, how many email recipients doyou have for each of the following email lists?
Number of e-mail newsletter subscribers:
30,409 25Number of e-mail activists (action alerts or petitions):

eNonprofit Benchmarks Study PAGE59Broader Nonprofit Online Survey
APPENDIX B
Average MedianQuestion Yes No
29. Has your organization utilized any of the followingspecial online fundraising tactics? (Please check allthat apply)
Friend-to-Friend Fundraising:
Paid Ads to Acquire New Donors:
Emergency Relief Campaign::
31. Does your organization collect online “interest”information about subscribers/ activists/ donors?
32. If yes, does your organization use that data to target e-mail messages?
APPENDIX B: CONTINUED
Broader Nonprofit Online Survey
7 44
6 45
10 41
20 33
12 24
$10,770,133 $21,00027. What are the direct mail fundraising totals for your
organization over the past 12 months?
$1,710,303 $028. What are the telemarketing or tele-fund totals (in
dollars) for your organization over the past 12 months?
$10,079,656 $2,50026. What are the online fundraising totals for your
organization over the past 12 months?

APPENDIX C.
Below are the three data points gathered across the following three vendors: Convio,GetActive Software, and Kintera. Data from all three vendors together represent morethan 1,000 organizations.
eNonprofit Benchmarks StudyPAGE60Aggregate Data from Technology VendorsAPPENDIX C
Average Message Click-Through Rate Average Online Gift
4% $95
Average E-Mail Open Rate
19%
APPENDIX C
Aggregate Data from Technology Vendors

