enhancing transparency in the land use sector
TRANSCRIPT
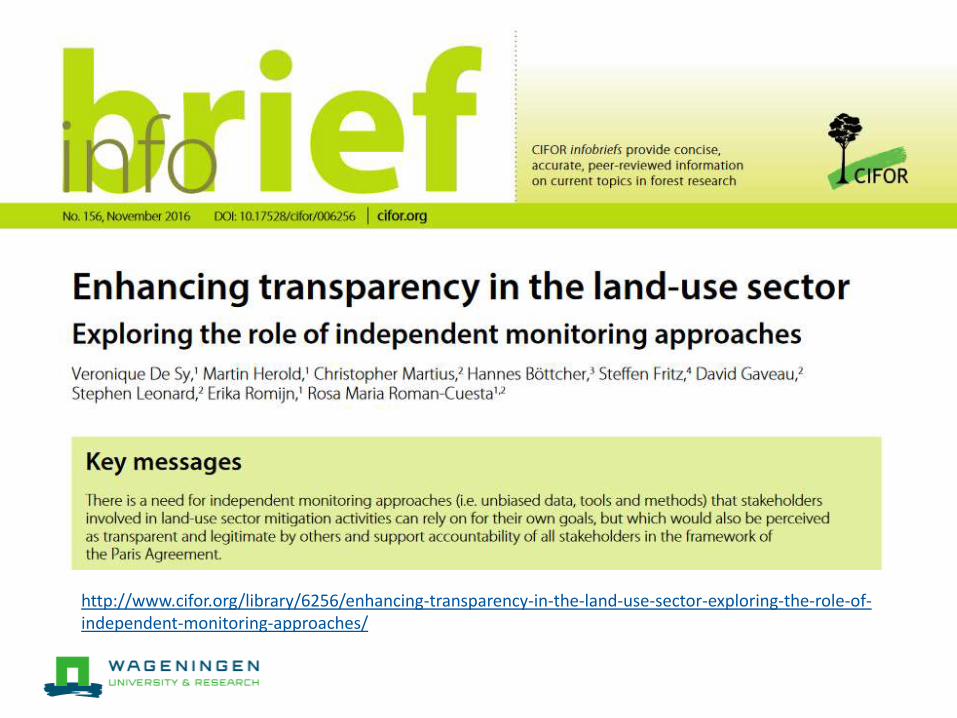
http://www.cifor.org/library/6256/enhancing-transparency-in-the-land-use-sector-exploring-the-role-of-independent-monitoring-approaches/
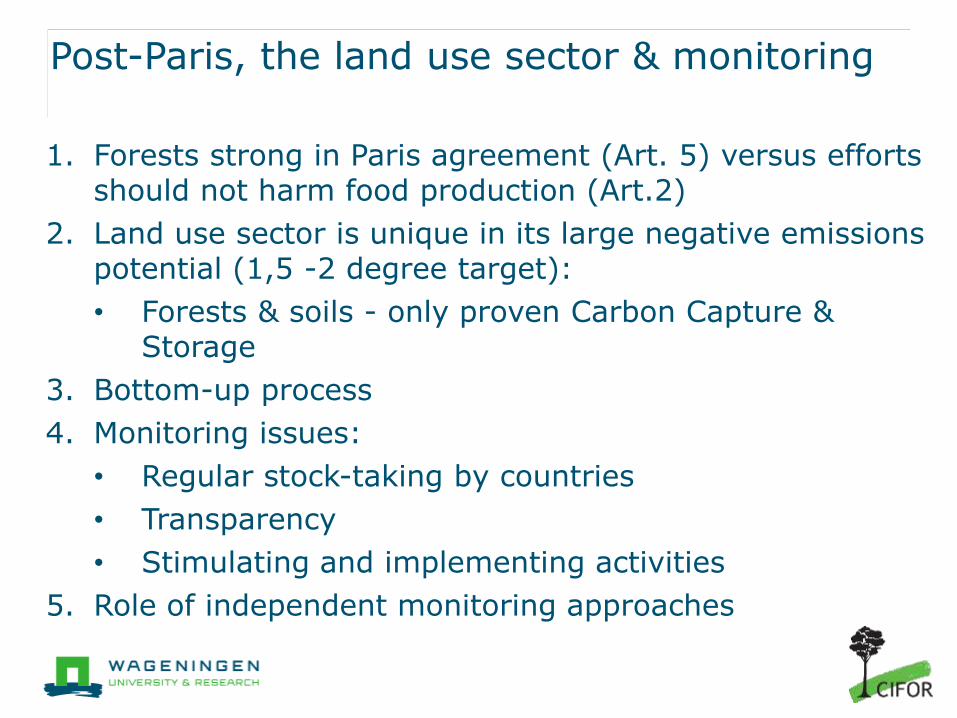
Post-Paris, the land use sector & monitoring
1. Forests strong in Paris agreement (Art. 5) versus efforts should not harm food production (Art.2)
2. Land use sector is unique in its large negative emissions potential (1,5 -2 degree target):
• Forests & soils - only proven Carbon Capture & Storage
3. Bottom-up process
4. Monitoring issues:
• Regular stock-taking by countries
• Transparency
• Stimulating and implementing activities
5. Role of independent monitoring approaches

Independent monitoring...
All
sta
keh
old
ers
Govern
ment
(Annex I
)
Govern
ment
(Non-
Annex I
)
Inte
rgovern
menta
l
org
aniz
ation
Non-g
overn
menta
l
org
aniz
ation
Com
merc
ial
org
aniz
ation (
pri
vate
secto
r)
Public c
om
pany (
sta
te-
ow
ned)
Researc
h institu
te a
nd
univ
ers
ity
Donor
agency
Local sta
kehold
er
Journ
alism
/ m
edia
…provides information that is increasing
transparency, building confidence and
broadening participation for multiple
stakeholders.
55% 39% 54% 54% 68% 65% 38% 53% 67% 54% 43%
…can be defined as methods, data and tools to
estimate greenhouse gas emissions from land
activities that are additional to mandated
monitoring by governments.
54% 58% 56% 51% 54% 45% 75% 53% 78% 62% 29%
…provides information that is accurate, reliable and
customizable.54% 35% 50% 68% 67% 55% 38% 52% 56% 54% 43%
…provides information that is supporting countries
to fill data and capacity gaps.49% 42% 50% 54% 58% 45% 25% 48% 44% 46% 57%
…provides data that can serve the purpose of
independent verification by UNFCCC roster of experts
for reviewing the annual submissions of greenhouse
gas (GHG) inventories.
43% 49% 39% 62% 40% 47% 38% 43% 22% 15% 29%
…provides information that is potentially serving as
authoritative reference for many kinds of
stakeholders.
43% 38% 35% 51% 53% 39% 25% 41% 33% 46% 57%
…provides information that is independent from
commercial interests.41% 33% 24% 49% 52% 39% 13% 44% 33% 46% 57%
…provides underpinning science to improve data. 40% 33% 37% 46% 39% 26% 25% 48% 44% 39% 43%
…ensures that stakeholders, e.g. REDD+ countries,
can have ownership and control over datasets and
methods and consider them legitimate.
38% 23% 44% 41% 43% 43% 0% 39% 22% 62% 29%
Number of responses 533 69 54 37 106 51 8 179 9 13 7
1 2 3 4 5 6 7 8 9
Colour code according to rank of percentages (1 = highest ranked percentage, 9 = lowest ranked percentage)

Defining independent monitoring
• Stakeholders have different perspectives; it is not a specific tool, or a one-serves-all approach
• Embraces diversity with the purpose of increasing transparency, and broadening stakeholder participation and confidence
• Key elements: 1. transparency in data sources, definitions, methodologies and
assumptions;2. free and open methods, data, and tools, which are ‘barrier
free’ to all stakeholders;3. increased participation and accountability of stakeholders;4. complementarity to mandated reporting by countries;5. promotion of accuracy, consistency, completeness and
comparability of greenhouse gas (GHG) emission estimates

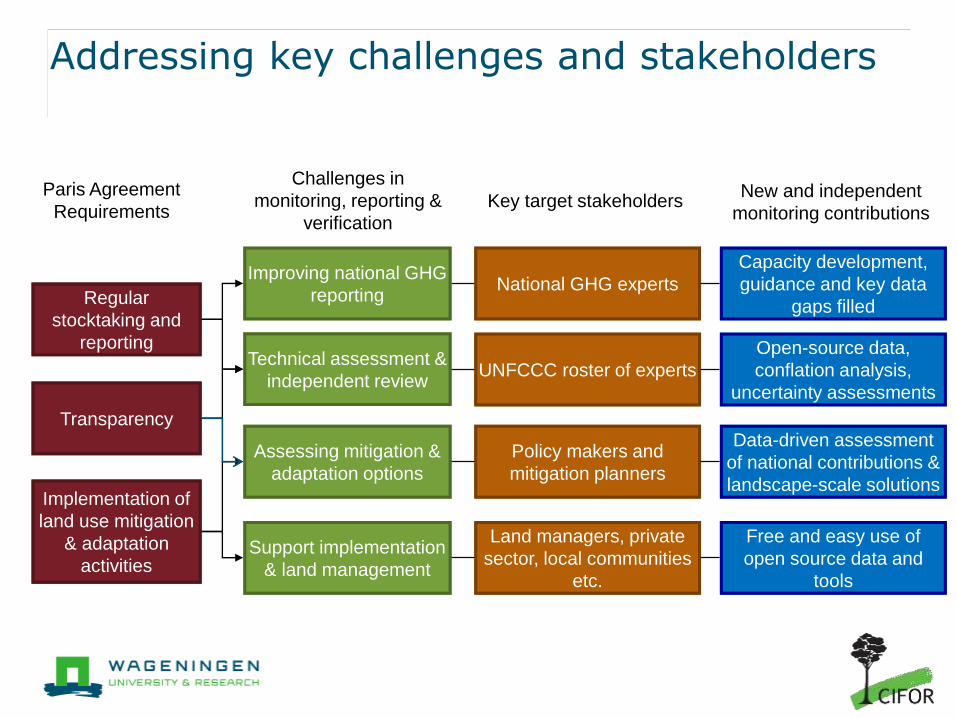
Regular
stocktaking and
reporting
Transparency
Implementation of
land use mitigation
& adaptation
activities
Paris Agreement
requirements
Challenges in
monitoring, reporting &
verification
Key target stakeholdersNew and independent
monitoring contributions
Improving national GHG
reportingNational GHG experts
Capacity development,
guidance and key data
gaps filled
Addressing key challenges and stakeholders

Recommendations to countries and UNFCCC
• Transparency is a great opportunity: builds confidence and legitimacy
• Transparency can cause (initial) frustration but will enhance quality: things will become more serious and be ready and open for surprises
• Transparency requires capacity : circumstances vary, and enhancing transparency requires flexibility (step-wise)
• Transparency reduces ignorance: take advantage of the diversity of (independent) datasets and approaches

Regular
stocktaking and
reporting
Transparency
Implementation of
land use mitigation
& adaptation
activities
Paris Agreement
requirements
Challenges in
monitoring, reporting &
verification
Key target stakeholdersNew and independent
monitoring contributions
Improving national GHG
reportingNational GHG experts
Capacity development,
guidance and key data
gaps filled
Technical assessment &
independent reviewUNFCCC roster of experts
Open-source data,
conflation analysis,
uncertainty assessments
Addressing key challenges and stakeholders

Diversity in AFOLU databases
• Country level agreement for agriculture, forestry and other land-use emissions for the FAOSTAT, EDGAR and ‘Hotspots’ databases
• Source: Roman-Cuesta et al., 2016, Biogeosciences• Disagreements stem from differences in conceptual frameworks,
definitions, methods and assumptions, etc.

Recommendations to expert communities
• Better dialog between communities involved in producing emissions estimates in the land use sector
• Independent monitoring important for preparing harmonized reference data for technical assessments
• International expert community need to develop better guidance and training materials on how to use global datasets (i.e. complementarity, uncertainties, etc.)
• IPCC Good practice guidelines need updates (i.e. land representation, REDD+, use of remote sensing)
• Open source data and tools

Regular
stocktaking and
reporting
Transparency
Implementation of
land use mitigation
& adaptation
activities
Paris Agreement
requirements
Challenges in
monitoring, reporting &
verification
Key target stakeholdersNew and independent
monitoring contributions
Improving national GHG
reportingNational GHG experts
Capacity development,
guidance and key data
gaps filled
Technical assessment &
independent reviewUNFCCC roster of experts
Open-source data,
conflation analysis,
uncertainty assessments
Assessing mitigation &
adaptation options
Policy makers and
mitigation planners
Data-driven assessment
of national contributions &
landscape-scale solutions
Addressing key challenges and stakeholders
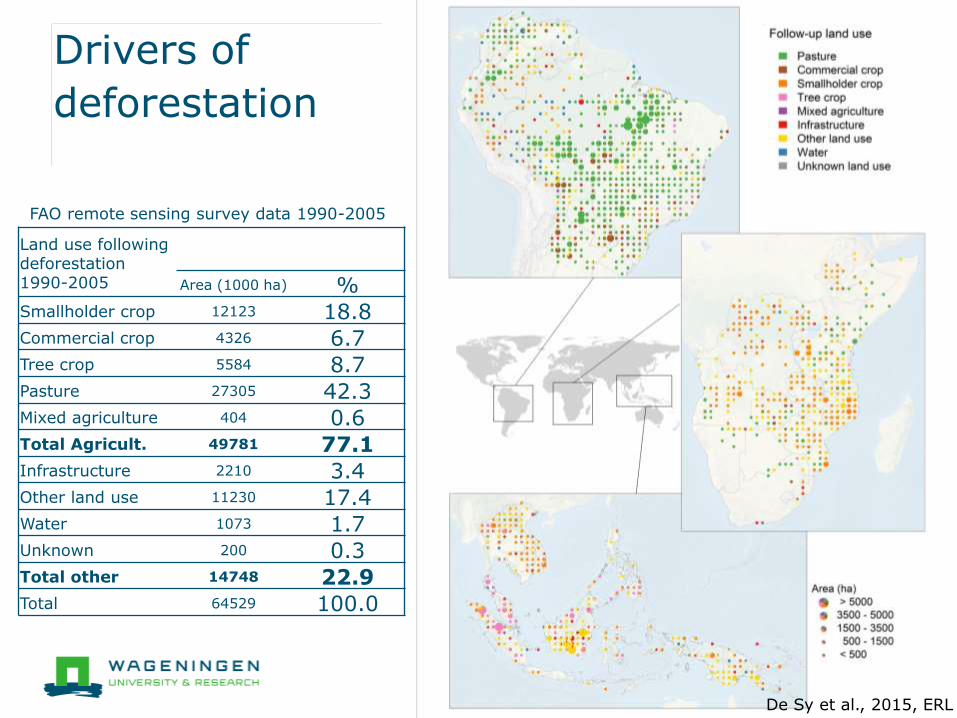
Drivers of
deforestation
Land use following deforestation 1990-2005 Area (1000 ha) %Smallholder crop 12123 18.8Commercial crop 4326 6.7Tree crop 5584 8.7Pasture 27305 42.3Mixed agriculture 404 0.6Total Agricult. 49781 77.1Infrastructure 2210 3.4Other land use 11230 17.4Water 1073 1.7Unknown 200 0.3Total other 14748 22.9Total 64529 100.0
De Sy et al., 2015, ERL
FAO remote sensing survey data 1990-2005

AFOLU (Agriculture Forests and Other Land Uses) net emissions
Contribution of emission sources per pixel (0.5°)
Roman et al., 2016, Biogeosciences
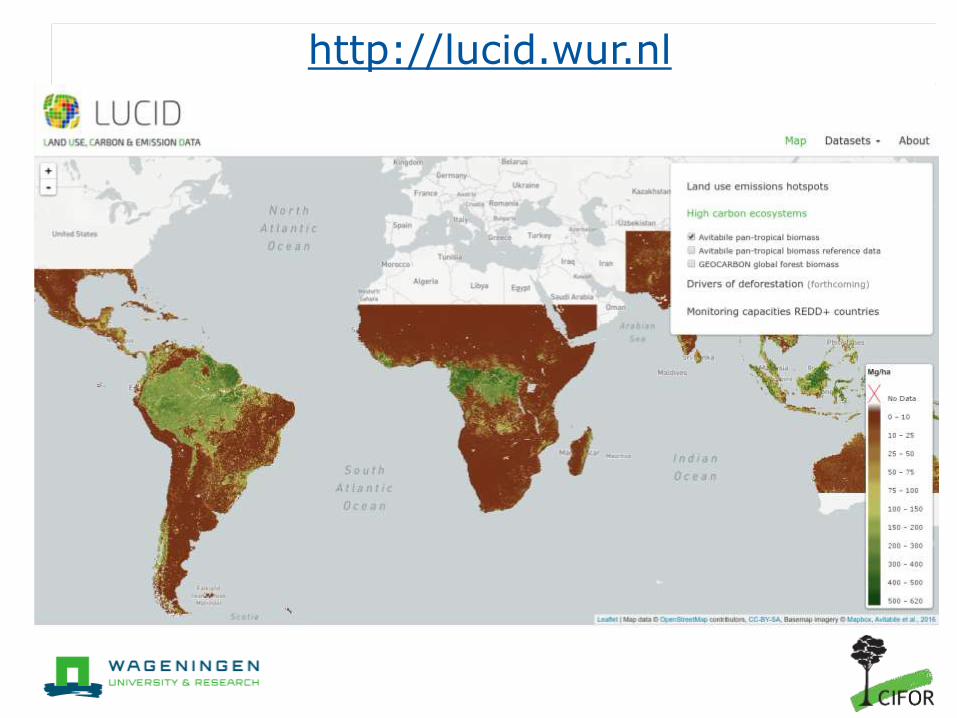
Data available: http://lucid.wur.nl/

Recommendations for mitigation planning
• Information is needed to understand the needs and options of land use sector mitigation on national and local levels
• Landscape-scale solutions require assessment of synergies and trade-offs for active engagement:
• REDD+
• Climate Smart Agriculture
• Restauration
Regular
stocktaking and
reporting
Transparency
Implementation of
land use mitigation
& adaptation
activities
Paris Agreement
Requirements
Challenges in
monitoring, reporting &
verification
Key target stakeholdersNew and independent
monitoring contributions
Improving national GHG
reportingNational GHG experts
Capacity development,
guidance and key data
gaps filled
Support implementation
& land management
Land managers, private
sector, local communities
etc.
Free and easy use of
open source data and
tools
Technical assessment &
independent reviewUNFCCC roster of experts
Open-source data,
conflation analysis,
uncertainty assessments
Assessing mitigation &
adaptation options
Policy makers and
mitigation planners
Data-driven assessment
of national contributions &
landscape-scale solutions
Addressing key challenges and stakeholders

Combining Sentinel-1 & Landsat (Bolivia)
Fortnightly (two-weekly) monitoring 10/2015 – 04/2016
Landsat NDVI
S1 VV
18Credit: Johannes Reiche

Performance at control, intervention, initiative level(credit: Astrid Bos, Amy Duchelle)

Interactive monitoring system design
• Linking near-real time satellite observations with on the ground monitoring by local experts, communities, land managers etc.
• Create on environment of open exchange of information
• Operational monitoring in Kafa Biosphere Reserve, Ethiopia in near-real time mode since Oct. 2014
• Inception for system at national and local level in Peru – joint research incl. multi-level governance
Pratihast et al., 2016, PLOS One
http://www.wageningenur.nl/cbm

Recommendations for implementation
• Independent monitoring is not a “system”, it is a variety of practices
• A participatory and interactive environment creates open exchange and partnership
• No dataset is perfect, but local activities are real ... use as common ground
• Useful to be complementary to national reporting and promote IPCC principles
• Transparency takes effort but can lead to transformational changes